Sequence Alignment, Mutual Information, and Dissimilarity Measures for Constructing Phylogenies Orion Penner 1 *, Peter Grassberger 1,2 *, Maya Paczuski 1 1 Complexity Science Group, Department of Physics and Astronomy, University of Calgary, Calgary, Alberta, Canada, 2 Department of Biological Sciences, Institute for Biocomplexity and Informatics, University of Calgary, Calgary, Alberta, Canada Abstract Background: Existing sequence alignment algorithms use heuristic scoring schemes based on biological expertise, which cannot be used as objective distance metrics. As a result one relies on crude measures, like the p- or log-det distances, or makes explicit, and often too simplistic, a priori assumptions about sequence evolution. Information theory provides an alternative, in the form of mutual information (MI). MI is, in principle, an objective and model independent similarity measure, but it is not widely used in this context and no algorithm for extracting MI from a given alignment (without assuming an evolutionary model) is known. MI can be estimated without alignments, by concatenating and zipping sequences, but so far this has only produced estimates with uncontrolled errors, despite the fact that the normalized compression distance based on it has shown promising results. Results: We describe a simple approach to get robust estimates of MI from global pairwise alignments. Our main result uses algorithmic (Kolmogorov) information theory, but we show that similar results can also be obtained from Shannon theory. For animal mitochondrial DNA our approach uses the alignments made by popular global alignment algorithms to produce MI estimates that are strikingly close to estimates obtained from the alignment free methods mentioned above. We point out that, due to the fact that it is not additive, normalized compression distance is not an optimal metric for phylogenetics but we propose a simple modification that overcomes the issue of additivity. We test several versions of our MI based distance measures on a large number of randomly chosen quartets and demonstrate that they all perform better than traditional measures like the Kimura or log-det (resp. paralinear) distances. Conclusions: Several versions of MI based distances outperform conventional distances in distance-based phylogeny. Even a simplified version based on single letter Shannon entropies, which can be easily incorporated in existing software packages, gave superior results throughout the entire animal kingdom. But we see the main virtue of our approach in a more general way. For example, it can also help to judge the relative merits of different alignment algorithms, by estimating the significance of specific alignments. It strongly suggests that information theory concepts can be exploited further in sequence analysis. Citation: Penner O, Grassberger P, Paczuski M (2011) Sequence Alignment, Mutual Information, and Dissimilarity Measures for Constructing Phylogenies. PLoS ONE 6(1): e14373. doi:10.1371/journal.pone.0014373 Editor: Konrad Scheffler, University of Stellenbosch, South Africa Received April 20, 2010; Accepted September 27, 2010; Published January 4, 2011 Copyright: ß 2011 Penner et al. This is an open-access article distributed under the terms of the Creative Commons Attribution License, which permits unrestricted use, distribution, and reproduction in any medium, provided the original author and source are credited. Funding: This research was funded by NSERC. OP is funded through scholarships from NSERC, iCORE and Advanced Education and Technology. The funders had no role in study design, data collection and analysis, decision to publish, or preparation of the manuscript. Competing Interests: The authors have declared that no competing interests exist. * E-mail: [email protected] (OP); [email protected] (PG) Introduction Sequence alignment achieves many purposes and comes in several different varieties [1]: Local versus global (and even ‘‘glocal’’: [2]), pairwise versus multiple, and DNA/RNA versus proteins. Rather than listing all applications, we cite just two numbers: According to Google Scholar the two original papers on the BLAST algorithm for local alignment by [3] and on one of its improvements [4] have been cited more than 30,000 times each, and the number of daily file uploads to the NCBI server providing BLAST is &140,000 [5]. A partial list of alignment tools in the public domain can be found in http://pbil.univ-lyon1.fr/ alignment.html. In global alignment, which we focus on here, two sequences of comparable length are placed one below the other. The algorithm inserts blanks in each of the sequences such that the number of positions at which the two sequences agree is maximized. More precisely, a scoring scheme is used. Each position at which the two sequences agree is rewarded by a positive score, while each disagreement (‘‘mutation’’) and each insertion of a blank (‘‘gap’’) is punished by a negative one. The best alignment is that with the highest total score. In local alignment, one aligns only subsequences against each other and looks for the highest scores between any pairs of subsequences. Regions that cannot be well-aligned are simply ignored. Existing algorithms use either heuristic scoring schemes or scores derived from explicit probabilistic models [6]. Similarities between DNA sequences, e.g. for distance-based phylogenetic tree construction, are typically not based on alignment scores. Instead they use explicit evolutionary assump- tions (e.g. the Kimura two-parameter model [7]) or are simply obtained by counting the number of nucleotide substitutions (like the p-distance or the Poisson corrected p-distance [7]). An PLoS ONE | www.plosone.org 1 January 2011 | Volume 6 | Issue 1 | e14373

Welcome message from author
This document is posted to help you gain knowledge. Please leave a comment to let me know what you think about it! Share it to your friends and learn new things together.
Transcript
Sequence Alignment, Mutual Information, andDissimilarity Measures for Constructing PhylogeniesOrion Penner1*, Peter Grassberger1,2*, Maya Paczuski1
1 Complexity Science Group, Department of Physics and Astronomy, University of Calgary, Calgary, Alberta, Canada, 2 Department of Biological Sciences, Institute for
Biocomplexity and Informatics, University of Calgary, Calgary, Alberta, Canada
Abstract
Background: Existing sequence alignment algorithms use heuristic scoring schemes based on biological expertise, whichcannot be used as objective distance metrics. As a result one relies on crude measures, like the p- or log-det distances, ormakes explicit, and often too simplistic, a priori assumptions about sequence evolution. Information theory provides analternative, in the form of mutual information (MI). MI is, in principle, an objective and model independent similaritymeasure, but it is not widely used in this context and no algorithm for extracting MI from a given alignment (withoutassuming an evolutionary model) is known. MI can be estimated without alignments, by concatenating and zippingsequences, but so far this has only produced estimates with uncontrolled errors, despite the fact that the normalizedcompression distance based on it has shown promising results.
Results: We describe a simple approach to get robust estimates of MI from global pairwise alignments. Our main result usesalgorithmic (Kolmogorov) information theory, but we show that similar results can also be obtained from Shannon theory.For animal mitochondrial DNA our approach uses the alignments made by popular global alignment algorithms to produceMI estimates that are strikingly close to estimates obtained from the alignment free methods mentioned above. We pointout that, due to the fact that it is not additive, normalized compression distance is not an optimal metric for phylogeneticsbut we propose a simple modification that overcomes the issue of additivity. We test several versions of our MI baseddistance measures on a large number of randomly chosen quartets and demonstrate that they all perform better thantraditional measures like the Kimura or log-det (resp. paralinear) distances.
Conclusions: Several versions of MI based distances outperform conventional distances in distance-based phylogeny. Evena simplified version based on single letter Shannon entropies, which can be easily incorporated in existing softwarepackages, gave superior results throughout the entire animal kingdom. But we see the main virtue of our approach in amore general way. For example, it can also help to judge the relative merits of different alignment algorithms, by estimatingthe significance of specific alignments. It strongly suggests that information theory concepts can be exploited further insequence analysis.
Citation: Penner O, Grassberger P, Paczuski M (2011) Sequence Alignment, Mutual Information, and Dissimilarity Measures for Constructing Phylogenies. PLoSONE 6(1): e14373. doi:10.1371/journal.pone.0014373
Editor: Konrad Scheffler, University of Stellenbosch, South Africa
Received April 20, 2010; Accepted September 27, 2010; Published January 4, 2011
Copyright: � 2011 Penner et al. This is an open-access article distributed under the terms of the Creative Commons Attribution License, which permitsunrestricted use, distribution, and reproduction in any medium, provided the original author and source are credited.
Funding: This research was funded by NSERC. OP is funded through scholarships from NSERC, iCORE and Advanced Education and Technology. The funders hadno role in study design, data collection and analysis, decision to publish, or preparation of the manuscript.
Competing Interests: The authors have declared that no competing interests exist.
* E-mail: [email protected] (OP); [email protected] (PG)
Introduction
Sequence alignment achieves many purposes and comes in
several different varieties [1]: Local versus global (and even
‘‘glocal’’: [2]), pairwise versus multiple, and DNA/RNA versus
proteins. Rather than listing all applications, we cite just two
numbers: According to Google Scholar the two original papers on
the BLAST algorithm for local alignment by [3] and on one of its
improvements [4] have been cited more than 30,000 times each,
and the number of daily file uploads to the NCBI server providing
BLAST is &140,000 [5]. A partial list of alignment tools in
the public domain can be found in http://pbil.univ-lyon1.fr/
alignment.html.
In global alignment, which we focus on here, two sequences of
comparable length are placed one below the other. The algorithm
inserts blanks in each of the sequences such that the number of
positions at which the two sequences agree is maximized. More
precisely, a scoring scheme is used. Each position at which the two
sequences agree is rewarded by a positive score, while each
disagreement (‘‘mutation’’) and each insertion of a blank (‘‘gap’’) is
punished by a negative one. The best alignment is that with the
highest total score. In local alignment, one aligns only subsequences
against each other and looks for the highest scores between any
pairs of subsequences. Regions that cannot be well-aligned are
simply ignored. Existing algorithms use either heuristic scoring
schemes or scores derived from explicit probabilistic models [6].
Similarities between DNA sequences, e.g. for distance-based
phylogenetic tree construction, are typically not based on
alignment scores. Instead they use explicit evolutionary assump-
tions (e.g. the Kimura two-parameter model [7]) or are simply
obtained by counting the number of nucleotide substitutions (like
the p-distance or the Poisson corrected p-distance [7]). An
PLoS ONE | www.plosone.org 1 January 2011 | Volume 6 | Issue 1 | e14373
important property of a similarity measure, from the point of view
of phylogeny, is that distances should grow linearly with evolution
time. This results in a measure satisfying the so-called four point
condition [8], which in turn makes the measure useful for neighbor
joining, the most popular distance based algorithm for inferring
phylogenetic trees [9]. The most important metrics developed
from this view point are the closely related paralinear [10] and log-det
[11] distances. In this paper we refer to both as ‘‘log-det’’, for
simplicity’s sake.
In the above mentioned distances, distinct rates of different
substitution types are either taken into account using a model, or
are not taken into account at all. This fact stands in stark contrast
with mutual information (MI), which takes the amount of information
shared between two objects as a measure of their similarity [12].
For instance, more frequent substitutions can be encoded more
efficiently, and should thus be a weaker indicator for dissimilarity
than rare, and thus ‘‘surprising’’, substitutions. The crucial point to
note is that the frequency of substitutions and indels and their
correlations can be counted directly from the alignment, and no
model is required. As a consequence, MI is, in principle, a model-
free, universal, and objective similarity measure, in stark contrast
to all metrics discussed above.
Indeed, there are two variants of information theory: The more
traditional Shannon theory, based on a probabilistic interpreta-
tion of the sequences, and the less well known Kolmogorov
(or algorithmic) ‘‘complexity’’ theory [12]. In this paper we use
Kolmogorov information as our main vehicle, but we also show
that Shannon theory gives comparable results.
Roughly, in algorithmic information theory the complexity K(A)of a sequence A is the minimal amount of information (measured
in bits) needed to specify A uniquely, on a given computer, with a
given operating system. Numerical results depend on the latter,
but this dependence will, in general, be weak and is ignored in this
paper. For two sequences A and B, the conditional complexity (or
conditional information) K(ADB) is the information needed to
specify A, if B is already known (i.e., either it or its specification
was already input before). If A and B are similar, this information
might consist of a short list of changes needed to go from B to A,
and K(ADB) is small. If, on the other hand, A and B have nothing
in common, then knowing B is useless and K(ADB)~K(A).Finally, the mutual information (MI) is defined as the difference
I(A; B)~K(A){K(ADB): It is the amount of information which is
common to A and B, and is also equal to the amount of
information in B which is useful for describing A, and vice versa.
Indeed, it can be shown that, up to correction terms that become
negligible for long sequences (see [12]): (a) I(A; B)§0; (b)
I(A; B)~0 if and only if A and B are completely independent;
(c) I(A; A)~K(A); and (d) I(A; B)~I(B; A). Moreover, the
probability (in the Bayesian sense) that I(A; B)§d is smaller than
2{d , if A and B are independent (see Theorem 2 of [13]). Hence,
the similarity is significant and not by chance when I(A; B) is
large.
The fundamental difference between Shannon theory and
Algorithmic Information theory is that Shannon theory makes no
attempt to quantify the minimum information required to specify a
any particular sequence. Instead Shannon theory assumes that a
sequence can be treated as though it was generated as a ‘‘typical’’
case of a probabilistic process. As a result of this assumption,
Shannon information has no dependence on hardware. However,
the main drawback is that it cannot, strictly speaking, deal with
individual sequences and it needs an assumption on the probability
distribution. Any numerical result obtained from individual
sequences implies the assumption that the specific sequences are
‘typical’ of the underlying probabilistic process. As a result it
involves statistical inference, even if the result does not strongly
depend on this inference. In particular, the assumption of
independence of letters in a sequence (used also below) will lead
to over-estimation of Shannon entropy, and thus implies no risk of
overfitting.
The fact that alignment and information theory are closely
related has been realized repeatedly. However, most work in this
direction has focused on aligning images rather than sequences
[14]. Conceptually, these two problems are closely related, but
technically, they are not. The effects of sequence randomness on
the significance of alignments has also been studied in [15].
Finally, attempts to extend the notion of edit distance [1] to more
general editing operations have been made. In this case the
similarity of two sequences is quantified by the complexity of the
edit string, see [16]. Indeed, the aims of [16] are similar to ours,
but their approach differs in several key respects and leads to
markedly different results.
Methods
Translation StringsAt the heart of our approach is the concept of a translation string.
The translation string TBDA contains the minimal information
necessary to recover the sequence B from another sequence A.
Similarly, TADB contains the information needed to obtain A from
B. Here we focus on DNA sequences, consisting of the letters
A,C,G and T, and corresponding to complete mitochondrial
genomes. But the approach is more general and can be applied to
protein sequences without further effort. We refer to the ith
element of sequence X as Xi, and denote the length of X as nX .
Any global alignment algorithm, when applied to A and B,
outputs a pair of sequences (A’,B’) of equal length n§
maxfnA,nBg. The sequences A’ and B’ are obtained from Aand B by inserting hyphens (‘‘gaps’’) such that the total score is
maximized. The strings TBDA and TADB also have length n, and are
composed from an alphabet of nine characters. For each i, the
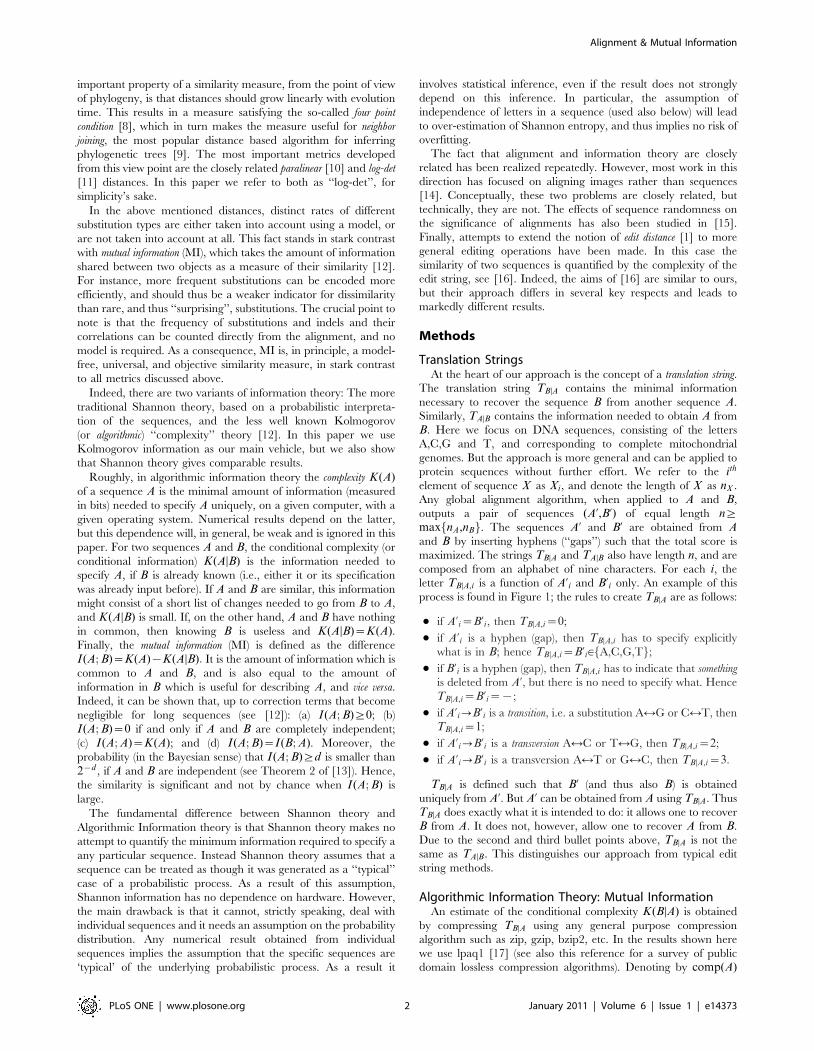
letter TBDA,i is a function of A’i and B’i only. An example of this
process is found in Figure 1; the rules to create TBDA are as follows:
N if A’i~B’i, then TBDA,i~0;
N if A’i is a hyphen (gap), then TBDA,i has to specify explicitly
what is in B; hence TBDA,i~B’i[fA,C,G,Tg;N if B’i is a hyphen (gap), then TBDA,i has to indicate that something
is deleted from A’, but there is no need to specify what. Hence
TBDA,i~B’i~{;
N if A’i?B’i is a transition, i.e. a substitution A<G or C<T, then
TBDA,i~1;
N if A’i?B’i is a transversion A<C or T<G, then TBDA,i~2;
N if A’i?B’i is a transversion A<T or G<C, then TBDA,i~3.
TBDA is defined such that B’ (and thus also B) is obtained
uniquely from A’. But A’ can be obtained from A using TBDA. Thus
TBDA does exactly what it is intended to do: it allows one to recover
B from A. It does not, however, allow one to recover A from B.
Due to the second and third bullet points above, TBDA is not the
same as TADB. This distinguishes our approach from typical edit
string methods.
Algorithmic Information Theory: Mutual InformationAn estimate of the conditional complexity K(BDA) is obtained
by compressing TBDA using any general purpose compression
algorithm such as zip, gzip, bzip2, etc. In the results shown here
we use lpaq1 [17] (see also this reference for a survey of public
domain lossless compression algorithms). Denoting by comp(A)
Alignment & Mutual Information
PLoS ONE | www.plosone.org 2 January 2011 | Volume 6 | Issue 1 | e14373
the compressed version of A and by len½A� the length of A in bits,
gives an exact upper bound
K(BDA)ƒK0(BDA):len½comp(TBDA)�: ð1Þ
If there were no correlations between sequence A and the
translation string, TBDA, this would also be the best possible upper
bound. However, in general we must expect that such correlations
exist, although we find them to be weak (see the second figure in
Material S1). Thus Eq. (1) is still a good estimate, but the best one
is obtained by compressing conditionally on A,
K(BjA)ƒlen½comp(TBjAjA)�:len½comp(A TBjA)�
{len½comp(A)�ƒK0(BjA):ð2Þ
More precisely, one can show that K0(BDA){K(BDA)&I(A; TBDA).
In order to obtain an estimate of MI, we have to subtract
K(BDA) from K(B), which is also estimated via compression.
Unlike TBDA, B is a DNA string. Since general purpose com-
pression algorithms are known to be inferior for DNA [18,19] we
could use an efficient DNA compressor like, e.g., ‘GeneCompress’’
or ‘‘XM’’ [18,19] (as we shall do in Eq. (4) below). To avoid any
question of consistency, we shall not do this. Instead, the
compression is carried out using a general purpose compression
algorithm, to get
I(A; B)&I(A; B)align~len½comp(B)�{len½comp(TBjAjA)�
~len½comp(A)�zlen½comp(B)�
{len½comp(A TBjA)�:
ð3Þ
This is to be compared to the general definition of algorithmic MI,
based entirely on concatenation and compression [12,20] without
using any alignment. This estimate is obtained by comparing the
size of the compressed concatenation AB to the sum of the sizes of
the compressed individual files,
I(A; B)compr~len½comp(A)�zlen½comp(B)�{len½comp(AB)�:ð4Þ
At first sight it might seem paradoxical that I(A; B)align can
even be positive. Not only does TBDA involve a larger alphabet than
B, but, in general, it is also a longer string. Thus one could expect
that TBDA would not typically compress to a shorter size than B.
The reason why this first impression is wrong is clear from
Figure 1: If A and B are similar, then TBDA consists mostly of zeroes
and compresses readily. In practical alignment schemes, the scores
for mismatches are carefully chosen such that more frequent
substitutions are punished less than unlikely substitutions. In
contrast, coding each mismatch simply by a letter in TBDA seems to
ignore this issue. However, more frequent mismatches will give
letters occurring with higher frequency, and general purpose
compression algorithms utilize frequency differences to achieve
higher compression.
Conceptually our approach is similar to encoding generalized
edit strings in [16]. However, there are several pivotal differences
between that work and ours. First, the authors in [16] did not
compress their edit strings and as a result the conclusions they
were able to draw from a quantitative analysis were much weaker
than ours. Second, our approach utilizes an alignment algorithm
to achieve an efficient encoding of TBDA. In addition to producing a
better estimate of K(BDA), this allows us to make quantitative
evaluations of the alignment algorithm itself. An additional
difference between our approach and the traditional edit methods
used in approximate string matching [21] is that our translation
strings do not give both translations A?B and B?A from the
same string. This asymmetry is crucial to establish the relations to
conditional and mutual information.
For long strings, I(A; B) should be symmetric in its arguments.
In general, the estimates satisfy I(A; B)align&I(B; A)align (see the
third figure in Material S1). Indeed, the translation strings TBDAand TADB can differ substantially, resulting in different estimates for
K(BDA) and K(ADB) via Eq. (2). This difference is mostly canceled
by differences between len½comp(B)� and len½comp(A)�. Take, for
instance, the case where B is much shorter than A. Then TBDAconsists mostly of hyphens and is highly compressible. On the
other hand, TADB is similar to A, since most letters have to be
inserted when translating B to A. Thus both I(A; B)align and
I(B; A)align are small compared to K(A), but for different reasons.
Further details are given in Material S1.
Shannon TheoryCompared to algorithmic information, Shannon theory is the
more widely known version of information theory [12]. The basic
concept of Shannon theory is that of a block or word probability
pn(s1 . . . snDA). It gives the probability that the ‘word’ s1 . . . sn of n
consecutive letters (such as A,C,G or T for DNA) appears at any
random position in the string A. Here we assume stationarity, but
we do not assume absence of correlations. The entropy (analogous
to the complexity in algorithmic information theory) of a string
comprised of letters from an alphabet A is defined as h(A)~limn??hn(A) with
hn(A)~{X
fs1...sng[An
pn(s1 . . . snDA) log pn(s1 . . . snDA): ð5Þ
From this, MI is defined as in algorithmic theory: I(A; B)~h(A)zh(B){h(A,B) [12]. If entropy is measured in bits, then the
logarithm is to base 2. In practice, the limit n?? is rarely feasible,
and one usually approximates h(A) by the single-letter entropy
h(A)&h1(A):{Xs[A
p(s) log p(s) ð6Þ
Figure 1. Example of an alignment and of the two translation strings TADB and TBDA. Colors indicate sites with mutations (red), gaps (blue),and conservation (green).doi:10.1371/journal.pone.0014373.g001
Alignment & Mutual Information
PLoS ONE | www.plosone.org 3 January 2011 | Volume 6 | Issue 1 | e14373
or, at most, by the pair approximation based on the probabilities
for words of length two.
Eq. (6) is valid under the assumption that correlations between
consecutive letters in the string can be neglected. Similarly, h(A,B)for two sequences of equal length is estimated by assuming that
consecutive letter pairs (si,ti) with si[A and ti[B are independent.
If we make this assumption, there are still two ways to estimate the
MI of two strings. In the first we use the fact that (A’,B’) carries the
same information as (A,B) to employ a five-letter alphabet
A~fA,C,G,T ,{g. This has the drawback that indels are usually
correlated. In the second we thus neglect all indels and reduce the
alphabet to A~f0,1,2,3g. In the following we shall mostly use the
latter to compare with other pairwise distance metrics, but we
stress that we do this only for simplicity and convenience (and
since it is sufficient to make our point). However, the more
interesting MI estimate remains the one obtained from algorithmic
theory, due to the fact it takes into account both indels and all
possible correlations within each string and between them.
Distances, Trees and QuartetsThe value of the MI itself is useful for many purposes:
Estimating similarities between different pairs (and thus of finding
closest neighbors of a given sequence in a large data set);
comparing the qualities of alignments obtained by different
algorithms; or assessing the significance of an alignment (i.e.,
verifying that it is better than an alignment between two unrelated
sequences). But in the case of phylogeny, one wants more. Ideally,
one wants an additive metric distance, i.e. a non-negative symmetric
pairwise function dAB for which dAA~0 and which satisfies both
the triangle inequality
dACƒdABzdBC ð7Þ
for any triple, and the four-point condition [22]
dABzdCDƒ maxfdACzdBD,dADzdBCg: ð8Þ
for any quartet. The latter is a necessary and sufficient condition
for all pairwise distances between N sequences to be representable
as distance sums over links in a tree [8] with the N sequences
represented by the leaves. Thus distances satisfying Eq. (8) are also
called ‘tree metrics’.
Several potential metrics can be derived from MI [20,23,24].
According to [20,24], the preferred one is the normalized compression
distance
d(NCD)AB ~
maxfK(ADB),K(BDA)gmaxfK(A),K(B)g ~1{
Ialgor(A; B)
maxfK(A),K(B)g ; ð9Þ
where Ialgor can be either Ialign or Icompr, depending on the way it
is estimated. For Shannon theory we can use the same construct
with K(A) replaced by h(A) [25]. Since it would be confusing to
use the word ‘‘compression’’ for this metric, we have to use
another name. We call it the normalized Shannon distance
d(NSD)AB ~1{
IShannon(A; B)
maxfh(A),h(B)g : ð10Þ
Although d(NCD) has been used to produce meaningful
phylogenetic trees [20,23–25], it has one important drawback
for phylogenetic applications: It is not additive. Indeed, for two
completely unrelated sequences (corresponding to infinite evolu-
tionary distance), both d(NCD)AB and d
(NSD)AB do not go to infinity, but
rather to 1. They are not linear but convex functions of
evolutionary distance. Such metrics are well known to lead to
long branch attraction (or the ‘Felsenstein phenomenon’ [26]).
If evolution is assumed to be a Markov process, then the data
processing inequality [12] guarantees that MI decreases with
evolutionary distance. A natural assumption – following from the
dominance of a single maximal eigenvalue of the Markov matrix –
is that it decreases exponentially to zero. In this case the log-MI
‘‘distance’’
d(log{MI)AB ~{ log
Ialgor(A; B)
maxfK(A),K(B)g
� �
resp: { logIShannon(A; B)
maxfh(A),h(B)g
� � ð11Þ
would increase linearly with evolution and would be thus additive.
Unfortunately, d(log{MI)AB is not a proper metric, as it does not even
satisfy the triangle inequality. This can be seen from the following
example: Take three sequences over an alphabet of four letters (like
DNA) where each letter is represented by two bits (purine/
pyrimidine, double/triple hydrogen bonds). Sequence B is random,
sequence A is obtained from B by replacing randomly the first bit
but conserving the second, and C is obtained by replacing the
second but conserving the first. Then I(A; B) and I(B; C) are non-
zero, while I(A; C)~0. At the same time, all single sequence
complexities (and entropies) are the same, thus d(log{MI)AC ~? while
d(log{MI)AB and d
(log{MI)BC are finite, clearly violating Eq. (7).
Fortunately, real evolution is most likely not as extreme as this
counter example, and the triangle inequality is not really required
for distance based phylogeny. In particular, the relationship
between trees and metric additivity is not restricted to metrics
satisfying the triangle inequality, as seen from the proof in [8].
Also, the neighbor joining algorithm [9] does not require the
triangle inequality. Thus we claim that d (log{MI) is an a priori
better distance measure for phylogeny than d (NCD) or d(NSD),
although a final evaluation can only be made through detailed
tests on real biological sequences.
Such tests are presented in the results section, with the log-det
(or, more precisely, the paralinear) distance [10,11] and two
distances based on Kimura’s model [7] (see the supplementary
information) as other competitors. In the latter, one assumes
different rates a for transitions (A< G, C<T) and b for
transversions (all others).
Assume that for two aligned sequences, A and B, one first
eliminates all positions with indels. Thus, at each site one sees one
of the 16 possibilities (i,k) with i,k[fA,C,G,Tg. Denote the
measured frequencies for these possibilities fAB(i,k). The single-
sequence (‘marginal’) frequencies are gA(i)~P
k fAB(i,k) and
gB(k)~P
i fAB(i,k). We introduce matrices FAB with matrix
elements (FAB)ik~fAB(i,k), GA with (GA)ik~gA(i)dik, and
(GB)ik~gB(i)dik (here, dik is the Kronecker delta, i.e. GA and
GB are diagonal matrices). The log-det distance is then defined as
d(log{det)AB ~{ log det½G{1=2
A FABG{1=2B �: ð12Þ
In [10], this is called paralinear distance; in [11] the name log-det
is used either for this or for simplified versions where the matrices
GA and GB are omitted. This difference is irrelevant for additivity
and for use in the neighbor joining algorithm. It can be shown that
d(log{det)AB is additive under rather general evolutionary models,
although not when evolutionary speed is site dependent.
Alignment & Mutual Information
PLoS ONE | www.plosone.org 4 January 2011 | Volume 6 | Issue 1 | e14373
Before moving on, we should point out that the data required to
compute the log-det distance are precisely the same as those needed
to compute the two MI-based distances d(NSD)AB and d
(log{MI)AB ,
provided one uses for the latter the single-letter Shannon formulas
with indels deleted. In that case,
I(A; B)Shannon~Xi,k
fAB(i,k) logfAB(i,k)
gA(i)gB(k)ð13Þ
and
h(A)~{X
i
gA(i)
Mlog
gA(i)
Mð14Þ
where M~P
i gA(i)~P
k gB(k), and is the number of sites in the
alignment. This is the main reason we will later compare these
three distances in detail.
ToolsWe utilized the MAVID [27] and Kalign [28] global sequence
alignment programs available for download at [29] and [30]. We
also experimented with STRETCHER [31], lagan [32] and
CLUSTALW 2 [33], and observed similar results. We made no
effort to optimize the scoring parameters of the algorithms and
only used the default values.
To evaluate I(A; B)compr we utilized the expert model (XM) DNA
compression algorithm [19]. To evaluate I(A; B)align we used
lpaq1 [17]. Using lpaq1 was not crucial, with the standard LINUX
tools gzip and bzip2 producing similar results. For DNA we also
explored GenCompress [23] and bzip2. Both showed markedly
inferior results to XM (see supplementary information), although
their ability to compress single sequences is not so much inferior to
XM [19]. Presumably this is due to the fact that XM is more
efficient in finding and exploiting approximate repeats, which is
crucial in compressing concatenated strings.
The complete mtDNA sequences used in our analysis were
downloaded from [34]. We paid special attention to eliminate
incomplete sequences and sequences with too many wild cards.
We also took care to circularly shift the sequences (mtDNA forms
in most cases a closed ring) in order to improve the alignments. We
used different subsets of sequences for different plots. In a few cases
we also flipped the strands, if this led to much better alignments.
Overall, we used nearly 1800 sequences.
Results
Alignment based mutual informations versuscompression based mutual informations
Our first results concern the agreement between the two
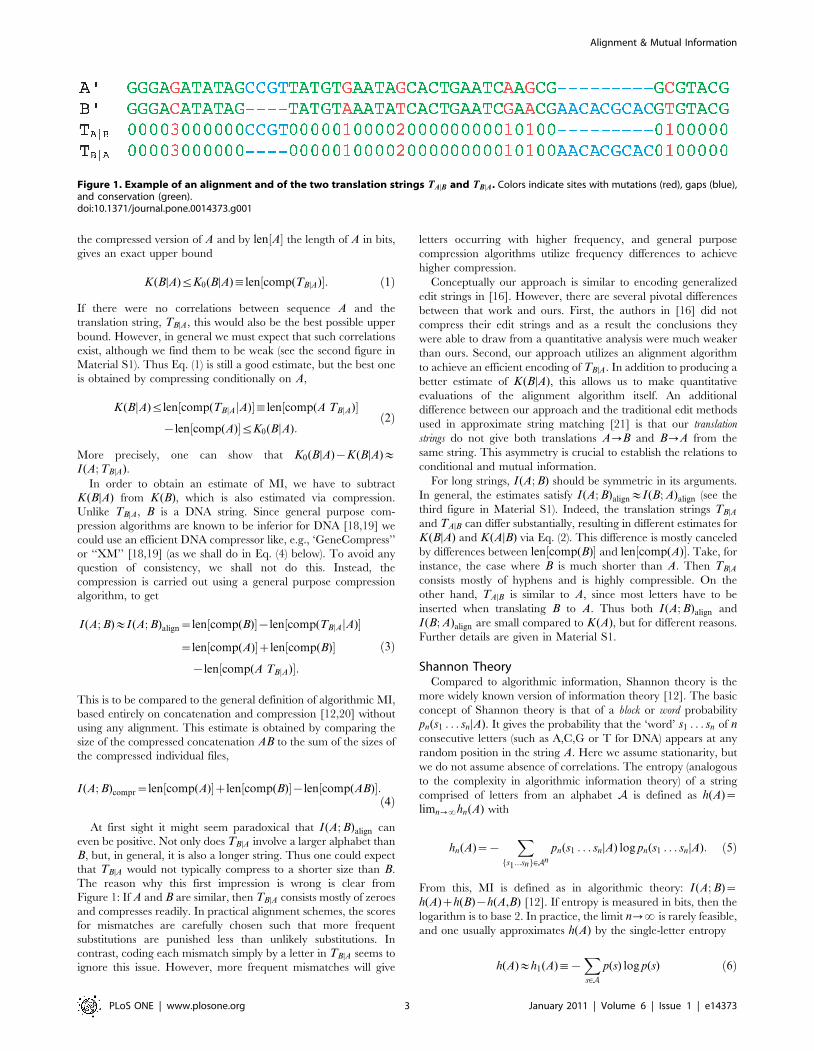
estimates Ialign and Icompr. In Figure 2 we compare estimates Icompr
obtained with XM to estimates Ialign obtained with the MAVID
alignment tool [29] and with subsequent compression using lpaq1.
It is well known that DNA and amino acid sequences are hard to
compress [18,19], thus one might expect that Icompr depends
strongly on the compression algorithm used. This is indeed the
case, as seen from the first figure in Material S1, where we
compare values of Icompr obtained with three different compres-
sion algorithms: The general purpose compressor lpaq1 [17] and
the two special DNA compressors GeneCompress [18] and XM
[19]. From this figure it is clear that XM is far better the other two.
Note that it is very likely that an imperfect compression algorithm
underestimates rather than overestimates MI – although we do not
know a rigorous theorem to this effect.
In view of this, it is not obvious that the estimates produced by
XM are realistic either. It is thus highly significant that the two
estimates shown in Figure 2 are approximately equal, despite the
fact that alignment algorithms and compression algorithms follow
drastically different routes. The slight downward shift from the
diagonal, particularly visible for large MI pairs, is due to an off-set
of &50 bytes in the XM algorithm. Points above the diagonal
indicate that concatenation and compression – using the XM
algorithm – produce a better estimate of MI, while points below
indicate that MAVID alignment followed by compression of its
translation string produced a better estimate. The invertebrate-
invertebrate pairs far above the diagonal in Figure 2 correspond to
pairs of species where the individual genes are similar, but their
ordering is changed (this refers in particular to all pairs with
Ialign&0 and Icomprw0:3 Kbyte). In that case a compression
algorithm is superior to a global alignment algorithm, since it is not
affected by shuffling open reading frames (ORFs). Most negative
estimates for MI seen in Figure 2 represent cases where shuffling
the ORFs prevented reasonable global alignments. Particularly
interesting are pairs of mammals with IcomprwIalign. We checked
that all of them involve a subspecies of sikka deer (Cervus nippon
taiouanus, GenBank accession number DQ985076), in which a
single gene (NADH6) is supposedly on the opposite strand
compared to all other mammals.
Agreement between Icompr and Ialign could have been improved
presumably in many cases by masking part of the genome, but we
have not tried this. In any case, the occasional disagreements are
of particular interest, since they indicate where one of the two
approaches encountered particular difficulty. Generally speaking
Figure 2 suggests that DNA compression can still be improved
slightly, as seen from pairs with I between 1 and 2 Kbyte
(corresponding roughly to species in different families but the same
orders). On the other hand, purely compression based MI
estimates give non-trivial (at least positive) results even across
different classes.
Figure 2. Scatter plot of MI estimates for complete mitochon-drial DNA between pairs of species: Icompr using XM [19] vs. Ialign
using MAVID [27] followed by compression with lpaq1. Notethat the two estimates generally agree and fall on the diagonal, while insome cases one method does better than the other as explained in thetext. Here and in Figure 3 ‘‘vertebrata’’ means non-mammalianvertebrata. This plot contains roughly 36,000 pairs, about 16,000 ofwhich contain two mammals, the other 20,000 covering equally theother combinations. Ialign is the average between the values obtainedfrom TBDA and TADB.doi:10.1371/journal.pone.0014373.g002
Alignment & Mutual Information
PLoS ONE | www.plosone.org 5 January 2011 | Volume 6 | Issue 1 | e14373

Comparison between different alignment algorithmsMI estimates obtained using other global alignment algorithms
are similar to those obtained with MAVID; an example is shown
in Figure 3. In this figure we see that MAVID produced slightly,
but systematically better alignments. However, because neither
algorithm’s scoring scheme was optimized, we do not consider this
figure to indicate which of the two alignment algorithms is better.
Rather, it represents a proof of principle that our method can be
used to identify strengths and weakness of different alignment
algorithms and evaluate objectively the sequence similarity in any
given alignment.
Correlations within single translation strings: Shannoninformations
In Figure 4 we show compression based conditional complexity
estimates for animal mtDNA translation strings plotted against the
corresponding single letter Shannon entropies h1. In the latter, we
have not eliminated indels, i.e. they are based on the nine letter
alphabet f0,1,2,3,A,C,G,T ,{g. Thus the difference between
K(TBDA) and h1(TBDA) is entirely based on correlations, detected by
the compression algorithm (in this case lpaq1).
As K(TBDA) goes to zero, the two estimates agree, up to a small
initialization cost for lpaq1 of &30 bytes. The estimates agree
because the translation string is mostly composed of zeros, with the
few substitutions being far apart and weakly correlated. For
increasing K(TBDA), however, the compression algorithm often
gives significantly lower estimates, thus indicating strong correla-
tions within the translation string. More detailed analysis of
pairwise correlations (unpublished) suggests that these are mostly
correlations between letters A,C,G,T ,{ (i.e., inserts and gaps
rather than substitutions). The fact that indels occur strongly
correlated is well known [1], and is also assumed in most
alignment scoring schemes.
Therefore, if the information encoded in gaps is to be taken into
account, it is necessary to go beyond the single letter approxima-
tion when estimating realistic and absolute sequence similarities.
Furthermore, taking into account only pairwise letter correlations
would not be sufficient either. This, of course, is not completely
new, and the most common way to deal with this problem is to
simply ignore indels [7]. Indeed there seems to exist a wide spread
opinion that indels are not very informative and useful. Whether
this is true or whether it just reflects an inability to deal with this
information efficiently is an open question. In any case, the most
straightforward way to deal with it would be based on algorithms
using data compression.
Comparison with p-distances: The effect of indelsA very simple but popular distance measure between sequences
(both DNA and amino acids) is p-distance. It is defined by first
removing all indel positions and then counting the number of
positions where the two sequences disagree [7],
d(p)~msubstit
M, ð15Þ
where msubstit is the number of observed substitutions and M is the
total number of (non-indel) sites. Since this quantity saturates with
increasing evolutionary distance, a slightly more sophisticated
version is the Poisson corrected (PC) p-distance [7], d(p,PC)~
{ log (1{d (p)). We note that neither d(p) nor d (p,PC) take into
account the type of substitutions, any information contained in
indels, or any information contained in internal correlations within
the translation strings.
Our main interest here is to see which of these three neglected
aspects (type of substitution, indels, correlations) has the biggest
effect. In Figure 5 we show a scatter plot of the normalized
compression distance d(NCD)AB , estimated via Ialign, against d
(p)AB, for
&105 pairs (A,B) taken from all over the animal kingdom. In
order to avoid meaningless alignments, we took in each pair only
members in the same (sub-) phylum (hexapoda, mollusca,
crustacea, chelicerata, cnidaria, porifera, platyhelminthes, echino-
dermata) or in the same (super-) class (mammals, sauropsida,
amphibia, actinopterygii). We also eliminated pairs with
msubstitzmconservv0:9 minfNA,NBg, as we would have otherwise
too many biologically meaningless alignments. Here, NA, NB are
Figure 3. Scatter plot comparing alignment based MI esti-mates: Kalign [28] vs. MAVID [27]. The number of pairs here isabout half of that shown in Figure 2. Points on the diagonal indicateagreement between the two estimates. These data were generatedusing the default scoring parameters. Therefore, the plot represents aproof of principle for using MI to evaluate alignments rather than adefinitive statement about the quality of the two alignment algorithmsshown.doi:10.1371/journal.pone.0014373.g003
Figure 4. Scatter plot comparing K(TBDA) estimated usingcompression, to the single letter Shannon informationh1(TBDA). The diagonal, X~Y , is a guide for the eye. Points fallingbelow the diagonal indicate cases where TBDA is not independent andidentically distributed, and some letters show strong correlations. Thefact that K(TBDA) is slightly larger than h1(TBDA) for low entropytranslation strings corresponds to the initiation cost for lpaq1compression, which is &30 byte independently of the sequence. Theplot shows &30,000 pairs taken from all over the animal kingdom.doi:10.1371/journal.pone.0014373.g004
Alignment & Mutual Information
PLoS ONE | www.plosone.org 6 January 2011 | Volume 6 | Issue 1 | e14373
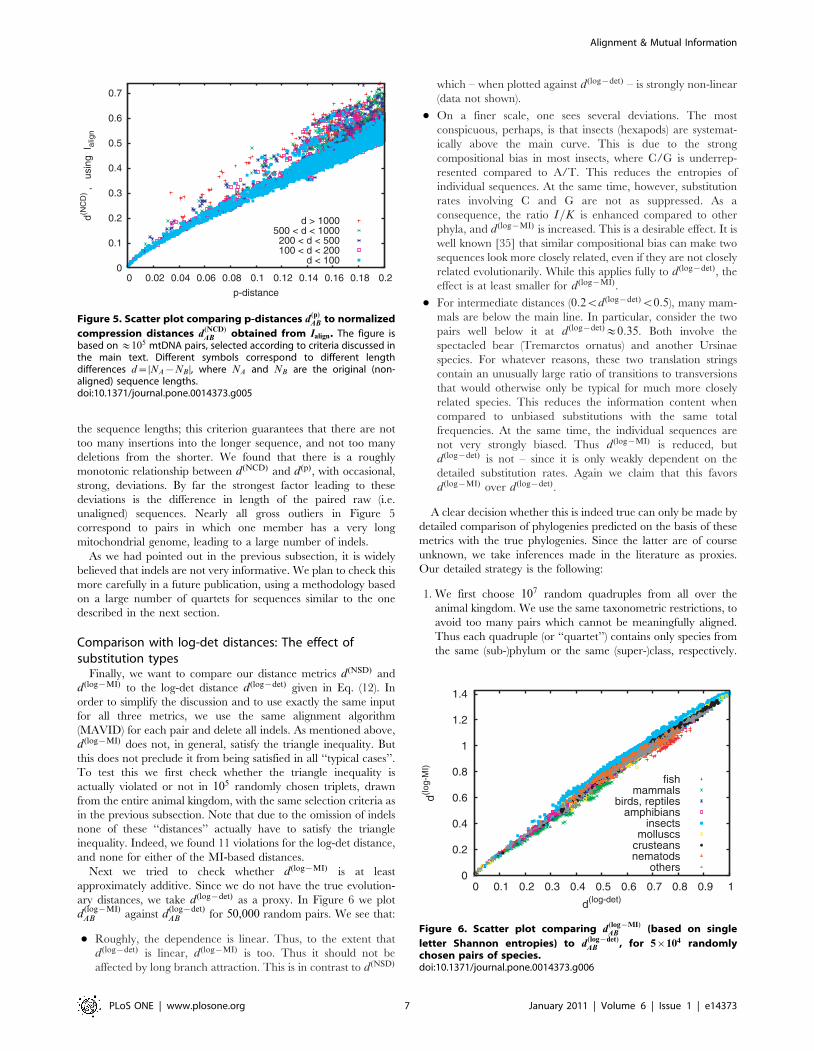
the sequence lengths; this criterion guarantees that there are not
too many insertions into the longer sequence, and not too many
deletions from the shorter. We found that there is a roughly
monotonic relationship between d(NCD) and d(p), with occasional,
strong, deviations. By far the strongest factor leading to these
deviations is the difference in length of the paired raw (i.e.
unaligned) sequences. Nearly all gross outliers in Figure 5
correspond to pairs in which one member has a very long
mitochondrial genome, leading to a large number of indels.
As we had pointed out in the previous subsection, it is widely
believed that indels are not very informative. We plan to check this
more carefully in a future publication, using a methodology based
on a large number of quartets for sequences similar to the one
described in the next section.
Comparison with log-det distances: The effect ofsubstitution types
Finally, we want to compare our distance metrics d (NSD) and
d (log{MI) to the log-det distance d(log{det) given in Eq. (12). In
order to simplify the discussion and to use exactly the same input
for all three metrics, we use the same alignment algorithm
(MAVID) for each pair and delete all indels. As mentioned above,
d (log{MI) does not, in general, satisfy the triangle inequality. But
this does not preclude it from being satisfied in all ‘‘typical cases’’.
To test this we first check whether the triangle inequality is
actually violated or not in 105 randomly chosen triplets, drawn
from the entire animal kingdom, with the same selection criteria as
in the previous subsection. Note that due to the omission of indels
none of these ‘‘distances’’ actually have to satisfy the triangle
inequality. Indeed, we found 11 violations for the log-det distance,
and none for either of the MI-based distances.
Next we tried to check whether d(log{MI) is at least
approximately additive. Since we do not have the true evolution-
ary distances, we take d(log{det) as a proxy. In Figure 6 we plot
d(log{MI)AB against d
(log{det)AB for 50,000 random pairs. We see that:
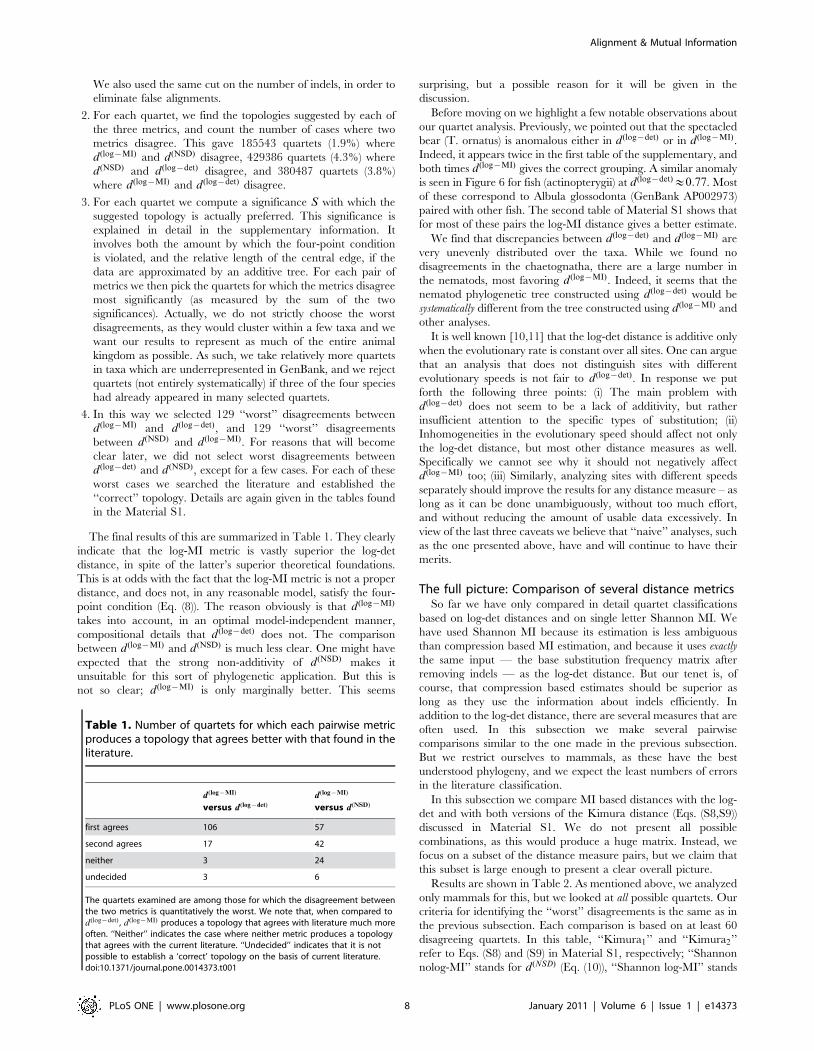
N Roughly, the dependence is linear. Thus, to the extent that
d (log{det) is linear, d (log{MI) is too. Thus it should not be
affected by long branch attraction. This is in contrast to d(NSD)
which – when plotted against d(log{det) – is strongly non-linear
(data not shown).
N On a finer scale, one sees several deviations. The most
conspicuous, perhaps, is that insects (hexapods) are systemat-
ically above the main curve. This is due to the strong
compositional bias in most insects, where C/G is underrep-
resented compared to A/T. This reduces the entropies of
individual sequences. At the same time, however, substitution
rates involving C and G are not as suppressed. As a
consequence, the ratio I=K is enhanced compared to other
phyla, and d(log{MI) is increased. This is a desirable effect. It is
well known [35] that similar compositional bias can make two
sequences look more closely related, even if they are not closely
related evolutionarily. While this applies fully to d(log{det), the
effect is at least smaller for d(log{MI).
N For intermediate distances (0:2vd (log{det)v0:5), many mam-
mals are below the main line. In particular, consider the two
pairs well below it at d (log{det)&0:35. Both involve the
spectacled bear (Tremarctos ornatus) and another Ursinae
species. For whatever reasons, these two translation strings
contain an unusually large ratio of transitions to transversions
that would otherwise only be typical for much more closely
related species. This reduces the information content when
compared to unbiased substitutions with the same total
frequencies. At the same time, the individual sequences are
not very strongly biased. Thus d(log{MI) is reduced, but
d (log{det) is not – since it is only weakly dependent on the
detailed substitution rates. Again we claim that this favors
d (log{MI) over d (log{det).
A clear decision whether this is indeed true can only be made by
detailed comparison of phylogenies predicted on the basis of these
metrics with the true phylogenies. Since the latter are of course
unknown, we take inferences made in the literature as proxies.
Our detailed strategy is the following:
1. We first choose 107 random quadruples from all over the
animal kingdom. We use the same taxonometric restrictions, to
avoid too many pairs which cannot be meaningfully aligned.
Thus each quadruple (or ‘‘quartet’’) contains only species from
the same (sub-)phylum or the same (super-)class, respectively.
Figure 5. Scatter plot comparing p-distances d(p)AB to normalized
compression distances d(NCD)AB obtained from Ialign. The figure is
based on &105 mtDNA pairs, selected according to criteria discussed inthe main text. Different symbols correspond to different lengthdifferences d~DNA{NB D, where NA and NB are the original (non-aligned) sequence lengths.doi:10.1371/journal.pone.0014373.g005
Figure 6. Scatter plot comparing d(log{MI)AB (based on single
letter Shannon entropies) to d(log{det)AB , for 5|104 randomly
chosen pairs of species.doi:10.1371/journal.pone.0014373.g006
Alignment & Mutual Information
PLoS ONE | www.plosone.org 7 January 2011 | Volume 6 | Issue 1 | e14373
We also used the same cut on the number of indels, in order to
eliminate false alignments.
2. For each quartet, we find the topologies suggested by each of
the three metrics, and count the number of cases where two
metrics disagree. This gave 185543 quartets (1.9%) where
d (log{MI) and d(NSD) disagree, 429386 quartets (4.3%) where
d (NSD) and d (log{det) disagree, and 380487 quartets (3.8%)
where d(log{MI) and d (log{det) disagree.
3. For each quartet we compute a significance S with which the
suggested topology is actually preferred. This significance is
explained in detail in the supplementary information. It
involves both the amount by which the four-point condition
is violated, and the relative length of the central edge, if the
data are approximated by an additive tree. For each pair of
metrics we then pick the quartets for which the metrics disagree
most significantly (as measured by the sum of the two
significances). Actually, we do not strictly choose the worst
disagreements, as they would cluster within a few taxa and we
want our results to represent as much of the entire animal
kingdom as possible. As such, we take relatively more quartets
in taxa which are underrepresented in GenBank, and we reject
quartets (not entirely systematically) if three of the four species
had already appeared in many selected quartets.
4. In this way we selected 129 ‘‘worst’’ disagreements between
d (log{MI) and d(log{det), and 129 ‘‘worst’’ disagreements
between d(NSD) and d(log{MI). For reasons that will become
clear later, we did not select worst disagreements between
d (log{det) and d (NSD), except for a few cases. For each of these
worst cases we searched the literature and established the
‘‘correct’’ topology. Details are again given in the tables found
in the Material S1.
The final results of this are summarized in Table 1. They clearly
indicate that the log-MI metric is vastly superior the log-det
distance, in spite of the latter’s superior theoretical foundations.
This is at odds with the fact that the log-MI metric is not a proper
distance, and does not, in any reasonable model, satisfy the four-
point condition (Eq. (8)). The reason obviously is that d (log{MI)
takes into account, in an optimal model-independent manner,
compositional details that d (log{det) does not. The comparison
between d (log{MI) and d (NSD) is much less clear. One might have
expected that the strong non-additivity of d(NSD) makes it
unsuitable for this sort of phylogenetic application. But this is
not so clear; d (log{MI) is only marginally better. This seems
surprising, but a possible reason for it will be given in the
discussion.
Before moving on we highlight a few notable observations about
our quartet analysis. Previously, we pointed out that the spectacled
bear (T. ornatus) is anomalous either in d (log{det) or in d(log{MI).
Indeed, it appears twice in the first table of the supplementary, and
both times d (log{MI) gives the correct grouping. A similar anomaly
is seen in Figure 6 for fish (actinopterygii) at d(log{det)&0:77. Most
of these correspond to Albula glossodonta (GenBank AP002973)
paired with other fish. The second table of Material S1 shows that
for most of these pairs the log-MI distance gives a better estimate.
We find that discrepancies between d(log{det) and d (log{MI) are
very unevenly distributed over the taxa. While we found no
disagreements in the chaetognatha, there are a large number in
the nematods, most favoring d (log{MI). Indeed, it seems that the
nematod phylogenetic tree constructed using d(log{det) would be
systematically different from the tree constructed using d(log{MI) and
other analyses.
It is well known [10,11] that the log-det distance is additive only
when the evolutionary rate is constant over all sites. One can argue
that an analysis that does not distinguish sites with different
evolutionary speeds is not fair to d(log{det). In response we put
forth the following three points: (i) The main problem with
d (log{det) does not seem to be a lack of additivity, but rather
insufficient attention to the specific types of substitution; (ii)
Inhomogeneities in the evolutionary speed should affect not only
the log-det distance, but most other distance measures as well.
Specifically we cannot see why it should not negatively affect
d (log{MI) too; (iii) Similarly, analyzing sites with different speeds
separately should improve the results for any distance measure – as
long as it can be done unambiguously, without too much effort,
and without reducing the amount of usable data excessively. In
view of the last three caveats we believe that ‘‘naive’’ analyses, such
as the one presented above, have and will continue to have their
merits.
The full picture: Comparison of several distance metricsSo far we have only compared in detail quartet classifications
based on log-det distances and on single letter Shannon MI. We
have used Shannon MI because its estimation is less ambiguous
than compression based MI estimation, and because it uses exactly
the same input — the base substitution frequency matrix after
removing indels — as the log-det distance. But our tenet is, of
course, that compression based estimates should be superior as
long as they use the information about indels efficiently. In
addition to the log-det distance, there are several measures that are
often used. In this subsection we make several pairwise
comparisons similar to the one made in the previous subsection.
But we restrict ourselves to mammals, as these have the best
understood phylogeny, and we expect the least numbers of errors
in the literature classification.
In this subsection we compare MI based distances with the log-
det and with both versions of the Kimura distance (Eqs. (S8,S9))
discussed in Material S1. We do not present all possible
combinations, as this would produce a huge matrix. Instead, we
focus on a subset of the distance measure pairs, but we claim that
this subset is large enough to present a clear overall picture.
Results are shown in Table 2. As mentioned above, we analyzed
only mammals for this, but we looked at all possible quartets. Our
criteria for identifying the ‘‘worst’’ disagreements is the same as in
the previous subsection. Each comparison is based on at least 60
disagreeing quartets. In this table, ‘‘Kimura1’’ and ‘‘Kimura2’’
refer to Eqs. (S8) and (S9) in Material S1, respectively; ‘‘Shannon
nolog-MI’’ stands for d(NSD) (Eq. (10)), ‘‘Shannon log-MI’’ stands
Table 1. Number of quartets for which each pairwise metricproduces a topology that agrees better with that found in theliterature.
d (log{MI)
versus d(log{det)
d(log{MI)
versus d (NSD)
first agrees 106 57
second agrees 17 42
neither 3 24
undecided 3 6
The quartets examined are among those for which the disagreement betweenthe two metrics is quantitatively the worst. We note that, when compared tod(log{det) , d (log{MI) produces a topology that agrees with literature much moreoften. ‘‘Neither’’ indicates the case where neither metric produces a topologythat agrees with the current literature. ‘‘Undecided’’ indicates that it is notpossible to establish a ‘correct’ topology on the basis of current literature.doi:10.1371/journal.pone.0014373.t001
Alignment & Mutual Information
PLoS ONE | www.plosone.org 8 January 2011 | Volume 6 | Issue 1 | e14373
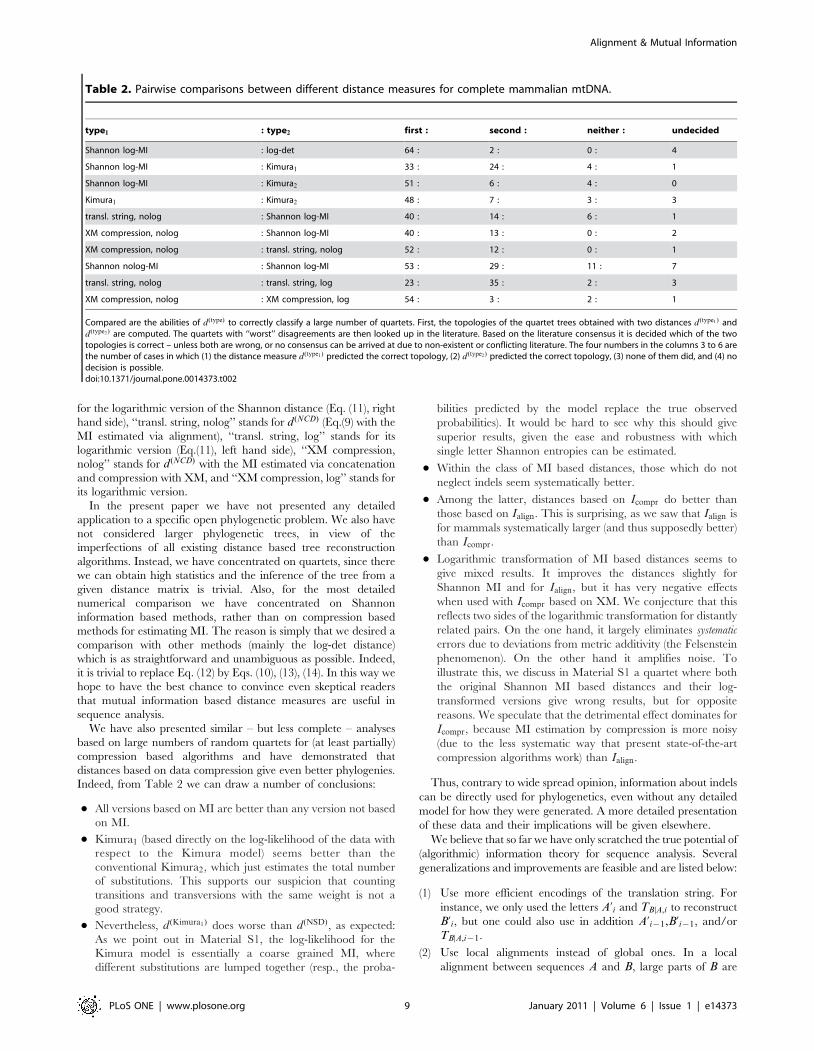
for the logarithmic version of the Shannon distance (Eq. (11), right
hand side), ‘‘transl. string, nolog’’ stands for d (NCD) (Eq.(9) with the
MI estimated via alignment), ‘‘transl. string, log’’ stands for its
logarithmic version (Eq.(11), left hand side), ‘‘XM compression,
nolog’’ stands for d (NCD) with the MI estimated via concatenation
and compression with XM, and ‘‘XM compression, log’’ stands for
its logarithmic version.
In the present paper we have not presented any detailed
application to a specific open phylogenetic problem. We also have
not considered larger phylogenetic trees, in view of the
imperfections of all existing distance based tree reconstruction
algorithms. Instead, we have concentrated on quartets, since there
we can obtain high statistics and the inference of the tree from a
given distance matrix is trivial. Also, for the most detailed
numerical comparison we have concentrated on Shannon
information based methods, rather than on compression based
methods for estimating MI. The reason is simply that we desired a
comparison with other methods (mainly the log-det distance)
which is as straightforward and unambiguous as possible. Indeed,
it is trivial to replace Eq. (12) by Eqs. (10), (13), (14). In this way we
hope to have the best chance to convince even skeptical readers
that mutual information based distance measures are useful in
sequence analysis.
We have also presented similar – but less complete – analyses
based on large numbers of random quartets for (at least partially)
compression based algorithms and have demonstrated that
distances based on data compression give even better phylogenies.
Indeed, from Table 2 we can draw a number of conclusions:
N All versions based on MI are better than any version not based
on MI.
N Kimura1 (based directly on the log-likelihood of the data with
respect to the Kimura model) seems better than the
conventional Kimura2, which just estimates the total number
of substitutions. This supports our suspicion that counting
transitions and transversions with the same weight is not a
good strategy.
N Nevertheless, d (Kimura1) does worse than d(NSD), as expected:
As we point out in Material S1, the log-likelihood for the
Kimura model is essentially a coarse grained MI, where
different substitutions are lumped together (resp., the proba-
bilities predicted by the model replace the true observed
probabilities). It would be hard to see why this should give
superior results, given the ease and robustness with which
single letter Shannon entropies can be estimated.
N Within the class of MI based distances, those which do not
neglect indels seem systematically better.
N Among the latter, distances based on Icompr do better than
those based on Ialign. This is surprising, as we saw that Ialign is
for mammals systematically larger (and thus supposedly better)
than Icompr.
N Logarithmic transformation of MI based distances seems to
give mixed results. It improves the distances slightly for
Shannon MI and for Ialign, but it has very negative effects
when used with Icompr based on XM. We conjecture that this
reflects two sides of the logarithmic transformation for distantly
related pairs. On the one hand, it largely eliminates systematic
errors due to deviations from metric additivity (the Felsenstein
phenomenon). On the other hand it amplifies noise. To
illustrate this, we discuss in Material S1 a quartet where both
the original Shannon MI based distances and their log-
transformed versions give wrong results, but for opposite
reasons. We speculate that the detrimental effect dominates for
Icompr, because MI estimation by compression is more noisy
(due to the less systematic way that present state-of-the-art
compression algorithms work) than Ialign.
Thus, contrary to wide spread opinion, information about indels
can be directly used for phylogenetics, even without any detailed
model for how they were generated. A more detailed presentation
of these data and their implications will be given elsewhere.
We believe that so far we have only scratched the true potential of
(algorithmic) information theory for sequence analysis. Several
generalizations and improvements are feasible and are listed below:
(1) Use more efficient encodings of the translation string. For
instance, we only used the letters A’i and TBDA,i to reconstruct
B’i, but one could also use in addition A’i{1,B’i{1, and/or
TBDA,i{1.
(2) Use local alignments instead of global ones. In a local
alignment between sequences A and B, large parts of B are
Table 2. Pairwise comparisons between different distance measures for complete mammalian mtDNA.
type1 : type2 first : second : neither : undecided
Shannon log-MI : log-det 64 : 2 : 0 : 4
Shannon log-MI : Kimura1 33 : 24 : 4 : 1
Shannon log-MI : Kimura2 51 : 6 : 4 : 0
Kimura1 : Kimura2 48 : 7 : 3 : 3
transl. string, nolog : Shannon log-MI 40 : 14 : 6 : 1
XM compression, nolog : Shannon log-MI 40 : 13 : 0 : 2
XM compression, nolog : transl. string, nolog 52 : 12 : 0 : 1
Shannon nolog-MI : Shannon log-MI 53 : 29 : 11 : 7
transl. string, nolog : transl. string, log 23 : 35 : 2 : 3
XM compression, nolog : XM compression, log 54 : 3 : 2 : 1
Compared are the abilities of d(type) to correctly classify a large number of quartets. First, the topologies of the quartet trees obtained with two distances d (type1) andd(type2 ) are computed. The quartets with ‘‘worst’’ disagreements are then looked up in the literature. Based on the literature consensus it is decided which of the twotopologies is correct – unless both are wrong, or no consensus can be arrived at due to non-existent or conflicting literature. The four numbers in the columns 3 to 6 arethe number of cases in which (1) the distance measure d (type1) predicted the correct topology, (2) d (type2 ) predicted the correct topology, (3) none of them did, and (4) nodecision is possible.doi:10.1371/journal.pone.0014373.t002
Alignment & Mutual Information
PLoS ONE | www.plosone.org 9 January 2011 | Volume 6 | Issue 1 | e14373
not aligned with A at all and are encoded without reference to
A. Only the aligned parts give information from A that can be
used to recover B. Before making the jump from global to
local alignments, an intermediate step would be a ‘‘glocal’’
alignment tool such as shuffle-lagan (‘‘slagan’’) of [2].
(3) Construct objective measures based on information theory for
the quality of multiple alignments. A straightforward measure
is the information about sequence C obtained from aligning it
simultaneously with A and B. Assume e.g. that the sequences
A and B are much more similar to each other than either Aand C or B and C (as for human, chimpanzee, and chicken).
In order to measure the MI between chicken and the
primates, one could first align A and B and then align, in a
second step, C to the fixed alignment (A,B).
ConclusionsAt present, biological sequence analysis is heavily based on the
concept of alignment. There exist proposals for alignment-free
approaches, and it has been suggested that they will become more
and more important as more sequence data become available [36].
To us it seems an open question whether alignment-free algorithms
for sequence comparison will become widely used, whether they
will eventually displace alignment-based algorithms, or whether
both approaches will merge into a unified approach. We hope that
we have shown with the present work that an amalgamation of both
methods (alignment-based and alignment-free) is possible. More
precisely, by showing that mutual informations between two
sequences can be easily estimated from global alignments, we have
established a direct link between sequence alignment, Shannon
information theory, and methods based on data compression and
Kolmogorov information theory. Technically, we have dealt only
with pairwise global alignment, but at least the basic concepts
should have much wider applicability.
From another point of view, the present paper deals with the
basic notion of parsimony. In bioinformatics (and in phylogeny in
particular) maximal parsimony in dealing with several objects is
often taken as synonymous to minimal number of changes needed
to go from the description of one object to the description of
another. This is most clearly formulated in the so-called
‘‘maximum parsimony method’’ of distance-free phylogenetic tree
construction [7], but it also underlies the concepts of p- and log-det
distances. However, the invention of the Morse alphabet in the
nineteenth century, and the theoretical works by Shannon,
Kolmogorov, and others in the middle of the last century might
cast some doubt on it. It is Rissanen’s minimum description length
principle [37,38], however, that makes this view obsolete today.
Instead of paying attention to the number of changes, one should
pay attention to the information needed to encode these changes.
We call this ‘‘true parsimony’’. In this sense, the maximum
parsimony method does not really aim for maximal true
parsimony. On the other hand, likelihood based and Bayesian
methods do aim for true parsimony, but at the cost of depending
on explicit models. One goal of the present paper is to show how
true parsimony can be measured in less model dependent ways
and how maximum true parsimony can be achieved to various
degrees of approximation. Moreover, even the crudest approxi-
mation – based on MI obtained via single-letter Shannon
entropies, with all information about indels discarded – can lead
to important practical improvements.
Supporting Information
Material S1 Additional figures, tables and discussion.
Found at: doi:10.1371/journal.pone.0014373.s001 (2.82 MB
PDF)
Acknowledgments
PG would like to thank Olav Zimmermann for numerous discussions.
Author Contributions
Conceived and designed the experiments: OP PG MP. Performed the
experiments: OP PG MP. Analyzed the data: OP PG MP. Contributed
reagents/materials/analysis tools: OP PG MP. Wrote the paper: OP PG
MP.
References
1. Aluru S, ed (2006) Handbook of computational molecular biology. Boca Raton:
Chapman & Hall/CRC.
2. Brudno M, Malde S, Poliakov A, Do C, Couronne O, et al. (2003) Glocal
alignment: finding rearrangements during alignment. Bioinformatics 19: 54–62.
3. Altschul S, Gish W, Miller W, Myers E, Lipman D (1990) Basic local alignment
search tool. Journal of molecular biology 215: 403–410.
4. Altschul S, Madden T, Schaffer A, Zhang J, Zhang Z, et al. (1997) Gapped
BLAST and PSI-BLAST: a new generation of protein database search
programs. Nucleic acids research 25: 3389.
5. McGinnis S, Madden T (2004) BLAST: at the core of a powerful and diverse set
of sequence analysis tools. Nucleic Acids Research 32: W20.
6. Durbin R, Eddy S, Krogh A, Mitchison G (1998) Biological sequence analysis:
Probabilistic models of proteins and nucleic acids. Cambridge University Press
Cambridge.
7. Nei M, Kumar S (2000) Molecular evolution and phylogenetics. USA: Oxford
University Press.
8. Buneman P (1974) A note on metric properties of trees. Journal of
Combinatorial Theory, Ser B 17: 48–50.
9. Saitou N, Nei M (1987) The neighbor-joining method: a new method for
reconstructing phylogenetic trees. Molecular biology and evolution 4: 406.
10. Lake J (1994) Reconstructing evolutionary trees from DNA and protein
sequences: paralinear distances. Proceedings of the National Academy of
Sciences of the United States of America 91: 1455.
11. Lockhart P, Steel M, Hendy M, Penny D (1994) Recovering evolutionary trees
under a more realistic model of sequence evolution. Molecular biology and
evolution 11: 605.
12. Cover T, Thomas J (2006) Elements of information theory John Wiley & Sons.
13. Milosavljevic A (1995) Discovering dependencies via algorithmic mutual
information: A case study in dna sequence comparisons. Machine Learning
21: 35–50.
14. Viola P, Wells III W (1997) Alignment by maximization of mutual information.International journal of computer vision 24: 137–154.
15. Allison L, Powell D, Dix T (1999) Compression and approximate matching.
Computer Journal 42: 1–10.
16. Varre J, Delahaye J, Rivals E (1999) Transformation distances: a family of
dissimilarity measures based on movements of segments. Bioinformatics 15:194–202.
17. Mahoney M (2008) http://cs.fit.edu/ mmahoney/compression/text.html.
18. Chen X, et al. (2003) http://monod.uwaterloo.ca/downloads/gencompress.
19. Cao M, Dix T, Allison L, Mears C (2007) A Simple Statistical Algorithm forBiological Sequence Compression. In: 2007 Data Compression Conference
IEEE Computer Society. pp 43–52.
20. Cilibrasi R, Vitanyi P (2005) Clustering by compression. IEEE Transactions on
Information Theory 51: 1523–1545.
21. Navarro G (2001) A guided tour to approximate string matching. ACMcomputing surveys (CSUR) 33: 88.
22. Press W, Teukolsky S, Vetterling W, Flannery B (2007) Numerical recipes: theart of scientific computing Cambridge University Press.
23. Li M, Badger J, Chen X, Kwong S, Kearney P, et al. (2001) An information-
based sequence distance and its application to whole mitochondrial genome
phylogeny. Bioinformatics 17: 149–154.
24. Li M, Chen X, Li X, Ma B, Vitanyi P (2004) The similarity metric. IEEETransactions on Information Theory 50: 3250–3264.
25. Kraskov A, Stogbauer H, Andrzejak R, Grassberger P (2003) Hierarchicalclustering based on mutual information. Arxiv preprint q-bio/0311039.
26. Felsenstein J (1981) Evolutionary trees from DNA sequences: a maximum
likelihood approach. Journal of molecular evolution 17: 368–376.
27. Bray N, Pachter L (2003) MAVID multiple alignment server. Nucleic Acids
Research 31: 3525–3526.
28. Lassmann T, Sonnhammer E (2005) Kalign – an accurate and fast multiplesequence alignment algorithm. BMC Bioinformatics 6: 298.
Alignment & Mutual Information
PLoS ONE | www.plosone.org 10 January 2011 | Volume 6 | Issue 1 | e14373
29. Bray N, Pachter L (2004) http://bio.math.berkeley.edu/mavid/download.
30. EMBL-EBI (2006) http://msa.sbc.su.se/cgi-bin/msa.cgi.31. Emboss (1999) http://bioweb2.pasteur.fr/docs/EMBOSS/stretcher.html.
32. Brudno M, Do C, Cooper G, Kim M, Davydov E, et al. (2003) LAGAN and
Multi-LAGAN: Efficient Tools for Large-Scale Multiple Alignment of GenomicDNA. Genome Research 13: 721–731.
33. Thompson J, Higgins D, Gibson T (1994) CLUSTAL W: improving thesensitivity of progressive multiple sequence alignment through sequence
weighting, position-specific gap penalties and weight matrix choice. Nucleic
Acids Res 22: 4673–4680.
34. NCBI (2008) http://www.ncbi.nlm.nih.gov/sites/entrez?db = genome.
35. Steel M, Lockhart P, Penny D (1993) Confidence in evolutionary trees from
biological sequence data. Nature 364: 440–442.
36. Vinga S, Almeida J (2003) Alignment-free sequence comparison–a review.
Bioinformatics 19: 513.
37. Rissanen J (1978) Modeling by shortest data description. Automatica 14:
465–471.
38. Rissanen J (1986) Stochastic complexity and statistical inference Analysis and
Optimization of Systems. pp 391–407.
Alignment & Mutual Information
PLoS ONE | www.plosone.org 11 January 2011 | Volume 6 | Issue 1 | e14373
Related Documents