SEPTEMBER/OCTOBER 2016 America's BEST Colleges and Universities BEST colleges for adult learners BEST bang for the buck colleges EMBARGOED INFORMATION: No Public Release Before 12:01 AM (EDT) August 29, 2016 © 2016 Washington Monthly Publishing LLC COLLEGE RANKINGS 2016 What Can College Do For You?

Welcome message from author
This document is posted to help you gain knowledge. Please leave a comment to let me know what you think about it! Share it to your friends and learn new things together.
Transcript

SEPTEMBER/OCTOBER 2016
America's BEST Colleges and UniversitiesBEST colleges for adult learnersBEST bang for the buck colleges
EMBARGOED INFORMATION:No Public Release Before
12:01 AM (EDT) August 29, 2016 © 2016 Washington Monthly Publishing LLC
COLLEGE RANKINGS
2016What Can College Do For You?

VOLUME 48 NUMBER 9/10SEPTEMBER/OCTOBER 2016
67
77
80
TOC IMAGES: middle: Courtesy of Dear World; bottom: ASSOCIATED PRESS
Cover
THE 2016 COLLEGE GUIDEIntroduction: A Different Kind of College Ranking 19by Kevin Carey
America’s Best Colleges for Adult Learners 23Nearly half of all college students are twenty-five or older. Yet no publication has ranked the top schools for them. Until now.by Paul Glastris
Best Colleges for Adult Learners Rankings 26
A Note on Methodology: Best Colleges for Adult Learners 34
America’s Best Bang for the Buck Colleges 2016 37Our exclusive list of schools that help non-wealthy students attain marketable degrees at affordable prices.by Robert Kelchen
Best Bang for the Buck Rankings 38
The Sixteen Most Innovative People in Higher Education 59How they’re working to make college more accessible, affordable, and effective.by Gilad Edelman
Labor of Love 67Paul Quinn College president Michael Sorrell thinks his work college model can thrive in cities across the country. But can it work without him?by Matt Connolly
How the Internet Wrecked College Admissions 73Colleges are drowning in online applications, which is bad news for both schools and students.by Anne Kim
The False Promise of “Free College” 77Hillary Clinton won’t be able to bring tuition down to zero. But if she’s willing to be radical, she can make college affordable for all.by Iris Palmer
National University Rankings 80
Liberal Arts College Rankings 94
Top 100 Master’s Universities 106
Top 100 Baccalaureate Colleges 110
A Note on Methodology: 4-Year Colleges and Universities 114

10 September/October 2016
Departments
Editor’s Note: Why We Let Underwhelming Colleges Host the Debates 11
Tilting at Windmills 14 The futility of trying to normalize Trump ... Dale Carnegie versus Norman Vincent Peale ...
by Timothy Noah
on politiCal Books
1968 Versus 2016 117
D espite the many similarities, this year isn’t 1968. Because Hillary understands what Johnson never did: that he had to be (mostly) at one with his party’s base.
by Ed Kilgore
The Myth of the Powell Memo 120
A secret note from a future Supreme Court justice did not give rise to today’s conservative infrastructure. Something more insidious did.
by Mark Schmitt
How Do You Get Ideologues to Change Their Minds? 123
The answer can be found in the conservative movement’s turn against mass incarceration.
by Heather Schoenfeld
Made from Concentrate 125
Four companies decide what meat you eat, two choose what milk you buy, and soon only one will determine what beer you drink. Are we all fine with that?
by Leah Douglas
Editor in Chief Founding EditorPaul Glastris Charles Peters
Senior Editor: Phillip LongmanManaging Editor, Print: Amy M. StackhouseManaging Editor, Digital: Matt ConnollySenior Writer: Anne Kim Books Editor: Kukula Kapoor Glastris Legal Affairs Editor: Garrett Epps Contributing Writer: Nancy LeTourneauWeb Editor: Martin Longman College Guide Guest Editor: Kevin CareyCollege Guide Data Manager: Robert KelchenContributing Editors: Jonathan Alter, Steve Benen, James Bennet, Thomas N. Bethell, Tom Bethell, Katherine Boo, Taylor Branch, Matthew Cooper, Michelle Cottle, Kevin Drum, Gregg Easterbrook, Haley Sweetland Edwards, John Eisendrath, James Fallows, T. A. Frank, Daniel Franklin, John Gravois, Joshua Green, Charles Homans, David Ignatius, Mickey Kaus, Phil Keisling, Ed Kilgore, Michael Kinsley, Christina Larson, Nicholas Lemann, Suzannah Lessard, Arthur Levine, Joshua Micah Marshall, Jon Meacham, StephanieMencimer, Matthew Miller, Rachel Morris, Timothy Noah, Joseph Nocera, JohnRothchild, David Segal, Walter Shapiro, Joshua Wolf Shenk, Amy Sullivan, Nicholas Thompson, Steven Waldman, Benjamin Wallace-Wells, Robert WorthEditorial Advisory Board: Nicholas Lemann, Chair ; Clara Bingham, DebraDickerson, James Fallows, Steven TelesFounder’s Board: Charles W. Bailey (1929–2012), Russell Baker, James DavidBarber (1930–2004), Edgar Cahn, David Halberstam (1934–2007), Murray Kempton (1917–1997), Peter Lisagor (1915–1976), Richard Reeves, Richard H. Rovere (1915–1979), Hugh Sidey (1927–2005), James C. Thomson III (1931–2002)Art Director: Amy SwanInterns: Katie Hazen, Jose Soto
Publisher Chairman Diane Straus Jeffrey Leonard
Vice President Vice President Operations and Marketing Circulation and Business
Carl Iseli Claire Iseli
Board of Directors: Jeffrey Leonard, Chair; Paul Glastris, Nicholas Lemann, Diane StrausPresident and Publisher Emeritus: Markos KounalakisBusiness Manager: Sarah P. WeeldreyerWeb Site Development: KettulSubscription Rates: U.S. and possessions: one year, $44.95; two years, $79.95; three years, $109.95. For Canadian and foreign subscriptions: add $20 per subscription year. Back issues, $6. Washington Monthly is indexed in the Book Review Index, Political Science Abstracts, Public Affairs Information Service, the Readers’ Guide to Periodical Literature, and Ulrich’s International Periodicals Directory and may be obtained on microfilm from University Microfilms International, Ann Arbor, MI 48106. Reprints: Please call 202-955-9010, or email [email protected] Service: Please call our customer service department toll-free at 855-492-1648, or email [email protected]: Please contact David Greene at 202-413-4736 or Diane Straus at 202-955-9010, ext. 201, or by email at [email protected] or [email protected] Offices: 1200 18th Street, NW, Suite 330, Washington, DC 20036; telephone202-955-9010; fax 202-955-9011. Unsolicited manuscripts can be emailed [email protected] or sent to the editorial offices.
Washington Monthly (ISSN 0043-0633) is published bimonthly by Washington Monthly LLC, 1200 18th Street, NW, Suite 330, Washington, DC 20036. Washington Monthly LLC is wholly owned by Washington Monthly Corporation, a District of Columbia 501(c)(3) nonprofit corporation. Periodicals postage paid at Washington, DC, and at additional mailing offices.
POSTMASTER: Send address changes to Washington Monthly, 1200 18th Street, NW, Suite 330, Washington, DC 20036.
www.washingtonmonthly.com
© 2016 Washington Monthly LLC. All rights reserved. Reproduction without per-mission is prohibited. Washington Monthly® trademark is registered in the U.S. Patent and Trademark Office.
SPECIAL THANKS TO LUMINA FOUNDATION, THE KRESGE FOUNDATION, AND THE BILL AND MELINDA GATES FOUNDATION FOR THEIR SUPPORT
Washington Monthly Remembers Warren O’Hearn
We mourn the loss of Warren E. O’Hearn, a retired commander in the U.S. Navy,
our longtime accountant and financial advisor, and, most importantly, a trusted colleague and friend.

Washington Monthly 19Washington Monthly 19
IntroductIon: a different kind
of college rankingBy Kevin Carey
eleven years ago, the Washington Monthly decided that America needed a different kind of college ranking.
Back then, U.S. News & World Report was the only game in town. Every year, the newsmagazine would rate the nation’s institutions of higher learning on measures of wealth, fame, and exclusivity, then publish the results as a list of “best” colleges.
In response, colleges tried to claw their way up the U.S. News ladder by raising prices and excluding all but the most privileged students—exactly the opposite of what a nation struggling to keep higher education affordable for an increas-ingly diverse student population actually needed.
So we gathered the best available data and ranked colleg-es not on what they did for themselves, but on what they did for their country. Our method had three pillars: social mobility, research, and service. Colleges that enrolled many low-income students and helped them graduate did well on our rankings, regardless of how famous they were. So did universities pro-ducing the next generation of scientists and PhDs, and those that built an ethos of public obligation by sending graduates into service.
But from the beginning, we acknowledged that the U.S. News rankings weren’t flawed simply because heaping compli-ments on Harvard and Princeton is a great way to sell guide-books for $9.95 at airport newsstands. (Although that was most of the reason.) U.S. News also relied on “input” measures like freshman SAT scores and class-size ratios because there was no way to measure outcomes of higher education, like how much students learned in school and whether they got good jobs after graduation. Those numbers didn’t exist—or if they did, colleges wouldn’t release them.
We have devoted a sizable portion of the in-depth jour-nalism that accompanies each new Washington Monthly Col-lege Guide to exploring and advocating for exactly this kind of data. And we’re pleased to report that it worked: last year, the Obama administration released a trove of new outcomes in-formation for every college and university in America. For the
first time, we know how much students earn ten years after enrolling at a given college and how likely they are to be paying down the principal on their loans. The new data also includ-ed new perspectives on college opportunity, including the per-centage of first-generation students at each college.
We incorporated all of this new information, and more, into this year’s rankings, marking the single-biggest change in our methodology to date. You can find the 2016 ranking of na-tional universities starting on page 80 and a detailed descrip-tion of the methodology on 114.
Some of the results were surprising. Colleges we once ranked as mediocre rose to the upper reaches. Others that we had long seen as stellar dropped down, sometimes drastically.
But on the whole, the new rankings bring the central problem facing American higher education into even sharper focus. It is far too easy for colleges to garner undeserved rep-utations for excellence by hiking tuition, burdening students with loans, and spending the money on things that have little to do with educational excellence. Meanwhile, colleges that are authentically committed to service and social mobility get far too little recognition or reward.
Here are some highlights of what we found:
Public Trust
The U.S. News national university rankings are dominated by private institutions that are free to pick and choose from among high school valedictorians and wealthy legacies. In fact, last year, only one public university, the University of Califor-
For more on our rankings and the latest in higher education reform news, go to the College Guide section of our website, at
washingtonmonthly.com/2016-college-guide

20 September/October 2016
nia, Berkeley, cracked U.S. News’s top twenty. On our rankings, public universities, which combine economic diversity with service and a commitment to knowledge production and re-search, have always done much better. That remains the case, with the majority of our top twenty national universities com-ing from the public sector, including the University of Califor-nia, San Diego, Texas A&M, and Brigham Young University, schools that rate nowhere near the top at U.S. News.
Adding new data elements to our rankings did, however, elevate a group of elite private universities, including Stanford,
Harvard, and MIT, which now comprise our top three. This shows that with enough money, it’s possible to be famous and exclusive and contribute to social mobility and research. (Those three universities possess $73 billion in combined endowment assets, representing more than 10 percent of the total for every university in America.) But this model provides few lessons for improving collegiate opportunity writ large. It is, by definition, limited to a tiny fraction of students, the victors in an increas-ingly winner-takes-all society. Indeed, even many elite schools with considerable means still fail to measure up on our rank-ings. Columbia, Northwestern, and Washington University in St. Louis, which rank number four, twelve, and fifteen, respec-tively, on the U.S. News list, come in at number twenty-four, forty, and ninety-nine in our rankings.
A more instructive example is California State, Fresno, ranked twenty-fifth on our list. Half of all undergrads there are first-generation students, and the majority have income low enough to qualify for a federal Pell Grant. Cal State–Fresno has a higher graduation rate than is typical, given those demographics, and a highly affordable net price for lower- and moderate-income students (calculated as tuition and fees minus grants and scholarships) of only $5,367 per year. Its students earn $3,600 more per year ten years after starting school than our statistical models predict, and also outperform peer institutions when it comes to students pay-ing down the principal on their loans. And Cal State–Fresno spends 59 percent of its federal work-study funds on public service—the single-highest percentage of any national uni-versity in the country.
Texas Woman’s University, located outside Dallas–Fort Worth, doesn’t produce much research, because it isn’t a re-search institution. And its service numbers could be better. But it excels at the task that students and parents care most about: helping graduates get a foothold in the middle class. Based on demographics and student majors, students from TWU (originally founded by the state legislature as the Girls Industrial College) should earn less than $34,000 per year at the ten-year mark. They actually earn $45,000 per year. TWU is highly focused on training students in fields like kinesiol-ogy, business administration, child development, and, most prominently, nursing. Colleges like TWU are the backbone of America’s modern system of career development, helping an economically and racially diverse student population get good jobs for an affordable price.
Mercer University in Georgia, ranked thirty-seventh on our list, is a long-established private institution with a solid graduation rate and academic profile of incoming freshmen. But given those numbers, Mercer enrolls many more low- income and first-generation students than is typical, earnings are robust, and students are paying their loans back at an un-usually high rate. Mercer also sends substantial numbers of graduates into ROTC and the Peace Corps, and reports a high level of community and staff participation in public service.
Universities like Cal State–Fresno, Texas Woman’s, and Mercer never show up on conventional “best college” rankings.
1. StanFord UniverSity (Ca) 42. Harvard University (MA) 2
3. MA Institute of Technology (MA) 7
4. University of California–San Diego (CA)* 39
5. University of Pennsylvania (PA) 9
6. Texas A&M University–College Station (TX)* 70
7. University of California–Berkeley (CA)* 20
8. University of California–Los Angeles (CA)* 23
9. Georgetown University (DC) 21
10. University of California–Davis (CA)* 41
11. Duke University (NC) 8
12. University of California–Riverside (CA)* 121
13. Yale University (CT) 3
14. University of Washington–Seattle (WA)* 52
15. Princeton University (NJ) 1
16. Georgia Institute of Technology–Main (GA)* 36
17. University of CA–Santa Barbara (CA)* 37
18. University of Florida (FL)* 47
19. Brigham Young University–Provo (UT) 66
20. University of NC–Chapel Hill (NC)* 30
21. University of Michigan–Ann Arbor (MI)* 29
22. Vanderbilt University (TN) 15
23. Columbia Univ. in the City of NY (NY) 4
24. University of Notre Dame (IN) 18
25. CA State University–Fresno (CA)* 52
26. Utah State University (UT)* Rank not published
27. Cornell University (NY) 15
28. University of Wisconsin–Madison (WI)* 41
29. Dartmouth College (NH) 12
30. VA Polytechnic Inst. & State Univ. (VA)* 70
Top 30NaTioNal UNiversiTies
ranK in U.S. NewS (2016)
The 2016 U.S. News rankings were released in September 2015.*Public institution

Washington Monthly 21Washington Monthly 21
And then there’s our bottom-ranked national university, Texas Southern, which last made national news nearly a de-cade ago when its former president pleaded no contest to crim-inal charges of misappropriating university funds. As journal-ists noted at the time, Texas Southern was arguably “created to fail” as a means of preventing desegregation. Unfortunately for its students, it continues to live this legacy, with a 15 percent graduation rate—far worse than other universities with simi-lar student populations—relatively high prices, and a stagger-ing 56 percent of borrowers failing to pay down the principal
They aren’t the most exclusive, and they don’t have football teams playing on New Year’s Day. Yet in relative anonymity, they are achieving the goal politicians and pundits say is vital: affordable, high-quality college education.
Then there are the colleges doing exactly the opposite. Hofstra University president Stuart Rabinowitz earns
more than $1 million per year. The university has a comfortable role in the greater New York City metropolitan area, enrolling students with an average SAT score near 1,200. Its published tuition of $40,460 is lower than some other private schools. U.S. News puts Hofstra in the middle of the pack, at 135th, a solid safety school for aspirants to NYU.
But our rankings suggest that’s pretty much all there is to Hofstra. It is home to few faculty who have been induct-ed into the National Academies or been similarly recognized at the top of their field. It conducts very little scientific re-search, and its graduates are relatively unlikely to go on to earn PhDs. Its graduation rate is below par, and it enrolls relative-ly few low-income and first-generation students—perhaps be-cause it charges students from households earning less than $75,000 per year a whopping net price of $28,865, one of the very highest rates nationwide. Employment results are par for the course, loan repayment rates somewhat worse. Hofstra is doing okay for itself. It is doing little for anyone else. We rank it 297th out of 303 national universities.
The University of Miami’s football program has gone through several cycles of scandal and glory over the decades. What’s constant is the university’s high tuition prices and an anemic commitment to economic opportunity. Fewer than one in five Miami students are from low-income families, with similar proportions among first-generation students, and those who do attend are charged nearly $25,000 in tuition per year. Yet after college, Miami students make almost $9,000 less per year than their demographics and student majors predict, among the ten worst disparities nationwide.
Catholic University’s spiritual commitment to aiding the poor seems to stop at the admissions office door. Only 13 percent of its students are eligible for Pell Grants, and 16 per-cent are first-generation college-goers, one of the worst num-bers nationwide.
Some national universities have fallen in our rankings from previous years, yet still stand out for their successes. The University of Texas at El Paso remains in our top third, be-cause, as in years past, it enrolls many low-income students and charges affordable prices while making considerable in-vestments in service and research. UTEP’s Achilles’ heel is the new loan repayment rate measure, which shows that nearly a quarter of students who borrow money to go there fail to pay down even $1 in principal on their loans five years after leaving school. UTEP administrators may need to invest in counseling and outreach to bring their ranking back up. Changes to the federal Pell Grant program that give nontraditional students aid to pay for summer semesters could help increase gradua-tion rates at UTEP (and elsewhere), reducing debt and improv-ing repayment rates.
1. Berea ColleGe (Ky) 672. Harvey Mudd College (CA) 14
3. Amherst College (MA) 2
4. Williams College (MA) 1
5. Haverford College (PA) 12
6. Bryn Mawr College (PA) 25
7. Washington and Lee University (VA) 14
8. Pomona College (CA) 4
9. Colgate University (NY) 19
10. Swarthmore College (PA) 3
11. Wesleyan University (CT) 14
12. Davidson College (NC) 9
13. Knox College (IL) 72
14. Carleton College (MN) 8
15. Bowdoin College (ME) 4
16. Middlebury College (VT) 4
17. Wellesley College (MA) 4
18. Ripon College (WI) 116
19. Grinnell College (IA) 19
20. New College of Florida (FL)* 82
21. Colby College (ME) 19
22. Agnes Scott College (GA) 67
23. Bates College (ME) 25
24. McDaniel College (MD) 134
25. University of Richmond (VA) 32
26. College of the Holy Cross (MA) 32
27. Bucknell University (PA) 32
28. Salem College (NC) 136
29. Hamilton College (NY) 14
30. Allegheny College (PA) 72
Top 30liberal arTs colleges
ranK in U.S. NewS (2016)
*Public institution

22 September/October 2016
on their loans. As Washington Monthly has shown in previous in-depth investigations, too many “dropout factory” colleges are built to fail, but don’t stop enrolling tens of thousands of vulnerable students, year after year.
Liberal Values
Our new ranking of liberal arts colleges follows a pattern simi-lar to national universities. Berea College tops this year’s list, due to its steadfast commitment to providing a free liberal arts education to first-generation and low-income students in Appalachia. This year’s candidates for the Democratic presi-dential nomination have promised huge new federal subsi-dies to students attending public colleges and universities. Yet those plans leave out colleges like Berea, which arguably do far more to advance the public interest than selective public uni-versities that skew toward the children of wealth and privilege.
Washington and Lee University in Virginia vaulted all the way to seventh on our liberal arts college ranking, on the strength of its affordable tuition and its outstanding earning results—students earned $18,000 more per year than our sta-tistical models predicted. Ripon College in Wisconsin outper-forms its peers in enrolling first-generation and Pell students, helping them graduate, and sending them successfully into the labor market. Tougaloo College, a historically black institu-tion in Mississippi, continues to outperform in graduating an overwhelmingly low-income student population while keeping prices affordable—although it, too, has a serious problem with students being unable to pay down their loans.
Agnes Scott College, an all-women’s institution in Geor-gia, jumped twenty-one places in the rankings this year in part due to superior earnings results, joining Bryn Mawr, Wellesley, and other women’s colleges that have historically ranked highly on our measures of service and social obliga-tion. Davidson College, a highly selective institution in North Carolina with a strong humanities tradition, rose to number twelve by virtue of strong earning and loan repayment rates, accompanied by generous financial aid policies for lower- and middle-income students.
On the down side, Bennington College, ranked 227 out of 239, is probably still a good place to matriculate if you want to write, or live in, a book like Donna Tartt’s The Secret History. But for everyone else, it offers stingy financial aid for needy students, below-par earnings and graduation rates, and com-paratively little in the way of research and service.
Regional Pride
National universities and liberal arts colleges dominate mass media coverage of higher education, but they don’t include the hundreds of regional and master’s-granting universities that collectively enroll millions of students every year. Among the best of them, St. John’s College in Santa Fe, New Mexi-co, shows that a traditional Great Books–focused liberal arts curriculum doesn’t necessarily lead to living in your parents’
basement at age twenty-five; earnings there rate comparably to similar schools, and a higher percentage of St. John’s gradu-ates go on to earn PhDs than any master’s university nation-wide. (Although this may lead to living in your parents’ base-ment when you’re thirty-five.) The Johnnies also enter the Peace Corps in high numbers.
California State campuses are located throughout the up-per ranks of our master’s university rankings. They vary in how successfully they help students graduate and pay back loans, but their common thread is a high population of Pell-eligible students and unusually low net prices for students who aren’t well-to-do—the legacy of California’s historical commitment to accessible higher education, one that remains threatened by economic and budgetary pressures in the Golden State.
The College of the Ozarks, a Christian liberal arts school in Missouri that offers free tuition to full-time students in ex-change for work and service commitments (its trademarked nickname is “Hard Work U”), rose to number two on our rank-ing of baccalaureate colleges. The majority of undergrads there qualify for Pell Grants, nearly two-thirds graduate within six years, and their loan repayment rates are stellar because no-body has loans to begin with. Number five–ranked Calvin Col-lege, a Christian Reformed Church institution in Grand Rap-ids, Michigan, combines high loan repayment rates with an academically minded research focus, and it’s one of the few col-leges to simultaneously excel in sending graduates into PhD programs, ROTC, and the Peace Corps.
Future Rankings
College rankings are only as good as the data that form them. To rank a college based on what happens to its students after leaving school is to assert that colleges bear responsibility for events that are partly outside their control. Public institutions can be hostage to the whims of elected officials. When we cel-ebrate or criticize an institution, we are really describing a con-fluence of individual actions, organizational decisions, and so-cietal trends.
But the great benefit of ranking the vast and diverse pop-ulation of American colleges is that the imperfections and limi-tations of the data have a tendency to balance themselves out, revealing a critical truth: for any category of institution, serv-ing any kind of student, there are colleges out there that tru-ly stand out on every measure, or at least most of them, com-pared to other, similar schools. When it comes to serving their country, they simply do better, year in and year out, at one of the most vital and sacred responsibilities any public-minded institution can bear.
Which is why we will continue to hunt and advocate for more information about the many ways colleges do or don’t succeed. And it’s why we will use that information, fairly and publicly, for the benefit of all.
Kevin Carey directs the Education Policy Program at New America and is guest editor of the Washington Monthly College Guide issue.

Washington Monthly 23Washington Monthly 23
america’s Best colleges for
adult learnersNearly half of all college students are twenty-five or older. Yet no publication
has ranked the top schools for them. Until now.
By Paul Glastris
go to almost any college website and look at the PRphotos of the students. The first thing you’ll prob-ably notice is their diversity: white, black, Latino,
Native American, Asian, Middle Eastern, all the colors of the rainbow. What you might not notice, at least at first, is what they all have in common: their age, late teens and early twenties. The reason you might not notice this is that it seems natural: in our mind’s eye, colleges are places filled with fresh-faced young people who recently graduated high school.
But in the real world, that’s no longer the case. More than 40 percent of the 20.2 million students at-tending American colleges and universities are adults, defined as twenty-five years old or older. This is not a new trend, and colleges surely know all about it. Yet the fact that the PR photos on their websites don’t reflect that reality indicates just how behind the curve most of them are in adapting and catering to this huge and grow- ing demographic.
Unlike traditional undergrads, adult learners tend to juggle full-time jobs and family responsibilities, and so they have trouble fitting daytime classes into their schedules. Yet few colleges offer anywhere near enough evening, weekend, and online classes to complete a de-gree, or—banish the thought—provide on-campus day-care. Many adult learners are returning students who have earned college credits elsewhere. Yet too often, col-leges won’t accept a lot of those credits, forcing adult students to spend more time and money to get their de-grees. Adult learners typically have learned-on-the-job
knowledge of the subject they’re hoping to major in—a bookkeeper studying accounting, for instance. But pre-cious few colleges offer tests that can let these students earn college credit for that knowledge—“prior learning assessments,” in higher ed speak.
The failure of so many colleges and universities to meet the needs of adult learners hurts us all. It diminishes up-ward mobility, robs the economy of needed skills, and slows our efforts to catch up with other countries in the percent-age of our population with post-secondary credentials.
And it’s not just the higher education system that has failed to adapt to the needs of adult learners. So has the press. The ever-growing number of publications that rate and rank American colleges and universities—U.S. News & World Report, Forbes, Money, Barron’s, Fiske, the Princ-eton Review, Kiplinger’s Personal Finance, the New York Times, the Times of London Educational Supplement— all focus mainly on high school students and their fami-lies. None rank colleges based on which serve adult stu-dents best.
Until now. In this issue, we inaugurate our first-ever rankings of the best colleges for adult learners. To create them, we pulled data from two federal government sourc-es: the Department of Education’s Integrated Postsec-ondary Education Data System (IPEDS) survey and the department’s new College Scorecard database, released last fall. We also are grateful to have been given key re-sults from the College Board’s Annual Survey of Colleges. We combined all these numbers into seven general mea-sures of colleges’ openness and responsiveness to adult

24 September/October 2016
students and to how well those students fared once they left. Our rankings for four-year schools begin on page 26, for two-year schools on page 30. Our detailed methodol-ogy begins on page 34.
At the top of our list of four-year schools is San Francisco’s Golden Gate University. This 110-year-old in-stitution, which started as a night law school, has long been devoted to the needs of adult learners. That devo-tion shows up in one of our measures: fully 88 percent of Golden Gate’s students are adults (the higher that percentage, the higher a school scores on our rankings). Golden Gate also does well on three metrics of adult stu-dent friendliness: “ease of transfer” (how open a school is, for instance, to accepting credits earned at other col-leges, and whether it lets adults enroll without having to take tests like the SAT); “flexibility of programs” (wheth-er it offers things like weekend and evening classes and prior learning assessments); and “services for adults” (fi-nancial aid counseling, on-campus daycare, job place-ment, specialized services for military veterans, and so on). Golden Gate does poorly on one metric, tuition and fees (at $14,640 per year, it’s relatively expensive), and middling on another, whether adult students are able to pay back at least some of the principal on their loans five years after leaving college. But it partially makes up for that in another important measure: earnings. The mean income of adult students ten years after they enter Gold-en Gate University is $73,166, the eighteenth highest of the 571 four-year schools we looked at.
Several other four-year colleges that traditionally fo-cus on adult learners also do well on our rankings. They include Regis University, a private nonprofit in Colorado (number twenty-two); Charter Oak State College in Con-necticut (twenty-eight), University of Maryland’s Uni-versity College (fifty-three), and the State University of New York (SUNY) Empire State College (sixty-three). So do a smattering of highly regarded state flagships, like the University of Iowa (thirteen) and Indiana University Bloomington (fifty-seven).
Equally instructive are the schools that don’t make the list. No for-profit colleges score in the top 100—though one, Walden University in Minnesota, a private institution organized as a “public benefit corporation,” clocks in at number nineteen. Also absent are Ivy League colleges, or indeed any of the private elite institutions that crowd the top of U.S. News’s rankings. Few of these institutions even made it into the 571 schools we looked at. That is because they enroll too few adult students for the federal government to provide statistically reliable loan repayment and earnings data. For the most part, these elite schools simply aren’t in the business of edu-cating adults.
Instead, our top 100 four-year list is dominated by the kinds of workaday schools—Montana State Univer-sity Billings (number fifteen), University of Missouri–Kansas City (number twenty)—that U.S. News tends to ignore. But according to our data, they deserve three cheers for providing affordable, career-enhancing college educations to America’s working adult students.
Community colleges seldom enjoy national repu-tations. One that does, Miami Dade College in Florida, the second-largest institution of higher education in the country, comes in at number seventy-nine on our rank-ing of the 100 best two-year schools. Mostly, though, the colleges on our two-year list are largely unknown out-side their communities but warrant national recogni-tion for delivering big-time for adult learners. Inver Hills Community College in Minnesota (number seven) gar-nered the highest scores possible on our ease of transfer and flexibility measures. And students at number one–ranked Weber State University in Utah, which grants mostly two-year degrees, earn an impressive $50,867 on average ten years after enrolling in college—the sixth-highest income among the 1,171 community colleges we looked at.
Every year, millions of adult Americans make the de-cision to go back to college to earn the degrees they need to advance their lives. We hope these rankings will help them pick colleges where they have the best chance of achieving their goals. Just as important, we hope that by honoring colleges that do right by adult students, we’ll spur more colleges to do the same.
Paul Glastris is editor in chief of the Washington Monthly.

26 September/October 2016
1 Golden Gate Univ.–San Francisco (CA) 5 6 4 88% 9 73167 18 83% 160 14640 360
2 University of Utah (UT)* 4 8 6 32% 184 64667 33 92% 9 7835 181
3 Park University (MO) 4 9 5 78% 28 53600 131 81% 186 10600 272
4 Concordia Univ.–Saint Paul (MN) 5 9 6 40% 128 56367 100 88% 48 20200 401
5 University of Colorado–Denver (CO)* 4 6 5 25% 263 93400 7 84% 133 8500 202
6 Bellevue University (NE) 5 8 2 82% 25 61433 55 84% 116 6450 77
7 Indiana Wesleyan University (IN) 5 8 5 69% 42 59233 76 82% 167 24102 444
8 Hawaii Pacific University (HI) 5 9 5 43% 108 55367 110 88% 37 21130 411
9 University of North Dakota (ND)* 5 7 6 17% 387 62833 43 84% 118 7741 174
10 CA State Univ.–Dominguez Hills (CA)* 5 9 5 38% 137 53300 134 77% 300 6139 54
11 Grand Canyon University (AZ)° 5 8 6 66% 48 62367 50 62% 508 17173 378
12 University of Oklahoma–Norman (OK)* 5 8 6 13% 450 62733 44 79% 250 7695 172
13 University of Iowa (IA)* 5 7 6 9% 503 66233 26 84% 114 8079 195
14 Marylhurst University (OR) 5 9 5 77% 31 39867 448 82% 164 20295 403
15 Montana State Univ.–Billings (MT)* 5 9 6 39% 129 36467 511 81% 204 5780 31
16 University of Wyoming (WY)* 4 8 6 24% 291 52500 148 88% 52 3968 1
17 CA State University–East Bay (CA)* 5 6 6 33% 177 56867 95 83% 151 6564 93
18 Jacksonville University (FL) 5 9 6 44% 105 58533 80 83% 135 31370 522
19 Walden University (MN)° 5 7 3 87% 13 58400 81 79% 262 11880 299
20 University of Missouri–Kansas City (MO)* 5 9 6 25% 276 53133 140 74% 365 9476 243
21 Southern IL University–Carbondale (IL)* 5 9 6 20% 351 53033 142 78% 295 11917 302
22 Regis University (CO) 5 9 5 60% 61 58133 83 83% 136 33060 534
23 University of Baltimore (MD)* 5 8 4 51% 81 61500 53 73% 388 8018 190
24 Winona State University (MN)* 5 8 6 12% 461 44000 350 91% 11 8750 213
25 Univ. of CO–Colorado Springs (CO)* 4 9 6 24% 280 50400 192 82% 163 7460 157
26 Governors State University (IL)* 4 8 6 62% 57 44167 346 76% 321 9386 235
27 Colorado Christian University (CO) 5 9 5 45% 95 55933 105 79% 264 20935 409
28 Charter Oak State College (CT)* 5 7 3 91% 5 45100 316 80% 216 7014 128
29 University of Minnesota–Twin Cities (MN)* 4 9 6 11% 466 59533 72 86% 72 13560 325
30 Utah State University (UT)* 4 7 6 24% 293 51500 174 91% 18 6384 71
31 Ramapo College of New Jersey (NJ)* 5 9 5 12% 453 54333 120 88% 53 13388 324
32 Northeastern Illinois University (IL)* 5 7 6 45% 101 42267 401 80% 228 8299 198
33 National University (CA) 4 8 3 77% 32 58233 82 84% 117 12384 308
34 Cardinal Stritch University (WI) 5 7 5 67% 47 59267 75 80% 215 26570 468
35 Eastern Michigan University (MI)* 5 9 6 27% 243 43300 377 77% 316 9663 245
36 Bethel University (TN) 5 9 5 68% 44 46767 278 62% 509 10750 281
37 Georgia Institute of Tech (GA)* 3 8 5 4% 552 78100 13 94% 5 11394 294
38 University of Southern Maine (ME)* 5 8 5 33% 175 41700 413 87% 66 7796 177
39 University of Wisconsin–Milwaukee (WI)* 5 8 6 22% 324 46900 273 80% 227 9391 236
40 Idaho State University (ID)* 5 8 6 35% 155 44567 332 72% 415 6566 94
41 Eastern Washington University (WA)* 5 7 6 21% 340 45767 295 85% 94 7972 188
42 Old Dominion University (VA)* 4 8 6 27% 239 51200 181 83% 154 8970 221
43 University of Alabama–Huntsville (AL)* 5 7 6 26% 247 54267 122 76% 338 9158 229
44 Florida Atlantic University (FL)* 4 8 6 28% 218 50367 194 78% 287 4831 7
45 University at Buffalo (NY)* 5 6 6 8% 509 63400 35 82% 174 8871 217
46 CUNY Bernard M. Baruch College (NY)* 3 9 5 25% 274 59333 73 87% 60 6561 91
47 Southern NH University (NH) 5 9 5 62% 58 48267 237 80% 213 29604 506
48 Granite State College (NH)* 4 9 4 76% 33 35833 517 80% 211 7065 131
49 Saint Leo University (FL) 5 7 5 72% 40 50200 200 75% 351 20110 400
50 Viterbo University (WI) 5 9 5 30% 197 52667 146 86% 81 23790 439
Ease of transfe
r (5 pts m
ax)
Services fo
r adult students (
6 pts max)
Mean earnings of adult students
10 years afte
r college entry
Flexibility of programs (9
pts max)
Rank Loan repayment rate of adult s
tudents
5 years afte
r leaving co
llege
% students o
ver age 25
RankRank
Tuition and fees
Rank
best 4-YeAR COLLeGes FORADULt LeARNeRs*Public institution
°For-profit institution

28 September/October 2016
best 4-YeAR COLLeGes FORADULt LeARNeRs
51 Metropolitan State Univ. of Denver (CO)* 5 7 6 45% 97 43167 381 72% 422 6070 49
52 University of Kentucky (KY)* 5 8 6 8% 505 48667 223 84% 121 10616 275
53 Univ. of MD–University College (MD)* 3 8 4 83% 22 57100 92 73% 389 6744 105
54 Calumet College of Saint Joseph (IN) 5 7 6 47% 89 48333 235 76% 337 16405 374
55 CA State Univ.–Monterey Bay (CA)* 4 8 6 16% 406 48267 237 85% 95 5963 45
56 University of New Mexico–Main (NM)* 5 8 6 26% 248 42200 405 76% 341 6846 116
57 Indiana University–Bloomington (IN)* 5 8 6 3% 561 50333 195 83% 145 10388 265
58 Fort Hays State University (KS)* 5 7 6 30% 203 39567 455 79% 259 4469 2
59 Rhode Island College (RI)* 5 7 6 24% 290 43600 359 81% 190 7602 166
60 University of Missouri–St. Louis (MO)* 5 7 6 28% 222 45700 297 79% 231 9474 242
61 University of Texas–Austin (TX)* 4 7 6 5% 548 62267 51 87% 64 9830 252
62 University of Alabama (AL)* 5 9 6 8% 506 49333 210 74% 362 9826 251
63 SUNY Empire State College (NY)* 4 9 3 84% 18 43967 352 74% 372 6665 103
64 Northern Kentucky University (KY)* 5 9 6 24% 284 39600 453 74% 384 8856 216
65 Virginia Commonwealth University (VA)* 5 7 6 15% 421 53167 135 81% 193 12398 310
66 CUNY College of Staten Island (NY)* 5 7 6 19% 365 48767 220 77% 306 6458 79
67 University of Houston (TX)* 4 7 6 20% 357 57400 90 81% 184 8605 203
68 Michigan State University (MI)* 4 8 6 4% 558 63200 42 84% 120 13954 348
69 CA State University–Long Beach (CA)* 4 6 6 17% 386 55467 109 88% 44 6452 78
70 University of Mount Olive (NC) 4 6 5 67% 46 48033 259 90% 21 17800 384
71 University of WA Bothell (WA)* 4 7 4 27% 241 65233 29 91% 15 11911 301
72 CA State University–Sacramento (CA)* 4 6 6 25% 272 54167 123 85% 103 6648 102
73 Notre Dame of MD University (MD) 4 8 6 62% 59 49567 208 86% 88 33010 533
74 Silver Lake Coll. of the Holy Family (WI) 5 9 4 54% 76 44467 336 86% 82 24350 446
75 University of Illinois at Chicago (IL)* 4 5 6 11% 468 71367 20 90% 26 14614 358
76 Saint Ambrose University (IA) 5 9 6 16% 410 48367 233 87% 63 27540 484
77 Wichita State University (KS)* 5 7 6 29% 207 43900 354 75% 354 7265 141
78 CUNY Lehman College (NY)* 3 8 6 43% 110 48867 217 78% 290 6408 74
79 Creighton University (NE) 5 7 6 7% 519 72333 19 89% 28 35360 546
80 Western Illinois University (IL)* 5 8 6 14% 429 43367 375 81% 192 11471 296
81 Portland State University (OR)* 4 6 6 41% 116 48300 236 82% 175 7794 176
82 Metropolitan State University (MN)* 4 8 3 72% 41 45533 303 82% 173 6642 101
83 University of La Verne (CA) 5 8 5 45% 93 61200 57 83% 138 36744 550
84 University of Northern Iowa (IA)* 5 8 6 9% 495 42633 390 79% 229 7749 175
85 Kean University (NJ)* 4 7 6 27% 230 50100 202 83% 137 11244 292
86 University of Central Missouri (MO)* 5 8 6 16% 402 37267 495 80% 225 7265 141
87 Boise State University (ID)* 4 8 6 31% 192 41133 425 79% 267 6641 100
88 University of Nebraska–Lincoln (NE)* 4 7 6 6% 532 50233 199 90% 22 8070 194
89 University of TX Permian Basin (TX)* 5 7 5 27% 234 47200 267 77% 303 5250 15
90 Texas Woman’s University (TX)* 5 6 5 36% 152 50300 197 78% 281 7836 182
91 Friends University (KS) 5 8 5 45% 94 50933 183 78% 276 24630 450
92 University of Texas–Arlington (TX)* 4 7 5 39% 130 53800 128 79% 252 8878 218
93 Western Michigan University (MI)* 4 8 6 13% 444 46833 276 85% 91 10685 278
94 Albertus Magnus College (CT) 4 8 5 52% 79 60100 66 81% 189 28930 500
95 Penn State–Main (PA)* 5 9 6 3% 563 48200 242 79% 232 17502 381
96 DeSales University (PA) 5 7 5 31% 189 61000 62 89% 30 32350 529
97 Salem State University (MA)* 5 7 6 24% 295 44933 320 74% 376 8646 207
98 National Louis University (IL) 4 5 5 78% 29 53433 133 77% 299 15711 369
99 Washington State University (WA)* 4 7 6 17% 388 52133 161 85% 97 12428 311
100 CA State University–Stanislaus (CA)* 5 5 6 21% 344 47333 266 83% 156 6686 104
Ease of transfe
r (5 pts m
ax)
Services fo
r adult students (
6 pts max)
Mean earnings of adult students
10 years afte
r college entry
Flexibility of programs (9
pts max)
Rank Loan repayment rate of adult s
tudents
5 years afte
r leaving co
llege
% students o
ver age 25
RankRank
Tuition and fees
Rank

30 September/October 2016
1 Weber State University (UT)* 4 9 6 32% 924 50867 6 88% 3 5184 708
2 Utah Valley University (UT)* 4 8 6 34% 841 51800 3 85% 6 5270 712
3 Central Texas College (TX)* 4 8 6 61% 209 39867 163 63% 363 2130 157
4 Howard Community College (MD)* 4 8 6 35% 805 48533 16 71% 132 4003 551
5 Gateway Community College (AZ)* 4 8 6 58% 244 37733 253 66% 250 2046 138
6 Columbia College (MO) 4 8 4 77% 36 42733 94 74% 89 6582 761
7 Inver Hills Community College (MN)* 4 9 5 40% 659 43733 66 78% 43 5272 713
8 Arapahoe Community College (CO)* 4 9 5 51% 374 40867 136 66% 260 3392 405
9 Capital Community College (CT)* 3 8 6 55% 302 41967 105 77% 50 3892 526
10 Lakeshore Technical College (WI)* 4 8 6 52% 351 34900 437 81% 21 3984 548
11 Mesa Community College (AZ)* 4 8 6 40% 654 42333 100 62% 418 2046 138
12 Diablo Valley College (CA)* 4 7 6 32% 906 44300 58 72% 125 1298 59
13 East Los Angeles College (CA)* 4 7 6 50% 385 39133 190 66% 246 1220 44
14 University of Alaska–Anchorage (AK)* 4 7 6 43% 548 43133 77 78% 36 6262 757
15 Oakton Community College (IL)* 3 7 6 42% 602 46367 36 82% 12 3061 342
16 Quincy College (MA)* 4 8 4 48% 412 46400 34 76% 64 4846 681
17 City College of San Francisco (CA)* 3 7 6 54% 311 45367 39 61% 467 1290 57
18 Milwaukee Area Technical College (WI)* 4 9 6 61% 203 33500 537 56% 646 4283 616
19 Prince George’s Community College (MD)* 3 7 6 47% 452 47967 25 63% 366 3480 422
20 Massachusetts Bay Community College (MA)* 4 5 5 40% 630 48767 9 84% 8 4176 591
21 College of the Canyons (CA)* 4 7 6 29% 1002 44433 53 63% 353 1154 29
22 Northcentral Technical College (WI)* 4 8 5 55% 305 36800 302 73% 98 4148 576
23 Ohlone College (CA)* 4 6 5 38% 694 45100 41 71% 130 1162 30
24 Stark State College (OH)* 4 9 6 49% 399 33233 567 57% 595 3686 472
25 Normandale Community College (MN)* 4 7 6 33% 898 42533 97 75% 81 5709 747
26 Univ. of the District of Columbia (DC)* 4 6 5 57% 258 43533 72 65% 310 5251 710
27 Northwest Florida State College (FL)* 4 7 6 44% 524 34200 488 80% 23 3124 357
28 Miami-Jacobs Career College (OH)° 3 8 5 73% 60 50900 5 42% 929 12024 838
29 Triton College (IL)* 4 8 5 45% 490 39667 169 63% 350 3638 467
30 Trident Technical College (SC)* 4 8 5 50% 386 34767 448 76% 63 3942 534
31 Bunker Hill Community College (MA)* 4 6 6 47% 440 37700 256 73% 102 3384 402
32 Penn State Fayette–Eberly (PA)* 4 8 6 23% 1107 48200 18 79% 27 13588 929
33 Saddleback College (CA)* 3 7 6 36% 773 43067 86 72% 110 1142 15
34 Herzing College (WI)° 4 7 4 81% 11 44300 58 59% 518 12790 884
35 Walla Walla Community College (WA)* 4 6 6 55% 291 35333 404 72% 121 4376 636
36 Broward College (FL)* 3 8 6 36% 769 40033 152 75% 74 2542 229
37 Rio Salado College (AZ)* 4 8 5 48% 415 37967 234 56% 627 2046 138
38 Penn State–Shenango (PA)* 4 6 5 51% 379 48200 18 79% 27 13332 907
39 Sante Fe Community College (NM)* 3 7 6 60% 215 32867 596 77% 49 1494 95
40 William Rainey Harper College (IL)* 3 8 6 36% 768 41033 130 72% 113 3102 355
41 North Lake College (TX)* 4 8 5 40% 634 40733 138 54% 706 1665 106
42 Hagerstown Community College (MD)* 4 8 6 36% 778 36533 325 63% 390 3108 356
43 Fox Valley Technical College–Appleton (WI)* 3 8 6 48% 428 36933 292 76% 58 4289 618
44 Lake Washington Inst. of Technology (WA)* 3 5 6 62% 188 40400 140 76% 59 3907 529
45 Cape Cod Community College (MA)* 4 7 6 43% 556 36100 345 69% 168 4212 598
46 National Amer. Univ.–Rapid City (SD)° 4 7 4 82% 8 43133 77 59% 549 13212 902
47 Portland Community College (OR)* 4 5 6 54% 310 38233 222 67% 224 3592 448
48 Fayetteville Tech. Community College (NC)* 4 8 5 60% 227 34233 484 52% 725 2394 194
49 Phoenix College (AZ)* 4 6 6 50% 389 36967 287 60% 509 2046 138
50 Santa Ana College (CA)* 4 5 5 58% 246 38767 201 67% 229 1142 15
best 2-YeAR COLLeGes FORADULt LeARNeRs*Public institution
°For-profit institution
Ease of transfe
r (4 pts m
ax)
Services fo
r adult students (
6 pts max)
Mean earnings of adult students
10 years afte
r college entry
Flexibility of programs (9
pts max)
Rank Loan repayment rate of adult s
tudents
5 years afte
r leaving co
llege
% students o
ver age 25
RankRank
Tuition and fees (p
er 9 months)
Rank

32 September/October 2016
best 2-YeAR COLLeGes FORADULt LeARNeRs
51 Lower Columbia College (WA)* 4 8 6 47% 453 32933 589 63% 368 4281 615
52 Nassau Community College (NY)* 4 6 6 24% 1096 45267 40 72% 122 4754 675
53 Delaware County Community College (PA)* 3 9 5 38% 717 41700 111 75% 75 4840 680
54 Florida State College at Jacksonville (FL)* 3 8 6 45% 484 36233 340 70% 154 2609 245
55 Western Nevada College (NV)* 4 6 6 49% 393 34433 470 68% 202 2700 272
56 Olympic College (WA)* 4 6 6 48% 420 35233 410 71% 145 3720 478
57 Mid-State Technical College (WI)* 4 8 5 48% 413 33300 558 73% 104 4116 569
58 North Hennepin Community College (MN)* 3 9 4 47% 449 42733 94 72% 112 4358 634
59 Chandler/Gilbert Community College (AZ)* 4 7 5 23% 1102 45633 38 64% 325 2046 138
60 Midway University (KY) 4 8 5 67% 125 43267 76 77% 48 22300 1165
61 San Diego Mesa College (CA)* 3 7 6 36% 776 41233 125 67% 228 1142 15
62 Orange Coast College (CA)* 3 8 6 29% 1004 40033 152 70% 160 1184 41
63 Wright State University–Lake Campus (OH)* 3 7 6 21% 1122 48100 24 78% 41 5842 750
64 College of DuPage (IL)*~ 3 9 6 38% 722 39000 194 64% 321 5371 721
65 Greenville Technical College (SC)* 4 7 6 42% 603 33333 554 72% 106 4094 567
66 Sinclair Community College (OH)* 4 8 6 46% 458 31800 695 53% 711 2377 186
67 Minneapolis Comm. and Tech. College (MN)* 4 7 5 54% 318 38167 224 60% 499 5350 720
68 De Anza College (CA)* 3 6 6 32% 926 47100 29 61% 443 1542 98
69 New Mexico State University–Grants (NM)* 4 6 5 46% 474 38067 227 69% 181 1896 126
70 Irvine Valley College (CA)* 3 8 6 31% 963 39500 176 67% 227 1326 65
71 University of Pittsburgh–Titusville (PA)* 4 6 5 21% 1126 53167 2 81% 18 11604 830
72 Penn. State University–Mont Alto (PA)* 4 8 5 24% 1101 48200 18 79% 27 13648 930
73 Yavapai College (AZ)* 3 8 6 55% 307 32700 622 61% 476 1896 126
74 Pikes Peak Community College (CO)* 4 6 6 46% 462 35867 357 61% 450 3227 371
75 Mt. Hood Community College (OR)* 3 8 6 47% 443 36567 321 65% 265 4751 674
76 CUNY Medgar Evers College (NY)* 3 8 5 43% 570 42933 89 71% 136 6332 758
77 College of Southern Nevada (NV)* 4 6 6 44% 522 37267 273 56% 630 2700 272
78 Paradise Valley Community College (AZ)* 3 8 6 37% 756 38600 205 61% 468 2046 138
79 Miami Dade College (FL)* 3 8 6 35% 818 36467 329 76% 62 3486 425
80 Hutchinson Community College (KS)* 4 8 6 32% 910 32600 634 65% 309 2720 279
81 Oklahoma State–Oklahoma City (OK)* 3 7 6 49% 405 38200 223 60% 512 2859 308
82 Seminole State College (FL)* 4 8 5 40% 629 35600 380 61% 475 3131 358
83 Skagit Valley College (WA)* 4 6 6 44% 510 34400 473 70% 166 4200 596
84 CUNY NYC College of Technology (NY)* 3 7 6 27% 1041 44600 48 77% 46 6369 759
85 Community Coll. of Baltimore County (MD)* 4 6 5 42% 601 41800 109 60% 490 3442 414
86 Shoreline Community College (WA)* 3 4 6 42% 593 45967 37 78% 40 3963 542
87 Piedmont Virginia Community College (VA)* 4 8 6 33% 868 33967 504 62% 411 4235 605
88 Westmoreland County Community Coll. (PA)* 4 9 5 38% 728 31667 705 69% 171 3870 523
89 Harcum College (PA) 4 7 6 54% 309 41267 124 81% 20 21260 1161
90 Hodges University (FL) 4 8 3 69% 91 42867 90 66% 264 13220 903
91 American River College (CA)* 3 8 6 51% 364 34700 455 50% 791 1104 2
92 Clark State Community College (OH)* 4 7 6 50% 387 32067 675 54% 689 3359 396
93 Gateway Community College (CT)* 3 8 6 42% 585 35067 424 70% 151 3866 517
94 Barton Community College (KS)* 4 6 6 41% 609 36067 347 61% 447 3008 333
95 Grossmont College (CA)* 4 7 5 32% 911 38533 210 63% 351 1386 80
96 Western Nebraska Community College (NE) 4 8 6 34% 837 30167 841 66% 245 2496 217
97 Front Range Community College (CO)* 3 8 5 42% 582 39567 174 67% 222 3365 399
98 Cameron University (OK)* 4 7 5 41% 615 39833 164 60% 503 5340 718
99 Edison State Community College (OH)* 4 9 5 40% 645 32667 626 60% 488 4219 599
100 Moraine Park Technical College (WI)* 3 8 4 69% 108 33800 512 73% 100 4151 581
Ease of transfe
r (4 pts m
ax)
Services fo
r adult students (
6 pts max)
Mean earnings of adult students
10 years afte
r college entry
Flexibility of programs (9
pts max)
Rank Loan repayment rate of adult s
tudents
5 years afte
r leaving co
llege
% students o
ver age 25
RankRank
Tuition and fees (p
er 9 months)
Rank
~ College of DuPage was put on probation by its accreditor.
34 September/October 2016
We began with the 7,687 postsecondary institutions listed in the Integrated Postsecondary Education Data System (IPEDS) as being active in the 2014–15
academic year. We then limited the sample to all colleges with a Carnegie basic classification in 2015 of between 1 and 23, excluding many certificate-granting institutions as well as special-focus institutions such as medical schools or rabbini-cal programs. We dropped fifty-eight colleges for being out-side the fifty states and Washington, D.C., dropped seven colleges for closing or merging since 2014–15, dropped four colleges for not participating in any federal financial aid pro-grams, and dropped the five service academies to be consis-tent with the main rankings. An additional 130 colleges were excluded for having fewer than 100 students in any of the last three years in which they were open.
The next sample restriction was to exclude colleges that did not have data on all of the outcome measures. Another 513 colleges were dropped for not participating in the Col-lege Board’s Annual Survey of Colleges, which is key in our rankings. Fifteen colleges did not have data on the percent of adult students, 315 colleges did not have data on average earnings of independent students, and we excluded 808 col-leges that participated in the federal student loan program but did not report a separate repayment rate for indepen-dent students. As we used the percentage of adult students as one of our metrics, colleges with insufficient numbers of independent students to have a separate repayment rate for independent students were unlikely to score highly in this ranking anyway. For twenty colleges that served at least 75 percent adult students and did not have separate data on earnings or repayment rates for independent students, we instead used data for all students. Our resulting sample is 1,749 colleges, of which 571 are considered four-year colleges (based on Carnegie classification and whether they award-ed more bachelor’s degrees than certificates or associate’s degrees) and 1,178 are two-year colleges. As a final precau-tion to weed out especially questionable colleges, we cross-checked all our rankings with the Department of Education’s level-two Heightened Cash Monitoring List. We then ran-domly selected five schools on each of the two lists, checked their status on the less severe level-one Heightened Cash Monitoring List, verified their accreditation, and searched through local and national news clips over the past year for signs of problems.
We used the following seven metrics in constructing our inaugural rankings for adult students:
(1) ease of transfer/enrollment. This is designed to re-flect how easy it is for adult students to either initially enroll or transfer in a given college. It includes data from the U.S. Department of Education’s Integrated Postsecondary Edu-cation Data System (IPEDS) and the College Board’s Annual Survey of Colleges on whether there is an orientation pro-gram for transfer students, whether transcript review is avail-able prior to admission, whether students can transfer in at an upper level (seniors for four-year colleges and sophomores for two-year colleges), whether a college is test-optional for adult students or open admission (four-year colleges only), and whether a transfer advisor is available. Four-year colleg-es could score up to five points on this metric, while two-year colleges could score up to four points.
(2) Flexibility of programs. This metric considers wheth-er colleges are flexible enough to meet the needs of adult students, and again is based on IPEDS and College Board data. Colleges receive a point if they allow credits to be earned by life experience/prior learning assessment, if cred-its can be earned via examination, if accelerated programs are available, if at least some distance programs are avail-able, if independent study classes are available, if student- designed majors are allowed, if weekend and/or evening classes are offered, if academic support is available after 6 p.m., or if academic support is available on weekends. Colleg-es could earn a maximum of nine points on this metric.
(3) Services available for adult students. This is basedon IPEDS and College Board data and reflects whether a col-lege offers services that adult students are most likely to use. Colleges receive a point if they offer general services for adult students, financial aid counseling, on-campus daycare, coun-seling services, job placement services, or veterans’ services. Colleges could earn at most six points on this metric.
(4) the percent of adult students (age 25+) at the col-lege. This measure is from IPEDS and represents the percent-age of undergraduate students who are age twenty-five or older, which is the age at which students are automatical-ly considered as independent from their parents for finan-cial aid purposes. We used this measure instead of the per-centage of independent students from the U.S. Department of Education’s College Scorecard due to there being no miss-ing data on this measure and the extremely strong correlation between the two measures.
(5) Mean earnings of adult students ten years after en-tering college. Here, we used newly released data from the College Scorecard to examine what the average earnings were for independent students a decade after they entered college regardless of whether they graduated or dropped out. (Independent students include all adult students, as well as younger students who are veterans or have children of their own—people who benefit from additional flexibility.) We would ideally like to compare this to students’ earnings before they entered (or reentered) college, but this is still a big
a note on MethodoloGy:BeSt ColleGeS For adUlt learnerS

Washington Monthly 35Washington Monthly 35
step forward in showing which colleges seem to serve their adult students well.
(6) loan repayment rates of adult students five yearsafter entering repayment. We use this metric from the Col-lege Scorecard to see what percentage of a college’s for-mer independent students were able to pay down at least $1 of their loan’s principal five years after entering repay-ment (typically, six months after leaving college). For the 122 colleges (all two-year institutions) that did not partici-pate in the federal student loan program and did not fully meet all students’ financial need, we assigned those colleg-es a repayment rate of zero. Recent research by the Institute for College Access and Success showed that nearly one mil-lion students attend community colleges that will not offer their students federal loans, instead steering them to private loans with far less favorable terms to borrowers. Addition-ally, a new article by Mark Wiederspan of Arizona State Uni-versity has found an empirical relationship between colleg-es that refuse to offer federal loans and worse academic out-comes for their students.
(7) tuition and fees for in-district students. This metriccomes from IPEDS and is a simple measure of affordability. We do not use net price in the adult student rankings because net price data is only available for first-time, full-time students— a far cry from this group of students.
We constructed the rankings by rescaling each of the first three measures to have a maximum score of five points each.
We then standardized each of the other four measures sepa-rately for two-year and four-year colleges to have a mean of zero and a standard deviation of one, trimming back a small number of observations that were more than five standard deviations away from the mean. The resulting rankings are then a sum of each of the seven measures, and we show the top 100 colleges in each sector.
A note on process: Initial decisions on what data to use, how to weigh that data, and which colleges to include in the rankings were made by Washington Monthly data manager and assistant professor of higher education at Seton Hall Uni-versity Robert Kelchen, Washington Monthly guest editor and New America education program director Kevin Carey, Wash-ington Monthly editor in chief Paul Glastris, and Becky Klein-Collins, associate vice president for research and policy devel-opment at the Council for Adult and Experiential Learning. We then presented those decisions to a vetting committee con-sisting of Shanna Smith Jaggars, director of student success research for the Office of Distance Education and E-Learning at Ohio State University and formerly assistant director of the Community College Research Center at Columbia Universi-ty; and Jack Buckley, senior vice president for research at the College Board and formerly commissioner of the U.S. Depart-ment of Education’s National Center for Education Statistics. With Jaggars’s and Buckley’s input, we adjusted the method-ology, built the rankings, and ran the rankings past our vet-ting committee for final approval. —Eds.

Washington Monthly 37Washington Monthly 37
america’s Best Bang for the
Buck colleges 2016Our exclusive list of schools that help non-wealthy
students attain marketable degrees at affordable prices.
By robert Kelchen
for the past four years, we’ve ranked America’s colleges and universities based on their “Bang for the Buck”—that is, the extent to which they charge students who aren’t rich a
reasonable price for quality education that will advance them in their careers. Last fall, the Obama administration made our job a lot easier. It released a new data set, the “College Scorecard,” that shows, for the first time, how much students earn ten years af-ter enrolling at a given college and whether they’re paying down at least some of the loan principal. It also reveals the percent of first-generation students each college enrolls, a key measure of its commitment to opportunity. We incorporated all this new data, and more, into our 2016 Best Bang for the Buck rankings, which are broken down by region and can be found starting on page 38. (We used the same data and methodology to create the social mobility portion of the main rankings, which begin on page 80; the methodology is explained beginning on page 114.)
The top Best Bang for the Buck colleges in each of our five regions reflect a diverse group of institutions. Harvard Univer-sity (tops in the Northeast) does a relatively good job for an elite college in enrolling lower-income and first-generation students, and getting into Harvard is generally a ticket to economic suc-cess. Berea College (South) and College of the Ozarks (Midwest) are familiar to many in the higher education world for being tu-ition-free colleges that primarily serve low-income students. Cal State–Bakersfield is best in the West for serving large numbers of modest-income and first-generation students at a low price, and setting them up to earn, ten years after enrolling, $49,800 a year, over $10,000 more than do former students from other colleges who have similar backgrounds. The University of Mount Olive in North Carolina heads our Southeast list on the strength of a low net price of attendance for families making less than $75,000 per year and outperforming its expected values for grad-uation rates, earnings, and loan repayment.
Across the regions, a few trends stand out. Some elite pri-vate colleges (such as Penn, Princeton, Duke, and Stanford) make the top twenty in their regions, but the lists are dominat-
ed by lesser-known private colleges and non-flagship public col-leges. For example, CUNY Brooklyn College is one spot ahead of Yale in the Northeast and Trinity Washington College edges out Davidson College in the Southeast. University of California and California State University campuses make up nearly half of the top twenty in the West, highlighting the historical commitment of California citizens to their public colleges (even as the number of qualified students far exceeds available capacity).
Prospective students who don’t have money to burn might also want to look at the bottom of our Best Bang lists to see which kinds of colleges they should probably avoid, and why. The University of Tulsa, 197th out of 199 colleges in the South, charges more than $22,000 a year in tuition, even though its stu-dents go on to earn almost $10,500 less per year than would be expected considering their backgrounds. If your family income is less that $75,000 a year and you want to enroll at Hampshire College, the respected liberal arts school in Massachusetts, be aware that you’ll pay, on average, $24,000 a year to do so and ten years later will earn $31,900 a year, nearly $8,000 less than had you attended another school, even after taking the mix of ma-jors into account.
Finally, in the future we would love to supplement these rankings with data not just on specific colleges but on different programs within each college. After all, a university that might be a great value for a physics major might not be so good for a communications major. The U.S. Department of Education has indicated that it may include program-level data in future up-dates to the College Scorecard tool. However, the federal gov-ernment is years behind states such as Florida, Tennessee, and Virginia in making this important information available to the public—in part due to a congressional ban on student-level data that primarily serves to obscure colleges’ true outcomes.
robert Kelchen, an assistant professor of higher education in the Depart-ment of Education Leadership, Management, and Policy at Seton Hall University, is data manager of the Washington Monthly College Guide.

38 September/October 2016
1 College of the Ozarks (MO) 63% 22 45% 6 63% 47% 20 36% 35% 178 31200 25999 14 11014 24 100%* 1 82% 2
2 University of Michigan–Dearborn (MI)* 51% 183 50% 144 43% 30% 31 41% 30% 23 48150 44908 34 8799 14 82% 262 79% 106
3 Ripon College (WI) 71% 164 60% 12 36% 30% 75 33% 25% 48 43750 39111 18 16477 163 93% 177 88% 34
4 Kettering University (MI) 58% 106 66% 315 26% 20% 77 22% 23% 218 74650 57527 1 28471 364 95% 10 86% 10
5 Southwestern College (KS) 53% 167 33% 4 37% 33% 127 41% 36% 94 44300 40913 30 19684 298 85% 199 73% 3
6 Bethel College–Mishawaka (IN) 66% 49 47% 5 52% 39% 25 39% 38% 158 35450 36084 199 16213 187 86% 181 79% 18
7 Eastern Illinois University (IL)* 60% 87 54% 55 39% 40% 208 38% 37% 186 41850 35874 8 14468 128 89% 104 83% 26
8 Ottawa University–Ottawa (KS) 35% 266 38% 237 48% 35% 28 47% 35% 12 42700 34897 3 16000 185 79% 246 72% 47
9 Truman State University (MO)* 72% 26 69% 107 20% 17% 142 23% 22% 162 43950 42537 102 9973 26 94% 20 93% 173
10 Elmhurst College (IL) 74% 17 63% 21 34% 31% 133 36% 31% 106 50050 47915 61 16551 201 92% 52 89% 109
11 Lake Superior State University (MI)* 41% 213 36% 72 41% 33% 62 39% 33% 89 35900 33465 64 8794 3 79% 251 80% 245
12 University of Illinois at Chicago (IL)* 58% 249 61% 262 50% 32% 5 39% 31% 46 51950 51086 134 11353 79 90% 183 87% 61
13 Saint Mary-of-the-Woods College (IN) 56% 60 40% 8 50% 46% 113 47% 40% 59 31300 29389 89 12878 69 80% 232 84% 292
14 Spring Arbor University (MI) 54% 150 50% 81 45% 36% 51 41% 35% 74 41150 38410 42 14596 132 86% 185 81% 53
15 Wilberforce University (OH) 43% 193 20% 2 84% 77% 72 44% 53% 344 32600 30052 59 16779 227 63% 339 44% 1
16 Missouri Southern State Univ. (MO)* 35% 264 36% 199 59% 39% 10 47% 37% 28 33200 32746 146 8140 2 72% 309 75% 270
17 Univ. of IL–Urbana-Champaign (IL)* 84% 47 82% 106 20% 17% 99 23% 21% 155 57350 55166 73 12402 106 95% 57 93% 108
18 Illinois Institute of Technology (IL) 65% 186 66% 190 32% 23% 38 32% 24% 42 66200 64248 84 15062 190 93% 101 88% 12
19 Baker University (KS) 55% 140 51% 91 38% 30% 58 39% 32% 66 50250 48202 65 16148 183 87% 146 81% 20
20 Univ. of Nebraska–Kearney (NE)* 55% 137 52% 98 35% 32% 131 39% 34% 102 39200 37993 110 12484 74 90% 69 85% 51
21 MO Univ. of Science & Tech. (MO)* 64% 207 66% 244 27% 13% 9 25% 20% 104 64700 62449 69 13234 126 92% 109 90% 92
22 Tiffin University (OH) 40% 289 33% 47 62% 46% 17 58% 39% 2 36950 34233 43 23414 345 78% 307 66% 4
23 Mt. Vernon Nazarene Univ. (OH) 57% 115 53% 85 43% 33% 46 41% 33% 50 41950 40453 95 17935 252 88% 124 83% 46
24 University of Notre Dame (IN) 95% 7 98% 242 12% 11% 192 10% 14% 291 69400 64442 17 13769 144 99% 2 98% 191
25 Saint Johns University (MN) 79% 90 71% 24 20% 23% 247 15% 21% 322 57550 53773 26 16853 181 98% 68 92% 25
26 Grand Valley State University (MI)* 67% 46 61% 53 36% 28% 56 32% 31% 181 40450 41425 223 13353 101 90% 88 88% 124
27 Valparaiso University (IN) 70% 29 66% 87 26% 21% 92 27% 25% 170 49100 48352 135 16408 196 94% 23 90% 80
28 Buena Vista University (IA) 50% 111 54% 266 50% 35% 22 39% 33% 73 38750 35752 48 16377 203 89% 77 86% 123
29 Mount Mercy University (IA) 66% 50 52% 9 35% 39% 268 35% 37% 244 43050 41730 106 18078 258 93% 34 87% 27
30 Milwaukee School of Engineering (WI) 56% 128 69% 360 28% 17% 39 28% 21% 62 64950 60718 19 17870 250 93% 39 86% 23
31 Ohio Northern University (OH) 67% 6 64% 119 24% 23% 172 26% 27% 220 53950 46663 4 20314 330 93% 35 92% 166
32 Baldwin Wallace University (OH) 69% 32 63% 49 32% 31% 187 35% 31% 124 44550 44475 164 16752 208 93% 38 87% 42
33 Park University (MO) 42% 270 27% 7 32% 45% 347 49% 42% 65 46100 46030 165 10512 38 81% 268 71% 6
34 Clarke University (IA) 69% 5 55% 11 39% 36% 137 38% 34% 103 40900 38322 58 19914 319 88% 97 89% 216
35 Univ. of Wisconsin–Eau Claire (WI)* 67% 44 65% 124 27% 29% 220 27% 31% 297 44400 43206 113 11481 48 94% 13 93% 146
36 Bradley University (IL) 76% 9 72% 89 27% 24% 135 26% 25% 183 52000 49029 38 19664 297 94% 22 92% 129
37 Western Illinois University (IL)* 55% 141 51% 78 43% 43% 202 39% 39% 213 42000 38181 22 15805 168 86% 180 80% 36
38 Simpson College (IA) 68% 196 61% 35 30% 27% 124 27% 24% 137 46800 43061 29 17876 234 95% 144 92% 99
39 Fort Hays State University (KS)* 42% 267 30% 14 28% 39% 340 42% 39% 147 38250 36433 77 10126 28 86% 191 81% 49
40 Malone University (OH) 58% 114 53% 80 42% 34% 64 42% 34% 44 39350 41440 263 16078 177 90% 87 82% 11
41 Cornell College (IA) 68% 195 70% 219 34% 23% 34 24% 20% 119 41600 40629 129 14986 113 94% 161 90% 75
42 Millikin University (IL) 59% 103 59% 179 40% 35% 102 36% 33% 139 43400 39763 24 16421 198 88% 141 85% 105
43 Michigan State University (MI)* 79% 72 71% 22 24% 26% 236 23% 28% 305 49750 47324 63 11226 75 91% 174 90% 183
44 Hamline University (MN) 65% 62 63% 140 38% 31% 63 26% 31% 304 46500 42737 23 17620 243 91% 59 90% 147
45 Cardinal Stritch University (WI) 49% 305 48% 155 43% 40% 100 47% 37% 16 50850 43164 2 17508 270 81% 330 76% 17
46 Univ. of Wisconsin–Stevens Point (WI)* 59% 93 59% 161 34% 32% 160 35% 34% 187 40100 42032 255 11522 49 95% 12 88% 19
47 University of Illinois–Springfield (IL)* 46% 235 50% 247 37% 34% 139 38% 32% 75 41450 41176 153 9015 15 85% 208 81% 66
48 Illinois State University (IL)* 72% 123 67% 56 26% 32% 314 31% 32% 221 45450 40625 20 14925 178 93% 93 89% 24
49 Drury University (MO) 55% 296 49% 41 64% 23% 1 45% 21% 1 33350 33944 195 19588 290 72% 346 81% 359
50 Western Michigan University (MI)* 55% 268 51% 66 39% 37% 128 32% 36% 284 43550 37730 12 14771 174 88% 241 84% 50
best bANG FOR the bUCk MIDWest COLLeGes*Public institution
°For-profit institution
6-year graduation rate
Predicted grad rate based on % of Pell re
cipients,
incoming SATs, etc.
Graduation rate rank
Grad rate performance rank
Students receiving Pell G
rants
Predicted % Pell based on ACT/S
AT and admit rates
Pell performance rank
First-gen stu
dents
Predicted % first-
gen based on ACT/SAT and admit rates
First-gen performance rank
Median earnings 10 years a
fter entering college
Predicted median earnings
Earnings performance rank
Net price of attendance for families below $75,0
00 income
Net price rank
% repaying $1 in loan principal 5 years a
fter leaving coll.
Repayment rank
Predicted repayment ra
te
Repay. rate perf. r
ank

40 September/October 2016
51 Hanover College (IN) 69% 188 63% 52 31% 35% 270 30% 28% 153 45100 39128 11 16494 165 91% 215 89% 135
52 Indiana Wesleyan University (IN) 68% 35 57% 15 39% 27% 36 49% 31% 3 46700 46877 175 24951 352 84% 219 81% 78
53 Michigan Technological University (MI)* 65% 185 65% 164 26% 20% 52 24% 24% 201 60200 59718 145 10977 68 93% 99 92% 138
54 Knox College (IL) 80% 79 71% 18 28% 23% 83 22% 21% 167 42550 42358 157 16901 186 93% 192 91% 144
55 Pittsburg State University (KS)* 49% 211 45% 79 41% 36% 108 38% 37% 169 38700 39675 222 10498 37 84% 217 80% 72
56 College of Mount St. Joseph (OH) 56% 131 47% 30 33% 36% 253 37% 37% 194 41600 39654 70 14602 133 85% 211 81% 83
57 Muskingum University (OH) 50% 198 51% 193 42% 38% 125 42% 38% 115 40250 38521 83 15336 151 88% 129 82% 39
58 Grinnell College (IA) 88% 42 88% 170 23% 12% 33 14% 12% 135 45850 50378 330 11927 33 95% 132 95% 199
59 Augsburg College (MN) 62% 73 57% 61 43% 35% 54 28% 33% 302 44550 43614 125 17881 251 90% 82 86% 69
60 Ursuline College (OH) 49% 216 45% 93 47% 42% 110 42% 39% 133 42050 39543 50 13251 99 79% 300 78% 142
61 Wabash College (IN) 72% 157 66% 42 25% 29% 256 23% 24% 232 50750 44195 7 19121 277 92% 212 88% 89
62 Univ. of Wisconsin–Platteville (WI)* 53% 168 56% 254 31% 28% 147 35% 33% 150 45350 47365 259 11582 52 93% 43 84% 9
63 Ferris State University (MI)* 50% 202 49% 154 41% 37% 111 38% 37% 174 40750 38845 72 11604 53 83% 250 82% 190
64 College of Saint Benedict (MN) 81% 75 74% 33 24% 22% 159 18% 21% 270 46700 43547 40 17946 237 98% 86 98% 228
65 Denison University (OH) 83% 66 84% 216 18% 16% 161 21% 15% 70 48450 48741 182 14066 86 95% 125 94% 133
66 Univ. of Wisconsin–Green Bay (WI)* 49% 317 54% 287 32% 33% 206 42% 28% 5 40100 41235 224 11312 19 94% 156 87% 14
67 Eureka College (IL) 57% 56 53% 100 40% 36% 104 41% 33% 43 38100 37761 152 15603 162 85% 157 86% 239
68 Metropolitan State University (MN)* 34% 319 34% 175 42% 40% 150 36% 42% 311 43900 39582 16 13382 103 84% 234 77% 21
69 College of Saint Scholastica (MN) 65% 59 61% 94 31% 30% 177 30% 31% 235 49150 45803 31 18157 263 92% 55 91% 182
70 Saint Xavier University (IL) 52% 177 54% 220 50% 41% 50 46% 36% 26 46900 46371 141 14627 134 83% 247 81% 126
71 Southeast MO State University (MO)* 49% 217 48% 157 36% 31% 93 43% 34% 40 36050 36048 168 10329 34 81% 282 81% 217
72 Monmouth College (IL) 57% 278 53% 64 43% 43% 205 37% 33% 98 40100 38447 94 13650 70 86% 294 82% 70
73 Dominican University (IL) 64% 64 54% 27 44% 40% 115 46% 37% 35 45450 48083 291 14045 116 84% 222 85% 212
74 Indiana University–Bloomington (IN)* 77% 83 70% 31 18% 26% 330 24% 28% 298 45350 44616 139 8848 29 91% 145 91% 161
75 Saint Cloud State University (MN)* 47% 229 47% 176 30% 35% 277 31% 37% 317 41250 39719 93 12203 66 91% 62 84% 16
76 Hannibal-LaGrange University (MO) 49% 113 45% 74 36% 41% 279 44% 36% 41 33800 34141 183 14826 136 87% 118 83% 102
77 Bluffton University (OH) 59% 43 47% 19 40% 43% 233 41% 36% 96 39350 40380 215 19314 314 91% 58 84% 41
78 University of Evansville (IN) 65% 14 65% 173 26% 24% 149 27% 28% 233 41450 39469 86 17451 254 93% 44 93% 225
79 Central Christian College of Kansas (KS) 36% 260 36% 192 56% 49% 67 45% 38% 67 30950 30966 169 16444 205 82% 198 72% 13
80 Quincy University (IL) 52% 179 50% 136 43% 33% 47 40% 36% 107 37950 38630 204 15372 155 83% 249 80% 90
81 Marian University (WI) 52% 176 46% 60 40% 45% 282 45% 42% 134 41600 39576 68 16462 199 87% 147 83% 74
82 Waldorf University (IA)° 39% 238 36% 120 54% 50% 117 45% 40% 99 37150 34753 67 19280 313 84% 178 73% 7
83 Grace Coll. & Theological Seminary (IN) 61% 77 53% 36 34% 32% 158 29% 34% 307 33900 37861 323 14893 143 93% 32 86% 15
84 Saint Mary’s Univ. of Minnesota (MN) 60% 84 53% 39 30% 34% 275 34% 35% 210 44300 44616 184 16891 218 91% 61 85% 33
85 Webster University (MO) 62% 70 56% 50 35% 32% 138 33% 31% 166 41250 41327 171 19086 284 88% 131 83% 58
86 Goshen College (IN) 71% 4 60% 20 31% 33% 230 27% 31% 282 37150 39819 270 16192 195 91% 54 90% 169
87 DePauw University (IN) 79% 89 80% 206 19% 22% 261 20% 20% 199 47950 44032 25 16932 188 96% 115 95% 154
88 Maryville University of Saint Louis (MO) 68% 165 51% 3 33% 29% 78 35% 30% 86 46400 46969 194 21604 341 86% 271 84% 85
89 University of Michigan–Ann Arbor (MI)* 91% 25 90% 146 16% 18% 244 18% 19% 245 58400 59353 214 8869 30 93% 92 96% 321
90 Gustavus Adolphus College (MN) 82% 69 78% 68 25% 20% 84 16% 18% 256 50200 49201 127 17042 193 96% 112 98% 268
91 Illinois College (IL) 67% 209 58% 23 35% 43% 323 37% 33% 95 38050 39486 232 13933 81 91% 225 85% 32
92 John Carroll University (OH) 74% 133 69% 54 27% 25% 154 22% 23% 214 51450 48956 54 17795 232 94% 166 94% 207
93 Univ. of Wisconsin–Oshkosh (WI)* 53% 169 54% 215 27% 36% 315 38% 37% 176 41700 40618 117 11887 64 92% 47 89% 91
94 Grace University (NE) 47% 142 48% 210 48% 40% 61 32% 34% 255 32550 37394 329 11999 45 89% 89 82% 45
95 Blackburn College (IL) 43% 192 49% 293 52% 41% 44 40% 36% 113 38100 36286 92 11900 44 76% 273 83% 335
96 Lake Forest College (IL) 69% 182 70% 203 33% 27% 73 27% 22% 92 49200 47245 82 18451 256 92% 202 89% 104
97 Wayne State College (NE)* 49% 214 53% 251 39% 39% 190 35% 37% 259 37100 36437 138 9704 22 86% 173 85% 172
98 Ashland University (OH) 57% 252 49% 16 30% 36% 312 39% 34% 108 40450 38737 96 19574 316 90% 188 82% 5
99 Trinity Christian College (IL) 57% 57 55% 142 35% 32% 141 37% 33% 101 41000 40778 155 19259 312 91% 63 85% 64
100 University of Wisconsin–Madison (WI)* 83% 53 81% 123 15% 19% 271 19% 22% 280 51750 52829 219 12499 109 96% 29 94% 103
best bANG FOR the bUCk MIDWest COLLeGes
6-year graduation rate
Predicted grad rate based on % of Pell re
cipients,
incoming SATs, etc.
Graduation rate rank
Grad rate performance rank
Students receiving Pell G
rants
Predicted % Pell based on ACT/S
AT and admit rates
Pell performance rank
First-gen stu
dents
Predicted % first-
gen based on ACT/SAT and admit rates
First-gen performance rank
Median earnings 10 years a
fter entering college
Predicted median earnings
Earnings performance rank
Net price of attendance for families below $75,0
00 income
Net price rank
% repaying $1 in loan principal 5 years a
fter leaving coll.
Repayment rank
Predicted repayment ra
te
Repay. rate perf. r
ank

42 September/October 2016
1 Harvard University (MA) 97% 12 87% 18 11% 11% 105 21% 12% 17 82000 69361 9 4347 9 93% 124 92% 159
2 Amherst College (MA) 95% 33 91% 126 21% 9% 11 21% 9% 4 59650 53657 49 6253 3 n/a 231 88% 50
3 Maine Maritime Academy (ME)* 72% 6 52% 3 30% 38% 246 24% 35% 367 78300 50537 1 18422 231 94% 36 90% 85
4 MA Institute of Technology (MA) 92% 29 97% 345 19% 11% 22 18% 12% 38 91800 78652 6 6867 25 98% 13 97% 132
5 Williams College (MA) 96% 28 93% 176 19% 8% 16 18% 9% 16 58150 52820 58 8158 11 n/a 164 93% 100
6 Rutgers University-Camden (NJ)* 57% 173 52% 109 45% 40% 50 32% 37% 235 55650 45744 13 10192 44 90% 74 82% 4
7 Saint Joseph’s College–New York (NY) 69% 59 51% 6 32% 36% 182 41% 36% 40 54900 47113 27 11383 61 88% 158 83% 40
8 CUNY Bernard M. Baruch College (NY)* 65% 103 56% 53 45% 27% 7 48% 23% 1 55250 59884 353 5824 10 90% 101 85% 47
9 Massachusetts Maritime Academy (MA)* 66% 86 66% 242 19% 33% 343 20% 33% 371 78750 62189 2 9091 31 91% 63 89% 129
10 University of Pennsylvania (PA) 96% 20 94% 193 14% 14% 93 18% 14% 63 76950 67556 24 9622 54 96% 34 95% 112
11 CUNY John Jay Col. of Crim. Just. (NY)* 43% 309 33% 41 55% 52% 63 48% 42% 42 46100 39993 40 4611 5 78% 339 74% 46
12 Princeton University (NJ) 97% 17 98% 281 12% 11% 78 18% 12% 33 74750 70124 83 6419 22 n/a 15 96% 95
13 St. Francis College (NY) 53% 138 41% 32 43% 50% 221 38% 41% 194 51300 38031 7 11682 53 78% 293 75% 110
14 University of Baltimore (MD)* 43% 313 33% 46 44% 47% 138 44% 42% 99 57250 44279 5 15510 162 77% 352 67% 2
15 Colgate University (NY) 91% 53 93% 294 11% 13% 130 15% 12% 64 61650 53223 28 11063 34 97% 88 95% 107
16 CUNY Brooklyn College (NY)* 52% 236 44% 60 49% 39% 21 43% 32% 12 45800 45371 208 5184 8 80% 315 77% 66
17 Yale University (CT) 97% 15 97% 235 13% 11% 68 20% 12% 22 66500 64572 153 7458 29 96% 33 94% 64
18 CUNY College of Staten Island (NY)* 48% 267 33% 14 45% 37% 34 50% 39% 13 43050 42799 217 7015 18 78% 350 75% 90
19 Haverford College (PA) 94% 40 92% 184 15% 10% 45 17% 10% 24 53700 53735 229 9147 19 n/a 171 93% 106
20 Cedar Crest College (PA) 63% 35 44% 7 43% 49% 195 49% 39% 15 44050 39099 79 15934 174 86% 152 84% 117
21 Bentley University (MA) 87% 2 73% 23 16% 25% 261 19% 24% 232 73100 63608 15 20076 247 97% 4 97% 188
22 Columbia Univ. in the City of NY (NY) 94% 24 91% 127 21% 15% 24 20% 15% 39 70400 69379 191 7992 35 92% 148 93% 268
23 College of the Holy Cross (MA) 92% 45 84% 48 16% 22% 211 16% 18% 189 64050 54515 19 16556 167 97% 93 96% 138
24 Colby College (ME) 91% 51 89% 185 11% 17% 214 14% 15% 133 55400 50673 77 9568 21 97% 114 96% 148
25 McDaniel College (MD) 71% 222 62% 45 32% 32% 108 31% 26% 47 47250 44039 113 14994 112 95% 172 86% 3
26 Rutgers University–Newark (NJ)* 65% 250 53% 12 48% 41% 23 32% 37% 254 55650 54672 193 9875 58 90% 216 86% 21
27 Bowdoin College (ME) 94% 37 94% 233 14% 12% 65 16% 11% 41 53600 55374 273 8541 14 97% 102 94% 74
28 SUNY Maritime College (NY)* 47% 280 60% 376 24% 34% 281 24% 32% 321 78250 63467 3 13941 113 92% 48 86% 25
29 Hamilton College (NY) 92% 48 91% 225 14% 13% 89 14% 12% 95 56500 53723 130 10171 24 95% 151 96% 232
30 Manhattan College (NY) 74% 25 65% 50 28% 31% 152 26% 31% 249 63650 55176 22 21904 291 94% 28 91% 67
31 CUNY Queens College (NY)* 56% 184 51% 134 38% 37% 86 45% 31% 3 48800 50476 276 4890 6 86% 212 86% 205
32 Lafayette College (PA) 90% 60 87% 161 11% 21% 305 13% 18% 256 68050 57307 14 15206 120 96% 135 96% 197
33 Cooper Un. Advance. of Sci. & Art (NY) 82% 1 79% 168 19% 12% 40 20% 16% 53 54250 53874 212 12154 60 88% 98 98% 373
34 Penn State–Schuylkill (PA)* 42% 259 37% 125 54% 57% 149 32% 45% 381 47350 38260 30 14696 128 89% 77 80% 10
35 La Salle University (PA) 66% 83 53% 20 36% 41% 178 37% 39% 190 53550 46577 33 21937 293 91% 68 85% 24
36 Dartmouth College (NH) 95% 22 93% 172 14% 14% 91 12% 14% 177 64750 64395 213 9021 46 97% 25 96% 147
37 Fairfield University (CT) 81% 9 72% 56 15% 24% 265 19% 26% 310 67650 54233 4 27432 367 97% 3 96% 176
38 SUNY–Binghamton (NY)* 80% 121 81% 259 28% 21% 26 24% 22% 88 59500 55438 95 12887 118 93% 110 93% 178
39 CUNY City College (NY)* 43% 316 46% 308 52% 37% 9 43% 31% 9 45750 46739 259 5111 7 79% 330 79% 200
40 Vassar College (NY) 92% 46 92% 231 22% 11% 13 13% 11% 77 48250 52829 342 8791 16 96% 131 96% 198
41 SUNY College at Brockport (NY)* 67% 72 59% 64 41% 38% 72 30% 34% 219 41400 41198 219 11592 65 90% 107 87% 93
42 Georgian Court University (NJ) 49% 258 44% 122 43% 50% 222 46% 45% 110 47200 39250 26 15713 165 87% 203 83% 56
43 CUNY Lehman College (NY)* 36% 346 33% 171 54% 49% 53 48% 39% 18 43250 46365 313 3190 2 78% 340 72% 16
44 College of New Jersey (NJ)* 86% 4 80% 94 18% 23% 192 22% 23% 130 57850 55818 144 13447 96 95% 11 98% 307
45 Lehigh University (PA) 87% 58 84% 139 15% 23% 309 17% 23% 284 75250 64869 16 17428 219 98% 10 96% 99
46 Penn State–Worthington Scranton (PA)* 47% 192 42% 112 48% 49% 122 32% 41% 335 47350 41965 70 11921 57 89% 77 88% 162
47 Houghton College (NY) 72% 211 61% 29 39% 27% 12 24% 24% 123 39550 36369 114 18496 210 93% 218 92% 144
48 New Jersey Institute of Technology (NJ)* 57% 305 52% 99 39% 31% 19 36% 30% 30 66150 65725 211 13978 148 91% 183 87% 14
49 College of the Atlantic (ME) 68% 247 65% 145 34% 24% 17 n/a 21% 68 28550 22947 55 16245 156 n/a 298 89% 272
50 Holy Family University (PA) 57% 174 44% 24 36% 48% 323 50% 44% 37 49600 45982 92 14337 126 86% 208 82% 51
best bANG FOR the bUCk NORtheAst COLLeGes*Public institution
°For-profit institution
6-year graduation rate
Predicted grad rate based on % of Pell re
cipients,
incoming SATs, etc.
Graduation rate rank
Grad rate performance rank
Students receiving Pell G
rants
Predicted % Pell based on ACT/S
AT and admit rates
Pell performance rank
First-gen stu
dents
Predicted % first-
gen based on ACT/SAT and admit rates
First-gen performance rank
Median earnings 10 years a
fter entering college
Predicted median earnings
Earnings performance rank
Net price of attendance for families below $75,0
00 income
Net price rank
% repaying $1 in loan principal 5 years a
fter leaving coll.
Repayment rank
Predicted repayment ra
te
Repay. rate perf. r
ank
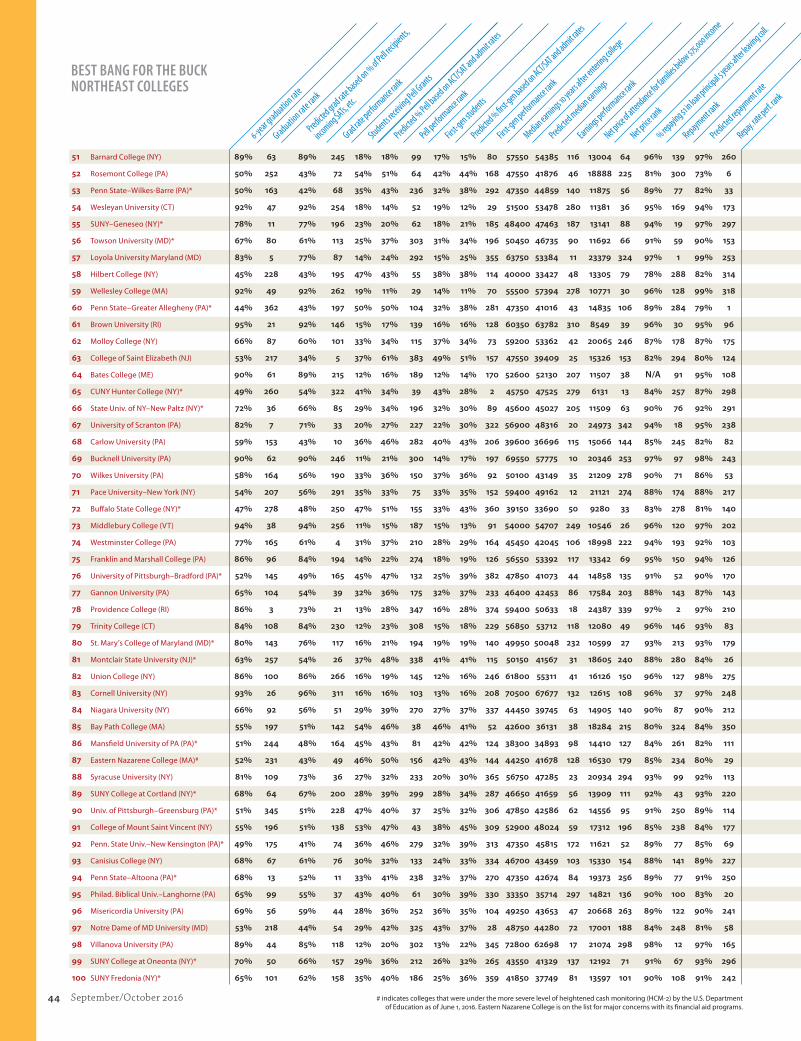
44 September/October 2016
51 Barnard College (NY) 89% 63 89% 245 18% 18% 99 17% 15% 80 57550 54385 116 13004 64 96% 139 97% 260
52 Rosemont College (PA) 50% 252 43% 72 54% 51% 64 42% 44% 168 47550 41876 46 18888 225 81% 300 73% 6
53 Penn State–Wilkes-Barre (PA)* 50% 163 42% 68 35% 43% 236 32% 38% 292 47350 44859 140 11875 56 89% 77 82% 33
54 Wesleyan University (CT) 92% 47 92% 254 18% 14% 52 19% 12% 29 51500 53478 280 11381 36 95% 169 94% 173
55 SUNY–Geneseo (NY)* 78% 11 77% 196 23% 20% 62 18% 21% 185 48400 47463 187 13141 88 94% 19 97% 297
56 Towson University (MD)* 67% 80 61% 113 25% 37% 303 31% 34% 196 50450 46735 90 11692 66 91% 59 90% 153
57 Loyola University Maryland (MD) 83% 5 77% 87 14% 24% 292 15% 25% 355 63750 53384 11 23379 324 97% 1 99% 253
58 Hilbert College (NY) 45% 228 43% 195 47% 43% 55 38% 38% 114 40000 33427 48 13305 79 78% 288 82% 314
59 Wellesley College (MA) 92% 49 92% 262 19% 11% 29 14% 11% 70 55500 57394 278 10771 30 96% 128 99% 318
60 Penn State–Greater Allegheny (PA)* 44% 362 43% 197 50% 50% 104 32% 38% 281 47350 41016 43 14835 106 89% 284 79% 1
61 Brown University (RI) 95% 21 92% 146 15% 17% 139 16% 16% 128 60350 63782 310 8549 39 96% 30 95% 96
62 Molloy College (NY) 66% 87 60% 101 33% 34% 115 37% 34% 73 59200 53362 42 20065 246 87% 178 87% 175
63 College of Saint Elizabeth (NJ) 53% 217 34% 5 37% 61% 383 49% 51% 157 47550 39409 25 15326 153 82% 294 80% 124
64 Bates College (ME) 90% 61 89% 215 12% 16% 189 12% 14% 170 52600 52130 207 11507 38 n/a 91 95% 108
65 CUNY Hunter College (NY)* 49% 260 54% 322 41% 34% 39 43% 28% 2 45750 47525 279 6131 13 84% 257 87% 298
66 State Univ. of NY–New Paltz (NY)* 72% 36 66% 85 29% 34% 196 32% 30% 89 45600 45027 205 11509 63 90% 76 92% 291
67 University of Scranton (PA) 82% 7 71% 33 20% 27% 227 22% 30% 322 56900 48316 20 24973 342 94% 18 95% 238
68 Carlow University (PA) 59% 153 43% 10 36% 46% 282 40% 43% 206 39600 36696 115 15066 144 85% 245 82% 82
69 Bucknell University (PA) 90% 62 90% 246 11% 21% 300 14% 17% 197 69550 57775 10 20346 253 97% 97 98% 243
70 Wilkes University (PA) 58% 164 56% 190 33% 36% 150 37% 36% 92 50100 43149 35 21209 278 90% 71 86% 53
71 Pace University–New York (NY) 54% 207 56% 291 35% 33% 75 33% 35% 152 59400 49162 12 21121 274 88% 174 88% 217
72 Buffalo State College (NY)* 47% 278 48% 250 47% 51% 155 33% 43% 360 39150 33690 50 9280 33 83% 278 81% 140
73 Middlebury College (VT) 94% 38 94% 256 11% 15% 187 15% 13% 91 54000 54707 249 10546 26 96% 120 97% 202
74 Westminster College (PA) 77% 165 61% 4 31% 37% 210 28% 29% 164 45450 42045 106 18998 222 94% 193 92% 103
75 Franklin and Marshall College (PA) 86% 96 84% 194 14% 22% 274 18% 19% 126 56550 53392 117 13342 69 95% 150 94% 126
76 University of Pittsburgh–Bradford (PA)* 52% 145 49% 165 45% 47% 132 25% 39% 382 47850 41073 44 14858 135 91% 52 90% 170
77 Gannon University (PA) 65% 104 54% 39 32% 36% 175 32% 37% 233 46400 42453 86 17584 203 88% 143 87% 143
78 Providence College (RI) 86% 3 73% 21 13% 28% 347 16% 28% 374 59400 50633 18 24387 339 97% 2 97% 210
79 Trinity College (CT) 84% 108 84% 230 12% 23% 308 15% 18% 229 56850 53712 118 12080 49 96% 146 93% 83
80 St. Mary’s College of Maryland (MD)* 80% 143 76% 117 16% 21% 194 19% 19% 140 49950 50048 232 10599 27 93% 213 93% 179
81 Montclair State University (NJ)* 63% 257 54% 26 37% 48% 338 41% 41% 115 50150 41567 31 18605 240 88% 280 84% 26
82 Union College (NY) 86% 100 86% 266 16% 19% 145 12% 16% 246 61800 55311 41 16126 150 96% 127 98% 275
83 Cornell University (NY) 93% 26 96% 311 16% 16% 103 13% 16% 208 70500 67677 132 12615 108 96% 37 97% 248
84 Niagara University (NY) 66% 92 56% 51 29% 39% 270 27% 37% 337 44450 39745 63 14905 140 90% 87 90% 212
85 Bay Path College (MA) 55% 197 51% 142 54% 46% 38 46% 41% 52 42600 36131 38 18284 215 80% 324 84% 350
86 Mansfield University of PA (PA)* 51% 244 48% 164 45% 43% 81 42% 42% 124 38300 34893 98 14410 127 84% 261 82% 111
87 Eastern Nazarene College (MA)# 52% 231 43% 49 46% 50% 156 42% 43% 144 44250 41678 128 16530 179 85% 234 80% 29
88 Syracuse University (NY) 81% 109 73% 36 27% 32% 233 20% 30% 365 56750 47285 23 20934 294 93% 99 92% 113
89 SUNY College at Cortland (NY)* 68% 64 67% 200 28% 39% 299 28% 34% 287 46650 41659 56 13909 111 92% 43 93% 220
90 Univ. of Pittsburgh–Greensburg (PA)* 51% 345 51% 228 47% 40% 37 25% 32% 306 47850 42586 62 14556 95 91% 250 89% 114
91 College of Mount Saint Vincent (NY) 55% 196 51% 138 53% 47% 43 38% 45% 309 52900 48024 59 17312 196 85% 238 84% 177
92 Penn. State Univ.–New Kensington (PA)* 49% 175 41% 74 36% 46% 279 32% 39% 313 47350 45815 172 11621 52 89% 77 85% 69
93 Canisius College (NY) 68% 67 61% 76 30% 32% 133 24% 33% 334 46700 43459 103 15330 154 88% 141 89% 227
94 Penn State–Altoona (PA)* 68% 13 52% 11 33% 41% 238 32% 37% 270 47350 42674 84 19373 256 89% 77 91% 250
95 Philad. Biblical Univ.–Langhorne (PA) 65% 99 55% 37 43% 40% 61 30% 39% 330 33350 35714 297 14821 136 90% 100 83% 20
96 Misericordia University (PA) 69% 56 59% 44 28% 36% 252 36% 35% 104 49250 43653 47 20668 263 89% 122 90% 241
97 Notre Dame of MD University (MD) 53% 218 44% 54 29% 42% 325 43% 37% 28 48750 44280 72 17001 188 84% 248 81% 58
98 Villanova University (PA) 89% 44 85% 118 12% 20% 302 13% 22% 345 72800 62698 17 21074 298 98% 12 97% 165
99 SUNY College at Oneonta (NY)* 70% 50 66% 157 29% 36% 212 26% 32% 265 43550 41329 137 12192 71 91% 67 93% 296
100 SUNY Fredonia (NY)* 65% 101 62% 158 35% 40% 186 25% 36% 359 41850 37749 81 13597 101 90% 108 91% 242
best bANG FOR the bUCk NORtheAst COLLeGes
6-year graduation rate
Predicted grad rate based on % of Pell re
cipients,
incoming SATs, etc.
Graduation rate rank
Grad rate performance rank
Students receiving Pell G
rants
Predicted % Pell based on ACT/S
AT and admit rates
Pell performance rank
First-gen stu
dents
Predicted % first-
gen based on ACT/SAT and admit rates
First-gen performance rank
Median earnings 10 years a
fter entering college
Predicted median earnings
Earnings performance rank
Net price of attendance for families below $75,0
00 income
Net price rank
% repaying $1 in loan principal 5 years a
fter leaving coll.
Repayment rank
Predicted repayment ra
te
Repay. rate perf. r
ank
# indicates colleges that were under the more severe level of heightened cash monitoring (HCM-2) by the U.S. Department of Education as of June 1, 2016. Eastern Nazarene College is on the list for major concerns with its financial aid programs.

46 September/October 2016
1 Berea College (KY) 63% 66 48% 2 85% 38% 1 44% 28% 4 34350 27472 3 2896 1 86% 77 74% 2
2 William Carey University (MS) 59% 19 45% 3 69% 37% 2 40% 32% 50 34950 30803 9 16827 141 75% 115 71% 20
3 John Brown University (AR) 65% 9 54% 6 32% 27% 91 34% 28% 70 46100 41817 8 15386 121 93% 3 86% 6
4 LeTourneau University (TX) 55% 33 54% 53 41% 29% 34 38% 26% 18 53750 45426 2 17725 156 84% 43 80% 19
5 Blue Mountain College (MS) 47% 32 46% 59 57% 43% 30 41% 36% 83 32100 28790 21 8881 15 79% 49 79% 60
6 Texas A&M Univ.–College Station (TX)* 79% 12 70% 5 22% 26% 178 30% 28% 116 53800 52218 47 7202 28 93% 11 90% 15
7 Tougaloo College (MS) 51% 119 35% 1 88% 65% 6 35% 45% 195 30450 26892 13 10883 40 55% 187 50% 10
8 Texas A&M International Univ. (TX)* 42% 92 33% 7 58% 54% 106 49% 45% 97 45800 44060 40 3739 3 77% 100 76% 57
9 Texas Woman’s University (TX)* 44% 142 43% 51 48% 45% 101 43% 41% 129 45000 33901 1 7698 39 79% 132 77% 40
10 Louisiana College (LA) 43% 90 44% 86 47% 42% 88 40% 39% 141 39850 36960 17 11599 74 87% 22 76% 3
11 Univ. of Science & Arts of Okla. (OK)* 42% 168 40% 35 45% 42% 112 46% 32% 9 32650 29639 23 5380 2 73% 152 73% 66
12 Williams Baptist College (AR) 41% 59 44% 99 51% 42% 61 49% 36% 16 31800 29261 32 11134 60 79% 51 78% 49
13 Brescia University (KY) 34% 101 47% 186 51% 45% 80 49% 36% 12 37950 34558 18 10145 34 83% 25 78% 18
14 Arkansas Tech University (AR)* 42% 94 38% 32 45% 35% 48 51% 37% 10 35750 32464 11 9034 38 71% 131 76% 149
15 Oklahoma State University–Main (OK)* 61% 62 54% 10 29% 28% 125 30% 29% 137 43550 40162 16 11752 90 88% 54 84% 13
16 University of Oklahoma–Norman (OK)* 66% 47 60% 12 25% 23% 124 31% 27% 93 46500 40593 6 14394 125 86% 69 86% 51
17 University of Tennessee–Martin (TN)* 47% 61 45% 39 47% 35% 33 48% 35% 13 35000 34451 70 6729 9 71% 138 76% 158
18 Lyon College (AR) 49% 131 56% 170 47% 29% 14 38% 24% 6 37900 39756 125 11374 52 88% 67 82% 8
19 Tennessee Technological Univ. (TN)* 51% 112 52% 97 37% 29% 43 43% 32% 17 38400 36695 46 11054 85 86% 74 83% 16
20 Southeastern OK State Univ. (OK)* 30% 162 22% 15 49% 42% 70 51% 40% 26 35600 34823 65 7610 20 73% 124 73% 67
21 East Central University (OK)* 34% 139 29% 26 48% 36% 35 51% 39% 20 35550 33636 37 6935 10 69% 149 76% 172
22 Vanderbilt University (TN) 93% 2 95% 104 14% 13% 129 13% 14% 154 61800 61847 85 7394 31 94% 8 95% 112
23 Tusculum College (TN) 33% 145 42% 175 60% 40% 15 53% 39% 8 41250 35648 4 17069 146 75% 113 73% 39
24 Murray State University (KY)* 53% 39 48% 24 35% 35% 135 41% 36% 76 36350 37028 102 8443 26 83% 56 83% 71
25 Trinity University (TX) 81% 1 75% 22 15% 17% 149 18% 20% 160 54400 52732 42 17551 152 95% 1 97% 89
26 Sam Houston State University (TX)* 51% 111 47% 25 42% 44% 160 43% 39% 99 42250 36675 7 10710 78 80% 121 79% 36
27 Henderson State University (AR)* 33% 140 41% 163 54% 42% 42 46% 39% 56 36250 30883 5 8825 32 69% 144 73% 138
28 Southern Nazarene University (OK) 44% 79 45% 78 51% 45% 74 38% 41% 168 45350 42127 14 15685 129 85% 34 79% 9
29 Christian Brothers University (TN) 57% 26 55% 40 44% 35% 58 37% 31% 71 47700 47817 87 7029 12 71% 136 78% 170
30 Centenary College of Louisiana (LA) 56% 105 63% 171 35% 28% 66 30% 23% 61 41750 39260 31 16398 126 92% 30 84% 4
31 Rice University (TX) 92% 3 95% 111 17% 13% 81 16% 14% 121 62350 67176 174 8258 51 96% 2 96% 69
32 University of Texas–Tyler (TX)* 43% 84 47% 115 37% 32% 90 41% 34% 57 42900 40894 35 9368 44 80% 79 82% 103
33 So. Arkansas Univ.–Campus (AR)* 32% 148 37% 124 52% 43% 55 49% 39% 38 35750 32956 22 8063 22 69% 150 70% 92
34 Oklahoma Baptist University (OK) 52% 16 50% 42 34% 30% 99 29% 29% 147 35300 34398 66 14309 107 87% 13 89% 81
35 University of Texas–El Paso (TX)* 39% 169 35% 28 60% 44% 10 44% 42% 123 41250 41156 81 6151 18 77% 151 80% 152
36 Mississippi Univ. for Women (MS)* 40% 106 44% 114 51% 43% 63 43% 39% 94 35600 34279 51 9416 45 76% 108 75% 53
37 Tennessee Wesleyan College (TN) 44% 44 48% 108 48% 41% 79 46% 36% 29 37150 37586 93 11117 59 79% 58 83% 123
38 Texas Lutheran University (TX) 47% 31 50% 101 40% 45% 170 41% 37% 87 43750 40574 24 15684 130 84% 21 78% 12
39 Georgetown College (KY) 57% 100 61% 126 34% 29% 83 30% 25% 74 43550 40730 28 15706 113 90% 44 87% 26
40 Asbury University (KY) 69% 4 61% 14 35% 29% 75 24% 29% 179 36050 36041 84 20977 187 93% 5 89% 21
41 Austin Peay State University (TN)* 36% 120 36% 68 53% 36% 21 46% 38% 48 35550 34465 55 10124 62 67% 153 72% 136
42 Transylvania University (KY) 72% 36 72% 65 27% 15% 31 21% 16% 88 41800 43933 130 16884 133 95% 14 93% 34
43 Milligan College (TN) 57% 27 56% 63 36% 31% 98 34% 31% 109 37800 39686 129 13951 103 90% 9 86% 22
44 Campbellsville University (KY) 41% 98 37% 27 42% 42% 140 48% 39% 42 32200 31696 73 12985 89 80% 81 77% 29
45 Dillard University (LA) 38% 179 41% 119 76% 62% 25 43% 43% 144 34950 33019 38 15346 109 65% 166 52% 1
46 Saint Edward’s University (TX) 68% 6 59% 8 34% 30% 97 34% 31% 104 45850 46946 113 16400 136 85% 35 88% 126
47 Belhaven University (MS) 45% 75 42% 43 54% 40% 29 38% 36% 113 39500 38750 67 20146 182 77% 105 69% 5
48 Central Baptist College (AR) 36% 80 36% 61 45% 48% 162 47% 38% 44 35400 35529 86 10892 54 73% 88 71% 44
49 Northeastern State University (OK)* 30% 160 27% 33 50% 40% 50 44% 39% 81 36000 35464 71 6461 8 69% 145 76% 173
50 Western Kentucky University (KY)* 50% 56 46% 30 39% 34% 92 43% 37% 62 35450 36352 105 11215 72 77% 97 80% 119
best bANG FOR the bUCk sOUtheRN COLLeGes*Public institution
°For-profit institution
6-year graduation rate
Predicted grad rate based on % of Pell re
cipients,
incoming SATs, etc.
Graduation rate rank
Grad rate performance rank
Students receiving Pell G
rants
Predicted % Pell based on ACT/S
AT and admit rates
Pell performance rank
First-gen stu
dents
Predicted % first-
gen based on ACT/SAT and admit rates
First-gen performance rank
Median earnings 10 years a
fter entering college
Predicted median earnings
Earnings performance rank
Net price of attendance for families below $75,0
00 income
Net price rank
% repaying $1 in loan principal 5 years a
fter leaving coll.
Repayment rank
Predicted repayment ra
te
Repay. rate perf. r
ank

48 September/October 2016
51 Nicholls State University (LA)* 41% 102 39% 47 39% 36% 115 51% 38% 11 36450 40295 168 8376 25 75% 110 74% 50
52 LA State Univ./Agri. & Mech. Coll. (LA)* 66% 49 71% 159 20% 24% 180 29% 27% 127 46300 45405 64 8414 53 89% 37 88% 42
53 King College (TN) 52% 46 49% 44 45% 37% 62 54% 35% 2 37550 43399 188 15356 120 84% 41 80% 23
54 Centre College (KY) 84% 10 82% 50 16% 12% 96 16% 14% 118 46250 47413 111 17580 145 95% 15 95% 68
55 Our Lady of Holy Cross College (LA) 27% 137 31% 112 49% 58% 192 50% 45% 77 41250 38096 26 12029 71 79% 50 75% 25
56 Texas State Univ.–San Marcos (TX)* 56% 87 54% 46 36% 40% 179 38% 37% 134 44350 43159 56 10893 82 86% 71 84% 32
57 St. Mary’s University (TX) 58% 24 55% 34 52% 39% 36 45% 36% 41 47500 52003 175 16649 139 84% 42 83% 55
58 Southwestern University (TX) 73% 34 69% 29 27% 29% 155 24% 24% 143 47700 46848 63 19493 171 95% 19 89% 11
59 Northwestern OK State Univ. (OK)* 32% 149 33% 84 41% 47% 181 47% 42% 85 36200 35322 59 5793 5 75% 109 78% 106
60 University of Texas–Austin (TX)* 80% 11 80% 73 27% 24% 95 28% 24% 91 52450 56193 160 12276 100 92% 17 92% 88
61 Sewanee–University of the South (TN) 79% 21 79% 83 18% 18% 131 16% 17% 155 42600 43020 95 13243 76 90% 45 94% 131
62 Union College (KY) 34% 133 39% 131 58% 40% 16 52% 39% 14 35900 33031 20 15544 124 66% 158 72% 161
63 Tennessee State University (TN)* 35% 176 30% 18 67% 56% 26 42% 46% 180 36600 34314 36 9053 65 60% 189 60% 48
64 Maryville College (TN) 55% 108 56% 93 43% 35% 60 38% 28% 30 37350 39545 133 13798 86 84% 90 84% 74
65 Lee University (TN) 52% 43 53% 75 38% 25% 39 37% 30% 59 33250 35696 140 12689 88 78% 91 83% 147
66 AR State Univ.–Main (AR)* 37% 117 45% 165 46% 31% 27 48% 32% 5 33000 35217 136 9430 47 72% 130 76% 146
67 University of North Texas (TX)* 49% 115 55% 155 36% 34% 118 37% 33% 90 42950 43196 90 6380 21 81% 117 82% 94
68 University of Phoenix–Louisiana (LA)° 15% 193 15% 60 70% 46% 7 n/a 43% 28 n/a 27302 10 16969 144 n/a 176 58% 86
69 University of St. Thomas (TX) 50% 54 52% 90 34% 29% 84 40% 31% 43 48600 48563 83 18447 162 85% 33 85% 70
70 Bryan College–Dayton (TN) 54% 35 48% 19 35% 39% 167 40% 34% 72 34400 39007 178 13364 96 86% 27 83% 28
71 Southwestern Christian University (OK) 35% 89 29% 21 64% 45% 17 50% 39% 27 28700 33467 170 18618 174 66% 120 61% 17
72 Xavier University of Louisiana (LA) 45% 74 53% 164 58% 37% 11 34% 35% 157 47650 46344 52 19805 179 73% 125 68% 14
73 University of Central Arkansas (AR)* 41% 99 48% 153 40% 30% 54 39% 34% 79 38000 38612 100 9583 50 75% 118 79% 145
74 Oklahoma Wesleyan University (OK) 46% 69 41% 23 40% 44% 164 45% 39% 68 43650 42087 44 19383 173 82% 61 80% 41
75 Sul Ross State University (TX)* 26% 175 30% 123 61% 51% 51 53% 47% 73 37700 36330 48 9981 57 69% 143 73% 128
76 Mississippi College (MS) 56% 29 57% 71 37% 32% 89 30% 31% 148 38650 41096 139 13965 104 83% 59 83% 64
77 University of Arkansas–Pine Bluff (AR)* 27% 138 31% 116 72% 65% 72 43% 46% 164 28200 26885 54 8100 6 46% 173 48% 95
78 Midwestern State University (TX)* 43% 85 44% 88 38% 42% 169 40% 39% 136 39150 39749 99 8117 23 79% 85 81% 113
79 McNeese State University (LA)* 39% 109 41% 96 36% 38% 150 46% 37% 36 37250 38064 104 7509 17 73% 127 77% 133
80 Austin College (TX) 75% 28 69% 17 29% 26% 109 23% 21% 130 49050 51344 134 18478 159 92% 32 91% 62
81 Freed-Hardeman University (TN) 52% 42 58% 143 35% 28% 67 27% 30% 167 36750 36870 88 16057 132 87% 20 86% 58
82 University of the Ozarks (AR) 48% 30 50% 92 40% 33% 77 40% 33% 58 33000 39492 184 14344 108 82% 28 79% 33
83 Alcorn State University (MS)* 35% 124 28% 16 80% 54% 4 39% 48% 193 30900 28816 34 13874 101 48% 191 52% 134
84 Texas A&M University–Commerce (TX)* 44% 141 39% 13 50% 52% 157 47% 43% 101 38500 35533 27 8977 64 72% 165 76% 165
85 Tarleton State University (TX)* 42% 93 47% 128 44% 47% 158 43% 41% 128 41000 38870 33 13520 99 82% 64 83% 85
86 University of Phoenix–Oklahoma (OK)° 13% 196 13% 58 68% 46% 9 n/a 43% 21 n/a 26719 12 16719 140 n/a 182 57% 104
87 Middle Tennessee State University (TN)* 46% 130 49% 125 45% 40% 78 40% 37% 102 36450 35872 74 8474 55 77% 148 79% 125
88 Northwestern State Univ. of LA (LA)* 38% 116 38% 72 40% 36% 103 47% 37% 33 35150 36410 114 8749 29 67% 154 73% 155
89 Bellarmine University (KY) 65% 8 65% 64 23% 23% 138 29% 28% 139 45200 46177 107 20814 186 93% 4 91% 47
90 University of Texas–Arlington (TX)* 41% 159 46% 148 40% 39% 126 44% 36% 45 47550 46883 69 11936 93 81% 112 80% 31
91 University of Central Oklahoma (OK)* 35% 125 39% 109 35% 37% 145 40% 38% 119 38700 37702 57 10142 63 78% 93 80% 114
92 West Texas A&M University (TX)* 42% 97 48% 144 38% 41% 159 42% 39% 103 40700 40452 79 9501 49 80% 80 83% 124
93 Alice Lloyd College (KY) 40% 172 44% 136 57% 50% 68 52% 36% 3 32750 34456 122 10802 36 75% 140 79% 144
94 Texas Tech University (TX)* 60% 67 63% 121 29% 34% 183 33% 32% 138 46650 45712 61 12083 95 88% 48 87% 52
95 University of Texas at Dallas (TX)* 66% 48 70% 139 36% 21% 13 34% 23% 25 50500 59490 195 9447 67 87% 65 90% 141
96 Kentucky Wesleyan College (KY) 38% 72 48% 179 49% 44% 93 41% 36% 78 37150 36219 62 15133 117 78% 62 80% 96
97 Wayland Baptist University (TX) 34% 135 31% 36 32% 41% 191 47% 42% 89 42650 41359 53 13444 97 75% 116 72% 35
98 Eastern Kentucky University (KY)* 39% 107 48% 176 43% 39% 100 44% 37% 60 34000 34372 94 9417 46 77% 103 82% 156
99 University of Phoenix–Tennesee (TN)° 16% 191 15% 55 72% 46% 5 n/a 44% 19 n/a 27779 49 17605 154 n/a 183 58% 116
100 East Texas Baptist University (TX) 34% 96 40% 137 47% 51% 166 42% 40% 126 37150 34241 29 16538 142 77% 63 76% 54
best bANG FOR the bUCk sOUtheRN COLLeGes
6-year graduation rate
Predicted grad rate based on % of Pell re
cipients,
incoming SATs, etc.
Graduation rate rank
Grad rate performance rank
Students receiving Pell G
rants
Predicted % Pell based on ACT/S
AT and admit rates
Pell performance rank
First-gen stu
dents
Predicted % first-
gen based on ACT/SAT and admit rates
First-gen performance rank
Median earnings 10 years a
fter entering college
Predicted median earnings
Earnings performance rank
Net price of attendance for families below $75,0
00 income
Net price rank
% repaying $1 in loan principal 5 years a
fter leaving coll.
Repayment rank
Predicted repayment ra
te
Repay. rate perf. r
ank
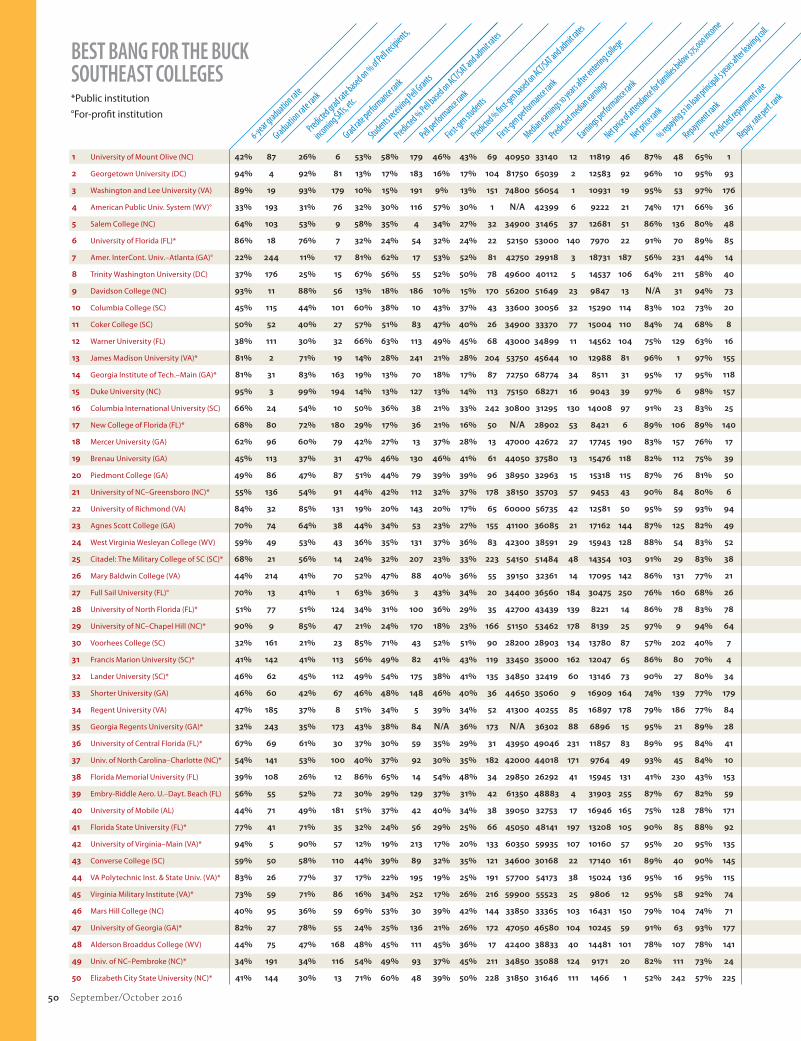
50 September/October 2016
1 University of Mount Olive (NC) 42% 87 26% 6 53% 58% 179 46% 43% 69 40950 33140 12 11819 46 87% 48 65% 1
2 Georgetown University (DC) 94% 4 92% 81 13% 17% 183 16% 17% 104 81750 65039 2 12583 92 96% 10 95% 93
3 Washington and Lee University (VA) 89% 19 93% 179 10% 15% 191 9% 13% 151 74800 56054 1 10931 19 95% 53 97% 176
4 American Public Univ. System (WV)° 33% 193 31% 76 32% 30% 116 57% 30% 1 n/a 42399 6 9222 21 74% 171 66% 36
5 Salem College (NC) 64% 103 53% 9 58% 35% 4 34% 27% 32 34900 31465 37 12681 51 86% 136 80% 48
6 University of Florida (FL)* 86% 18 76% 7 32% 24% 54 32% 24% 22 52150 53000 140 7970 22 91% 70 89% 85
7 Amer. InterCont. Univ.–Atlanta (GA)° 22% 244 11% 17 81% 62% 17 53% 52% 81 42750 29918 3 18731 187 56% 231 44% 14
8 Trinity Washington University (DC) 37% 176 25% 15 67% 56% 55 52% 50% 78 49600 40112 5 14537 106 64% 211 58% 40
9 Davidson College (NC) 93% 11 88% 56 13% 18% 186 10% 15% 170 56200 51649 23 9847 13 n/a 31 94% 73
10 Columbia College (SC) 45% 115 44% 101 60% 38% 10 43% 37% 43 33600 30056 32 15290 114 83% 102 73% 20
11 Coker College (SC) 50% 52 40% 27 57% 51% 83 47% 40% 26 34900 33370 77 15004 110 84% 74 68% 8
12 Warner University (FL) 38% 111 30% 32 66% 63% 113 49% 45% 68 43000 34899 11 14562 104 75% 129 63% 16
13 James Madison University (VA)* 81% 2 71% 19 14% 28% 241 21% 28% 204 53750 45644 10 12988 81 96% 1 97% 155
14 Georgia Institute of Tech.–Main (GA)* 81% 31 83% 163 19% 13% 70 18% 17% 87 72750 68774 34 8511 31 95% 17 95% 118
15 Duke University (NC) 95% 3 99% 194 14% 13% 127 13% 14% 113 75150 68271 16 9043 39 97% 6 98% 157
16 Columbia International University (SC) 66% 24 54% 10 50% 36% 38 21% 33% 242 30800 31295 130 14008 97 91% 23 83% 25
17 New College of Florida (FL)* 68% 80 72% 180 29% 17% 36 21% 16% 50 n/a 28902 53 8421 6 89% 106 89% 140
18 Mercer University (GA) 62% 96 60% 79 42% 27% 13 37% 28% 13 47000 42672 27 17745 190 83% 157 76% 17
19 Brenau University (GA) 45% 113 37% 31 47% 46% 130 46% 41% 61 44050 37580 13 15476 118 82% 112 75% 39
20 Piedmont College (GA) 49% 86 47% 87 51% 44% 79 39% 39% 96 38950 32963 15 15318 115 87% 76 81% 50
21 University of NC–Greensboro (NC)* 55% 136 54% 91 44% 42% 112 32% 37% 178 38150 35703 57 9453 43 90% 84 80% 6
22 University of Richmond (VA) 84% 32 85% 131 19% 20% 143 20% 17% 65 60000 56735 42 12581 50 95% 59 93% 94
23 Agnes Scott College (GA) 70% 74 64% 38 44% 34% 53 23% 27% 155 41100 36085 21 17162 144 87% 125 82% 49
24 West Virginia Wesleyan College (WV) 59% 49 53% 43 36% 35% 131 37% 36% 83 42300 38591 29 15943 128 88% 54 83% 52
25 Citadel: The Military College of SC (SC)* 68% 21 56% 14 24% 32% 207 23% 33% 223 54150 51484 48 14354 103 91% 29 83% 38
26 Mary Baldwin College (VA) 44% 214 41% 70 52% 47% 88 40% 36% 55 39150 32361 14 17095 142 86% 131 77% 21
27 Full Sail University (FL)° 70% 13 41% 1 63% 36% 3 43% 34% 20 34400 36560 184 30475 250 76% 160 68% 26
28 University of North Florida (FL)* 51% 77 51% 124 34% 31% 100 36% 29% 35 42700 43439 139 8221 14 86% 78 83% 78
29 University of NC–Chapel Hill (NC)* 90% 9 85% 47 21% 24% 170 18% 23% 166 51150 53462 178 8139 25 97% 9 94% 64
30 Voorhees College (SC) 32% 161 21% 23 85% 71% 43 52% 51% 90 28200 28903 134 13780 87 57% 202 40% 7
31 Francis Marion University (SC)* 41% 142 41% 113 56% 49% 82 41% 43% 119 33450 35000 162 12047 65 86% 80 70% 4
32 Lander University (SC)* 46% 62 45% 112 49% 54% 175 38% 41% 135 34850 32419 60 13146 73 90% 27 80% 34
33 Shorter University (GA) 46% 60 42% 67 46% 48% 148 46% 40% 36 44650 35060 9 16909 164 74% 139 77% 179
34 Regent University (VA) 47% 185 37% 8 51% 34% 5 39% 34% 52 41300 40255 85 16897 178 79% 186 77% 84
35 Georgia Regents University (GA)* 32% 243 35% 173 43% 38% 84 n/a 36% 173 n/a 36302 88 6896 15 95% 21 89% 28
36 University of Central Florida (FL)* 67% 69 61% 30 37% 30% 59 35% 29% 31 43950 49046 231 11857 83 89% 95 84% 41
37 Univ. of North Carolina–Charlotte (NC)* 54% 141 53% 100 40% 37% 92 30% 35% 182 42000 44018 171 9764 49 93% 45 84% 10
38 Florida Memorial University (FL) 39% 108 26% 12 86% 65% 14 54% 48% 34 29850 26292 41 15945 131 41% 230 43% 153
39 Embry-Riddle Aero. U.–Dayt. Beach (FL) 56% 55 52% 72 30% 29% 129 37% 31% 42 61350 48883 4 31903 255 87% 67 82% 59
40 University of Mobile (AL) 44% 71 49% 181 51% 37% 42 40% 34% 38 39050 32753 17 16946 165 75% 128 78% 171
41 Florida State University (FL)* 77% 41 71% 35 32% 24% 56 29% 25% 66 45050 48141 197 13208 105 90% 85 88% 92
42 University of Virginia–Main (VA)* 94% 5 90% 57 12% 19% 213 17% 20% 133 60350 59935 107 10160 57 95% 20 95% 135
43 Converse College (SC) 59% 50 58% 110 44% 39% 89 32% 35% 121 34600 30168 22 17140 161 89% 40 90% 145
44 VA Polytechnic Inst. & State Univ. (VA)* 83% 26 77% 37 17% 22% 195 19% 25% 191 57700 54173 38 15024 136 95% 16 95% 115
45 Virginia Military Institute (VA)* 73% 59 71% 86 16% 34% 252 17% 26% 216 59900 55523 25 9806 12 95% 58 92% 74
46 Mars Hill College (NC) 40% 95 36% 59 69% 53% 30 39% 42% 144 33850 33365 103 16431 150 79% 104 74% 71
47 University of Georgia (GA)* 82% 27 78% 55 24% 25% 136 21% 26% 172 47050 46580 104 10245 59 91% 63 93% 177
48 Alderson Broaddus College (WV) 44% 75 47% 168 48% 45% 111 45% 36% 17 42400 38833 40 14481 101 78% 107 78% 141
49 Univ. of NC–Pembroke (NC)* 34% 191 34% 116 54% 49% 93 37% 45% 211 34850 35088 124 9171 20 82% 111 73% 24
50 Elizabeth City State University (NC)* 41% 144 30% 13 71% 60% 48 39% 50% 228 31850 31646 111 1466 1 52% 242 57% 225
best bANG FOR the bUCk sOUtheAst COLLeGes*Public institution
°For-profit institution
6-year graduation rate
Predicted grad rate based on % of Pell re
cipients,
incoming SATs, etc.
Graduation rate rank
Grad rate performance rank
Students receiving Pell G
rants
Predicted % Pell based on ACT/S
AT and admit rates
Pell performance rank
First-gen stu
dents
Predicted % first-
gen based on ACT/SAT and admit rates
First-gen performance rank
Median earnings 10 years a
fter entering college
Predicted median earnings
Earnings performance rank
Net price of attendance for families below $75,0
00 income
Net price rank
% repaying $1 in loan principal 5 years a
fter leaving coll.
Repayment rank
Predicted repayment ra
te
Repay. rate perf. r
ank

52 September/October 2016
51 University of Mary Washington (VA)* 74% 6 65% 26 16% 28% 226 25% 30% 177 49750 48642 80 14819 108 95% 4 95% 134
52 Chowan University (NC) 25% 210 26% 134 68% 69% 142 42% 50% 209 35350 29365 19 16371 148 76% 127 58% 5
53 Saint Leo University (FL) 44% 125 38% 46 47% 43% 103 49% 42% 28 43500 42814 93 16196 135 76% 159 70% 43
54 Radford University (VA)* 59% 47 55% 66 28% 42% 236 31% 40% 214 42300 39772 49 12784 78 92% 18 88% 70
55 Averett University (VA) 35% 135 40% 175 49% 53% 165 44% 41% 73 42850 32112 7 18311 193 77% 118 74% 104
56 North Greenville University (SC) 53% 65 56% 162 39% 27% 50 30% 27% 72 32300 35055 200 16941 153 91% 26 83% 33
57 Digital Media Arts College (FL)° 39% 106 35% 69 69% 41% 2 39% 35% 62 n/a 33426 43 17375 172 50% 216 56% 216
58 Appalachian State University (NC)* 68% 20 65% 77 26% 28% 147 24% 28% 163 37600 42681 237 9330 23 94% 8 92% 100
59 Longwood University (VA)* 64% 34 57% 42 23% 39% 245 32% 39% 196 42700 38936 28 14925 111 91% 25 91% 128
60 Univ. of South Carolina–Upstate (SC)* 39% 107 41% 150 46% 51% 187 38% 41% 117 36550 35159 78 12629 63 85% 64 78% 51
61 FL Agricultural & Mechanical Univ. (FL)* 40% 218 40% 114 64% 52% 27 41% 43% 106 39300 38844 105 11227 70 64% 237 56% 9
62 Florida International University (FL)* 52% 156 50% 89 58% 37% 1 40% 33% 33 46100 53547 248 10510 61 81% 170 79% 87
63 Southern Polytechnic State Univ. (GA)* 37% 172 51% 247 41% 25% 26 33% 28% 59 52350 53069 137 10158 34 78% 146 75% 82
64 Winston-Salem State University (NC)* 44% 123 37% 39 58% 55% 99 37% 47% 221 33950 34746 142 7656 11 67% 200 64% 83
65 College of William and Mary (VA)* 90% 8 91% 130 12% 17% 205 13% 19% 192 56750 60773 213 8299 29 97% 5 96% 97
66 University of South Carolina–Aiken (SC)* 41% 91 43% 142 41% 50% 210 35% 40% 171 37450 37343 114 10709 27 87% 50 81% 66
67 University of South Florida–Main (FL)* 62% 92 59% 61 42% 32% 39 39% 30% 12 42800 48968 239 8802 33 82% 166 83% 169
68 Emmanuel College (GA) 42% 81 39% 75 50% 55% 176 38% 42% 145 32600 31046 76 11775 45 78% 109 79% 152
69 Edward Waters College (FL) 21% 234 23% 141 89% 69% 18 50% 48% 86 27850 29364 153 12239 58 50% 215 40% 35
70 Univ. of Virginia’s College–Wise (VA)* 42% 228 41% 90 39% 48% 216 43% 36% 29 36750 36666 116 8277 5 81% 167 78% 95
71 Spelman College (GA) 71% 64 63% 20 50% 48% 117 22% 35% 250 47700 38138 8 30614 256 78% 177 64% 3
72 Marshall University (WV)* 44% 119 45% 126 43% 37% 81 43% 37% 41 35550 35597 119 7221 9 72% 187 79% 239
73 Clearwater Christian College (FL) 47% 56 50% 151 50% 42% 68 25% 36% 238 35650 36653 144 16171 141 93% 14 85% 46
74 George Mason University (VA)* 67% 72 66% 106 27% 30% 181 28% 30% 127 57500 55636 69 14935 132 93% 44 90% 67
75 Stetson University (FL) 63% 36 65% 140 37% 26% 52 28% 26% 79 44450 45416 148 20089 202 90% 32 88% 105
76 Old Dominion University (VA)* 51% 163 47% 62 34% 38% 196 35% 36% 103 44200 45117 143 11280 71 85% 134 79% 19
77 Everglades University (FL) 57% 25 34% 2 63% 47% 32 47% 41% 46 41500 43022 154 26258 247 72% 148 68% 89
78 Virginia State University (VA)* 44% 122 30% 5 69% 56% 44 41% 52% 231 35950 34272 67 12566 72 53% 238 54% 150
79 Talladega College (AL) 51% 48 35% 4 75% 56% 21 45% 42% 70 28950 32922 210 11450 40 34% 243 44% 241
80 Georgia State University (GA)* 52% 152 49% 58 51% 38% 23 32% 35% 142 42250 44290 172 14282 117 79% 188 75% 62
81 Bluefield College (VA) 43% 78 38% 60 37% 52% 237 48% 42% 48 43450 39342 33 18928 200 85% 65 78% 60
82 William Peace University (NC) 37% 242 42% 195 55% 52% 97 32% 38% 199 36750 35015 71 17545 154 89% 103 74% 2
83 East Carolina University (NC)* 58% 118 59% 145 33% 38% 202 28% 35% 210 40250 39972 110 11221 69 92% 61 86% 27
84 Catawba College (NC) 52% 43 46% 48 44% 50% 190 35% 39% 153 38750 35499 47 20807 222 89% 34 83% 58
85 Flagler College–St. Augustine (FL) 62% 10 58% 63 31% 40% 209 31% 34% 139 38350 34619 36 18281 192 89% 33 93% 189
86 Lenoir-Rhyne University (NC) 51% 79 50% 105 44% 43% 119 35% 39% 160 39000 36847 56 17054 159 84% 96 82% 110
87 Clemson University (SC)* 82% 28 77% 41 18% 25% 212 18% 26% 208 49050 53346 219 11081 66 96% 12 94% 77
88 Oglethorpe University (GA) 56% 149 62% 209 41% 28% 34 25% 24% 82 45650 41212 24 17043 140 79% 172 82% 190
89 Limestone College (SC) 36% 131 38% 148 53% 49% 104 51% 39% 6 36800 36444 109 21315 225 77% 119 62% 12
90 West Virginia University (WV)* 57% 124 57% 133 27% 32% 197 35% 33% 74 44400 41133 45 8164 26 83% 152 87% 228
91 Clayton State University (GA)* 30% 215 33% 159 59% 52% 78 40% 43% 124 39300 37276 63 11434 56 67% 203 64% 76
92 Univ. of NC–Wilmington (NC)* 70% 14 67% 71 29% 28% 128 25% 27% 116 40150 44490 230 10799 44 87% 62 92% 217
93 Florida Gulf Coast University (FL)* 46% 109 51% 188 34% 38% 169 40% 36% 57 43200 44117 146 11829 62 87% 69 85% 96
94 Barton College (NC) 47% 58 41% 51 51% 56% 185 40% 42% 111 37900 34289 39 19491 204 82% 86 80% 106
95 North Carolina Wesleyan College (NC) 31% 167 30% 102 66% 59% 75 49% 44% 47 39200 35154 35 18675 196 62% 190 58% 86
96 Wake Forest University (NC) 87% 16 87% 119 12% 22% 240 12% 22% 232 61600 55658 18 19658 209 98% 3 97% 116
97 West Virginia Univ. Inst. of Tech. (WV)* 21% 231 40% 252 40% 48% 203 35% 38% 136 44400 41117 46 6774 2 83% 82 82% 123
98 University of Montevallo (AL)* 45% 114 52% 198 41% 32% 67 36% 34% 76 35050 35143 120 13876 93 81% 120 82% 146
99 DeVry University–Florida (FL)° 39% 158 24% 3 63% 40% 6 n/a 39% 9 n/a 34249 70 23750 230 58% 225 62% 205
100 Univ. of S. Florida–St. Petersburg (FL)* 36% 180 47% 237 40% 37% 106 39% 32% 37 42800 43223 128 9970 32 82% 113 81% 127
best bANG FOR the bUCk sOUtheAst COLLeGes
6-year graduation rate
Predicted grad rate based on % of Pell re
cipients,
incoming SATs, etc.
Graduation rate rank
Grad rate performance rank
Students receiving Pell G
rants
Predicted % Pell based on ACT/S
AT and admit rates
Pell performance rank
First-gen stu
dents
Predicted % first-
gen based on ACT/SAT and admit rates
First-gen performance rank
Median earnings 10 years a
fter entering college
Predicted median earnings
Earnings performance rank
Net price of attendance for families below $75,0
00 income
Net price rank
% repaying $1 in loan principal 5 years a
fter leaving coll.
Repayment rank
Predicted repayment ra
te
Repay. rate perf. r
ank

54 September/October 2016
1 CA State University–Bakersfield (CA)* 40% 140 33% 46 61% 50% 39 55% 45% 22 49800 39113 8 6225 7 83% 129 75% 6
2 Harvey Mudd College (CA) 90% 20 96% 167 13% 4% 43 12% 6% 53 80900 62700 3 13097 60 n/a 30 98% 95
3 California Maritime Academy (CA)* 57% 29 49% 40 35% 37% 118 24% 34% 195 79750 58355 2 11855 47 90% 37 89% 93
4 University of WA–Tacoma (WA)* 49% 103 44% 63 47% 41% 57 33% 40% 185 52850 41599 6 6823 10 93% 16 83% 4
5 CA State University–Stanislaus (CA)* 51% 90 34% 4 58% 49% 45 57% 45% 13 45200 40801 28 5905 5 85% 112 77% 9
6 Arizona State–West (AZ)* 59% 51 41% 2 50% 29% 9 n/a 31% 60 n/a 37303 86 7590 13 82% 139 70% 2
7 Stanford University (CA) 95% 6 92% 68 17% 15% 88 21% 15% 42 77900 70472 14 5465 11 97% 10 93% 30
8 Univ. of California–Merced (CA)* 59% 119 56% 70 60% 40% 2 46% 37% 30 n/a 50511 12 9947 54 n/a 138 86% 88
9 Brigham Young University–Provo (UT) 78% 42 74% 62 36% 19% 7 14% 22% 188 57750 48775 13 10864 70 97% 9 95% 67
10 Brigham Young University–Idaho (ID) 52% 47 46% 61 43% 30% 30 22% 32% 194 38150 34855 50 7197 4 94% 13 85% 13
11 CA State Univ.–San Bernardino (CA)* 44% 127 33% 17 59% 53% 56 56% 47% 29 48350 43222 24 5976 6 80% 151 76% 42
12 University of California–Davis (CA)* 82% 33 76% 45 43% 30% 13 40% 28% 9 58200 54796 47 11203 74 93% 48 92% 83
13 University of California–San Diego (CA)* 86% 21 79% 32 43% 26% 5 38% 25% 4 60150 61348 115 10226 58 94% 32 93% 84
14 Utah State University (UT)* 50% 147 44% 39 36% 29% 46 33% 32% 109 42850 35540 17 10768 69 93% 61 85% 3
15 Soka University of America (CA) 85% 35 71% 5 30% 26% 65 26% 21% 58 n/a 35071 76 9978 17 n/a 110 87% 33
16 CA State University–Los Angeles (CA)* 38% 152 32% 56 65% 54% 41 60% 48% 8 46600 46301 89 3635 2 84% 122 76% 11
17 Evergreen State College (WA)* 56% 69 45% 19 44% 29% 19 31% 34% 145 32850 27920 25 10515 42 82% 137 80% 76
18 Fresno Pacific University (CA) 59% 53 47% 14 58% 40% 11 47% 39% 35 42350 39721 52 14631 98 85% 115 80% 37
19 University of CA–Santa Barbara (CA)* 81% 39 74% 31 38% 28% 32 37% 27% 14 53700 54116 103 10747 67 93% 50 89% 19
20 Univ. of California–Los Angeles (CA)* 91% 12 85% 42 36% 26% 23 34% 23% 11 59750 60194 104 9852 50 92% 70 93% 112
21 University of California–Riverside (CA)* 67% 84 67% 98 57% 34% 1 44% 33% 7 51050 52974 126 9489 45 90% 101 89% 79
22 University of WA Bothell (WA)* 66% 26 52% 7 34% 38% 150 33% 38% 165 52850 51624 70 7744 16 93% 16 90% 50
23 University of Colorado–Denver (CO)* 42% 168 46% 154 28% 35% 187 34% 34% 119 77150 50547 1 12687 88 85% 155 85% 108
24 Pomona College (CA) 95% 11 93% 90 17% 8% 40 25% 8% 1 51750 58364 181 6425 3 n/a 107 90% 72
25 Thomas Aquinas College (CA) 76% 64 69% 36 35% 13% 3 n/a 15% 95 n/a 26932 26 17094 109 n/a 124 92% 134
26 CA State University–Sacramento (CA)* 43% 131 44% 117 51% 46% 58 45% 42% 84 48500 42929 22 8164 18 87% 88 84% 61
27 Arizona State–East (AZ)* 59% 49 51% 37 39% 25% 25 n/a 28% 86 n/a 39747 116 9620 32 82% 139 77% 32
28 Washington State University (WA)* 67% 86 55% 6 33% 37% 153 34% 36% 138 47300 41282 23 12990 92 91% 87 87% 22
29 CA State University–Chico (CA)* 58% 60 47% 22 40% 40% 110 38% 39% 127 46700 43404 41 11407 55 88% 71 84% 46
30 University of California–Irvine (CA)* 86% 22 75% 9 43% 35% 42 39% 31% 39 56650 59552 144 9834 49 93% 45 94% 109
31 CA State University–Fresno (CA)* 50% 150 45% 52 55% 53% 84 50% 45% 52 44900 41273 42 5367 9 85% 153 83% 58
32 CA State University–Long Beach (CA)* 61% 45 54% 48 47% 44% 74 44% 36% 32 48750 50230 122 7620 15 89% 62 89% 98
33 University of California–Berkeley (CA)* 91% 13 89% 93 32% 20% 18 32% 19% 3 63350 66085 141 9920 53 92% 65 94% 144
34 Claremont McKenna College (CA) 92% 17 95% 136 13% 12% 99 12% 11% 100 64050 62118 61 10985 25 n/a 39 95% 52
35 University of Utah (UT)* 60% 114 52% 21 32% 29% 73 29% 31% 136 50500 46268 33 12728 90 92% 68 89% 29
36 University of Washington–Seattle (WA)* 82% 32 72% 11 25% 25% 104 33% 26% 41 52850 56302 152 7919 27 93% 49 91% 60
37 CA State Univ.–Dominguez Hills (CA)* 30% 172 28% 95 60% 61% 119 55% 51% 67 46350 43408 48 2316 1 77% 161 74% 59
38 University of Montana–Western (MT)* 47% 71 39% 47 43% 45% 120 41% 38% 80 31000 33064 128 8286 8 88% 55 84% 54
39 Arizona State University (AZ)* 60% 118 58% 82 36% 27% 35 37% 30% 34 46550 42689 38 9825 48 84% 159 85% 129
40 Central Washington University (WA)* 53% 83 49% 73 36% 41% 159 40% 40% 126 45850 41631 30 11736 61 89% 57 85% 47
41 CA State University–Northridge (CA)* 47% 113 38% 29 50% 53% 137 48% 45% 73 45900 44205 63 9468 30 84% 123 81% 63
42 Saint Martin’s University (WA) 50% 99 46% 74 37% 34% 78 38% 36% 87 48000 45003 46 16599 111 90% 52 81% 7
43 Eastern Oregon University (OR)* 30% 173 31% 115 50% 49% 98 46% 44% 103 38000 31569 16 13137 80 83% 134 76% 15
44 Western Washington University (WA)* 69% 19 63% 49 25% 28% 132 27% 31% 156 44350 43449 77 12033 68 93% 15 93% 101
45 Western Oregon University (OR)* 45% 123 45% 100 44% 41% 83 43% 41% 98 39850 36204 34 14792 99 86% 103 81% 28
46 CA Poly. St. U.–San Luis Obispo (CA)* 72% 14 75% 124 20% 26% 160 25% 23% 85 61150 58071 45 12839 78 95% 4 98% 145
47 College of Idaho (ID) 64% 117 55% 23 36% 32% 69 37% 27% 18 38750 41947 148 15206 91 91% 118 84% 8
48 CA State Univ.–Channel Islands (CA)* 55% 73 43% 16 41% 47% 162 44% 42% 92 n/a 46979 93 11917 64 86% 98 84% 73
49 Montana Tech/Univ. of Montana (MT)* 46% 74 50% 133 35% 24% 37 39% 28% 17 41500 46844 169 10710 31 84% 94 78% 34
50 CA State University–San Marcos (CA)* 47% 112 47% 102 43% 48% 157 44% 42% 96 46450 45250 71 8533 21 89% 60 86% 74
best bANG FOR the bUCk WesteRN COLLeGes*Public institution
°For-profit institution
6-year graduation rate
Predicted grad rate based on % of Pell re
cipients,
incoming SATs, etc.
Graduation rate rank
Grad rate performance rank
Students receiving Pell G
rants
Predicted % Pell based on ACT/S
AT and admit rates
Pell performance rank
First-gen stu
dents
Predicted % first-
gen based on ACT/SAT and admit rates
First-gen performance rank
Median earnings 10 years a
fter entering college
Predicted median earnings
Earnings performance rank
Net price of attendance for families below $75,0
00 income
Net price rank
% repaying $1 in loan principal 5 years a
fter leaving coll.
Repayment rank
Predicted repayment ra
te
Repay. rate perf. r
ank

56 September/October 2016
51 University of Wyoming (WY)* 54% 132 58% 146 24% 23% 97 31% 28% 77 46450 43627 56 9122 39 91% 85 88% 43
52 San Diego State University (CA)* 66% 89 61% 50 40% 42% 141 41% 35% 51 49300 51429 131 8641 36 90% 106 87% 35
53 Southern Utah University (UT)* 39% 144 45% 160 39% 36% 76 34% 34% 123 38050 34637 37 12978 79 89% 66 81% 12
54 Eastern Washington University (WA)* 46% 120 43% 78 39% 44% 163 36% 42% 173 41650 39120 54 10004 37 87% 82 83% 38
55 CA State Univ.–Monterey Bay (CA)* 40% 139 47% 159 48% 48% 100 45% 41% 72 45050 43522 66 7597 14 86% 97 84% 69
56 University of Phoenix–Idaho (ID)° 12% 191 21% 177 68% 53% 27 55% 43% 12 56500 38578 4 18325 126 57% 182 65% 178
57 University of California–Santa Cruz (CA)* 75% 52 67% 24 44% 32% 17 39% 31% 36 45550 54032 191 12043 81 92% 79 89% 45
58 Arizona State–Downtown Phoenix (AZ)* 58% 124 45% 3 41% 31% 26 n/a 32% 110 n/a 38552 80 9416 44 82% 165 89% 192
59 University of Southern California (CA) 91% 15 90% 99 23% 19% 59 22% 19% 68 65250 63950 72 17327 121 95% 24 95% 97
60 University of Redlands (CA) 71% 16 64% 43 27% 28% 111 35% 29% 57 56200 55497 82 21049 147 93% 20 89% 49
61 Heritage University (WA) 16% 196 20% 145 77% 60% 14 63% 53% 19 35500 32907 53 10705 43 72% 172 70% 81
62 Oregon State University (OR)* 62% 108 53% 18 33% 31% 79 30% 32% 134 46700 45977 85 15106 108 91% 90 88% 48
63 Oregon Institute of Technology (OR)* 46% 79 37% 33 35% 44% 182 39% 37% 89 48500 49640 114 12276 57 88% 54 84% 53
64 CA State Poly. Univ.–Pomona (CA)* 53% 81 56% 122 45% 37% 52 43% 34% 28 53450 58975 178 8763 22 90% 43 87% 65
65 Santa Clara University (CA) 85% 1 82% 79 15% 16% 113 17% 18% 125 68950 63104 21 24862 176 96% 2 100% 160
66 University of the Pacific (CA) 65% 95 72% 185 41% 29% 16 34% 28% 50 64750 54170 10 24040 178 91% 81 93% 146
67 Northwest Christian University (OR) 48% 109 45% 80 52% 43% 50 40% 40% 124 38450 37694 81 16487 110 86% 105 81% 39
68 NM Inst. of Mining and Tech (NM)* 46% 122 58% 190 29% 26% 81 29% 25% 69 53400 55195 130 9337 28 93% 21 85% 10
69 Gonzaga University (WA) 82% 2 74% 41 19% 21% 124 16% 24% 183 52900 49290 35 22417 159 95% 3 97% 127
70 University of La Verne (CA) 59% 121 48% 8 46% 48% 149 49% 40% 25 54550 52848 67 17704 124 85% 156 81% 31
71 Linfield College–McMinnville (OR) 69% 92 64% 58 25% 31% 168 33% 26% 45 50750 46426 31 20391 136 95% 76 92% 51
72 Pacific Lutheran University (WA) 69% 18 65% 67 29% 29% 103 26% 31% 169 46800 45067 62 19969 131 95% 8 93% 91
73 California Institute of Technology (CA) 92% 8 100% 184 11% 8% 70 n/a 10% 81 82100 88282 176 7978 29 100% 1 100% 105
74 California State Univ.–Fullerton (CA)* 53% 135 55% 121 42% 46% 167 45% 39% 46 47700 49374 121 5983 12 89% 121 86% 56
75 George Fox University (OR) 64% 40 58% 55 36% 32% 71 27% 33% 170 44200 44018 94 20604 141 93% 14 89% 41
76 University of Hawaii–Hilo (HI)* 38% 149 38% 109 46% 45% 101 38% 42% 164 35900 35960 97 8896 24 84% 125 81% 70
77 Pepperdine University (CA) 82% 34 74% 27 21% 29% 188 22% 27% 167 60450 56432 36 19056 133 94% 42 92% 77
78 Mt. Sierra College (CA)° 31% 153 20% 26 71% 51% 10 54% 43% 16 48100 48175 98 20277 150 60% 176 57% 64
79 Brigham Young University–Hawaii (HI) 49% 65 48% 101 30% 38% 180 25% 32% 179 38850 39431 105 9888 20 91% 29 93% 126
80 San Diego Christian College (CA) 43% 94 37% 60 58% 53% 62 42% 41% 102 36100 35135 79 24109 183 90% 41 73% 1
81 University of Arizona (AZ)* 61% 111 60% 97 33% 32% 89 32% 32% 114 45100 44772 90 12317 85 88% 127 87% 92
82 Regis University (CO) 59% 54 56% 84 28% 24% 67 39% 29% 26 52300 51967 88 19051 125 85% 111 86% 117
83 Woodbury University (CA) 48% 107 40% 34 51% 47% 72 41% 42% 133 44600 43634 75 22183 156 86% 102 80% 21
84 Sonoma State University (CA)* 55% 72 51% 76 30% 40% 185 38% 39% 137 46050 45766 91 12735 75 89% 56 89% 99
85 University of Idaho (ID)* 56% 130 49% 35 41% 39% 80 33% 36% 150 40850 41104 101 12050 82 87% 142 88% 123
86 National University (CA) 43% 129 41% 94 33% 42% 184 45% 38% 48 56550 50448 19 22131 154 84% 120 80% 44
87 Whittier College (CA) 66% 104 55% 10 37% 40% 129 36% 30% 54 46550 48951 135 20293 134 89% 136 82% 14
88 Trident University International (CA)° 48% 156 40% 20 15% 33% 198 51% 34% 2 n/a 65154 39 13078 93 79% 173 77% 66
89 Humboldt State University (CA)* 41% 134 48% 157 50% 39% 34 37% 39% 132 37650 39818 134 11760 62 84% 119 83% 85
90 University of Montana (MT)* 49% 155 49% 110 39% 29% 29 34% 32% 90 34450 38816 159 12261 84 88% 132 85% 55
91 Univ. of Phoenix–Oregon (OR)° 18% 183 21% 128 65% 55% 44 55% 44% 15 56500 44423 9 18990 130 57% 182 69% 188
92 Mount St. Mary’s College (CA) 64% 37 52% 15 58% 50% 48 47% 45% 93 51750 52671 113 23138 166 85% 117 87% 150
93 Mills College (CA) 65% 36 66% 120 48% 27% 8 29% 28% 108 42300 42236 96 21736 151 87% 95 94% 182
94 Willamette University (OR) 78% 56 74% 66 21% 22% 109 16% 20% 162 49700 44634 27 22697 164 93% 93 96% 149
95 Univ. of CO–Colorado Springs (CO)* 47% 116 51% 143 32% 31% 95 30% 33% 144 42200 44481 138 12460 73 87% 83 85% 78
96 Occidental College (CA) 86% 30 84% 88 22% 18% 66 16% 16% 120 51050 54961 155 16479 105 94% 84 97% 147
97 Westmont College (CA) 78% 55 73% 59 21% 24% 142 18% 21% 148 48300 44653 40 24213 175 97% 51 95% 87
98 University of Nevada–Reno (NV)* 53% 136 53% 108 29% 33% 164 38% 34% 62 46550 45317 73 13134 95 86% 148 86% 102
99 Embry-Riddle Aero. Univ.–Prescott (AZ) 57% 28 52% 64 28% 26% 82 37% 29% 33 61350 53852 18 32037 196 87% 67 84% 75
100 Fort Lewis College (CO)* 38% 179 38% 103 33% 35% 133 32% 29% 79 34650 32941 65 12684 52 76% 175 75% 90
best bANG FOR the bUCk WesteRN COLLeGes
6-year graduation rate
Predicted grad rate based on % of Pell re
cipients,
incoming SATs, etc.
Graduation rate rank
Grad rate performance rank
Students receiving Pell G
rants
Predicted % Pell based on ACT/S
AT and admit rates
Pell performance rank
First-gen stu
dents
Predicted % first-
gen based on ACT/SAT and admit rates
First-gen performance rank
Median earnings 10 years a
fter entering college
Predicted median earnings
Earnings performance rank
Net price of attendance for families below $75,0
00 income
Net price rank
% repaying $1 in loan principal 5 years a
fter leaving coll.
Repayment rank
Predicted repayment ra
te
Repay. rate perf. r
ank

80 September/October 2016
1 Stanford University (CA) 7 79 112 48 19 3 11 35 9 4 3 2 2 73 238 14 101
2 Harvard University (MA) 1 11 143 27 4 1 86 134 10 11 16 1 4 148 218 70 194
3 MA Institute of Technology (MA) 19 248 43 65 3 9 6 111 12 2 11 4 3 181 36 201 194
4 University of California–San Diego (CA)* 37 35 7 5 189 64 51 105 5 43 22 5 7 38 203 34 13
5 University of Pennsylvania (PA) 4 113 137 97 11 52 25 102 16 23 33 9 9 88 225 25 118
6 Texas A&M University–College Station (TX)* 74 18 221 111 96 11 73 47 19 104 11 78 62 157 2 10 25
7 University of California–Berkeley (CA)* 25 115 24 4 225 60 88 221 21 16 1 8 6 33 205 50 120
8 University of California–Los Angeles (CA)* 24 47 26 10 165 57 98 176 7 36 10 20 13 44 143 136 45
9 Georgetown University (DC) 12 104 219 173 2 126 24 89 94 33 122 93 71 5 155 111 54
10 University of California–Davis (CA)* 55 50 18 8 52 86 68 100 22 54 18 53 22 53 193 23 87
11 Duke University (NC) 9 243 134 182 22 40 12 186 6 12 37 10 15 25 57 149 129
12 University of California–Riverside (CA)* 121 128 1 7 200 50 131 92 110 146 58 29 58 70 248 3 3
13 Yale University (CT) 2 144 107 35 84 13 22 62 20 3 39 6 8 58 67 201 194
14 University of Washington–Seattle (WA)* 54 13 144 47 243 17 69 68 3 62 15 23 16 12 108 38 194
15 Princeton University (NJ) 3 184 121 57 35 7 7 83 70 5 43 7 5 115 148 201 194
16 Georgia Institute of Technology–Main (GA)* 59 204 66 130 43 29 38 131 23 39 17 13 27 153 62 163 64
17 University of CA–Santa Barbara (CA)* 62 34 31 14 164 73 72 25 79 60 47 36 11 26 211 99 111
18 University of Florida (FL)* 36 10 41 32 176 18 119 73 24 42 5 77 68 30 87 194 194
19 Brigham Young University–Provo (UT) 79 72 8 273 13 76 10 77 177 35 129 144 154 188 93 201 75
20 University of NC–Chapel Hill (NC)* 31 65 201 229 214 22 19 48 8 37 24 33 39 31 122 118 11
21 University of Michigan–Ann Arbor (MI)* 28 125 184 185 181 36 66 246 2 30 2 37 29 29 130 142 61
22 Vanderbilt University (TN) 17 199 125 168 154 12 63 225 31 27 59 22 24 64 89 15 46
23 Columbia Univ. in the City of NY (NY) 10 78 57 66 113 20 99 199 11 13 26 18 10 57 242 201 194
24 University of Notre Dame (IN) 8 205 138 216 33 155 2 143 96 24 82 39 104 42 13 41 85
25 CA State University–Fresno (CA)* 223 61 108 61 48 2 198 66 236 248 267 183 159 193 102 1 20
26 Utah State University (UT)* 221 43 53 133 20 74 85 7 99 186 130 112 159 197 123 5 194
27 Cornell University (NY) 15 210 142 200 63 129 28 189 15 9 20 34 21 19 181 201 112
28 University of Wisconsin–Madison (WI)* 49 110 209 207 185 125 27 71 4 34 7 25 20 13 131 122 126
NAtIONAL UNIVeRsItIes*Public institution
°For-profit institution
SoCial MoBility: The first column shows the percentage of students graduating within six years, and the second column shows the predicted rate of
graduation (based on incoming ACT/SAT scores, Pell Grant percentages, and other measures; see our full methodology on page 114). The third and fourth
columns show the difference between the actual and predicted percentages of Pell Grant recipients and first-generation students based on ACT/SAT
scores and the percentage of students admitted. The fifth column shows the difference between actual and predicted earnings of all students (dropouts
and graduates) ten years after starting college after controlling for student demographics and majors, living costs, and other factors. The sixth column
shows the net price of attending that institution, or the average price that first-time, full-time students who have a family income below $75,000 per year
and receive financial aid to pay for college after subtracting need-based financial aid. The final two columns reflect the actual and predicted performance
of the percentage of students who repaid at least $1 in principal on their loans within five years of entering repayment.
reSearCh: The first column shows total research expenditures. The second shows the school’s ranking in the number of bachelor’s recipients who go on
to receive PhDs, relative to school size. The third ranks the school by the number of science and engineering PhDs awarded. The fourth column shows the
school’s ranking by the number of faculty receiving prestigious awards, relative to the number of full-time faculty. The fifth column ranks the school by the
number of faculty who are members of the National Academies, relative to the number of full-time faculty.
ServiCe: The first column ranks the school by the number of alumni who go on to serve in the Peace Corps, relative to school size. The second column
ranks the school by the percentage of students who serve in ROTC. The third gives the percentage of funds in federal work-study money that goes to
community service (versus non-community service). The fourth column shows the school’s rank on a combined measure of the number of students
participating in community service and the total number of service hours performed, both relative to school size. The fifth column shows the school’s rank
on a combined measure of the percent of students doing community service, the number of hours of community service per student, whether any staff
were employed in community service, if any service courses were offered, or if the institution provides scholarships for community service.
sOCIAL MObILItY
Graduation rate rank
Pell perfo
rmance rank
Grad rate perform
ance rank
First-gen perfo
rmance rank
Earnings perform
ance rank
Net price rank
Repayment rank
Repayment rate perfo
rmance rank
ReseARCh
Research expenditu
res rank
Bachelor’s to PhD rank
Science & engineering PhDs rank
Faculty in National Academies ra
nk
ROTC rank
Peace Corps rank
% of federal w
ork-study funds
spent on service rank
Community service rank
seRVICe
Faculty awards ra
nk
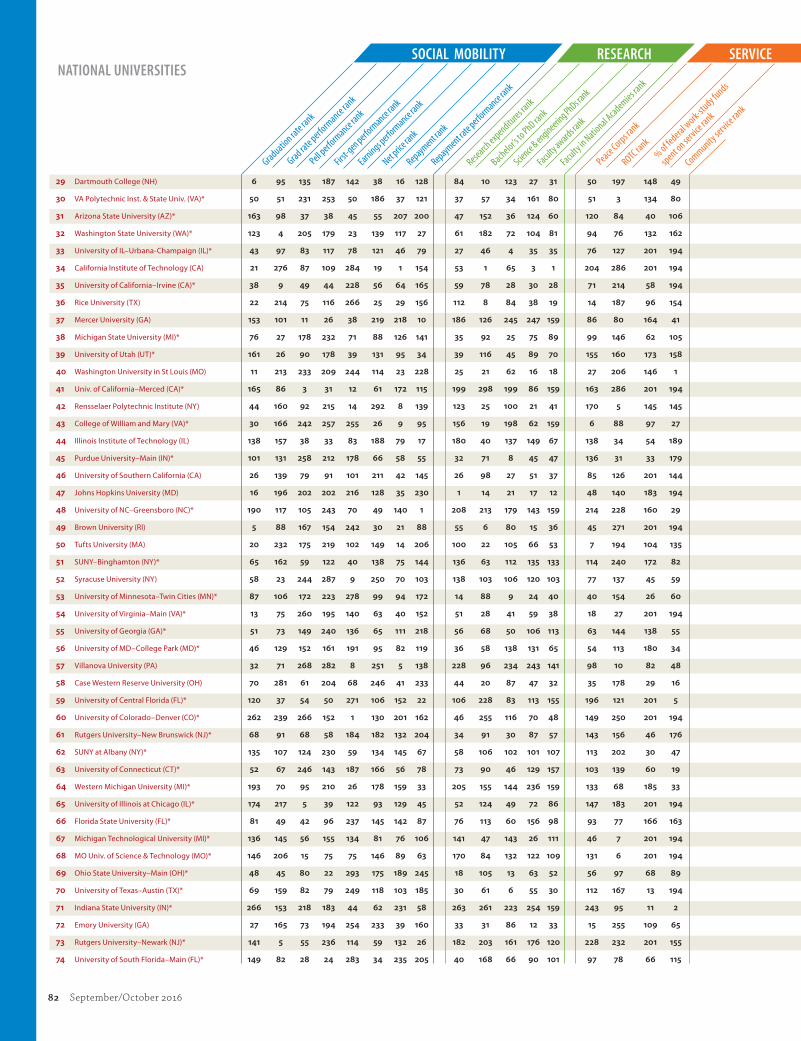
82 September/October 2016
29 Dartmouth College (NH) 6 95 135 187 142 38 16 128 84 10 123 27 31 50 197 148 49
30 VA Polytechnic Inst. & State Univ. (VA)* 50 51 231 253 50 186 37 121 37 57 34 161 80 51 3 134 80
31 Arizona State University (AZ)* 163 98 37 38 45 55 207 200 47 152 36 124 60 120 84 40 106
32 Washington State University (WA)* 123 4 205 179 23 139 117 27 61 182 72 104 81 94 76 132 162
33 University of IL–Urbana-Champaign (IL)* 43 97 83 117 78 121 46 79 27 46 4 35 35 76 127 201 194
34 California Institute of Technology (CA) 21 276 87 109 284 19 1 154 53 1 65 3 1 204 286 201 194
35 University of California–Irvine (CA)* 38 9 49 44 228 56 64 165 59 78 28 30 28 71 214 58 194
36 Rice University (TX) 22 214 75 116 266 25 29 156 112 8 84 38 19 14 187 96 154
37 Mercer University (GA) 153 101 11 26 38 219 218 10 186 126 245 247 159 86 80 164 41
38 Michigan State University (MI)* 76 27 178 232 71 88 126 141 35 92 25 75 89 99 146 62 105
39 University of Utah (UT)* 161 26 90 178 39 131 95 34 39 116 45 89 70 155 160 173 158
40 Washington University in St Louis (MO) 11 213 233 209 244 114 23 228 25 21 62 16 18 27 206 146 1
41 Univ. of California–Merced (CA)* 165 86 3 31 12 61 172 115 199 298 199 86 159 163 286 201 194
42 Rensselaer Polytechnic Institute (NY) 44 160 92 215 14 292 8 139 123 25 100 21 41 170 5 145 145
43 College of William and Mary (VA)* 30 166 242 257 255 26 9 95 156 19 198 62 159 6 88 97 27
44 Illinois Institute of Technology (IL) 138 157 38 33 83 188 79 17 180 40 137 149 67 138 34 54 189
45 Purdue University–Main (IN)* 101 131 258 212 178 66 58 55 32 71 8 45 47 136 31 33 179
46 University of Southern California (CA) 26 139 79 91 101 211 42 145 26 98 27 51 37 85 126 201 144
47 Johns Hopkins University (MD) 16 196 202 202 216 128 35 230 1 14 21 17 12 48 140 183 194
48 University of NC–Greensboro (NC)* 190 117 105 243 70 49 140 1 208 213 179 143 159 214 228 160 29
49 Brown University (RI) 5 88 167 154 242 30 21 88 55 6 80 15 36 45 271 201 194
50 Tufts University (MA) 20 232 175 219 102 149 14 206 100 22 105 66 53 7 194 104 135
51 SUNY–Binghamton (NY)* 65 162 59 122 40 138 75 144 136 63 112 135 133 114 240 172 82
52 Syracuse University (NY) 58 23 244 287 9 250 70 103 138 103 106 120 103 77 137 45 59
53 University of Minnesota–Twin Cities (MN)* 87 106 172 223 278 99 94 172 14 88 9 24 40 40 154 26 60
54 University of Virginia–Main (VA)* 13 75 260 195 140 63 40 152 51 28 41 59 38 18 27 201 194
55 University of Georgia (GA)* 51 73 149 240 136 65 111 218 56 68 50 106 113 63 144 138 55
56 University of MD–College Park (MD)* 46 129 152 161 191 95 82 119 36 58 138 131 65 54 113 180 34
57 Villanova University (PA) 32 71 268 282 8 251 5 138 228 96 234 243 141 98 10 82 48
58 Case Western Reserve University (OH) 70 281 61 204 68 246 41 233 44 20 87 47 32 35 178 29 16
59 University of Central Florida (FL)* 120 37 54 50 271 106 152 22 106 228 83 113 155 196 121 201 5
60 University of Colorado–Denver (CO)* 262 239 266 152 1 130 201 162 46 255 116 70 48 149 250 201 194
61 Rutgers University–New Brunswick (NJ)* 68 91 68 58 184 182 132 204 34 91 30 87 57 143 156 46 176
62 SUNY at Albany (NY)* 135 107 124 230 59 134 145 67 58 106 102 101 107 113 202 30 47
63 University of Connecticut (CT)* 52 67 246 143 187 166 56 78 73 90 46 129 157 103 139 60 19
64 Western Michigan University (MI)* 193 70 95 210 26 178 159 33 205 155 144 236 159 133 68 185 33
65 University of Illinois at Chicago (IL)* 174 217 5 39 122 93 129 45 52 124 49 72 86 147 183 201 194
66 Florida State University (FL)* 81 49 42 96 237 145 142 87 76 113 60 156 98 93 77 166 163
67 Michigan Technological University (MI)* 136 145 56 155 134 81 76 106 141 47 143 26 111 46 7 201 194
68 MO Univ. of Science & Technology (MO)* 146 206 15 75 75 146 89 63 170 84 132 122 109 131 6 201 194
69 Ohio State University–Main (OH)* 48 45 80 22 293 175 189 245 18 105 13 63 52 56 97 68 89
70 University of Texas–Austin (TX)* 69 159 82 79 249 118 103 185 30 61 6 55 30 112 167 13 194
71 Indiana State University (IN)* 266 153 218 183 44 62 231 58 263 261 223 254 159 243 95 11 2
72 Emory University (GA) 27 165 73 194 254 233 39 160 33 31 86 12 33 15 255 109 65
73 Rutgers University–Newark (NJ)* 141 5 55 236 114 59 132 26 182 203 161 176 120 228 232 201 155
74 University of South Florida–Main (FL)* 149 82 28 24 283 34 235 205 40 168 66 90 101 97 78 66 115
NAtIONAL UNIVeRsItIessOCIAL MObILItY
Graduation rate rank
Pell perfo
rmance rank
Grad rate perform
ance rank
First-gen perfo
rmance rank
Earnings perform
ance rank
Net price rank
Repayment rank
Repayment rate perfo
rmance rank
ReseARCh
Research expenditu
res rank
Bachelor’s to PhD rank
Science & engineering PhDs rank
Faculty in National Academies ra
nk
ROTC rank
Peace Corps rank
% of federal w
ork-study funds
spent on service rank
Community service rank
seRVICe
Faculty awards ra
nk
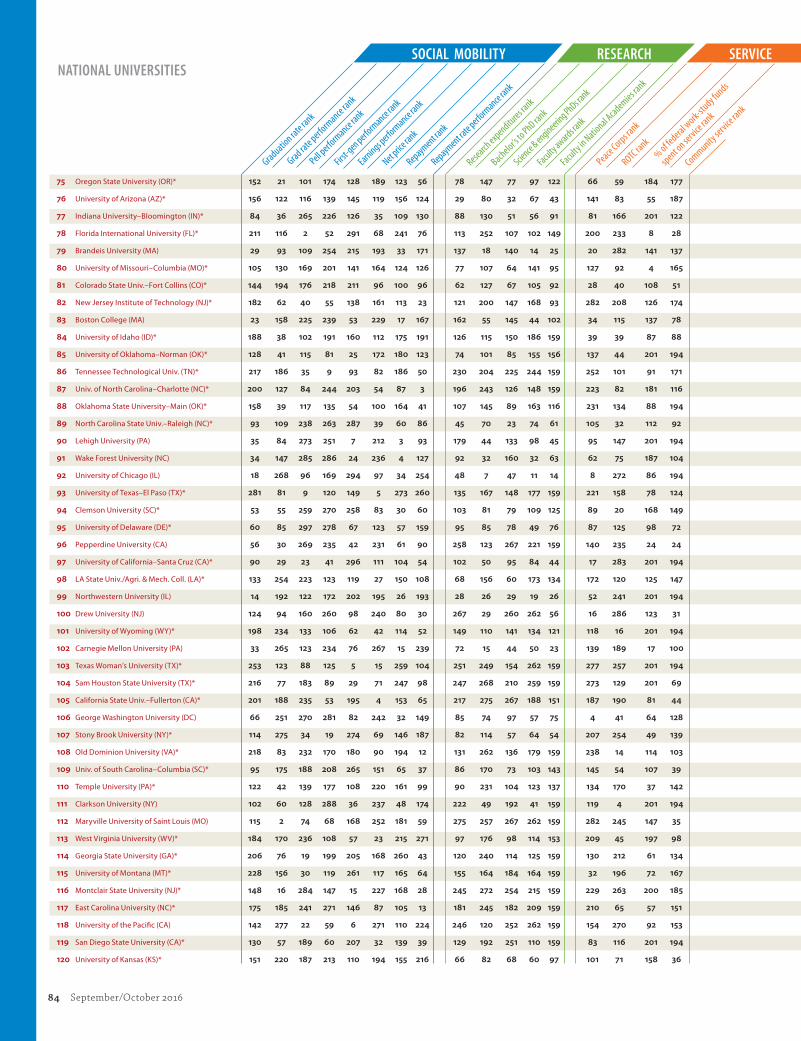
84 September/October 2016
75 Oregon State University (OR)* 152 21 101 174 128 189 123 56 78 147 77 97 122 66 59 184 177
76 University of Arizona (AZ)* 156 122 116 139 145 119 156 124 29 80 32 67 43 141 83 55 187
77 Indiana University–Bloomington (IN)* 84 36 265 226 126 35 109 130 88 130 51 56 91 81 166 201 122
78 Florida International University (FL)* 211 116 2 52 291 68 241 76 113 252 107 102 149 200 233 8 28
79 Brandeis University (MA) 29 93 109 254 215 193 33 171 137 18 140 14 25 20 282 141 137
80 University of Missouri–Columbia (MO)* 105 130 169 201 141 164 124 126 77 107 64 141 95 127 92 4 165
81 Colorado State Univ.–Fort Collins (CO)* 144 194 176 218 211 96 100 96 62 127 67 105 92 28 40 108 51
82 New Jersey Institute of Technology (NJ)* 182 62 40 55 138 161 113 23 121 200 147 168 93 282 208 126 174
83 Boston College (MA) 23 158 225 239 53 229 17 167 162 55 145 44 102 34 115 137 78
84 University of Idaho (ID)* 188 38 102 191 160 112 175 191 126 115 150 186 159 39 39 87 88
85 University of Oklahoma–Norman (OK)* 128 41 115 81 25 172 180 123 74 101 85 155 156 137 44 201 194
86 Tennessee Technological Univ. (TN)* 217 186 35 9 93 82 186 50 230 204 225 244 159 252 101 91 171
87 Univ. of North Carolina–Charlotte (NC)* 200 127 84 244 203 54 87 3 196 243 126 148 159 223 82 181 116
88 Oklahoma State University–Main (OK)* 158 39 117 135 54 100 164 41 107 145 89 163 116 231 134 88 194
89 North Carolina State Univ.–Raleigh (NC)* 93 109 238 263 287 39 60 86 45 70 23 74 61 105 32 112 92
90 Lehigh University (PA) 35 84 273 251 7 212 3 93 179 44 133 98 45 95 147 201 194
91 Wake Forest University (NC) 34 147 285 286 24 236 4 127 92 32 160 32 63 62 75 187 104
92 University of Chicago (IL) 18 268 96 169 294 97 34 254 48 7 47 11 14 8 272 86 194
93 University of Texas–El Paso (TX)* 281 81 9 120 149 5 273 260 135 167 148 177 159 221 158 78 124
94 Clemson University (SC)* 53 55 259 270 258 83 30 60 103 81 79 109 125 89 20 168 149
95 University of Delaware (DE)* 60 85 297 278 67 123 57 159 95 85 78 49 76 87 125 98 72
96 Pepperdine University (CA) 56 30 269 235 42 231 61 90 258 123 267 221 159 140 235 24 24
97 University of California–Santa Cruz (CA)* 90 29 23 41 296 111 104 54 102 50 95 84 44 17 283 201 194
98 LA State Univ./Agri. & Mech. Coll. (LA)* 133 254 223 123 119 27 150 108 68 156 60 173 134 172 120 125 147
99 Northwestern University (IL) 14 192 122 172 202 195 26 193 28 26 29 19 26 52 241 201 194
100 Drew University (NJ) 124 94 160 260 98 240 80 30 267 29 260 262 56 16 286 123 31
101 University of Wyoming (WY)* 198 234 133 106 62 42 114 52 149 110 141 134 121 118 16 201 194
102 Carnegie Mellon University (PA) 33 265 123 234 76 267 15 239 72 15 44 50 23 139 189 17 100
103 Texas Woman’s University (TX)* 253 123 88 125 5 15 259 104 251 249 154 262 159 277 257 201 194
104 Sam Houston State University (TX)* 216 77 183 89 29 71 247 98 247 268 210 259 159 273 129 201 69
105 California State Univ.–Fullerton (CA)* 201 188 235 53 195 4 153 65 217 275 267 188 151 187 190 81 44
106 George Washington University (DC) 66 251 270 281 82 242 32 149 85 74 97 57 75 4 41 64 128
107 Stony Brook University (NY)* 114 275 34 19 274 69 146 187 82 114 57 64 54 207 254 49 139
108 Old Dominion University (VA)* 218 83 232 170 180 90 194 12 131 262 136 179 159 238 14 114 103
109 Univ. of South Carolina–Columbia (SC)* 95 175 188 208 265 151 65 37 86 170 73 103 143 145 54 107 39
110 Temple University (PA)* 122 42 139 177 108 220 161 99 90 231 104 123 137 134 170 37 142
111 Clarkson University (NY) 102 60 128 288 36 237 48 174 222 49 192 41 159 119 4 201 194
112 Maryville University of Saint Louis (MO) 115 2 74 68 168 252 181 59 275 257 267 262 159 282 245 147 35
113 West Virginia University (WV)* 184 170 236 108 57 23 215 271 97 176 98 114 153 209 45 197 98
114 Georgia State University (GA)* 206 76 19 199 205 168 260 43 120 240 114 125 159 130 212 61 134
115 University of Montana (MT)* 228 156 30 119 261 117 165 64 155 164 184 164 159 32 196 72 167
116 Montclair State University (NJ)* 148 16 284 147 15 227 168 28 245 272 254 215 159 229 263 200 185
117 East Carolina University (NC)* 175 185 241 271 146 87 105 13 181 245 182 209 159 210 65 57 151
118 University of the Pacific (CA) 142 277 22 59 6 271 110 224 246 120 252 262 159 154 270 92 153
119 San Diego State University (CA)* 130 57 189 60 207 32 139 39 129 192 251 110 159 83 116 201 194
120 University of Kansas (KS)* 151 220 187 213 110 194 155 216 66 82 68 60 97 101 71 158 36
NAtIONAL UNIVeRsItIessOCIAL MObILItY
Graduation rate rank
Pell perfo
rmance rank
Grad rate perform
ance rank
First-gen perfo
rmance rank
Earnings perform
ance rank
Net price rank
Repayment rank
Repayment rate perfo
rmance rank
ReseARCh
Research expenditu
res rank
Bachelor’s to PhD rank
Science & engineering PhDs rank
Faculty in National Academies ra
nk
ROTC rank
Peace Corps rank
% of federal w
ork-study funds
spent on service rank
Community service rank
seRVICe
Faculty awards ra
nk

86 September/October 2016
121 University of Iowa (IA)* 107 172 230 225 61 137 101 136 41 87 42 48 46 106 159 201 194
122 Southern IL University–Carbondale (IL)* 246 245 81 138 32 162 236 101 142 108 115 198 159 142 58 171 157
123 Worcester Polytechnic Institute (MA) 47 68 166 205 16 295 13 75 192 38 181 52 106 168 8 201 194
124 University of Alabama at Birmingham (AL)* 207 105 58 76 218 154 257 137 42 134 88 195 66 198 90 83 114
125 Saint Louis University–Main (MO) 104 53 255 141 100 290 106 51 166 165 148 116 145 110 152 80 4
126 Illinois State University (IL)* 98 64 253 165 34 181 71 24 212 191 242 220 159 159 161 201 194
127 Marquette University (WI) 75 119 264 256 79 261 62 173 203 73 173 94 159 59 11 190 37
128 Duquesne University (PA) 89 63 283 294 28 248 83 197 218 133 190 232 131 79 150 65 12
129 DePaul University (IL) 106 31 47 88 69 265 197 220 241 215 214 222 159 117 234 84 110
130 University of Nebraska–Omaha (NE)* 252 260 185 156 80 70 173 81 233 233 241 234 159 186 153 93 43
131 Ashland University (OH) 177 19 251 77 92 235 134 6 275 179 267 194 159 257 286 56 183
132 Iowa State University (IA)* 108 126 200 267 152 84 81 140 69 102 35 85 94 150 55 201 194
133 Trinity International University–Illinois (IL) 229 69 4 73 247 216 209 49 275 153 267 262 159 282 286 153 26
134 University of Nebraska–Lincoln (NE)* 129 229 267 233 222 136 91 133 71 93 75 139 138 75 135 127 17
135 Tennessee State University (TN)* 289 56 25 237 73 41 297 120 214 218 230 206 159 255 188 94 125
136 University of Pittsburgh–Pittsburgh (PA)* 64 138 227 124 282 263 120 209 13 64 31 31 42 60 51 74 71
137 Wright State University–Main (OH)* 272 179 131 84 153 180 221 57 163 184 182 258 147 213 74 90 32
138 Bowling Green State Univ.–Main (OH)* 189 198 249 132 21 199 220 231 229 154 168 166 159 126 73 156 79
139 Auburn University (AL)* 110 230 194 245 206 190 137 236 108 135 71 201 152 166 12 18 81
140 University of Houston (TX)* 237 297 44 12 238 80 219 203 111 222 69 58 72 237 191 198 8
141 Texas Tech University (TX)* 162 224 234 140 116 113 157 129 105 174 91 65 118 201 132 159 127
142 Loyola University–Chicago (IL) 99 207 32 149 156 278 143 226 165 139 154 233 159 61 138 20 23
143 University of North Texas (TX)* 224 252 100 78 159 6 242 196 167 229 110 126 129 185 180 135 84
144 Central Michigan University (MI)* 180 178 180 206 56 109 187 192 225 217 214 248 159 161 177 169 113
145 Saint John Fisher College (NY) 97 17 239 262 169 226 121 164 275 236 267 208 159 202 246 73 6
146 University of La Verne (CA) 170 8 199 25 94 218 203 38 275 264 267 262 159 208 264 69 192
147 University of Oregon (OR)* 117 33 252 248 210 147 144 182 124 121 119 100 78 21 169 191 170
148 University of MD–Baltimore County (MD)* 150 280 86 128 269 153 136 91 140 76 19 111 159 135 195 79 141
149 FL Agricultural & Mechanical Univ. (FL)* 275 142 21 176 137 89 295 2 164 117 228 187 159 191 26 201 194
150 Miami University–Oxford (OH)* 67 74 228 15 120 244 217 289 197 83 177 192 159 47 85 129 50
151 Northern Illinois University (IL)* 210 208 147 159 89 208 190 46 204 209 168 181 159 164 118 52 150
152 Middle Tennessee State University (TN)* 244 228 71 92 131 28 271 237 242 280 247 253 159 219 174 51 123
153 University of Rochester (NY) 41 143 151 242 259 203 55 201 75 17 70 54 17 36 136 201 194
154 University of MA–Amherst (MA)* 94 197 136 231 234 148 138 263 89 79 63 61 82 69 173 110 172
155 Cardinal Stritch University (WI) 227 136 85 13 17 213 243 20 275 290 261 262 159 282 286 201 194
156 University of Texas–Arlington (TX)* 270 246 118 34 129 108 238 82 133 242 99 153 139 240 168 139 181
157 Boston University (MA) 42 141 274 276 135 283 20 116 54 53 39 40 59 43 133 124 94
158 University of Mass.–Dartmouth (MA)* 230 226 148 163 221 140 200 132 191 235 231 83 159 190 268 7 42
159 George Mason University (VA)* 126 140 217 190 88 183 84 53 127 221 76 193 144 123 86 201 194
160 Clark University (MA) 71 52 204 261 292 223 74 163 239 41 202 42 49 3 275 177 86
161 Mississippi State University (MS)* 164 193 106 198 223 177 212 175 83 144 111 219 136 269 63 12 109
162 Ball State University (IN)* 171 237 214 164 65 115 174 169 227 210 219 170 159 169 162 128 131
163 IN Univ./Purdue Univ.–Indianapolis (IN)* 267 222 256 112 105 98 223 122 63 288 214 130 90 245 182 47 57
164 Regent University (VA) 238 14 6 69 112 204 258 72 275 298 252 262 159 282 237 201 194
165 University at Buffalo (NY)* 100 54 196 211 179 105 151 184 50 178 56 71 85 124 231 201 194
166 Stevens Institute of Technology (NJ) 73 135 99 171 18 254 49 244 185 100 172 95 77 268 215 179 194
NAtIONAL UNIVeRsItIessOCIAL MObILItY
Graduation rate rank
Pell perfo
rmance rank
Grad rate perform
ance rank
First-gen perfo
rmance rank
Earnings perform
ance rank
Net price rank
Repayment rank
Repayment rate perfo
rmance rank
ReseARCh
Research expenditu
res rank
Bachelor’s to PhD rank
Science & engineering PhDs rank
Faculty in National Academies ra
nk
ROTC rank
Peace Corps rank
% of federal w
ork-study funds
spent on service rank
Community service rank
seRVICe
Faculty awards ra
nk

88 September/October 2016
167 University of South Dakota (SD)* 209 133 161 188 143 165 169 148 183 254 213 133 159 246 163 22 119
168 Penn State–Main (PA)* 39 12 292 94 224 253 148 194 17 66 14 96 73 121 25 201 194
169 Texas State Univ.–San Marcos (TX)* 187 111 222 131 107 78 182 85 171 258 214 210 159 218 149 188 182
170 Adelphi University (NY) 143 137 193 127 74 276 141 42 271 246 206 178 159 176 274 35 40
171 Georgia Regents University (GA)* 295 221 72 241 115 10 45 14 275 298 267 262 159 282 286 201 194
172 University of Louisville (KY)* 204 212 119 72 246 91 213 181 91 190 109 92 123 162 94 201 30
173 University of San Francisco (CA) 111 203 179 189 49 273 130 211 250 163 264 175 159 49 99 120 22
174 New York University (NY) 45 257 120 186 147 299 93 253 38 67 53 68 51 108 267 6 70
175 Arizona State–Downtown Phoenix (AZ)* 172 3 27 134 117 47 229 296 275 298 267 262 159 282 286 201 194
176 Florida Institute of Technology (FL) 195 103 263 1 230 293 158 5 219 56 187 228 74 249 9 106 140
177 University of Vermont (VT)* 86 89 243 295 290 122 54 198 117 122 146 43 105 11 157 103 156
178 American University (DC) 72 190 278 289 161 288 78 223 158 97 176 151 159 2 107 28 73
179 Seton Hall University (NJ) 132 149 140 153 27 259 160 110 238 208 234 140 159 146 72 201 166
180 Robert Morris University (PA) 178 44 213 146 163 238 147 36 275 295 267 199 159 282 223 21 138
181 Azusa Pacific University (CA) 139 121 229 145 99 281 77 29 249 259 267 205 159 92 111 154 90
182 University of Mississippi (MS)* 167 249 181 203 133 116 226 273 119 198 167 229 159 224 28 75 76
183 Indiana University of Penn.–Main (PA)* 212 182 240 214 51 197 191 125 265 183 222 237 159 247 49 189 96
184 Portland State University (OR)* 264 174 145 166 193 127 208 212 157 276 163 197 135 84 253 182 14
185 University of Rhode Island (RI)* 154 180 257 284 66 167 154 241 122 128 127 132 112 125 164 140 159
186 Edgewood College (WI) 181 118 159 220 166 209 102 44 275 286 267 262 159 262 224 186 83
187 Kent State University–Kent (OH)* 205 151 113 3 121 210 264 243 193 212 125 182 146 216 119 192 102
188 San Francisco State University (CA)* 235 263 191 93 199 72 183 202 184 232 267 204 159 116 251 43 93
189 University of Louisiana at Lafayette (LA)* 243 259 237 23 197 8 266 188 145 234 195 231 159 222 199 77 146
190 Kansas State University (KS)* 169 168 155 222 192 157 122 84 93 140 101 189 158 132 46 201 194
191 University of the Cumberlands (KY) 265 150 89 45 233 191 269 281 275 237 267 262 159 265 1 133 173
192 University of Southern Mississippi (MS)* 234 266 33 167 124 104 282 262 160 89 156 224 159 275 61 113 161
193 University of Tennessee (TN)* 116 223 36 121 257 101 205 282 64 86 54 115 119 109 79 201 194
194 University of Nevada–Reno (NV)* 202 152 226 71 104 144 188 150 132 177 120 69 99 160 112 201 194
195 University of Nevada–Las Vegas (NV)* 269 273 248 74 155 58 251 287 174 238 165 246 159 189 145 2 169
196 University of Denver (CO) 83 108 130 142 235 269 135 213 213 148 254 136 159 37 210 89 63
197 Drexel University (PA) 119 187 174 113 37 296 112 109 115 188 93 118 88 235 117 174 180
198 University of Massachusetts–Lowell (MA)* 197 181 171 70 286 103 179 151 148 256 158 180 159 278 165 48 133
199 Rochester Institute of Technology (NY) 140 231 64 238 183 255 96 147 176 119 206 190 159 261 60 62 193
200 Howard University (DC) 155 66 60 291 172 277 288 8 168 65 141 200 64 22 24 101 194
201 Northern Arizona University (AZ)* 222 211 69 98 127 124 246 261 187 199 220 191 159 78 52 199 194
202 University of Memphis (TN)* 260 176 46 100 130 77 294 298 161 216 152 207 159 227 47 161 58
203 Tulane University of Louisiana (LA) 80 236 163 80 288 284 166 250 98 51 118 127 132 10 91 44 7
204 Seattle Pacific University (WA) 96 59 110 266 262 247 18 21 264 112 239 262 159 9 209 201 194
205 Virginia Commonwealth University (VA)* 179 261 220 197 220 198 206 208 87 201 52 73 96 107 207 32 107
206 Montana State University (MT)* 225 282 127 217 267 179 67 32 116 149 177 142 159 91 37 201 117
207 University of San Diego (CA) 85 189 282 224 251 264 53 117 244 143 211 159 159 24 22 121 21
208 University of Arkansas (AR)* 159 271 208 102 194 79 170 179 114 166 113 174 110 178 114 105 194
209 Louisiana Tech University (LA)* 219 169 289 85 241 16 227 180 194 181 192 242 159 258 142 39 143
210 Univ. of Massachusetts–Boston (MA)* 268 218 207 87 245 45 225 70 150 260 189 107 140 263 261 95 175
211 University of Texas at Dallas (TX)* 131 241 13 16 298 48 177 257 125 158 93 158 84 248 259 201 194
212 Colorado School of Mines (CO)* 103 262 192 196 77 257 50 190 154 45 128 46 55 96 48 201 194
NAtIONAL UNIVeRsItIessOCIAL MObILItY
Graduation rate rank
Pell perfo
rmance rank
Grad rate perform
ance rank
First-gen perfo
rmance rank
Earnings perform
ance rank
Net price rank
Repayment rank
Repayment rate perfo
rmance rank
ReseARCh
Research expenditu
res rank
Bachelor’s to PhD rank
Science & engineering PhDs rank
Faculty in National Academies ra
nk
ROTC rank
Peace Corps rank
% of federal w
ork-study funds
spent on service rank
Community service rank
seRVICe
Faculty awards ra
nk

90 September/October 2016
213 University of Wisconsin–Milwaukee (WI)* 259 279 146 157 72 184 195 146 152 220 108 165 150 144 222 19 194
214 East Tennessee State University (TN)* 263 219 39 28 139 159 284 301 232 219 228 214 159 242 109 16 164
215 University of New Hampshire–Main (NH)* 78 24 276 292 209 232 44 153 101 109 157 91 159 41 81 201 194
216 University of Kentucky (KY)* 166 291 211 150 204 110 162 183 60 142 55 81 124 128 53 201 194
217 University of Missouri–St. Louis (MO)* 248 102 157 37 231 107 214 31 206 230 186 230 130 194 243 201 194
218 Barry University (FL) 283 216 158 144 174 241 237 4 260 173 258 262 159 215 260 151 62
219 University of Cincinnati–Main (OH)* 147 96 156 30 252 228 256 292 43 185 74 80 83 152 103 162 130
220 Union University (TN) 137 58 129 56 285 249 193 61 275 150 267 262 159 173 204 117 56
221 Florida Atlantic University (FL)* 257 227 173 104 263 85 222 40 173 223 158 212 114 184 217 100 184
222 University of Maine (ME)* 173 80 132 269 253 176 115 94 130 95 163 150 128 182 100 201 194
223 Fordham University (NY) 63 155 212 252 212 285 118 267 209 125 168 99 127 65 98 71 18
224 Trident University International (CA)° 232 25 299 2 46 141 252 74 275 298 267 262 159 282 286 201 194
225 University of New Mexico–Main (NM)* 239 146 195 64 281 31 253 251 81 141 92 88 108 67 42 201 194
226 University of Colorado–Boulder (CO)* 109 238 186 250 272 217 108 229 49 75 38 76 50 23 50 201 194
227 University of Toledo (OH)* 245 120 78 62 109 142 275 275 144 202 131 146 159 234 124 201 194
228 Widener University–Main (PA) 192 112 296 162 118 274 196 107 272 226 237 262 159 250 29 9 66
229 Yeshiva University (NY) 40 7 150 300 250 243 43 238 67 99 139 28 34 282 286 201 194
230 Texas A&M University–Commerce (TX)* 249 46 182 90 60 37 286 276 255 285 257 202 159 279 276 201 194
231 Ohio University–Main (OH)* 134 20 262 18 158 206 250 268 153 162 153 147 159 158 110 201 194
232 Liberty University (VA) 226 22 141 29 125 262 249 16 275 294 267 261 159 276 201 201 194
233 Wichita State University (KS)* 255 233 45 51 148 135 232 222 151 239 187 223 159 270 286 201 194
234 South Dakota State University (SD)* 183 114 224 275 226 160 92 69 146 194 175 257 159 165 106 201 194
235 University of Alabama–Huntsville (AL)* 236 264 29 49 264 174 245 248 128 138 191 167 148 260 192 131 191
236 University of West Florida (FL)* 240 235 126 99 273 53 230 178 210 180 261 262 159 122 17 201 194
237 University of Dayton (OH) 82 173 293 299 132 282 31 168 134 111 220 262 159 68 43 175 67
238 Northeastern University (MA) 61 278 164 118 280 260 90 195 118 129 90 82 115 82 175 119 178
239 Fairleigh Dickinson U.–Metro. (NJ) 233 6 298 95 85 200 202 18 274 292 238 241 159 282 285 201 194
240 Kennesaw State University (GA)* 258 283 103 227 123 169 248 240 252 291 265 217 159 217 216 116 121
241 University of Texas–San Antonio (TX)* 300 303 51 82 198 51 263 278 172 266 162 196 159 236 35 102 97
242 Eastern Michigan University (MI)* 284 285 91 151 186 102 265 215 243 225 244 239 159 241 141 170 190
243 SUNY Coll. of Envir. Science & Forestry (NY)* 112 148 250 265 303 163 125 265 201 52 201 262 159 1 229 157 10
244 Wilmington University (DE) 293 90 291 11 90 171 272 15 275 297 267 250 159 282 265 201 194
245 University of St. Thomas (MN) 91 32 279 301 95 280 36 135 266 160 267 256 159 111 18 201 194
246 University of North Dakota (ND)* 203 250 286 285 103 173 97 113 139 169 180 185 159 203 33 201 194
247 University of Miami (FL) 57 177 198 181 295 279 116 170 57 69 103 79 69 72 219 143 152
248 Trevecca Nazarene University (TN) 215 40 76 83 248 207 211 114 275 263 267 262 159 282 252 201 194
249 St. John’s University–New York (NY) 176 163 247 184 41 287 234 274 259 273 202 262 159 205 184 27 77
250 Benedictine University (IL) 208 167 203 114 162 205 192 177 270 244 265 262 159 282 269 76 186
251 Texas A&M University–Corpus Christi (TX)* 279 258 153 105 150 150 244 219 211 175 254 262 159 180 38 201 194
252 Georgia Southern University (GA)* 214 293 104 259 213 185 240 214 221 284 267 260 159 171 104 85 148
253 Valdosta State University (GA)* 276 295 94 246 64 158 268 142 269 287 267 249 159 174 64 201 194
254 New Mexico State University–Main (NM)* 251 183 111 20 276 43 280 290 109 151 134 154 159 199 66 201 194
255 Lamar University (TX)* 294 200 162 110 58 187 289 283 254 269 240 211 159 267 284 167 132
256 North Carolina A&T State University (NC)* 250 28 48 296 217 24 300 277 178 187 195 225 159 271 23 201 194
257 Texas Christian University (TX) 88 270 294 228 196 266 107 235 235 132 243 184 159 226 30 67 91
258 University of Hawaii–Manoa (HI)* 185 256 215 136 297 44 128 280 65 159 95 108 79 100 69 201 194
NAtIONAL UNIVeRsItIessOCIAL MObILItY
Graduation rate rank
Pell perfo
rmance rank
Grad rate perform
ance rank
First-gen perfo
rmance rank
Earnings perform
ance rank
Net price rank
Repayment rank
Repayment rate perfo
rmance rank
ReseARCh
Research expenditu
res rank
Bachelor’s to PhD rank
Science & engineering PhDs rank
Faculty in National Academies ra
nk
ROTC rank
Peace Corps rank
% of federal w
ork-study funds
spent on service rank
Community service rank
seRVICe
Faculty awards ra
nk

92 September/October 2016
259 North Dakota State University–Main (ND)* 199 286 275 293 182 132 59 112 104 172 135 121 159 233 105 201 194
260 University of Alabama (AL)* 127 272 261 160 236 225 216 286 159 196 124 171 159 212 128 31 52
261 Suffolk University (MA) 191 92 290 258 111 275 163 118 262 289 214 251 159 220 266 42 168
262 Morgan State University (MD)* 297 124 14 268 91 152 301 247 216 157 226 145 159 264 96 201 194
263 Jackson State University (MS)* 261 15 12 277 232 156 302 269 175 161 209 262 159 282 19 201 194
264 Clark Atlanta University (GA) 277 48 10 297 55 300 296 11 231 94 231 203 159 74 186 201 194
265 Cleveland State University (OH)* 288 269 67 46 175 196 278 217 147 251 204 162 159 254 244 150 194
266 Wayne State University (MI)* 296 292 17 63 97 92 290 302 80 207 81 117 126 211 262 201 194
267 University of Akron–Main (OH)* 274 195 50 17 201 202 283 288 143 214 120 172 142 225 172 194 194
268 University of Missouri–Kansas City (MO)* 231 255 210 103 219 215 254 266 188 211 166 226 159 80 249 201 38
269 University of Northern Colorado (CO)* 241 299 245 180 86 192 178 166 248 189 200 227 159 104 176 201 194
270 Idaho State University (ID)* 298 240 20 101 173 170 276 294 202 197 211 160 159 251 221 201 194
271 Grand Canyon University (AZ)° 299 99 62 6 31 268 291 264 275 296 267 262 159 281 236 193 194
272 Oakland University (MI)* 254 288 271 107 151 67 224 242 215 278 208 238 159 230 277 152 194
273 Spalding University (KY) 282 171 170 129 167 201 261 80 275 270 267 262 159 282 247 201 194
274 University of South Alabama (AL)* 286 301 70 67 188 94 281 270 169 205 227 119 159 239 56 201 194
275 Texas Wesleyan University (TX) 278 164 114 54 47 224 285 279 275 171 267 262 159 282 230 201 194
276 Univ. of MD Eastern Shore (MD)* 291 87 168 264 30 133 298 256 234 193 249 262 159 175 281 201 194
277 Southern Methodist University (TX) 77 225 177 175 229 258 127 255 190 131 174 169 100 102 239 201 194
278 University of West Georgia (GA)* 273 247 165 249 177 120 267 97 257 265 267 262 159 272 278 201 194
279 Argosy University–Phoenix Online (AZ)° 303 287 16 137 10 303 277 9 275 298 267 262 159 282 286 201 194
280 Immaculata University (PA) 196 1 303 158 87 289 204 19 275 282 267 262 159 282 286 201 194
281 Prairie View A&M University (TX)* 285 100 98 298 279 33 299 272 223 227 258 240 159 266 15 201 188
282 Texas A&M University–Kingsville (TX)* 290 242 52 36 240 46 287 299 207 279 245 255 159 282 171 201 194
283 American International College (MA) 271 134 197 255 81 221 270 210 275 277 267 262 159 244 220 201 194
284 Baylor University (TX) 92 244 190 221 171 291 149 252 220 77 171 252 159 192 21 201 194
285 University of Louisiana–Monroe (LA)* 280 253 93 42 190 14 292 300 256 241 234 262 159 280 256 201 194
286 Boise State University (ID)* 287 284 97 115 268 143 233 259 189 281 248 138 159 129 185 201 194
287 Nova Southeastern University (FL) 256 267 65 40 256 272 274 207 224 283 116 262 159 282 286 130 136
288 Dallas Baptist University (TX) 194 132 287 192 260 234 262 285 275 195 267 262 159 282 258 115 15
289 Gardner-Webb University (NC) 213 161 300 126 208 239 255 227 275 206 267 262 159 232 151 155 99
290 University of Arkansas at Little Rock (AR)* 301 300 77 21 277 75 293 297 226 271 194 216 117 206 273 36 160
291 Lipscomb University (TN) 160 274 216 193 299 230 167 234 275 136 267 262 159 156 198 196 68
292 University of Tulsa (OK) 113 201 254 148 301 256 185 258 200 48 204 137 87 167 279 178 53
293 Lindenwood University (MO) 247 294 206 86 157 245 239 155 275 293 267 262 159 274 200 201 194
294 Catholic University of America (DC) 118 209 302 302 106 302 47 157 198 72 195 152 159 55 70 53 194
295 University of Hartford (CT) 186 202 295 279 239 286 176 158 261 250 267 245 159 256 280 176 108
296 Biola University (CA) 125 215 154 274 289 294 52 161 275 118 249 262 159 177 213 201 194
297 Hofstra University (NY) 157 298 272 247 170 297 184 291 253 224 224 235 159 195 179 59 74
298 The New School (NY) 145 154 281 290 144 301 171 232 237 274 151 128 159 183 286 201 194
299 University of New Orleans (LA)* 292 302 277 43 300 21 279 284 195 137 184 157 159 179 226 201 194
300 Shenandoah University (VA) 242 290 301 280 227 270 199 249 275 247 267 262 159 151 286 165 95
301 Lesley University (MA) 220 289 280 283 270 298 210 293 273 253 267 262 159 90 286 144 9
302 Andrews University (MI) 168 191 288 303 302 222 228 295 268 59 261 213 159 259 286 201 194
303 Texas Southern University (TX)* 302 296 63 272 275 214 303 303 240 267 231 218 159 253 227 201 194
NAtIONAL UNIVeRsItIessOCIAL MObILItY
Graduation rate rank
Pell perfo
rmance rank
Grad rate perform
ance rank
First-gen perfo
rmance rank
Earnings perform
ance rank
Net price rank
Repayment rank
Repayment rate perfo
rmance rank
ReseARCh
Research expenditu
res rank
Bachelor’s to PhD rank
Science & engineering PhDs rank
Faculty in National Academies ra
nk
ROTC rank
Peace Corps rank
% of federal w
ork-study funds
spent on service rank
Community service rank
seRVICe
Faculty awards ra
nk

94 September/October 2016
1 Berea College (KY) 144 4 1 6 9 1 178 4 143 95 106 139 20 23
2 Harvey Mudd College (CA) 21 206 32 38 2 46 1 103 20 1 112 86 9 134
3 Amherst College (MA) 2 57 21 12 14 3 117 37 11 11 131 111 138 134
4 Williams College (MA) 1 81 28 22 17 6 66 66 12 6 125 116 138 134
5 Haverford College (PA) 6 87 58 27 122 14 73 72 28 5 26 139 100 96
6 Bryn Mawr College (PA) 49 211 95 142 121 67 81 208 2 12 43 139 1 3
7 Washington and Lee University (VA) 24 179 172 170 1 28 49 172 69 88 114 45 8 33
8 Pomona College (CA) 3 92 31 3 223 4 118 60 17 7 90 120 130 118
9 Colgate University (NY) 17 151 129 61 7 30 11 73 27 36 88 139 16 124
10 Swarthmore College (PA) 7 165 43 36 225 37 21 89 21 2 63 139 125 38
11 Wesleyan University (CT) 13 128 65 34 169 33 70 105 5 14 58 139 84 121
12 Davidson College (NC) 9 53 165 185 29 19 5 42 42 25 110 38 94 9
13 Knox College (IL) 57 15 56 92 114 116 112 83 143 65 2 139 3 41
14 Carleton College (MN) 8 169 78 96 235 56 35 204 9 3 3 139 76 70
15 Bowdoin College (ME) 4 117 82 45 160 10 17 52 15 17 23 139 138 134
16 Middlebury College (VT) 5 129 162 87 141 23 25 124 32 31 13 137 23 97
17 Wellesley College (MA) 15 130 39 66 165 25 29 194 3 13 68 60 138 134
18 Ripon College (WI) 108 11 53 25 28 103 106 20 143 100 62 9 61 42
19 Grinnell College (IA) 27 121 25 68 207 38 61 109 18 10 7 139 138 134
20 New College of Florida (FL)* 120 180 19 46 64 9 164 126 64 9 93 139 138 134
21 Colby College (ME) 16 88 181 117 26 16 22 94 43 27 22 134 138 134
22 Agnes Scott College (GA) 112 33 30 174 23 123 176 26 81 46 29 90 22 130
23 Bates College (ME) 19 105 163 140 110 34 12 74 34 42 47 139 64 12
24 McDaniel College (MD) 109 19 113 52 51 75 74 7 143 151 72 6 32 55
25 University of Richmond (VA) 43 133 124 60 50 41 71 64 16 64 86 39 92 63
LIbeRAL ARts COLLeGes
SoCial MoBility: The first column shows the percentage of students graduating within six years, and the second column shows the predicted rate of
graduation (based on incoming ACT/SAT scores, Pell Grant percentages, and other measures; see our full methodology on page 114). The third and fourth
columns show the difference between the actual and predicted percentages of Pell Grant recipients and first-generation students based on ACT/SAT scores
and the percentage of students admitted. The fifth column shows the difference between actual and predicted earnings of all students (dropouts and
graduates) ten years after starting college after controlling for student demographics and majors, living costs, and other factors. The sixth column shows the
net price of attending that institution, or the average price that first-time, full-time students who have a family income below $75,000 per year and receive
financial aid to pay for college after subtracting need-based financial aid. The final two columns reflect the actual and predicted performance of the
percentage of students who repaid at least $1 in principal on their loans within five years of entering repayment.
reSearCh: The first column shows total research expenditures. The second shows the school’s ranking in the number of bachelor’s recipients who go on
to receive PhDs, relative to school size.
ServiCe: The first column ranks the school by the number of alumni who go on to serve in the Peace Corps, relative to school size. The second column ranks
the school by the percentage of students who serve in ROTC. The third gives the percentage of funds in federal work-study money that goes to community
service (versus non-community service). The fourth column shows the school’s rank on a combined measure of the number of students participating in
community service and the total number of service hours performed, both relative to school size. The fifth column shows the school’s rank on a combined
measure of the percent of students doing community service, the number of hours of community service per student, whether any staff were employed in
community service, if any service courses were offered, or if the institution provides scholarships for community service.
*Public institution
°For-profit institution
sOCIAL MObILItY
Graduation rate rank
Pell perfo
rmance rank
Grad rate perform
ance rank
First-gen perfo
rmance rank
Earnings perform
ance rank
Net price rank
Repayment rank
Repayment rate perfo
rmance rank
ROTC rank
Peace Corps rank
% of federal w
ork-study funds
spent on service rank
Community service rank
seRVICeReseARCh
Research expenditu
res rank
Bachelor’s to PhD rank
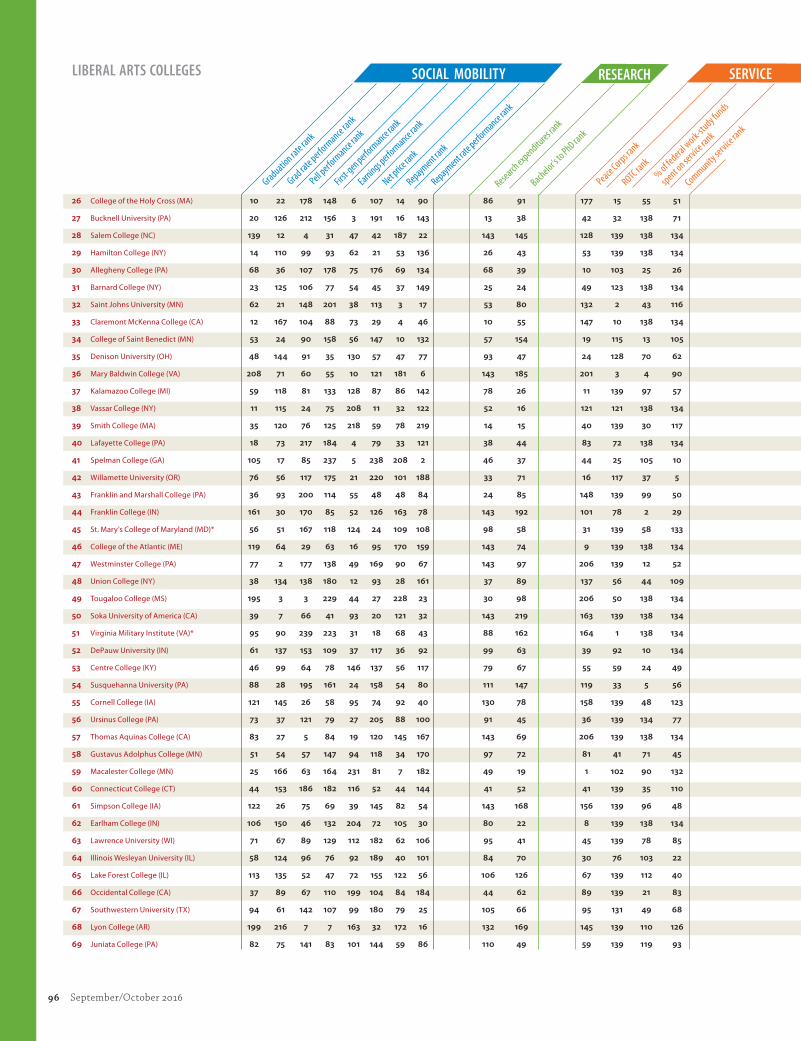
96 September/October 2016
26 College of the Holy Cross (MA) 10 22 178 148 6 107 14 90 86 91 177 15 55 51
27 Bucknell University (PA) 20 126 212 156 3 191 16 143 13 38 42 32 138 71
28 Salem College (NC) 139 12 4 31 47 42 187 22 143 145 128 139 138 134
29 Hamilton College (NY) 14 110 99 93 62 21 53 136 26 43 53 139 138 134
30 Allegheny College (PA) 68 36 107 178 75 176 69 134 68 39 10 103 25 26
31 Barnard College (NY) 23 125 106 77 54 45 37 149 25 24 49 123 138 134
32 Saint Johns University (MN) 62 21 148 201 38 113 3 17 53 80 132 2 43 116
33 Claremont McKenna College (CA) 12 167 104 88 73 29 4 46 10 55 147 10 138 134
34 College of Saint Benedict (MN) 53 24 90 158 56 147 10 132 57 154 19 115 13 105
35 Denison University (OH) 48 144 91 35 130 57 47 77 93 47 24 128 70 62
36 Mary Baldwin College (VA) 208 71 60 55 10 121 181 6 143 185 201 3 4 90
37 Kalamazoo College (MI) 59 118 81 133 128 87 86 142 78 26 11 139 97 57
38 Vassar College (NY) 11 115 24 75 208 11 32 122 52 16 121 121 138 134
39 Smith College (MA) 35 120 76 125 218 59 78 219 14 15 40 139 30 117
40 Lafayette College (PA) 18 73 217 184 4 79 33 121 38 44 83 72 138 134
41 Spelman College (GA) 105 17 85 237 5 238 208 2 46 37 44 25 105 10
42 Willamette University (OR) 76 56 117 175 21 220 101 188 33 71 16 117 37 5
43 Franklin and Marshall College (PA) 36 93 200 114 55 48 48 84 24 85 148 139 99 50
44 Franklin College (IN) 161 30 170 85 52 126 163 78 143 192 101 78 2 29
45 St. Mary’s College of Maryland (MD)* 56 51 167 118 124 24 109 108 98 58 31 139 58 133
46 College of the Atlantic (ME) 119 64 29 63 16 95 170 159 143 74 9 139 138 134
47 Westminster College (PA) 77 2 177 138 49 169 90 67 143 97 206 139 12 52
48 Union College (NY) 38 134 138 180 12 93 28 161 37 89 137 56 44 109
49 Tougaloo College (MS) 195 3 3 229 44 27 228 23 30 98 206 50 138 134
50 Soka University of America (CA) 39 7 66 41 93 20 121 32 143 219 163 139 138 134
51 Virginia Military Institute (VA)* 95 90 239 223 31 18 68 43 88 162 164 1 138 134
52 DePauw University (IN) 61 137 153 109 37 117 36 92 99 63 39 92 10 134
53 Centre College (KY) 46 99 64 78 146 137 56 117 79 67 55 59 24 49
54 Susquehanna University (PA) 88 28 195 161 24 158 54 80 111 147 119 33 5 56
55 Cornell College (IA) 121 145 26 58 95 74 92 40 130 78 158 139 48 123
56 Ursinus College (PA) 73 37 121 79 27 205 88 100 91 45 36 139 134 77
57 Thomas Aquinas College (CA) 83 27 5 84 19 120 145 167 143 69 206 139 138 134
58 Gustavus Adolphus College (MN) 51 54 57 147 94 118 34 170 97 72 81 41 71 45
59 Macalester College (MN) 25 166 63 164 231 81 7 182 49 19 1 102 90 132
60 Connecticut College (CT) 44 153 186 182 116 52 44 144 41 52 41 139 35 110
61 Simpson College (IA) 122 26 75 69 39 145 82 54 143 168 156 139 96 48
62 Earlham College (IN) 106 150 46 132 204 72 105 30 80 22 8 139 138 134
63 Lawrence University (WI) 71 67 89 129 112 182 62 106 95 41 45 139 78 85
64 Illinois Wesleyan University (IL) 58 124 96 76 92 189 40 101 84 70 30 76 103 22
65 Lake Forest College (IL) 113 135 52 47 72 155 122 56 106 126 67 139 112 40
66 Occidental College (CA) 37 89 67 110 199 104 84 184 44 62 89 139 21 83
67 Southwestern University (TX) 94 61 142 107 99 180 79 25 105 66 95 131 49 68
68 Lyon College (AR) 199 216 7 7 163 32 172 16 132 169 145 139 110 126
69 Juniata College (PA) 82 75 141 83 101 144 59 86 110 49 59 139 119 93
LIbeRAL ARts COLLeGes sOCIAL MObILItY
Graduation rate rank
Pell perfo
rmance rank
Grad rate perform
ance rank
First-gen perfo
rmance rank
Earnings perform
ance rank
Net price rank
Repayment rank
Repayment rate perfo
rmance rank
ROTC rank
Peace Corps rank
% of federal w
ork-study funds
spent on service rank
Community service rank
seRVICeReseARCh
Research expenditu
res rank
Bachelor’s to PhD rank

98 September/October 2016
70 Houghton College (NY) 103 14 22 112 53 157 110 93 143 117 82 57 138 134
71 Wabash College (IN) 102 32 151 130 11 174 128 48 56 87 54 139 138 134
72 Linfield College–McMinnville (OR) 114 45 179 33 32 193 55 45 126 130 97 139 104 47
73 Dickinson College (PA) 40 140 213 218 87 114 65 201 45 102 12 11 60 54
74 Alfred University (NY) 157 138 72 131 20 90 165 133 7 141 195 85 79 134
75 Dillard University (LA) 222 171 16 116 74 82 222 3 6 121 199 47 138 134
76 Moravian Coll./Moravian Theo. Sem. (PA) 97 6 192 95 34 195 111 51 143 155 159 70 34 125
77 Monmouth College (IL) 172 50 118 53 80 50 182 38 143 164 144 139 75 104
78 Reed College (OR) 66 228 35 89 239 91 51 138 31 4 5 97 138 134
79 Illinois College (IL) 126 18 202 49 151 55 140 18 143 166 196 139 56 14
80 Centenary College of Louisiana (LA) 181 218 44 32 67 100 123 8 143 79 206 139 128 108
81 Hanover College (IN) 115 39 156 80 15 105 133 79 143 81 73 139 138 134
82 John Carroll University (OH) 90 41 86 122 66 141 98 118 100 134 165 17 111 58
83 Whittier College (CA) 127 8 136 39 179 190 166 13 121 125 77 139 33 89
84 Hobart William Smith Colleges (NY) 72 177 143 214 98 171 85 180 48 158 38 139 6 24
85 Trinity College (CT) 41 114 218 172 57 40 42 55 35 92 140 110 138 134
86 Lewis & Clark College (OR) 81 160 62 151 220 216 30 114 19 73 35 87 26 1
87 Oberlin College (OH) 31 217 135 154 238 66 39 198 46 8 37 139 27 36
88 St. Olaf College (MN) 30 123 108 194 209 71 9 186 54 35 61 139 133 69
89 Saint Norbert College (WI) 93 69 161 62 147 128 96 125 128 143 96 27 18 30
90 College of Idaho (ID) 142 20 69 19 190 78 132 9 143 171 32 81 138 134
91 Univ. of Science & Arts of Okla. (OK)* 213 77 79 9 58 2 217 113 143 183 192 139 138 134
92 Albion College (MI) 98 72 169 144 68 159 114 116 67 51 152 139 62 95
93 Gettysburg College (PA) 45 147 198 195 81 94 15 147 70 111 48 69 113 67
94 Whitman College (WA) 29 80 171 193 232 209 31 176 76 21 14 139 7 91
95 Hiram College (OH) 141 10 80 18 186 185 179 21 143 106 146 112 126 59
96 Austin College (TX) 87 34 77 91 177 156 125 104 120 54 60 139 118 127
97 Georgetown College (KY) 174 178 55 42 60 88 144 47 143 150 197 61 124 106
98 Hollins University (VA) 163 139 70 56 71 143 197 203 143 113 25 139 80 80
99 Wheaton College (IL) 26 62 18 183 227 92 2 163 61 33 94 8 138 134
100 Maryville College (TN) 183 143 36 20 175 53 196 128 143 131 142 139 123 19
101 Drury University (MO) 182 31 2 1 139 181 218 230 143 182 170 101 131 134
102 Transylvania University (KY) 100 122 20 54 173 115 52 62 143 68 102 80 138 134
103 Oglethorpe University (GA) 177 207 17 90 30 119 205 193 143 132 104 125 108 75
104 College of Wooster (OH) 85 172 97 102 168 68 80 63 59 50 46 139 138 134
105 Westminster College (MO) 116 58 139 70 183 140 138 50 143 120 155 139 28 60
106 Sewanee–University of the South (TN) 64 136 100 126 134 47 148 205 62 82 34 139 138 134
107 Kenyon College (OH) 22 84 216 188 219 35 50 171 71 29 15 139 138 134
108 Claflin University (SC) 205 16 13 197 127 124 226 27 23 215 206 18 46 76
109 Univ. of Pittsburgh–Greensburg (PA)* 194 112 48 212 18 63 136 76 143 214 186 34 138 113
110 Furman University (SC) 47 43 185 190 133 217 13 68 36 48 111 16 47 131
111 Muhlenberg College (PA) 34 40 236 159 65 165 19 98 114 129 157 122 74 74
112 Stonehill College (MA) 50 25 230 200 25 215 27 153 127 167 69 48 86 17
113 Hope College (MI) 67 63 111 127 167 110 23 102 22 90 108 132 138 134
LIbeRAL ARts COLLeGes sOCIAL MObILItY
Graduation rate rank
Pell perfo
rmance rank
Grad rate perform
ance rank
First-gen perfo
rmance rank
Earnings perform
ance rank
Net price rank
Repayment rank
Repayment rate perfo
rmance rank
ROTC rank
Peace Corps rank
% of federal w
ork-study funds
spent on service rank
Community service rank
seRVICeReseARCh
Research expenditu
res rank
Bachelor’s to PhD rank

100 September/October 2016
114 University of Minnesota–Morris (MN)* 143 181 84 169 132 22 152 187 55 124 135 139 51 134
115 Rhodes College (TN) 60 185 102 123 152 188 103 177 131 77 138 62 68 2
116 Elizabethtown College (PA) 92 35 201 24 136 198 67 44 137 139 133 139 134 8
117 Goucher College (MD) 131 168 174 202 83 200 60 57 122 112 18 79 63 78
118 Saint Mary’s College (IN) 80 76 103 152 63 146 8 107 143 108 107 21 138 134
119 Wittenberg University (OH) 136 197 54 40 138 212 135 165 123 83 64 139 31 31
120 Doane College–Crete (NE) 155 113 94 37 86 173 134 71 63 173 176 127 52 122
121 Fisk University (TN) 200 68 51 239 115 179 224 14 1 57 118 51 138 134
122 Penn State–Greater Allegheny (PA)* 207 96 109 198 13 70 160 5 66 219 206 139 138 134
123 Mount Holyoke College (MA) 54 192 101 145 158 101 41 175 143 18 71 105 138 134
124 Pitzer College (CA) 42 86 224 149 205 102 120 135 113 84 56 126 53 16
125 Alma College (MI) 146 161 112 100 41 130 146 199 143 122 183 98 106 28
126 Augustana College (IL) 79 95 193 106 91 162 115 185 87 109 116 139 83 65
127 Univ. of Wisconsin–Green Bay (WI)* 198 187 120 8 144 31 87 11 60 201 200 100 138 134
128 Wells College (NY) 171 59 38 139 82 136 194 120 143 153 21 139 138 134
129 Scripps College (CA) 33 175 123 97 191 142 6 169 112 28 28 84 138 134
130 Presbyterian College (SC) 125 116 229 233 189 44 43 19 143 149 124 5 101 18
131 Washington & Jefferson College (PA) 84 78 209 108 149 202 102 130 74 116 78 24 15 86
132 Manhattanville College (NY) 166 111 159 104 42 183 159 24 143 199 190 133 40 100
133 Coe College (IA) 117 154 110 120 166 150 89 110 89 101 126 36 41 107
134 Assumption College (MA) 96 48 187 119 59 194 77 87 143 195 168 74 127 34
135 Massachusetts Coll. of Liberal Arts (MA)* 193 91 115 67 202 39 193 123 143 213 122 139 45 25
136 Judson College (AL) 217 163 45 21 76 69 216 209 143 128 206 20 57 98
137 Lycoming College (PA) 145 49 190 94 117 133 151 97 138 127 181 44 81 87
138 St. John’s College (MD) 123 222 8 115 35 219 173 224 143 20 166 139 138 134
139 Skidmore College (NY) 32 55 228 225 210 54 57 173 40 75 130 139 88 111
140 Millsaps College (MS) 128 183 189 81 195 170 186 179 90 23 85 30 107 13
141 Wofford College (SC) 55 23 164 222 153 154 46 75 143 103 162 4 89 134
142 Le Moyne College (NY) 104 13 176 191 123 166 147 151 143 174 205 64 38 92
143 Heidelberg University (OH) 196 164 73 23 85 153 192 139 58 191 136 88 134 94
144 Emory and Henry College (VA) 203 190 175 103 108 85 189 99 143 152 194 139 42 4
145 Northland College (WI) 190 189 41 98 215 61 175 141 143 93 4 139 138 134
146 Saint Mary’s College of California (CA) 151 141 154 86 8 233 158 115 143 188 153 94 11 82
147 Univ. of NH–Manchester (NH)* 156 5 234 236 88 86 76 31 143 219 161 139 138 114
148 Central College (IA) 124 108 183 192 148 129 119 181 143 148 139 139 59 7
149 Bethel College–North Newton (KS) 179 131 92 213 154 139 169 61 143 114 206 139 50 37
150 Siena College (NY) 74 29 208 219 131 192 83 178 39 177 169 37 73 27
151 Wesleyan College (GA) 187 83 233 48 100 49 219 189 143 94 206 114 54 21
152 Beloit College (WI) 63 74 116 157 222 111 107 160 142 30 52 139 138 134
153 Penn State–Beaver (PA)* 209 42 194 167 45 60 160 15 72 219 206 139 138 134
154 Guilford College (NC) 169 65 23 43 126 206 211 212 143 159 150 129 95 72
155 Wartburg College (IA) 129 149 184 208 137 172 91 119 143 135 99 139 134 15
156 Whitworth University (WA) 86 94 149 111 201 196 95 154 135 138 70 52 117 20
157 Westmont College (CA) 75 47 150 153 40 226 20 85 96 123 151 104 138 134
LIbeRAL ARts COLLeGes sOCIAL MObILItY
Graduation rate rank
Pell perfo
rmance rank
Grad rate perform
ance rank
First-gen perfo
rmance rank
Earnings perform
ance rank
Net price rank
Repayment rank
Repayment rate perfo
rmance rank
ROTC rank
Peace Corps rank
% of federal w
ork-study funds
spent on service rank
Community service rank
seRVICeReseARCh
Research expenditu
res rank
Bachelor’s to PhD rank

102 September/October 2016
158 Saint Vincent College (PA) 99 9 226 206 170 132 108 70 143 140 87 139 115 134
159 Univ. of Virginia’s College–Wise (VA)* 214 101 204 30 120 7 202 65 141 207 203 29 138 134
160 William Jewell College (MO) 147 199 147 65 203 178 116 81 143 133 65 96 102 11
161 Fort Lewis College (CO)* 221 119 140 71 78 43 213 91 83 187 74 139 138 134
162 Saint Michael’s College (VT) 65 66 191 196 211 214 18 137 51 157 17 77 114 43
163 Shepherd University (WV)* 216 231 180 11 155 13 200 157 101 203 173 139 98 101
164 Birmingham Southern College (AL) 140 223 158 134 196 138 167 150 143 61 57 46 65 64
165 University of Wisconsin–Parkside (WI)* 232 227 98 17 181 17 204 156 119 209 180 113 66 66
166 Albright College (PA) 189 191 128 16 142 199 157 10 143 179 206 136 72 119
167 Spring Hill College (AL) 167 210 166 82 164 99 199 196 143 165 143 53 17 32
168 Ohio Wesleyan University (OH) 134 214 152 162 180 221 143 202 115 56 92 82 14 35
169 Bethany College (WV) 202 106 214 150 33 160 198 29 143 176 206 139 116 120
170 SUNY Potsdam (NY)* 191 201 59 135 113 36 180 190 118 172 175 31 138 134
171 William Peace University (NC) 223 195 68 211 77 135 155 1 143 219 206 40 138 134
172 Saint Anselm College (NH) 89 82 221 204 43 223 38 168 143 161 171 73 93 79
173 Sarah Lawrence College (NY) 91 209 173 230 22 229 94 220 143 59 141 83 39 112
174 Bridgewater College (VA) 164 186 238 99 96 127 129 59 143 180 123 124 129 39
175 Wheaton College (MA) 70 79 144 179 143 210 26 95 104 118 76 119 138 134
176 Colorado College (CO) 28 173 222 215 236 64 58 214 50 40 50 135 132 46
177 St. Lawrence University (NY) 52 162 127 171 206 109 97 210 129 99 33 63 138 134
178 University of Puget Sound (WA) 78 146 93 163 90 235 24 192 85 76 6 138 138 134
179 Univ. of North Carolina–Asheville (NC)* 159 213 47 128 230 15 188 227 29 156 75 139 138 134
180 Randolph-Macon College (VA) 160 204 227 160 105 201 104 39 143 86 167 58 122 84
181 Hendrix College (AR) 107 203 33 44 226 167 141 166 73 53 79 89 138 134
182 Penn State–Berks (PA)* 178 52 197 141 48 152 160 49 125 219 206 95 138 134
183 Elmira College (NY) 162 97 105 59 79 207 174 183 143 178 80 13 138 134
184 Bryn Athyn Coll. of the New Church (PA) 201 198 211 146 70 12 203 112 116 219 206 139 138 134
185 Concordia College–Moorhead (MN) 110 156 131 221 176 108 63 197 117 115 84 67 138 134
186 Randolph College (VA) 197 233 134 181 36 161 126 69 143 119 120 139 138 134
187 Martin University (IN) 238 60 10 15 46 122 231 34 143 219 206 139 138 134
188 Alice Lloyd College (KY) 218 188 49 5 157 26 215 215 143 219 206 139 138 134
189 University of Maine–Machias (ME)* 230 104 207 28 172 8 207 58 108 219 206 139 138 134
190 Covenant College (GA) 168 229 34 232 109 134 127 207 143 142 51 139 138 134
191 Fairleigh Dick. U.–Coll. Florham (NJ) 180 100 188 14 107 177 191 41 143 200 204 130 138 134
192 Hartwick College (NY) 173 194 74 105 118 208 149 96 136 144 66 139 138 134
193 Erskine College and Seminary (SC) 175 70 206 238 161 98 100 12 143 110 206 139 138 134
194 Sweet Briar College (VA) 152 107 219 187 119 204 93 28 82 136 103 139 138 134
195 Morehouse College (GA) 185 103 37 234 171 237 229 146 4 104 113 7 87 53
196 Luther College (IA) 69 102 168 216 188 186 64 211 107 60 91 139 138 134
197 Bloomfield College (NJ) 224 85 88 57 103 148 223 35 143 219 206 139 120 128
198 Arcadia University (PA) 150 159 132 73 129 211 156 152 77 208 109 107 138 103
199 Mount St. Mary’s University (MD) 135 132 231 173 102 224 72 33 143 196 202 12 121 88
200 University of Pittsburgh–Johnstown (PA)* 186 196 205 209 69 97 136 174 143 181 184 68 138 129
201 Ouachita Baptist University (AR) 165 202 130 121 162 83 177 162 124 160 174 35 138 134
LIbeRAL ARts COLLeGes sOCIAL MObILItY
Graduation rate rank
Pell perfo
rmance rank
Grad rate perform
ance rank
First-gen perfo
rmance rank
Earnings perform
ance rank
Net price rank
Repayment rank
Repayment rate perfo
rmance rank
ROTC rank
Peace Corps rank
% of federal w
ork-study funds
spent on service rank
Community service rank
seRVICeReseARCh
Research expenditu
res rank
Bachelor’s to PhD rank

104 September/October 2016
202 Pine Manor College (MA) 226 127 126 29 61 77 221 217 143 219 100 139 138 134
203 Marlboro College (VT) 153 46 61 177 228 231 139 111 143 32 27 139 138 134
204 Meredith College (NC) 154 109 210 205 111 187 99 53 143 175 160 108 138 134
205 Southern Virginia University (VA) 229 236 9 165 89 131 171 82 143 219 182 19 138 134
206 Bethany Lutheran College (MN) 192 193 42 228 185 62 131 131 143 219 206 66 138 134
207 Lynchburg College (VA) 176 148 232 189 150 175 168 129 143 194 134 139 69 81
208 Virginia Wesleyan College (VA) 204 212 122 101 84 197 183 36 143 189 172 23 138 134
209 Hampden-Sydney College (VA) 133 152 237 226 159 151 130 88 140 107 105 14 138 134
210 Roanoke College (VA) 137 155 215 186 193 222 113 148 102 170 154 139 82 73
211 Gordon College (MA) 101 142 196 227 221 213 45 164 133 137 115 49 67 115
212 Schreiner University (TX) 219 224 71 50 145 96 212 228 143 218 206 139 36 134
213 Warren Wilson College (NC) 188 232 83 224 237 168 154 191 143 163 20 139 91 6
214 Davis & Elkins College (WV) 210 176 157 4 217 65 209 155 143 204 187 139 138 134
215 Washington College (MD) 111 184 235 155 174 203 75 127 143 146 117 139 138 134
216 Hampshire College (MA) 118 219 133 220 224 225 150 225 94 34 129 106 29 134
217 University of Pikeville (KY) 228 220 27 2 200 76 220 231 143 219 206 43 138 134
218 LaGrange College (GA) 206 221 146 124 97 149 210 195 143 205 188 139 138 134
219 Bethune-Cookman University (FL) 215 38 14 137 104 112 236 236 143 212 206 42 138 134
220 SUNY–Purchase College (NY)* 149 182 220 210 197 73 184 213 65 198 178 139 138 134
221 Eckerd College (FL) 138 158 199 166 229 227 185 226 103 96 98 109 77 44
222 Carthage College (WI) 148 174 145 74 182 230 142 145 134 184 185 118 138 134
223 Emmanuel College (MA) 158 215 225 176 192 232 153 206 143 202 127 75 19 61
224 Allen University (SC) 234 157 6 51 233 58 235 158 143 219 206 71 138 134
225 West Virginia State University (WV)* 236 235 182 13 214 5 225 237 8 216 191 26 138 134
226 Johnson C. Smith University (NC) 211 44 125 217 140 164 232 234 139 211 206 54 85 102
227 Bennington College (VT) 130 225 114 231 213 218 124 218 143 105 149 139 138 134
228 Philander Smith College (AR) 220 98 12 72 212 84 237 233 92 219 179 91 138 134
229 Stillman College (AL) 235 230 11 136 125 125 233 223 143 186 206 93 138 134
230 Virginia Union University (VA) 231 170 119 207 194 163 230 140 143 190 206 28 109 99
231 King’s College (NY) 170 208 87 143 135 228 190 222 143 217 206 55 138 134
232 Cheyney University of PA (PA)*# 233 205 40 113 184 51 238 232 109 210 198 99 138 134
233 Ave Maria University (FL) 184 200 137 199 198 106 214 235 143 219 206 139 138 134
234 Holy Cross College (IN) 227 237 160 203 178 89 201 200 143 219 206 65 138 134
235 Paine College (GA) 237 226 50 235 156 80 234 229 75 206 189 22 138 134
236 Thiel College (PA) 225 234 155 64 216 184 206 221 143 193 206 139 138 134
237 Marymount Manhattan College (NY) 212 239 203 168 106 236 195 216 143 197 193 139 138 134
238 American Jewish University (CA) 132 1 223 26 187 239 227 239 143 219 206 139 138 134
239 East-West University (IL) 239 238 15 10 234 234 239 238 143 219 206 139 138 134
LIbeRAL ARts COLLeGes sOCIAL MObILItY
Graduation rate rank
Pell perfo
rmance rank
Grad rate perform
ance rank
First-gen perfo
rmance rank
Earnings perform
ance rank
Net price rank
Repayment rank
Repayment rate perfo
rmance rank
ROTC rank
Peace Corps rank
% of federal w
ork-study funds
spent on service rank
Community service rank
seRVICeReseARCh
Research expenditu
res rank
Bachelor’s to PhD rank
# indicates colleges that were under the more severe level of heightened cash monitoring (HCM-2) by the U.S. Department of Education as of June 1, 2016. Cheyney University is on the list for issues of administrative capacity.

106 September/October 2016
1 Truman State University (MO)* 38 231 240 257 209 91 42 277 210 5 12 64 215 118
2 Trinity University (TX) 12 140 355 364 188 387 16 393 108 2 26 352 205 82
3 SUNY–Geneseo (NY)* 14 260 223 388 245 201 31 447 151 9 7 226 77 49
4 Valparaiso University (IN) 42 192 175 267 260 335 47 140 149 8 18 115 55 61
5 CA State University–Stanislaus (CA)* 288 8 107 26 68 14 297 29 152 383 224 433 15 137
6 James Madison University (VA)* 9 46 590 544 25 196 5 389 56 73 30 80 46 57
7 Providence College (RI) 2 19 598 620 19 581 2 340 177 51 43 56 1 70
8 Evergreen State College (WA)* 215 43 43 400 58 110 375 204 222 43 10 433 303 298
9 CA State Univ.–San Bernardino (CA)* 400 37 148 57 56 15 429 120 27 372 234 144 14 214
10 Western Washington University (WA)* 52 119 369 436 249 161 54 311 45 99 3 433 88 129
11 Rutgers University-Camden (NJ)* 194 146 178 454 15 100 131 16 71 157 107 268 303 161
12 CA State University–Bakersfield (CA)* 463 99 95 41 12 17 357 18 130 168 215 433 303 298
13 College of New Jersey (NJ)* 3 127 450 320 162 218 17 469 201 14 102 209 277 8
14 CA State University–Sacramento (CA)* 418 372 164 226 49 41 235 174 21 404 123 117 2 291
15 Pacific Lutheran University (WA) 50 164 311 489 182 468 26 256 262 27 5 23 266 47
16 Creighton University (NE) 27 467 290 437 103 502 50 559 8 10 113 59 122 60
17 Gonzaga University (WA) 6 89 354 539 91 542 15 410 155 53 2 61 105 139
18 St. John’s College (NM) 242 455 60 628 145 478 255 456 335 1 8 433 303 298
19 Columbia International University (SC) 83 22 59 616 343 241 98 13 335 56 4 433 303 298
20 Milligan College (TN) 198 317 186 213 429 236 148 144 335 20 15 433 136 4
21 University of Mary Washington (VA)* 29 75 569 494 231 271 24 312 182 23 11 267 134 181
22 Citadel: The Military College of SC (SC)* 69 35 487 591 133 255 117 34 268 230 143 1 156 130
23 Fairfield University (CT) 11 73 522 541 4 613 3 302 39 52 151 384 85 209
24 CA State University–Los Angeles (CA)* 484 138 97 18 288 4 333 33 54 330 260 376 40 213
25 NM Inst. of Mining and Tech (NM)* 379 607 247 189 426 70 66 31 5 7 450 367 303 298
26 Buffalo State College (NY)* 351 341 389 600 50 67 367 257 115 17 97 247 151 169
27 Hamline University (MN) 108 275 129 478 84 394 95 245 297 48 67 292 56 151
28 Bradley University (IL) 22 199 232 290 118 458 46 225 121 47 87 230 169 56
29 University of Redlands (CA) 41 94 326 136 261 499 65 148 161 62 38 371 20 138
30 CA State University–Chico (CA)* 185 49 324 341 104 128 191 130 107 191 64 433 28 222
31 Baldwin Wallace University (OH) 54 122 293 194 306 349 62 75 287 39 91 255 160 107
32 Eastern Illinois University (IL)* 147 134 330 293 41 259 166 54 187 116 161 88 164 92
33 Southwestern College (KS) 262 3 224 150 100 459 285 2 335 127 174 433 78 199
34 CA State University–Northridge (CA)* 358 67 385 200 184 76 336 178 15 382 252 337 16 35
35 Kettering University (MI) 178 540 154 339 1 620 25 22 86 59 347 433 94 298
36 Santa Clara University (CA) 4 218 332 331 42 587 6 507 98 22 71 92 243 104
37 CUNY City College (NY)* 416 431 48 20 384 8 446 330 3 197 199 262 303 298
38 University of Scranton (PA) 8 38 481 556 20 589 30 377 263 26 175 42 159 190
39 Loyola University Maryland (MD) 5 115 548 597 13 562 1 405 221 25 312 45 188 188
40 CA Poly. St. U.–San Luis Obispo (CA)* 35 405 453 227 114 188 19 449 18 107 29 201 153 287
41 University of WA–Tacoma (WA)* 330 158 157 547 9 22 58 7 118 555 450 199 303 298
42 Millersville University of PA (PA)* 123 109 534 264 387 248 144 167 225 60 75 168 19 24
43 University of Baltimore (MD)* 414 52 361 269 5 303 488 9 66 418 450 433 280 94
44 Nazareth College (NY) 37 200 300 592 113 560 100 475 335 41 79 397 13 2
45 Embry-Riddle Aero. U.–Dayt. Beach (FL) 216 219 292 129 7 632 230 98 16 214 334 3 214 245
46 Drake University (IA) 36 434 291 491 44 538 41 462 180 21 16 164 291 240
47 CA State Univ.–Dominguez Hills (CA)* 568 264 339 179 119 2 482 172 79 425 296 237 10 79
48 Bethel College–Mishawaka (IN) 85 4 64 247 354 327 260 42 335 228 218 228 219 20
49 Arizona State–West (AZ)* 160 7 21 156 267 32 381 4 335 492 450 433 303 298
50 Univ. of Wisconsin–Eau Claire (WI)* 75 248 349 458 228 133 29 242 166 105 52 264 111 166
tOP 100 MAsteR’s UNIVeRsItIes*Public institution
°For-profit institution
sOCIAL MObILItY
Graduation rate rank
Pell perfo
rmance rank
Grad rate perform
ance rank
First-gen perfo
rmance rank
Earnings perform
ance rank
Net price rank
Repayment rank
Repayment rate perfo
rmance rank
ROTC rank
Peace Corps rank
% of federal w
ork-study funds
spent on service rank
Community service rank
seRVICeReseARCh
Research expenditu
res rank
Bachelor’s to PhD rank

108 September/October 2016
51 Lebanon Valley College (PA) 31 96 531 349 240 543 7 105 335 13 226 433 236 66
52 Stetson University (FL) 122 382 88 254 380 473 126 219 220 29 61 46 185 48
53 Humboldt State University (CA)* 437 502 84 353 443 151 313 234 41 72 9 433 221 196
54 Grand Valley State University (MI)* 78 131 123 285 382 212 142 214 47 202 104 335 251 3
55 Alaska Pacific University (AK) 308 25 600 224 305 622 243 220 202 4 1 433 303 298
56 University of Michigan–Dearborn (MI)* 291 280 71 36 107 53 384 185 51 162 383 211 303 277
57 West Virginia Wesleyan College (WV) 164 121 304 273 86 316 192 91 298 93 450 433 125 42
58 University of Northern Iowa (IA)* 91 182 505 587 206 192 85 336 87 66 89 225 32 114
59 Southern IL Univ.–Edwardsville (IL)* 297 442 191 306 473 245 263 170 9 221 244 57 5 164
60 William Carey University (MS) 155 14 2 81 76 354 506 136 335 186 450 274 303 298
61 St. Mary’s University (TX) 177 206 72 64 568 344 332 272 205 36 293 20 79 27
62 John Brown University (AR) 107 50 173 128 72 296 60 32 335 151 182 322 303 298
63 Augsburg College (MN) 127 147 118 469 246 408 134 116 172 131 55 249 170 12
64 CA State University–Long Beach (CA)* 140 105 215 72 404 36 175 307 22 359 112 239 244 247
65 CUNY Brooklyn College (NY)* 282 81 93 31 281 9 421 157 40 240 251 418 303 298
66 Saint Joseph’s College–New York (NY) 53 6 436 141 27 127 198 100 335 473 428 433 303 298
67 SUNY Fredonia (NY)* 102 212 442 599 77 223 158 390 284 65 45 433 255 125
68 Xavier University of Louisiana (LA) 383 536 24 350 220 466 522 104 36 16 126 82 302 152
69 CUNY Bernard M. Baruch College (NY)* 103 69 31 2 572 13 151 112 102 394 440 386 303 298
70 CUNY Hunter College (NY)* 328 456 136 10 425 16 330 451 4 163 263 405 303 298
71 La Salle University (PA) 84 18 428 398 29 529 119 68 170 113 371 215 186 203
72 CUNY John Jay Col. of Crim. Just. (NY)* 407 47 225 145 37 6 458 111 42 504 427 263 303 298
73 Millikin University (IL) 172 325 190 216 89 337 211 184 335 85 450 433 141 36
74 Elmhurst College (IL) 30 45 228 167 157 342 83 190 323 300 73 425 176 256
75 Univ. of Minnesota–Duluth (MN)* 190 539 430 580 417 144 44 252 11 226 50 123 6 258
76 Converse College (SC) 171 303 172 401 66 370 159 365 335 61 198 282 134 147
77 Mills College (CA) 110 385 20 291 308 522 249 599 93 12 14 433 303 298
78 Tusculum College (TN) 537 567 26 9 47 366 503 230 335 556 450 433 4 9
79 Columbia College (SC) 385 286 18 131 95 286 364 10 335 561 450 433 43 142
80 University of Dallas (TX) 60 413 211 596 395 539 152 564 335 3 20 70 303 298
81 Elizabeth City State University (NC)* 444 34 80 601 296 1 620 563 82 490 379 26 53 1
82 Wayne State College (NE)* 331 433 296 397 265 84 253 275 324 290 401 18 3 156
83 Mississippi Univ. for Women (MS)* 461 446 119 172 218 73 497 265 235 68 387 373 59 91
84 Towson University (MD)* 81 148 557 411 85 146 106 269 101 329 144 178 69 45
85 Bentley University (MA) 1 20 519 447 16 472 4 318 335 479 221 433 229 174
86 LeTourneau University (TX) 231 277 69 21 23 397 337 131 216 165 287 433 303 298
87 Asbury University (KY) 57 92 149 481 312 498 72 139 335 11 207 179 303 298
88 Hood College (MD) 90 87 325 456 315 429 190 267 335 15 39 66 303 298
89 Niagara University (NY) 92 62 526 577 60 276 138 342 125 133 267 19 228 46
90 University of North Florida (FL)* 294 338 216 105 366 42 262 155 68 339 116 163 140 180
91 Western Illinois University (IL)* 226 172 319 333 81 311 259 72 106 187 359 93 64 220
92 CA State Univ.–Monterey Bay (CA)* 458 513 298 195 200 33 257 196 63 550 81 433 22 73
93 Gannon University (PA) 104 44 426 449 79 389 188 263 309 184 450 51 45 51
94 Mercyhurst College (PA) 97 104 321 157 505 374 344 481 147 77 110 62 23 14
95 Texas A&M International Univ. (TX)* 421 56 208 180 181 5 480 280 91 537 412 240 72 272
96 Butler University (IN) 24 368 403 509 36 586 11 394 239 37 154 219 204 140
97 Simmons College (MA) 71 569 427 493 116 548 45 578 240 91 6 145 35 80
98 CUNY Queens College (NY)* 207 168 284 12 418 7 261 335 10 318 310 388 303 298
99 Univ. of NC–Wilmington (NC)* 44 211 288 382 561 115 213 532 14 140 62 433 95 171
100 American Public Univ. System (WV)° 529 229 260 1 18 64 513 28 335 561 450 433 303 298
MAsteR’s UNIVeRsItIes
sOCIAL MObILItY
Graduation rate rank
Pell perfo
rmance rank
Grad rate perform
ance rank
First-gen perfo
rmance rank
Earnings perform
ance rank
Net price rank
Repayment rank
Repayment rate perfo
rmance rank
ROTC rank
Peace Corps rank
% of federal w
ork-study funds
spent on service rank
Community service rank
seRVICeReseARCh
Research expenditu
res rank
Bachelor’s to PhD rank

110 September/October 2016
1 Cooper Un. Advance. of Science & Art (NY) 1 64 49 73 96 56 52 219 27 1 12 83 66 65
2 College of the Ozarks (MO) 17 6 18 96 22 30 1 3 54 81 98 16 64 29
3 Goshen College (IN) 6 17 133 166 170 114 23 89 54 2 2 87 66 65
4 Cedar Crest College (PA) 18 5 167 19 23 107 75 69 54 10 25 87 7 36
5 Calvin College (MI) 3 90 75 222 167 196 7 183 5 3 7 30 59 31
6 California Maritime Academy (CA)* 31 26 121 215 2 48 31 84 11 150 22 14 66 65
7 Texas Lutheran University (TX) 73 153 153 63 42 102 87 31 54 13 14 87 1 16
8 Maine Maritime Academy (ME)* 4 4 186 221 1 164 12 55 24 150 98 12 66 65
9 University of Evansville (IN) 12 112 95 120 64 143 18 120 35 9 6 67 45 28
10 Ohio Northern University (OH) 10 74 103 113 13 203 16 87 32 21 90 54 2 65
11 Loras College (IA) 15 111 162 201 60 122 8 119 54 34 4 87 25 6
12 Montana Tech/Univ. of Montana (MT)* 78 160 35 17 210 28 92 30 1 71 37 87 66 46
13 Augustana College (SD) 11 157 120 225 72 96 6 178 16 15 19 71 12 25
14 Blue Mountain College (MS) 75 105 23 61 36 12 123 100 54 12 98 87 60 65
15 Wilberforce University (OH) 105 3 53 209 50 129 193 2 28 5 98 87 66 65
16 Taylor University (IN) 2 114 48 185 160 199 17 182 25 6 20 87 43 13
17 University of Mount Olive (NC) 114 10 159 77 10 47 66 1 54 124 98 87 66 65
18 Eureka College (IL) 33 66 72 34 98 100 86 127 54 40 98 87 3 38
19 Coker College (SC) 58 24 58 39 71 88 91 7 39 144 98 87 26 44
20 Brigham Young University–Idaho (ID) 50 47 27 212 37 4 10 16 54 118 80 39 66 65
21 Buena Vista University (IA) 57 170 22 50 45 119 36 62 54 33 86 20 60 45
22 Clarke University (IA) 7 12 85 68 49 195 55 117 54 64 98 87 32 4
23 St. Francis College (NY) 42 15 179 147 4 44 139 67 54 78 98 86 66 65
24 Mars Hill College (NC) 124 52 17 162 93 120 133 41 54 111 70 87 5 10
25 Northwestern College (IA) 19 127 84 208 159 177 4 97 54 16 36 87 21 3
26 Marietta College (OH) 23 80 127 122 127 170 34 80 54 17 13 87 35 41
27 Lake Superior State University (MI)* 117 50 45 57 56 10 132 132 19 47 67 87 66 65
28 Hastings College (NE) 29 121 114 107 76 147 33 123 54 26 23 87 34 18
29 University of South Carolina–Aiken (SC)* 119 142 194 177 103 27 69 35 15 43 38 79 18 49
30 Penn State Erie–Behrend Coll. (PA)* 9 13 112 112 192 176 39 112 4 19 95 19 66 65
31 University of Pittsburgh–Bradford (PA)* 48 62 126 229 14 85 25 102 22 31 28 11 66 65
32 Ottawa University–Ottawa (KS) 163 155 29 6 11 111 129 24 54 58 32 87 66 65
33 Kentucky Wesleyan College (KY) 141 212 68 60 87 90 142 151 54 20 45 87 10 30
34 University of Arkansas–Pine Bluff (AR)* 196 168 56 144 78 6 212 150 2 97 98 5 66 65
35 Berry College (GA) 21 217 70 146 140 171 13 163 31 7 5 87 66 65
36 Voorhees College (SC) 175 21 26 101 122 70 196 5 54 69 98 2 66 65
37 Huntington University (IN) 24 25 134 196 149 105 14 70 54 41 98 87 6 62
38 Adrian College (MI) 32 43 100 93 129 125 100 137 54 84 18 52 4 65
39 Oklahoma Baptist University (OK) 46 77 73 106 88 73 64 131 54 14 40 73 66 65
40 Cedarville University (OH) 5 123 88 223 116 181 3 168 54 11 24 6 66 65
41 Carroll College (MT) 13 86 192 192 121 206 5 153 54 4 11 10 66 65
42 Saint Mary-of-the-Woods College (IN) 35 9 77 41 65 62 118 170 54 77 51 87 66 65
43 Warner University (FL) 140 28 93 76 9 77 167 9 54 143 98 87 66 65
44 Trinity Christian College (IL) 34 96 86 67 100 184 28 33 54 37 98 87 54 24
45 Missouri Southern State Univ. (MO)* 162 130 7 21 94 7 179 159 54 108 31 87 66 65
46 University of Mount Union (OH) 16 34 122 89 74 217 22 74 54 24 85 70 60 34
47 University of South Carolina–Upstate (SC)* 135 146 166 135 75 60 83 27 34 140 43 34 20 42
48 University of Maine–Farmington (ME)* 36 54 66 160 124 75 27 121 54 74 9 87 66 65
49 Averett University (VA) 161 172 147 82 6 162 148 63 54 48 98 87 13 65
50 Defiance College (OH) 63 35 102 54 80 211 81 21 54 49 98 87 65 5
tOP 100 bACCALAUReAte COLLeGes*Public institution
°For-profit institution
sOCIAL MObILItY
Graduation rate rank
Pell perfo
rmance rank
Grad rate perform
ance rank
First-gen perfo
rmance rank
Earnings perform
ance rank
Net price rank
Repayment rank
Repayment rate perfo
rmance rank
ROTC rank
Peace Corps rank
% of federal w
ork-study funds
spent on service rank
Community service rank
seRVICeReseARCh
Research expenditu
res rank
Bachelor’s to PhD rank

Washington Monthly 111Washington Monthly 111
SoCial MoBility: The first column shows the percentage of students graduating within six years, and the second column shows the predicted rate of
graduation (based on incoming ACT/SAT scores, Pell Grant percentages, and other measures; see our full methodology on page 114). The third and fourth
columns show the difference between the actual and predicted percentages of Pell Grant recipients and first-generation students based on ACT/SAT scores
and the percentage of students admitted. The fifth column shows the difference between actual and predicted earnings of all students (dropouts and
graduates) ten years after starting college after controlling for student demographics and majors, living costs, and other factors. The sixth column shows the
net price of attending that institution, or the average price that first-time, full-time students who have a family income below $75,000 per year and receive
financial aid to pay for college after subtracting need-based financial aid. The final two columns reflect the actual and predicted performance of the
percentage of students who repaid at least $1 in principal on their loans within five years of entering repayment.
reSearCh: The first column shows total research expenditures. The second shows the school’s ranking in the number of bachelor’s recipients who go on
to receive PhDs, relative to school size.
ServiCe: The first column ranks the school by the number of alumni who go on to serve in the Peace Corps, relative to school size. The second column ranks
the school by the percentage of students who serve in ROTC. The third gives the percentage of funds in federal work-study money that goes to community
service (versus non-community service). The fourth column shows the school’s rank on a combined measure of the number of students participating in
community service and the total number of service hours performed, both relative to school size. The fifth column shows the school’s rank on a combined
measure of the percent of students doing community service, the number of hours of community service per student, whether any staff were employed in
community service, if any service courses were offered, or if the institution provides scholarships for community service.

112 September/October 2016
bACCALAUReAte COLLeGes
51 Univ. of Wisconsin–Superior (WI)* 129 192 65 129 77 34 93 167 9 88 88 55 40 65
52 Bennett College for Women (NC) 112 36 41 194 19 194 204 136 54 54 3 65 66 65
53 Dordt College (IA) 14 71 79 195 157 209 2 60 54 22 98 87 30 56
54 University of Montana–Western (MT)* 72 32 123 81 158 8 60 46 43 93 72 87 66 65
55 Tennessee Wesleyan College (TN) 95 163 61 18 114 35 134 181 54 83 98 87 39 51
56 Penn State–Schuylkill (PA)* 115 51 137 227 8 80 39 18 54 150 98 87 66 61
57 Emmanuel College (GA) 109 67 156 163 69 46 141 133 54 150 98 87 17 8
58 Shorter University (GA) 83 59 125 45 7 131 173 164 54 45 74 87 66 65
59 Embry-Riddle Aero. Univ.–Prescott (AZ) 28 49 90 35 12 229 68 59 54 68 98 1 66 65
60 Huntingdon College (AL) 90 118 109 97 214 144 135 107 54 25 64 21 8 50
61 Blackburn College (IL) 104 187 37 71 67 50 155 198 54 56 16 87 66 65
62 Penn State–Altoona (PA)* 8 7 185 180 24 188 39 141 21 135 94 7 66 65
63 Hilbert College (NY) 93 85 78 103 15 67 137 175 54 150 98 44 57 63
64 Manchester College (IN) 40 63 181 99 181 160 51 130 54 18 98 87 56 9
65 Warner Pacific College (OR) 110 109 67 23 212 192 71 32 54 150 15 87 48 1
66 Lander University (SC)* 85 104 154 152 57 65 29 12 54 117 93 15 66 65
67 Hannibal-LaGrange University (MO) 59 55 161 32 112 84 72 51 54 150 98 87 53 20
68 Grand View University (IA) 67 117 64 153 135 117 54 95 54 112 84 60 27 32
69 Brescia University (KY) 167 222 62 2 35 24 99 38 54 123 98 87 66 65
70 Williams Baptist College (AR) 121 150 40 5 51 37 128 79 54 150 98 87 66 65
71 Unity College (ME) 60 169 20 65 230 154 65 99 47 150 1 87 41 7
72 Iowa Wesleyan College (IA) 182 218 107 52 125 161 171 187 54 32 33 87 11 2
73 West Liberty University (WV)* 123 188 144 75 79 25 160 222 18 94 98 87 29 52
74 Penn State–Worthington Scranton (PA)* 70 45 118 210 21 51 39 93 54 150 98 56 66 65
75 Florida Memorial University (FL) 136 14 4 44 33 108 218 134 54 107 77 32 66 65
76 University of Mobile (AL) 97 176 25 47 17 132 166 157 54 73 98 58 66 65
77 Catawba College (NC) 49 41 168 171 39 207 48 28 54 99 41 87 66 33
78 Brigham Young University–Hawaii (HI) 61 102 187 187 119 21 24 145 54 38 50 64 66 65
79 Bluefield College (VA) 103 53 212 58 25 174 85 29 54 122 98 87 31 55
80 Penn State–Wilkes-Barre (PA)* 54 27 184 188 54 49 39 26 48 150 98 50 66 65
81 Alderson Broaddus College (WV) 100 162 91 25 32 76 140 118 49 76 58 87 66 65
82 Briar Cliff University (IA) 88 140 96 92 134 136 62 49 54 98 98 87 58 15
83 Wisconsin Lutheran College (WI) 22 98 104 148 201 79 9 56 54 30 98 84 66 65
84 Culver-Stockton College (MO) 86 99 89 111 68 94 163 190 54 102 98 87 23 58
85 Bluffton University (OH) 26 16 135 62 132 186 26 22 54 60 98 87 66 65
86 East Texas Baptist University (TX) 165 184 146 91 46 123 143 86 54 55 98 87 50 17
87 Flagler College–St. Augustine (FL) 20 58 190 159 29 158 38 174 54 66 21 87 66 65
88 Oregon Institute of Technology (OR)* 84 23 191 88 137 59 58 45 23 137 83 87 66 65
89 Talladega College (AL) 51 8 11 78 193 40 227 221 54 50 60 45 66 65
90 Keystone College (PA) 128 75 94 49 177 63 138 154 54 150 98 85 46 21
91 Wilmington College (OH) 111 148 101 22 163 169 90 61 54 95 98 87 42 23
92 Benedict College (SC) 184 89 14 108 208 134 225 204 8 72 89 23 16 26
93 Penn State–Brandywine (PA)* 122 159 207 204 20 31 39 94 54 96 98 49 66 65
94 Univ. of Minnesota–Crookston (MN)* 77 70 218 131 216 20 76 110 40 129 92 87 28 37
95 University of the Ozarks (AR) 66 138 57 42 223 74 106 58 54 29 98 87 66 65
96 Penn. State Univ.–New Kensington (PA)* 62 31 198 199 70 43 39 48 54 150 98 35 66 65
97 Concordia College–New York (NY) 89 57 197 136 40 92 113 40 54 105 53 87 66 65
98 University of Phoenix–Idaho (ID)° 223 206 24 9 3 163 199 214 54 150 98 87 66 65
99 Clearwater Christian College (FL) 71 147 43 224 131 112 19 20 54 150 27 18 66 65
100 College of St. Joseph (VT) 149 18 165 84 73 127 115 14 54 150 98 87 55 65
sOCIAL MObILItY
Graduation rate rank
Pell perfo
rmance rank
Grad rate perform
ance rank
First-gen perfo
rmance rank
Earnings perform
ance rank
Net price rank
Repayment rank
Repayment rate perfo
rmance rank
ROTC rank
Peace Corps rank
% of federal w
ork-study funds
spent on service rank
Community service rank
seRVICeReseARCh
Research expenditu
res rank
Bachelor’s to PhD rank

114 September/October 2016
there are two primary goals to our methodology. First, we considered no single category to be more important than any other. Second, the final rank-
ings needed to reflect excellence across the full breadth of our measures, rather than reward an exceptionally high focus on, say, research. Thus, all three main cate-gories were weighted equally when calculating the final score. In order to ensure that each measurement contrib-uted equally to a college’s score within any given cate-gory, we standardized each data element so that each had a mean of zero and a standard deviation of one. The data was also adjusted to account for statistical outliers. No college’s performance in any single area was allowed to exceed five standard deviations from the mean of the data set. All measures use an average of the three most recent years of data in an effort to get a better picture of a college’s performance rather than statistical noise. Thanks to rounding, some colleges have the same over-all score. We have ranked them according to their pre-rounding results. To establish the set of colleges included in the rank-ings, we started with the 1,863 colleges in the fifty states that are listed in the U.S. Department of Education’s In-tegrated Postsecondary Education Data System (IPEDS) and have a 2015 Carnegie basic classification of research, master’s, baccalaureate, and baccalaureate/associate’s colleges, are not exclusively graduate colleges, partici-pate in federal financial aid programs, and plan to be open in fall 2016. As the Carnegie classifications were up-dated this year for the first time in five years, some colleg-es switched categories or moved into or out of our sam-ple. This represents the first major update to our ranking categories since 2011. We then excluded 356 baccalaure-ate and baccalaureate/associate’s-level colleges which reported that at least half of the undergraduate degrees awarded in 2012 were below the bachelor’s-degree level, as well as eighteen colleges with fewer than 100 under-graduate students in any year they were open between fall 2012 and fall 2014, and an additional seventy-eight colleges with fewer than fifty students in the federal graduation rate cohort (first-time, full-time students) be-tween 2012 and 2014. Next, we decided to exclude the five federal military academies (Air Force, Army, Coast Guard, Merchant Ma-rine, and Navy) because their unique missions make them difficult to evaluate using our methodology. Our rankings
are based in part on the percentage of students receiving Pell Grants and the percentage of students enrolled in the Reserve Officers’ Training Corps (ROTC), whereas the service academies provide all students with free tuition (and thus no Pell Grants or student loans) and commis-sion graduates as officers in the armed services (and thus not the ROTC program). This resulted in a final sample of 1,406 colleges and includes public, private nonprofit, and for-profit colleges. As a final precaution to weed out es-pecially questionable colleges, we cross-checked every ranking with the Department of Education’s second-level Heightened Cash Monitoring List. Then we randomly se-lected five schools on each of the lists, checked their sta-tus on the less drastic first-level Heightened Cash Moni-toring List for signs of instability, verified their accredita-tion, and searched through local and national news clips over the past year for signs of problems. The social mobility portion of the rankings changed significantly this year in response to newly available data on student outcomes from the U.S. Department of Edu-cation’s College Scorecard, with four of the eight factors contributing to the social mobility score coming from the Scorecard data. A college’s graduation rate (from the IPEDS) counted for 20 percent of the social mobility score, with half of that being determined by the reported grad-uation rate and the other half coming from comparing the reported graduation rate to a predicted graduation rate based on the percentage of Pell recipients and first- generation students, the percentage of students receiv-ing student loans, the admit rate, the racial/ethnic and gender makeup of the student body, the number of stu-dents (overall and full-time), and whether a college is pri-marily residential. We estimated this predicted gradu-ation rate measure in a regression model separately for each classification using average data from the last three years, imputing for missing data when necessary. Colleg-es with graduation rates that are higher than the “aver-age” college with similar stats score better than colleg-es that match or, worse, undershoot the mark. A few col-leges had predicted graduation rates over 100 percent, which we then trimmed back to 100 percent. We used IPEDS data for the percentage of a col-lege’s students receiving Pell Grants and College Score-card data on the percentage of first-generation students in order to get at colleges’ commitments to educating a diverse group of students. (Graduation rates for these groups of students aren’t available yet in federal data, but Pell graduation rates should be coming in a year or two.) We then estimated predicted percentages of Pell re-cipients and first-generation students based on regres-sions using admit rates and ACT/SAT scores. The gaps between actual and predicted percentages counted for 20 percent of a college’s score, with 13.33 percent for Pell
a note on MethodoloGy:4-year ColleGeS and UniverSitieS

Washington Monthly 115Washington Monthly 115
performance and 6.67 percent for first-generation per-formance. We measured a college’s affordability by using data from IPEDS on the average net prices paid by first-time, full-time, in-state students with family incomes be-low $75,000 per year over the last three years. We focused on these income categories due to our interest in afford-ability for students from lower- to middle-income fami-lies. Net price counted for 20 percent of the social mobil-ity score. We have wanted to include more data on students’ economic outcomes for years, and now the College Scorecard provides us with that opportunity. The first metric we used compares the median earnings of a col-lege’s former students (graduates and dropouts alike) ten years after initial enrollment to predicted earnings based on the variables used to predict graduation rates, as well as two other factors designed to take colleges’ missions and locations into account. We adjusted for a college’s mix of bachelor’s degrees awarded, using STEM, educa-tion, business, health, social science, and liberal arts as broad degree categories. We also adjusted for regional living costs using fair market rent data from the Bureau of Labor Statistics to account for the fact that $40,000 per year in the rural South goes much farther than $40,000 per year in the Washington metropolitan area. This met-ric is worth 20 percent of the social mobility score. The other new metric is a student loan repayment rate, reflecting the percentage of students who paid down at least $1 in principal within five years of leaving college and entering repayment. We had previously used data on the percentage of students defaulting on their loans within three years of entering repayment, but the repayment rate is a far better measure of students’ eco-nomic circumstances. We use the raw repayment rate for 10 percent of the social mobility score and a regression-adjusted repayment rate (using the same predictors as the graduation rate metric) for another 10 percent.
The research score for national universities is based on five measurements: the total amount of an institu-tion’s research spending (from the Center for Measuring University Performance and the National Science Foun-dation); the number of science and engineering PhDs awarded by the university; the number of undergraduate alumni who have gone on to receive a PhD in any subject, relative to the size of the college; the number of faculty receiving prestigious awards, relative to the number of full-time faculty; and the number of faculty in the Nation-al Academies, relative to the number of full-time faculty. For national universities, we weighted each of these com-ponents equally to determine a college’s final score in the category. For liberal arts colleges, master’s universities, and baccalaureate colleges, which do not have extensive doctoral programs, science and engineering PhDs were
excluded and we gave double weight to the number of alumni who go on to get PhDs. Faculty awards and Na-tional Academy membership were not included in the re-search score for these institutions because such data is available for only a relative handful of these colleges. We determined the community service score by measuring each college’s performance in four equally weighted measures. We judged military service by col-lecting data on the size of each college’s Air Force, Army, and Navy ROTC programs and dividing by the number of students. We similarly measured national service by dividing the number of alumni currently serving in the Peace Corps by total enrollment. The final two measures are based on data reported to the Corporation for Na-tional and Community Service by colleges and universi-ties in their applications for the President’s Higher Educa-tion Community Service Honor Roll. One measure is the percentage of federal work-study grant money spent on community service projects. The second measure is more complicated and includes the percent of students doing community service, the number of hours of community service per student, whether any staff were employed in community service, if any service courses were offered, or if the institution provides scholarships for community service. Colleges that did not submit applications in a giv-en year had no data and were given zeros on these mea-sures. (Our advice to those colleges: If you care about ser-vice, believe you do a good job of promoting it, and want the world to know, then fill out the application!) —Eds.
Related Documents


![,%=2)7 EPPS]](https://static.cupdf.com/doc/110x72/6183916cab76af35b40a8e29/27-epps.jpg)
