In this report we will be discussing the dynamics of the Indian copper industry, its trend (demand-supply, trade, pricing) in the past 5 years, the situation in the current financial year (2019-2020) and outlook (page 11) for the same. We will also be covering the demand-supply of the red metal in the international markets. Overview Copper is an important non-ferrous base metal having wide industrial applications. Today it has become the 3 rd most used industrial metal after steel and aluminium in terms of quantities consumed. As compared with the global markets, India has limited copper ore reserves which constitute around 2% of the world copper reserves and mining production too is just 0.2% of the world's production. There are three major players which dominate the primary copper industry in the Indian Markets. Hindustan Copper Limited (HCL) in Public Sector, Hindalco Limited and Vedanta Industries Limited in Private Sector. Structure of the Copper Industry The copper industry can be classified into four categories Chart 1: Industry Segmentation Source: Industry, CARE Ratings Miners Xstrata, Rio Tinto, BHP, Escondido & Codelco in Chile, Grasberg in Indonesia, Anta Mina in Peru Custom Smelters (Smelting and Refining) Guixi & Yunxan in China, Hindalco and Vedanta in India Integrated Producers Hindustan Copper in India, Codelco in Chile Secondary Producers Many regional players manufacturing copper by recycling copper scrap September , 2019 I Industry Research Indian Copper Industry- Trends and Outlook Contact: Madan Sabnavis Chief Economist [email protected] +91-22- 6837 4433 Author: Urvisha Jagasheth Research Analyst [email protected] +91-22- 6837 4410 Mradul Mishra (Media Contact) [email protected] +91-22-6837 4424 Disclaimer: This report is prepared by CARE Ratings Ltd. CARE Ratings has taken utmost care to ensure accuracy and objectivity while developing this report based on information available in public domain. However, neither the accuracy nor completeness of information contained in this report is guaranteed. CARE Ratings is not responsible for any errors or omissions in analysis/inferences/views or for results obtained from the use of information contained in this report and especially states that CARE Ratings has no financial liability whatsoever to the user of this report

Welcome message from author
This document is posted to help you gain knowledge. Please leave a comment to let me know what you think about it! Share it to your friends and learn new things together.
Transcript
In this report we will be discussing the dynamics of the Indian copper
industry, its trend (demand-supply, trade, pricing) in the past 5 years,
the situation in the current financial year (2019-2020) and outlook
(page 11) for the same. We will also be covering the demand-supply of
the red metal in the international markets.
Overview
Copper is an important non-ferrous base metal having wide industrial
applications. Today it has become the 3rd most used industrial metal
after steel and aluminium in terms of quantities consumed.
As compared with the global markets, India has limited copper ore
reserves which constitute around 2% of the world copper reserves and
mining production too is just 0.2% of the world's production.
There are three major players which dominate the primary copper
industry in the Indian Markets. Hindustan Copper Limited (HCL) in
Public Sector, Hindalco Limited and Vedanta Industries Limited in
Private Sector.
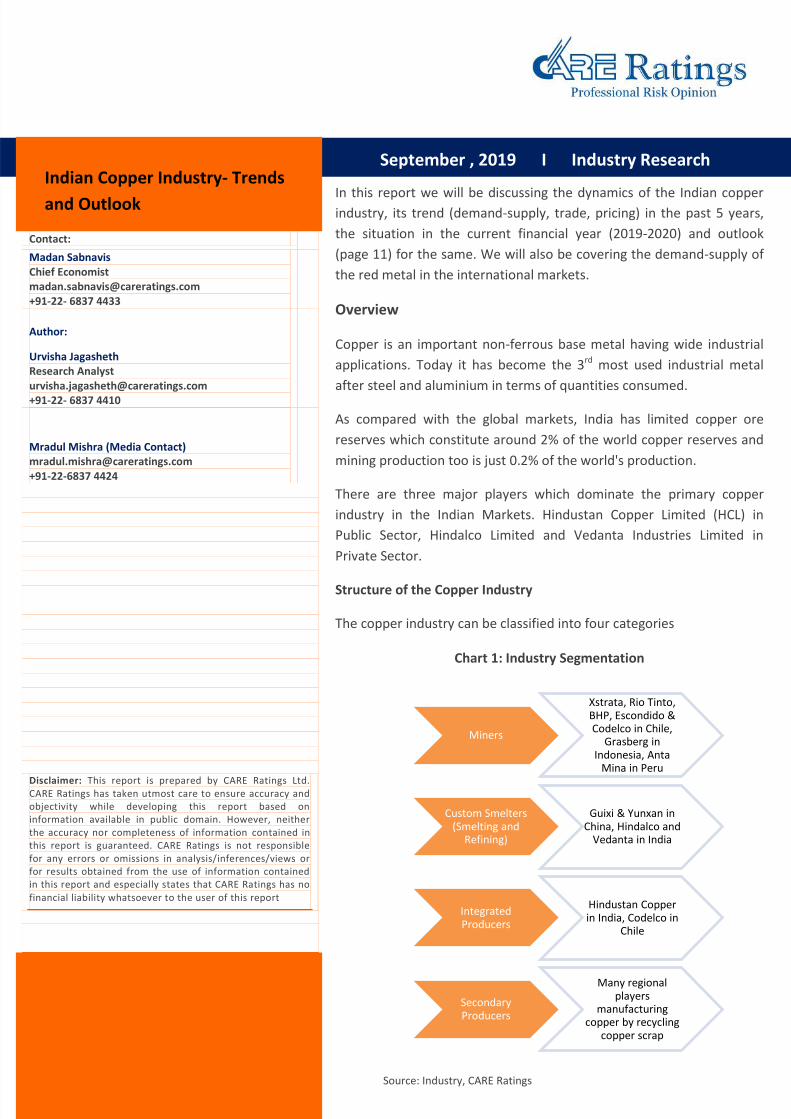
Structure of the Copper Industry
The copper industry can be classified into four categories
Chart 1: Industry Segmentation
Source: Industry, CARE Ratings
Miners
Xstrata, Rio Tinto, BHP, Escondido & Codelco in Chile,
Grasberg in Indonesia, Anta
Mina in Peru
Custom Smelters (Smelting and
Refining)
Guixi & Yunxan in China, Hindalco and
Vedanta in India
Integrated Producers
Hindustan Copper in India, Codelco in
Chile
Secondary Producers
Many regional players
manufacturing copper by recycling
copper scrap
September , 2019 I Industry Research Indian Copper Industry- Trends
and Outlook
Contact:
Madan Sabnavis Chief Economist [email protected] +91-22- 6837 4433
Author:
Urvisha Jagasheth Research Analyst [email protected] +91-22- 6837 4410
Mradul Mishra (Media Contact) [email protected] +91-22-6837 4424
Disclaimer: This report is prepared by CARE Ratings Ltd. CARE Ratings has taken utmost care to ensure accuracy and objectivity while developing this report based on information available in public domain. However, neither the accuracy nor completeness of information contained in this report is guaranteed. CARE Ratings is not responsible for any errors or omissions in analysis/inferences/views or for results obtained from the use of information contained in this report and especially states that CARE Ratings has no financial liability whatsoever to the user of this report

Industry Research I COPPER
2
Domestic Copper Industry
India has limited copper mines which are mainly concentrated in the states of Rajasthan, Madhya Pradesh, Bihar and
Jharkhand. The largest resources of copper ore are in the state of Rajasthan. Hindustan Copper holds all the operating
copper mining leases in India, making it the sole copper miner in the country.
Copper companies usually buy the copper ore from the overseas markets or they will import it from the mines they have
ownership in foreign countries. These companies have set up their smelting and refining plants in India, which refines the
copper concentrates to convert it to pure metal also known as copper cathodes.
Production Capacity
Table 1: Domestic copper cathode smelting capacity (in terms of Kilo Tonnes (KT))
Company Location Smelting and Refining Capacity
Hindalco Dahej 500
Vedanta Tuticorin* 400
Hindustan Copper Various Locations** 99.5***
Source: Company Filings, CARE Ratings
Note: One must keep in mind that capacity data only reflects production capabilities *not operational since March, 2018 **Hindustan
Copper Limited (HCL) is a vertically integrated company. The mines owned by HCL have the Smelting facilities located right next to their
mines (Khetri Copper Complex which is in Rajasthan and Indian Copper Complex which is located in Jharkand). Gujarat Copper Project
(formerly known as Jhagadia Copper Limited, acquired by HCL), is into smelting and refining of secondary copper ***Although the
installed capacity of cathode is shown as 99.5 KT (KCC - 31 KT & ICC – 18.5 KT, GCP – 50 MT), due to economic consideration the
Company suspended KCC smelter & refinery from December 2008. Hence the current available capacity is 68.5 KT.
Total capacity available for copper cathode smelting in India for the current year i.e. FY20 is 568.5 KT.
Production
Primary refined copper production is referred to as ‘refined copper derived post smelting the mined copper ore and
concentrates’. Secondary refined copper production is when we derive refined copper through the same processes used
for the production of primary copper but the raw material used is copper scrap. Copper is among the few materials that do
not degrade or lose their chemical or physical properties in the recycling process. Copper scrap derives from either metals
discarded in semis fabrication or finished product manufacturing processes (“new scrap”) or obsolete end‐of‐life products
(“old scrap”).

Industry Research I COPPER
3
Chart 2: Domestic Refined Copper Production (units in KT)
Source: Ministry of Mines, CARE Ratings
Domestic production of refined copper had grown at a CAGR of 9.6% during FY14-18. Production fell by 46.1% during FY19
due to the permanent closure of Sterlite’s 400KT copper factory in Thoothukudi (formerly known as Tuticorin) on 28 May
2018. The Tuticorin smelter accounts for 40% of the country’s copper smelting capacity. Refined copper production had
also fallen during FY19 as output from Hindustan Copper and Hindalco was also low due the planned shutdown of its
smelters during the first half of the year.
Trade
Chart 3: Imports of Copper Ores and Concentrates (units in KT) Chart 4: Exports and Imports of Copper Cathodes (units in
KT)
Source: Ministry of Commerce
762 796 799
848
457
18.3% 4.4% 0.4%
6.2%
-46.1%
-50.0%
-40.0%
-30.0%
-20.0%
-10.0%
0.0%
10.0%
20.0%
30.0%
0
100
200
300
400
500
600
700
800
900
2014-15 2015-16 2016-17 2017-18 2018-19
1,702
1,886
1,143
1,488
824
0
200
400
600
800
1,000
1,200
1,400
1,600
1,800
2,000
2014-15 2015-16 2016-17 2017-18 2018-19
368
320 337
378
48 28 23 27 36
84
0
50
100
150
200
250
300
350
400
2014-15 2015-16 2016-17 2017-18 2018-19
Exports Imports

Industry Research I COPPER
4
India has emerged as an importer of copper ore and concentrates and imports more than 90% of our concentrate
requirements due to the lack of copper mines present in the country. Imports of copper ore and concentrates fell by 44.6%
during FY19 due to the lack of requirement from the Tuticorin smelter.
India used to be a net exporter of copper cathodes till FY18. Now with the closure of the Tuticorin smelter, the drop in
domestic production has led to the domino effect of increasing the country’s imports and decreasing its exports. India has
become a net importer of refined copper after 18 years.
During FY19, exports had fallen by 87.4%, (during FY18 exports had increased by 12.3%) whereas imports increased by
131.2% (during FY18 imports had increased by 35.6%).
India imported refined copper from, Japan (71%), Congo (6%), Singapore (5%), Chile (4%), Tanzania (4%), UAE (4%) and
South Africa (3%) and exported refined copper to China (75%), Taiwan (13%), Malaysia (5%), South Korea (5%) and
Bangladesh (2%) during FY19. Share of exports towards China has increased, from it being 63% during FY18 to 75% during
FY19 and share of imports from Japan has increased from it being 68% during FY18 to 71% during FY19.
Application/Usage of Copper
Copper is a malleable, ductile metallic element and an excellent conductor of heat and electricity. Copper also has
relatively high creep strength as compared to other commonly used materials.
Electrical/Electronic Industry is the largest consumer of copper, where it is used in the form of cables and winding wires as
it encounters much less resistance and is safe for electrical distribution system from high voltage transmission cables to
micro-circuits. Copper is also used in power cables, either insulated or uninsulated, for high, medium and low voltage
applications. Copper is an essential component of energy efficient generators, motors, transformers and renewable energy
production systems. Renewable energy sources such as solar, wind, geothermal, fuel cells and other technologies are all
heavily reliant on copper due to its excellent conductivity.
Copper plays a key role in worldwide information and telecommunications technologies. HDSL (High Digital Subscriber
Line) and ADSL (Asymmetrical Digital Subscriber Line) technology allows for high‐speed data transmission, including
internet service, through the existing copper infrastructure of ordinary telephone wire. Copper and copper alloy products
are used in domestic subscriber lines, wide and local area networks, mobile phones and personal computers.
Building and construction industry, copper is used in plumbing, taps, valves and fittings components.
In the transportation industry, copper is used in various components such as copper motors, wiring, radiators, connectors,
brakes and bearings. EVs are guzzlers for copper. According to an estimate by ICSG most cars contain an average of 20 kg
copper and luxury & hybrid vehicles contain about 45 kg copper. Electric vehicles (EVs) contain approximately 4 times more
copper than conventional cars. It is used in batteries, windings and copper rotors used in electric motors, wiring, busbars
and charging infrastructure.
Copper is also used in making industrial machinery and equipment. Due to their durability, machinability and ability to be
cast with high precision and tolerances, copper alloys are ideal for making products such as gears, bearings and turbine
blades. Copper's superior heat transfer capabilities and ability to withstand extreme environments makes it an ideal choice
for heat exchange equipment, pressure vessels and vats.

Industry Research I COPPER
5
Chart 5: Domestic Refined Copper Consumption (in units of KT) Chart 6: Sector-Wise Consumption of Copper in India
Source: Ministry of Mines, Ministry of Commerce, CARE Ratings Source: Ministry of Mines
Others* also includes process industries
Consumption of refined copper (including secondary consumption) has grown at a CAGR of 4.2% during FY15-19. Need for
wiring in infrastructure projects and renewable energy projects, increase in automobile production (which grew by 7.3%
CAGR) and increase in production of consumer durables (production of refrigerators and air conditioners increased by 6.9%
and 0.7% respectively) has augmented the consumption of copper in the last 5 years.
Demand drivers
Infrastructure: We see the demand for copper in the electrical segment to grow due to the demand via the infrastructure
sector. The PMAY scheme will be the driver of consumption for copper in the building and construction sector. The PMAY-
G, scheme aims to provide 1.95 crore houses till FY22 whereas PMAY-Urban aims to provide over 81 lakh houses (with an
investment amount sanctioned around Rs 4.83 lakh crore).
Automobiles Sector (E-bikes/EVs): The government has announced a series of support measures and incentives, as a result
of which electric vehicles will see a steady growth in the coming years across the country. Manufacturing of EVs uses 3
times the copper than normal automobiles.
Power sector (Renewable energy): The country has set an ambitious target of installing 175 GW of renewable energy
capacity by the year 2022 which could augment the use of copper for wiring applications.
Consumer Durables: - Demand for durables like refrigerators and other consumer electronic goods are likely to witness
growing demand in the coming years in the rural markets with the government being very proactive and in investing
significantly towards rural electrification.
Telecom Sector: The increasing penetration of mobile phones in urban and rural areas will further result in more demand
for telecom towers in rural areas.
432 509 495 509 494
167
182 171 174 212
599
690 666 683 705
0
100
200
300
400
500
600
700
800
2014-15 2015-16 2016-17 2017-18 2018-19
Waste and Scrap Imports
Primary refined copper
Electrical & Telecommuni
cations , 56%
Transport, 8%
Consumer Durables,
7%
Building and Construction
, 7%
General Engineering goods, 6%
Others* , 16%

Industry Research I COPPER
6
Copper Industry performance during 2019-20
Table 2: Domestic Production, Consumption, Exports and Imports of Primary Refined Copper (KT)
Production Change (y-o-y) Consumption
Change (y-o-y) Exports
Change (y-o-y) Imports
Change (y-o-y)
FY18* 274 15.8% 168 -1.2% 113 46.2% 7 -34.1%
FY19* 129 -52.9% 142 -15.3% 7 -93.6% 20 182.1%
FY20* 131 1.7% 167 17.1% 2 -72.7% 37 82.6% Source: Ministry of Mines, Ministry of Commerce, CARE Ratings
Table 3: Domestic overall Consumption of Refined Copper (KT)
Primary Secondary Total Change (y-o-y)
FY18* 168 68 236 1.4%
FY19* 142 61 203 -13.8%
FY20* 167 88 255 25.3% Source: Ministry of Commerce, CARE Ratings
*April-July
In the current financial year, there has been a marginal recovery in terms of production of refined copper but nevertheless
the domestic copper production still continues to remain stressed as the Tuticorin smelter is still non-operational. As a
result imports of copper cathodes have increased by 82.6% and exports have fallen by 72.7%. India has imported 86% of
its copper cathodes requirements from Japan and exported 83% to China.
Copper consumption (primary and secondary) has increased by 25.3% which was driven by usage in the electrical sector
(power, cables and transformer).
Industry Research I COPPER
7
Trends in Global Copper Industry
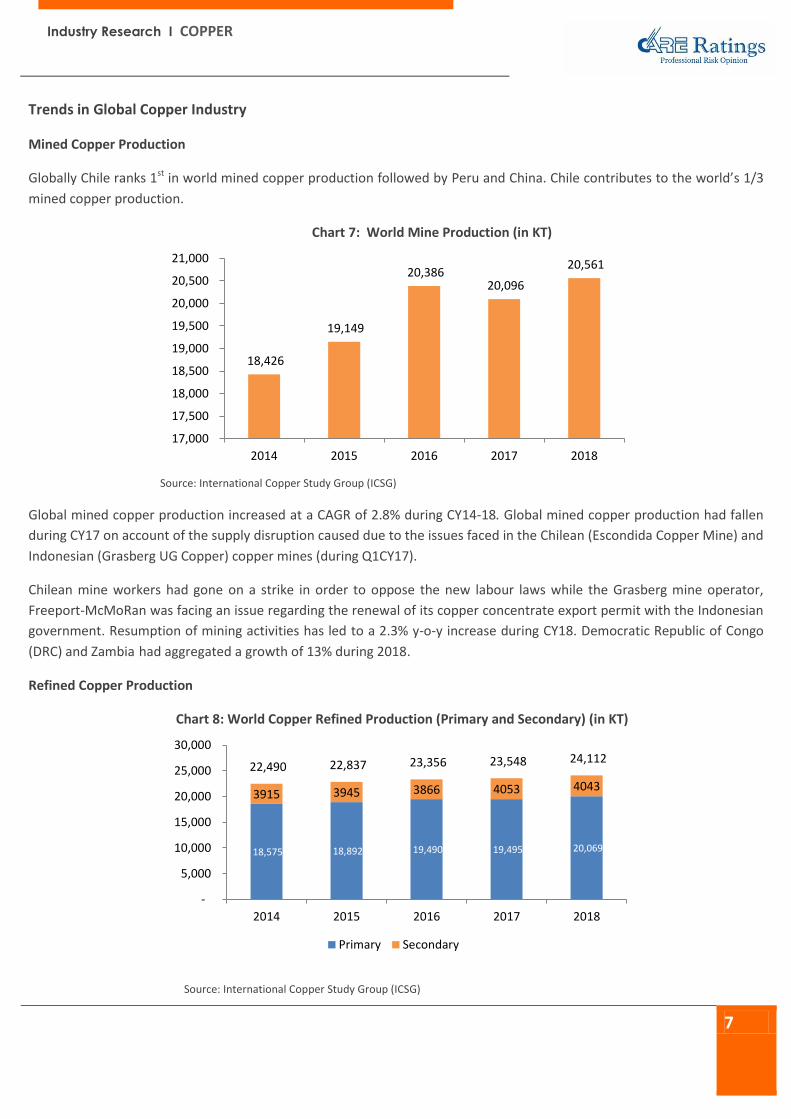
Mined Copper Production
Globally Chile ranks 1st in world mined copper production followed by Peru and China. Chile contributes to the world’s 1/3
mined copper production.
Chart 7: World Mine Production (in KT)
Source: International Copper Study Group (ICSG)
Global mined copper production increased at a CAGR of 2.8% during CY14-18. Global mined copper production had fallen
during CY17 on account of the supply disruption caused due to the issues faced in the Chilean (Escondida Copper Mine) and
Indonesian (Grasberg UG Copper) copper mines (during Q1CY17).
Chilean mine workers had gone on a strike in order to oppose the new labour laws while the Grasberg mine operator,
Freeport-McMoRan was facing an issue regarding the renewal of its copper concentrate export permit with the Indonesian
government. Resumption of mining activities has led to a 2.3% y-o-y increase during CY18. Democratic Republic of Congo
(DRC) and Zambia had aggregated a growth of 13% during 2018.
Refined Copper Production
Chart 8: World Copper Refined Production (Primary and Secondary) (in KT)
Source: International Copper Study Group (ICSG)
18,426
19,149
20,386 20,096
20,561
17,000
17,500
18,000
18,500
19,000
19,500
20,000
20,500
21,000
2014 2015 2016 2017 2018
18,575 18,892 19,490 19,495 20,069
3915 3945 3866 4053 4043
22,490 22,837 23,356 23,548 24,112
-
5,000
10,000
15,000
20,000
25,000
30,000
2014 2015 2016 2017 2018
Primary Secondary
Industry Research I COPPER
8
Global refined copper production has grown at a CAGR of 1.8% during CY14-18. In 2017, China accounted for 38% of world
copper refined production, followed by Chile (10%), Japan (6%) and the United States (5%).
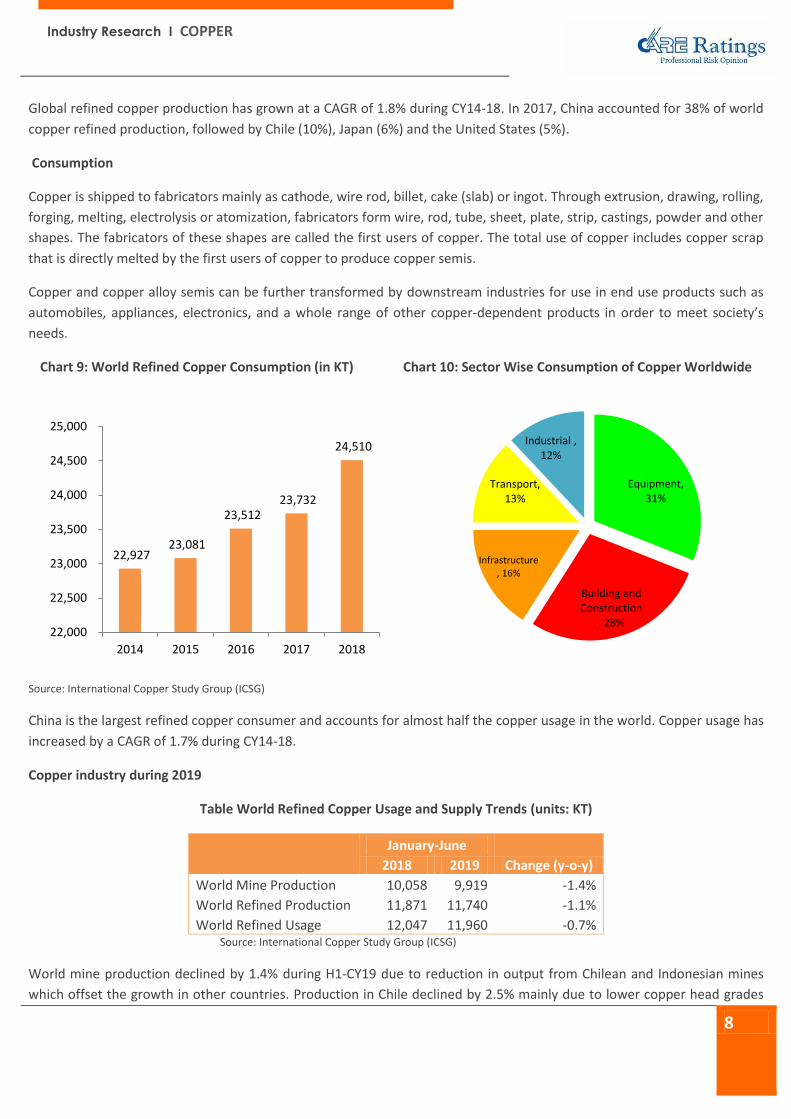
Consumption
Copper is shipped to fabricators mainly as cathode, wire rod, billet, cake (slab) or ingot. Through extrusion, drawing, rolling,
forging, melting, electrolysis or atomization, fabricators form wire, rod, tube, sheet, plate, strip, castings, powder and other
shapes. The fabricators of these shapes are called the first users of copper. The total use of copper includes copper scrap
that is directly melted by the first users of copper to produce copper semis.
Copper and copper alloy semis can be further transformed by downstream industries for use in end use products such as
automobiles, appliances, electronics, and a whole range of other copper‐dependent products in order to meet society’s
needs.
Chart 9: World Refined Copper Consumption (in KT) Chart 10: Sector Wise Consumption of Copper Worldwide
Source: International Copper Study Group (ICSG)
China is the largest refined copper consumer and accounts for almost half the copper usage in the world. Copper usage has
increased by a CAGR of 1.7% during CY14-18.
Copper industry during 2019
Table World Refined Copper Usage and Supply Trends (units: KT)
January-June
2018 2019 Change (y-o-y)
World Mine Production 10,058 9,919 -1.4%
World Refined Production 11,871 11,740 -1.1%
World Refined Usage 12,047 11,960 -0.7% Source: International Copper Study Group (ICSG)
World mine production declined by 1.4% during H1-CY19 due to reduction in output from Chilean and Indonesian mines
which offset the growth in other countries. Production in Chile declined by 2.5% mainly due to lower copper head grades
22,927 23,081
23,512 23,732
24,510
22,000
22,500
23,000
23,500
24,000
24,500
25,000
2014 2015 2016 2017 2018
Equipment, 31%
Building and Construction
, 28%
Infrastructure , 16%
Transport, 13%
Industrial , 12%

Industry Research I COPPER
9
and concentrate production in Indonesia declined by 55% as a consequence of the transition of the country’s major two
mines to different ore zones. On the other hand production in Peru, Australia, China and Mongolia increased due to
improved grades.
World refined production declined by 1.1% with primary production declining by 1.5% and secondary production (from
scrap) increasing by 1%. Total Chilean refined production declined by 15% due to temporary smelter shutdowns whilst
undergoing upgrades to comply with new environmental regulations. Shutdown of Vedanta’s Tuticorin also added to the
decline in worldwide production. Zambian refined output fell by 28% due to power supply interruptions, smelter outages
due to the introduction of a 5% custom duty on copper concentrate imports which constrained the smelter feed. Output
from Japan, Peru, the United States and a few European countries also declined due to smelter maintenance shutdowns.
However these reductions were largely offset by growth in Chinese output and by increases in countries recovering from
production constraints in 2018 such as Australia, Brazil, Iran and Poland.
World apparent refined usage of copper has declined by 0.7% and World ex-China usage declined by 3% in the current
calendar year January to June period. Although Chinese net refined copper imports declined by 16%, the apparent usage
grew by around 3% given the increase in higher domestic output. Demand had increased in India and Taiwan but declined
in the EU and Japan.
Global Copper Price movements
Prices of copper are usually affected by demand – supply dynamics and macroeconomic factors. LME daily publishes
inventory levels of copper which also has a direct impact on the prices of copper and on the stock prices of copper
producing companies.
Prices of the commodity is also influenced by the economic growth of the major copper consuming countries like China,
USA, Japan and Germany and the dollar index. Growth and development of the infrastructure, telecom, real estate and
electrical industry directly affect the prices of Copper.
Chart 11: Price movements of LME Copper (USD/tonne)
5221 5159
6444 6343
5954
5000
5200
5400
5600
5800
6000
6200
6400
6600
2015-16 2016-17 2017-18 2018-19 2019-20*

Industry Research I COPPER
10
Source: LME
*April-September (till date)
Global copper prices rose by 25% during FY18. Prices had risen on account of supply side distortions due to the disruptions
in the Chilean and Indonesian mines. Price had also rallied due to pick-up of demand in China and also because of the
shutdown of polluting smelters in China, which have not been following the efficiency norms. The Chinese government had
taken a stance to improve the air quality and reduce pollution in the country.
Prices decreased marginally by 1.6% during FY19. The tariff war between the US and China, appreciation of the US dollar
against major currencies and slowdown in the global economy led to copper prices being subdued throughout FY19.
The continued tariff war and rising tension between US and China has further continued in the current financial year i.e.
FY20 which has led to copper prices to further decline.
Financials of Copper Companies
To understand the financial performance of the copper industry we have analysed the sales/revenues and operating
margins of the three major players which dominate the Indian Copper market. We have considered the segmented sales
and operating profits of Vedanta and Hindalco (Copper division) and the standalone financial statements for Hindustan
Copper.
The profitability of Indian Copper Companies largely depends on the Treatment Charges and Refinery Charges (TC/RC). In a
nutshell it is the TC/RC is the fees smelters charge miners for processing the concentrates. They are amounts designed to
cover refining costs. Now for example copper concentrate contracts may define a purchase price based on LME price on a
certain date minus the TC or RC being used at the time.
5,500
5,700
5,900
6,100
6,300
6,500
6,700
6,900
7,100
7,300
7,500
3-A
pr-
18
13
-Ap
r-1
82
5-A
pr-
18
8-M
ay-1
81
8-M
ay-1
83
1-M
ay-1
81
2-J
un
-18
22
-Ju
n-1
84
-Ju
l-1
81
6-J
ul-
18
26
-Ju
l-1
87
-Au
g-1
81
7-A
ug-
18
30
-Au
g-1
81
1-S
ep
-18
21
-Se
p-1
83
-Oct
-18
15
-Oct
-18
25
-Oct
-18
6-N
ov-
18
16
-No
v-1
82
8-N
ov-
18
10
-Dec
-18
20
-Dec
-18
4-J
an-1
91
6-J
an-1
92
8-J
an-1
97
-Fe
b-1
91
9-F
eb
-19
1-M
ar-1
91
3-M
ar-1
92
5-M
ar-1
94
-Ap
r-1
91
6-A
pr-
19
30
-Ap
r-1
91
3-M
ay-1
92
3-M
ay-1
95
-Ju
n-1
91
7-J
un
-19
27
-Ju
n-1
99
-Ju
l-1
91
9-J
ul-
19
31
-Ju
l-1
91
2-A
ug-
19
22
-Au
g-1
93
-Se
p-1
91
3-S
ep
-19
25
-Se
p-1
9

Industry Research I COPPER
11
Chart 12: Revenue juxtaposed with LME Copper Prices Chart 13: Operating Profit Margin (in %)
Source: Company Annual Reports, BSE
Cumulative sales revenue of the copper industry has declined by 6.6% during FY15-19. Revenues of the industry largely
depend on the copper prices prevailing in the global economy. LME copper prices started declining and have been
supressed ever since due to the US-China trade war which commensurate in lowering the revenues of copper producers
during FY19. Shutdown of the Tuticorin smelter too resulted in the fall of revenues by 32.1% during FY19 on a y-o-y basis.
Even in the current financial year, revenues have dropped by 17.3% and copper prices have fallen by 11.1% during Q1-
FY20.
Operating profits largely depend on the TC/RC margins. Higher TC/C margins are favourable to companies as it increases
their profitability. Mine strikes and shortages/unavailability of copper concentrates has resulted in the fall of the TC/RC
margins in the last few years which has resulted in suppressing the margins of copper manufacturers as well.
Conclusion/Outlook:
With the permanent closure of the Tuticorin smelter, and the uncertainty surrounding with its remission, we believe by the
end of FY20, refined copper production will be around 450 KT, registering a 1.5% drop from its FY19 level of production.
Production of copper till date is 167 KT (April-July).
Demand for the domestic copper market is dependent largely on the electrical & telecommunications (56%), building &
construction (8%), automobiles (11%) and the consumer durables segments (8%). We estimate domestic refined copper
demand to increase by 7-8% (including consumption of scrap) by the end of FY20.
The growing demand from the power sector, the government’s thrust on renewable energy and increasing demand
from the households for consumer durables will add onto the demand for copper in India.
Manufacturing of hybrid and electric cars will also augment the consumption of copper as EVs use 4 times more
copper than traditional internal combustion engines.
Due to the increase in demand, India will continue being a net importer of refined copper during FY20 as well, unless the
Madurai court passes the judgement for the remission of the Tuticorin smelter.
5,000
5,200
5,400
5,600
5,800
6,000
6,200
6,400
6,600
6,800
7,000
5,000
55,000
105,000
155,000
205,000
255,000
305,000
355,000
405,000
455,000
20
14
-15
20
15
-16
20
16
-17
20
17
-18
20
18
-19
Q1
-FY1
9
Q1
-FY2
0
8.5
10.4
8.1
6.6
5.0
4.2 4.3
3.0
4.0
5.0
6.0
7.0
8.0
9.0
10.0
11.0
20
14
-15
20
15
-16
20
16
-17
20
17
-18
20
18
-19
Q1
-FY1
9
Q1
-FY2
0

Industry Research I COPPER
12
Global copper prices will be suppressed and will range between USD 5,500-5,900/tonne.
Till there isn’t a constructive trade deal reached between the US and China, Copper prices are going to be subdued
We also expect TC/RC margins to remain under pressure owing to the supply side disruptions from the major mining areas
(Chile mining strike).
This could act as a double whammy for copper manufacturers given global copper prices are already low and low
TC/RC margins will affect smelters earning capacity potentially affecting the overall financials of the copper
industry.
Annexures
Process of Manufacturing Copper
Copper is never found as a whole. When it is mined, Copper ore typically contains less than 1% of Copper. Mined Copper
ore has to go through a variety of physical and chemical processes to become market ready. Market ready refined copper,
refers to copper cathodes which is 99.99% pure copper. The most common types of ore are copper oxide and copper
sulfide.
The first few steps in copper processing are common to both the Copper ores. After mining, the first major step in getting
copper ready for market is concentration. The copper is concentrated by slurrying the ground ore with water and chemical
reagents. The copper is then removed with a skimmer. At the end of this step, copper concentrations are typically between
24 and 40%.
After the concentration is complete, the next phase involves creating market-ready copper. That typically takes place at a
refining plant/smelter. Through copper refining, unwanted material is progressively removed and copper is concentrated
up to 99.99% purity, the standard for Grade A copper.
Now the copper ore is processed according to the content the ore contains. If the copper ore is rich in sulfides it is
processed through Pyrometallurgy and if the copper ore is rich in oxides it is process through Hydrometallurgy.
Pyrometallurgy uses the application of heat to separate the copper ore from the sulfides whereas Hydrometallurgy uses
water to extract the copper from the ore. Since each mine site is unique in its mineral composition, concentration, and
quantities, the most economical and profitable processing of ore must be determined by the mine planners.

Industry Research I COPPER
13
Chart: Process of copper refining through Hydrometallurgy
Heap Leaching
•The leaching reagent (dilute sulfuric acid) is sprayed through sprinklers on top of the heap pile and allowed to trickle down through the heap, where it dissolves the copper from the ore.
•The resulting solution of sulfuric acid and copper sulfate is collected in a small pool. The copper compound can now be seen at concentrations of between 60-70%.
Solvent Extraction
•The leach solution is mixed vigorously with a solvent. The copper migrates from the leach solution into the solvent.
•The two liquids are then allowed to separate based on solubility, with copper remaining in solution in the solvent, and impurities remaining in the leach solution
Electrowinning
•An electrical current passes through an inert anode (positive electrode) and through the copper solution from the previous step, which acts as an electrolyte.
•Positively-charged copper ions (called cations) come out of solution and are plated onto a cathode (negative electrode) as 99.99% pure copper.

Industry Research I COPPER
14
Chart : Process of copper refining through Pyrometallury
The finished copper cathodes can then be made into wires, plates, tubes, and other copper products. Downstream sector
of copper includes value-added products such as sheet, strip, foil, wire rod, wire, etc
Froth Floatation
•The copper ore is crushed and a liquid is added to make it a slurry which is a mix of worthless” rock, called gangue. The slurry is placed in a tank and a process called froth floatation is used to separate the copper minerals from the gangue.
•Chemical reagents called “collectors” are added to the slurry and bind to the copper particles, making them hydrophobic, or waterproof.
•Pipes are used to blow air into the bottom of the tank to create bubbles, which rise to the surface, taking the waterproof copper sulfide particles along. The froth of copper-rich bubbles at the top of the tank is then skimmed off for further processing.
Thickening
• The froth is poured into large tanks called thickeners where the bubbles break and solids from the froth solution settle at the bottom of the tank.
•The solids are then filtered to remove excess water, which can be reused in processing additional batches of sulfide ore.
Smelting
•High temperatures are used to further purify the ore in a series of smelting steps. The
copper concentrate is first sent through the smelting furnace to be heated up and converted into molten liquid. The heated liquid is poured into a slag-settling furnace.
•The copper matte created by the smelting furnace contains 58-60% copper. The molten matte is then taken to another furnace called a converter to have the remaining iron and sulfur burned off.The resulting product, molten anode copper, is poured into molds called anode-casting wheels.
Electrolysis
•An electric current is applied, and positively-charged copper ions leave the anode and move in solution through the electrolyte solution to be plated on the cathode.
•After 14 days of electrolysis, the anodes have gradually disappeared, and the copper cathodes now contain 99.99% pure copper. The cathodes are taken out of the tank and rinsed with water to prevent further reaction
CARE Ratings Limited (Formerly known as Credit Analysis & Research Ltd) Corporate Office: 4th Floor, Godrej Coliseum, Somaiya Hospital Road, Off Eastern Express Highway, Sion (East), Mumbai - 400 022. Tel: +91-22-6754 3456 I Fax: +91-22-6754 3457 E-mail: [email protected] I Website: www.careratings.com I CIN: L67190MH1993PLC071691
Follow us on /company/CARE Ratings
/company/CARE Ratings
Related Documents