Briefing Key Personnel What's New 27 Speeches 34 Key Macroeconomic Indicators Domestic World 59 61 Outstanding Government Debt 62 Market Roundup Macro-Economic Overview Market Overview 40 50 CCIL Indices 74 Primary Market Analysis 76 Milestones 151 154 Money Market Foreign Exchange Market Derivatives Interest Rate Movement Government Securities Market Statistics Corporate Bonds Benchmark Rates 78 116 123 134 137 147 105 81 CONTENTS CONTENTS Managing Director's Message 5 Infocus RBI ANNUAL REPORT 2015-16 Report of the Working Group on Development of Corporate Bond Market in India 7 Article Summary 22 Measuring GDP in a Digitalised Economy The role of collateral in supporting liquidity

Welcome message from author
This document is posted to help you gain knowledge. Please leave a comment to let me know what you think about it! Share it to your friends and learn new things together.
Transcript
Briefing
Key Personnel
What's New 27
Speeches 34
Key Macroeconomic Indicators
Domestic
World
59
61
Outstanding Government Debt 62
Market Roundup
Macro-Economic Overview
Market Overview
40
50
CCIL Indices 74
Primary Market Analysis 76
Milestones 151
154
Money Market
Foreign Exchange Market
Derivatives
Interest Rate Movement
Government Securities Market
Statistics
Corporate Bonds
Benchmark Rates
78
116
123
134
137
147
105
81
C O N T E N T SC O N T E N T S
Managing Director's Message 5
Infocus
RBI ANNUAL REPORT 2015-16
Report of the Working Group on Development of Corporate Bond Market in India
7
Article Summary 22
Measuring GDP in a Digitalised Economy
The role of collateral in supporting liquidity

STATISTICS
TABLESTABLE 1 : DOMESTIC INDICATORS ......................................................................................................... 59
TABLE 2 : WORLD ECONOMIC INDICATORS ...................................................................................... 61
TABLE 3 : OUTSTANDING GOVERNMENT DEBT ............................................................................. 62
TABLE 4 : STATE DEVELOPMENT LOANS (SDLS) OUTSTANDING............................................ 70
TABLE 5 : CONSOLIDATED OUTSTANDING ....................................................................................... 71
TABLE 6 : ANALYSIS OF OUTSTANDING BONDS .............................................................................. 73
TABLE 7 : INDEX COMPOSITION .............................................................................................................. 74
TABLE 8 : INDEX PERFORMANCE ANALYSIS ..................................................................................... 75
TABLE 9 : SECURITIES & MONEY MARKET (PRIMARY) : COMPARATIVE DATA .................. 76
TABLE 10 : LIQUIDITY ANALYSIS ................................................................................................................ 77
TABLE 11 : CCIL SETTLEMENT DETAILS ................................................................................................. 78
TABLE 12 : CATEGORYWISE BUYING ACTIVITY .................................................................................. 79
TABLE 13 : CATEGORYWISE SELLING ACTIVITY ................................................................................ 79
TABLE 14 : COMPARABLE RATES (%) ......................................................................................................... 80
TABLE 15 : PROPRIETARY / CONSTITUENT SETTLEMENT ANALYSIS .......................................... 81
TABLE 16 : DEAL SIZE ANALYSIS ................................................................................................................. 82
TABLE 17 :
TABLE 20 : TENOR WISE ACTIVITY - CENTRAL GOVERNMENT DATED SECURITIES ...... 85
TABLE 21 : NETTING FACTOR - FUNDS ................................................................................................... 86
TABLE 22 : NETTING FACTOR: SECURITIES ........................................................................................... 87
TABLE 23 : LIQUIDITY ANALYSIS FOR CENTRAL GOVERNMENT SECURITIES TRANSACTED
DURING THE MONTH ....................................................................................................... 88
TABLE 24 : MARKET SHARE OF TOP 'N' SECURITIES ........................................................................ 92
TABLE 25 : MARKET SHARE OF MEMBERS IN OUTRIGHT SETTLEMENT ................................. 92
TABLE 26 : MARKET SHARE OF TOP FIVE MEMBERS (CATEGORYWISE) ................................... 93
TABLE 27 : TRADING PLATFORM ANALYSIS OF OUTRIGHT TRADES ........................................ 93
TABLE 29 : MARKET SHARE IN PROPRIETARY TRADES ............................................................... 94
TABLE 30 : MARKET SHARE IN CONSTITUENT TRADES ................................................................ 95
TABLE 31 : TURNOVER RATIO .................................................................................................................... 95
TABLE 32 : NET MARKET ACTIVITY IN G-SEC TRADING ................................................................ 96
GOVERNMENT SECURITIES MARKET
T+2 SETTLEMENT SUMMARY ............................................................................................... 83
TABLE 18: : T+2 TRADES - HISTORICAL SETTLEMENT SUMMARY ............................................... 83
TABLE 19 : INSTRUMENT WISE BREAKUP OF OUTRIGHT TRADES ........................................... 84
TABLE 28 : WHEN-ISSUED TRADING HISTORICAL ............................................................................. 94
TABLE 28A : WHEN-ISSUED TRADING DETAILS .................................................................................... 94
TABLE 33 : TRADING SUMMARY ................................................................................................................ 97
TABLE 34 : G-SEC TRADING ANALYSIS .................................................................................................... 98
TABLE 35 : T-BILL TRADING ANALYSIS ................................................................................................... 99
TABLE 36 : SDL TRADING ANALYSIS ........................................................................................................ 100
TABLE 37 : LIQUIDITY OF TRADES GREATER THAN 5 CRORE (G-SEC) .................................... 101
TABLE 38 : LIQUIDITY DISTRIBUTION (G-SEC) .................................................................................... 103
TABLE 39 : MONEY MARKET VOLUMES ................................................................................................ 105
MONEY MARKET

TABLE 40 : CBLO TRADING........................................................................................................................... 105
TABLE 41 : REPO TERM ANALYSIS .............................................................................................................. 106
TABLE 42 : INSTRUMENTWISE SETTLEMENT OF REPO TRADES ................................................ 106
TABLE 43 : CROMS TRADING ACTIVITY .................................................................................................. 107
TABLE 44 : CROMS HISTORICAL SUMMARY............................................................................................ 107
TABLE 45 : TOP 5 SECURITIES - BASKET REPO ..................................................................................... 108
TABLE 46 : TOP 5 SECURITIES - SPECIAL REPO .................................................................................... 108
TABLE 47 : DEALT TRANSACTIONS ON THE NDS-CALL PLATFORM .......................................... 108
TABLE 48 : OTC DEALS REPORTED ON THE NDS-CALL SYSTEM .................................................. 109
TABLE 49 : UNCOLLATERALISED OVERNIGHT TRANSACTIONS (%) ............................................ 110
TABLE 50 : OVERNIGHT TRANSACTIONS DEALT ON NDS-CALL PLATFORM (%) .................... 111
TABLE 51 : OVERNIGHT TRANSACTIONS REPORTED ON NDS-CALL PLATFORM (%) ........... 112
TABLE 52 : CALL MARKET AND FBIL O/N MIBOR - RATES (%) ....................................................... 113
TABLE 53 : TENORWISE ANALYSIS OF TERM MONEY TRANSACTIONS ........................................ 114
TABLE 54 : NDS-CALL HISTORICAL ............................................................................................................ 115
TABLE 55 : FOREX SETTLEMENT ................................................................................................................ 116
TABLE 56 : FOREX TRADE TYPE ANALYSIS ........................................................................................... 117
TABLE 57 : FOREX DEAL SIZE ANALYSIS ................................................................................................ 117
TABLE 58 : TENORWISE FORWARD TRADES ANALYSIS ................................................................... 118
TABLE 59 : MARKET SHARE - FOREX ........................................................................................................ 118
TABLE 60 : CATEGORYWISE FOREX ACTIVITY - DEAL TYPE ........................................................ 119
TABLE 61 : NETTING FACTOR - FOREX ................................................................................................... 119
TABLE 62 : FOREX FORWARD SETTLEMENT STATISTICS ............................................................... 120
TABLE 63 : CLS SETTLEMENT ....................................................................................................................... 120
TABLE 64 : CURRENCY WISE GROSS SETTLEMENT ........................................................................... 121
TABLE 65 : TOP 5 CURRENCY PAIRS - CLS ............................................................................................. 121
TABLE 66 : TRADING DETAILS - FX CLEAR ............................................................................................ 122
TABLE 67 : INTEREST RATE SWAP TRANSACTIONS (MATCHED) ................................................. 123
TABLE 68 : INTEREST RATE SWAP (MIBOR) MARKET SHARE ........................................................ 123
TABLE 69 : INTEREST RATE SWAP (MIFOR) MARKET SHARE ........................................................ 124
TABLE 70 : TOP ‘N’ MARKET SHARE - IRS .............................................................................................. 124
TABLE 71 : IRS TRADE SUMMARY (MATCHED) ................................................................................... 124
TABLE 72 : OUTSTANDING POSITION IN IRS TRANSACTIONS ..................................................... 125
TABLE 73 : NETTING FACTOR - IRS NON-GUARANTEED SETTLEMENT ................................... 125
TABLE 74 : TRADED VOLUME FOR OTC INTERBANK FCY - INR FORWARDS ....................... 126
TABLE 75 : TRADED VOLUME FOR OTC INTERBANK FCY - INR OPTIONS ........................... 127
TABLE 76 : TRADED PRINCIPAL AMOUNT FOR OTC INTERBANK FCY - INR CROSS CURRENCY
SWAPS .................................................................................................................. 128
TABLE 77 : TRADED VOLUME FOR OTC INTERBANK FCY - FCY FORWARDS ......................... 129
TABLE 78 : TRADED VOLUME FOR OTC INTERBANK FCY - FCY OPTIONS .......................... 130
TABLE 79 : TRADED PRINCIPAL AMOUNT FOR OTC INTERBANK FCY - FCY CROSS
CURRENCY SWAPS ................................................................................................................. 130
TABLE 80 : TRADED NOTIONAL PRINCIPAL FOR OTC INTERBANK FCY - IRS .................... 131
TABLE 81 : OUTSTANDING VOLUME FOR OTC INTERBANK FCY - INR FORWARDS ........... 132
FOREIGN EXCHANGE MARKET
DERIVATIVES

TABLE 82 : OUTSTANDING VOLUME FOR OTC INTERBANK FCY - INR OPTIONS ............... 132
TABLE 83 : OUTSTANDING PRINCIPAL AMOUNT FOR OTC INTERBANK FCY - INR
CROSS CURRENCY SWAPS .................................................................................................... 132
TABLE 84 : OUTSTANDING VOLUME FOR OTC INTERBANK FCY - FCY FORWARDS .......... 132
TABLE 85 : OUTSTANDING VOLUME FOR OTC INTERBANK FCY - FCY OPTIONS ............... 132
TABLE 86 : OUTSTANDING PRINCIPAL AMOUNT FOR OTC INTERBANK FCY -
FCY CROSS CURRENCY SWAPS ......................................................................................... 133
TABLE 87 : OUTSTANDING NOTIONAL PRINCIPAL FOR OTC INTERBANK FCY - IRS ........ 133
TABLE 88 : SPREAD ANALYSIS - SDL .......................................................................................................... 135
TABLE 89 : YIELD MOVEMENT .................................................................................................................... 136
TABLE 90 : PRIMARY MARKET ISSUANCE OF CORPORATE BONDS .......................................... 137
TABLE 91 : ANALYSIS OF CORPORATE BOND ISSUANCE ................................................................ 138
TABLE 92 : RATING ANALYSIS OF CORPORATE BOND ISSUANCES ........................................... 138
TABLE 93 : TOP 5 ISSUANCES .................................................................................................................... 139
TABLE 94 : SECTOR ANALYSIS ...................................................................................................................... 139
TABLE 95 : CATEGORY ANALYSIS ............................................................................................................... 139
TABLE 96 : NON-FIXED RATE BOND ISSUANCE ANALYSIS ............................................................. 139
TABLE 97 : CORPORATE BONDS TRADING DETAILS ....................................................................... 140
TABLE 98 : HISTORICAL SUMMARY ....................................................................................................... 140
TABLE 99 : TRADING ANALYSIS ............................................................................................................... 141
TABLE 100 : RATING ANALYSIS .................................................................................................................. 141
TABLE 101 : CATEGORY ANALYSIS .............................................................................................................. 142
TABLE 102 : BOND TYPE ANALYSIS ........................................................................................................... 142
TABLE 103 : SPREAD ANALYSIS ...................................................................................................................... 142
TABLE 104 : CATEGORY ANALYSIS - HISTORICAL ................................................................................... 142
TABLE 105 : RATING ANALYSIS - HISTORICAL ......................................................................................... 143
TABLE 106 : SPREAD ANALYSIS - HISTORICAL .......................................................................................... 143
TABLE 107 : TOP 25 TRADED CORPORATE BONDS .............................................................................. 144
TABLE 108 : CDs AND CPs TRADING DETAILS ........................................................................................ 145
TABLE 109 : HISTORICAL SUMMARY ...................................................................................................... 145
TABLE 110 : TENORWISE TRADING ANALYSIS CDs ................................................................................. 146
TABLE 111 :
TABLE 112 :
TABLE 113 :
TABLE 114 :
CHART 1 : ZERO COUPON YIELD CURVE .............................................................................................. 134
CHART 2 : SOVEREIGN YIELD CURVE ..................................................................................................... 134
INTEREST RATE MOVEMENT
CORPORATE BONDS
CERTIFICATE OF DEPOSIT AND COMMERCIAL PAPERS
BENCHMARK RATES
CHARTS
COMPARISON OF FBIL TERM MIBOR AND CD WEIGHTED AVERAGE RATE (%) 147
148
FBIL FC-RUPEE OPTION VOLATILITY MATRIX RATES - 25 DELTA RISK REVERSAL (%) 149
FBIL FC-RUPEE OPTION VOLATILITY MATRIX RATES - 25 DELTA STRANGLE (%) 150
FBIL FC-RUPEE OPTION VOLATILITY MATRIX RATES - AT THE MONEY (ATM) VOLS (%)

Message from MDMessage from MD
Dear Colleagues,
Financial markets in India have been able to
achieve stability for the last few quarters
with growth slowly picking up and the Indian
Rupee being relatively less volatile vis-à-vis
many emerging market currencies.
Recessionary conditions are gradually
diminishing in Brazil and Russia, but the
near-term outlook is still fragile due to
policy uncertainties and soft commodity
prices. The flow from foreign investors to
Indian markets has been positive and the
equity market has witnessed some buying
which moved benchmark indices northward.
That has been aided by stable rainfall -
almost normal with only a marginal deficit.
The normal rainfall would help in keeping a
rein on inflationary pressures. Oil prices,
which moved upward temporarily, have been
stable and remained below USD50 helping
non-oil emerging countries like India.
Last GDP data release showed a marginal
drop in growth for Q1 of 2016-17. The
inflation data (both CPI and WPI) does not
show any immediate concern for policy
makers. The global commodity price stability
has helped in keeping domestic inflation at
manageable levels. Liquidity pressure has
come down in recent months after infusion of
liquidity by Reserve Bank of India through
OMO auctions and higher Government
spending.
RBI announced new policies for deepening the
corporate bond market. These measures are
intended to aid in market development,
enhance participation, facilitate greater
market liquidity and improve communication.
Accepting many of the recommendations of the
Khan Committee to develop the corporate bond
market, RBI has decided to enhance the
aggregate limit of partial credit enhancement
provided by banks, permit brokers in corporate
bond repos, authorise the platform for repo in
corporate bonds and encourage credit supply
for large borrowers through market
mechanism. Suitable legal amendments may
have to be made in the existing legal framework
in case RBI decides to accept corporate bonds
under current LAF mechanism as collateral.
Banks are also being permitted to issue Masala
Bonds for their capital requirements and for
financing infrastructure and affordable
housing. The FPIs will be eligible to avail the
facility to trade directly in corporate bonds.
These measures are likely to be helpful for
developing the corporate bond market in India.
R. Sridharan

of the month
•
•
•
•
On September 8, 2016, CCIL conducted the 11th cycle of the Portfolio Compression
exercise in the OTC Interest Rate Swaps market. The exercise achieved a compression of
84% and a market-wide reduction of notional outstanding of 2,18,958.79 crore.
FX-SWAP Dealing System registered its highest daily volume of USD 730.00 million on
September 6, 2016.
Trades on the ASTROID (the Anonymous IRS Dealing System) recorded their highest level
of 6,700 crore on September 14, 2016.
CBLO volumes recorded their all-time high volumes of 1,16,232.60 crore on September
15, 2016.
`
`
`
Against the backdrop of a global environment
characterized by weak growth and heightened
financial market volatility, the Indian economy
posted gains in 2015-16 and the underlying
conditions improved, scaling up the growth
momentum. Progress of the southwest monsoon
augurs well for agriculture and the rural economy,
while the seventh pay commission award would
provide a stimulus to consumption spending
within the targeted fiscal deficit. On the external
front, indicators of external sustainability
improved noticeably during the year and foreign
direct investment (FDI) recorded the highest
annual net inflow. On the flipside, sluggishness in
the industrial sector continues, and the capex cycle
and private investment activity remains weak.
Further, the banking sector has been dealing with
stress on account of deterioration in corporate
balance sheets and loan quality, necessitating
efforts to free up credit flows to the productive
sectors of the economy.
The modest acceleration in real GDP growth in
2015-16 was supported by private consumption.
The significant improvement in corporate
profitability, on account of saving on input costs
and sales growth, is expected to boost corporate
saving and translate into investment spending.
However, on the production side, agriculture
weathered two consecutive years of drought
conditions and posted a modest growth during the
year. Industrial output weakened during the year
and consumer non-durables posted a decline after
consecutive years of expansion, mainly on account
of contraction/deceleration in fast moving
consumer goods, reflecting the subdued state of
rural demand. The services sector witnessed a
deceleration across all constituents as new business
orders slowed and exports were impacted by weak
external demand. Notable progress was seen in the
infrastructure space, with electricity generation
recording the highest ever annual capacity addition
in the solar and wind energy segments. There was
significant improvement in the road sector in terms
of new constructions and also in the railways sector
in terms of capital investment, commissioning of
broad gauged lines and electrification of railway
tracks. Major Indian ports recorded the highest
capacity addition during the year.
The inflation conditions which eased in the first
few months of 2016 on the back of the seasonal
decline in prices of fruits and vegetables picked up
again from May 2016 as food prices firmed up
ahead of the onset of the monsoon. Monetary
conditions reflected an interplay of diverse factors
as demand for currency drove up the expansion of
reserve money and muted the money multiplier
which, in turn, moderated the rate of money
supply. Bank credit which was sluggish in the first
half of the year, picked up in the retail segment,
industry and agriculture in the second half of the
year. Timely recognition of the deterioration in
banks' balance sheets through the Reserve Bank's
asset quality review resulted in the overall stressed
assets ratio rising marginally by end-March 2016
from its level a year ago, with a rise in the gross NPA
ratio but a fall in the restructured assets ratio. In the
external sector, a faster pace of contraction in
imports relative to exports and large terms of trade
gains narrowed the current account deficit to 1.1%
of GDP, which was comfortably financed along
with sizable accretion to reserves.
Assessment: 2015-16
RBI ANNUAL REPORT 2015-16
CC
ILM
on
thly
Ne
wsl
ett
er
Se
pte
mb
er
20
16
INFOCUS
7

CC
ILM
on
thly
Ne
wsl
ett
er
Se
pte
mb
er
20
16
Prospects: 2016-17
The near-term domestic outlook appears to be
brighter than the outcome for 2015-16, despite the
weak outlook for the global economy due to the
Brexit referendum. Although a pick-up in
investment activity remains a concern,
consumption is expected to provide support to
aggregate demand and may receive a boost from the
revival of rural demand in response to the well-
distributed southwest monsoon and the seventh
pay commission's award. However, industrial
activity and export demand is likely to remain slack
in the coming months, unless the industrial
activity is supported by the recent Government
measures including 100% FDI in defence, civil
aviation, pharmaceuticals and broadcasting.
Service sector activity is likely to receive a stimulus
in public administration, defence and other
services as public expenditure on wages, salaries
and pensions translates into disposable incomes.
The central government's commitment to the fiscal
consolidation path in 2016-17 has enhanced the
credibility of fiscal policy, thus helping in
anchoring inflation expectations and improving
the business environment. The passage and
implementation of the Goods and Services Tax
(GST) Bill is expected to boost trade, investment
and growth by reducing supply chain rigidities,
encouraging scale economies, cutting down
transportation and transaction costs, as also
promoting efficiency gains.
India's external position seems viable and well-
buffered to sustain a pick-up in non-oil non-gold
imports, although the external environment
continues to pose challenges stemming from large
currency movements, a rising incidence of
protectionist measures, swift and massive
movements of capital and the amplification of
uncertainty by the Brexit vote. Although the
outlook for capital inflows is optimistic with the
recent liberalization of FDI policy, the repayment
of FCNR (B) deposits which is due under the
special swap scheme needs to be managed carefully.
Among the various structural reforms initiated, the
UDAY scheme has provided DISCOMs an
opportunity to regain financial viability. In the
banking sector, the enactment of the Insolvency
and Bankruptcy Code would help sick companies
to either wind up or turn around, and for investors
to exit. Amendments to strengthen the Debt
Recovery Tribunals for speedier resolution of
stressed assets have been passed. Efforts need to be
made to re-energise asset reconstruction companies
(ARCs) by resolving issues relating to their capital
requirements and enabling price discovery for
NPAs/security receipts so that they can be traded in
open, competitive markets that ensure liquidity. In
order to intensify structural reforms in factor
markets, particularly land and labour, initiatives
are being taken by state governments, such as
amendment of labour laws, and a transparent and
viable framework for land acquisition processes.
The National Agriculture Market (NAM), a pan-
India electronic trading platform is an important
step towards improving marketing infrastructure.
India witnessed a moderate pick-up in pace in the
second half of the year despite truncating
investment and persistent global uncertainties.
Government continued its fiscal consolidation
roadmap in 2015-16. Net exports remained muted
in the midst of suppressed global demand. Despite
this, trade deficit dwindled due to the pace of
contraction of imports surpassing that of exports,
and in part due to gains in net terms of trade. A
holistic view of the Indian economy portrays
sound macroeconomic fundamentals buttressed by
slumping inflation and narrowing twin deficits.
Economic Review
INFOCUS
8

The key challenges in the year ahead entail
stimulating private investment and rejuvenating
banking sector while maintaining macroeconomic
stability.
Aggregate demand in urban and rural areas depicts
contrary views on recent income evolution.
Improvement in urban consumption is reflected in
the concurrent surge in sales of passenger vehicles.
By contrast, rural consumption has stagnated, with
two consecutive years of deficient monsoons
having taken a toll on rural incomes. Gross fixed
capital formation remained subdued during 2015-
16. At the same time, several initiatives by the
Government, including 'Make in India', and faster
clearances of stalled projects have revived business
sentiment. Higher rate of increase in gross financial
assets relative to financial liabilities was responsible
for the spike in household net financial saving rate.
Despite two consecutive years of below par rainfall,
GVA from agriculture and allied activities posted a
modest growth in 2015-16. Notwithstanding these
setbacks, the Ministry of Agriculture has placed
food grains production for the year at 0.1% higher
than previous year, mainly due to an increase in
wheat production. At the same time, the favourable
impact of the normal monsoon this year
juxtaposed with the implementation of the seventh
pay commission's recommendations will provide a
fillip to consumption demand.
For the year as a whole, average inflation
plummeted from 5.8% in the preceding year to
4.9% in the current year. A statistical
decomposition of contribution of different
subgroups within CPI indicates that the major
contribution to disinflation emanated from the
food group mainly on account of the government's
adroit supply management policies and also from
the fall in global food prices.
Food constitutes 45.9% of CPI and contributed
50% to overall inflation in 2015-16. Keeping this
in mind, the Government took a couple of
measures to break the food inflation spiral as part
of a comprehensive and rapidly deployed food
management strategy - higher Minimum Support
Prices (MSPs) to incentivise production of pulses;
procurement of pulses with a view to creating
buffer stock; banning exports of most pulses; zero
import duty on pulses and onions; raising
minimum export prices of onions; and allowing
states to impose stock limits for certain essential
commodities such as onions, edible oils and pulses.
The implementation of the revised pay scales under
the seventh pay commission is expected to increase
headline inflation with a cumulative impact of 10
basis points by March 2017 over the baseline
scenario set out in the bi-monthly monetary policy
statement of June 2016 (which excluded the impact
of the seventh pay commission implementation).
This reflects indirect effects emerging from
augmentation in personal consumption
expenditures pushing up aggregate demand. The
full impact on CPI inflation, which mainly comes
through the direct effects of an increase in house
rent allowance when it is affected, will be realised in
a calibrated manner over ensuing months.
Domestic financial markets showed differential
responses across segments, with equity and foreign
exchange markets most affected by global
spillovers, while the debt, money and credit market
were driven by global developments. Money
market rates shifted from a softening bias in the
first half of 2015-16 and hardened in the second
half of the fiscal due to advance tax outflows and
year-end factors. However rates have softened
considerably during the current fiscal i.e. 2016-17
following easing liquidity conditions. During
Financial Markets
CC
ILM
on
thly
Ne
wsl
ett
er
Se
pte
mb
er
20
16
INFOCUS
9

CC
ILM
on
thly
Ne
wsl
ett
er
Se
pte
mb
er
20
16
2015-16, G-Sec yields exhibited slight bearish
trends following the weak rupee, sub-normal
monsoons, oversupply of securities and changing
expectations of a rate hike by the US Fed. However
the fiscal consolidation adherence of the Union
Budget 2016-17, dovish guidance by the US Fed
brought about the easing of yields in the first
quarter of 2016-17, which got further momentum
mid-June 2016 following the Brexit results, lower
inflation concerns due to normal monsoons, easy
liquidity conditions supported by OMO purchases
by the RBI. The corporate debt market has seen a
substantial increase in issuance by corporates,
while there was a decline in the secondary market
turnover. The equity market started on a subdued
note in the first half of 2015-16 affected by
domestic factors like weak monsoon, asset quality
of the banking system, sluggish investment
activity, depreciation of the rupee etc. While the
tide turned at the start of the second half following
the rate cut affected by the RBI in September, the
trend reversed at the start of 2016 following global
turbulence on fears of a China meltdown and flight
of FII capital from emerging markets. The trends
reversed after March 2016 led by increasing
investor optimism about government reforms,
good progress of monsoons and FPI buying in the
market. The rupee showed a depreciating bias
through 2015-16 due to factors like the Greek crisis,
hawkish FOMC guidance, global sell-offs,
devaluation of remnimbi and the subsequent sell-
offs in the Chinese market. During the current
fiscal, the rupee has remained largely range bound
showing a slight depreciation during the
immediate aftermath of the Brexit result. Overall,
the rupee has largely remained a better performing
currency among its peer currencies.
During fiscal 2015-16 indirect tax collections were
around 30% higher than the previous year
supported by higher excise duty collections due to
the upward duty revisions on petroleum products,
modest increase in customs collections and the
increase in service tax due to upward revision in the
service tax rates. On the other hand direct tax
collections recorded a shortfall relative to the
budget estimates. Non-tax revenues and non-debt
receipts from were higher than budgeted. The
budgeted target for GFD-GDP ratio was
maintained at 3.9% as budgeted, with the revenue
deficit at 2.5%, lower than the budgeted 2.8%.
During 2016-17, the buoyancy in tax collections is
budgeted to decline, with an increase in
d i s i n v e s t m e n t p ro c e e d s a n d re c e i p t s
communication services. Expenditure is expected
to pick up in the form up provision for
implementation of One-Rank-One-Pension
(OROP) awards and towards bank capitalization,
while a decline in major subsidies has been
estimated. While key fiscal indicators of State
Governments have deteriorated in 2015-16, the
GFD-GDP ratio for 2016-17 is budgeted to decline
due to a turnaround from a deficit mode to a
surplus mode.
The slump in commodity prices, weak global
demand and a surge in protectionist measures
across advanced and emerging economies led to a
decline in exports by 15.5% in 2015-16, panning
across all constituents and in terms of both volume
and value. Imports also declined by similar levels
led by reduction in oil prices and also gold and
non-oil non-gold imports. Invisibles behaved
diversely in 2015-16, with exports of merchandise
trade related transportation services impacted by
the global deceleration, while tourism and software
exports have remained resilient. On the other hand,
remittance inflows were affected by the sluggish
Government Finances
External Sector
INFOCUS
10

CC
ILM
on
thly
Ne
wsl
ett
er
Se
pte
mb
er
20
16
activity in the gulf region. However, due to the
sharp fall in merchandise trade deficit, current
account deficit was at 1.1% of GDP, the lowest since
2007-08. Buoyed by measures to enhance GDP, FDI
inflows surged to USD 36 billion in 2015-16, the
highest net annual inflow thus far, while net
portfolio inflows turned negative. By the end of
2015-16, India's foreign exchange reserves reached a
record level of USD 360.2 billion. Going ahead, the
external sector outlook will depend upon CAD
remaining under sustainable limits, revival in
exports and ability of the reform measures to instill
confidence among international investors.
A Monetary Policy Framework Agreement (MPFA)
was signed between the Government of India and
RBI on February 20, 2015 which steered the
conduct of monetary policy during 2015-16.
Empowered by the MPFA, RBI set out an agenda
for its monetary policy operations: entrenching a
durable disinflationary process to take consumer
price index (CPI) inflation to the targets set for
January 2016 and March 2017; improving
transmission of the policy rate to bank lending
rates by ensuring appropriate liquidity
management consistent with the monetary policy
stance; and dampening volatility of the WACR and
other money market rates around the repo rate, i.e.,
securing the first leg of monetary transmission.
RBI continued with an accommodative stance for
monetary policy through 2015-16 while keeping
focus on a gradual and durable disinflation path
that was expected to take the CPI inflation below
6% by January 2016. The policy repo rate was
reduced by 25 bps in June 2015 and 50 bps in
September 2015 as the receding inflationary
pressure emanating from benign cereal prices and
moderation in international crude oil prices
opened up space for monetary policy action. With
the target for January 2016 achieved, the focus of
monetary policy shifted to attaining the inflation
target of 5% by the end of 2016-17. Based on an
assessment that the target of 5% inflation by March
2017 was achievable, particularly when the Union
Budget 2016-17 adhered to fiscal consolidation and
announced measures to re-invigorate the rural
economy, upgrade the social and physical
infrastructure, deepen institutional reforms and
improve the environment for business, the policy
rate was reduced further by 25 bps to 6.50% in April
2016, the lowest since March 2011. The policy rate
was kept unchanged thereafter as a sharper-than-
anticipated increase in food prices has pushed up
the projected trajectory of inflation over the rest of
the year.
During 2015-16, a considerable flux in
autonomous liquidity flows necessitated a pro-
active assessment of liquidity conditions and
nimble responses through a combination of regular
facilities and fine-tuning operations in the form of
variable rate repo/reverse repo auctions. Liquidity
conditions generally remained tight during the
second half of the year due to festival related
currency requirements and advance tax outflows in
Q3, followed by balance sheet considerations and
restraint in government spending in Q4. Effective
liquidity management, however, kept the WACR
within +/- 10 bps and +/- 20 bps of the repo rate for
36% and 79% of the total number of trading days,
respectively, during 2015-16. With the institution
of the revised liquidity management framework,
the role of term repo auctions under the liquidity
adjustment facility (LAF) has become significant.
Normal 14-day and fine tuning term repos of
varying tenors ranging from 2 to 56-day accounted
Monetary Policy Operations
Disinflation
Operating Framework
INFOCUS
11

CC
ILM
on
thly
Ne
wsl
ett
er
Se
pte
mb
er
20
16
for about 90% of the average net liquidity injection
under the LAF during the year. Since July 22, 2015,
the Financial Benchmark India Private Limited
(FBIL) has started compiling the Mumbai Inter-
Bank Offer Rate (MIBOR) based on actual data of
the interbank call market transactions covering a
one hour time span from 9.00 a.m. to 10.00 a.m.
Given the market microstructure, thick trading in
the first hour usually elevates MIBOR above
WACR. The FBIL has started generating quote-
based term benchmarks, but their use in pricing of
financial products and transactions is yet to pick
up.
In April 2016, the liquidity management
framework was revised in a move to progressively
lower the average ex ante liquidity deficit to a
position closer to neutrality. RBI assured the
market of meeting the requirements of durable
liquidity and then using its fine-tuning operations
to make short-term liquidity conditions consistent
with the stated policy stance. Accordingly, in Q1 of
2016-17 RBI injected permanent liquidity through
open market operations (outright), more than
offsetting the impact of currency leakage during
the same period. For ensuring non-disruptive
FCNR(B) redemptions, RBI pro-actively injected
liquidity through open market purchase auction
on August 11, 2016. With a view to further
minimising volatility in WACR, as also easing
liquidity management for banks without
abandoning liquidity discipline, the minimum
daily maintenance of the cash reserve ratio (CRR)
was lowered from 95% of the requirement to 90%
effective April 16, 2016. Furthermore, the policy
rate corridor around the repo rate was narrowed
from +/-100 bps to +/- 50 bps.
During 2015-16, as a part of the phased
implementation of the liquidity coverage ratio
(LCR), the minimum required high quality liquid
assets (HQLA) was raised from 60% to 70% of the
total net cash outflow over the next 30 calendar
days under the stress scenario effective January 01,
2016, which correspondingly limited the capacity
of banks to use the excess statutory liquidity ratio
(SLR) securities to access collateralised liquidity
from money markets and RBI. Recognising the
scope for providing greater flexibility to banks
within the prescribed SLR, effective February 11,
2016, RBI allowed banks to reckon additional
government securities held by them up to 3% of
their NDTL within the mandatory SLR
requirement as level 1 HQLA for the purpose of
computing their LCR on top of the 5% permitted
in November 2014. On July 21, 2016, additional
headroom equivalent to 1% of NDTL was provided
within the prescribed SLR. Together, the total carve-
out from SLR available to banks stands at 11% of
their NDTL, including 2% of NDTL available
under MSF.
In response to the reduction in the policy repo rate
by 150 bps during January 15, 2015 through April
05, 2016, the median base rate of banks declined by
60 bps as against a higher decline of 92 bps in
median term deposit rates, reflecting banks'
preference to protect profitability in the wake of
deter iorat ing asset qual i ty and higher
provisioning. The weighted average lending rate
(WALR) on fresh rupee loans declined by 100 bps
(up to June 2016), significantly more than the
decline of 65 bps in WALR on outstanding rupee
loans.
As set out in the agenda for 2015-16, RBI
introduced the Marginal Cost of Funds based
Lending Rate (MCLR) system for scheduled
commercial banks (excluding RRBs), effective
Monetary Policy Transmission
Experience of the MCLR System
INFOCUS
12

CC
ILM
on
thly
Ne
wsl
ett
er
Se
pte
mb
er
20
16
April 1, 2016 whereby all new rupee loans
sanctioned and credit limits renewed would be
priced with reference to the MCLR. As expected,
the MCLR for the overnight segment, one year
segment and up to three-year segment (as on July
31, 2016) was lower by 70 bps, 25 bps and 36 bps,
respectively, than the base rate of 9.65%.
There has hardly been any transmission of a
reduction in the policy rate to the actual lending
rates charged to customers during 2016-17. While
the cost of funding by banks has declined
somewhat leading to a decline in shorter maturity
MCLR, there has been an increase in the term
premia in respect of term loans of one year and
above, thereby attenuating the transmission to
actual lending rates charged to customers.
Moreover, banks may have been loading (i) a higher
credit risk premia on their new customers in order
to attain their desired return on net worth in a
rising NPA environment; and/or (ii) a higher
strategic risk premia on their riskier loans as part of
their business strategy to reorient their lending
operations towards less risky activities. The
consequent rise in the spread is reflected in a near
unchanged WALR in respect of both outstanding
and fresh rupee loans during 2016-17 so far.
In the first bi-monthly policy statement for 2016-
17, RBI set a target for CPI inflation at 5% by
March 2017. The eventual aim is to move towards
4% CPI inflation by the end of 2017-18. To
strengthen the monetary policy framework, the
Union Budget 2016-17 announced the formal
constitution of a Monetary Policy Committee
(MPC) by amending the RBI Act, 1934, which will
be vested with the responsibility of setting the
policy rate. The amended RBI Act, which was
notified in the Gazette of India on May 14, 2016
mandates a MPC to determine the policy interest
rate to achieve the inflation target set by the
Government. MPC is a new institutional structure.
The MPC shall consist of the Governor of RBI, the
Deputy Governor-in-charge of monetary policy,
one officer of the Bank to be nominated by the
Central Board of RBI and three members to be
appointed by the Central Government. Each
member shall have one vote, and in the event of a
tie, the Governor can exercise a casting or second
vote.
In 2015-16, RBI put especial effort towards
fostering a more conducive environment for
adequate flow of credit to priority sectors, in
particular to the micro, small and medium
enterprises (MSME) sector. The committee on
Medium-Term Path on Financial Inclusion
submitted action plan for financial inclusion that
will guide the financial inclusion process going
forward. RBI has set up Financial Inclusion and
Development Department (FIDD) for seamless
implementation of its financial inclusion agenda.
Priority Sector Lending Certificates (PSLCs) will
allow the market mechanism to drive priority
sector lending by leveraging the comparative
strengths of different banks.
In view of the critical role played by regional rural
banks (RRBs) in driving the financial inclusion
agenda, priority sector lending guidelines were
revised for RRBs in December 2015 and an overall
target of 75% of the total outstanding loans to the
priority sector was set for them. RBI advised banks
to review their existing lending policies to the
micro and small enterprises (MSEs) sector and fine-
tune them by allowing for standby credit facilities
in case of term loans, additional working capital
limits, mid-term review of regular working capital
limits and timelines for credit decisions.
Agenda for 2016-17
Credit delivery and financial inclusion
INFOCUS
13

CC
ILM
on
thly
Ne
wsl
ett
er
Se
pte
mb
er
20
16
Financial Inclusion Advisory Committee (FIAC)
was reconstituted in June 2015 for preparing a
national strategy for financial inclusion which
aims at converging financial inclusion efforts of
various stakeholders and PMJDY, apart from
monitoring the progress; (ii) monitoring progress
on FIP; and (iii) monitoring progress on financial
literacy. The Government of India merged
financial inclusion fund (FIF) and financial
inclusion technology fund (FITF) to form a single
financial inclusion fund in July 2015 with a corpus
of 20 billion. The new FIF, which will be
administered by an advisory Board constituted by
the Government, will be maintained by NABARD.
Based on the recommendations of the
Implementation Group on Encouraging Greater
Retail Participation in G-Secs, the Clearing
Corporation of India Ltd. (CCIL) was advised to
enable participation of demat account holders in
NDS-OM. A Working Group set up under the aegis
of the Financial Stability and Development
Council Sub-committee (FSDC-SC) considered
several measures for strengthening participation,
improving market infrastructure and easing the
issuance process for corporate bonds. Unlisted
securities and securitised debt instruments will
shortly be added to the basket of corporate debt for
foreign portfolio investor (FPI) investments.
Covered options against underlying currency
exposures have been allowed. The limits for all
resident individuals, firms and companies to book
foreign exchange forwards and foreign currency-
Indian rupee (FCY-INR) options contracts on the
basis of declaration have been increased from US$
250,000 to US$ 1,000,000. Indian residents having
long term foreign currency (FCY) borrowings were
permitted to enter into FCY-INR swaps with
multilateral or international financial institutions
(MFIs/IFIs), in which the Government of India is a
shareholding member provided such swaps were
undertaken by the MFI/IFI concerned on a back-to-
back basis with an authorised dealer (AD)
Category-I bank in India.
In the when-issued (WI) market, scheduled
commercial banks were allowed to take short
positions, whereas all eligible entities were
permitted to take long positions. Primary dealers
(PDs) were allowed to participate in exchange
traded currency futures market. For a more broad
based participation in OTC derivatives, regulated
entities other than banks and PDs such as mutual
funds and insurance companies have been enabled
to trade in such derivatives on electronic platforms
with guaranteed settlements by the CCIL.
The Financial Benchmarks India Pvt. Ltd. (FBIL)
took over the administration of the benchmark for
the overnight inter-bank rate based on the actual
traded rates, and also started publishing the polled
term Mumbai interbank offer rate (MIBOR) for
three tenors, 14-day, one month and three
months, as well as the FBIL FC-Rupee Options
Volatility Matrix rates. The CCIL trade repository
expanded the public dissemination of data on a
gross basis in pursuit of enhanced transparency.
CCIL has also started disseminating data on short
term USD/INR interbank near maturity swaps.
Agenda for 2016-17 include changes in e-Kuber to
facilitate seamless transfer of g-secs between demat
accounts and subsidiary general ledger/gilt
accounts and operationalising electronic platforms
for repo in corporate bonds in coordination with
the Securities and Exchange Board of India (SEBI),
issuance of final guidelines on introduction of
interest rate options, review of Guidelines on
commercial paper (CP), CDS and STRIPS, as well as
introduction of money market futures.
`
Financial Markets and Foreign Exchange
Management
viz.,
INFOCUS
14

CC
ILM
on
thly
Ne
wsl
ett
er
Se
pte
mb
er
20
16
Additionally, framework for authorisation of
shifting OTC derivatives on to exchanges or
electronic trading platforms will be put in place.
The scope of dissemination of OTC forex
derivative transactions by the CCIL Trade
Repository will also be expanded.
Under the Financial Markets Operations
Department (FMOD), a 56-day variable rate repo
was conducted in January 2016 to expand the ambit
of liquidity adjustment facility. Straight through
processing (STP) was introduced for fixed rate repo,
reverse repo and MSF. Under Section 25 of the
Negotiable Instruments Act, 1881, it was decided to
keep open all money market segments on the
working Saturdays from September 01, 2015.
Reverse repo and MSF are being conducted from
February 19, 2016 on all Mumbai holidays when
the real time gross settlement (RTGS) system is in
operation. From May 02, 2016, the Reserve Bank
reference rate is being computed on the basis of the
volume weighted average of the actual market
transactions that have taken place during a
randomly selected 15-minute window between
11.30 a.m. and 12.30 p.m. every weekday. To address
the volatility in the foreign exchange market,
intervention in the exchange traded currency
derivatives (ETCD) segment commenced in
September 2015.
Under the Foreign Exchange Department (FED),
the guidelines on external commercial borrowings
(ECBs) were rationalised and liberalised during
2015 -16 in tune wi th macroeconomic
developments. Resident importers were allowed to
raise trade credits in INR allowing the transfer of
currency risk to overseas lenders. To facilitate rupee
denominated borrowings/bonds from abroad, a
framework for such issuance has been put in place.
An analogous information technology based
system for monitoring import transactions is being
operationalised.
Furthermore, regulations pertaining to the
employee stock options (ESOP) scheme were
reframed in sync with the SEBI regulations (for
listed companies) and the Ministry of Corporate
Affairs' regulations (for unlisted companies). The
National Pension System (NPS) was made an
eligible investment option for non-resident
Indians (NRIs). As per the foreign direct
investment (FDI) policy amendment by the
Government, sectoral limits on foreign
investments are to be aggregates of both FDI & FPI,
foreign investment in limited liability partnership
(LLP) is permitted under the automatic route for
sectors where 100% FDI is allowed without
attendant FDI-linked performance conditionality,
foreign investment up to 100% under the
automatic route is permitted in the plantation
sector, manufacturing sector given clear definition
as to where foreign investment has been allowed,
single brand retail brick & mortar stores can
undertake sales via e-commerce, and FDI limit in
the insurance sector via automatic route has been
increased to 49%.
To encourage start-up entities, cashless sweat issue
of equity has been allowed if drafted as per SEBI
guidelines, issue of shares against legitimate
payment owed by the investee company permitted
subject to adherence to the FDI policy, having an
escrow arrangement in respect of transfer of shares
between a resident and a non-resident, as well as
start-up having an overseas subsidiary has been
permitted to open an FCY account with a bank
outside India for the purpose of crediting to it
foreign exchange earnings from operations.
Further, payments in foreign exchange arising out
of its own or its subsidiaries' sales/exports have
been allowed as a permissible credit to an Indian
start-up's exchange earners account.
INFOCUS
15

CC
ILM
on
thly
Ne
wsl
ett
er
Se
pte
mb
er
20
16
The Reserve Bank has also liberalised the approval
process for setting up liaison/branch/ project
office in India to ease doing business in the
country. Transfers between non-resident ordinary
rupee (NRO) accounts have been permitted.
Further, NRIs and persons of Indian origin (PIOs)
have been permitted to open NRO accounts jointly
with other NRIs/PIOs. Authorised dealer (AD)
banks have to obtain declarations from their clients
that remittances from their respective NRO
accounts are legitimate and not external
borrowings. Non-residents having a business
interest in India are permitted to open a repatriable
special non-resident rupee (SNRR) account with
balances commensurate with business operations.
An Indian company receiving foreign investment
under the FDI route has been permitted to open
and maintain an FCY account with an AD in India
provided it has impending FCY expenditure, which
however needs to be closed immediately after the
requirements are completed or within six months
from the date of opening of such account,
whichever is earlier.
Despite marginal pick-up in economic growth and
credit off-take, the Indian banking system
continued to battle with the challenge of rising
NPAs during 2015-16. As a supervisory action, RBI
initiated an “asset quality review” during the year
following which banks recognized stressed assets,
there by taking a hit on profitability with higher
provisioning. To foster competition in the banking
system and with an aim to take banking services to
under-served segments of the population, RBI
allowed entry of new players with the establishment
of small finance and payments banks.
To address challenges posed by the recent growth in
banking consumers following the implementation
of the Pradhan Mantri Jan-Dhan Yojana (PMJDY),
for customer services and protection RBI
operationalised the Charter of Customer Rights. It
also undertook a comprehensive review of the
Banking Ombudsman (BO) scheme. Thus, the year
witnessed a slew of policy actions in pursuance of
the three pillars envisaged by the Reserve Bank for
improving the regulation and supervision of the
financial sector, ., strengthening the banking
structure through new players; expanding financial
access; and improving the system's ability to deal
with distress.
The Financial Stability Unit (FSU) within the
Reserve Bank is responsible for macro-prudential
surveillance by conducting periodic stress tests and
other tools, dissemination of information relating
to the status of and challenges to financial stability
through the bi-annual report, namely, Financial
Stability Report (FSR). It also acts as a secretariat to
the Financial Stability and Development Council,
a sub-Committee of the apex institutional
mechanism for financial stability in the country. In
2015-16, the stress testing framework was modified
to incorporate sectoral probability of defaults and
modeling corporate sector distress. The Sub-
Committee of FSDC review various issues which
includes central know your customer registry,
International Financial Services Centre,
development of corporate bond market, peer-to-
peer (P2P) lending, regulation of credit guarantee
schemes, risks in deposit mobilization by multi-
state co-operative societies. A sub-group of FSDC
also looked into the range of issues like legal entity
identifier (LEI), a regulatory framework for NBFC-
account aggregator (AA), securitization, a single
entity undertaking multiple activities.
Regulation, Supervision and Financial
Stability
,
viz
Financial Stability Unit
INFOCUS
16

CC
ILM
on
thly
Ne
wsl
ett
er
Se
pte
mb
er
20
16
Regulation of Financial Intermediaries
Department of Banking Regulation (DBR)
regulates commercial banks and has proactively
addressed both the time and cross-sectional
dimensions of risks to preserve systemic stability. It
also focused on developing an inclusive and
competi t ive banking structure through
appropriate regulatory measures. In 2015-16, the
RBI strengthened the regulatory framework for
dealing with stressed assets, introduced the Scheme
for Sustainable Structuring of Stressed Assets and
passed Insolvency and Bankruptcy Code to
improve the framework for resolution of corporate
entities, partnership firms and individuals in a
time-bound manner. To improve recovery, it
amended many of its Acts.
As an initiative towards financial inclusion
through a bouquet of banking products, including
small credit, small savings and payments/
remittances, the Reserve Bank issued in-principle
approval for setting up of 11 payments banks and
ten small finance banks (SFBs) in September 2015
and October 2015, respectively. The first SFB
license was granted to Capital Small Finance Bank
Limited in March 2016 while the first payment
bank license was granted to Airtel Payment Bank
Ltd. in April 2016. To determine transparent
lending rates and strengthen monetary
transmission, banks were mandated to price their
credit using the marginal cost of funds based
lending rate (MCLR) as the internal benchmark.
In August 2016, RBI released guidelines for on-tap
licensing of universal banks with the objective to
encourage greater competition and innovation in
the system. In February 2016, banks were advised to
comply with the Indian Accounting Standards
converged with IFRS in the preparation of
financial statements for the accounting periods
beginning April 1, 2018. Following the
announc emen t i n th e Fo l l ow ing th e
recommendations made by the Committee to
Review Governance of Boards of Banks in India,
the Banks Board Bureau (BBB - which started
functioning from April 8, 2016) was set up by the
central government with support from the Reserve
Bank to infuse greater professionalism in the
constitution and operation of the boards of PSBs.
For 2016-17, RBI intends to finalize the policy on
prudential and implementation aspects of the
expected credit loss approach, guidelines for
computing exposure for counterparty credit risk
(CCR) arising from derivative transactions and
capital requirements for bank exposures to central
counterparties as well as margin requirements for
non-centrally cleared derivatives.
During 2015-16, steps such as early recognition of
financial distress; prompt steps for resolution and
fair recovery for lenders, risk weights assigning to
exposures to central/state government/s and
claims guaranteed by state governments; risk
weights with respect to investments in corporate
bonds by standalone primary dealers; and strategic
debt restructuring and refinancing of project loans
had been taken.
The Reserve Bank introduced the revised format for
central repository for information on large credits
(CRILC) reporting for improved data collection
from banks from the quarter ended September
2015. A new framework for fraud detection,
reporting and monitoring was rolled out in May
2015. A Central Fraud Registry for the use of banks
was operationalized on January 20, 2016. An
Expert Panel on IT Examination and Cyber
Security, set up by the RBI, is expected to provide
assistance in IT examination/cyber security
initiatives of banks, review examination reports
and suggest actionable items during 2016-17.
INFOCUS
17

CC
ILM
on
thly
Ne
wsl
ett
er
Se
pte
mb
er
20
16
Public debt management
During the year, the Reserve Bank successfully
managed the large borrowing programme of the
central government and the states in an orderly
manner in the face of multiple challenges
including reduction in HTM category of banks'
investments, reduction in SLR in an environment
of tight liquidity, increased issuances by state
governments and global uncertainties.
The central government in consultation with the
Reserve Bank designed a Sovereign Gold Bond
Scheme (SGB) as an alternative to the purchase of
metal gold. The Reserve Bank manages the scheme
on behalf of the Government and issued three
tranches of SGBs during the fiscal year 2015-16.
Further, the Government of India (Ministry of
Power) had formulated the Ujwal DISCOM
Assurance Yojana (UDAY) scheme on November
20, 2015 with the objective to improve operational
and financial efficiency of the state DISCOMs. The
Reserve Bank during 2015-16 issued UDAY bonds
for a total amount of 990 billion with a fixed
spread of 75 bps over the FIMMDA g-sec yield. In
2016-17 so far, the issuance spread ranged between
63-74 bps for 495 billion.
Gross market borrowings of 6,000 billion were
proposed in the Union Budget 2015-16 through
dated securities, of which 150 billion was
allocated for issue of SGBs. The actual gross market
borrowings through dated securities were 5850
billion and the net borrowings were 4406 billion
which funded 82% of the gross fiscal deficit as
against 89 percent in the previous year. The net
market borrowings of the central government, (i.e.,
through dated securities and T-bills) declined to
4,530 billion in 2015-16 from 4,778 billion in
2014-15.
The Reserve Bank continued with the policy of
passive consolidation of g-secs by way of
reissuances. Out of 161 securities auctioned in
2015-16, 154 securities were reissues of the existing
securities. In order to manage the maturity profile
and reduce rollover risks of the government debt in
a proactive manner, buybacks and switches were
conducted in the fourth quarter of 2015-16 for an
amount of 749 billion ( 579 billion in the
previous year). This has modulated redemption
pressures and reduced the quantum of gross
borrowing requirement for 2016-17. Reflecting the
strategy of maturity elongation, the weighted
average maturity of borrowings increased to 16.0
years in 2015-16 from 14.7 years in 2014-15.
Consequently, the weighted average maturity of
outstanding debt increased to 10.5 years in 2015-16
from 10.2 years in 2014-15. To cater to the demand
from long-term investors like insurance companies
and pension funds, a 40-year security was also
issued in 2015-16.
A Medium Term Debt Management Strategy
(MTDS) was formulated by the Reserve Bank in
consultation with the Government and placed in
the public domain on December 31, 2015. The
MTDS has been articulated for a period of three
years (2015-16 to 2017-18). It is premised on three
broad pillars: low costs, risk mitigation and market
development in line with the sound international
practices while factoring in domestic economic
and financial conditions.
The net issuance of T-bills was lower during 2015-
16 than in the previous year. The yields on T-bills
softened during the year reflecting the easing
interest rate regime. Primary Dealers (PDs)
`
`
`
`
`
`
` `
` `
Debt Management of the Central Government
Debt Management Operations
Medium Term Debt Management Strategy
Treasury Bills
INFOCUS
18

CC
ILM
on
thly
Ne
wsl
ett
er
Se
pte
mb
er
20
16
individually achieved the stipulated minimum
success ratio and their aggregate share in T-bill
auctions stood at 75.4% in 2015-16, down from
77.2% during 2014-15.
The Government's WMA limits for the first and
second halves of 2015-16 were fixed at 450 billion
and 200 billion, respectively. The Government's
cash position was largely comfortable as it started
the year with a large cash balance of 1,573 billion.
Recourse to WMA was limited to 16 days in 2015-
16 vis-à-vis 61 days in the previous year (including
16 days of overdraft), reflecting relatively fewer
gaps between receipts and expenditures. The
average utilization of WMA was lower at 187
billion as compared to 236 billion in 2014-15.
Gross market borrowings of the states increased to
2,946 billion during 2015-16 through the issuance
of 298 securities as compared to 2,408 billion
mobilised through 282 securities in the previous
year. Despite increased supply, the weighted
average yield of SDLs during 2015-16 was lower at
8.28% as compared with 8.58% in the previous year,
reflecting the easing interest rate regime. However,
the weighted average spread over the comparable
central government securities increased to 50 bps
from 38 bps during the previous year on concerns
over increased supply due to UDAY bond
issuances.
Investments by states in Intermediate Treasury Bills
(ITBs) of the central government increased during
the year. The daily average investments in ITBs
increased marginally to 749 billion in 2015-16
from 731 billion in the previous year. Further,
while the outstanding amount in Auction Treasury
Bills (ATBs) continued to decline in 2015-16, the
declining trend in investments in ITBs reversed
over the same period. During 2015-16, eleven states
availed Special Drawing Facility (six states in 2014-
15), eleven states availed WMA (10 states in 2014-
15) and nine states availed Over Draft facility from
the Reserve Bank in 2015-16 (10 states in 2014-15).
The monthly average utilization of WMA and OD
by the states was higher during 2015-16 than that
during 2014-15.
Source : www.rbi.org.in
Cash Management of the Central Government
Debt Management of State Governments
Cash Management of State Governments`
`
`
`
`
`
`
`
`
INFOCUS
19

CC
ILM
on
thly
Ne
wsl
ett
er
Se
pte
mb
er
20
16
The Financial Stability and Development Council
Sub-committee (FSDC-SC) in its meeting held on
September 10, 2015 decided to constitute a
Working Group on Corporate Bonds with
representation from the Ministry of Finance,
Government of India and all the regulators with the
remit to guide the implementation of the
recommendations made by all the earlier
committees and suggest further measures that may
be taken to develop the corporate debt market. The
recommendations of the Committee released in
August 2016 are:
1. Frequent debt issuers may club all issuances
during a quarter under the same umbrella ISIN
to enhance liquidity of the issuance. These
issuers may come out with a feasible maturity
structure wherein they can stagger the
redemption amount across the year by
amortizing the repayments. Reissuances to be
exempt from Stamp Duty and review of
Corporate Governance norms for companies
with only listed debt securities.
2. SEBI to have a relook at October 2013
guidelines to clarify on day count convention,
shut period, basis for yield calculation,
calculation of coupon interest and redemption
with intervening holidays with illustrations.
3. Required notification to be issued by RBI by
August-end 2016 to allow FPIs to invest in
unlisted debt securities and pass through
securities issued by securitizations SPVs /
Special Purpose Distinct Entity (SPDE).
4. Amendments in FEMA and SEBI guidelines to
facilitate direct trading in corporate bonds by
FPIs in the OTC segment and on an electronic
platform of a recognized stock exchange, with
no involvement of brokers.
5. Amendment in RBI guidelines so that the credit
exposure of a protection buyer in credit default
swaps shall be on the protection seller.
6. Stock exchanges may operationalize market
making scheme in corporate bonds.
7. Regulated entities like banks, PDs other than
brokers to be encouraged to act as market
makers. RBI to examine members of debt
segment of exchanges to access the repo market
in corporate bonds to enable market making.
8. The Electronic Book Mechanism for private
placement of debt securities, currently
mandatory for issuances over 500 crore, may
be extended to all primary market issuances.
9. An acceptable mechanism for daily valuation
of corporate bond holdings to be developed
either by the Financial Benchmarks India Pvt.
Ltd. (FBIL) or credit rating agencies.
10. The penalty structure in place for default in
delivery of debt securities/funds for trades
subject to CCP clearing to be reviewed in order
to prescribe prudent yet reasonable penalty or
an alternative mechanism of borrowing
through corporate bond repo to be explored to
ensure settlement.
11. CRAs may be mandated to strictly adhere to the
regulatory norms with regard to timely
disclosure of defaults on the stock exchanges
and their own website and also publish credit
rating transition matrix more frequently.
12. Banks may be encouraged to submit loan
overdue information to CICs on a weekly basis
to start with.
13. A centralized database for corporate bonds
covering both primary and secondary market
segments may be established expeditiously in
`
Report of the Working Group on Development of Corporate Bond Market in India
INFOCUS
20

CC
ILM
on
thly
Ne
wsl
ett
er
Se
pte
mb
er
20
16
two phases, for secondary market trades by end
August 2016 and for both primary and
secondary market by end October 2016.
14. Amendments may be carried out in the RBI
Act, 1934 to provide complete clarity on the
legal position relating to netting of OTC
derivat ive contracts . Pending these
amendments, the possibility of permitting
netting keeping in view the existing legal
provisions and banking practices may be
explored expeditiously.
15. An electronic dealing platform with CCP
facility similar to the CROMS platform in the
G-Sec market may be introduced. An electronic
dealing platform without CCP facility may also
be introduced for bonds for which CCP facility
may not be feasible.
16. FIMMDA may consult market participants to
develop a commonly acceptable market repo
agreement for execution among the market
participants by end September 2016.
17. Guidelines on Tripartite repo on corporate
bonds may also be introduced by
depositories/other entities in consultation with
SEBI by end September 2016.
18. Entities authorized as market makers in
corporate bond market, including the brokers,
may be allowed to participate in the repo
market executed on electronic platform linked
to guaranteed settlement
19. Insurance companies and EPFO may be
allowed to invest in AT-1 bonds of banks subject
to prudential limits with credit rating upto
investment grade.
20. The maximum investment ceiling of 2% of the
total portfolio of the funds in AT-1 instruments
stipulated for non-Government PFs may be
reviewed for relaxation.
21. Corporate bond index may be introduced by
the Stock Exchanges/other entities.
22. Initially the upper limit for PCE by the banking
system as a whole may be enhanced to a higher
limit with no single bank having exposure of
more than 20 per cent of the bond issue size by
end August 2016.
23. Guidelines to be issued by end-August 2016
regarding reduction of capital requirements of
banks on account of PCE in case of
improvement of base rating of project.
24. A separate regulatory framework may be
formulated for providing credit enhancement
of corporate bonds by NBFCs engaged in such
activities.
25. RBI to issue guidelines to ensure that large
corporates with borrowings from the banking
system above a cut-off level may be required to
tap the market for a portion of their working
capital and term loan needs.
26. After introduction of measures like tripartite
repo and repo on electronic dealing platform
with CCP facility, RBI may explore the
possibility for accepting corporate bonds for
LAF operations with suitable risk management
framework.
27. Legal basis may be examined expeditiously to
remove the technical obstacles for RBI to accept
corporate bonds as collateral under LAF repo as
and when the Scheme is introduced.
28. The stamp duty on debentures should be made
uniform across states and be linked to the tenor
of securities within an overall cap.
29. In order to achieve the objective behind the
Bankruptcy Code, issues such as early
notification of the rules, development of
insolvency professionals, tribunal/court
infrastructure and information utilities and
quick redressal of the transitional problems
may be addressed with priority.
Source : www.rbi.org.in
INFOCUS
21

CC
ILM
on
thly
Ne
wsl
ett
er
Se
pte
mb
er
20
16
There are increasing concerns that the digital
economy is in large part absent from our statistics.
This paper attempts to address the multitude of
measurement issues raised by digitalisation. There
is a broad convergence around the idea that one of
the manifestations of the digital economy is peer-
to -peer (P2P) or consumer- to -consumer
t r an s a c t i on s f a c i l i t a t ed by web - b a s ed
intermediaries in the corporate sector. According
to the authors, GDP, atleast conceptually, captures
all of the related transactions and value-added
created. The difference only lies on the scale of such
transactions.
The first question is whether the current tools
available to statistical offices can accurately capture
the intermediation fees charged by the new digital
intermediaries . To the extent that the
intermediaries are registered in the national
territory, their activity is likely to be captured in the
accounts as other registered entities. Where the
entities are not registered in the national territory
and, so, the transactions between households and
the intermediary are cross border, complications
may arise. To what extent statistical information
systems are able to accurately measure the scale of
market transactions in dwelling services between
households is difficult to say. For long-term
lettings, there is not likely to be a significant degree
of under-recording, unlike however, for short-term
occas iona l l e t t ings . Advent of dig i ta l
intermediaries has increased the scale of such
transactions; however there are two important
factors to consider in assessing the impact on GDP.
First, the imputation already included in the
national accounts for dwelling services, accounting
albeit for some loss in value; and second, the
intermediaries themselves provide the scope to
improve measurement via registration and records
of transactions for tax purposes.
The emergence of a wide host of intermediary
service providers is likely to have significantly
increased the scale of these activities One possible
solution provided by the intermediaries is that
their turnover will reflect the underlying activities
conducted, and additional administrative
information may also be available relating to hours
worked and sector of activity.
A third important platform of the sharing
economy relates to the intermediaries bringing
together buyers and sellers of goods. Inmost
countries, the standing assumption is that the
distribution margin is negligible or indeed zero.
For those unincorporated enterprises able to
achieve scalability there is an increased likelihood
of registering their activity for tax purposes,
especially if they cross the VAT registration
threshold and almost certainly if their customer
base expands to corporations. For all other
unincorporated enterprises, the assumption
remains that transactions for each unit are not
likely to be significant.
Crowd-funding and Peer-to-Peer lending have
emerged as not insignificant new sources of
a l t e rna t ive f inanc ing in recent yea r s .
Notwithstanding issues relating to cross-border
trade, the value-added of the intermediaries,
typically captured through explicit fees, will be at
least in theory, captured in GDP. It is important to
note, however, that whilst these fees are a return for
the liquidity transformation services provided by
the P2P intermediaries, they are not the same thing
Measuring GDP in a Digitalised Economy
Nadim Ahmad, Paul Schreyer, OECD Statistics
ARtICLE
SUMMARY
22

CC
ILM
on
thly
Ne
wsl
ett
er
Se
pte
mb
er
20
16
as Financial Intermediation Services Indirectly
Measured (FISIM), because the transactions are
explicit, with the gains from the intermediation
services accruing to the creditors, and the
intermediaries are not classified as financial
intermediaries with deposits and/or loans.
There has been a long standing critique that many
services provided by households for their own
consumption could in theory be provided by a
third-party and so should be included in the
production boundary. But these have not been
included, partly on the grounds that they would
create other distortions to GDP that would render
GDP almost meaningless as a measure of economic
activity and a tool for policy making, and partly
because of the valuation difficulties.
The System of National Accounts does not provide
prescriptive guidance on when durables should or
should not be included as investment when they are
used both for own-use and also in production by
unincorporated enterprises. As such it is not clear
whether current national compilation systems use
the same qualifying criteria and, therefore, are
necessarily able to capture increased investment
that may have taken place from those individuals
choosing to benefit from the increased market
a c c e s s p rov ided by in t e rmed ia r i e s . A
reclassification of consumer durables as
investment does not affect GDP but has a direct
bearing on measures of capital, and by implication,
multi-factor productivity.
Free digital products for consumers are frequently
put forward as examples of output or consumer
welfare that goes unnoticed in GDP figures.
Because there is no explicit payment by the
consumer there is an argument that GDP is
underestimated by the value of the free services
received. But this overlooks the fact that, under the
'free' model, the consumer does indirectly pay
through the higher prices paid for advertised
products. Hence, other things being equal, overall
GDP would be equal in both cases.
The second avenue for the financing of free digital
products is collecting and commercially exploiting
the vast amounts of data generated by users of
digital products. Since there is no obvious proxy
like in the advertising model to establish the value
of the services provided for free, arriving at
measurement estimates is complicated. it is likely
that it is only when databases are sold in their
entirety that the full value of databases will be
recorded in the accounts, that too as goodwill, and
not contributing towards GDP.
Conceptual difficulties also emerge when
considering the creation of 'public goods' using
labour provided for free, and where financing is
typically only provided by donations. Assets that
have not been produced freely but are available for
free are included in the accounts and balance
sheets. Where the associated costs of production are
zero, it follows that these will not be included in the
valuation of the final asset.
With the exception of mineral exploration and
evaluation, Intellectual Property Products (IPPs)
are subject to substantial international trade. The
issue is whether the flows necessarily align with
national accounts concepts of ownership, since
taxes are paid and recorded on the basis of legal
ownership, and adjustments that relocate assets to
the territory of the economic owner actually using
them in production would result in further
imputations of somewhat incongruous cross-
border taxes. This is partly mitigated by balance of
payments income flows but not in entirety or
necessarily in the same time period. Productivity
estimates may also be affected, because the
transferred IPP may not always be captured in cross-
border international trade statistics.
ARtICLE
SUMMARY
23

CC
ILM
on
thly
Ne
wsl
ett
er
Se
pte
mb
er
20
16
Digitalisation also creates significant challenges
for prices and consequently volume based measures
of GDP and productivity. With products becoming
more unique, price comparisons that control for
quality differences become more complicated.
Proxy estimates that employ comparable price
changes over comparable products may limit the
scope of potential errors on volume estimates.
Concluding, the authors point out that in many
areas that affect both GDP and productivity,
practical measurement of the effect of digitisation
remains a challenge, as conventional methods may
no longer be appropriate to measure flow of
transaction generated, and hence this reinforces the
need to complement GDP with other indicators
that capture well-being.
Source: www.oecd-ilibrary.org
ARtICLE
SUMMARY
24

CC
ILM
on
thly
Ne
wsl
ett
er
Se
pte
mb
er
20
16
Collateral plays a vital role in ensuring the efficacy
of the financial system by supporting a substantial
range of transactions. However, collateral markets
have the potential to disrupt financial markets, not
least given that during periods of financial folly,
demand for high-quality collateral tends to
transcend the supply of such collateral. The
reduction in willingness or inability of market
participants to act as intermediaries in collateral
markets is likely to have serious repercussion for
market functioning. Keeping this in mind, this
paper offers a means to estimate how this potential
imbalance between collateral supply and demand is
likely to vary as a function of market stress.
Collateral refers to securities pledged to secure
loans and other counterparty exposures to support
a vast range of market-based transactions. By doing
so, it mitigates counterparty credit risk and
provides guaranteed liquidity to market
participants. During the 2007-2008 Great Financial
Crisis, the quantity of high-quality securities made
available for use as collateral precipitated in the
wake of perceptions of increased counterparty
credit risk and due to unanimous urge among
market participants to deleverage. Such panic
engulfing the financial world rendered it impotent
in credit transmission.
Given these developments, it is perhaps not
surprising that recent regulation has sought to
reduce some of the procyclicalities associated with
collateral. Such regulation includes a set of
numerical haircut floors for non-centrally cleared
securities financing transactions. The regulatory
minimum leverage ratio introduced under Basel III
has the prerogative to constraint credit expansion
among financial intermediaries during periods of
benign market conditions. These measures taken
together will dampen procyclicalities witnessed
during crises.
There is some evidence that, during the recent
crisis, intermediation activity of broker-dealers
reduced considerably, as falls in asset prices forced
such firms to deleverage. As market strain
intensifies, the ability and willingness of these
institutions to obtain the requisite leverage to
perform this intermediation tends to decline. This
may also include a sudden inability of market
participants to obtain the collateral they need to
manage the risks associated with their business,
including payment of initial margin on derivatives
transactions. While the aggregate supply of high-
quality collateral (i.e. the amount of high-quality
securities outstanding) is vast but only a small
percent of high-quality assets held by owners
participating in securities lending programmes are
actually available for loan. This is probably in part
due to regulatory bottlenecks on institutional
investors that prevent them from engaging in
securities lending transactions on a larger scale.
The overall approach in the paper is based on a
simple model of market participant behaviour, and
how this varies as a function of two variables,
together are used to capture the degree of stress in
financial markets; these are: i) VIX volatility index;
and ii) average credit default swap (CDS) premia on
senior unsecured debt of Global Systemically
Important Banks. A simple linear regression in the
paper suggests that a 10 basis point increase in
average dealer CDS premia is associated with a 0.20
percentage point reduction in the proportion of
beneficial owners' securities available for loan.
Using a range of global data on repo and securities
The role of collateral in supporting liquidity
Yuliya Baranova, Zijun Liu and Joseph Noss, Bank of England
ARtICLE
SUMMARY
25

CC
ILM
on
thly
Ne
wsl
ett
er
Se
pte
mb
er
20
16
lending transactions, the authors' estimate that the
average length of the 'supply chain' for high-quality
collateral to be around 3.90; that is, every unit of
collateral passed between those that supply to those
that demand it passes through an average of 3.9
intermediaries.
The quantity of equity that dealers are willing to
allocate to securities financing transactions is
modelled as a decreasing function of market stress.
The intuition is that as market stress intensifies,
dealers experience losses that reduce the value of
their capital (including equity allocated to
repo/reverse repo transactions).As market stress
and hence asset volatility increases, the threat of
insolvency causes shareholders' optimal choice of
leverage to fall, reducing dealers' capacity to act as
intermediaries. Throughout, this constraint on
dealers' leverage is assumed to match that imposed
by the regulatory minimum leverage ratio. This is
assumed to be 3% (equity as a proportion of total
assets), in line with the internationally agreed
Basel III standard.
This paper identifies and quantifies a number of
procyclical behaviours of market participants that
cause their supply of, and demand for, high-quality
collateral as well as their willingness and/or ability
to act as intermediaries in the market for securities
financing transactions to decrease/increase in
response to market stress. These include increased
perceptions of counterparty risk and the likelihood
that key financial intermediaries may seek to
deleverage.
Source: www.bankofengland.co.uk
ARtICLE
SUMMARY
26
CC
ILM
on
thly
Ne
wsl
ett
er
Se
pte
mb
er
20
16
WHAT'S NEW
InternationalDevelopments
• Bank of England's MPC voted for a package of measures designed to provide
additional support to growth and to achieve a sustainable return of inflation
to the 2% target comprising of: a 25 bps cut in Bank Rate to 0.25%; a new
Term Funding Scheme to reinforce the pass-through of the cut in Bank Rate;
the purchase of up to £10 billion of UK corporate bonds; and an expansion
of the asset purchase scheme for UK government bonds of £60 billion,
taking the total stock of these asset purchases to £435 billion. The last three
elements will be financed by the issuance of central bank reserves.
• Bank of England cut its growth forecast for 2017 to 0.80% and 1.80% in
2018. BoE Governor Mark Carney declared that all elements of the stimulus
can be taken further, including another rate cut.
• Reserve Bank of Australia lowered the cash rate by 25 bps to 1.50%, effective
August 3, 2016 in a bid to counter disinflation and support the labor
market.
• Reserve Bank of Australia said the outlook for the currency and China are
key uncertainties to its growth and inflation forecasts, which were otherwise
little changed.
• Reserve Bank of New Zealand reduced the Official Cash Rate by 25 bps to
2.0% and highlighted the need for further policy easing as it struggles to
head off the dangers of deflation.
• Fed Chair Janet Yellen said the case for raising interest rates had
“strengthened” but did not provide the timeline. Fed vice-chairman Stanley
Fischer said an increase was a possibility in September.
• Federal Reserve Vice Chairman Stanley Fischer signaled that a 2016 rate hike
is still under consideration as the economy is already close to meeting the
Fed's goals and growth will gain steam.
• The People's Bank of China said it will use multiple tools to keep liquidity at
reasonably ample levels and maintain reasonable credit growth in the second
half.
• The People's Bank of China said frequent reductions to lenders' reserve
requirements would add too much liquidity to the financial system, lead to
yuan depreciation expectations fuelling speculative currency trading and
also spur declines in borrowing costs.
briefing
27
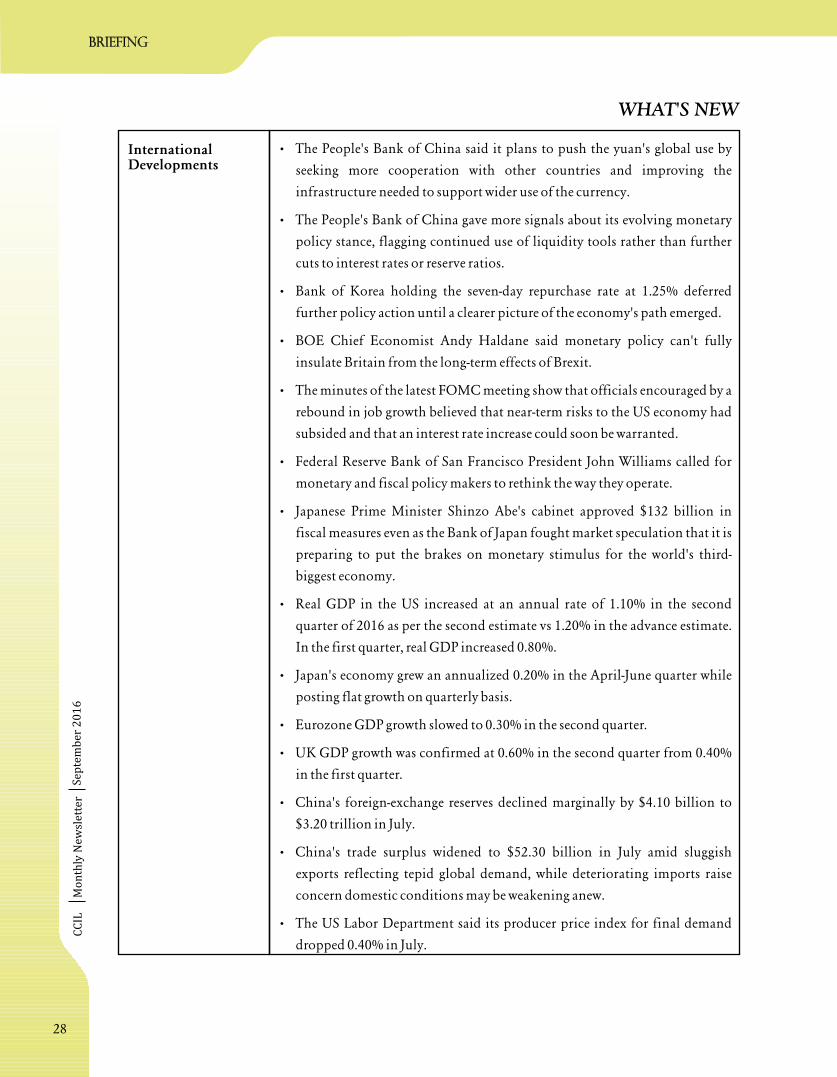
CC
ILM
on
thly
Ne
wsl
ett
er
Se
pte
mb
er
20
16
WHAT'S NEW
InternationalDevelopments
• The People's Bank of China said it plans to push the yuan's global use by
seeking more cooperation with other countries and improving the
infrastructure needed to support wider use of the currency.
• The People's Bank of China gave more signals about its evolving monetary
policy stance, flagging continued use of liquidity tools rather than further
cuts to interest rates or reserve ratios.
• Bank of Korea holding the seven-day repurchase rate at 1.25% deferred
further policy action until a clearer picture of the economy's path emerged.
• BOE Chief Economist Andy Haldane said monetary policy can't fully
insulate Britain from the long-term effects of Brexit.
• The minutes of the latest FOMC meeting show that officials encouraged by a
rebound in job growth believed that near-term risks to the US economy had
subsided and that an interest rate increase could soon be warranted.
• Federal Reserve Bank of San Francisco President John Williams called for
monetary and fiscal policy makers to rethink the way they operate.
• Japanese Prime Minister Shinzo Abe's cabinet approved $132 billion in
fiscal measures even as the Bank of Japan fought market speculation that it is
preparing to put the brakes on monetary stimulus for the world's third-
biggest economy.
• Real GDP in the US increased at an annual rate of 1.10% in the second
quarter of 2016 as per the second estimate vs 1.20% in the advance estimate.
In the first quarter, real GDP increased 0.80%.
• Japan's economy grew an annualized 0.20% in the April-June quarter while
posting flat growth on quarterly basis.
• Eurozone GDP growth slowed to 0.30% in the second quarter.
• UK GDP growth was confirmed at 0.60% in the second quarter from 0.40%
in the first quarter.
• China's foreign-exchange reserves declined marginally by $4.10 billion to
$3.20 trillion in July.
• China's trade surplus widened to $52.30 billion in July amid sluggish
exports reflecting tepid global demand, while deteriorating imports raise
concern domestic conditions may be weakening anew.
• The US Labor Department said its producer price index for final demand
dropped 0.40% in July.
briefing
28

CC
ILM
on
thly
Ne
wsl
ett
er
Se
pte
mb
er
20
16
WHAT'S NEW
Indian Economy • The Central Government, in consultation with RBI, fixed the inflation
target for the period beginning from August 5, 2016 and ending on the
March 31, 2021, as 4% with the upper tolerance level at 6% and the lower
tolerance level at 2%. The Government also notified the statutory and
institutionalized framework for monetary policy.
• The Rajya Sabha voted to approve the constitutional amendment that will
help usher in the GST.
• The Finance Ministry said that all efforts are being made to roll out GST
from April 1, 2017, and allayed fears that it will have an impact on inflation
even if the rate is kept at 20%.
• GDP at constant (2011-12) prices in Q1 of FY17 is estimated at 29.17 lakh
crore ( 27.24 lakh crore in Q1 of FY16), showing a growth rate of 7.10%.
Quarterly GVA at Basic Price at constant (2011-2012) prices for Q1 of FY17
is estimated at 27.38 lakh crore showing a growth rate of 7.30%, as against
25.51 lakh crore in Q1 of FY16.
• India registered a fiscal deficit of 67,164 crore during July 2016, a decline
of 31.75% over the fiscal deficit of 98,408 crore in July 2015. The fiscal
deficit during April-July 2016 accounted for 73.70% of the budgeted
estimates of 5,33,904 crore for 2016-17.
• India's exports declined 6.84% in July 2016 to $21.69 billion from $23.28
billion in July 2015. Imports fell 19.03% to $29.45 billion from $36.37
billion. The overall trade deficit for April-July 2016 was estimated at
US$10.80 billion which was 63.38% lower than the deficit of US$29.49
billion during April-July 2015.
• The Index of Industrial Production (IIP) grew 2.10% in June 2016 against
4.20% growth in June 2015. The IIP grew 0.60% in April-June 2016 as
against growth of 3.30% in April-June 2015.
• The eight core industries with a combined weight of 37.90% in the Index of
`
`
`
`
`
`
`
• China's CPI rose 1.80% in July while producer prices fell 1.70% from a year
earlier.
• Consumer-price growth in the U.K. increased to 0.60% in July from 0.50%
in June.
• The Financial Stability Board warned that the world's biggest banks still
cannot be wound down in an orderly manner.
InternationalDevelopments
briefing
29
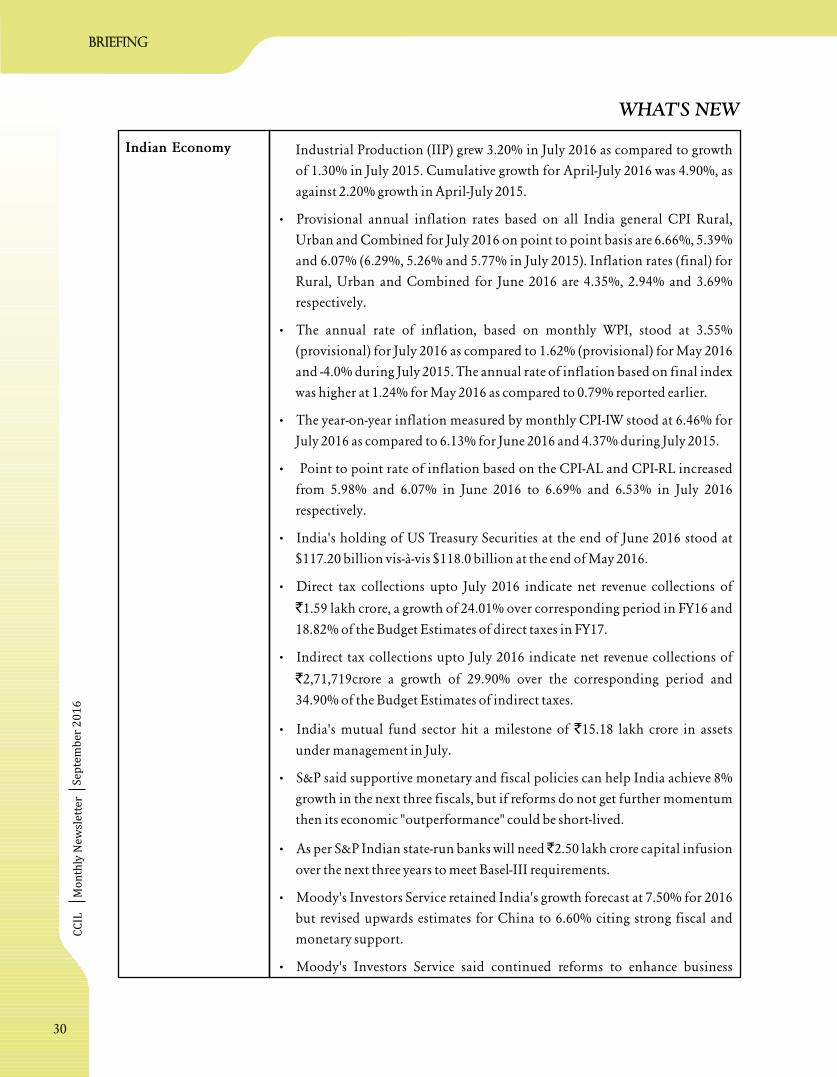
CC
ILM
on
thly
Ne
wsl
ett
er
Se
pte
mb
er
20
16
WHAT'S NEW
Industrial Production (IIP) grew 3.20% in July 2016 as compared to growth
of 1.30% in July 2015. Cumulative growth for April-July 2016 was 4.90%, as
against 2.20% growth in April-July 2015.
• Provisional annual inflation rates based on all India general CPI Rural,
Urban and Combined for July 2016 on point to point basis are 6.66%, 5.39%
and 6.07% (6.29%, 5.26% and 5.77% in July 2015). Inflation rates (final) for
Rural, Urban and Combined for June 2016 are 4.35%, 2.94% and 3.69%
respectively.
• The annual rate of inflation, based on monthly WPI, stood at 3.55%
(provisional) for July 2016 as compared to 1.62% (provisional) for May 2016
and -4.0% during July 2015. The annual rate of inflation based on final index
was higher at 1.24% for May 2016 as compared to 0.79% reported earlier.
• The year-on-year inflation measured by monthly CPI-IW stood at 6.46% for
July 2016 as compared to 6.13% for June 2016 and 4.37% during July 2015.
• Point to point rate of inflation based on the CPI-AL and CPI-RL increased
from 5.98% and 6.07% in June 2016 to 6.69% and 6.53% in July 2016
respectively.
• India's holding of US Treasury Securities at the end of June 2016 stood at
$117.20 billion vis-à-vis $118.0 billion at the end of May 2016.
• Direct tax collections upto July 2016 indicate net revenue collections of
1.59 lakh crore, a growth of 24.01% over corresponding period in FY16 and
18.82% of the Budget Estimates of direct taxes in FY17.
• Indirect tax collections upto July 2016 indicate net revenue collections of
2,71,719crore a growth of 29.90% over the corresponding period and
34.90% of the Budget Estimates of indirect taxes.
• India's mutual fund sector hit a milestone of 15.18 lakh crore in assets
under management in July.
• S&P said supportive monetary and fiscal policies can help India achieve 8%
growth in the next three fiscals, but if reforms do not get further momentum
then its economic "outperformance" could be short-lived.
• As per S&P Indian state-run banks will need 2.50 lakh crore capital infusion
over the next three years to meet Basel-III requirements.
• Moody's Investors Service retained India's growth forecast at 7.50% for 2016
but revised upwards estimates for China to 6.60% citing strong fiscal and
monetary support.
• Moody's Investors Service said continued reforms to enhance business
`
`
`
`
Indian Economy
briefing
30

CC
ILM
on
thly
Ne
wsl
ett
er
Se
pte
mb
er
20
16
WHAT'S NEW
• Dr. Urjit R Patel has been appointed as the new Governor of RBI for a period
of three years with effect from September 4, 2016.
• The 559th meeting of the Central Board of the RBI was held on Thursday,
August 11, 2016 at Mumbai. The Board approved the transfer of surplus of
the RBI for the year 2015-16 amounting to 658.76 billion to the
Government of India.
• RBI announced measures for development of fixed income and currency
markets.
• RBI identified State Bank of India (SBI) and ICICI Bank as Domestic
Systemically Important Banks (D-SIBs) in 2016 and retained their bucketing
structure as in 2015.
• Sovereign Gold Bonds (issued on February 8, 2016 and March 29, 2016,
respectively) shall be eligible for trading on the stock exchanges from August
29, 2016 (Monday).
• RBI notified the operational guidelines for the Sovereign Gold Bonds 2016-
17 Series II.
• The issue price of the Sovereign Gold Bond 2016-17 Series II has been fixed
at 3,150/- (Rupees Three Thousand One Hundred Fifty only) per gram of
gold.
• The Sovereign Gold Bonds issued on August 05, 2016 shall be eligible for
trading from Thursday, September 01, 2016 on the stock exchanges.
• RBI notified the fixed timings for broadcasting of auction results and
allotment of GoI dated securities and T-Bills.
• RBI relaxed the eligibility conditions and other terms of participation in the
market repo transactions in government securities market.
`
`
Reserve Bank of India:(Source:http://rbi.org.in)
environment and moderate inflation will help India achieve robust
growth but cautioned that rising contingent liability risks in the banking
sector could affect its credit quality. It expects GDP growth around 7.50%
for next two years.
• Moody's stated that RBI should continue with its policies and
communication showing commitment to achieve its inflation target.
• As per Care Ratings, the banking sector's NPAs almost doubled to 8.50%
in the first quarter driven by surging bad assets of state-run lenders.
• Goldman Sachs maintained its GDP growth forecast of 7.90% for this
fiscal.
Indian Economy
briefing
31

CC
ILM
on
thly
Ne
wsl
ett
er
Se
pte
mb
er
20
16
WHAT'S NEW
• RBI clarified on the prudential norms for off-balance sheet exposures of
banks for restructuring of derivative contracts.
• RBI permitted banks to engage the services of its retired officials for assisting
in internal audit.
• RBI permitted brokers registered with SEBI and authorised as market
makers in corporate bond market to undertake repo/reverse repo contracts
in corporate debt securities.
• RBI notified the guidelines on enhancing credit supply for large borrowers
through market mechanism.
• RBI relaxed the aggregate exposure limit of banks regarding Partial Credit
Enhancement (PCE) to corporate bonds.
• RBI placed the draft circular on customer protection limiting liability of
customers in unauthorisedelectronic banking transactions for feedback.
• RBI notified on the modification in procedure for handling dishonour of
cheques.
• RBI sought comments on the draft large exposures framework.
• RBI notified on priority sector lending status for factoring transactions.
• RBI published the report of the working group on corporate bond market in
India.
• RBI released guidelines for 'on tap' licensing of universal banks in the
private sector.
• RBI notified the Master Circular on collection of direct taxes OLTAS.
• RBI issued Master Directions for exemptions from the provisions of RBI
Act, 1934.
• RBI reviewed the prudential norms for risk weights for exposures to
corporates, AFCs and NBFC-IFCs.
• RBI issued Master Directions for Non-Banking Financial Companies.
• RBI constituted a Committee on household finance.
• RBI notified on capacity building in banks and AIFIs.
• RBI notified the timeline for implementation of Indian Accounting
Standards (Ind AS) by All India Financial Institutions.
• RBI notified the revised reporting format for Financial Literacy Centres.
• RBI extended the deadline for Bharat Bill Payment Operating Units
(BBPOU) applicants to December 31st.
briefing
32

CC
ILM
on
thly
Ne
wsl
ett
er
Se
pte
mb
er
20
16
Reserve Bank of India:(Source:http://rbi.org.in)
WHAT'S NEW
• RBI launched the 10th pilot round of quarterly services and infrastructure
outlook survey for Q2 FY17.
• RBI launched the 75th round of the quarterly Industrial Outlook Survey for
reference period Q2 FY17.
• RBI launched the September 2016 round of inflation expectations survey of
households.
• RBI launched the September 2016 round of Consumer Confidence Survey
(CCS).
• RBI released the summary of the electronic consultation with the Technical
Advisory Committee on Monetary Policy: August 2016.
• RBI released its Annual Report for 2015-16.
• RBI released 'Quarterly BSR-1: Outstanding Credit of Scheduled
Commercial Banks for March 2016'.
• RBI released the results of forward looking Surveys.
• RBI released data related to results of the 2015-16 round of the survey of
foreign liabilities and assets of the mutual fund companies.
• RBI released data on India's international trade in services for June 2016.
• RBI released data on overseas direct investment for July 2016.
• RBI released data on sectoral deployment of bank credit for July 2016.
• RBI released data on ECB/FCCB for July 2016.
CCIL • On September 8, 2016, CCIL conducted the 11th cycle of the
Portfolio Compression exercise in the OTC Interest Rate Swaps
market. The exercise achieved a compression of 84% and a market-
wide reduction of notional outstanding of 2,18,958.79 crore.
• FX-SWAP Dealing System registered its highest daily volume of USD
730.00 million on September 6, 2016.
• Trades on the ASTROID (the Anonymous IRS Dealing System)
recorded their highest level of 6,700 crore on September 14, 2016.
• CBLO volumes recorded their all-time high volumes of 1,16,232.60
crore on September 15, 2016.
`
`
`
briefing
33

CC
ILM
on
thly
Ne
wsl
ett
er
Se
pte
mb
er
20
16
Speaking on evolution of Indian debt and
associated derivatives markets including product
innovation and regulator's dilemmas, Dr. Rajan
said that the recent positive attractiveness in the
debt market was primarily factored on stable and
low inflation, reluctance of public sector banks
(PSBs) to lend and latest reforms like SARFAESI
Act, Debt Recovery Tribunals and the new
Bankruptcy Code. The reluctance of full pass-
through benefits of policy rate cuts into bank
lending rates was an additional contributing factor.
The sharp rise in commercial paper outstanding in
the last two years confirms the shift in borrowing
preference of highly-rated firms and the bypassing
of banks to borrow from the CP market. The latest
reforms display the RBI's cautious liberalizing
approach in the fixed income and derivative
markets with focused objective of enhancing
growth and maintaining stability.
RBI had proceeded cautiously in last few years on
market development which helped to strengthen
macroeconomic stability and addressed concerns
related to vulnerabilities due to fragile global
financial markets. It also tried to enhance greater
participation to add liquidity in the market,
particularly in G-Sec market by providing market
access through NDS-OM and linking it to de-mat
accounts for retail participation. On other hand,
high quality corporate credits could migrate from
banks to debt markets in the competitive market
infrastructure setup. Although substantial
borrowing by many institutional players like
NBFCs from banks and speculative trading in the
fixed market generates risks, the innovative fixed
income products and derivatives can be used to
mitigate those risks and help stabilize the markets.
The interest rate future (IRF) is one of such
successful traded innovation in the recent period
which can be used by investors to gain or shed
interest exposures. However, there were some other
innovative products like Inflation Indexed Bonds
(IIBs) that did not get good market response.
Intuitively, financial innovations have two major
dimensionalities - first is a way to evade or avoid
taxes and regulations and second is risk mitigating
objective. Dr. Rajan suggested that innovative
instruments need to be designed appealing to
investor specifications along with tinkering option
to modify some feature depending on dynamics of
market responses and requirements (Sandbox
Approach), rather than creating tax or regulatory
arbitrage. He added that the regulator needs to
create the necessary infrastructure for financial
innovation. The setting up of the Financial
Benchmarks India Pvt. Limited (FBIL which is
building a series of market benchmarks) is one of
latest infrastructure development in the field of
financial innovation. Recently the RBI also relaxed
norms for institutional participation, giving
Foreign Portfolio Investors (FPIs) direct access to a
variety of markets including NDS-OM and
corporate bond trading and going forward for
other market segments. It also took a fundamental
decision to allow all participants a moderate open
position in the exchange rate market to manage the
exchange risk - which will also rectify market
imbalances, improving exchange market liquidity
and depth without imposing regulatory supports.
India as a current account deficit country depends
on foreign financing through foreign direct
investment and equity investment for its current
Dr. Raghuram Rajan at FEDAI, August 2016
Strengthening Our Debt Market
SPEECH
34

CC
ILM
on
thly
Ne
wsl
ett
er
Se
pte
mb
er
20
16
account deficit financing. These foreign inflows
lead to deepening of debt and derivative markets
along with better price discovery and liquidity. On
the reform front, Dr. Rajan advocated giving
companies option to borrow in the currency they
want and how much they want to hedge. But given
India's weak bankruptcy system, there is moral
hazard built into unhedged foreign borrowing. In
case of rupee depreciation, severe problem may
arise when the issuance of short-term dollar or yen
denominated debt by infrastructure companies is
left unhedged. Hence the RBI encourages
companies without foreign exchange earnings to
either issue long term dollar bonds or rupee
denominated Masala bonds abroad. Dr. Rajan
advised that companies should issue Masala bonds
abroad in domestic currency which will
complement a vibrant domestic corporate bond
market.
Despite strong FDI flows to cover current account
deficit, the RBI has progressively expanded FDI
limits in government debt and also opened up
investment in state government debt with medium
term plan in process of strengthening of domestic
markets. It is liberalizing foreign inflow norms into
debt market steadily to improve the market depth
and liquidity. While he expressed his agreement
with the attractiveness of a globally issued dollar
denominated G-Sec especially in the yield-starved
world, he was against its suitability for India in
present market conditions due to associated
currency risks. Instead he suggested building out an
international quasi-sovereign rupee yield curve
which can be useful for better price discovery for
the rupee issuances.
Dr. Rajan also briefly discussed the RBI's effort to
even out the rupee yield curve. The RBI is trying to
bring more liquidity and better pricing through the
auctioning of term repo at the very short end, while
at long end, the apex bank is focused on more
illiquid securities through open market operations
so that the term curve evens out. RBI has also
initiated the process to amend the RBI Act to allow
it to conduct repos of corporate bonds with banks
and other financial institutions to bring liquidity
in the corporate debt market. Dr. Rajan advocated
for due diligence by credit rating agencies based on
qualitative and quantitative information about
corporate bank borrowings. RBI also keeps
vigilance on bank exposures to single/group large
corporations with risk concentration and is open
to imposing higher provisioning and capital
requirements for banks on such corporate lending
in the stress period. Dr. Rajan also emphasized on
greater clarification on obligations (including
guaranteed) of state governments to keep zero risk
weight without any explicit or implicit default or
restructuring of such obligations. He also touched
on the RBI's recent decisions to make lending
norms easier for banks to offer appropriate
amounts of credit enhancement, especially for
infrastructure projects.
Concluding his speech, Dr. Rajan said that as a
policy liberalizer, the RBI follows 'mini bang'
reform approach at a steady and irreversible pace to
re l a x p rud en t i a l r e gu l a t i on s w i t hou t
compromising systemic stability in the long run
instead of allowing risky routes of financing (either
through lower provisions or higher leverage or
ECBs) of infrastructure projects. It would be better
proposition for the Government to directly
subsidize such activities in case of their relevance of
national importance rather than for the RBI to
sacrifice systemic stability. A measured and well-
signaled liberalization of fixed income and
derivative markets will probably reap benefits of
deeper and more liquid markets, while minimizing
the risks associated with speculation, competition
and innovation.
Source: www.rbi.org.in
SPEECH
35

CC
ILM
on
thly
Ne
wsl
ett
er
Se
pte
mb
er
20
16
Addressing the FICCI-IBA Annual Global Banking
Conference, Dr. Rajan discussed the challenges faced
by public sector banks in the new competitive
environment and some possible solutions for it. He
emphasized on improving the operational efficiency
of stressed assets and creating the right capital
structure, thus implying simultaneous action on two
fronts. Looking beyond stressed assets to growth,
there are interesting, profitable, and challenging
times ahead for the financial sector. Interesting as
the level of competition is going to increase
manifold, both for customers as well as for talent.
Profitable as new technologies, information, and
new techniques open up new business opportunities
and customers. Challenging as competition and
novelty constitute a particularly volatile mix in
terms of risk.
Speaking on these aspects, he said that new niche
banks are likely to begin business, resulting in
increased competition and profitability. India has
enormous project financing needs in the coming
days as several airports, railway lines, power plants,
roads and manufacturing plants are in the pipeline.
However, banks have to lower their risks of lending
by developing industry knowledge in key areas
through in-house expertise in project evaluation,
demand projections for the project's output, likely
competition, and expertise and reliability of the
promoter. They have to mitigate real risks where
possible, and share where not. The third element of
project structuring is an appropriately flexible
capital structure. Fourth, financiers need to put in a
robust system of project monitoring and appraisal,
including real-time monitoring of costs. Lastly, the
incentive structure for bankers has to be worked out
so that they evaluate, design, and monitor projects
carefully, and get rewards accordingly.
Competition among banks is increasing and ways of
delivering financial services are changing
tremendously forcing banks to discover strategies
using advantages such as convenience, information,
and trust to remain on the competitive frontier.
Authorities should ensure their actions are
institution, ownership, and technology neutral to
ensure that efficient customer-oriented solutions
emerge through competition. Further, authorities
like the central bank and the Government should,
over the medium term, reduce the differences in
regulatory treatment between public sector banks
and private sector banks, and more generally,
between banks and other financial institutions. The
differences can be mitigated if the government pays
an adequate price for mandates. However, mandates
should increasingly be paid for, and are easier to
achieve as the institutional and technological
underpinnings of financial services improve.
Among the various challenges faced by public sector
banks, the most pressing task is to clean up their
balance sheets. The other tasks include improving
governance and management, filling out the ranks
of middle management which are thinned out by
retirements, and recruiting talent with expertise in
project evaluation, risk management, and IT,
including cyber security. The Bank Board Bureau
(BBB), composed of eminent personalities with
integrity and domain experience, has taken over part
of the appointments process in public sector banks.
Over time, as the bank boards are professionalized,
executive appointment decisions should devolve
from the BBB to the boards themselves, while the
BBB should focus on appointing directors to
Interesting, Profitable, and Challenging: Banking in India Today
Dr. Raghuram Rajan, Governor, at FICCI-IBA Annual Banking Conference, August 16, 2016
SPEECH
36

CC
ILM
on
thly
Ne
wsl
ett
er
Se
pte
mb
er
20
16
represent the government stake on the bank boards.
Management practices should be tightened as too
many loans are done without adequate due diligence
and without adequate follow up.
Banks could use the opportunity offered by
retirements to reorient hiring towards the skills they
need, and offer attractive rapid career progression
supported by strong training programs to new hires.
Public sector banks need to attract talent in
specialized areas by hiring laterally in small doses.
They should have more freedom to hire locally, and
pay wages commensurate with the local labour
market to have local information, be comfortable
with local culture, be locally accepted, and be
competitive in low-cost rural areas. The emphasis
should be on customer service and customer-centric
advice in order to recapture low-cost customer
deposits that are migrating elsewhere. Further, as
banks get cleaned up, and their boards are
strengthened, the focus should be on appropriate
structure as part of an overall rethink on strategy.
Since the performance of banks are monitored by
several authorities, it is important to streamline and
reduce the overlaps between the jurisdictions of the
authorities, and specify clear triggers where one
authority's oversight is invoked. Much of the
governance should be moved to the bank's board,
and public sector bank boards should be bound by
the rules same as of private sector bank boards. The
Department of Financial Services could move to a
program, coordinating and developmental role,
while the RBI would perform a purely regulatory
role. Lastly, Dr. Rajan urged banks to take a fresh
look at their systems, more importantly, the cyber
culture within the bank.
Source: www.rbi.org.in
SPEECH
37

CC
ILM
on
thly
Ne
wsl
ett
er
Se
pte
mb
er
20
16
In his speech, Shri Mundra traced the reforms in the
banking industry with an emphasis on public sector
banks (PSBs).
PSBs came into existence with nationalization in the
year 1969/1980 with a banking scenario of highly
regulated credit flow, militant unionized
atmosphere (resistance to technology), stiff branch
authorization norms, loan melas, and opaque
income recognition & asset classification (IRAC)
norms. Post-reform years (after 1991) saw several far-
reaching reforms in banking industry such as
deregulation of credit processes and interest rate
structures, introduction of prudential IRAC norms,
licensing of banks in the private sector/part
divestment in PSBs, migration to CBS etc. By 2008,
banks' balance sheets were much stronger, growth
was strong and NPAs had come down from the peak
of around 12% to slightly over 2%. Two
developments followed, namely, the global financial
crisis and introduction of PPP model in
infrastructure building. Banks were enthusiastic,
rather major partners, in this newly opened field
supported by accommodative fiscal and easy
monetary policies. However, the process got plagued
by weak governance, lax underwriting, high
corporate leverage, several policy logjams. By June
2016, the gross NPAs to gross advances stood at
11.30% in case of PSBs with a net loss after tax of
20,006 crore (as of March 2016).
While some of the events were external and hence,
not in control of the banks' management, Shri
Mundra noted that the important lesson was that in
absence of strong structural and governance reforms,
consistency of the performance would always remain
susceptible to such events. He stated that the
immediate and overriding priority for PSBs is to
complete the clean-up of the banks' balance sheets
which is underway. Resultant provisioning needs,
coupled with meeting Basel III norms/migration to
IFRS and to capture due market share in growth
funding would entail recapitalisation of most of
these banks. Seeking this capital externally at this
stage may be difficult as also value eroding for the
majority owner.
Simultaneously this process has to continue to
bestow greater “governance autonomy” to these
banks. The government ownership of these banks
has resulted in crucial stability and resilience in
trying times. Immediate roadmap should, therefore,
be towards complete “managerial autonomy”. If the
Government remains the largest but not necessarily
majority shareholder, it still serves the intended
purpose. At the same time, it releases these banks
from multi-institutional oversights and overlapping
controls. There could be a reasonable apprehension
that such measures can adversely impact the
objectives of inclusive growth being attempted
through several national missions and schemes. He
however argued that advent of several new
institutions (as recently licensed by RBI), new
processes, digital advancements & competition
would ensure that these objectives are well
supported.
Shri Mundra later discussed the reform process,
beginning with the governance in banks and
followed by reforms in the area of operational risks,
customer service and technology. While noting that
`
Banking Sector Reforms: A Journey, Not a Destination
Special Address by Shri S.S.Mundra, Deputy Governor, Reserve Bank of India at India Banking Reforms Conclave 2016
organized by Governance Now in Mumbai on August 24,2016.
SPEECH
38

CC
ILM
on
thly
Ne
wsl
ett
er
Se
pte
mb
er
20
16
the selection process has been made more objective
by actions such as setting up of BBB, and splitting
the post of CMD into a non-executive Chairman
and a CEO, he stated that going forward, BBB
should also cover selection of other Board members.
Other crucial points noted in this regard were
continuity of top management (wherein initial
appointment could be for 3 years with certain set
milestones, which if achieved, should earn
automatic extension for next 2 years) and an orderly
succession plan to ensure no abrupt changes in key
direction of the organization.
With respect to operational risks, he stressed on the
need to bring fraudsters as also errant valuers,
accountants, lawyers to book to stop them from
duping the system in future. Additionally, he
suggested a Fraud Registry and a Quick Response
Team at RBI to facilitate information sharing and
for closely tracking high-value fraud cases. He also
stated that strong centralized processing and
surveillance was needed as branches do not have the
capability to handle such areas effectively.
He further highlighted that bank boards would do
well to focus on the Governance issues with respect
to strategy and risk management. Boards should set
the “risk appetite” and ensure adherence of the same.
Further banks should put an enabling mechanism to
ensure that voice of middle/lower level functionaries
reaches the Top quickly.
Shri Mundra concluded by noting that while the
reform measures especially on governance have
achieved traction and attained a certain degree of
maturity, the need now is to accelerate this reform
process.
Source: www.rbi.org.in
SPEECH
39

CC
ILM
on
thly
Ne
wsl
ett
er
Se
pte
mb
er
20
16
Market Roundup
Domestic Macroeconomic Development
The Union Cabinet has approved setting up of GST Council and setting up its Secretariat with its head office
at New Delhi. The Council will be headed by Finance Minister and comprises representatives of all 29 states
and two union territories. The revenue secretary would be Ex-Officio Secretary to the GST Council and
Chairman of Central Board of Excise and Customs (CBEC) would be a permanent invitee (non-voting) to all
proceedings of the GST Council. The centre will have one-third vote, states together will have a two-third vote
and any resolution would be adopted by three-fourth majority. The GST Council will decide on the rate of tax
under the new indirect taxation regime and will make recommendations to the Union and the States on the
important issues related to GST. The central GST (CGST) and Integrated GST (IGST) will be drafted on the
basis of the model GST law, while the states will draft their respective GST (SGST) laws with minor variation
incorporating state-based exemptions. The IGST law would deal with inter-state movement of goods and
services.
According to Central Statistics Organization (CSO) latest data release, Indian economy grew at 7.09% (real
GDP growth) in the Q1:2016-17 compared to 7.95% in the preceding quarter and 7.47% in the corresponding
period of the last fiscal year. However, the GVA estimate was relatively better at 7.32% in the same quarter and
also stood higher than 7.18% growth in the Q1:FY16 indicating synergized economic activity in Q1: 2016-17.
The growth seems to be driven by sharp rise in the domestic consumption (8.7%), particularly in the
government consumption expenditure - which grew at 18.8% in the same quarter. However, aggravated
contraction in the gross capital formation (-4.58%) and net exports (-93.5%) were signaling the presence of
structural bottlenecks. Manifold growth in discrepancies for the third successive quarter also undermines the
robustness of the fastest economic growth claims regardless of lagged effects of policy reforms - like 'Make in
India' programme.
Sector-wise performance shows slowdown in agricultural production at 1.8% in the same quarter compared
to 2.6% in Q1 2015-16) - largely due to sharp decline in rice production (-7.7%), coarse cereals (-9.7%) and
pulses (-4.2%) during the 'Rabi' season and their contractionary impact was offset by rise in wheat
production (8.1%) to some extent. Industrial production also registered moderation in its growth pace due to
contraction in mining & quarrying and deceleration in construction activity despite strong growth
acceleration in manufacturing production and electricity generation. The deterioration in mining output
(0.4%) was driven by decline in production of crude oil (-3.3%) and natural gas (-6.1%) - with the negative
impact counter-balanced by improvement in coal production (5.4%) and IIP mining (2.3%). Only service
sector recorded acceleration in its growth pace at 9.6% in the same quarter - mainly on account of
improvement in performance of financial services (9.4%) and public administration & defence services
(12.3%).
Macro-Economic Overview
MArket Roundup
40

CC
ILM
on
thly
Ne
wsl
ett
er
Se
pte
mb
er
20
16Table M2: Central Government's Income - Expenditure Details ( Crore)`
Table M1: Sector - Wise Growth (Y/Y) Rates (%)
Sectors2015-16
(PE)2015-16:
Q12015-16:
Q22015-16:
Q32015-16:
Q42016-17:
Q1
Agriculture, Forestry & Fishing 1.25 2.55 2.03 -0.96 2.32 1.84
Mining & Quarrying 7.44 8.45 4.95 7.10 8.57 -0.41
Manufacturing 9.29 7.31 9.18 11.52 9.32 9.10
Electricity, Gas, Water Supply & Other Utility 6.57 3.98 7.47 5.64 9.28 9.36
Construction 3.90 5.65 0.82 4.58 4.48 1.53
Industry 7.40 6.73 6.34 8.60 7.92 6.03
Trade, Hotels, Transport, Communication &Broadcasting Services
8.96 9.96 6.68 9.20 9.85 8.15
Financial, Real Estate & Professional Services 10.27 9.31 11.93 10.48 9.08 9.37
Public Administration, Defense, & Other Services 6.62 5.95 6.87 7.19 6.40 12.28
Services 8.92 8.78 9.00 9.14 8.75 9.58
GVA at Basic Price (at 2011-12 Prices) 7.19 7.18 7.31 6.86 7.42 7.32
GDP @ 2011-12 7.56 7.47 7.58 7.24 7.95 7.09
Source: Central Statistical Office (CSO) & CCIL ResearchGVA: Gross Value Adde d, AE: Advance Estimate, PE: Provisional Estimate
According to CGA (Controller General of Accounts) data release on central government finances, total
receipts grew at 21.9% (Y/Y) to 2,63,200 crore in April - July 2016 - largely on account of strong growth in
revenue receipts (22.4%). During the same period, the tax revenue receipts registered 44.1% growth to
2,21,668 crore. On expenditure side, the total expenditure recorded a 9.3% rise to 6,56,687 crore in the
same period - largely driven by sharp rise in revenue account (13.7%) of both plan and non-plan expenditure.
The slower growth (at higher base) in total expenditure caused a slower growth (2.2%) in the fiscal deficit 2.2%
to 3,93,487 crore in the first quarter of 2016-17 - which consequently will give more leeway for social welfare
expenditure and capacity building.
`
` `
`
BE: Budget Estimate, RE: Revised Estimate, PR: Provisional Estimate
2015-16: RE 2015-16: PR 2016-17: BE April - July'16 % of Actuals to BE
Total Receipts 1250301 1240918 1444956 263200 18.22%
Revenue Receipts 1206084 1195332 1377022 255766 18.57%
Non-Debt Capital Receipts 44217 45586 67134 7434 11.07%
Total Expenditure 1785391 1773269 1978060 656687 33.20%
Plan Expenditure 477197 471081 550010 197751 35.95%
Non-plan Expenditure 1308194 1302188 1428050 458936 32.14%
Fiscal Deficit 535090 532351 533904 393487 73.70%
Revenue Deficit 341589 342684 354015 329638 93.11%
Primary Deficits 92469 90622 41234 253008 613.59%
Source: Controller General of Accounts (CGA)
Macro-Economic Overview
MArket Roundup
41

CC
ILM
on
thly
Ne
wsl
ett
er
Se
pte
mb
er
20
16
Table M3: Direct & Indirect Tax Collection Details ( Crore)`
Source: CGA (www.cga.nic.in),* Includes STT, Banking Cash Transaction Tax, Fringe Benefit Tax, Wealth Tax etc.
Direct Tax Collection Indirect Tax Collection
Period CorporateTax
PersonalTax
TotalOtherTax*
CustomsDuty
CentralExciseDuty
ServiceTax
Total
Gross TaxCollection
2014-15 428925 258334 687259 11687 188016 189983 167969 545968 1244884
2015-16 454503 280311 734814 13188 210338 287151 211396 708885 1456887
Growth (%) 5.96 8.51 6.92 12.84 11.87 51.15 25.85 29.84 17.03
April - July'15 66319 61950 128269 3874 66399 58033 48535 172967 305110
April - July'16 67061 91834 158895 3868 72153 90328 61195 223676 386439
Growth (%) 1.12 48.24 23.88 -0.15 8.67 55.65 26.08 29.32 26.66
There was a continual sharp rise of 26.7% in central government's gross tax collection to 3,86,439 crore
during April - July 2016. This impressive growth was driven by robust growth in both - direct tax collection
(23.9%) to 1,58,895 crore and indirect tax collection (29.3%) to 2,23,676 crore in the same period. The
impressive growth in indirect tax collection - particularly in central excise duty (55.6%) and service tax
collection (26.1%) displays the impact of exaggerated economic activity, while on the other hand, the sharp
rise in personal tax collection (48.2%) against marginal growth in corporate tax collection (1.1%) appears as a
reflection of better collection under Income Declaration Scheme for undisclosed assets ending in
September'16.
`
` `
Chart M1: Central Government Tax Collection Profile ( Crore)`
0
50000
100000
150000
200000
250000
300000
350000
400000
Corporate Personal Direct Tax Custom
Duty
Excise Services Indirect
Tax
Gross Tax
April - July'15 April - July'16
Macro-Economic Overview
MArket Roundup
42
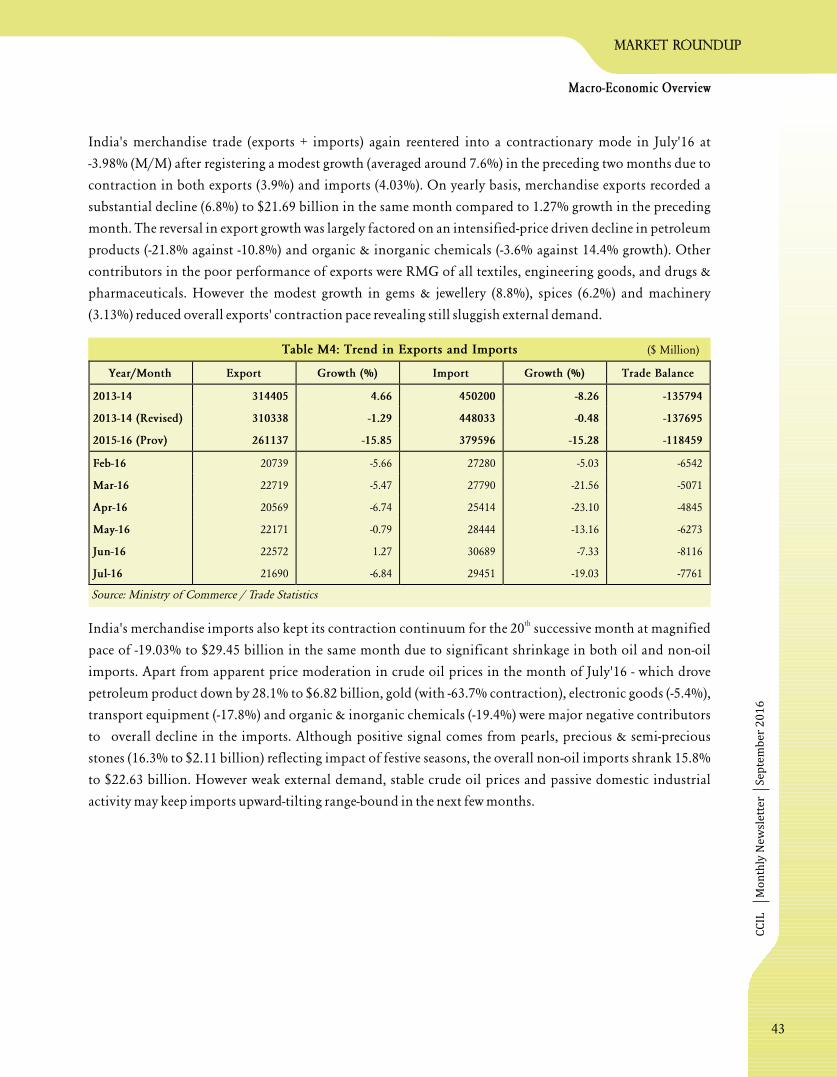
CC
ILM
on
thly
Ne
wsl
ett
er
Se
pte
mb
er
20
16
India's merchandise trade (exports + imports) again reentered into a contractionary mode in July'16 at
-3.98% (M/M) after registering a modest growth (averaged around 7.6%) in the preceding two months due to
contraction in both exports (3.9%) and imports (4.03%). On yearly basis, merchandise exports recorded a
substantial decline (6.8%) to $21.69 billion in the same month compared to 1.27% growth in the preceding
month. The reversal in export growth was largely factored on an intensified-price driven decline in petroleum
products (-21.8% against -10.8%) and organic & inorganic chemicals (-3.6% against 14.4% growth). Other
contributors in the poor performance of exports were RMG of all textiles, engineering goods, and drugs &
pharmaceuticals. However the modest growth in gems & jewellery (8.8%), spices (6.2%) and machinery
(3.13%) reduced overall exports' contraction pace revealing still sluggish external demand.
India's merchandise imports also kept its contraction continuum for the 20 successive month at magnified
pace of -19.03% to $29.45 billion in the same month due to significant shrinkage in both oil and non-oil
imports. Apart from apparent price moderation in crude oil prices in the month of July'16 - which drove
petroleum product down by 28.1% to $6.82 billion, gold (with -63.7% contraction), electronic goods (-5.4%),
transport equipment (-17.8%) and organic & inorganic chemicals (-19.4%) were major negative contributors
to overall decline in the imports. Although positive signal comes from pearls, precious & semi-precious
stones (16.3% to $2.11 billion) reflecting impact of festive seasons, the overall non-oil imports shrank 15.8%
to $22.63 billion. However weak external demand, stable crude oil prices and passive domestic industrial
activity may keep imports upward-tilting range-bound in the next few months.
th
Table M4: Trend in Exports and Imports ($ Million)
Source: Ministry of Commerce / Trade Statistics
Year/Month Export Growth (%) Import Growth (%) Trade Balance
2013-14 314405 4.66 450200 -8.26 -135794
2013-14 (Revised) 310338 -1.29 448033 -0.48 -137695
2015-16 (Prov) 261137 -15.85 379596 -15.28 -118459
Feb-16 20739 -5.66 27280 -5.03 -6542
Mar-16 22719 -5.47 27790 -21.56 -5071
Apr-16 20569 -6.74 25414 -23.10 -4845
May-16 22171 -0.79 28444 -13.16 -6273
Jun-16 22572 1.27 30689 -7.33 -8116
Jul-16 21690 -6.84 29451 -19.03 -7761
Macro-Economic Overview
MArket Roundup
43
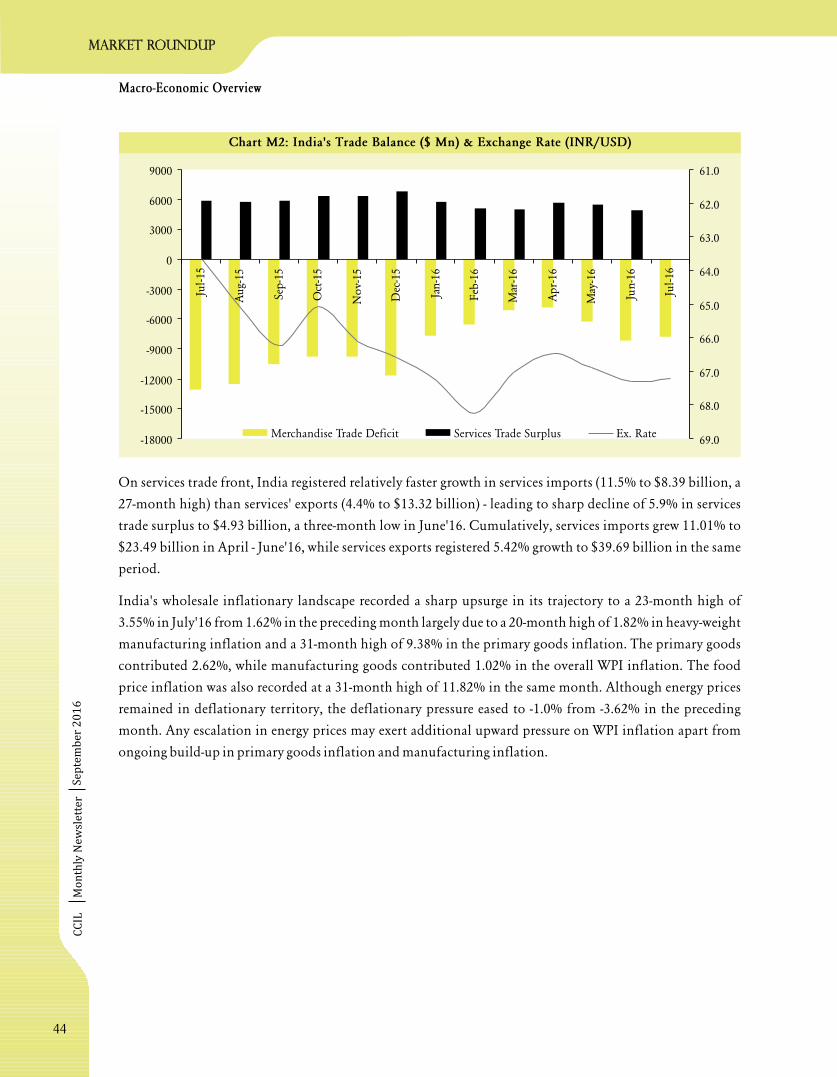
CC
ILM
on
thly
Ne
wsl
ett
er
Se
pte
mb
er
20
16
Chart M2: India's Trade Balance ($ Mn) & Exchange Rate (INR/USD)
On services trade front, India registered relatively faster growth in services imports (11.5% to $8.39 billion, a
27-month high) than services' exports (4.4% to $13.32 billion) - leading to sharp decline of 5.9% in services
trade surplus to $4.93 billion, a three-month low in June'16. Cumulatively, services imports grew 11.01% to
$23.49 billion in April - June'16, while services exports registered 5.42% growth to $39.69 billion in the same
period.
India's wholesale inflationary landscape recorded a sharp upsurge in its trajectory to a 23-month high of
3.55% in July'16 from 1.62% in the preceding month largely due to a 20-month high of 1.82% in heavy-weight
manufacturing inflation and a 31-month high of 9.38% in the primary goods inflation. The primary goods
contributed 2.62%, while manufacturing goods contributed 1.02% in the overall WPI inflation. The food
price inflation was also recorded at a 31-month high of 11.82% in the same month. Although energy prices
remained in deflationary territory, the deflationary pressure eased to -1.0% from -3.62% in the preceding
month. Any escalation in energy prices may exert additional upward pressure on WPI inflation apart from
ongoing build-up in primary goods inflation and manufacturing inflation.
-18000
-15000
-12000
-9000
-6000
-3000
0
3000
6000
9000
Jul-15
Aug-
15
Sep-1
5
Oct
-15
Nov-
15
Dec
-15
Jan-1
6
Feb
-16
Mar
-16
Apr-
16
May
-16
Jun-1
6
Jul-16
61.0
62.0
63.0
64.0
65.0
66.0
67.0
68.0
69.0Merchandise Trade Deficit Services Trade Surplus Ex. Rate
Macro-Economic Overview
MArket Roundup
44

CC
ILM
on
thly
Ne
wsl
ett
er
Se
pte
mb
er
20
16
Chart M3: Trajectory of WPI & CPI (Combined) Inflation (%)
On retail inflation front, CPI (Combined) inflation rose to a 23-month high of 6.07% in July'16 compared to
5.77% in June'16 - which was contributed by rural retail inflation with 3.59% share, while the urban retail
inflation contributed 2.48%. The consumption-wise profile shows that food and beverage prices rose by
7.96% and contributed 3.78% to the overall CPI inflation, while miscellaneous services contributed 1.08%.
The continual rise in consumer food price inflation to a 23-monthy high of 8.35% displays the supply-side
frictional pressures especially in pulses and fruits & vegetables prices despite good monsoon season. Any
serious intervention from the government in the supply-side management may ease some pressures and help
to moderate the overall CPI inflation; otherwise it would become a serious threat to inflation-targeting
objective of the monetary policy.
Table M5: Indian Inflation Environment: Inflation (Y-o-Y) Rate (%)
* P: Provisional; R: Revised for WPI; F: Final for CPI;Source: Office of the Economic Advisor & MOSPI, CFPI (C): Consumer Food Price Index (Combined),
Type Items July'16: P June'16: R/F 3 Months Ago 6 Months Ago 1 Year Ago
Primary 9.38 5.50 3.41 4.30 -3.98
Food Articles 11.82 8.18 4.70 6.46 -1.20
Fuel -1.00 -3.62 -4.83 -9.89 -11.56
Manufacturing 1.82 1.17 1.04 -1.17 -1.54
WPIInflation
Rate
WPI 3.55 1.62 0.79 -1.07 -4.00
CPI-Rural 6.66 6.29 6.17 6.48 4.35
CPI-Urban 5.39 5.26 4.68 4.81 2.94
CPI-Combined 6.07 5.77 5.47 5.69 3.69
CPIInflation
Rate
CFPI (C) 8.35 7.79 6.40 6.85 2.16
-6.0
-4.5
-3.0
-1.5
0.0
1.5
3.0
4.5
6.0
7.5
9.0
10.5
Jul-1
4
Aug-
14
Sep-1
4
Oct
-14
Nov-
14
Dec
-14
Jan-1
5
Feb
-15
Mar
-15
Apr-15
May
-15
Jun-1
5
Jul-1
5
Aug-
15
Sep-1
5
Oct
-15
Nov-
15
Dec
-15
Jan-1
6
Feb
-16
Mar
-16
Apr-16
May
-16
Jun-1
6
Jul-1
6
CPI (C) WPI
Macro-Economic Overview
MArket Roundup
45
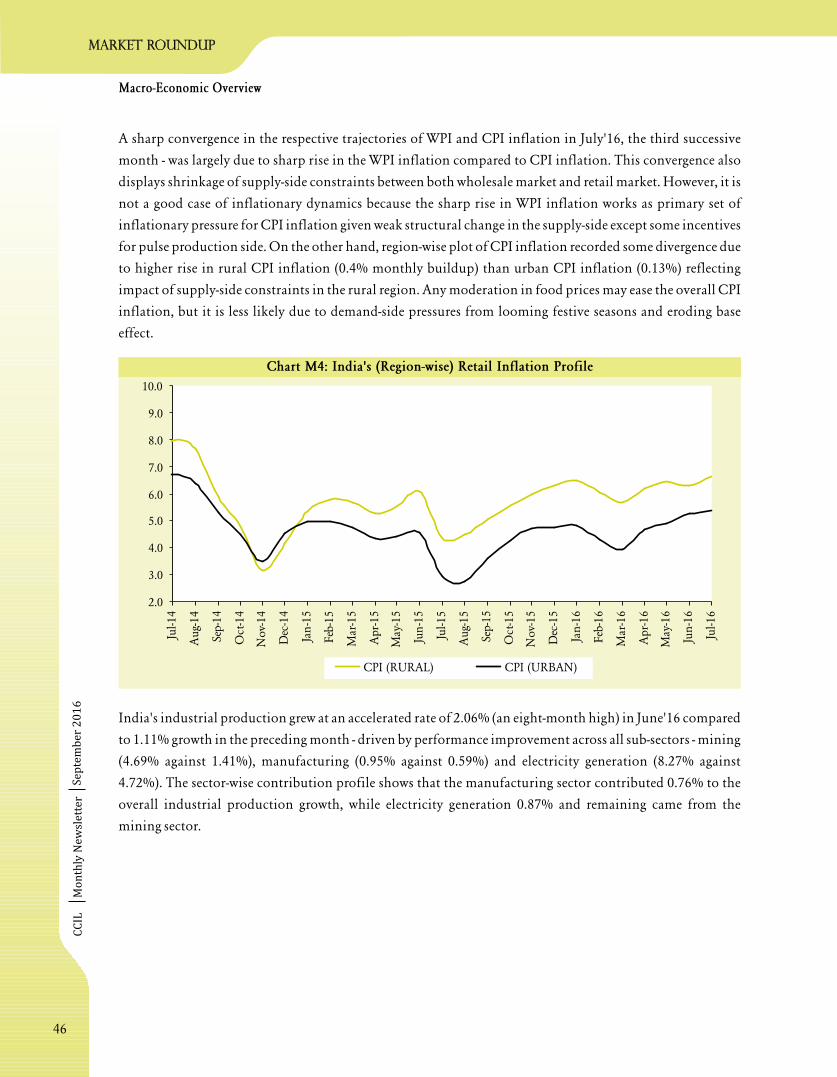
CC
ILM
on
thly
Ne
wsl
ett
er
Se
pte
mb
er
20
16
Chart M4: India's (Region-wise) Retail Inflation Profile
A sharp convergence in the respective trajectories of WPI and CPI inflation in July'16, the third successive
month - was largely due to sharp rise in the WPI inflation compared to CPI inflation. This convergence also
displays shrinkage of supply-side constraints between both wholesale market and retail market. However, it is
not a good case of inflationary dynamics because the sharp rise in WPI inflation works as primary set of
inflationary pressure for CPI inflation given weak structural change in the supply-side except some incentives
for pulse production side. On the other hand, region-wise plot of CPI inflation recorded some divergence due
to higher rise in rural CPI inflation (0.4% monthly buildup) than urban CPI inflation (0.13%) reflecting
impact of supply-side constraints in the rural region. Any moderation in food prices may ease the overall CPI
inflation, but it is less likely due to demand-side pressures from looming festive seasons and eroding base
effect.
India's industrial production grew at an accelerated rate of 2.06% (an eight-month high) in June'16 compared
to 1.11% growth in the preceding month - driven by performance improvement across all sub-sectors - mining
(4.69% against 1.41%), manufacturing (0.95% against 0.59%) and electricity generation (8.27% against
4.72%). The sector-wise contribution profile shows that the manufacturing sector contributed 0.76% to the
overall industrial production growth, while electricity generation 0.87% and remaining came from the
mining sector.
2.0
3.0
4.0
5.0
6.0
7.0
8.0
9.0
10.0
Jul-14
Aug-
14
Sep-1
4
Oct
-14
Nov-
14
Dec
-14
Jan
-15
Feb
-15
Mar
-15
Apr-
15
May
-15
Jun
-15
Jul-15
Aug-
15
Sep-1
5
Oct
-15
Nov-
15
Dec
-15
Jan
-16
Feb
-16
Mar
-16
Apr-
16
May
-16
Jun
-16
Jul-16
CPI (RURAL) CPI (URBAN)
Macro-Economic Overview
MArket Roundup
46

CC
ILM
on
thly
Ne
wsl
ett
er
Se
pte
mb
er
20
16
The Used-based production profile shows growth acceleration in production of basic goods (5.9%) and
intermediate goods (6.1%), and modest growth in consumer goods (2.85%) displaying intact domestic
demand. The improvement in the production of basic goods and intermediate goods for the seventh
successive month reflects more production activities in MSMEs segment, but continual contraction in
capital goods production (-16.5%) emerged as a major concern issue due to passive private investment activity
despite the RBI's policy rate cut (by 150 bps) and improvement in systemic liquidity. The performance of
eight major core-sector industries (as a group) faded with moderation in its growth pace from 5.23% in
June'16 to 3.16% in July'16 - mainly due to sharp deceleration in growth pace across all major sub-industries
except natural gas (3.3% against -4.5%) and refinery production (13.7% against 3.5%).
According to the IMF data, the global GDP growth projections for 2016 and 2017 are expected to remain
lower than its long-term average of 3.7% (1990-2007). Advanced economies are still running almost 1% below
average real growth due to weak consumption demand. Many advanced countries are struggling with private
and public sector debt overhang and impaired balance sheets of financial institutions - which are affecting
production capacity and skill-learning capacity of unemployed labor force. On supply side, the slowdown in
economic productivity and adverse demographic trends are weighing on potential growth. The economic
growth in emerging market economies are also slowing from an exceptionally fast pace of growth to modest
growth in the last decade, especially after eruption of global financial crisis (GFC). However, some large
emerging economies like China and India are growing significantly between 7% - 7.5%, while other
economies like Russia and Brazil are hostile to sharp contraction in their economic activity around 4%.
Despite a detail discussion on key global issues of low economic growth, high inequality and slow progress on
structural reforms by G-20 leaders in Hangzhou, China, the political pendulum still threatens to swing
against economic openness (post Brexit poll) and may raise risk to the concept of globalization. The global
economy could suffer from disappointing growth in absence of co-ordinated and forceful policy actions. On
Global Economic Development
Source: MOSPI & CCIL Research
Table M6: India's Industrial Production Growth Profile & Sectoral Contribution
Growth (Y/Y) Rate (%)Growth (Y/Y) Rate on
Use-Based (Goods) ClassificationSectoral Contribution (%)
in IIP Growth
Period Mining MFG Electricity IIP Basic Capital Intermediate Consumer Mining MFG Electricity
2014-15 1.45 2.30 8.43 2.81 7.13 1.60 1.78 -4.45 0.15 1.84 0.83
2015-16 2.18 2.01 5.61 2.40 3.38 1.08 2.04 3.28 0.22 1.59 0.58
Jan-16 1.54 -2.94 6.56 -1.59 1.94 -21.55 2.84 -0.10 0.16 -2.36 0.63
Feb-16 5.02 0.62 9.58 1.93 5.41 -9.34 4.87 0.60 0.51 0.50 0.91
Mar-16 0.34 -1.05 11.79 0.30 4.37 -15.32 4.25 0.64 0.04 -0.84 1.08
Apr-16 1.07 -3.66 14.56 -1.35 4.66 -25.04 2.28 -1.88 0.10 -2.93 1.50
May-16 1.41 0.59 4.72 1.11 3.78 -12.35 3.88 1.01 0.14 0.46 0.53
Jun-16 4.69 0.95 8.27 2.06 5.88 -16.47 6.07 2.85 0.45 0.76 0.87
Macro-Economic Overview
MArket Roundup
47

CC
ILM
on
thly
Ne
wsl
ett
er
Se
pte
mb
er
20
16
the policy front, the IMF has recommended four set of policy tools: first is greater public investment in
education, and trading for lower-skilled workers through vocational training, second is strengthening of
social safety net (unemployment insurance, health benefits and portable pensions), third is boost economic
fairness and fourth is global cooperation.
Global macroeconomic indicators profile shows mixed real economic activity across major global
economies. The Eurozone growth estimate for the second quarter was 1.6%, marginally lower than 1.7% in
the preceding quarter, while improvement was registered in the US (1.2% against 1.1%), the UK (2.2% against
2.1%) and Japan (0.8% against 0.1%). However among BRICS, India and China continued to grow at 7.09%
and 6.7% respectively in the second quarter, while other BRICS economies - Russia, Brazil and South Africa
were struggling with contractionary pressures in their respective growth trajectories but with bottoming out
possibility in Russia and South Africa.
Table M7: Major Global Macroeconomic Indicators (%)
Source: Respective Country Official Data Source, IMF, World Bank, OECD, M-END: Month End
The global industrial production profile also posted the same mixed pattern with contraction in the US
(-0.6%), Eurozone (-0.5%), Japan (-4.2%), Russia (-0.3%) and Brazil (-6.6%), while moderation in China
(6.0%) and South Africa (3.0%). Only India and the UK among major global economies registered
acceleration in their respective industrial production growth at 2.4% and 2.1% in July'16. On inflation front,
advanced economies in general recorded moderation except the UK - where CPI inflation rose fractionally to
0.6% in the same month from 0.5% in the preceding month. Among BRICS economies, China and South
Africa registered marginal rise to 2.09% and 6.48% respectively, while India registered sharp increase to 6.07%
compared to 5.77% in the previous month. Brazilian and Russian CPI inflation moderated slightly to 8.74%
(8.84%) and 7.2% (against 7.5%).
GDP Growth Inflation IIP Growth 10-Y Sovereign Bond YieldEconomy
(Q2:2016) (July'16) (July'16) (M-END: Aug'16)
Eurozone 1.60 0.10 -0.50 -0.06
US 1.20 0.84 -0.60 1.57
UK 2.20 0.60 2.10 0.64
Japan 0.80 -0.50 -4.20 -0.07
China 6.70 2.09 6.00 2.81
India (FY17Q1) 7.09 6.07 2.40 7.10
Russia -0.60 7.20 -0.30 8.23
Brazil -3.80 8.74 -6.60 12.11
South Africa -0.20 6.48 3.00 9.05
Macro-Economic Overview
MArket Roundup
48

CC
ILM
on
thly
Ne
wsl
ett
er
Se
pte
mb
er
20
16
Chart M5: Markit's PMI (Composite): A Measure of Economic Activity
The global manufacturing and services operating conditions (represented by JPMC PMI-Composite)
improved marginally reflecting from its PMI reading at 51.4 in July'16 compared to 51.2 in the preceding
month largely due to improvement in manufacturing activity (51.0 against 50.4) in the same period. The
improvement was also registered in new orders and employment; however backlogs remained in the
contractionary mode. Among advanced economies, the US economy also registered improvement in
operating conditions as its PMI reading grew from 51.2 to 51.8 in the preceding month, while Eurozone
operating condition improved with marginal rise from 53.1 to 53.2 in the same period. Japanese operating
conditions reentered into expansionary mode visible from its PMI reading of 50.1 after four months since
March'16. However, the Brexit outcome affected the UK operating conditions negatively as its PMI reading
fell from 52.4 in June'16 to 47.7 in July'16 showing sharp deterioration, especially in service sector.
Among BRICS economies, Russian operating conditions remained robust with its PMI reading at 53.5 in
July'16 largely driven by solid improvement in the services sector despite marginal contraction in
manufacturing activity. India also registered a three-month highest growth in its operating conditions
reflecting from its PMI reading of 52.4 in the same month compared to 51.1 in the preceding month. The
robust improvement was primarily due to noticeable improvement in services sector activity. Chinese
operating conditions also registered a 22-month high of 51.9 in its PMI reading in the same month - mainly
due to return of manufacturing activity into growth territory after 17 months. However, South Africa and
Brazil were still struggling with deterioration in their respective operating condition despite some
improvements.
July 2016
51.4
0
51.8
0
53.2
0
47.7
0 50.1
0
51.9
0
52.4
0
53.5
0
46.4
0
49.9
0
20
30
40
50
60
Global
Economy
US Eurozone UK JAPAN China India Russia Brazil South
Africa
Dotted Line No Change in Economic Activity
Macro-Economic Overview
MArket Roundup
49

CC
ILM
on
thly
Ne
wsl
ett
er
Se
pte
mb
er
20
16
The Markit's sectoral activity survey signaled acceleration in its growth pace in July'16 across all major
subsectors - consumer goods, technology, healthcare and telecom services. However consumer services and
basic metal registered deterioration in their respective activity. In Europe, sectoral growth witnessed some
moderation in industrial production activity, consumer goods and consumer services, while healthcare and
basic metal registered serious deceleration in the same month. The Asian sectoral performance remained
stagnated. However, the US sector PMI displayed a broad-based rebound in its growth pace across all major
sub-sector and consumer goods was the best performing sector in their production activity.
The three prime segments of the money market witnessed short term rates hardening moderately by 3-6 bps
during August over the previous month. Despite comfortable liquidity condition of the banking system,
rates remained at an elevated level in the middle of the month, when it came close to the policy rate -
breaching it on couple of occasions. Weighted average rate in the Repo market advanced by 6 bps to 6.46% m-
o-m, while the Call segment observed rate increasing by 5 bps to 6.41%.
Trading volume across the segments clocked smart revival with trading in CBLO soaring by 14% over July
volume. Repo market too posted m-o-m growth of 10%, followed by the Call (6%). Average trading in Repo
stood near 50,000 crore in the latter half of the month (touching an all-time high of 94,887 crore on
August 19), whereas, average CBLO volume was over 1 lakh crore during the same period.
The tables give the comparative weighted average rates over a period of time and the comparative statistics of
volume and rates across the various sub-groups of the money market.
Money Market Review
` `
`
Table M8: Comparative Weighted Average Money Market Rates (%)
Table M9: Comparative Money Market Volumes and Rates
Aug-16 Jul-16 3 Months ago 6 Months ago Year ago
CALL 6.41 6.36 6.44 6.77 7.08
REPO 6.46 6.40 6.46 6.83 7.20
CBLO 6.33 6.30 6.43 6.74 7.16
Gross Daily Average Std Minimum Maximum Market Share
Volumes(` Cr)
Volumes(` Cr)
DevRate(%)
Rate(%)
(%)
Aug-16 Jul-16 Aug-16 Jul-16 Aug-16 Jul-16 Aug-16 Jul-16 Aug-16 Jul-16 Aug-16 Jul-16
CALL 358,680.00 338,048.00 17,080.00 16,902.40 0.03 0.07 6.36 6.22 6.48 6.46 10.62 11.19
REPO 1,079,758.33 985,112.64 51,417.06 49,255.63 0.04 0.10 6.40 6.16 6.54 6.56 31.97 32.61
CBLO 1,938,951.45 1,697,821.50 92,331.02 84,891.08 0.39 0.25 4.79 5.62 6.60 6.52 57.41 56.20
Macro-Economic Overview
MArket Roundup
50
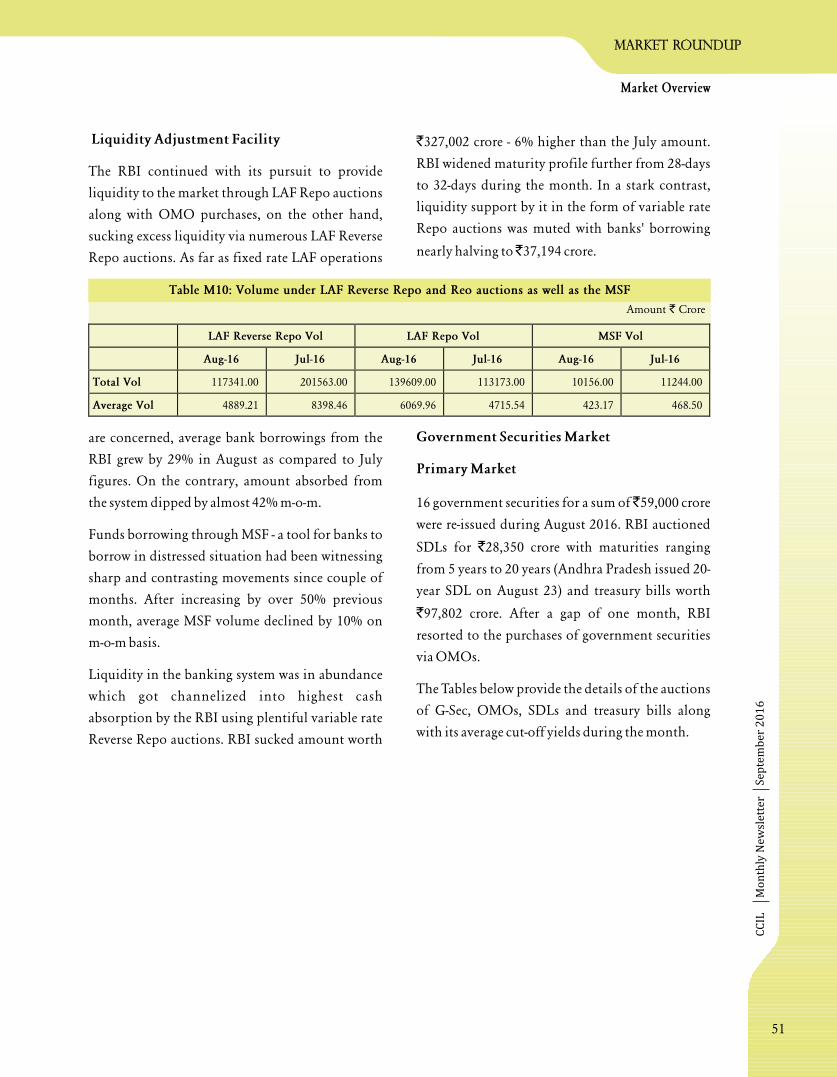
CC
ILM
on
thly
Ne
wsl
ett
er
Se
pte
mb
er
20
16
Liquidity Adjustment Facility
Government Securities Market
Primary Market
The RBI continued with its pursuit to provide
liquidity to the market through LAF Repo auctions
along with OMO purchases, on the other hand,
sucking excess liquidity via numerous LAF Reverse
Repo auctions. As far as fixed rate LAF operations
are concerned, average bank borrowings from the
RBI grew by 29% in August as compared to July
figures. On the contrary, amount absorbed from
the system dipped by almost 42% m-o-m.
Funds borrowing through MSF - a tool for banks to
borrow in distressed situation had been witnessing
sharp and contrasting movements since couple of
months. After increasing by over 50% previous
month, average MSF volume declined by 10% on
m-o-m basis.
Liquidity in the banking system was in abundance
which got channelized into highest cash
absorption by the RBI using plentiful variable rate
Reverse Repo auctions. RBI sucked amount worth
327,002 crore - 6% higher than the July amount.
RBI widened maturity profile further from 28-days
to 32-days during the month. In a stark contrast,
liquidity support by it in the form of variable rate
Repo auctions was muted with banks' borrowing
nearly halving to 37,194 crore.
16 government securities for a sum of 59,000 crore
were re-issued during August 2016. RBI auctioned
SDLs for 28,350 crore with maturities ranging
from 5 years to 20 years (Andhra Pradesh issued 20-
year SDL on August 23) and treasury bills worth
97,802 crore. After a gap of one month, RBI
resorted to the purchases of government securities
via OMOs.
The Tables below provide the details of the auctions
of G-Sec, OMOs, SDLs and treasury bills along
with its average cut-off yields during the month.
`
`
`
`
`
Table M10: Volume under LAF Reverse Repo and Reo auctions as well as the MSF
Amount Crore`
LAF Reverse Repo Vol LAF Repo Vol MSF Vol
Aug-16 Jul-16 Aug-16 Jul-16 Aug-16 Jul-16
Total Vol 117341.00 201563.00 139609.00 113173.00 10156.00 11244.00
Average Vol 4889.21 8398.46 6069.96 4715.54 423.17 468.50
MArket Roundup
Market Overview
51

CC
ILM
on
thly
Ne
wsl
ett
er
Se
pte
mb
er
20
16
Table M :11 Details of the Auctions of the G-Secs
Date of Issue/Auction
SecurityAmount(` Crore)
Cut-off Price(`)
Yield(%)
Devolvement onPDs (` Crore)
ACU CommissionCut-off rate
(paise per `100)
05-Aug-16 7.35% G.S. 2024 3,000.00 101.04 7.1727 0.00 0.07
05-Aug-16 7.61% G.S. 2030 8,000.00 103.47 7.2062 0.00 0.11
05-Aug-16 7.73% G.S. 2034 2,000.00 103.77 7.3512 0.00 0.27
05-Aug-16 8.13% G.S. 2045 2,000.00 109.12 7.3623 0.00 0.47
12-Aug-16 7.68% G.S. 2023 3,000.00 103.30 7.0923 0.00 0.06
12-Aug-16 7.59% G.S. 2026 8,000.00 103.33 7.0971 0.00 0.09
12-Aug-16 7.50% G.S. 2034 2,000.00 103.04 7.1958 0.00 0.23
12-Aug-16 8.17% G.S. 2044 2,000.00 111.00 7.2485 0.00 0.33
19-Aug-16 7.80% G.S. 2021 3,000.00 102.85 7.0649 0.00 0.07
19-Aug-16 7.59% G.S. 2029 8,000.00 102.97 7.2255 0.00 0.11
19-Aug-16 7.73% G.S. 2034 2,000.00 104.90 7.2413 0.00 0.33
19-Aug-16 8.13% G.S. 2045 2,000.00 110.01 7.2927 0.00 0.43
26-Aug-16 7.68% G.S. 2023 2,000.00 103.22 7.1039 0.00 0.06
26-Aug-16 7.59% G.S. 2026 8,000.00 103.11 7.1273 0.00 0.11
26-Aug-16 7.50% G.S. 2034 2,000.00 102.58 7.2403 0.00 0.33
26-Aug-16 7.72% G.S. 2055 2,000.00 106.10 7.2477 0.00 0.54
Table M12: Details of OMO Purchase
Date of Repurchase SecurityAmount Accepted
(` Crore)Cut-off Price
(`)Cut-off Yield
(%)
11-Aug-16 8.12% G.S. 2020 2,368.00 103.99 7.0304
11-Aug-16 8.83% G.S. 2023 1,520.00 109.24 7.1760
11-Aug-16 8.33% G.S. 2026 3,025.00 107.12 7.3061
11-Aug-16 7.95% G.S. 2032 2,115.00 106.32 7.2755
11-Aug-16 8.33% G.S. 2036 972.00 110.54 7.3130
Macro-Economic Overview
MArket Roundup
52

CC
ILM
on
thly
Ne
wsl
ett
er
Se
pte
mb
er
20
16
Table M13: Details of SDL Auctions/Issue
* Implicit yield for SDL reissued
Date of Issue/Auction
SecurityAmount(` Crore)
Cut-off Price(`)
Yield(%)
Under-subscription
08-Aug-16 7.50% Odisha SDL 2021 500.00 - 7.50 0.00
08-Aug-16 7.52% Punjab SDL 2021 800.00 - 7.52 0.00
08-Aug-16 7.58% Rajasthan SDL 2026 500.00 - 7.58 0.00
08-Aug-16 7.60% Gujarat SDL 2026 1,300.00 - 7.60 0.00
08-Aug-16 7.61% Kerala SDL 2026 1,500.00 - 7.61 0.00
08-Aug-16 7.62% Madhya Pradesh SDL 2026 1,500.00 - 7.62 0.00
08-Aug-16 7.62% Tamil Nadu SDL 2026 1,875.00 - 7.62 0.00
08-Aug-16 7.62% Telangana SDL 2026 1,500.00 - 7.62 0.00
08-Aug-16 7.63% Andhra Pradesh SDL 2026 1,000.00 - 7.63 0.00
08-Aug-16 7.63% Uttar Pradesh SDL 2026 2,000.00 - 7.63 0.00
08-Aug-16 7.63% West Bengal SDL 2026 1,000.00 - 7.63 0.00
08-Aug-16 7.69% Manipur SDL 2026 100.00 - 7.69 0.00
23-Aug-16 7.49% Punjab SDL 2021 400.00 - 7.49 0.00
23-Aug-16 7.56% Gujarat SDL 2026 1,300.00 - 7.56 0.00
23-Aug-16 7.57% Goa SDL 2026 70.00 - 7.57 0.00
23-Aug-16 7.57% Haryana SDL 2026 1,000.00 - 7.57 0.00
23-Aug-16 7.57% Jammu & Kashmir SDL 2026 400.00 - 7.57 0.00
23-Aug-16 7.57% Madhya Pradesh SDL 2026 1,000.00 - 7.57 0.00
23-Aug-16 7.57% Manipur SDL 2026 100.00 - 7.57 0.00
23-Aug-16 7.57% Nagaland SDL 2026 75.00 - 7.57 0.00
23-Aug-16 7.57% Odisha SDL 2026 500.00 - 7.57 0.00
23-Aug-16 7.57% Rajasthan SDL 2026 500.00 - 7.57 0.00
23-Aug-16 7.57% Tripura SDL 2026 230.00 - 7.57 0.00
23-Aug-16 7.58% Maharashtra SDL 2026 2,500.00 - 7.58 0.00
23-Aug-16 7.58% Tamil Nadu SDL 2026 1,500.00 - 7.58 0.00
23-Aug-16 7.58% Uttar Pradesh SDL 2026 2,000.00 - 7.58 0.00
23-Aug-16 7.58% West Bengal SDL 2026 500.00 - 7.58 0.00
23-Aug-16 7.59% Kerala SDL 2026 2,300.00 - 7.59 0.00
23-Aug-16 7.62% Andhra Pradesh SDL 2036 400.00 - 7.62 0.00
MArket Roundup
Market Overview
53

CC
ILM
on
thly
Ne
wsl
ett
er
Se
pte
mb
er
20
16
Secondary Market
Yield Movement
Despite clocking m-o-m decline of 9% and 5%
respectively, number of trade and volume in the
outright market were quite impressive. In absolute
terms, total number of trades stood at 154,964 in
August as against 170,404 in July. Amount traded in
the market was 1,974,956 crore vis-à-vis 2,079,649
crore during the previous month. Ample liquidity in
the banking system along with lower credit off-take led
banks turn to this market for investment.
Like trading, even average volume settled by CCIL
decreased marginally by 12% to 93,483 crore as
compared to 105,725 crore in July 2016.
10-year benchmark yield which began to ease since
February 2016 continued with its southward journey
during August as well, coming closer to its lowest level
of September 2009. Profit booking by bond traders saw
yields hardening by 7 bps to 7.20% at the beginning of
the month before it fell to the month's lowest of 7.08%
by August 11, 2016. The system is awash with liquidity
and at a time when credit growth is still sub-10%, banks
are finding it comfortable to invest in bonds to earn a
percentage point more than what they would have
earned if they just parked their money with the central
bank. The easy money stance adopted by the global
regulators and the decision to postpone interest rate
hike by the US Federal Reserve is luring foreign
investors to emerging markets assets giving higher
return.
Bond rally was halted with surging inflation that
weakened the outlook for interest-rate cuts. Urjit Patel's
selection as the next governor of the Reserve Bank of
India prompted market participants to tone down their
bets on lower interest rates. Dr. Patel, who engineered
the monetary policy framework with an explicit
inflation target, is being perceived as biased towards
higher interest rates to keep a tight check on inflation.
By August 23, average yields had reached 7.16% before
stabilizing around 7.13% at the end of the month.
Measures announced by the RBI to improve the
corporate bonds market by enhancing liquidity and
bolster demand for government securities added
positivity in the market.
The yields of different tenors on the last working day of
the month and the spread analysis of various tenors
over a period of time are illustrated in the tables below.
` `
`
`
Table M15: Average T-Bills Cut-Off Yields (%)
Table M14: Details of T-Bills Auctions
91 day T-Bill 182 day T-Bill 364 day T-BillDate Amt
(` Cr)Price(`)
YTM(%)
Amt(` Cr)
Price(`)
YTM(%)
Amt(` Cr)
Price(`)
YTM(%)
03-Aug-16 16370 98.39 6.5634 - - - 6000 93.75 6.6850
10-Aug-16 12000 98.39 6.5634 7000 96.79 6.6511 - - -
16-Aug-16 8300 98.39 6.5634 - - - 6000 93.76 6.6736
24-Aug-16 15101 98.39 6.5634 6000 96.78 6.6725 - - -
31-Aug-16 15030 98.39 6.5634 - 0.00 0.0000 6000 93.76 6.6736
Total 66801 13000 18000
Aug-16 Jul-16 3 Months ago 6 Months ago Year ago
91-day T-Bill 6.5634 6.5738 6.8536 7.3521 7.3937
182-day T-Bill 6.6618 6.7047 6.9406 7.2738 7.5002
364-day T-Bill 6.6774 6.7764 6.9538 7.2758 7.5592
Macro-Economic Overview
MArket Roundup
54

CC
ILM
on
thly
Ne
wsl
ett
er
Se
pte
mb
er
20
16
Foreign Exchange Market
The movement of rupee against all the major
international currencies can be regarded as
somewhat stable during August - it appreciated
marginally against GBP and Japanese Yen while
weakening moderately against the Euro and the
USD. The month began with the rupee depreciating
by 20 paise to 66.94 per dollar by August 04,
probably on account of RBI intervention to mop up
the inflow of dollars in the domestic markets by
FIIs. However, interest rate cut and bond purchases
by the Bank of England in an attempt to stimulate
the economy along with the rising optimism about
policy reforms in the country back home after the
Rajya Sabha approval for bringing in the Goods and
Services Act brought cheers to the market.
Assurance from the RBI Governor to provide ample
liquidity through OMOs and spot interventions or
deliveries of forward purchases in the wake of the
expected pressure in FCNR (B) redemptions pushed
Indian currency higher to 66.74 on August 10.
The period of rupee appreciation was cut short as
expectations of hike in Fed fund rate this year griped
the market sentiments yet again with fading
anticipation of repo rate cut in the near future by
the RBI following sharp increase in inflation.
Dollar strengthened globally after the release of
positive housing data in the US showing new
residential sales data for July bettering estimates
leading to weakness in rupee - touching 67/dollar
mark by the third week of the month. It ended the
month on a positive note tracking improvement in
the Stock market amid speculation payment of past
dues to government staff will stoke sales of cars and
appliances.
The tables depicted below give the analysis of the
rupee movement and the exchange rate prevailing
on the last working day of the month over a period
of time.
`
`
Table M16: Yield Movements (%)*
* on the last working day of the month
Table M17: Spread Analysis
Tenor Aug-16 Jul-16 3 Months ago 6 Months ago Year ago
O/N 6.5400 6.5900 6.5400 6.9600 7.1800
3 month 6.5471 6.5381 6.8141 7.2074 7.3977
6 month 6.6089 6.6754 6.9148 7.3099 7.4612
1 year 6.7122 6.8186 6.9855 7.2974 7.4820
2 year 6.8533 6.8727 7.1333 7.4081 7.7335
5 year 7.0551 7.0967 7.4922 7.7839 7.9392
10 year 7.1274 7.1747 7.4682 7.6589 7.7788
G-Sec Spread (bps)Period
Aug-16 Jul-16 3 Months 6 Months 1 Year
1 - 5 Years 34 28 51 49 46
1 - 10 Years 45 48 62 60 43
5 - 10 Years 11 20 11 12 -3
10 - 30 Years 9 9 24 37 8
MArket Roundup
Market Overview
55

CC
ILM
on
thly
Ne
wsl
ett
er
Se
pte
mb
er
20
16
FIIs trimmed their purchases of Indian assets during
August as comments from US Federal Reserve Vice-
Chairman and later by US Federal Reserve Chair
Janet Yellen strengthened expectations of an increase
in interest rates in the country in the coming
months. Net buying of Indian equities by FIIs was at
$1.36 billion vis-à-vis $1.88 billion in July - a decline
of 28%. They resumed selling of debt instruments to
take net sell off for the month at $0.39 billion
against the net purchase of $1.02 billion. In the
calendar year 2016, out of 8 months 5 months have
witnessed net selling of debt by them. Taking both
the markets into consideration, net buying of assets
by FIIs plunged by $1.93 billion to $0.96 billion - a
m-o-m decline of 67%.
Table M20: Movement of Forward Premia over a Period of Time (Monthly Average) (Percent)
Table M19: Exchange Rate Movement
Table M18: Exchange Rate Movement
The subsequent table displays the movement of 1-month, 3-month and 6-month forward premia over a
period of time which remained showed contrary movement as compared to previous month.
Exchange Rate Aug-16 Jul-16 3 Months ago 6 Months ago Year ago
` / Euro 74.62 74.27 74.79 75.08 74.50
` / Pound 87.69 88.30 98.65 95.20 102.31
` / 100 yen 64.89 64.69 60.40 60.78 54.75
` / Dollar 66.98 67.03 67.20 68.62 66.31
Aug-16 Jul-16 3 Months ago 6 Months ago Year ago
1-month 6.12 6.04 6.43 6.53 6.76
3-month 6.16 6.13 6.44 6.71 6.80
6-month 5.93 6.00 6.39 6.55 6.80
` / Euro ` / Pound ` / 100 yen ` / Dollar
Movement (%) -0.14 0.85 0.29 -0.36
Average Rate 75.00 87.80 66.06 66.94
Stdev 0.62 0.76 0.68 0.15
Max 76.04 89.07 67.03 67.19
Min 74.06 86.34 64.89 66.74
Macro-Economic Overview
MArket Roundup
56

CC
ILM
on
thly
Ne
wsl
ett
er
Se
pte
mb
er
20
16
Active RBI intervention in the foreign exchange
market to cap appreciation of the rupee in the wake
of strong capital inflows in the equity market and
to provide buffer for the September FCNR (B)
redemptions led to the accumulation of foreign
exchange reserves to swell by $2.27 billion at the
end of September 02 from $365.50 billion at the
end of July. Till week ended August 19,
accumulation of reserves had touched an all-time
high of $367.17 billion before declining marginally
to $366.78 billion in the following week.
Nevertheless, reserves touched a new peak of
$367.77 billion during the week ended September
02 - only on the back of healthy rise in foreign
currency assets throughout the period.
CHART M7: FOREIGN EXCHANGE RESERVES
Table M21: Movement of FII Flows Amount in USD Million
Quarter Net Investment in Equity Net Investment in Debt Total
2008-09 -11826.40 470.10 -11356.30
2009-10 22780.66 7470.89 30251.55
2010-11 24294.73 7931.30 32226.03
2011-12 9011.66 8451.76 17463.42
2012-13 25832.61 5214.43 31047.04
2013-14 13441.79 -4565.98 8875.81
2014-15 18372.41 27334.75 45707.16
2015-16 -2008.42 -514.45 -2522.87
Q1 2016-17 2202.40 -611.35 1591.05
Jul-16 1877.52 1019.68 2897.20
Aug-16 1356.80 -392.70 964.10
225,000
240,000
255,000
270,000
285,000
300,000
315,000
330,000
345,000
360,000
Jul-1
1
Jan-
12
Jul-1
2
Jan-1
3
Jul-1
3
Jan-1
4
Jul-1
4
Jan-
15
Jul-1
5
Jan-
16
Jul-1
6
USD
Mil
lion
-15,000
-10,000
-5,000
0
5,000
10,000
15,000U
SDM
illi
on
Change in Reserves Foreign Exchnage
MArket Roundup
Market Overview
57

CC
ILM
on
thly
Ne
wsl
ett
er
Se
pte
mb
er
20
16
Table M22: Trends in Scheduled Commercial Banks' Business ( Cr.)`
Table M23: Key Banking Rates and Ratios (%)
Banking Sector
The growth rate of non-food credit of banks
extended its decline to 9.27% (y-o-y) in the
fortnight ended August 19. Outstanding non-food
credit in the banking system stood at 71.72 lakh
crore as compared to 65.64 lakh crore in the same
fortnight last year. The rate of growth in deposits
mirrored the non-food credit movement and
depleted to a y-o-y growth of mere 8.56% to 97.26
lakh crore. RBI's report on the “Deployment of
Gross Bank Credit by Major Sectors” shows that the
share of housing in total non-food credit is on the
rise and has a share of 12% at the end of July 2016
and the second highest contributor. Banks are
disbursing more home loans in the absence of
demand from the corporate sector.
`
`
`
Aug-16 Jul-16 3 Months ago 6 Months ago Year ago
Money Stock 12110260 12043490 11901380 11580770 10999870
Aggregate Deposits 9726260 9674050 9542990 9351250 8959700
Non-food Credit 7172090 7163160 7142330 7064960 6563570
Investment in G-Secs 2821280 2804490 2711450 2715330 2681650
Aug-16 Jul-16
Credit-Deposit Ratio 74.80 75.13
Investment-Deposit Ratio 29.03 29.02
Base Rate 9.30 - 9.70 9.30 - 9.70
Term Deposit Rate >1 Year 7.00 - 7.50 7.00 - 7.50
Savings Deposit Rate 4.00 4.00
Macro-Economic Overview
MArket Roundup
58
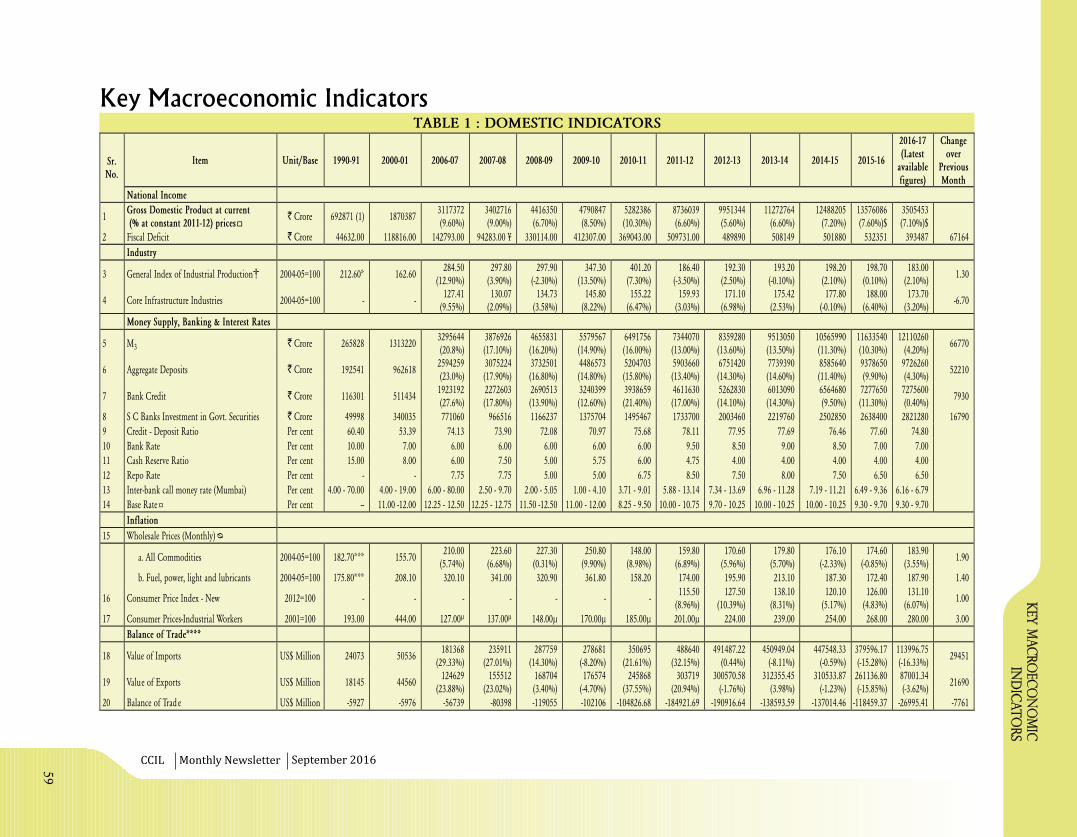
CCIL Monthly Newsletter
Key
Mac
ro
ec
on
om
ic
Ind
icato
rs
September 2016
Key Macroeconomic IndicatorsTABLE 1 : DOMESTIC INDICATORS
¤
ø
†
Item Unit/Base 1990-91 2000-01 2006-07 2007-08 2008-09 2009-10 2010-11 2011-12 2012-13 2013-14 2014-15 2015-16
2016-17(Latest
availablefigures)
Changeover
PreviousMonth
Sr.No.
National Income
1Gross Domestic Product at current(% at constant 2011-12) prices
` Crore 692871 (1) 18703873117372(9.60%)
3402716(9.00%)
4416350(6.70%)
4790847(8.50%)
5282386(10.30%)
8736039(6.60%)
9951344(5.60%)
11272764(6.60%)
12488205(7.20%)
13576086(7.60%)$
3505453(7.10%)$
2 Fiscal Deficit ` Crore 44632.00 118816.00 142793.00 94283.00 ¥ 330114.00 412307.00 369043.00 509731.00 489890 508149 501880 532351 393487 67164
Industry
3 General Index of Industrial Production 2004-05=100 212.60* 162.60284.50
(12.90%)297.80
(3.90%)297.90
(-2.30%)347.30
(13.50%)401.20
(7.30%)186.40
(-3.50%)192.30
(2.50%)193.20
(-0.10%)198.20
(2.10%)198.70
(0.10%)183.00
(2.10%)1.30
4 Core Infrastructure Industries 2004-05=100 - -127.41
(9.55%)130.07
(2.09%)134.73
(3.58%)145.80
(8.22%)155.22
(6.47%)159.93
(3.03%)171.10
(6.98%)175.42
(2.53%)177.80
(-0.10%)188.00
(6.40%)173.70
(3.20%)-6.70
Money Supply, Banking & Interest Rates
5 M3 ` Crore 265828 13132203295644(20.8%)
3876926(17.10%)
4655831(16.20%)
5579567(14.90%)
6491756(16.00%)
7344070(13.00%)
8359280(13.60%)
9513050(13.50%)
10565990(11.30%)
11633540(10.30%)
12110260(4.20%)
66770
6 Aggregate Deposits ` Crore 192541 9626182594259(23.0%)
3075224(17.90%)
3732501(16.80%)
4486573(14.80%)
5204703(15.80%)
5903660(13.40%)
6751420(14.30%)
7739390(14.60%)
8585640(11.40%)
9378650(9.90%)
9726260(4.30%)
52210
7 Bank Credit ` Crore 116301 5114341923192(27.6%)
2272603(17.80%)
2690513(13.90%)
3240399(12.60%)
3938659(21.40%)
4611630(17.00%)
5262830(14.10%)
6013090(14.30%)
6564680(9.50%)
7277650(11.30%)
7275600(0.40%)
7930
8 S C Banks Investment in Govt. Securities ` Crore 49998 340035 771060 966516 1166237 1375704 1495467 1733700 2003460 2219760 2502850 2638400 2821280 16790
9 Credit - Deposit Ratio Per cent 60.40 53.39 74.13 73.90 72.08 70.97 75.68 78.11 77.95 77.69 76.46 77.60 74.80
10 Bank Rate Per cent 10.00 7.00 6.00 6.00 6.00 6.00 6.00 9.50 8.50 9.00 8.50 7.00 7.00
11 Cash Reserve Ratio Per cent 15.00 8.00 6.00 7.50 5.00 5.75 6.00 4.75 4.00 4.00 4.00 4.00 4.00
12 Repo Rate Per cent - - 7.75 7.75 5.00 5.00 6.75 8.50 7.50 8.00 7.50 6.50 6.50
13 Inter-bank call money rate (Mumbai) Per cent 4.00 - 70.00 4.00 - 19.00 6.00 - 80.00 2.50 - 9.70 2.00 - 5.05 1.00 - 4.10 3.71 - 9.01 5.88 - 13.14 7.34 - 13.69 6.96 - 11.28 7.19 - 11.21 6.49 - 9.36 6.16 - 6.79
14 Base Rate Per cent -- 11.00 -12.00 12.25 - 12.50 12.25 - 12.75 11.50 -12.50 11.00 - 12.00 8.25 - 9.50 10.00 - 10.75 9.70 - 10.25 10.00 - 10.25 10.00 - 10.25 9.30 - 9.70 9.30 - 9.70
Inflation
15 Wholesale Prices (Monthly)
a. All Commodities 2004-05=100 182.70*** 155.70210.00
(5.74%)223.60
(6.68%)227.30
(0.31%)250.80
(9.90%)148.00
(8.98%)159.80
(6.89%)170.60
(5.96%)179.80
(5.70%)176.10
(-2.33%)174.60
(-0.85%)183.90
(3.55%)1.90
b. Fuel, power, light and lubricants 2004-05=100 175.80*** 208.10 320.10 341.00 320.90 361.80 158.20 174.00 195.90 213.10 187.30 172.40 187.90 1.40
16 Consumer Price Index - New 2012=100 - - - - - - -115.50
(8.96%)127.50
(10.39%)138.10
(8.31%)120.10
(5.17%)126.00
(4.83%)131.10
(6.07%)1.00
17 Consumer Prices-Industrial Workers 2001=100 193.00 444.00 127.00µ 137.00µ 148.00µ 170.00µ 185.00µ 201.00µ 224.00 239.00 254.00 268.00 280.00 3.00
Balance of Trade****
18 Value of Imports US$ Million 24073 50536181368
(29.33%)235911
(27.01%)287759
(14.30%)278681
(-8.20%)350695
(21.61%)488640
(32.15%)491487.22
(0.44%)450949.04
(-8.11%)447548.33
(-0.59%)379596.17(-15.28%)
113996.75(-16.33%)
29451
19 Value of Exports US$ Million 18145 44560124629
(23.88%)155512
(23.02%)168704(3.40%)
176574(-4.70%)
245868(37.55%)
303719(20.94%)
300570.58(-1.76%)
312355.45(3.98%)
310533.87(-1.23%)
261136.80(-15.85%)
87001.34(-3.62%)
21690
20 Balance of Trade US$ Million -5927 -5976 -56739 -80398 -119055 -102106 -104826.68 -184921.69 -190916.64 -138593.59 -137014.46 -118459.37 -26995.41 -7761
59

CCIL Monthly Newsletter
Key
Mac
ro
ec
on
om
ic
Ind
icato
rs
September 2016
TABLE 1 : DOMESTIC INDICATORS
Source: RBI Annual Report, Bulletin, Weekly Statistics, SEBI & CCILNotes:Yearly figures are as on March-end* : Base: 1980-81=100*** : Base : 1981-82=100**: Figure as at March-end****: Figures are cumulative for the yearQ.E : Quick EstimateR.E : Revised EstimateA.E : Advance EstimateB.E.: Budget Estimate#Turnover Ratio=(Central Government Securities Volumes for 12 months/MarketCapitialisation during the month)*100
Percentage figures in brackets denote y-o-y growth^ Turnover Ratio as on August 31, 2016(1) At 1993-94 prices
¥: Excluding acquisition cost of RBI stake in SBI ( 35,531 crores)
$: GDP for FY2015-16. GVA at Basic Price for Jan-Mar (Q4) of 2015-16: 31,27,229 Crore(7.40%). GVA for Jan-Mar (Q4) of 2014-15: 28,81,832 Crore - (6.20%).
`
`
`
o: GDP data till 2008-09 are calculated taking 1999-00 prices as the base whereas, till 2010-11, GDP data are calculated at market price (at 2004-05 prices).¤: Base Rate relates to five major banks since July 1, 2010. Earlier figures relate toBenchmark Prime Lending Rate (BPLR).ø: Inflation data till 2009-10 are calculated taking 1993-94 as base†: IIP data till 2010 - 2011 are calculated taking 1993-94 as base
Sr.No.
Item Unit/Base 1990-91 2000-01 2006-07 2007-08 2008-09 2009-10 2010-11 2011-12 2012-13 2013-14 2014-15 2015-16
2016-17(Latest
availablefigures)
Changeover
PreviousMonth
Foreign Exchange Inflows/Outflows & Exchange Rate
21 Foreign Exchange Reserves****
a. Foreign Currency Assets US$ Million 2236.00 39554.00 191924.00 294649.00 241597.00 254685.00 282037.00 260068.70 259725.90 276406.00 316238.30 332146.70 342237.60 1193.90
b. Gold US$ Million 3496.00 2725.00 6784.00 9558.00 9746.00 17920.00 23790.00 27023.10 26292.30 20978.00 19837.00 19325.40 21642.70 1066.30
c. SDRs US$ Million 102.00 2.00 2.00 18.00 1.00 5006.00 4671.00 4469.30 4327.60 4458.20 4004.80 1488.00 1488.60 3.80
22 Net FII Investment US$ Million -- 399.00 6708.00 16039.80 -11356.30 30251.55 32226.03 17463.42 31047.06 8875.81 45707.16 -2522.87 5452.35 964.10
23 Cumulative Net Investment+ US$ Million -- 13416.00 51965.70 68005.40 56649.30 89332.60 121558.70 140481.70 171528.69 180404.50 226110.60 223588.60 229041.30 964.10
Central Government Borrowings (Dated Securities and 364 day T-bills)
24 Government Borrowings****
Gross ` Crore -- 115183 227687 188205 306550 459497 479482 600409 558000 563973 592000 585000 299000 59000.00
Net ` Crore -- 73787 146574 106895 230018 313010 323661 473952 467384 458374 443422 403107 192162 20906.74
25 Outstandings (Dated Securities) ` Crore 1181604 1434086 1706083 2033452 2349966 2782985 3244536 3697910 4162571 4566630 4758792 20906.74
26 CCIL Settlement Statistics****
a. Securities (F.V.) ` Crore 6134096 9547387 10348089 15056299 11078460 11013019 17396220 23410745 25891675 26977819 16580190 0.57%
b. Forex US$ Million -- -- 1776981 3133664 3758904 2988971 4191037 4642573 4830933 4743321 5297790 5489286 2639509 7.20%
c. CBLO (F.V.) ` Crore -- -- 4732271 8110828 8824784 15541378 12259745 11155428 12028040 17526192 16764597 17833529 8263294 12.99%
27 Gilts Turnover Ratio# Per cent -- -- 0.40 0.69 0.94 0.69 0.71 0.72 1.92 1.02 1.60^ 1.94^ 3.81^
60
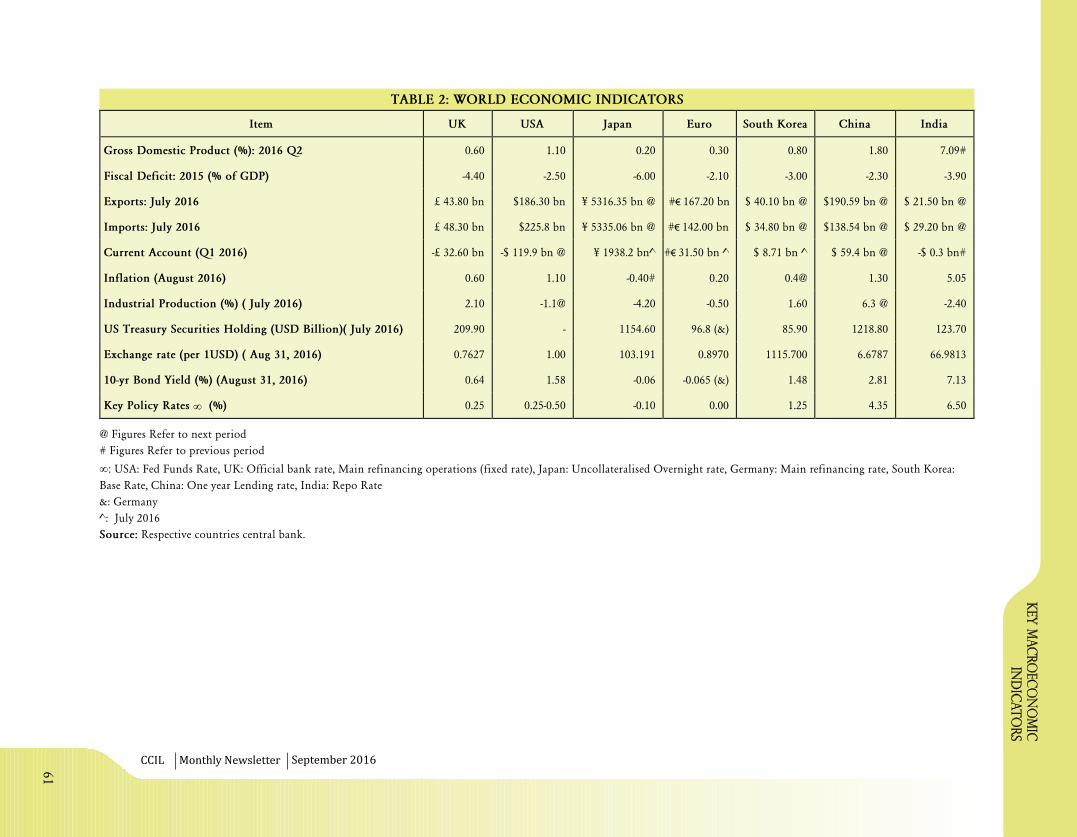
CCIL Monthly Newsletter
@ Figures Refer to next period
# Figures Refer to previous period
USA: Fed Funds Rate, UK: Official bank rate, Main refinancing operations (fixed rate), Japan: Uncollateralised Overnight rate, Germany: Main refinancing rate, South Korea:
Base Rate, China: One year Lending rate, India: Repo Rate
&: Germany
^:
Respective countries central bank.
¥:
July 2016
Source:
TABLE 2: WORLD ECONOMIC INDICATORS
¥
Key
Mac
ro
ec
on
om
ic
Ind
icato
rs
September 2016
Item UK USA Japan Euro South Korea China India
Gross Domestic Product (%): 2016 Q2 0.60 1.10 0.20 0.30 0.80 1.80 7.09#
Fiscal Deficit: 2015 (% of GDP) -4.40 -2.50 -6.00 -2.10 -3.00 -2.30 -3.90
Exports: July 2016 £ 43.80 bn $186.30 bn ¥ 5316.35 bn @ € 167.20 bn€ $ 40.10 bn @ $190.59 bn @ $ 21.50 bn @
Imports: July 2016 £ 48.30 bn $225.8 bn ¥ 5335.06 bn @ € 142.00 bn€ $ 34.80 bn @ $138.54 bn @ $ 29.20 bn @
Current Account (Q1 2016) -£ 32.60 bn -$ 119.9 bn @ ¥ 1938.2 bn^ € 31.50 bn ^€ $ 8.71 bn ^ $ 59.4 bn @ -$ 0.3 bn#
Inflation (August 2016) 0.60 1.10 -0.40# 0.20 0.4@ 1.30 5.05
Industrial Production (%) ( July 2016) 2.10 -1.1@ -4.20 -0.50 1.60 6.3 @ -2.40
US Treasury Securities Holding (USD Billion)( July 2016) 209.90 - 1154.60 96.8 (&) 85.90 1218.80 123.70
Exchange rate (per 1USD) ( Aug 31, 2016) 0.7627 1.00 103.191 0.8970 1115.700 6.6787 66.9813
10-yr Bond Yield (%) (August 31, 2016) 0.64 1.58 -0.06 -0.065 (&) 1.48 2.81 7.13
Key Policy Rates ∞ (%) 0.25 0.25-0.50 -0.10 0.00 1.25 4.35 6.50
61

ou
tsta
nd
ing
go
vern
men
t d
ebt
CCIL Monthly Newsletter September 2016
TABLE 3: OUTSTANDING GOVERNMENT DEBT
OUTSTANDING GOVERNMENT DEBT
Sr.No.
ISIN No. SecurityIssueDate
MaturityDate
Outstanding(` Crore)
MarketCapitali-zation
(` Crore)
Price(`)
Yield(%)
Yield (%)(PreviousMonth)
DurationMod
DurationV+ (for100bps)
V- (for100bps)
Convexity
PriceChangeDue to
ModifiedDurationfor 100bps
(%)
PriceChangeDue to
Convexityfor
100bps(%)
Expectedprice Changefor a 100bpsrise in yield
due toDuration and
ConvexityEffect(%)
ActualChange
for100pbsincreasein yield
PV01
Dated Securities
1 IN0020010107 8.07% 2017 15-Jan-02 15-Jan-17 66964.80 67244.65 100.42 6.86% 6.81% 0.3750 0.3626 101.0572 101.7988 0.2673 -0.3626 0.0013 -0.3612 -0.3643 0.0037
2 IN0020020031 7.49% 2017 16-Apr-02 16-Apr-17 58000.00 58227.71 100.39 6.82% 6.81% 0.6098 0.5897 102.5754 103.7923 0.6410 -0.5897 0.0032 -0.5865 -0.5865 0.0061
3 IN0020120021 8.07% 2017 3-Jul-12 3-Jul-17 50000.00 50495.00 100.99 6.82% 6.82% 0.8224 0.7953 101.4597 103.0863 1.0257 -0.7953 0.0051 -0.7901 -0.7902 0.0081
4 IN0020070010 7.99% 2017 9-Jul-07 9-Jul-17 71000.00 71673.74 100.95 6.82% 6.83% 0.8392 0.8116 101.2578 102.9147 1.0597 -0.8116 0.0053 -0.8063 -0.8063 0.0083
5 IN0020020098 7.46% 2017 28-Aug-02 28-Aug-17 57886.80 58245.82 100.62 6.80% 6.84% 0.9765 0.9444 99.7178 101.6192 1.3567 -0.9444 0.0068 -0.9376 -0.9377 0.0095
6 IN0020020163 6.25% 2018 2-Jan-03 2-Jan-18 16886.80 16782.10 99.38 6.73% 6.92% 1.2937 1.2516 99.1415 101.6545 2.2055 -1.2516 0.0110 -1.2406 -1.2406 0.0126
7 IN0020110014 7.83% G.S. 2018 11-Apr-11 11-Apr-18 73000.00 74080.33 101.48 6.84% 6.87% 1.5048 1.4550 102.9978 106.0392 2.9296 -1.4550 0.0146 -1.4404 -1.4405 0.0152
8 IN0020080019 8.24% GOVT. STOCK 2018 22-Apr-08 22-Apr-18 75000.00 76522.50 102.03 6.90% 6.89% 1.5304 1.4793 103.4228 106.5285 3.0168 -1.4793 0.0151 -1.4643 -1.4644 0.0155
9 IN0020010024 10.45% 2018 30-Apr-01 30-Apr-18 3716.00 3923.01 105.57 6.84% 6.90% 1.5276 1.4771 107.4595 110.6815 3.0309 -1.4771 0.0152 -1.4619 -1.4621 0.0161
10 IN0020030063 5.69% 2018 (conv) 25-Sep-03 25-Sep-18 16130.00 15787.00 97.87 6.81% 6.92% 1.9329 1.8693 98.4708 102.2219 4.5747 -1.8693 0.0229 -1.8464 -1.8466 0.0188
11 IN0019980286 12.60% 2018 (On Tap) 23-Nov-98 23-Nov-18 12631.88 14093.85 111.57 6.90% 6.96% 1.9697 1.9040 112.8073 117.1858 4.8520 -1.9040 0.0243 -1.8797 -1.8800 0.0219
12 IN0020030097 5.64% 2019 2-Jan-04 2-Jan-19 10000.00 9740.00 97.40 6.86% 6.98% 2.2033 2.1302 96.2424 100.4314 5.7434 -2.1302 0.0287 -2.1015 -2.1018 0.0209
13 IN0020080068 6.05% 2019 2-Feb-09 2-Feb-19 53000.00 52020.08 98.15 6.89% 6.96% 2.2781 2.2022 96.4795 100.8239 6.0997 -2.2022 0.0305 -2.1717 -2.1720 0.0217
14 IN0020130038 7.28% GS 2019 3-Jun-13 3-Jun-19 53000.00 53517.86 100.98 6.88% 6.90% 2.5085 2.4251 100.2827 105.2665 7.4300 -2.4251 0.0371 -2.3879 -2.3884 0.0249
15 IN0020030048 6.05% 2019 (conv) 12-Jun-03 12-Jun-19 11000.00 10753.60 97.76 6.94% 6.91% 2.5685 2.4823 96.6492 101.5687 7.6924 -2.4823 0.0385 -2.4439 -2.4443 0.0246
16 IN0020090042 6.90% 2019 13-Jul-09 13-Jul-19 45000.00 44976.06 99.95 6.92% 6.96% 2.6301 2.5422 98.3240 103.4525 8.0547 -2.5422 0.0403 -2.5019 -2.5024 0.0256
17 IN0020010065 10.03% 2019 9-Aug-01 9-Aug-19 6000.00 6482.22 108.04 6.96% 6.91% 2.6204 2.5323 105.9149 111.4173 8.0987 -2.5323 0.0405 -2.4918 -2.4923 0.0275
18 IN0020020171 6.35% 2020 2-Jan-03 2-Jan-20 61000.00 59941.41 98.26 6.94% 6.99% 3.0285 2.9270 96.4331 102.2468 10.5324 -2.9270 0.0527 -2.8743 -2.8751 0.0291
19 IN0020110071 8.19% G.S. 2020 16-Jan-12 16-Jan-20 74000.00 76653.12 103.59 7.20% 7.26% 2.9894 2.8856 101.6491 107.6880 10.3782 -2.8856 0.0519 -2.8337 -2.8344 0.0302
20 IN0020000025 10.70% 2020 22-Apr-00 22-Apr-20 6000.00 6708.08 111.80 6.97% 7.06% 3.0444 2.9418 112.2684 119.0722 11.1706 -2.9418 0.0559 -2.8860 -2.8868 0.0340
21 IN0020100015 7.80% G.S. 2020 3-May-10 3-May-20 75000.00 76940.40 102.59 6.98% 7.03% 3.1950 3.0872 101.9388 108.4313 11.9524 -3.0872 0.0598 -3.0274 -3.0283 0.0324
22 IN0020140029 8.27% G.S. 2020 9-Jun-14 9-Jun-20 73000.00 76136.01 104.30 6.95% 6.99% 3.2743 3.1643 102.8629 109.5832 12.5028 -3.1643 0.0625 -3.1018 -3.1028 0.0336
62

CCIL Monthly Newsletter
ou
tsta
nd
ing
go
vern
men
t d
ebt
September 2016
TABLE 3: OUTSTANDING GOVERNMENT DEBT (Contd.)
Sr.No.
ISIN No. SecurityIssueDate
MaturityDate
Outstanding(` Crore)
MarketCapitali-zation
(` Crore)
Price(`)
Yield(%)
Yield (%)(PreviousMonth)
DurationMod
DurationV+ (for100bps)
V- (for100bps)
Convexity
PriceChangeDue to
ModifiedDurationfor 100bps
(%)
PriceChangeDue to
Convexityfor
100bps(%)
Expectedprice Changefor a 100bpsrise in yield
due toDuration and
ConvexityEffect(%)
ActualChange
for100pbsincreasein yield
PV01
23 IN0020120054 8.12% Govt Stock 2020 10-Dec-12 10-Dec-20 76000.00 79068.73 104.04 7.01% 7.05% 3.6513 3.5277 102.1890 109.6593 15.4812 -3.5277 0.0774 -3.4503 -3.4516 0.0373
24 IN0020000124 11.60% 2020 27-Dec-00 27-Dec-20 5000.00 5842.47 116.85 7.01% 7.10% 3.5308 3.4112 114.9109 123.0243 14.8479 -3.4112 0.0742 -3.3370 -3.3382 0.0405
25 IN0020110022 7.80% G.S. 2021 11-Apr-11 11-Apr-21 66000.00 68011.68 103.05 7.01% 7.05% 3.8629 3.7321 102.1925 110.1123 17.4867 -3.7321 0.0874 -3.6446 -3.6462 0.0396
26 IN0020060318 7.94% G.S. 2021 24-May-06 24-May-21 49000.00 50857.91 103.79 6.98% 7.15% 3.9737 3.8397 101.9379 110.0746 18.3686 -3.8397 0.0918 -3.7479 -3.7495 0.0407
27 IN0020010040 10.25% 2021 30-May-01 30-May-21 26213.32 29503.25 112.55 7.09% 7.08% 3.8502 3.7185 110.9321 119.4967 17.5996 -3.7185 0.0880 -3.6305 -3.6320 0.0428
28 IN0020110030 8.79% G.S. 2021 8-Nov-11 8-Nov-21 83000.00 89131.63 107.39 7.06% 7.15% 4.2093 4.0657 105.7577 114.7167 20.8963 -4.0657 0.1045 -3.9612 -3.9633 0.0448
29 IN0020060037 8.20% Government Stock 2022 15-Feb-07 15-Feb-22 57632.33 60456.31 104.90 7.10% 7.16% 4.5205 4.3655 100.7686 109.9621 23.5033 -4.3655 0.1175 -4.2480 -4.2503 0.0459
30 IN0020020072 8.35% 2022 14-May-02 14-May-22 77000.00 81229.50 105.49 7.16% 7.24% 4.5818 4.4235 103.3067 112.8627 24.6790 -4.4235 0.1234 -4.3001 -4.3027 0.0477
31 IN0020120013 8.15% 2022 11-Jun-12 11-Jun-22 83000.00 86901.00 104.70 7.14% 7.17% 4.6742 4.5131 101.8155 111.4330 25.4954 -4.5131 0.1275 -4.3856 -4.3883 0.0480
32 IN0020070028 8.08% Government Stock 2022 2-Aug-07 2-Aug-22 68969.41 72226.28 104.72 7.09% 7.17% 4.8234 4.6583 100.5817 110.4029 26.8871 -4.6583 0.1344 -4.5239 -4.5267 0.0491
33 IN0020039031 5.87% 2022 (conv) 28-Aug-03 28-Aug-22 11000.00 10357.11 94.16 7.08% 7.15% 5.1059 4.9313 89.6782 98.9737 29.2522 -4.9313 0.1463 -4.7850 -4.7882 0.0464
34 IN0020070051 8.13% 2022 21-Sep-07 21-Sep-22 70495.28 73843.81 104.75 7.15% 7.18% 4.7705 4.6058 103.4942 113.4806 27.0786 -4.6058 0.1354 -4.4704 -4.4734 0.0499
35 IN0020030014 6.30% 2023 9-Apr-03 9-Apr-23 13000.00 12572.60 96.71 6.93% 7.17% 5.3494 5.1703 94.2129 104.4765 33.2514 -5.1703 0.1663 -5.0040 -5.0080 0.0513
36 IN0020130012 7.16% GOVT STOCK 2023 20-May-13 20-May-23 77000.00 77284.75 100.37 7.09% 7.14% 5.3509 5.1678 97.2360 107.8236 33.4344 -5.1678 0.1672 -5.0006 -5.0046 0.0529
37 IN0020030055 6.17% 2023 12-Jun-03 12-Jun-23 14000.00 13443.85 96.03 6.91% 7.07% 5.5418 5.3567 92.3163 102.7557 35.2708 -5.3567 0.1764 -5.1804 -5.1847 0.0521
38 IN0020130061 8.83% G.S. 223 25-Nov-13 25-Nov-23 83000.00 90844.16 109.45 7.13% 7.24% 5.4717 5.2833 106.0706 117.8921 35.8520 -5.2833 0.1793 -5.1040 -5.1085 0.0590
39 IN0020150010 7.68% GS 2023 27-Apr-15 15-Dec-23 88132.01 91084.79 103.35 7.08% 7.17% 5.6617 5.4681 99.4045 110.8922 37.7259 -5.4681 0.1886 -5.2795 -5.2843 0.0574
40 IN0020090034 7.35% 2024 22-Jun-09 22-Jun-24 83168.02 84360.73 101.43 7.11% 7.18% 6.0141 5.8078 97.0637 109.0190 42.5790 -5.8078 0.2129 -5.5949 -5.6007 0.0597
41 IN0020140045 8.40% GS 2024 28-Jul-14 28-Jul-24 90000.00 96651.81 107.39 7.16% 7.26% 5.9744 5.7680 102.1228 114.6099 42.3138 -5.7680 0.2116 -5.5564 -5.5622 0.0624
42 IN0020110048 9.15% G.S. 2024 14-Nov-11 14-Nov-24 92000.00 102948.00 111.90 7.20% 7.38% 5.9431 5.7366 108.2603 121.4216 43.0649 -5.7366 0.2153 -5.5212 -5.5272 0.0657
43 IN0020150036 7.72% GS 2025 25-May-15 25-May-25 86000.00 89257.16 103.79 7.13% 7.22% 6.4360 6.2146 99.5040 112.6727 49.8406 -6.2146 0.2492 -5.9654 -5.9728 0.0657
44 IN0020120047 8.20% G.S. 2025 24-Sep-12 24-Sep-25 90000.00 96176.97 106.86 7.16% 7.33% 6.4480 6.2253 103.8171 117.5818 51.2315 -6.2253 0.2562 -5.9691 -5.9769 0.0687
63

CCIL Monthly Newsletter
ou
tsta
nd
ing
go
vern
men
t d
ebt
September 2016
TABLE 3: OUTSTANDING GOVERNMENT DEBT (Contd.)
Sr.No.
ISIN No. SecurityIssueDate
MaturityDate
Outstanding(` Crore)
MarketCapitali-zation
(` Crore)
Price(`)
Yield(%)
Yield (%)(PreviousMonth)
DurationMod
DurationV+ (for100bps)
V- (for100bps)
Convexity
PriceChangeDue to
ModifiedDurationfor 100bps
(%)
PriceChangeDue to
Convexityfor
100bps(%)
Expectedprice Changefor a 100bpsrise in yield
due toDuration and
ConvexityEffect(%)
ActualChange
for100pbsincreasein yield
PV01
45 IN0020030071 5.97% 2025 25-Sep-03 25-Sep-25 16687.95 15387.67 92.21 7.15% 7.35% 6.8485 6.6121 88.7680 101.3181 55.7790 -6.6121 0.2789 -6.3332 -6.3418 0.0626
46 IN0020150093 7.59% GS 2026 11-Jan-16 11-Jan-26 95000.00 98128.64 103.29 7.10% 7.17% 6.8477 6.6129 97.7117 111.5282 56.2733 -6.6129 0.2814 -6.3316 -6.3404 0.0690
47 IN0020120039 8.33% G.S. 2026 9-Jul-12 9-Jul-26 90000.00 97380.00 108.20 7.15% 7.35% 6.9654 6.7249 102.3376 117.0701 59.1954 -6.7249 0.2960 -6.4289 -6.4386 0.0735
48 IN0020010081 10.18% 2026 11-Sep-01 11-Sep-26 15000.00 18231.64 121.54 7.14% 7.27% 6.6024 6.3749 118.6116 134.7408 55.8846 -6.3749 0.2794 -6.0955 -6.1047 0.0805
49 IN0020140060 8.15% G S 2026 24-Nov-14 24-Nov-26 86489.21 92451.00 106.89 7.18% 7.32% 7.1039 6.8575 101.9156 116.8971 62.3284 -6.8575 0.3116 -6.5459 -6.5564 0.0748
50 IN0020060078 8.24% Government Stock 2027 15-Feb-07 15-Feb-27 93388.55 100330.31 107.43 7.21% 7.36% 7.3099 7.0553 100.5118 115.7440 65.1980 -7.0553 0.3260 -6.7294 -6.7406 0.0760
51 IN0020070036 8.26% Government Stock 2027 2-Aug-07 2-Aug-27 73427.33 78656.02 107.12 7.30% 7.45% 7.4868 7.2231 100.3382 115.9325 69.0455 -7.2231 0.3452 -6.8779 -6.8902 0.0778
52 IN0020070069 8.28% 2027 21-Sep-07 21-Sep-27 89252.24 96465.34 108.08 7.21% 7.38% 7.3531 7.0973 104.1776 120.0661 68.5832 -7.0973 0.3429 -6.7544 -6.7668 0.0793
53 IN0020020247 6.01% 2028 7-Aug-03 25-Mar-28 15000.00 13923.72 92.82 6.92% 7.16% 8.1408 7.8685 88.2788 103.3236 81.4911 -7.8685 0.4075 -7.4611 -7.4766 0.0750
54 IN0020140011 8.60% GS 2028 2-Jun-14 2-Jun-28 84000.00 92985.98 110.70 7.23% 7.40% 7.6997 7.4310 104.8252 121.6215 75.0919 -7.4310 0.3755 -7.0556 -7.0697 0.0838
55 IN0020030022 6.13% 2028 4-Jun-03 4-Jun-28 11000.00 10362.99 94.21 6.85% 7.16% 8.3111 8.0357 88.3729 103.7801 84.2625 -8.0357 0.4213 -7.6144 -7.6307 0.0768
56 IN0020150069 7.59% GS 2029 19-Oct-15 20-Mar-29 80000.00 83042.48 103.80 7.13% 7.27% 8.1314 7.8517 99.1974 116.0643 84.7985 -7.8517 0.4240 -7.4277 -7.4448 0.0841
57 IN0020150028 7.88% GS 2030 11-May-15 19-Mar-30 89000.00 94787.40 106.50 7.12% 7.27% 8.4504 8.1598 101.5399 119.5397 93.2440 -8.1598 0.4662 -7.6936 -7.7135 0.0897
58 IN0020160019 7.61% GS 2030 9-May-16 9-May-30 40000.00 41878.24 104.70 7.07% 7.23% 8.6653 8.3696 98.5789 116.5416 96.8312 -8.3696 0.4842 -7.8854 -7.9063 0.0895
59 IN0020130053 9.20% GOVT. STOCK 2030 30-Sep-13 30-Sep-30 61884.55 72403.75 117.00 7.25% 7.46% 8.3543 8.0620 111.6281 131.1599 93.1143 -8.0620 0.4656 -7.5964 -7.6167 0.0974
60 IN0020110055 8.97% G.S. 2030 5-Dec-11 5-Dec-30 90000.00 103092.62 114.55 7.31% 7.43% 8.5650 8.2630 107.5635 126.8934 96.5495 -8.2630 0.4827 -7.7803 -7.8016 0.0963
61 IN0020060086 8.28% Government Stock 2032 15-Feb-07 15-Feb-32 90687.11 99093.81 109.27 7.27% 7.43% 9.2501 8.9256 100.4157 120.0416 111.9655 -8.9256 0.5598 -8.3658 -8.3924 0.0978
62 IN0020070044 8.32% Government Stock 2032 2-Aug-07 2-Aug-32 89434.05 97930.28 109.50 7.30% 7.40% 9.3568 9.0273 100.8098 120.7583 115.6510 -9.0273 0.5783 -8.4490 -8.4771 0.0994
63 IN0020020106 7.95% 2032 28-Aug-02 28-Aug-32 89000.00 94562.50 106.25 7.28% 7.36% 9.5220 9.1874 97.1289 116.7221 118.7895 -9.1874 0.5939 -8.5935 -8.6226 0.0976
64 IN0020070077 8.33% 2032 21-Sep-07 21-Sep-32 1522.48 1669.66 109.67 7.30% 7.47% 9.1463 8.8243 103.9571 124.0241 113.7634 -8.8243 0.5688 -8.2555 -8.2833 0.1000
65 IN0020140052 8.24% G.S 2033 10-Nov-14 10-Nov-33 87000.00 95313.02 109.56 7.26% 7.41% 9.6130 9.2764 102.3463 123.2122 126.0382 -9.2764 0.6302 -8.6462 -8.6789 0.1039
64

CCIL Monthly Newsletter
ou
tsta
nd
ing
go
vern
men
t d
ebt
September 2016
TABLE 3: OUTSTANDING GOVERNMENT DEBT (Contd.)
Sr.No.
ISIN No. SecurityIssueDate
MaturityDate
Outstanding(` Crore)
MarketCapitali-zation
(` Crore)
Price(`)
Yield(%)
Yield (%)(PreviousMonth)
DurationMod
DurationV+ (for100bps)
V- (for100bps)
Convexity
PriceChangeDue to
ModifiedDurationfor 100bps
(%)
PriceChangeDue to
Convexityfor
100bps(%)
Expectedprice Changefor a 100bpsrise in yield
due toDuration and
ConvexityEffect(%)
ActualChange
for100pbsincreasein yield
PV01
66 IN0020040039 7.50% 2034 10-Aug-04 10-Aug-34 80000.00 82357.20 102.95 7.20% 7.32% 10.2173 9.8621 93.8539 114.3196 140.0123 -9.8621 0.7001 -9.1620 -9.1998 0.1019
67 IN0020150051 7.73% GS 2034 12-Oct-15 19-Dec-34 40000.00 42176.80 105.44 7.19% 7.35% 10.1572 9.8048 97.1901 118.2482 140.7150 -9.8048 0.7036 -9.1012 -9.1397 0.1048
68 IN0020050012 7.40% 2035 9-Sep-05 9-Sep-35 52000.00 53057.52 102.03 7.20% 7.30% 10.2309 9.8753 95.8548 116.7890 146.5122 -9.8753 0.7326 -9.1427 -9.1842 0.1042
69 IN0020060045 8.33% 2036 7-Jun-06 7-Jun-36 86000.00 95589.00 111.15 7.26% 7.46% 10.3246 9.9631 102.6010 125.2293 149.4014 -9.9631 0.7470 -9.2161 -9.2593 0.1126
70 IN0020080050 6.83% G.S. 2039 19-Jan-09 19-Jan-39 13000.00 12691.98 97.63 7.04% 7.28% 11.5603 11.1672 88.2852 110.3847 188.2990 -11.1672 0.9415 -10.2257 -10.2869 0.1098
71 IN0020100031 8.30% G.S. 2040 2-Jul-10 2-Jul-40 90000.00 100412.55 111.57 7.27% 7.44% 11.2440 10.8497 101.6291 126.2685 184.5963 -10.8497 0.9230 -9.9267 -9.9884 0.1224
72 IN0020110063 8.83% G.S. 2041 12-Dec-11 12-Dec-41 90000.00 106020.00 117.80 7.28% 7.44% 11.3262 10.9285 107.6964 134.0213 191.4045 -10.9285 0.9570 -9.9715 -10.0380 0.1307
73 IN0020120062 8.30% GOVT STOCK 2042 31-Dec-12 31-Dec-42 90000.00 100881.00 112.09 7.26% 7.44% 11.6714 11.2625 101.7679 127.4945 204.0769 -11.2625 1.0204 -10.2421 -10.3156 0.1277
74 IN0020130079 9.23% Govt Stock 2043 23-Dec-13 23-Dec-43 79472.28 97817.10 123.08 7.27% 7.44% 11.5991 11.1922 112.0153 140.1382 204.4260 -11.1922 1.0221 -10.1701 -10.2450 0.1396
75 IN0020140078 8.17% G.S. 2044 1-Dec-14 1-Dec-44 84000.00 93008.16 110.72 7.27% 7.40% 11.9107 11.4930 100.9198 127.0216 217.6442 -11.4930 1.0882 -10.4048 -10.4875 0.1295
76 IN0020150044 8.13% G.S. 2045 22-Jun-15 22-Jun-45 69000.00 76289.71 110.56 7.25% 7.38% 12.0625 11.6405 100.2064 126.4977 223.3011 -11.6405 1.1165 -10.5240 -10.6102 0.1304
77 IN0020150077 7.72% GS 2055 26-Oct-15 26-Oct-55 19000.00 20216.00 106.40 7.23% 7.36% 13.0249 12.5707 96.7552 124.4704 284.9257 -12.5707 1.4246 -11.1461 -11.2819 0.1369
4538072.41 4821593.12 6.4259
65

CCIL Monthly Newsletter
ou
tsta
nd
ing
go
vern
men
t d
ebt
September 2016
TABLE 3: OUTSTANDING GOVERNMENT DEBT (Contd.)
Special Securities
Sr.No.
ISIN No. SecurityIssueDate
MaturityDate
Outstanding(` Crore)
MarketCapitali-zation
(` Crore)
Price(`)
Yield(%)
Yield(%)
(PreviousMonth)
DurationMod
DurationV+ (for100bps)
V- (for100bps)
Convexity
PriceChangeDue to
ModifiedDurationfor 100bps
(%)
PriceChangeDue to
Convexityfor
100bps(%)
Expectedprice Changefor a 100bpsrise in yield
due toDuration and
ConvexityEffect(%)
ActualChange
for100pbsincreasein yield
PV01
1 IN0020009018 11.50% GOI (IIBI) Spl Securities 2021 30-Mar-01 30-Mar-21 100.00 116.08 116.08 7.30% 7.42% 3.6135 3.4861 116.7568 125.1880 15.8992 -3.4861 0.0795 -3.4066 -3.4080 0.0421
2 IN00201090168.01% Postal Life Insurance Government of IndiaSpecial Security 2021
31-Mar-11 31-Mar-21 4000.00 4106.15 102.65 7.32% 7.43% 3.8130 3.6785 102.1813 109.9822 17.0893 -3.6785 0.0854 -3.5930 -3.5945 0.0390
3 IN00200600948.13% Oil Marketing Companies Government ofIndia Special Bonds, 2021
16-Oct-06 16-Oct-21 5000.00 5164.85 103.30 7.34% 7.46% 4.1892 4.0409 102.1342 110.7312 20.6125 -4.0409 0.1031 -3.9378 -3.9398 0.0430
4 IN0020019017 9.75% GOI (IFCI) SPL SEC 2021 30-Oct-01 30-Oct-21 400.00 440.75 110.19 7.34% 7.46% 4.1146 3.9690 109.0474 118.0564 20.1722 -3.9690 0.1009 -3.8681 -3.8700 0.0450
5 IN00200601287.75% Oil Marketing Companies Government ofIndia Special Bonds, 2021
28-Nov-06 28-Nov-21 5000.00 5085.41 101.71 7.35% 7.47% 4.3348 4.1812 99.4641 108.1393 21.7871 -4.1812 0.1089 -4.0723 -4.0744 0.0433
6 IN0020119015 PLI GoISpl. Floating Rate Bonds 2022 30-Mar-12 30-Mar-22 7000.00 6983.92 99.77 - - - - - - - - - - - -
7 IN0020060110 8.15% Government of India FCI Special Bonds, 2022 16-Oct-06 16-Oct-22 5000.00 5185.97 103.72 7.38% 7.51% 4.8292 4.6573 101.9252 111.8753 27.5927 -4.6573 0.1380 -4.5194 -4.5224 0.0497
8 IN0020089028 7% FERT COS GOI SPL BOND 2022 10-Dec-08 10-Dec-22 6071.51 5951.98 98.03 7.39% 7.52% 5.0954 4.9137 94.8394 104.6330 29.9733 -4.9137 0.1499 -4.7639 -4.7672 0.0489
9 IN00200890446.20% Fertilizer Companies’ Government of IndiaSpecial Bonds, 2022
24-Dec-08 24-Dec-22 491.41 462.07 94.03 7.40% 7.52% 5.2239 5.0376 90.5174 100.1124 31.0961 -5.0376 0.1555 -4.8821 -4.8857 0.0479
10 IN00200890516.65% Fertilizer Companies Government of IndiaSpecial Bonds, 2023
29-Jan-09 29-Jan-23 1710.93 1646.37 96.23 7.40% 7.53% 5.2697 5.0818 92.0297 101.8750 31.6642 -5.0818 0.1583 -4.9234 -4.9271 0.0492
11 IN0020120070 8.20% PLI GoISpl Sec. 2023 28-Mar-13 28-Mar-23 6893.68 7177.75 104.12 7.40% 7.52% 5.0770 4.8959 102.4774 113.0195 30.7753 -4.8959 0.1539 -4.7421 -4.7457 0.0527
12 IN00201090248.08% Postal Life Insurance Government of IndiaSpecial Security 2023
31-Mar-11 31-Mar-23 3000.00 3104.59 103.49 7.40% 7.53% 5.0951 4.9133 101.7643 112.2721 30.9345 -4.9133 0.1547 -4.7587 -4.7623 0.0525
13 IN00200890108.20% Oil Marketing Companies Government ofIndia Special Bonds 2023
10-Nov-08 10-Nov-23 22000.00 22941.05 104.28 7.42% 7.55% 5.4845 5.2883 101.3225 112.6261 35.8220 -5.2883 0.1791 -5.1092 -5.1137 0.0565
14 IN0020079011 8.30% Fertilizer Companies GOI Special Bonds, 2023 7-Dec-07 7-Dec-23 3880.00 4068.55 104.86 7.42% 7.55% 5.5479 5.3495 101.2515 112.6849 36.5199 -5.3495 0.1826 -5.1669 -5.1715 0.0571
15 IN00200600528.01% Oil Marketing Companies Government ofIndia Special Bonds, 2023
15-Dec-06 15-Dec-23 4150.00 4285.08 103.25 7.42% 7.55% 5.6038 5.4033 99.4439 110.7925 37.0743 -5.4033 0.1854 -5.2179 -5.2226 0.0567
16 IN00200600608.20% Oil Marketing Companies Government ofIndia Special Bonds, 2024
12-Feb-07 12-Feb-24 5000.00 5217.43 104.35 7.43% 7.56% 5.7395 5.5340 99.1583 110.7634 38.6021 -5.5340 0.1930 -5.3409 -5.3459 0.0580
17 IN00200790458.35% SBI Rights Issue Government of India SpecialBonds, 2024
27-Mar-08 27-Mar-24 9996.01 10523.20 105.27 7.43% 7.56% 5.6272 5.4257 103.1214 114.9412 38.3240 -5.4257 0.1916 -5.2341 -5.2391 0.0590
18 IN00200990198.20% Oil Marketing Companies’ Government ofIndia Special Bonds, 2024
15-Sep-09 15-Sep-24 10306.33 10774.52 104.54 7.44% 7.58% 5.8826 5.6717 102.3806 114.6781 42.1596 -5.6717 0.2108 -5.4609 -5.4667 0.0614
66
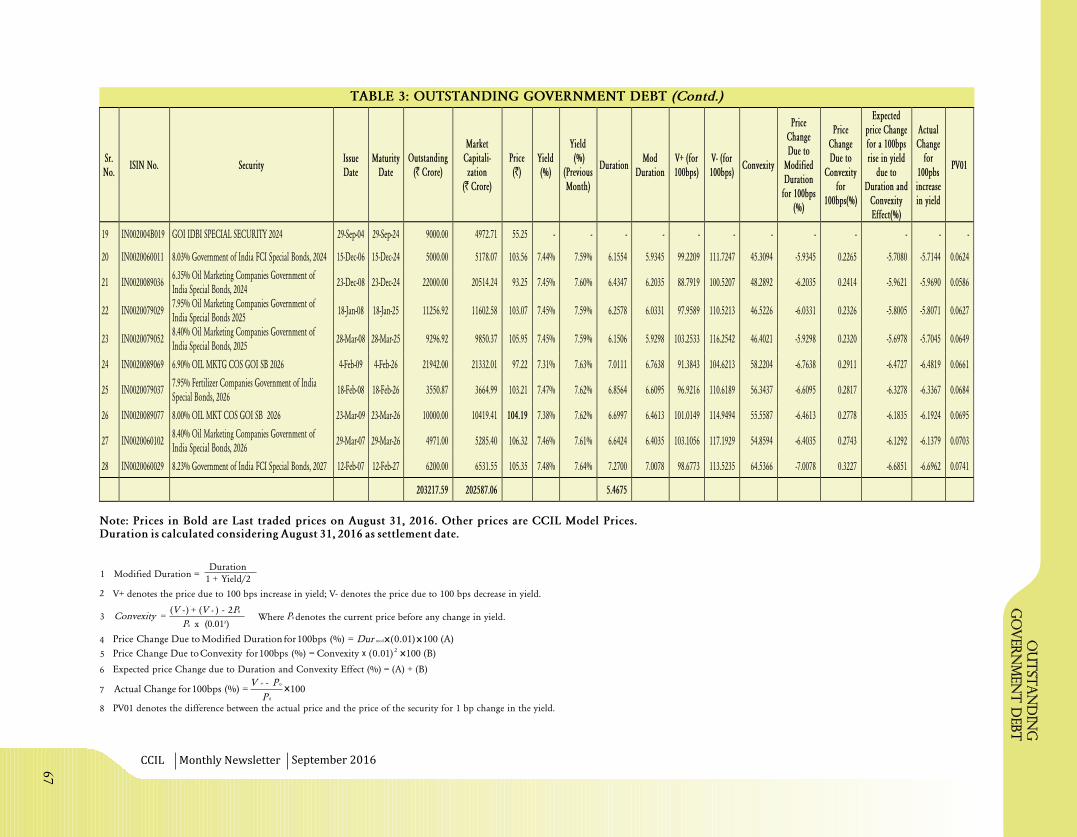
CCIL Monthly Newsletter
ou
tsta
nd
ing
go
vern
men
t d
ebt
September 2016
Modified Duration =Yield/21
Duration
+
0.01 )2x (P0
2P0( )V +( -+=
V - )Convexity
100 (A))01.0((%)100bpsforDurationModifiedtoDueChangePrice modx= Dur
100 (B))01.0(Convexity(%)100bpsforConvexitytoDueChangePrice 2=
Expected price Change due to Duration and Convexity Effect (%) = (A) + (B)
100(%)100bpsforChangeActual0
0-=
+
P
PV
V+ denotes the price due to 100 bps increase in yield; V- denotes the price due to 100 bps decrease in yield.
Where denotes the current price before any change in yield.
1
2
3
5
6
7
8 PV01 denotes the difference between the actual price and the price of the security for 1 bp change in the yield.
4
P0
x
x x
x
Note: Prices in Bold are Last traded prices on , 2016. Other prices are CCIL Model Prices.Duration is calculated considering as settlement date.
August 31August 31, 2016
TABLE 3: OUTSTANDING GOVERNMENT DEBT (Contd.)
Sr.No.
ISIN No. SecurityIssueDate
MaturityDate
Outstanding(` Crore)
MarketCapitali-zation
(` Crore)
Price(`)
Yield(%)
Yield(%)
(PreviousMonth)
DurationMod
DurationV+ (for100bps)
V- (for100bps)
Convexity
PriceChangeDue to
ModifiedDurationfor 100bps
(%)
PriceChangeDue to
Convexityfor
100bps(%)
Expectedprice Changefor a 100bpsrise in yield
due toDuration and
ConvexityEffect(%)
ActualChange
for100pbsincreasein yield
PV01
19 IN002004B019 GOI IDBI SPECIAL SECURITY 2024 29-Sep-04 29-Sep-24 9000.00 4972.71 55.25 - - - - - - - - - - - -
20 IN0020060011 8.03% Government of India FCI Special Bonds, 2024 15-Dec-06 15-Dec-24 5000.00 5178.07 103.56 7.44% 7.59% 6.1554 5.9345 99.2209 111.7247 45.3094 -5.9345 0.2265 -5.7080 -5.7144 0.0624
21 IN00200890366.35% Oil Marketing Companies Government ofIndia Special Bonds, 2024
23-Dec-08 23-Dec-24 22000.00 20514.24 93.25 7.45% 7.60% 6.4347 6.2035 88.7919 100.5207 48.2892 -6.2035 0.2414 -5.9621 -5.9690 0.0586
22 IN00200790297.95% Oil Marketing Companies Government ofIndia Special Bonds 2025
18-Jan-08 18-Jan-25 11256.92 11602.58 103.07 7.45% 7.59% 6.2578 6.0331 97.9589 110.5213 46.5226 -6.0331 0.2326 -5.8005 -5.8071 0.0627
23 IN00200790528.40% Oil Marketing Companies Government ofIndia Special Bonds, 2025
28-Mar-08 28-Mar-25 9296.92 9850.37 105.95 7.45% 7.59% 6.1506 5.9298 103.2533 116.2542 46.4021 -5.9298 0.2320 -5.6978 -5.7045 0.0649
24 IN0020089069 6.90% OIL MKTG COS GOI SB 2026 4-Feb-09 4-Feb-26 21942.00 21332.01 97.22 7.31% 7.63% 7.0111 6.7638 91.3843 104.6213 58.2204 -6.7638 0.2911 -6.4727 -6.4819 0.0661
25 IN00200790377.95% Fertilizer Companies Government of IndiaSpecial Bonds, 2026
18-Feb-08 18-Feb-26 3550.87 3664.99 103.21 7.47% 7.62% 6.8564 6.6095 96.9216 110.6189 56.3437 -6.6095 0.2817 -6.3278 -6.3367 0.0684
26 IN0020089077 8.00% OIL MKT COS GOI SB 2026 23-Mar-09 23-Mar-26 10000.00 10419.41 104.19 7.38% 7.62% 6.6997 6.4613 101.0149 114.9494 55.5587 -6.4613 0.2778 -6.1835 -6.1924 0.0695
27 IN00200601028.40% Oil Marketing Companies Government ofIndia Special Bonds, 2026
29-Mar-07 29-Mar-26 4971.00 5285.40 106.32 7.46% 7.61% 6.6424 6.4035 103.1056 117.1929 54.8594 -6.4035 0.2743 -6.1292 -6.1379 0.0703
28 IN0020060029 8.23% Government of India FCI Special Bonds, 2027 12-Feb-07 12-Feb-27 6200.00 6531.55 105.35 7.48% 7.64% 7.2700 7.0078 98.6773 113.5235 64.5366 -7.0078 0.3227 -6.6851 -6.6962 0.0741
203217.59 202587.06 5.4675
67

CC
ILM
on
thly
Ne
wsl
ett
er
outstanding
government debt
Se
pte
mb
er
20
16
TABLE 3: OUTSTANDING GOVERNMENT DEBT (Contd.)
TREASURY BILLS (DTB)
FLOATING RATE & INFLATION INDEX BONDS
Sr.No.
ISIN No. SecurityIssueDate
MaturityDate
Outstanding(` Crore)
MarketCapitali-zation
(` Crore)
Price(`)
1 IN0020022011 FRB 2017 (8.15% - 364 day T-Bills) 2-Jul-02 2-Jul-17 3000.00 3007.94 100.26
2 IN0020092071 FRB 2020 (7.23% - 182 day T-Bills) 21-Dec-09 21-Dec-20 13000.00 12752.59 98.10
3 IN0020130046 1.44% IIGS 2023 5-Jun-13 5-Jun-23 1152.06 1091.07 94.71
4 IN0020042050 FRB 2035 (7.64%- reset every 5 years) 25-Jan-05 25-Jan-35 350.00 354.13 101.18
17502.06 17205.74
1 IN002015Z121 364 DTB 4-Sep-15 1-Sep-16 5002.00 5001.11 99.98
2 IN002015Z139 364 DTB 18-Sep-15 16-Sep-16 5004.50 4990.44 99.72
3 IN002015Z147 364 DTB 1-Oct-15 29-Sep-16 5003.00 4976.16 99.46
4 IN002015Z154 364 DTB 16-Oct-15 13-Oct-16 6000.00 5955.31 99.26
5 IN002015Z162 364 DTB 30-Oct-15 27-Oct-16 6000.00 5939.58 98.99
6 IN002015Z170 364 DTB 13-Nov-15 11-Nov-16 6000.00 5921.48 98.69
7 IN002015Z188 364 DTB 27-Nov-15 24-Nov-16 6003.00 5914.13 98.52
8 IN002015Z196 364 DTB 11-Dec-15 8-Dec-16 6014.70 5908.92 98.24
9 IN002015Z204 364 DTB 25-Dec-15 26-Dec-16 6006.00 5878.93 97.88
10 IN002015Z212 364 DTB 8-Jan-16 5-Jan-17 6010.00 5875.13 97.76
11 IN002015Z220 364 DTB 22-Jan-16 19-Jan-17 6000.00 5843.71 97.40
12 IN002015Z238 364 DTB 5-Feb-16 2-Feb-17 6000.00 5834.87 97.25
13 IN002015Z246 364 DTB 18-Feb-16 16-Feb-17 6000.00 5819.95 97.00
14 IN002015Z253 364 DTB 4-Mar-16 2-Mar-17 6000.00 5805.06 96.75
15 IN002015Z261 364 DTB 18-Mar-16 16-Mar-17 6000.00 5787.02 96.45
16 IN002015Z279 364 DTB 31-Mar-16 30-Mar-17 6002.00 5780.13 96.30
17 IN002016Z012 364 DTB 15-Apr-16 12-Apr-17 6000.00 5763.51 96.06
18 IN002016Z020 364 DTB 29-Apr-16 27-Apr-17 6002.00 5747.67 95.76
19 IN002016Z038 364 DTB 13-May-16 11-May-17 6000.00 5734.05 95.57
20 IN002016Z046 364 DTB 27-May-16 25-May-17 6000.00 5721.67 95.36
21 IN002016Z053 364 DTB 10-Jun-16 8-Jun-17 6000.15 5706.37 95.10
22 IN002016Z061 364 DTB 24-Jun-16 22-Jun-17 8517.00 8081.19 94.88
23 IN002016Z079 364 DTB 8-Jul-16 6-Jul-17 6000.10 5672.37 94.54
24 IN002016Z087 364 DTB 22-Jul-16 20-Jul-17 6000.00 5657.68 94.29
25 IN002016Z095 364 DTB 5-Aug-16 3-Aug-17 6000.17 5643.26 94.05
26 IN002016Z103 364 DTB 19-Aug-16 17-Aug-17 6000.00 5634.88 93.91
27 IN002015Y264 182 DTB 11-Mar-16 8-Sep-16 10001.50 9989.26 99.88
28 IN002015Y272 182 DTB 25-Mar-16 26-Sep-16 6569.15 6539.10 99.54
68

CC
ILM
on
thly
Ne
wsl
ett
er
outstanding
government debt
Se
pte
mb
er
20
16
TABLE 3: OUTSTANDING GOVERNMENT DEBT (Concld.)
Note: Traded Prices are as on August 31, 2016. CCIL Model Prices are as on August 31, 2016.
Duration is calculated considering August 31, 2016, as settlement date.
Sr.No.
ISIN No. SecurityIssueDate
MaturityDate
Outstanding(` Crore)
MarketCapitali-zation
(` Crore)
Price(`)
29 IN002016Y015 182 DTB 7-Apr-16 6-Oct-16 6005.00 5966.91 99.37
30 IN002016Y023 182 DTB 22-Apr-16 20-Oct-16 6000.00 5948.09 99.13
31 IN002016Y031 182 DTB 6-May-16 3-Nov-16 6010.00 5943.04 98.89
32 IN002016Y049 182 DTB 20-May-16 17-Nov-16 6010.00 5928.55 98.64
33 IN002016Y056 182 DTB 3-Jun-16 1-Dec-16 10000.00 9839.08 98.39
34 IN002016Y064 182 DTB 17-Jun-16 15-Dec-16 6000.00 5887.33 98.12
35 IN002016Y072 182 DTB 30-Jun-16 29-Dec-16 6000.00 5872.57 97.88
36 IN002016Y080 182 DTB 15-Jul-16 12-Jan-17 7000.00 6830.50 97.58
37 IN002016Y098 182 DTB 29-Jul-16 26-Jan-17 6000.00 5842.33 97.37
38 IN002016Y106 182 DTB 12-Aug-16 9-Feb-17 7000.00 6801.98 97.17
39 IN002016Y114 182 DTB 26-Aug-16 23-Feb-17 6000.00 5814.97 96.92
40 IN002016X090 91 DTB 3-Jun-16 1-Sep-16 18000.00 17996.80 99.98
41 IN002016X108 91 DTB 10-Jun-16 8-Sep-16 19901.00 19876.64 99.88
42 IN002016X116 91 DTB 17-Jun-16 15-Sep-16 14211.00 14176.20 99.76
43 IN002016X124 91 DTB 24-Jun-16 22-Sep-16 14004.00 13952.68 99.63
44 IN002016X132 91 DTB 30-Jun-16 29-Sep-16 19101.00 18994.84 99.44
45 IN002016X140 91 DTB 8-Jul-16 6-Oct-16 12202.51 12126.37 99.38
46 IN002016X157 91 DTB 15-Jul-16 13-Oct-16 14900.00 14789.22 99.26
47 IN002016X165 91 DTB 22-Jul-16 20-Oct-16 15700.00 15564.18 99.13
48 IN002016X173 91 DTB 29-Jul-16 27-Oct-16 12200.00 12079.56 99.01
49 IN002016X181 91 DTB 5-Aug-16 3-Nov-16 16370.00 16187.85 98.89
50 IN002016X199 91 DTB 12-Aug-16 10-Nov-16 12000.00 11851.48 98.76
51 IN002016X207 91 DTB 19-Aug-16 17-Nov-16 8300.00 8187.22 98.64
IN002016X215 91 DTB 26-Aug-16 24-Nov-16 15101.25 14877.7062 98.52
436151.02 428458.99
69

CC
ILM
on
thly
Ne
wsl
ett
er
outstanding
government debt
Se
pte
mb
er
20
16
TABLE 4: STATE DEVELOPMENT LOANS (SDLS) - OUTSTANDING
No. of Bonds Outstanding (` Crore)Sr.No.
State/Union TerritoryNo. %Share Value %Share
Wtd. Avg.Coupon (%)
Wtd. Avg.Maturity (yrs.)
1 Andhra Pradesh 137 6.17 148964.98 8.35 8.52 5.97
2 Arunachal Pradesh 23 1.04 1386.89 0.08 8.49 5.70
3 Assam 21 0.95 13196.56 0.74 8.39 5.56
4 Bihar 55 2.48 49738.48 2.79 8.56 6.72
5 Chhattisgarh 30 1.35 15422.44 0.86 8.45 7.88
6 Goa 51 2.30 6959.00 0.39 8.45 6.22
7 Gujarat 108 4.87 126477.07 7.09 8.41 6.02
8 Haryana 105 4.73 93468.85 5.24 8.44 7.01
9 Himachal Pradesh 65 2.93 16860.36 0.95 8.45 4.96
10 Jammu & Kashmir 71 3.20 23336.32 1.31 8.54 5.70
11 Jharkhand 53 2.39 28900.13 1.62 8.46 7.29
12 Karnataka 55 2.48 82532.84 4.63 8.58 6.32
13 Kerala 114 5.14 92445.71 5.18 8.49 6.44
14 Madhya Pradesh 55 2.48 58040.26 3.25 8.44 6.53
15 Maharashtra 120 5.41 188492.46 10.57 8.45 6.18
16 Manipur 35 1.58 3494.63 0.20 8.34 5.88
17 Meghalaya 53 2.39 3601.87 0.20 8.38 6.03
18 Mizoram 37 1.67 2086.33 0.12 8.44 5.15
19 Nagaland 51 2.30 5366.01 0.30 8.47 5.64
20 Odisha 14 0.63 10328.03 0.58 7.98 6.54
21 Puducherry 25 1.13 4042.44 0.23 8.59 5.44
22 Punjab 169 7.62 87233.26 4.89 8.46 6.20
23 Rajastan 172 7.75 144470.89 8.10 8.40 6.22
24 Sikkim 23 1.04 2435.35 0.14 8.18 6.01
25 Tamil Nadu 144 6.49 162823.53 9.13 8.39 6.50
26 Telangana 30 1.35 31050.00 1.74 8.21 9.05
27 Tripura 28 1.26 3692.94 0.21 8.43 6.45
28 Uttar Pradesh 199 8.97 191908.99 10.76 8.41 6.93
29 Uttaranchal 42 1.89 16382.75 0.92 8.53 6.68
30 West Bengal 134 6.04 167978.23 9.42 8.52 5.77
2219 100.00 1783117.59 100.00 8.14 6.53
70

CC
ILM
on
thly
Ne
wsl
ett
er
TABLE :5 OUTSTANDING - GOVERNMENT SECURITIES, TREASURY BILLS AND STATE DEVELOPMENT LOANSAmount Crore`
outstanding
government debt
Se
pte
mb
er
20
16
MonthGovernmentSecurities
SpecialSecurities
FloatingRate Bonds
TreasuryBills#
State DevelopmentLoans*
Total
Apr-06 931868.00 50903.69 46350.00 67072.91 239804.87 1335999.46
May-06 940819.00 50903.69 46350.00 76150.24 240104.87 1354327.79
Jun-06 955689.00 50903.69 46350.00 76537.87 240763.49 1370244.04
Jul-06 963689.00 50903.69 46350.00 84100.94 240763.49 1385807.12
Aug-06 970380.00 56152.47 46350.00 92801.37 242221.82 1407905.65
Sep-06 979380.00 56152.47 46350.00 95251.47 243271.82 1420405.75
Oct-06 988354.00 66152.47 46350.00 93358.52 243271.82 1437486.80
Nov-06 1002354.00 71152.47 44350.00 99852.39 243473.15 1461182.00
Dec-06 1011354.00 76413.26 44350.00 96859.85 245904.37 1474881.48
Jan-07 1020354.00 71564.48 44350.00 102420.08 247867.61 1486556.16
Feb-07 1028354.00 90999.14 44350.00 108913.26 247472.70 1520089.10
Mar-07 1058997.00 87256.88 44350.00 115473.69 251072.27 1557149.85
Apr-07 1071297.00 87256.88 44350.00 119965.64 254078.59 1576948.11
May-07 1077797.00 87256.88 44350.00 126189.40 250533.80 1586127.08
Jun-07 1102797.00 87256.88 44350.00 145981.76 252283.80 1632669.44
Jul-07 1128797.00 87256.88 44350.00 151565.34 255849.38 1667818.61
Aug-07 1169627.00 90937.41 44350.00 156379.61 253433.89 1714727.92
Sep-07 1191897.00 90237.41 44350.00 147411.54 256918.33 1730814.28
Oct-07 1236540.00 90237.41 44350.00 159450.17 259992.07 1790569.65
Nov-07 1256919.00 90237.41 44350.00 146252.36 262886.53 1800645.30
Dec-07 1263919.00 90238.20 44350.00 126327.36 268186.53 1793021.09
Jan-08 1273966.00 98369.64 44350.00 126951.13 276361.79 1819998.56
Feb-08 1288612.00 100655.10 44350.00 123605.11 289973.52 1847195.72
Mar-08 1288085.00 119948.03 44350.00 136139.95 302724.48 1891247.46
Apr-08 1319085.00 119948.03 44350.00 139593.07 310302.66 1933278.75
May-08 1320109.00 119948.03 44350.00 147979.97 307821.10 1940208.09
Jun-08 1332724.00 119948.03 44350.00 132825.20 311085.20 1940932.42
Jul-08 1347067.00 119948.03 44350.00 133659.95 313385.20 1958410.17
Aug-08 1348567.00 119948.03 44350.00 134160.86 313885.20 1960911.08
Sep-08 1361057.00 119948.03 44350.00 135751.52 315762.92 1976869.47
Oct-08 1371057.00 119649.56 44350.00 141434.52 318774.92 1995266.01
Nov-08 1371690.00 141649.56 44350.00 149632.01 319041.09 2026362.66
Dec-08 1374093.00 177649.56 44350.00 145070.40 327486.09 2068649.05
Jan-09 1403513.00 183649.56 44350.00 146566.95 338191.45 2116270.96
Feb-09 1421512.96 205591.56 44350.00 146762.02 356629.49 2174846.03
Mar-09 1468512.67 202220.17 44350.00 150273.80 369290.70 2234647.33
Apr-09 1478125.85 202220.17 44350.00 163472.50 414068.98 2302237.50
May-09 1526423.69 202220.17 44350.00 148275.25 414563.33 2335832.44
Jun-09 1564423.69 202220.17 44350.00 146874.80 421563.33 2379431.98
Jul-09 1615423.69 202220.17 44350.00 141338.92 427513.33 2430846.11
Aug-09 1651423.69 202220.17 44350.00 138854.64 437472.91 2474321.41
Sep-09 1697423.69 212526.50 44350.00 141887.94 452223.35 2548411.48
Oct-09 1727423.69 212526.50 44350.00 134980.94 465742.01 2585023.14
Nov-09 1756423.69 212526.50 44350.00 134014.74 476964.28 2624279.21
Dec-09 1783423.69 212526.50 43350.00 134764.74 489096.47 2663161.40
Jan-10 1779887.91 211826.50 46350.00 134753.74 496442.94 2669261.09
71

CC
ILM
on
thly
Ne
wsl
ett
er
TABLE :5 OUTSTANDING - GOVERNMENT SECURITIES, TREASURY BILLS AND STATE DEVELOPMENT LOANS
Amount Crore`
outstanding
government debt
Se
pte
mb
er
20
16
MonthGovernmentSecurities
SpecialSecurities
FloatingRate Bonds
TreasuryBills#
State DevelopmentLoans*
Total
Feb-10 1787887.91 208607.03 46350.00 134660.14 509676.73 2687181.82
Mar-10 1787887.91 208214.03 46350.00 137466.34 517405.62 2697323.90
Apr-10 1833887.91 208214.03 49350.00 136489.04 521551.88 2749492.86
May-10 1859011.69 208214.03 49350.00 144488.54 529259.38 2790323.64
Jun-10 1892238.66 208214.03 49350.00 131988.54 534974.23 2816765.47
Jul-10 1900110.16 208214.03 49350.00 116883.22 540925.06 2815482.48
Aug-10 1949367.38 208214.03 49350.00 122828.95 547425.91 2877186.27
Sep-10 1994117.38 208214.03 49350.00 123295.65 554535.06 2929512.12
Oct-10 2024969.09 208214.03 49350.00 127892.94 565736.86 2976162.92
Nov-10 2057964.09 208214.03 49350.00 117768.94 573111.86 3006408.92
Dec-10 2080492.84 208214.03 49350.00 125268.94 579026.86 3042352.67
Jan-11 2104647.19 208214.03 49350.00 126923.25 585834.62 3074969.09
Feb-11 2107564.66 208214.03 49350.00 127687.35 597643.35 3090459.39
Mar-11 2107564.66 209051.05 49350.00 141326.90 605803.69 3113096.30
Apr-11 2142091.74 209051.05 49350.00 169973.45 614026.69 3184492.93
May-11 2178091.74 209051.05 49350.00 201219.95 617839.16 3255551.90
Jun-11 2214091.74 209051.05 49350.00 221862.40 626839.16 3321194.35
Jul-11 2240091.74 202656.76 49350.00 245126.77 635951.08 3373176.35
Aug-11 2282230.38 202656.76 43350.00 258813.67 647703.99 3434754.79
Sep-11 2304230.38 202656.76 43350.00 221271.87 658253.99 3429762.99
Oct-11 2343983.47 202656.76 43350.00 224245.69 669335.66 3483571.58
Nov-11 2377983.47 202656.76 46350.00 230366.87 680524.30 3537881.40
Dec-11 2428983.47 202656.76 48350.00 212864.67 693052.62 3585907.52
Jan-12 2483983.47 202656.76 48350.00 232689.60 709031.96 3676711.78
Feb-12 2532978.47 202656.76 48350.00 271336.87 723972.96 3779295.05
Mar-12 2544978.47 205656.76 48350.00 267019.92 742411.75 3808416.90
Apr-12 2583978.47 205656.76 48350.00 302223.35 746077.40 3886285.98
May-12 2613978.47 205656.76 48350.00 308155.15 757649.21 3933789.59
Jun-12 2668404.34 205656.76 48350.00 328967.43 765210.46 4016588.98
Jul-12 2719362.53 205656.76 48350.00 333413.61 780870.46 4087653.35
Aug-12 2794362.53 205656.76 48350.00 325173.76 791136.56 4164679.60
Sep-12 2829362.53 199893.91 48350.00 329499.27 808196.56 4215302.26
Oct-12 2868362.53 199893.91 48350.00 320097.07 828003.91 4264707.42
Nov-12 2933362.53 199893.91 43350.00 314675.75 842018.24 4333300.43
Dec-12 2969362.53 199893.91 43350.00 315530.69 852097.55 4380234.67
Jan-13 2981362.53 199893.91 43350.00 331630.52 868306.68 4424543.64
Feb-13 3017362.53 199823.91 43350.00 311164.52 874104.53 4445805.48
Mar-13 3017362.53 206717.59 43350.00 299764.15 889068.62 4456262.89
Apr-13 3062362.52 206717.59 43350.00 316620.40 897231.62 4526282.11
May-13 3121611.19 206717.59 43350.00 319429.14 900318.79 4591426.71
Jun-13 3167611.19 206717.59 45350.00 328052.31 904967.16 4652698.24
Jul-13 3227611.19 206717.59 45350.00 361888.95 908057.54 4749625.26
Aug-13 3291627.29 206717.59 45350.00 420017.27 919077.00 4882789.14
Sep-13 3283627.29 206717.59 43350.00 400722.16 933469.55 4867886.59
Oct-13 3328627.29 206717.59 44350.00 356220.45 954502.92 4890418.25
Nov-13 3404627.29 206717.59 45350.00 348625.62 969237.80 4974558.30
72
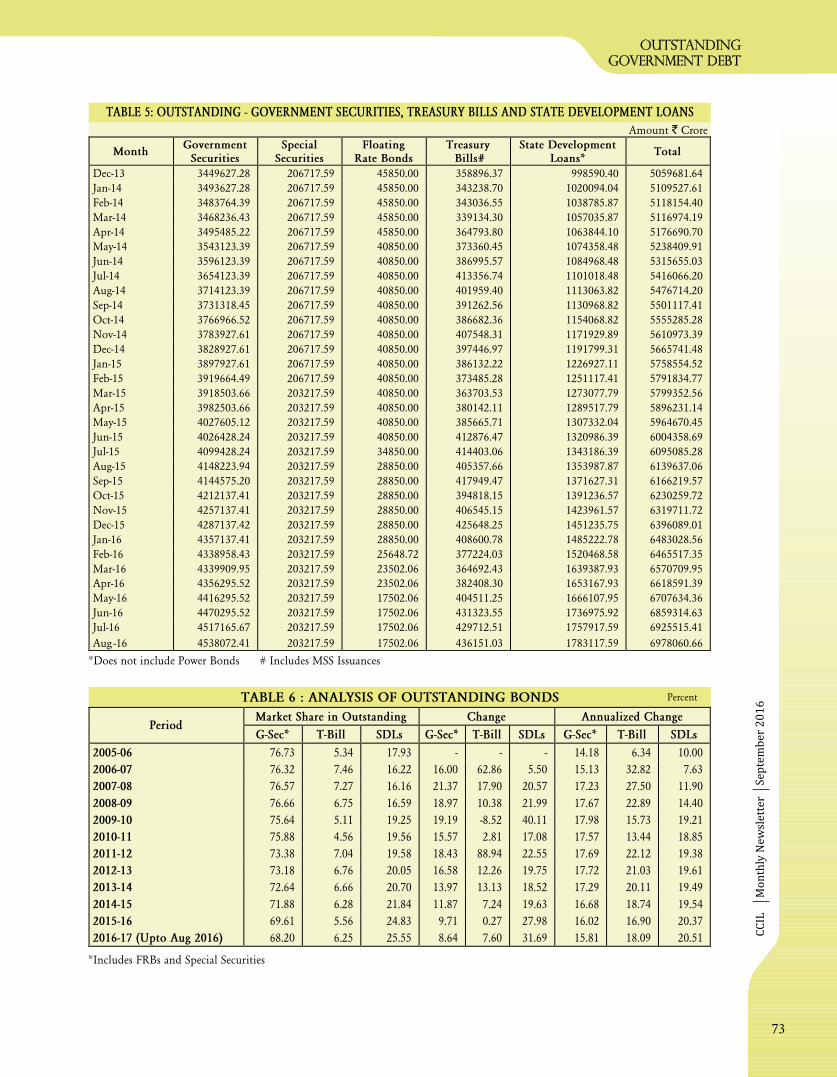
CC
ILM
on
thly
Ne
wsl
ett
er
outstanding
government debt
Se
pte
mb
er
20
16
TABLE 6 : ANALYSIS OF OUTSTANDING BONDS Percent
TABLE :5 OUTSTANDING - GOVERNMENT SECURITIES, TREASURY BILLS AND STATE DEVELOPMENT LOANS
*Includes FRBs and Special Securities
Amount Crore`
*Does not include Power Bonds # Includes MSS Issuances
MonthGovernment
SecuritiesSpecial
SecuritiesFloating
Rate BondsTreasury
Bills#State Development
Loans*Total
Dec-13 3449627.28 206717.59 45850.00 358896.37 998590.40 5059681.64
Jan-14 3493627.28 206717.59 45850.00 343238.70 1020094.04 5109527.61
Feb-14 3483764.39 206717.59 45850.00 343036.55 1038785.87 5118154.40
Mar-14 3468236.43 206717.59 45850.00 339134.30 1057035.87 5116974.19
Apr-14 3495485.22 206717.59 45850.00 364793.80 1063844.10 5176690.70
May-14 3543123.39 206717.59 40850.00 373360.45 1074358.48 5238409.91
Jun-14 3596123.39 206717.59 40850.00 386995.57 1084968.48 5315655.03
Jul-14 3654123.39 206717.59 40850.00 413356.74 1101018.48 5416066.20
Aug-14 3714123.39 206717.59 40850.00 401959.40 1113063.82 5476714.20
Sep-14 3731318.45 206717.59 40850.00 391262.56 1130968.82 5501117.41
Oct-14 3766966.52 206717.59 40850.00 386682.36 1154068.82 5555285.28
Nov-14 3783927.61 206717.59 40850.00 407548.31 1171929.89 5610973.39
Dec-14 3828927.61 206717.59 40850.00 397446.97 1191799.31 5665741.48
Jan-15 3897927.61 206717.59 40850.00 386132.22 1226927.11 5758554.52
Feb-15 3919664.49 206717.59 40850.00 373485.28 1251117.41 5791834.77
Mar-15 3918503.66 203217.59 40850.00 363703.53 1273077.79 5799352.56
Apr-15 3982503.66 203217.59 40850.00 380142.11 1289517.79 5896231.14
May-15 4027605.12 203217.59 40850.00 385665.71 1307332.04 5964670.45
Jun-15 4026428.24 203217.59 40850.00 412876.47 1320986.39 6004358.69
Jul-15 4099428.24 203217.59 34850.00 414403.06 1343186.39 6095085.28
Aug-15 4148223.94 203217.59 28850.00 405357.66 1353987.87 6139637.06
Sep-15 4144575.20 203217.59 28850.00 417949.47 1371627.31 6166219.57
Oct-15 4212137.41 203217.59 28850.00 394818.15 1391236.57 6230259.72
Nov-15 4257137.41 203217.59 28850.00 406545.15 1423961.57 6319711.72
Dec-15 4287137.42 203217.59 28850.00 425648.25 1451235.75 6396089.01
Jan-16 4357137.41 203217.59 28850.00 408600.78 1485222.78 6483028.56
Feb-16 4338958.43 203217.59 25648.72 377224.03 1520468.58 6465517.35
Mar-16 4339909.95 203217.59 23502.06 364692.43 1639387.93 6570709.95
Apr-16 4356295.52 203217.59 23502.06 382408.30 1653167.93 6618591.39
May-16 4416295.52 203217.59 17502.06 404511.25 1666107.95 6707634.36
Jun-16 4470295.52 203217.59 17502.06 431323.55 1736975.92 6859314.63
Jul
Aug
-
-
16
16
4517165.67
4538072.41
203217.59
203217.59
17502.06
17502.06
429712.51
436151.03
1757917.59
1783117.59
6925515.41
6978060.66
Market Share in Outstanding Change Annualized ChangePeriod
G-Sec* T-Bill SDLs G-Sec* T-Bill SDLs G-Sec* T-Bill SDLs
2005-06 76.73 5.34 17.93 - - - 14.18 6.34 10.00
2006-07 76.32 7.46 16.22 16.00 62.86 5.50 15.13 32.82 7.63
2007-08 76.57 7.27 16.16 21.37 17.90 20.57 17.23 27.50 11.90
2008-09 76.66 6.75 16.59 18.97 10.38 21.99 17.67 22.89 14.40
2009-10 75.64 5.11 19.25 19.19 -8.52 40.11 17.98 15.73 19.21
2010-11 75.88 4.56 19.56 15.57 2.81 17.08 17.57 13.44 18.85
2011-12 73.38 7.04 19.58 18.43 88.94 22.55 17.69 22.12 19.38
2012-13 73.18 6.76 20.05 16.58 12.26 19.75 17.72 21.03 19.61
2013-14 72.64 6.66 20.70 13.97 13.13 18.52 17.29 20.11 19.49
2014-15 71.88 6.28 21.84 11.87 7.24 19.63 16.68 18.74 19.54
2015-16 69.61 5.56 24.83 9.71 0.27 27.98 16.02 16.90 20.37
2016-17 (Upto Aug 2016) 68.20 6.25 25.55 8.64 7.60 31.69 15.81 18.09 20.51
73

CC
ILM
on
thly
Ne
wsl
ett
er
TABLE 7: INDEX COMPOSITION
CCIL Indices
CCIL Indices
Se
pte
mb
er
20
16
No. Liquid Index Broad Index CASBI Index SDL Index
1 7.59% G.S. 2026 7.59% G.S. 2026 7.83% G.S. 2018 7.69% Uttar Pradesh SDL 2026
2 7.59% G.S. 2029 7.59% G.S. 2029 7.28% G.S. 2019 7.88% Andhra Pradesh SDL 2026
3 7.88% G.S. 2030 7.88% G.S. 2030 6.90% G.S. 2019 7.69% Kerala SDL 2026
4 7.68% G.S. 2023 7.68% G.S. 2023 6.35% G.S 2020 8% Punjab SDL 2026
5 7.61% G.S. 2030 7.61% G.S. 2030 8.27% G.S. 2020 8.76% Madhya Pradesh SDL 2026
6 7.72% G.S. 2025 7.80% G.S. 2021 7.69% Tamilnadu SDL 2026
7 8.27% G.S. 2020 8.08% G.S. 2022 7.69% Maharashtra SDL 2026
8 7.35% G.S. 2024 7.16% G.S. 2023 7.69% West Bengal SDL 2026
9 7.80% G.S. 2021 7.68% G.S. 2023 7.69% Gujarat SDL 2026
10 7.28% G.S. 2019 7.35% G.S. 2024 7.98% Haryana SDL 2026
11 8.40% G.S. 2024 8.40% G.S. 2024 8.6% Bihar 2026
12 6.35% G.S 2020 7.72% G.S. 2025 8.67% Karnataka SDL 2026
13 8.12% G.S. 2020 7.59% G.S. 2026 8.07% Rajasthan SDL 2026
14 7.16% G.S. 2023 8.28% G.S. 2027 7.69% Telangana SDL 2026
15 8.08% G.S. 2022 8.60% G.S. 2028
16 7.83% G.S.2018 7.59% G.S. 2029
17 8.60% G.S. 2028 7.88% G.S. 2030
18 7.73% G.S. 2034 7.61% G.S. 2030
19 8.17% G.S. 2044 8.32% G.S. 2032
20 8.13% G.S. 2045 8.24% G.S. 2033
21 7.73% G.S. 2034
22 7.40% G.S. 2035
23 8.33% G.S. 2036
24 6.83% G.S. 2039
25 8.30% G.S. 2040
26 8.83% G.S. 2041
27 8.30% G.S. 2042
28 9.23% G.S. 2043
29 8.17% G.S. 2044
30 8.13% G.S. 2045
31 7.72% G.S. 2055
74

CCIL Monthly Newsletter
TABLE 8: INDEX PERFORMANCE ANALYSIS Percent
CC
IL In
dic
es
September 2016
Indices
TRIBond Index Broad
PRI
TRIBond Index Liquid
PRI
TRICASBI
PRI
TRITenor Index(upto 5 yrs)
PRI
TRITenor Index(5 -10 yrs)
PRI
TRITenor Index(10-15 yrs)
PRI
TRITenor Index(15-20 yrs)
PRI
TRITenor Index(20-30 yrs)
PRI
LiquidityWeight
T-Bill IndexEqualWeight
TRISDL Index
PRI
2007-08 2008-09 2009-10 2010-11 2011-12 2012-13 2013-14 2014-15 2015-16 2016-17 ( Aug-16)
YearlyReturn(%)
AnnualizedReturn
(%)
YearlyReturn(%)
AnnualizedReturn
(%)
YearlyReturn(%)
AnnualizedReturn
(%)
YearlyReturn(%)
AnnualizedReturn
(%)
YearlyReturn(%)
AnnualizedReturn
(%)
YearlyReturn(%)
AnnualizedReturn
(%)
YearlyReturn(%)
AnnualizedReturn
(%)
YearlyReturn(%)
AnnualizedReturn
(%)
YearlyReturn(%)
AnnualizedReturn
(%)
YearlyReturn(%)
AnnualizedReturn
(%)
8.7180 3.2022 14.6533 5.3970 4.9645 5.3248 5.9700 5.4167 5.3764 5.4117 12.5434 6.1813 1.8420 5.7391 17.9715 6.7967 7.5897 6.8625 12.7204 7.1685
0.3991 -4.8476 6.0812 -2.7559 -2.6056 -2.7308 -1.7544 -2.5920 -2.4471 -2.5739 3.9053 -1.8744 -6.1462 -2.3102 9.4740 -1.2935 -0.2737 -1.2089 4.4844 -0.9103
7.1601 2.7858 14.9089 5.1035 3.5974 4.8510 6.1285 5.0326 5.4325 5.0825 10.4908 5.6701 0.1164 5.1011 17.1786 6.1456 7.4502 6.2537 13.2048 6.6252
-0.6675 -4.7100 6.4797 -2.5703 -3.4510 -2.7176 -1.6508 -2.5660 -2.8086 -2.5963 3.4935 -1.9378 -7.8284 -2.5434 8.1415 -1.6173 -0.6877 -1.5402 4.9292 -1.1886
8.1171 2.1661 12.8054 4.2105 3.6406 4.1153 5.7445 4.3465 4.5829 4.3760 12.6371 5.2631 2.0880 4.9412 18.0029 6.0663 7.2960 6.1683 14.3364 6.6476
0.1014 -5.1539 5.0777 -3.1906 -2.6286 -3.0971 -6.0047 -3.5179 -2.0714 -3.3383 4.1990 -2.5285 -5.9231 -2.8734 9.4904 -1.8096 -0.1996 -1.6765 6.4401 -1.2230
9.4409 5.2012 10.8208 6.3018 6.4825 6.3319 3.7700 5.9621 5.3423 5.8844 9.7659 6.3088 5.7791 6.2557 11.0039 6.6789 9.1140 6.8797 10.4547 7.0136
0.2960 -3.9336 2.2316 -2.7310 -1.6107 -2.5452 -3.7924 -2.7244 -1.9219 -2.6244 1.5978 -2.1641 -2.2476 -2.1724 3.1155 -1.7031 1.1600 -1.4677 2.4565 -1.3241
9.0038 3.7253 12.9198 5.5023 3.7670 5.2111 5.6621 5.2754 5.0409 5.2460 11.8483 5.9599 2.0363 5.5609 15.9285 6.4638 8.6360 6.6431 13.0760 6.9509
0.4789 -4.4961 4.3543 -2.7882 -3.8358 -2.9636 -2.1813 -2.8522 -2.9799 -2.8682 3.4177 -2.1891 -5.9413 -2.5709 7.0973 -1.7293 0.3633 -1.5566 4.6693 -1.2584
7.8955 2.2961 14.0161 4.5395 4.2731 4.4950 6.8577 4.8293 4.7686 4.8217 13.0467 5.7052 0.6273 5.1861 18.9252 6.3666 7.6530 6.4732 14.2640 6.9334
-0.4663 -4.8335 5.5223 -2.8470 -3.4844 -2.9535 -1.3084 -2.7202 -3.4109 -2.8068 4.3128 -2.0404 -7.6428 -2.6156 10.3908 -1.4994 -0.2331 -1.3945 6.1038 -0.9623
8.1429 1.9977 10.3660 3.6190 3.4365 3.5886 7.8264 4.1836 4.7491 4.2541 13.1055 5.2024 -0.0401 4.6660 22.1676 6.1476 7.1293 6.2291 16.3552 6.8302
0.0010 -5.3562 4.5897 -3.4457 -4.4711 -3.6174 -0.5746 -3.1885 -3.3698 -3.2112 4.3310 -2.4008 -8.1866 -2.9954 12.7647 -1.6587 -1.1418 -1.6157 7.7336 -1.0460
7.2250 1.0100 16.1688 3.8746 2.5755 3.6570 7.4008 4.1837 4.5261 4.2264 14.1608 5.2861 -0.7621 4.6651 22.6906 6.1880 6.3691 6.2031 18.0327 6.9359
-1.0090 -6.4735 7.1305 -3.8985 -5.3463 -4.1413 -1.0681 -3.7082 -3.9139 -3.7339 5.2615 -2.7736 -8.7343 -3.3868 13.9646 -1.9252 -1.2247 -1.8670 9.2623 -1.1749
10.1806 8.1339 10.9553 8.6952 5.0149 8.0772 6.6233 7.8689 10.0279 8.1376 11.7266 8.5028 11.0666 8.7579 11.5784 9.0082 10.1342 9.1018 9.6661 9.1055
10.3857 8.1088 11.7960 8.8411 5.2582 8.2396 5.8004 7.8894 9.5957 8.1019 12.2183 8.5167 10.8000 8.7440 12.0361 9.0367 10.5240 9.1602 10.1150 9.1805
7.5452 7.5452 8.2904 7.9172 9.6032 8.4763 7.2877 8.1779 3.1958 7.1626 12.5981 8.0499 2.5543 7.2472 18.9297 8.6423 8.5516 8.6322 11.9732 8.8974
-0.7103 -0.7103 -0.1136 -0.4124 1.5256 0.2295 -1.1795 -0.1247 -5.2726 -1.1761 3.5978 -0.3961 -6.1907 -1.2453 8.8717 -0.0340 0.3361 0.0071 4.0853 0.3264
75

CC
ILM
on
thly
Ne
wsl
ett
er
TABLE 9: SECURITIES & MONEY MARKET (PRIMARY): COMPARATIVE DATA
Primary Market Analysis
primary market
analysis
Se
pte
mb
er
20
16
2016-17 2015-16 2015-16
(upto August 2016) (upto August 2015)
Dated Securities
GOI Borrowing
Total no of Issues (including reissues) 80 81 161Gross Amount Borrowed Excluding MSS (F.V ` Crore) 299000.00 309000.00 585000.00Weighted Average Maturity (years) 14.36 15.67 16.04Weighted Average Yield (%) 7.49 7.94 7.89
Devolvements on PDs (F.V ` Crore) 0.00 4863.34 10999.14Private Placements on RBI (F.V ` Crore) - - -Redemption (F.V ` Crore) 106837.54 91279.71 181892.67Net Borrowings(F.V ` Crore) 192162.46 217720.29 403107.33
Total Borrowing (F.V ` Crore) 299000.00 309000.00 585000.00Budgeted Borrowing (F.V ` Crore) 600000.00 600000.00 600000.00% Completed of Total Borrowing 49.83 51.50 97.50
Borrowing Under MSS
Total Outstanding (F.V. ` Crore) 0.00 0.00 0.00MSS Ceiling (F.V. ` Crore) 30000.00 50000.00 50000.00Outstanding as percent of Ceiling (%) 0.00 0.00 0.00
Purchases Under OMO
Dated Securities purchased under OMO 39 - 28Amount of OMO dated securities purchased (F.V. ` Crore) 90013.00 - 71410.01
Sale Under OMO
Dated Securities sold under OMO - 2 2Amount of OMO dated securities sold (F.V. ` Crore) - 8270.00 8270.00
Buybacks
Auctions (F.V. ` Crore) - - 37526.43NDS-OM (F.V. ` Crore) - - -
SDL
Total no of Issues 102 100 298
Gross Amount Borrowed (F.V ` Crore) 104755.00 91433.20 294560.32Weighted Average Coupon (%) 7.85 8.23 8.28
Cash Management Bill
Amount (F.V ` Crore) - - -Weighted Average Cut-off (%) - - -
91 Day Treasury Bills
Amount (F.V ` Crore) 316960.84 295935.75 686666.51Weighted Average Cut -off (%) 6.72 7.69 7.43
182 Day Treasury Bills
Amount (F.V ` Crore) 72025.00 69049.72 162188.61Weighted Average Cut -off (%) 6.83 7.71 7.45
364 Day Treasury Bill
Amount (F.V ` Crore) 68519.52 60988.00 154033.20Weighted Average Cut-off (%) 6.84 7.73 7.44
Benchmark Rates
Bank Rate(% p.a)(Effective Date) 7.00 (05-04-16) 8.25 (02-06-15) 7.00 (05-04-16)CRR Rate (% p.a.)(Effective Date) 4.00 (09-02-13) 4.00 (09-02-13) 4.00 (09-02-13)Reverse Repo Rate(%)(Effective Date) 6.00 (05-04-16) 6.25 (02-06-15) 6.00 (05-04-16)Repo Rate (%) (Effective Date) 6.50 (05-04-16) 7.25 (02-06-15) 6.50 (05-04-16)Call Money Range(%) 6.16 - 6.79 6.84 - 7.78 6.49 - 9.36
76
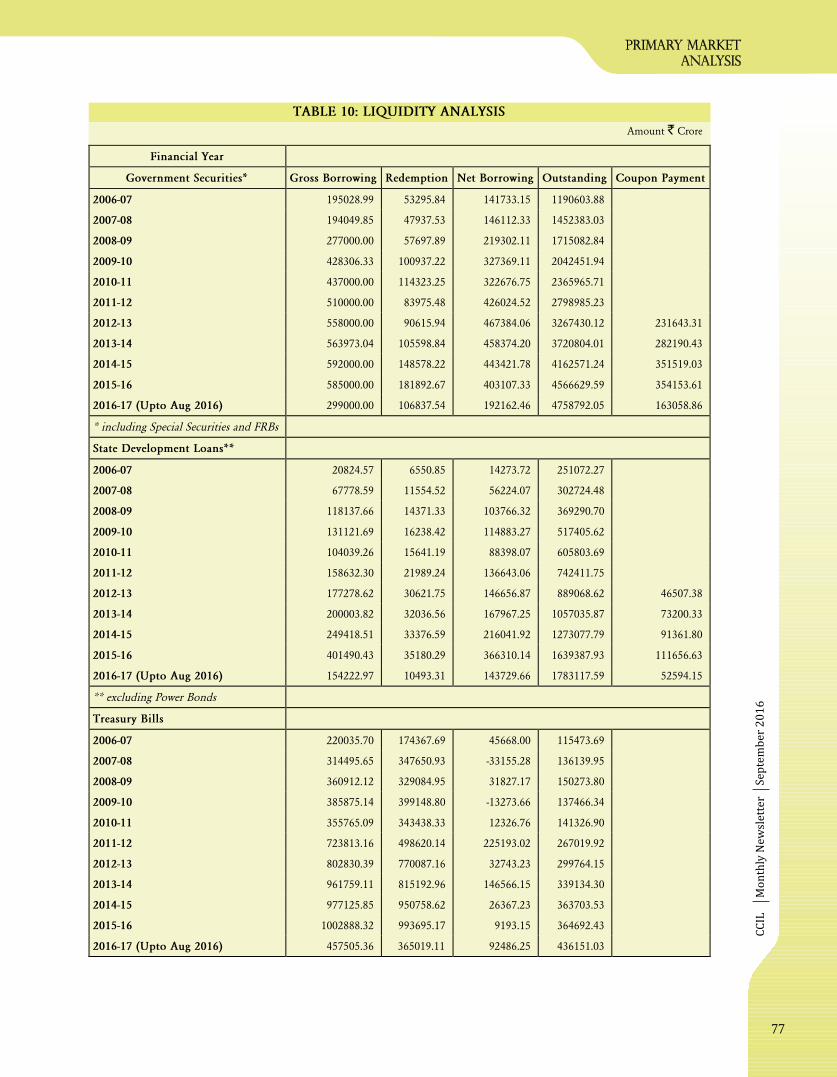
CC
ILM
on
thly
Ne
wsl
ett
er
TABLE 10: LIQUIDITY ANALYSIS
Amount Crore`
primary market
analysis
Se
pte
mb
er
20
16
Financial Year
Government Securities* Gross Borrowing Redemption Net Borrowing Outstanding Coupon Payment
2006-07 195028.99 53295.84 141733.15 1190603.88
2007-08 194049.85 47937.53 146112.33 1452383.03
2008-09 277000.00 57697.89 219302.11 1715082.84
2009-10 428306.33 100937.22 327369.11 2042451.94
2010-11 437000.00 114323.25 322676.75 2365965.71
2011-12 510000.00 83975.48 426024.52 2798985.23
2012-13 558000.00 90615.94 467384.06 3267430.12 231643.31
2013-14 563973.04 105598.84 458374.20 3720804.01 282190.43
2014-15 592000.00 148578.22 443421.78 4162571.24 351519.03
2015-16 585000.00 181892.67 403107.33 4566629.59 354153.61
2016-17 (Upto Aug 2016) 299000.00 106837.54 192162.46 4758792.05 163058.86
* including Special Securities and FRBs
State Development Loans**
2006-07 20824.57 6550.85 14273.72 251072.27
2007-08 67778.59 11554.52 56224.07 302724.48
2008-09 118137.66 14371.33 103766.32 369290.70
2009-10 131121.69 16238.42 114883.27 517405.62
2010-11 104039.26 15641.19 88398.07 605803.69
2011-12 158632.30 21989.24 136643.06 742411.75
2012-13 177278.62 30621.75 146656.87 889068.62 46507.38
2013-14 200003.82 32036.56 167967.25 1057035.87 73200.33
2014-15 249418.51 33376.59 216041.92 1273077.79 91361.80
2015-16 401490.43 35180.29 366310.14 1639387.93 111656.63
2016-17 (Upto Aug 2016) 154222.97 10493.31 143729.66 1783117.59 52594.15
** excluding Power Bonds
Treasury Bills
2006-07 220035.70 174367.69 45668.00 115473.69
2007-08 314495.65 347650.93 -33155.28 136139.95
2008-09 360912.12 329084.95 31827.17 150273.80
2009-10 385875.14 399148.80 -13273.66 137466.34
2010-11 355765.09 343438.33 12326.76 141326.90
2011-12 723813.16 498620.14 225193.02 267019.92
2012-13 802830.39 770087.16 32743.23 299764.15
2013-14 961759.11 815192.96 146566.15 339134.30
2014-15 977125.85 950758.62 26367.23 363703.53
2015-16 1002888.32 993695.17 9193.15 364692.43
2016-17 (Upto Aug 2016) 457505.36 365019.11 92486.25 436151.03
77

CCIL Monthly Newsletter
statis
tic
s
*Commenced operations from November 12, 2002, Cash and Tom settlement is with effect from February 5, 2004.
** Commenced operations from January 20, 2003.
Amount Crore`
Statistics
September 2016
TABLE 11: CCIL SETTLEMENT DETAILS
Outright Repo (First + Second Leg) Forex* CBLO**Settlement
Period Trades ValueAvg.
TradesAvg.Vol
Trades ValueAvg.
TradesAvg.Vol
TradesValue(USD
Million)
Avg.Trades
Avg. Vol(USD
Million)Trades Value
Avg.Trades
Avg.Vol
2002-03 191843 1076147 646 3623 23284 933509 78 3143 100232 136102 1101 1496 159 852 3 16
2003-04 243585 1575133 820 5303 41886 1887266 142 6419 330517 501342 1425 2161 3060 76851 10 262
2004-05 160682 1134222 550 3884 48726 3116185 167 10672 466327 899782 1976 3813 29351 976790 101 3345
2005-06 125509 864751 467 3215 51332 3386870 176 11599 489649 1179688 2084 5020 67463 2953134 229 10045
2006-07 137100 1021536 562 4187 58009 5112560 199 17509 606808 1776981 2550 7466 85881 4732271 292 16096
2007-08 188843 1653851 765 6696 53258 7893536 182 27033 757074 3133665 3181 13167 113277 8110828 385 27588
2008-09 245964 2160233 1047 9192 48561 8187856 169 28529 837520 3758904 3657 16414 118941 8824784 414 30748
2009-10 316956 2913890 1332 12243 57289 12142409 201 42605 883949 2988971 3843 12996 142052 15541378 498 54531
2010-11 332540 2870952 1346 11623 54842 8207508 187 27917 1150037 4191037 4792 17463 145383 12259745 495 41700
2011-12 412266 3488203 1732 14656 59573 7524816 205 25858 1283178 4642573 5579 20185 143949 11155428 495 38335
2012-13 658055 6592032 2731 27353 83141 10804188 288 37385 1396138 4830933 6018 20823 156099 12028040 538 41476
2013-14 820330 8956699 3390 37011 92795 14454046 317 49331 1512215 4743321 6490 20358 177918 17526192 605 59613
2014-15 977948 10156162 4126 42853 109391 15735514 381 54828 1731706 5297790 7595 23236 207241 16764597 722 58413
2015-16 883167 9728541 3665 40367 135623 17249279 490 62272 1885129 5489286 8056 23458 215151 17833529 777 64381
Apr-16 93171 1147680 5823 71730 10297 1323961 542 69682 146930 526607 9183 32913 14029 1222747 738 64355
May-16 82043 905382 3729 41154 14404 1884905 626 81952 171419 565364 8163 26922 17696 1621758 769 70511
Jun-16 94861 1123884 4312 51086 15672 1996670 653 83195 175473 576182 7976 26190 19250 1727229 802 71968
Jul-16 172945 2114509 8647 105725 14169 1972741 616 85771 142234 468812 7486 24674 18805 1733233 818 75358
Aug-16 155504 1963147 7405 93483 15594 2147312 678 93361 145081 502544 6909 23931 19962 1958326 868 85145
2016-17 (UptoAugust 2016)
598524 7254601 5926 71828 70136 9325589 626 83264 781137 2639509 7890 26662 89742 8263294 801 73779
78

CC
ILM
on
thly
Ne
wsl
ett
er
statistics
Se
pte
mb
er
20
16
TABLE 12: CATEGORYWISE BUYING ACTIVITY
Percent
* Call, Notice and Term Money segment.
TABLE 13: CATEGORYWISE SELLING ACTIVITY
Percent
* Call, Notice and Term Money segment.
Category OutrightReverse Repo
(Funds Lending)CBLO
LendingUncollateralised Money
Market Lending*Forex
IRS-MIBOR
IRS-MIFOR
Co-operative Banks 5.04 1.61 6.97 42.78 0.16 - -
Financial Institutions 0.33 0.03 3.14 - 0.00 - -
Foreign Banks 25.57 32.48 3.37 5.47 38.55 73.25 80.60
Insurance Companies 1.19 2.85 8.46 - - - -
Mutual Funds 8.14 19.35 50.29 - - - -
Others 1.37 0.00 9.68 - - - -
Primary Dealers 17.00 3.39 0.05 0.01 - 12.93 0.00
Private Sector Banks 13.85 13.59 4.92 15.02 25.67 13.50 19.40
Public Sector Banks 27.51 26.69 13.11 36.72 35.62 0.32 0.00
Total 100.00 100.00 100.00 100.00 100.00 100.00 100.00
Category Outright RepoCBLO
BorrowingUncollateralised Money
Market Borrowing*Forex
IRS-MIBOR
IRS-MIFOR
Co-operative Banks 4.88 0.22 0.86 0.81 0.16 - -
Financial Institutions 0.29 0.00 6.06 - 0.00 - -
Foreign Banks 26.75 20.50 8.69 11.33 39.06 63.85 83.17
Insurance Companies 0.98 0.08 0.18 - - - -
Mutual Funds 7.29 0.00 20.44 - - - -
Others 0.75 3.85 10.78 - - - -
Primary Dealers 18.40 32.88 3.94 29.95 - 20.65 0.00
Private Sector Banks 14.21 28.09 21.21 38.03 26.06 15.37 16.83
Public Sector Banks 26.46 14.36 27.83 19.88 34.72 0.12 0.00
Total 100.00 100.00 100.00 100.00 100.00 100.00 100.00
79
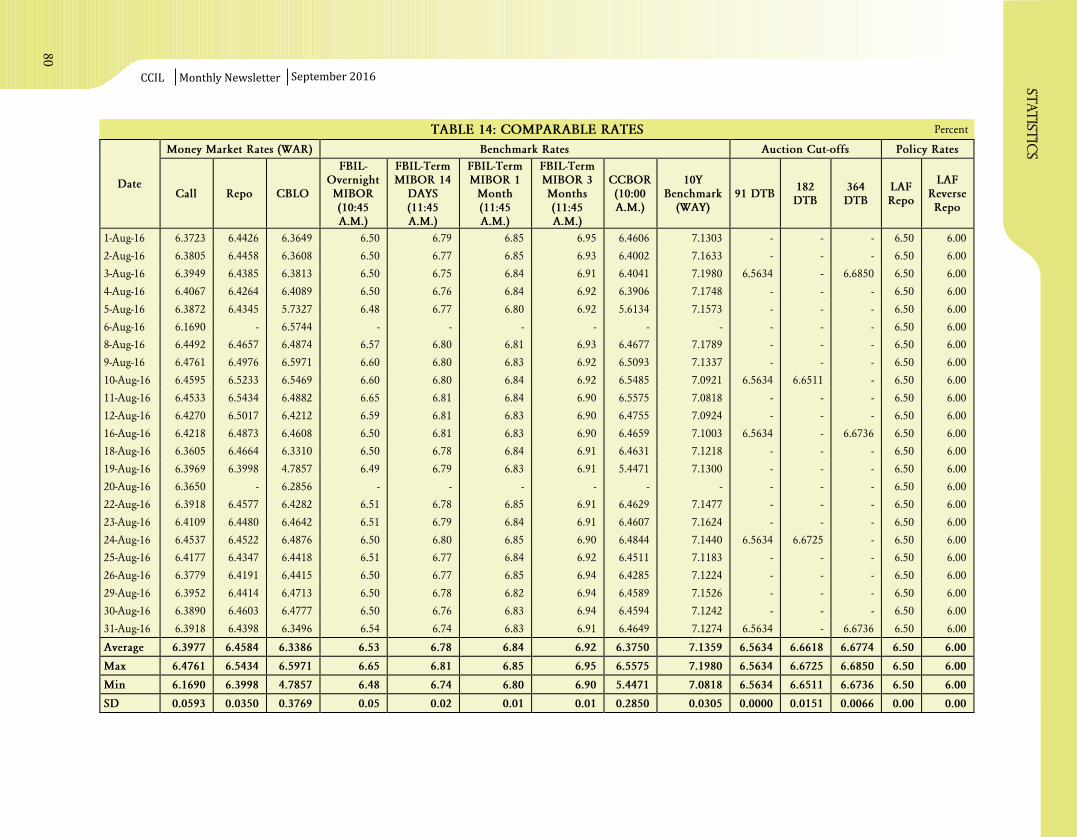
CCIL Monthly Newsletter
statis
tic
s
TABLE 14: COMPARABLE RATES Percent
September 2016
Money Market Rates (WAR) Benchmark Rates Auction Cut-offs Policy Rates
DateCall Repo CBLO
FBIL-OvernightMIBOR(10:45A.M.)
FBIL-TermMIBOR 14
DAYS(11:45A.M.)
FBIL-TermMIBOR 1
Month(11:45A.M.)
FBIL-TermMIBOR 3Months(11:45A.M.)
CCBOR(10:00A.M.)
10YBenchmark
(WAY)91 DTB
182DTB
364DTB
LAFRepo
LAFReverseRepo
1-Aug-16 6.3723 6.4426 6.3649 6.50 6.79 6.85 6.95 6.4606 7.1303 - - - 6.50 6.00
2-Aug-16 6.3805 6.4458 6.3608 6.50 6.77 6.85 6.93 6.4002 7.1633 - - - 6.50 6.00
3-Aug-16 6.3949 6.4385 6.3813 6.50 6.75 6.84 6.91 6.4041 7.1980 6.5634 - 6.6850 6.50 6.00
4-Aug-16 6.4067 6.4264 6.4089 6.50 6.76 6.84 6.92 6.3906 7.1748 - - - 6.50 6.00
5-Aug-16 6.3872 6.4345 5.7327 6.48 6.77 6.80 6.92 5.6134 7.1573 - - - 6.50 6.00
6-Aug-16 6.1690 - 6.5744 - - - - - - - - - 6.50 6.00
8-Aug-16 6.4492 6.4657 6.4874 6.57 6.80 6.81 6.93 6.4677 7.1789 - - - 6.50 6.00
9-Aug-16 6.4761 6.4976 6.5971 6.60 6.80 6.83 6.92 6.5093 7.1337 - - - 6.50 6.00
10-Aug-16 6.4595 6.5233 6.5469 6.60 6.80 6.84 6.92 6.5485 7.0921 6.5634 6.6511 - 6.50 6.00
11-Aug-16 6.4533 6.5434 6.4882 6.65 6.81 6.84 6.90 6.5575 7.0818 - - - 6.50 6.00
12-Aug-16 6.4270 6.5017 6.4212 6.59 6.81 6.83 6.90 6.4755 7.0924 - - - 6.50 6.00
16-Aug-16 6.4218 6.4873 6.4608 6.50 6.81 6.83 6.90 6.4659 7.1003 6.5634 - 6.6736 6.50 6.00
18-Aug-16 6.3605 6.4664 6.3310 6.50 6.78 6.84 6.91 6.4631 7.1218 - - - 6.50 6.00
19-Aug-16 6.3969 6.3998 4.7857 6.49 6.79 6.83 6.91 5.4471 7.1300 - - - 6.50 6.00
20-Aug-16 6.3650 - 6.2856 - - - - - - - - - 6.50 6.00
22-Aug-16 6.3918 6.4577 6.4282 6.51 6.78 6.85 6.91 6.4629 7.1477 - - - 6.50 6.00
23-Aug-16 6.4109 6.4480 6.4642 6.51 6.79 6.84 6.91 6.4607 7.1624 - - - 6.50 6.00
24-Aug-16 6.4537 6.4522 6.4876 6.50 6.80 6.85 6.90 6.4844 7.1440 6.5634 6.6725 - 6.50 6.00
25-Aug-16 6.4177 6.4347 6.4418 6.51 6.77 6.84 6.92 6.4511 7.1183 - - - 6.50 6.00
26-Aug-16 6.3779 6.4191 6.4415 6.50 6.77 6.85 6.94 6.4285 7.1224 - - - 6.50 6.00
29-Aug-16 6.3952 6.4414 6.4713 6.50 6.78 6.82 6.94 6.4589 7.1526 - - - 6.50 6.00
30-Aug-16 6.3890 6.4603 6.4777 6.50 6.76 6.83 6.94 6.4594 7.1242 - - - 6.50 6.00
31-Aug-16 6.3918 6.4398 6.3496 6.54 6.74 6.83 6.91 6.4649 7.1274 6.5634 - 6.6736 6.50 6.00
Average 6.3977 6.4584 6.3386 6.53 6.78 6.84 6.92 6.3750 7.1359 6.5634 6.6618 6.6774 6.50 6.00
Max 6.4761 6.5434 6.5971 6.65 6.81 6.85 6.95 6.5575 7.1980 6.5634 6.6725 6.6850 6.50 6.00
Min 6.1690 6.3998 4.7857 6.48 6.74 6.80 6.90 5.4471 7.0818 6.5634 6.6511 6.6736 6.50 6.00
SD 0.0593 0.0350 0.3769 0.05 0.02 0.01 0.01 0.2850 0.0305 0.0000 0.0151 0.0066 0.00 0.00
80
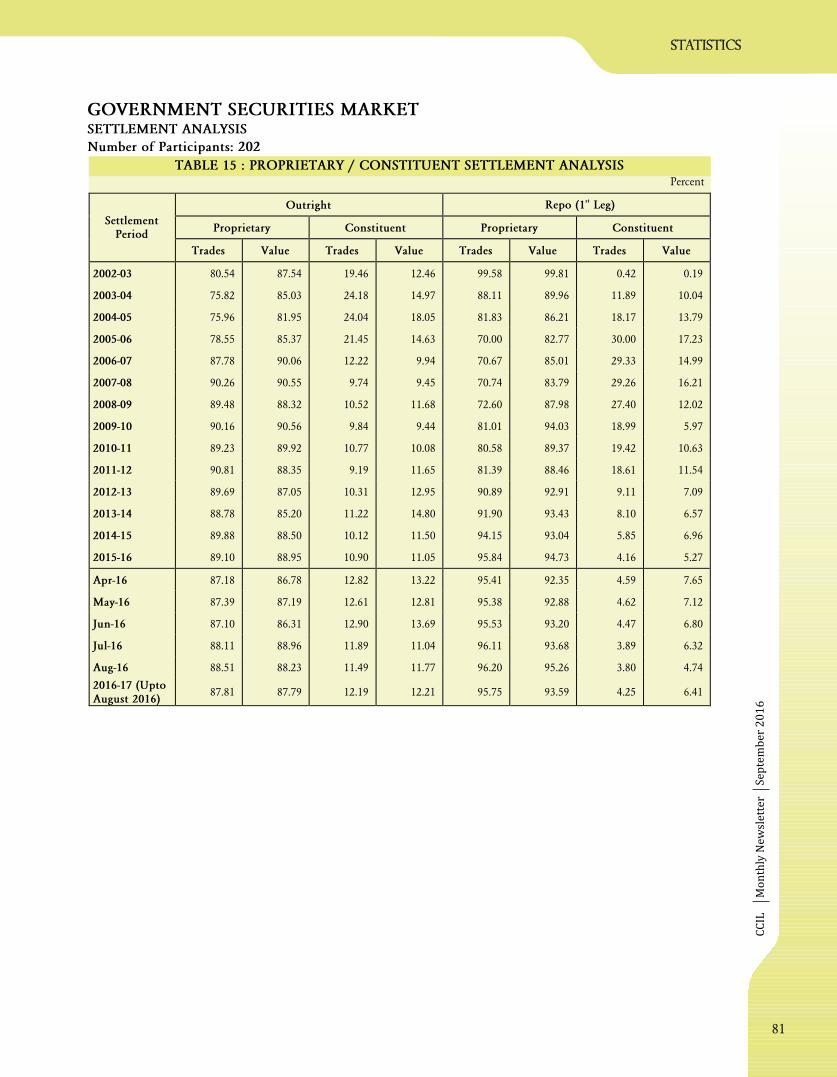
CC
ILM
on
thly
Ne
wsl
ett
er
statistics
TABLE 15 : PROPRIETARY / CONSTITUENT SETTLEMENT ANALYSIS
GOVERNMENT SECURITIES MARKETSETTLEMENT ANALYSIS
Number of Participants: 202
Percent
Se
pte
mb
er
20
16
Repo (1 Leg)st
Outright
Proprietary Constituent Proprietary ConstituentSettlement
Period
Trades Value Trades Value Trades Value Trades Value
2002-03 80.54 87.54 19.46 12.46 99.58 99.81 0.42 0.19
2003-04 75.82 85.03 24.18 14.97 88.11 89.96 11.89 10.04
2004-05 75.96 81.95 24.04 18.05 81.83 86.21 18.17 13.79
2005-06 78.55 85.37 21.45 14.63 70.00 82.77 30.00 17.23
2006-07 87.78 90.06 12.22 9.94 70.67 85.01 29.33 14.99
2007-08 90.26 90.55 9.74 9.45 70.74 83.79 29.26 16.21
2008-09 89.48 88.32 10.52 11.68 72.60 87.98 27.40 12.02
2009-10 90.16 90.56 9.84 9.44 81.01 94.03 18.99 5.97
2010-11 89.23 89.92 10.77 10.08 80.58 89.37 19.42 10.63
2011-12 90.81 88.35 9.19 11.65 81.39 88.46 18.61 11.54
2012-13 89.69 87.05 10.31 12.95 90.89 92.91 9.11 7.09
2013-14 88.78 85.20 11.22 14.80 91.90 93.43 8.10 6.57
2014-15 89.88 88.50 10.12 11.50 94.15 93.04 5.85 6.96
2015-16 89.10 88.95 10.90 11.05 95.84 94.73 4.16 5.27
Apr-16 87.18 86.78 12.82 13.22 95.41 92.35 4.59 7.65
May-16 87.39 87.19 12.61 12.81 95.38 92.88 4.62 7.12
Jun-16 87.10 86.31 12.90 13.69 95.53 93.20 4.47 6.80
Jul-16 88.11 88.96 11.89 11.04 96.11 93.68 3.89 6.32
Aug-16 88.51 88.23 11.49 11.77 96.20 95.26 3.80 4.74
2016-17 (UptoAugust 2016)
87.81 87.79 12.19 12.21 95.75 93.59 4.25 6.41
81
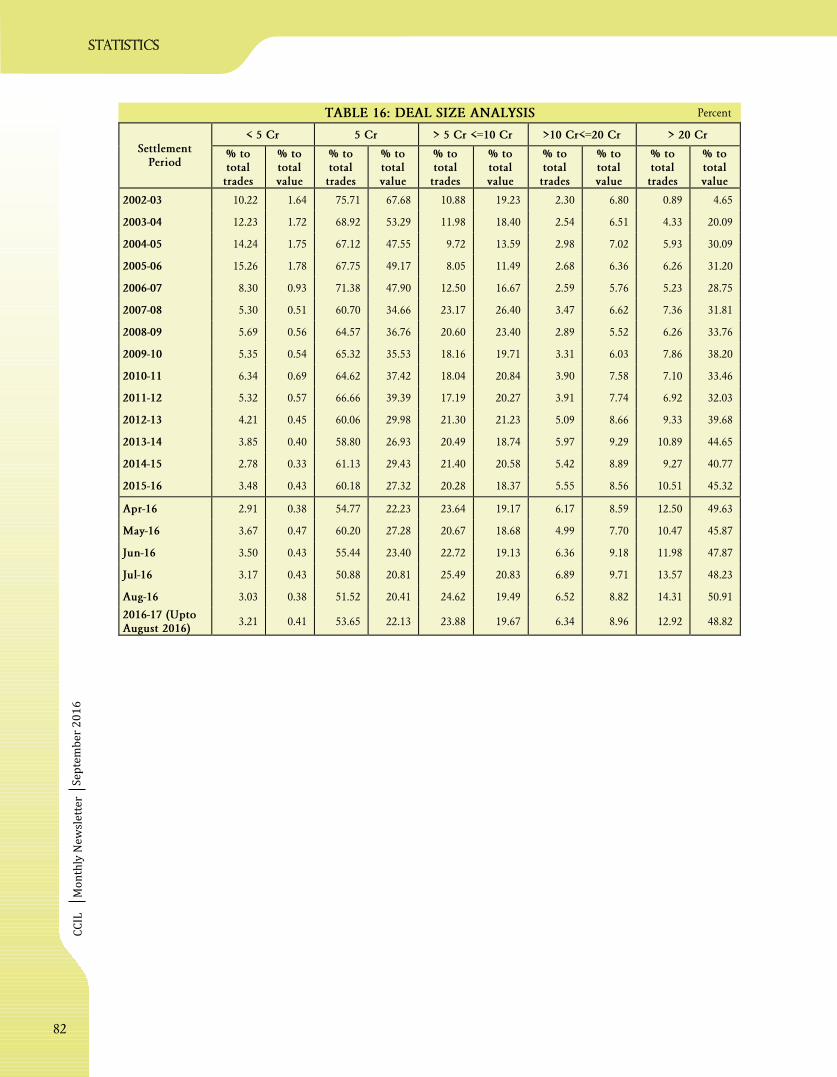
TABLE 16: DEAL SIZE ANALYSIS Percent
CC
ILM
on
thly
Ne
wsl
ett
er
statistics
Se
pte
mb
er
20
16
< 5 Cr 5 Cr > 5 Cr <=10 Cr >10 Cr<=20 Cr > 20 CrSettlement
Period% tototaltrades
% tototalvalue
% tototaltrades
% tototalvalue
% tototaltrades
% tototalvalue
% tototaltrades
% tototalvalue
% tototaltrades
% tototalvalue
2002-03 10.22 1.64 75.71 67.68 10.88 19.23 2.30 6.80 0.89 4.65
2003-04 12.23 1.72 68.92 53.29 11.98 18.40 2.54 6.51 4.33 20.09
2004-05 14.24 1.75 67.12 47.55 9.72 13.59 2.98 7.02 5.93 30.09
2005-06 15.26 1.78 67.75 49.17 8.05 11.49 2.68 6.36 6.26 31.20
2006-07 8.30 0.93 71.38 47.90 12.50 16.67 2.59 5.76 5.23 28.75
2007-08 5.30 0.51 60.70 34.66 23.17 26.40 3.47 6.62 7.36 31.81
2008-09 5.69 0.56 64.57 36.76 20.60 23.40 2.89 5.52 6.26 33.76
2009-10 5.35 0.54 65.32 35.53 18.16 19.71 3.31 6.03 7.86 38.20
2010-11 6.34 0.69 64.62 37.42 18.04 20.84 3.90 7.58 7.10 33.46
2011-12 5.32 0.57 66.66 39.39 17.19 20.27 3.91 7.74 6.92 32.03
2012-13 4.21 0.45 60.06 29.98 21.30 21.23 5.09 8.66 9.33 39.68
2013-14 3.85 0.40 58.80 26.93 20.49 18.74 5.97 9.29 10.89 44.65
2014-15 2.78 0.33 61.13 29.43 21.40 20.58 5.42 8.89 9.27 40.77
2015-16 3.48 0.43 60.18 27.32 20.28 18.37 5.55 8.56 10.51 45.32
Apr-16 2.91 0.38 54.77 22.23 23.64 19.17 6.17 8.59 12.50 49.63
May-16 3.67 0.47 60.20 27.28 20.67 18.68 4.99 7.70 10.47 45.87
Jun-16 3.50 0.43 55.44 23.40 22.72 19.13 6.36 9.18 11.98 47.87
Jul-16 3.17 0.43 50.88 20.81 25.49 20.83 6.89 9.71 13.57 48.23
Aug-16 3.03 0.38 51.52 20.41 24.62 19.49 6.52 8.82 14.31 50.91
2016-17 (UptoAugust 2016)
3.21 0.41 53.65 22.13 23.88 19.67 6.34 8.96 12.92 48.82
82

CC
ILM
on
thly
Ne
wsl
ett
er
statistics
Se
pte
mb
er
20
16
TABLE 18: T+2 TRADES - HISTORICAL SETTLEMENT SUMMARY Amount Crore`
TABLE 17: T+2 SETTLEMENT SUMMARY Amount Crore`
As confirmed on trade date
Date Trades Face Value
1-Aug-16 8 1228
2-Aug-16 23 1705
3-Aug-16 7 208
4-Aug-16 17 1155
5-Aug-16 15 1509
8-Aug-16 8 430
9-Aug-16 18 1756
10-Aug-16 17 2277
11-Aug-16 7 300
12-Aug-16 9 1453
16-Aug-16 5 435
18-Aug-16 13 383
19-Aug-16 8 683
22-Aug-16 13 685
23-Aug-16 13 1217
24-Aug-16 7 1281
25-Aug-16 6 575
26-Aug-16 10 431
29-Aug-16 7 730
30-Aug-16 18 1610
31-Aug-16 8 1007
Total 237 21058
Month Trades Face Value
2015-16 2139 124016
Apr-16 208 14058
May-16 196 11095
Jun-16 259 15822
Jul-16 236 19431
Aug-16 237 21058
2016-17 (Upto August 2016) 1136 81465
83

CC
ILM
on
thly
Ne
wsl
ett
er
statistics
Se
pte
mb
er
20
16
TABLE 19: INSTRUMENT WISE BREAKUP OF OUTRIGHT TRADES
Amount Crore`
Cen. Govt. Dated Securities Treasury Bills State Development LoansSettlement
Period ValueAvg.Value
% Share ValueAvg.Value
% Share ValueAvg.Value
% Share
2002-03 1032185 3475 95.91 37443 126 3.48 6519 22 0.61
2003-04 1458665 4911 92.61 102299 344 6.49 14169 48 0.90
2004-05 862820 2955 76.07 246703 845 21.75 24700 85 2.18
2005-06 657213 2443 76.00 189839 706 21.95 17700 66 2.05
2006-07 883248 4723 86.46 126956 679 12.43 11332 61 1.11
2007-08 1467704 5942 88.74 171914 696 10.39 14234 58 0.86
2008-09 1955412 8321 90.52 170436 725 7.89 34385 146 1.59
2009-10 2480850 10424 85.14 363283 1526 12.47 69757 293 2.39
2010-11 2552181 10333 88.90 275095 1114 9.58 43677 177 1.52
2011-12 3099108 13021 88.85 345237 1451 9.90 43859 184 1.26
2012-13 5920929 24568 89.82 552943 2294 8.39 118159 490 1.79
2013-14 7968661 32928 88.97 833191 3443 9.30 154847 640 1.73
2014-15 9149608 38606 90.09 823470 3475 8.11 183083 773 1.80
2015-16 8557672 35509 87.96 854390 3545 8.78 316479 1313 3.25
Apr-16 1031370 64461 89.87 83673 5230 7.29 32636 2040 2.84
May-16 813233 36965 89.82 57151 2598 6.31 34997 1591 3.87
Jun-16 983212 44691 87.48 95031 4320 8.46 45641 2075 4.06
Jul-16 1962723 98136 92.82 93145 4657 4.41 58641 2932 2.77
Aug-16 1819612 86648 92.69 81368 3875 4.14 62167 2960 3.17
2016-17 (UptoAugust 2016)
6610151 65447 91.12 410368 4063 5.66 234083 2318 3.23
84
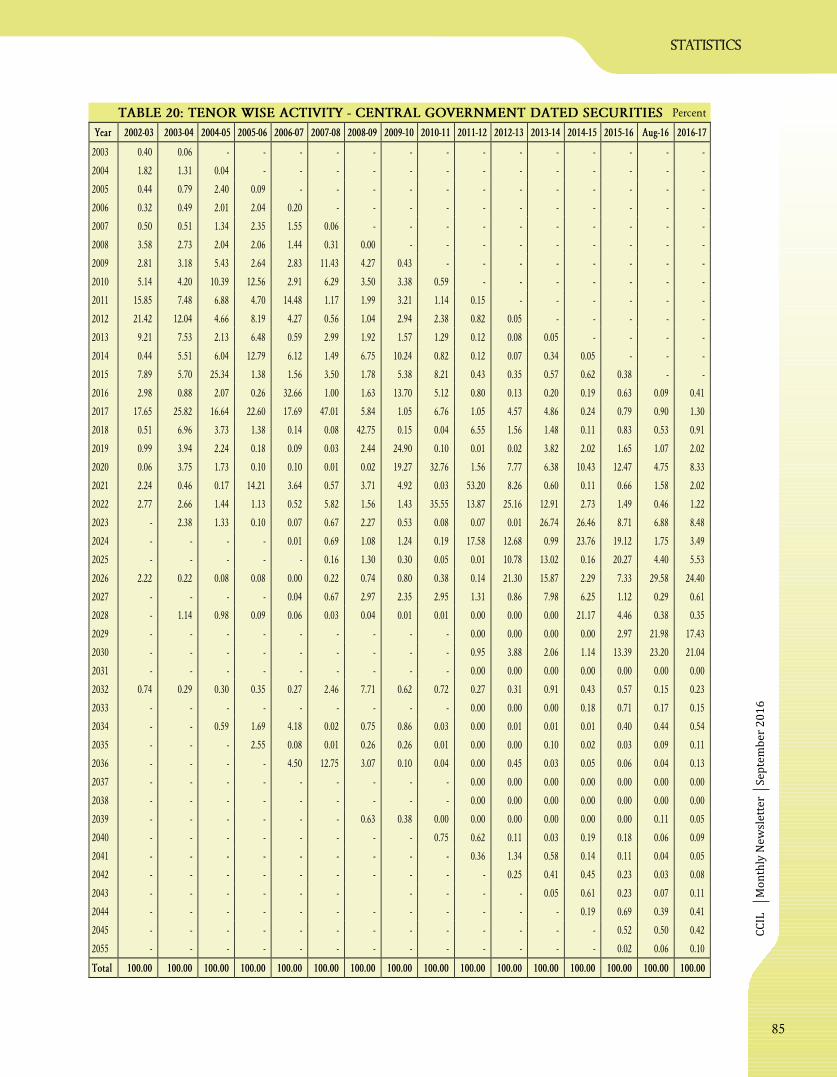
CC
ILM
on
thly
Ne
wsl
ett
er
statistics
Se
pte
mb
er
20
16
TABLE 20: TENOR WISE ACTIVITY - CENTRAL GOVERNMENT DATED SECURITIES Percent
Year 2002-03 2003-04 2004-05 2005-06 2006-07 2007-08 2008-09 2009-10 2010-11 2011-12 2012-13 2013-14 2014-15 2015-16 Aug-16 2016-17
2003 0.40 0.06 - - - - - - - - - - - - - -
2004 1.82 1.31 0.04 - - - - - - - - - - - - -
2005 0.44 0.79 2.40 0.09 - - - - - - - - - - - -
2006 0.32 0.49 2.01 2.04 0.20 - - - - - - - - - - -
2007 0.50 0.51 1.34 2.35 1.55 0.06 - - - - - - - - - -
2008 3.58 2.73 2.04 2.06 1.44 0.31 0.00 - - - - - - - - -
2009 2.81 3.18 5.43 2.64 2.83 11.43 4.27 0.43 - - - - - - - -
2010 5.14 4.20 10.39 12.56 2.91 6.29 3.50 3.38 0.59 - - - - - - -
2011 15.85 7.48 6.88 4.70 14.48 1.17 1.99 3.21 1.14 0.15 - - - - - -
2012 21.42 12.04 4.66 8.19 4.27 0.56 1.04 2.94 2.38 0.82 0.05 - - - - -
2013 9.21 7.53 2.13 6.48 0.59 2.99 1.92 1.57 1.29 0.12 0.08 0.05 - - - -
2014 0.44 5.51 6.04 12.79 6.12 1.49 6.75 10.24 0.82 0.12 0.07 0.34 0.05 - - -
2015 7.89 5.70 25.34 1.38 1.56 3.50 1.78 5.38 8.21 0.43 0.35 0.57 0.62 0.38 - -
2016 2.98 0.88 2.07 0.26 32.66 1.00 1.63 13.70 5.12 0.80 0.13 0.20 0.19 0.63 0.09 0.41
2017 17.65 25.82 16.64 22.60 17.69 47.01 5.84 1.05 6.76 1.05 4.57 4.86 0.24 0.79 0.90 1.30
2018 0.51 6.96 3.73 1.38 0.14 0.08 42.75 0.15 0.04 6.55 1.56 1.48 0.11 0.83 0.53 0.91
2019 0.99 3.94 2.24 0.18 0.09 0.03 2.44 24.90 0.10 0.01 0.02 3.82 2.02 1.65 1.07 2.02
2020 0.06 3.75 1.73 0.10 0.10 0.01 0.02 19.27 32.76 1.56 7.77 6.38 10.43 12.47 4.75 8.33
2021 2.24 0.46 0.17 14.21 3.64 0.57 3.71 4.92 0.03 53.20 8.26 0.60 0.11 0.66 1.58 2.02
2022 2.77 2.66 1.44 1.13 0.52 5.82 1.56 1.43 35.55 13.87 25.16 12.91 2.73 1.49 0.46 1.22
2023 - 2.38 1.33 0.10 0.07 0.67 2.27 0.53 0.08 0.07 0.01 26.74 26.46 8.71 6.88 8.48
2024 - - - - 0.01 0.69 1.08 1.24 0.19 17.58 12.68 0.99 23.76 19.12 1.75 3.49
2025 - - - - - 0.16 1.30 0.30 0.05 0.01 10.78 13.02 0.16 20.27 4.40 5.53
2026 2.22 0.22 0.08 0.08 0.00 0.22 0.74 0.80 0.38 0.14 21.30 15.87 2.29 7.33 29.58 24.40
2027 - - - - 0.04 0.67 2.97 2.35 2.95 1.31 0.86 7.98 6.25 1.12 0.29 0.61
2028 - 1.14 0.98 0.09 0.06 0.03 0.04 0.01 0.01 0.00 0.00 0.00 21.17 4.46 0.38 0.35
2029 - - - - - - - - - 0.00 0.00 0.00 0.00 2.97 21.98 17.43
2030 - - - - - - - - - 0.95 3.88 2.06 1.14 13.39 23.20 21.04
2031 - - - - - - - - - 0.00 0.00 0.00 0.00 0.00 0.00 0.00
2032 0.74 0.29 0.30 0.35 0.27 2.46 7.71 0.62 0.72 0.27 0.31 0.91 0.43 0.57 0.15 0.23
2033 - - - - - - - - - 0.00 0.00 0.00 0.18 0.71 0.17 0.15
2034 - - 0.59 1.69 4.18 0.02 0.75 0.86 0.03 0.00 0.01 0.01 0.01 0.40 0.44 0.54
2035 - - - 2.55 0.08 0.01 0.26 0.26 0.01 0.00 0.00 0.10 0.02 0.03 0.09 0.11
2036 - - - - 4.50 12.75 3.07 0.10 0.04 0.00 0.45 0.03 0.05 0.06 0.04 0.13
2037 - - - - - - - - - 0.00 0.00 0.00 0.00 0.00 0.00 0.00
2038 - - - - - - - - - 0.00 0.00 0.00 0.00 0.00 0.00 0.00
2039 - - - - - - 0.63 0.38 0.00 0.00 0.00 0.00 0.00 0.00 0.11 0.05
2040 - - - - - - - - 0.75 0.62 0.11 0.03 0.19 0.18 0.06 0.09
2041 - - - - - - - - - 0.36 1.34 0.58 0.14 0.11 0.04 0.05
2042 - - - - - - - - - - 0.25 0.41 0.45 0.23 0.03 0.08
2043 - - - - - - - - - - 0.05 0.61 0.23 0.07 0.11
2044 - - - - - - - - - - - - 0.19 0.69 0.39 0.41
2045 - - - - - - - - - - - - - 0.52 0.50 0.42
2055 - - - - - - - - - - - - - 0.02 0.06 0.10
Total 100.00 100.00 100.00 100.00 100.00 100.00 100.00 100.00 100.00 100.00 100.00 100.00 100.00 100.00 100.00 100.00
85

statistics
CC
ILM
on
thly
Ne
wsl
ett
er
Se
pte
mb
er
20
16
TABLE 21: NETTING FACTOR: FUNDS
Netting Factor denotes the extent of actual reduction achieved through multi-lateral offsetting of individual member fund
obligations (arising out of every trade) to a single net fund obligation. This process has significantly reduced individual
funding requirements for every member and also achieved reduction in market liquidity risk.
Amount Crore`
NETTING FACTOR
Settlement Period Gross Net Netting Factor (%)
2002-03 2324017 653519 71.88
2003-04 4038385 979592 75.74
2004-05 4582506 1037355 77.36
2005-06 4460523 905062 79.71
2006-07 6275182 968185 84.57
2007-08 9646481 1596638 83.45
2008-09 10756665 1674892 84.43
2009-10 15502457 2642001 82.96
2010-11 11233653 2561298 77.20
2011-12 10996999 2191680 80.07
2012-13 17585265 3101477 82.36
2013-14 23207382 4256748 81.66
2014-15 26141572 4216733 83.87
2015-16 27433525 4352880 84.13
Apr-16 2526936 335746 86.71
May-16 2855684 392078 86.27
Jun-16 3179982 496910 84.37
Jul-16 4381799 531170 87.88
Aug-16 4299624 526654 87.75
2016-17 (Upto August 2016) 17244025 2282558 86.76
86

CC
ILM
on
thly
Ne
wsl
ett
er
statistics
TABLE 22: NETTING FACTOR: SECURITIES Amount Crore`
Se
pte
mb
er
20
16
Settlement Period Gross Net Netting Factor (%)
2004-05 4250540 2462556 42.06
2005-06 4384775 2012523 54.10
2006-07 6123933 2418739 60.50
2007-08 9536455 3776777 60.40
2008-09 10365006 3750501 63.82
2009-10 15056277 6461619 57.08
2010-11 11078385 4883399 55.92
2011-12 11011992 4139464 62.41
2012-13 17395376 6568929 62.24
2013-14 23302555 9419626 59.58
2014-15 25891676 10026109 61.28
2015-16 26977725 10438154 61.31
Apr-16 2471641 959576 61.18
May-16 2790287 1091745 60.87
Jun-16 3120554 1238317 60.32
Jul-16 4251970 1446559 65.98
Aug-16 4110460 1353667 67.07
2016-17 (Upto August 2016) 16744911 6089864 63.63
87

statis
tic
s
CCIL Monthly Newsletter
TABLE 23: LIQUIDITY ANALYSIS FOR CENTRAL GOVERNMENT SECURITIES TRANSACTED DURING THE MONTH
September 2016
Sr.No.
SecurityMaturity
Date
Daystraded(in last
12months)
Valuetraded inlast 12months(FV in
` Crore)
Percentshare inlast 12monthsValue
No. ofTrades
(August,2016)
Value forAugust -
2016(FV in
` Crore)
Percentshare in(August2016)
Outstanding(FV in
` Crore)
TurnoverRatio*
AverageDaily
TradingValue inlast 12months(FV in
` Crore)
AverageDaily
TradingValue inAugust -
2016 (FV in` Crore)
1 7.59% G.S. 2026 11-Jan-26 155 1900129 16.62 43737 531130 29.19 95000 559 12259 25292
2 7.59% G.S. 2029 20-Mar-29 209 1406302 12.30 33976 399983 21.98 80000 500 6729 19047
3 7.88% G.S. 2030 19-Mar-30 240 1924658 16.84 21086 218945 12.03 89000 246 8019 10426
4 7.61% G.S. 2030 09-May-30 80 388380 3.40 17401 201190 11.06 40000 503 4855 9580
5 7.68% G.S. 2023 15-Dec-23 240 895506 7.83 8581 106086 5.83 88132 120 3731 5052
6 7.72% G.S. 2025 25-May-25 240 1527057 13.36 7176 77595 4.26 86000 90 6363 3695
7 8.27% G.S. 2020 09-Jun-20 240 830212 7.26 2984 57417 3.16 73000 79 3459 2734
8 7.80% G.S. 2021 11-Apr-21 228 146906 1.29 1229 25510 1.40 66000 39 644 1215
9 7.35% G.S. 2024 22-Jun-24 239 293513 2.57 1810 22061 1.21 83168 27 1228 1051
10 7.28% G.S. 2019 03-Jun-19 240 180373 1.58 664 15723 0.86 53000 30 752 749
11 8.12% G.S. 2020 10-Dec-20 240 149874 1.31 577 14680 0.81 76000 19 624 699
12 7.16% G.S. 2023 20-May-23 238 94524 0.83 767 12623 0.69 77000 16 397 601
13 6.35% G.S. 2020 02-Jan-20 237 131447 1.15 541 10008 0.55 61000 16 555 477
14 8.40% G.S. 2024 28-Jul-24 240 241846 2.12 442 9122 0.50 90000 10 1008 434
15 8.13% G.S. 2045 22-Jun-45 240 61855 0.54 718 9093 0.50 69000 13 258 433
16 7.83% G.S.2018 11-Apr-18 229 82310 0.72 333 8557 0.47 73000 12 359 407
17 8.17% G.S. 2044 01-Dec-44 232 55951 0.49 661 7060 0.39 84000 8 241 336
18 8.60% G.S. 2028 02-Jun-28 225 57599 0.50 462 6510 0.36 84000 8 256 310
19 8.08% G.S. 2022 02-Aug-22 227 81953 0.72 270 6504 0.36 68969 9 361 310
20 8.83% G.S. 2023 25-Nov-23 231 54663 0.48 161 5945 0.33 83000 7 237 283
21 8.15% G.S. 2026 24-Nov-26 230 60748 0.53 520 5654 0.31 86489 7 264 269
22 7.73% G.S. 2034 19-Dec-34 211 57552 0.50 638 5236 0.29 40000 13 273 249
23 7.99% G.S. 2017 09-Jul-17 104 18419 0.16 23 4437 0.24 71000 6 177 493
88

CCIL Monthly Newsletter
statis
tic
s
TABLE 23: LIQUIDITY ANALYSIS FOR CENTRAL GOVERNMENT SECURITIES TRANSACTED DURING THE MONTH (Contd.)
September 2016
Sr.No.
SecurityMaturity
Date
Daystraded(in last
12months)
Valuetraded inlast 12months(FV in
` Crore)
Percentshare inlast 12monthsValue
No. ofTrades
(August,2016)
Value forAugust -
2016(FV in
` Crore)
Percentshare in(August2016)
Outstanding(FV in
` Crore)
TurnoverRatio*
AverageDaily
TradingValue inlast 12months(FV in
` Crore)
AverageDaily
TradingValue inAugust -
2016 (FV in` Crore)
24 7.46% G.S. 2017 28-Aug-17 96 10367 0.09 39 4221 0.23 57887 7 108 352
25 8.07% G.S. 2017 15-Jan-17 147 32220 0.28 97 3541 0.19 66965 5 219 197
26 8.28% G.S. 2027 21-Sep-27 208 45300 0.40 257 3315 0.18 89252 4 218 174
27 8.24% G.S. 2033 10-Nov-33 227 46518 0.41 307 3179 0.17 87000 4 205 159
28 8.79% G.S. 2021 08-Nov-21 185 28490 0.25 91 3106 0.17 83000 4 154 163
29 7.49% G.S. 2017 16-Apr-17 171 31941 0.28 88 2927 0.16 58000 5 187 209
30 6.90% G.S. 2019 13-Jul-19 178 28099 0.25 165 2887 0.16 45000 6 158 137
31 7.50% G.S. 2034 10-Aug-34 147 11948 0.10 523 2787 0.15 80000 3 81 139
32 7.80% G.S. 2020 03-May-20 226 54057 0.47 135 2628 0.14 75000 4 239 138
33 8.20% G.S. 2025 24-Sep-25 147 16834 0.15 171 2554 0.14 90000 3 115 128
34 6.83% G.S. 2039 19-Jan-39 72 3292 0.03 704 1985 0.11 13000 15 46 99
35 8.19% G.S. 2020 16-Jan-20 115 15488 0.14 75 1736 0.10 74000 2 135 91
36 7.02% G.S. 2016 17-Aug-16 204 49936 0.44 55 1675 0.09 - - 245 279
37 9.20% G.S. 2030 30-Sep-30 217 29564 0.26 181 1601 0.09 61885 3 136 84
38 7.40% G.S. 2035 09-Sep-35 177 9371 0.08 534 1559 0.09 52000 3 53 78
39 8.07% G.S. 2017 (JUL) 03-Jul-17 167 41708 0.36 45 1308 0.07 50000 3 250 93
40 9.23% G.S. 2043 23-Dec-43 208 15752 0.14 108 1305 0.07 79472 2 76 73
41 8.32% G.S. 2032 02-Aug-32 172 14361 0.13 120 1292 0.07 89434 1 83 68
42 8.26% G.S. 2027 02-Aug-27 165 12405 0.11 97 1201 0.07 73427 2 75 71
43 8.33% G.S. 2026 09-Jul-26 118 10841 0.09 112 1118 0.06 90000 1 92 102
44 8.30% G.S. 2040 02-Jul-40 146 13785 0.12 99 1070 0.06 90000 1 94 67
45 7.72% G.S. 2055 26-Oct-55 90 7980 0.07 151 1035 0.06 19000 5 89 54
46 7.95% G.S. 2032 28-Aug-32 209 15762 0.14 138 911 0.05 89000 1 75 54
89

statis
tic
s
TABLE 23: LIQUIDITY ANALYSIS FOR CENTRAL GOVERNMENT SECURITIES TRANSACTED DURING THE MONTH (Contd.)
CCIL Monthly Newsletter September 2016
Sr.No.
SecurityMaturity
Date
Daystraded(in last
12months)
Valuetraded inlast 12months(FV in
` Crore)
Percentshare inlast 12monthsValue
No. ofTrades
(August,2016)
Value forAugust -
2016(FV in
` Crore)
Percentshare in(August2016)
Outstanding(FV in
` Crore)
TurnoverRatio*
AverageDaily
TradingValue inlast 12months(FV in
` Crore)
AverageDaily
TradingValue inAugust -
2016 (FV in` Crore)
47 8.15% G.S. 2022 11-Jun-22 106 8871 0.08 39 865 0.05 83000 1 84 62
48 8.24% G.S. 2027 15-Feb-27 211 29184 0.26 114 844 0.05 93389 1 138 44
49 8.83% G.S. 2041 12-Dec-41 130 6741 0.06 49 711 0.04 90000 1 52 55
50 8.33% G.S. 2036 07-Jun-36 130 11861 0.10 89 707 0.04 86000 1 91 51
51 6.05% G.S. 2019 02-Feb-19 152 23741 0.21 37 666 0.04 53000 1 156 56
52 9.15% G.S. 2024 14-Nov-24 90 10354 0.09 29 611 0.03 92000 1 115 56
53 8.30% G.S. 2042 31-Dec-42 178 17070 0.15 64 506 0.03 90000 1 96 51
54 8.97% G.S. 2030 05-Dec-30 90 3033 0.03 29 474 0.03 90000 1 34 47
55 8.35% G.S. 2022 14-May-22 175 24062 0.21 17 468 0.03 77000 1 137 67
56 5.69% G.S. 2018 25-Sep-18 87 9815 0.09 15 455 0.03 16130 3 113 65
57 8.28% G.S. 2032 15-Feb-32 127 6876 0.06 69 440 0.02 90687 0 54 28
58 6.17% G.S. 2023 12-Jun-23 69 1307 0.01 146 426 0.02 14000 3 19 28
59 8.24% G.S. 2018 22-Apr-18 60 6245 0.05 15 397 0.02 75000 1 104 66
60 6.90% OMC SB 2026 04-Feb-26 60 3076 0.03 34 395 0.02 21942 2 51 79
61 8.13% G.S. 2022 21-Sep-22 155 23811 0.21 23 356 0.02 70495 1 154 51
62 6.01% G.S. 2028 25-Mar-28 83 995 0.01 123 261 0.01 15000 2 12 17
63 6.30% G.S. 2023 09-Apr-23 52 564 0.00 70 175 0.01 13000 1 11 13
64 6.13% G.S. 2028 04-Jun-28 41 378 0.00 87 157 0.01 11000 1 9 20
65 8.20% G.S. 2022 15-Feb-22 103 9961 0.09 20 151 0.01 57632 0 97 15
66 6.25% G.S. 2018 02-Jan-18 63 2754 0.02 16 120 0.01 16887 1 44 20
67 6.05% G.S. 2019 12-Jun-19 65 1369 0.01 17 117 0.01 11000 1 21 12
68 10.45% G.S. 2018 30-Apr-18 4 126 0.00 1 100 0.01 3716 3 32 100
69 8.33% G.S. 2032 21-Sep-32 10 515 0.00 2 65 0.00 1522 4 52 65
90

CCIL Monthly Newsletter
statis
tic
s
TABLE 23: LIQUIDITY ANALYSIS FOR CENTRAL GOVERNMENT SECURITIES TRANSACTED DURING THE MONTH (Contd.)
*Turnover Ratio has been calculated as trading value as a percentage of of respective security.outstanding
September 2016
Sr.No.
SecurityMaturity
Date
Daystraded(in last
12months)
Valuetraded inlast 12months(FV in
` Crore)
Percentshare inlast 12monthsValue
No. ofTrades
(August,2016)
Value forAugust -
2016(FV in
` Crore)
Percentshare in(August2016)
Outstanding(FV in
` Crore)
TurnoverRatio*
AverageDaily
TradingValue inlast 12months(FV in
` Crore)
AverageDaily
TradingValue inAugust -
2016 (FV in` Crore)
70 7.94% G.S. 2021 24-May-21 48 780 0.01 10 53 0.00 49000 0 16 9
71 10.25% G.S. 2021 30-May-21 40 406 0.00 7 27 0.00 26213 0 10 7
72 5.64% G.S. 2019 02-Jan-19 24 889 0.01 3 15 0.00 10000 0 37 8
73 8.00% OMC SB 2026 23-Mar-26 17 119 0.00 2 10 0.00 10000 0 7 5
74 12.60% G.S. 2018 23-Nov-18 35 13442 0.12 2 9 0.00 12632 0 384 9
75 10.03% G.S. 2019 09-Aug-19 12 164 0.00 3 6 0.00 6000 0 14 3
76 8.35% SBI SB 2024 27-Mar-24 6 70 0.00 1 5 0.00 9996 0 12 5
77 8.30% FERT SB 2023 07-Dec-23 23 138 0.00 2 5 0.00 3880 0 6 3
78 10.18% G.S. 2026 11-Sep-26 17 137 0.00 2 2 0.00 15000 0 8 2
79 7% FERT SB 2022 10-Dec-22 15 785 0.01 2 2 0.00 6072 0 52 1
80 7.95% OMC SB 2025 18-Jan-25 7 14 0.00 1 1 0.00 11257 0 2 1
81 8.15% FCI SB 2022 16-Oct-22 30 157 0.00 2 1 0.00 5000 0 5 1
82 8.23% FCI SB 2027 12-Feb-27 15 168 0.00 1 0 0.00 6200 0 11 0
83Other Securities Traded DuringThe Past 12 Months But NotTraded During The Month
22203 0.19
Total 11429977 100.00 150192 1819613 100.00
91

CC
ILM
on
thly
Ne
wsl
ett
er
statistics
Se
pte
mb
er
20
16
TABLE 24: MARKET SHARE OF TOP 'N' SECURITIES Percent
TABLE 25: MARKET SHARE OF MEMBERS IN OUTRIGHT SETTLEMENT Percent
Settlement Period Top 5 Top 10 Top 15 Top 20
2003-04 39.01 57.30 70.28 79.43
2004-05 49.97 66.31 74.56 80.36
2005-06 63.75 82.82 89.67 92.85
2006-07 74.88 88.82 92.37 94.88
2007-08 66.35 83.84 92.54 95.79
2008-09 61.07 73.89 81.92 87.35
2009-10 60.71 79.08 86.48 90.54
2010-11 71.77 88.33 93.91 96.39
2011-12 85.51 94.15 97.07 98.68
2012-13 77.59 94.68 97.63 98.70
2013-14 68.11 90.79 95.61 97.70
2014-15 79.28 91.80 96.45 97.74
2015-16 66.26 82.74 88.47 91.80
Apr-16 66.05 82.34 87.92 91.38
May-16 65.11 80.17 86.12 90.14
Jun-16 69.58 83.30 89.53 92.28
Jul-16 72.90 89.70 93.34 95.44
Aug-16 80.09 90.99 94.04 95.94
2016-17 (UptoAugust 2016)
69.51 86.32 90.95 93.29
Settlement Period Top 5 Top 10 Top 15 Top 20
2002-03 20.17 32.59 42.33 50.14
2003-04 19.02 31.58 40.63 48.49
2004-05 21.20 35.51 46.10 54.37
2005-06 21.84 37.47 49.11 57.64
2006-07 28.93 45.34 57.08 65.89
2007-08 27.42 43.65 56.17 65.31
2008-09 28.33 45.51 57.23 65.63
2009-10 28.74 44.32 55.32 63.35
2010-11 34.01 49.31 59.66 67.17
2011-12 30.04 47.85 60.10 68.81
2012-13 31.30 48.48 59.42 67.31
2013-14 33.33 49.48 59.63 67.34
2014-15 31.06 46.52 56.59 64.50
2015-16 32.08 48.64 58.60 65.67
Apr-16 33.00 47.55 56.88 64.27
May-16 35.33 48.65 58.19 65.84
Jun-16 28.06 46.74 56.32 63.50
Jul-16 32.26 46.46 56.56 63.48
Aug-16 31.50 47.95 56.96 64.34
2016-17 (UptoAugust 2016)
31.90 47.35 56.88 64.13
92

CC
ILM
on
thly
Ne
wsl
ett
er
statistics
Se
pte
mb
er
20
16
TABLE 26: MARKET SHARE OF TOP FIVE MEMBERS (CATEGORYWISE) Percent
TRADING ANALYSIS
TABLE 27: TRADING PLATFORM ANALYSIS OF OUTRIGHT TRADES Amount Crore`
CategoriesCooperative
BanksForeignBanks
Public SectorBanks
Private SectorBanks
MutualFunds
PrimaryDealers
No ofMembers
54 36 27 20 27 7
2002-03 87.04 75.91 41.44 50.65 59.76 62.00
2003-04 76.72 75.48 43.88 53.33 55.47 62.96
2004-05 82.30 77.94 51.20 69.12 56.99 61.90
2005-06 75.10 77.91 53.45 71.55 56.49 56.95
2006-07 77.20 76.04 52.57 73.68 68.00 72.44
2007-08 86.70 74.99 55.29 73.01 70.20 86.20
2008-09 82.16 76.26 52.53 76.79 66.10 86.83
2009-10 72.08 79.86 47.99 79.61 64.19 82.44
2010-11 62.05 83.05 48.99 74.60 66.49 84.80
2011-12 61.15 75.91 51.48 74.43 68.01 82.38
2012-13 55.50 77.32 48.92 83.43 65.36 82.08
2013-14 55.31 81.15 45.68 86.53 65.08 85.35
2014-15 58.68 82.14 47.58 80.35 66.19 87.29
2015-16 60.56 86.10 50.22 83.16 63.90 89.18
Apr-16 56.03 86.43 43.78 77.02 64.46 90.79
May-16 49.10 89.62 45.68 79.36 66.51 88.58
Jun-16 51.53 87.47 51.09 79.92 61.42 90.77
Jul-16 57.37 87.94 46.97 78.22 63.16 93.51
Aug-16 61.55 91.65 51.17 86.86 72.15 97.61
2016-17 (UptoAugust 2016)
56.94 88.90 48.11 80.60 65.81 93.44
OTC NDS-OM TotalPeriod
Trades % Share Value % Share Trades % Share Value % Share Trades Value
2005-06 38809 50.36 292515 56.98 38251 49.64 220890 43.02 77060 513405
2006-07 35322 25.79 368704 36.11 101641 74.21 652270 63.89 136963 1020974
2007-08 31020 16.43 453226 27.42 157823 83.57 1199919 72.58 188843 1653145
2008-09 35288 14.35 613229 28.36 210585 85.65 1548906 71.64 245873 2162135
2009-10 40736 12.87 798397 27.41 275769 87.13 2113896 72.59 316505 2912293
2010-11 42710 12.85 622558 21.73 289636 87.15 2241886 78.27 332346 2864444
2011-12 44908 10.89 731938 20.96 367495 89.11 2760795 79.04 412403 3492733
2012-13 57757 8.79 1179701 17.91 599316 91.21 5408334 82.09 657073 6588036
2013-14 57545 7.03 1501310 16.79 760964 92.97 7437982 83.21 818509 8939292
2014-15 57293 5.85 1635278 16.09 921361 94.15 8531024 83.91 978654 10166302
2015-16 60560 6.86 1891410 19.42 822803 93.14 7846591 80.58 883363 9738000
Apr-16 5459 5.71 215622 18.48 90180 94.29 951109 81.52 95639 1166731
May-16 5818 7.54 187443 21.86 71371 92.46 670028 78.14 77189 857471
Jun-16 6679 6.59 223994 18.60 94738 93.41 979979 81.40 101417 1203973
Jul-16 9007 5.29 237828 11.44 161397 94.71 1841820 88.56 170404 2079648
Aug-16 8347 5.39 264665 13.40 146617 94.61 1710290 86.60 154964 1974956
2016-17 (UptoAugust 2016)
35310 5.89 1129553 15.51 564303 94.11 6153226 84.49 599613 7282779
93

statistics
CC
ILM
on
thly
Ne
wsl
ett
er
Se
pte
mb
er
20
16
TABLE 28A: WHEN-ISSUED TRADING DETAILS Amount Crore`
TABLE 28: WHEN-ISSUED TRADING - HISTORICAL Amount Crore`
TABLE 29: MARKET SHARE - PROPRIETARY TRADES*Percent
* Trade Data
Security Description Maturity Date Trades Value
7.59% G.S. 2026 11-Jan-26 47 605
6.97% G.S. 2026 06-Sep-26 29 245
7.59% G.S. 2029 20-Mar-29 1 10
7.61% G.S. 2030 09-May-30 32 290
8.13% G.S. 2045 22-Jun-45 1 10
Total 110 1160
Period Trades Value
2006-07 154 1270
2007-08 169 1530
2008-09 335 3000
2009-10 320 3180
2010-11 306 2715
2011-12 391 2985
2012-13 1586 11805
2013-14 1406 11295
2014-15 1232 11265
2015-16 679 5755
Apr-16 166 1345
May-16 112 990
Jun-16 188 1890
Jul-16 61 555
Aug-16 110 1160
2016-17 (Upto August 2016) 637 5940
Buy SellCategory
Trades Value Trades Value
Co-operative Banks 8.43 4.67 8.46 4.56
Financial Institutions 0.35 0.32 0.21 0.28
Foreign Banks 25.40 25.01 21.81 26.38
Insurance Companies 1.09 1.16 0.94 0.96
Mutual Funds 5.04 8.19 5.71 7.19
Others 1.22 0.89 1.19 0.74
Primary Dealers 15.88 16.81 18.99 18.31
Private Sector Banks 8.95 9.55 9.67 9.96
Provident Funds 0.02 0.08 0.00 0.00
Public Sector Banks 27.26 26.94 27.20 26.00
94

CC
ILM
on
thly
Ne
wsl
ett
er
statistics
Se
pte
mb
er
20
16
TABLE 30: MARKET SHARE - CONSTITUENT TRADES*Percent
*Trade data
Percent
TABLE 31: TURNOVER RATIO
Buy SellConstituent Category
Trades Value Trades Value
Banks 0.31 0.37 0.25 0.31
Co-operative Banks 2.32 0.95 1.96 0.77
Corporates 2.34 3.35 2.87 3.33
FIIs 0.10 0.65 0.09 0.60
Insurance Companies 0.46 0.52 0.33 0.30
Mutual Funds 0.04 0.04 0.03 0.04
Finance Cos. 0.00 0.01 0.00 0.00
Others 0.20 0.23 0.19 0.17
Provident Funds 0.59 0.23 0.11 0.10
Current Month Previous Month 3 Months 6 Months 12 Months
3.81% 4.26% 1.56% 1.52% 1.70%
95
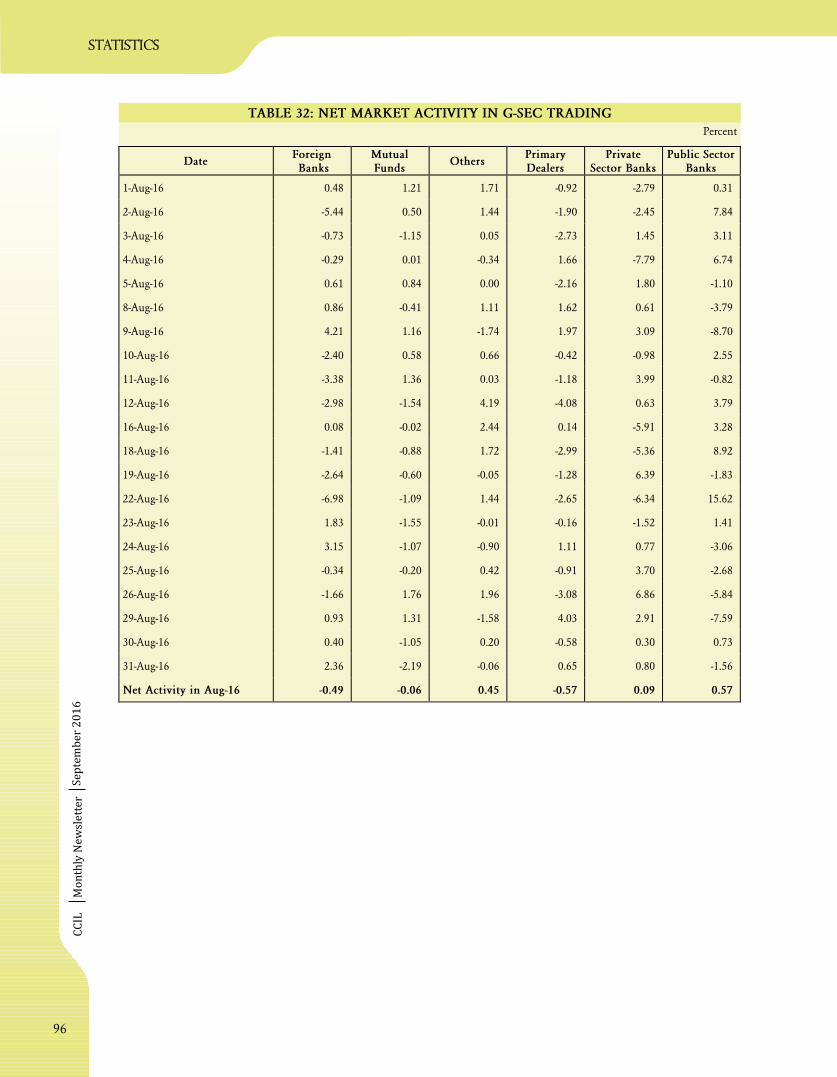
statistics
CC
ILM
on
thly
Ne
wsl
ett
er
TABLE 32: NET MARKET ACTIVITY IN G-SEC TRADING
Percent
Se
pte
mb
er
20
16
DateForeignBanks
MutualFunds
OthersPrimaryDealers
PrivateSector Banks
Public SectorBanks
1-Aug-16 0.48 1.21 1.71 -0.92 -2.79 0.31
2-Aug-16 -5.44 0.50 1.44 -1.90 -2.45 7.84
3-Aug-16 -0.73 -1.15 0.05 -2.73 1.45 3.11
4-Aug-16 -0.29 0.01 -0.34 1.66 -7.79 6.74
5-Aug-16 0.61 0.84 0.00 -2.16 1.80 -1.10
8-Aug-16 0.86 -0.41 1.11 1.62 0.61 -3.79
9-Aug-16 4.21 1.16 -1.74 1.97 3.09 -8.70
10-Aug-16 -2.40 0.58 0.66 -0.42 -0.98 2.55
11-Aug-16 -3.38 1.36 0.03 -1.18 3.99 -0.82
12-Aug-16 -2.98 -1.54 4.19 -4.08 0.63 3.79
16-Aug-16 0.08 -0.02 2.44 0.14 -5.91 3.28
18-Aug-16 -1.41 -0.88 1.72 -2.99 -5.36 8.92
19-Aug-16 -2.64 -0.60 -0.05 -1.28 6.39 -1.83
22-Aug-16 -6.98 -1.09 1.44 -2.65 -6.34 15.62
23-Aug-16 1.83 -1.55 -0.01 -0.16 -1.52 1.41
24-Aug-16 3.15 -1.07 -0.90 1.11 0.77 -3.06
25-Aug-16 -0.34 -0.20 0.42 -0.91 3.70 -2.68
26-Aug-16 -1.66 1.76 1.96 -3.08 6.86 -5.84
29-Aug-16 0.93 1.31 -1.58 4.03 2.91 -7.59
30-Aug-16 0.40 -1.05 0.20 -0.58 0.30 0.73
31-Aug-16 2.36 -2.19 -0.06 0.65 0.80 -1.56
Net Activity in Aug-16 -0.49 -0.06 0.45 -0.57 0.09 0.57
96

CCIL Monthly Newsletter
statis
tic
s
TABLE 33: TRADING SUMMARY
Amount Crore`
*Amount in USD Million
September 2016
Central Government SDL T-Bills Total Repo CBLO Forex*Date
Trades Value Trades Value Trades Value Trades Value Trades Value Trades Value Trades Value
1-Aug-16 10164 116007 249 6036 69 4518 10482 126561 304 40405 911 83344 7249 23987
2-Aug-16 6213 73396 196 4212 72 3061 6481 80670 368 43049 890 81281 4791 20786
3-Aug-16 6999 79248 133 2020 118 9835 7250 91103 354 43920 885 75798 7375 25494
4-Aug-16 6883 88450 179 3833 103 4905 7165 97189 357 42832 813 70897 5896 23748
5-Aug-16 8276 104767 146 3171 35 961 8457 108900 498 66623 742 55003 8575 26729
6-Aug-16 0 0 155 9411 - -
8-Aug-16 6513 73202 175 2793 70 2352 6758 78346 353 48018 896 88335 6173 19760
9-Aug-16 12202 150065 261 4111 82 2018 12545 156194 360 48672 943 88568 6680 19586
10-Aug-16 10408 126487 358 7855 134 7414 10900 141756 343 43652 931 86733 6508 19543
11-Aug-16 7877 96241 264 4221 67 2598 8208 103060 380 47403 945 94445 7308 19996
12-Aug-16 5110 68126 128 1405 67 2723 5305 72253 372 52641 1066 115381 8741 23808
16-Aug-16 4746 59923 102 1649 79 7027 4927 68599 362 55652 1010 110486 6753 19733
18-Aug-16 5618 71974 122 1546 84 5841 5824 79362 359 55840 974 101654 5714 18381
19-Aug-16 7979 103314 173 1300 47 1882 8199 106496 602 94887 854 66202 7126 21345
20-Aug-16 0 0 170 9964 - -
22-Aug-16 6594 85737 104 1035 69 3585 6767 90357 356 48996 975 102939 5892 19122
23-Aug-16 6193 72209 157 2408 36 1753 6386 76370 345 50857 1000 105225 6833 19569
24-Aug-16 8093 94024 205 3231 130 12594 8428 109850 353 51775 944 106341 6357 19550
25-Aug-16 6371 79133 125 1534 48 757 6544 81424 346 45881 947 102672 6745 19681
26-Aug-16 4443 50298 165 2783 41 1872 4649 54952 335 43977 925 100850 6625 19538
29-Aug-16 5734 62977 137 1130 72 2593 5943 66701 348 48640 961 96049 5887 18225
30-Aug-16 7553 94730 283 4491 58 1846 7894 101067 367 53412 995 105503 6256 21248
31-Aug-16 5475 70180 239 3332 138 10235 5852 83748 360 52626 1030 101245 11597 82714
Total 149444 1820490 3901 64097 1619 90369 154964 1974956 7822 1079758 19962 1958326 145081 502544
Average 7116 86690 186 3052 77 4303 7379 94046 340 46946.01 868 85145 6909 23931
MarketShare (%)
96.44 92.18 2.52 3.25 1.04 4.58
97
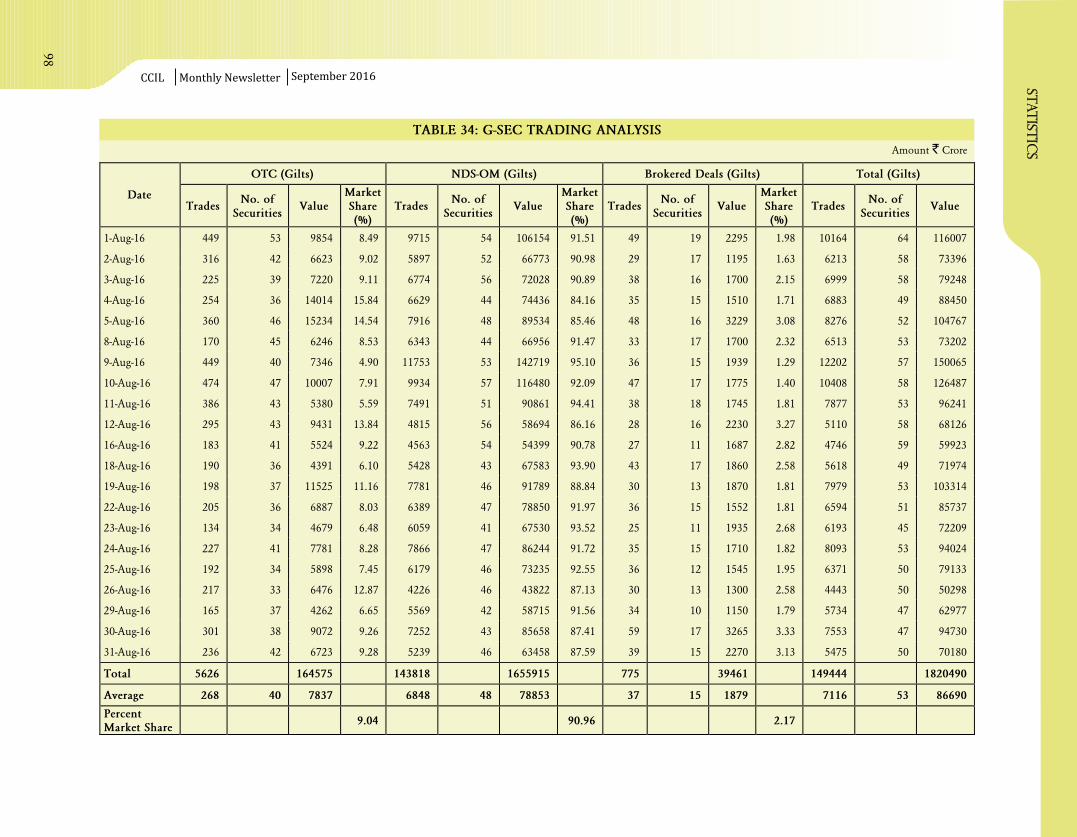
TABLE 34: G-SEC TRADING ANALYSIS
Amount Crore`
statis
tic
s
CCIL Monthly Newsletter September 2016
OTC (Gilts) NDS-OM (Gilts) Brokered Deals (Gilts) Total (Gilts)
DateTrades
No. ofSecurities
ValueMarketShare(%)
TradesNo. of
SecuritiesValue
MarketShare(%)
TradesNo. of
SecuritiesValue
MarketShare(%)
TradesNo. of
SecuritiesValue
1-Aug-16 449 53 9854 8.49 9715 54 106154 91.51 49 19 2295 1.98 10164 64 116007
2-Aug-16 316 42 6623 9.02 5897 52 66773 90.98 29 17 1195 1.63 6213 58 73396
3-Aug-16 225 39 7220 9.11 6774 56 72028 90.89 38 16 1700 2.15 6999 58 79248
4-Aug-16 254 36 14014 15.84 6629 44 74436 84.16 35 15 1510 1.71 6883 49 88450
5-Aug-16 360 46 15234 14.54 7916 48 89534 85.46 48 16 3229 3.08 8276 52 104767
8-Aug-16 170 45 6246 8.53 6343 44 66956 91.47 33 17 1700 2.32 6513 53 73202
9-Aug-16 449 40 7346 4.90 11753 53 142719 95.10 36 15 1939 1.29 12202 57 150065
10-Aug-16 474 47 10007 7.91 9934 57 116480 92.09 47 17 1775 1.40 10408 58 126487
11-Aug-16 386 43 5380 5.59 7491 51 90861 94.41 38 18 1745 1.81 7877 53 96241
12-Aug-16 295 43 9431 13.84 4815 56 58694 86.16 28 16 2230 3.27 5110 58 68126
16-Aug-16 183 41 5524 9.22 4563 54 54399 90.78 27 11 1687 2.82 4746 59 59923
18-Aug-16 190 36 4391 6.10 5428 43 67583 93.90 43 17 1860 2.58 5618 49 71974
19-Aug-16 198 37 11525 11.16 7781 46 91789 88.84 30 13 1870 1.81 7979 53 103314
22-Aug-16 205 36 6887 8.03 6389 47 78850 91.97 36 15 1552 1.81 6594 51 85737
23-Aug-16 134 34 4679 6.48 6059 41 67530 93.52 25 11 1935 2.68 6193 45 72209
24-Aug-16 227 41 7781 8.28 7866 47 86244 91.72 35 15 1710 1.82 8093 53 94024
25-Aug-16 192 34 5898 7.45 6179 46 73235 92.55 36 12 1545 1.95 6371 50 79133
26-Aug-16 217 33 6476 12.87 4226 46 43822 87.13 30 13 1300 2.58 4443 50 50298
29-Aug-16 165 37 4262 6.65 5569 42 58715 91.56 34 10 1150 1.79 5734 47 62977
30-Aug-16 301 38 9072 9.26 7252 43 85658 87.41 59 17 3265 3.33 7553 47 94730
31-Aug-16 236 42 6723 9.28 5239 46 63458 87.59 39 15 2270 3.13 5475 50 70180
Total 5626 164575 143818 1655915 775 39461 149444 1820490
Average 268 40 7837 6848 48 78853 37 15 1879 7116 53 86690
PercentMarket Share
9.04 90.96 2.17
98

TABLE 35: T-BILL TRADING ANALYSIS
Amount Crore`
CCIL Monthly Newsletter
statis
tic
s
September 2016
OTC (T-Bills) NDS-OM (T-Bills) Brokered Deals (T-Bills) Total (T-Bills)
DateTrades
No. ofSecurities
ValueMarketShare(%)
TradesNo. of
SecuritiesValue
MarketShare(%)
TradesNo. of
SecuritiesValue
MarketShare(%)
TradesNo. of
SecuritiesValue
1-Aug-16 26 13 2916 64.53 43 17 1602 35.47 8 5 1604 35.50 69 26 4518
2-Aug-16 27 13 1830 59.78 45 16 1231 40.22 4 2 675 22.05 72 24 3061
3-Aug-16 67 13 8217 83.56 51 12 1617 16.44 3 3 660 6.71 118 20 9835
4-Aug-16 46 22 3246 66.17 57 20 1659 33.83 2 2 250 5.10 103 29 4905
5-Aug-16 9 7 121 12.57 26 9 840 87.43 0 0 0 0.00 35 14 961
8-Aug-16 14 13 328 13.93 56 19 2024 86.07 0 0 0 0.00 70 25 2352
9-Aug-16 18 11 179 8.85 64 19 1839 91.15 3 2 115 5.70 82 24 2018
10-Aug-16 63 22 5668 76.45 71 20 1746 23.55 7 5 590 7.96 134 29 7414
11-Aug-16 37 19 1932 74.37 30 12 666 25.63 3 2 325 12.51 67 23 2598
12-Aug-16 18 15 1137 41.78 49 11 1585 58.22 2 2 325 11.94 67 18 2723
16-Aug-16 36 11 6119 87.08 43 14 908 12.92 2 2 730 10.39 79 18 7027
18-Aug-16 37 21 4083 69.91 47 17 1758 30.09 3 3 955 16.35 84 27 5841
19-Aug-16 21 14 1097 58.28 26 7 785 41.72 3 2 600 31.88 47 15 1882
22-Aug-16 25 14 1374 38.33 44 11 2211 61.67 10 4 845 23.57 69 17 3585
23-Aug-16 13 8 542 30.90 23 11 1211 69.10 1 1 5 0.29 36 18 1753
24-Aug-16 77 16 9881 78.46 53 22 2713 21.54 3 3 693 5.50 130 29 12594
25-Aug-16 27 13 385 50.82 21 12 372 49.17 1 1 50 6.60 48 19 757
26-Aug-16 23 11 1297 69.29 18 14 575 30.71 3 3 350 18.70 41 24 1872
29-Aug-16 24 13 691 23.87 48 12 1902 65.76 2 2 300 10.37 72 21 2593
30-Aug-16 15 12 346 17.12 43 13 1500 74.26 1 1 174 8.63 58 20 1846
31-Aug-16 84 15 8556 80.52 54 18 1680 15.81 4 4 390 3.67 138 23 10235
Total 707 59943 912 30426 65 9636 1619 90369
Average 34 14 2854 43 15 1449 3 2 459 77 22 4303
PercentMarket Share
66.33 33.67 10.66
99

statis
tic
s
CCIL Monthly Newsletter
TABLE 36: SDL TRADING ANALYSIS
Amount Crore`
September 2016
OTC (SDLs) NDS-OM (SDLs) Brokered Deals (SDLs) Total (SDLs)
DateTrades
No. ofSecurities
ValueMarketShare(%)
TradesNo. of
SecuritiesValue
MarketShare(%)
TradesNo. of
SecuritiesValue
MarketShare(%)
TradesNo. of
SecuritiesValue
1-Aug-16 108 57 2214 36.68 141 51 3822 63.32 8 7 243 4.03 249 95 6036
2-Aug-16 92 61 2318 55.03 104 26 1894 44.97 6 5 67 1.60 196 78 4212
3-Aug-16 61 33 1357 67.15 72 35 664 32.85 10 7 314 15.57 133 60 2020
4-Aug-16 96 44 2597 67.75 83 25 1236 32.25 18 13 710 18.52 179 71 3833
5-Aug-16 69 31 2047 64.55 77 29 1124 35.45 13 8 343 10.83 146 53 3171
8-Aug-16 89 35 2131 76.30 86 43 662 23.70 10 8 174 6.23 175 74 2793
9-Aug-16 113 56 1940 47.19 148 51 2171 52.81 13 11 375 9.12 261 95 4111
10-Aug-16 152 64 4682 59.60 206 53 3173 40.40 18 14 430 5.47 358 100 7855
11-Aug-16 118 52 2763 65.46 146 40 1458 34.54 15 12 350 8.29 264 80 4221
12-Aug-16 63 36 928 66.03 65 38 477 33.97 6 4 180 12.81 128 62 1405
16-Aug-16 50 32 1239 75.13 52 26 410 24.87 4 4 55 3.33 102 48 1649
18-Aug-16 74 49 1069 69.12 48 22 477 30.88 3 2 40 2.59 122 68 1546
19-Aug-16 93 48 772 59.40 80 35 528 40.60 11 8 157 12.05 173 74 1300
22-Aug-16 55 31 569 54.99 49 25 466 45.01 4 3 76 7.34 104 49 1035
23-Aug-16 117 48 2023 84.01 40 25 385 15.99 10 8 145 6.02 157 64 2408
24-Aug-16 130 43 2557 79.15 75 30 674 20.85 18 8 583 18.05 205 69 3231
25-Aug-16 58 30 796 51.90 67 31 738 48.10 12 10 241 15.71 125 57 1534
26-Aug-16 106 58 1808 64.97 59 24 975 35.03 13 9 195 7.01 165 73 2783
29-Aug-16 71 37 744 58.34 66 29 386 30.29 12 10 145 11.37 137 65 1130
30-Aug-16 166 78 3477 60.84 117 56 1013 17.73 36 31 1225 21.43 283 125 4491
31-Aug-16 133 69 2116 53.12 106 54 1216 30.52 20 15 652 16.36 239 105 3332
Total 2014 40148 1887 23949 260 6700 3901 64097
Average 96 47 1912 90 36 1140 12 9 319 186 75 3052
PercentMarket Share
62.64 37.36 10.45
100

TABLE 3 : LIQUIDITY OF TRADES GREATER THAN 5 CRORE (G-SEC)7 `
CC
ILM
on
thly
Ne
wsl
ett
er
statistics
Se
pte
mb
er
20
16
Sr.No.
ISINDESC TradesValue(` Cr.)
MarketShare(% )
DaysTraded
Days Tradedwith 5 trades ormore per day
Days Traded withless than 5 trades
per day
1 7.59% G.S. 2026 43871 537644 29.62 21 21 0
2 7.59% G.S. 2029 32862 389652 21.47 21 21 0
3 7.88% G.S. 2030 20650 215469 11.87 21 21 0
4 7.61% G.S. 2030 17484 203982 11.24 21 21 0
5 7.68% G.S. 2023 8611 106702 5.88 21 21 0
6 7.72% G.S. 2025 7063 75588 4.16 21 21 0
7 8.27% G.S. 2020 3110 62410 3.44 21 21 0
8 7.80% G.S. 2021 1138 25008 1.38 21 21 0
9 7.35% G.S. 2024 1765 22473 1.24 21 21 0
10 7.28% G.S. 2019 664 15950 0.88 21 20 1
11 8.12% G.S. 2020 613 15263 0.84 21 21 0
12 7.16% G.S. 2023 573 12538 0.69 21 20 1
13 6.35% G.S. 2020 502 10023 0.55 21 21 0
14 8.40% G.S. 2024 424 9268 0.51 21 20 1
15 8.13% G.S. 2045 703 9050 0.50 21 21 0
16 7.83% G.S.2018 336 9042 0.50 21 18 3
17 8.17% G.S. 2044 668 7432 0.41 21 21 0
18 8.08% G.S. 2022 252 6396 0.35 21 17 4
19 8.60% G.S. 2028 441 6366 0.35 21 21 0
20 8.83% G.S. 2023 158 6088 0.34 21 14 7
21 8.15% G.S. 2026 506 5706 0.31 21 19 2
22 7.73% G.S. 2034 512 4880 0.27 21 18 3
23 7.46% G.S. 2017 31 4200 0.23 10 2 8
24 6.90% G.S. 2019 211 3880 0.21 21 14 7
25 7.99% G.S. 2017 20 3850 0.21 6 2 4
26 8.07% G.S. 2017 90 3565 0.20 16 7 9
27 8.79% G.S. 2021 94 3365 0.19 17 7 10
28 8.28% G.S. 2027 235 3215 0.18 19 17 2
29 8.24% G.S. 2033 270 3080 0.17 20 18 2
30 7.49% G.S. 2017 86 2927 0.16 14 6 8
31 7.80% G.S. 2020 127 2840 0.16 17 13 4
32 8.20% G.S. 2025 130 2358 0.13 17 10 7
33 7.50% G.S. 2034 213 1986 0.11 18 14 4
34 8.19% G.S. 2020 83 1875 0.10 20 7 13
35 9.20% G.S. 2030 167 1623 0.09 17 11 6
36 7.02% G.S. 2016 49 1505 0.08 5 3 2
37 9.23% G.S. 2043 102 1260 0.07 18 9 9
38 8.26% G.S. 2027 45 1138 0.06 9 5 4
39 8.32% G.S. 2032 74 1110 0.06 14 7 7
40 8.30% G.S. 2040 86 1056 0.06 15 7 8
101
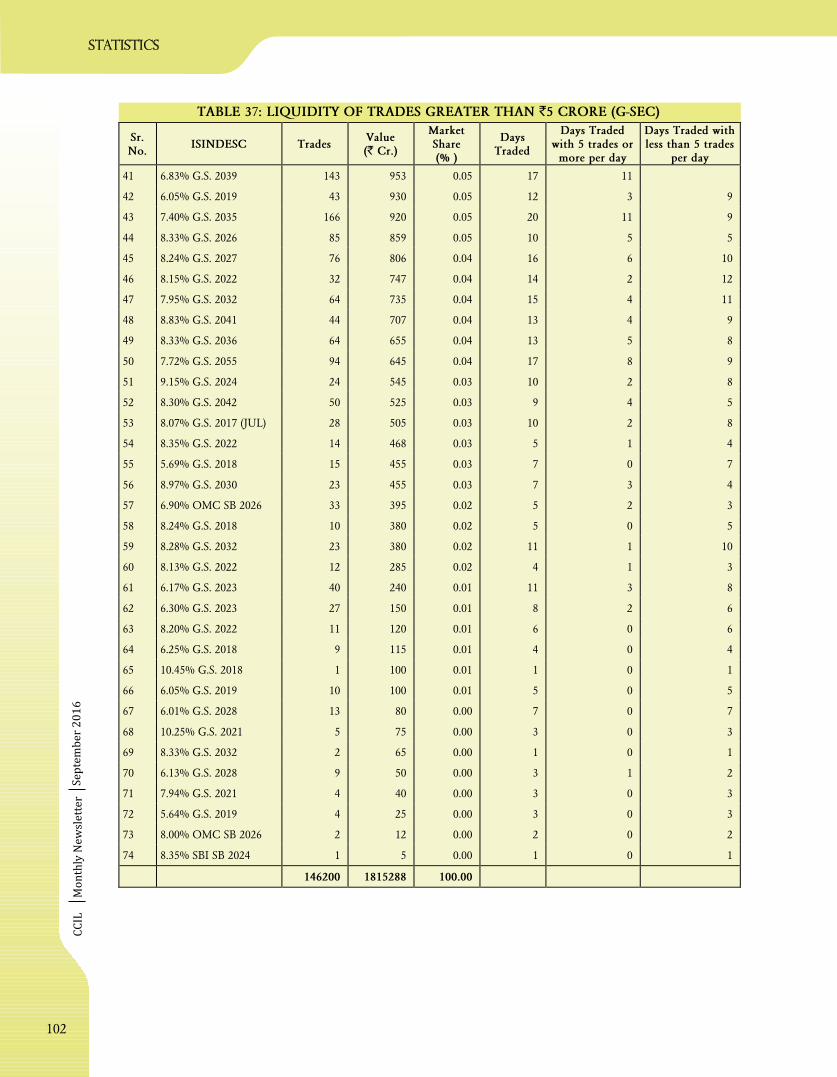
statistics
CC
ILM
on
thly
Ne
wsl
ett
er
Se
pte
mb
er
20
16
TABLE 3 : LIQUIDITY OF TRADES GREATER THAN 5 CRORE (G-SEC)7 `
Sr.No.
ISINDESC TradesValue(` Cr.)
MarketShare(% )
DaysTraded
Days Tradedwith 5 trades ormore per day
Days Traded withless than 5 trades
per day
41 6.83% G.S. 2039 143 953 0.05 17 11
42 6.05% G.S. 2019 43 930 0.05 12 3 9
43 7.40% G.S. 2035 166 920 0.05 20 11 9
44 8.33% G.S. 2026 85 859 0.05 10 5 5
45 8.24% G.S. 2027 76 806 0.04 16 6 10
46 8.15% G.S. 2022 32 747 0.04 14 2 12
47 7.95% G.S. 2032 64 735 0.04 15 4 11
48 8.83% G.S. 2041 44 707 0.04 13 4 9
49 8.33% G.S. 2036 64 655 0.04 13 5 8
50 7.72% G.S. 2055 94 645 0.04 17 8 9
51 9.15% G.S. 2024 24 545 0.03 10 2 8
52 8.30% G.S. 2042 50 525 0.03 9 4 5
53 8.07% G.S. 2017 (JUL) 28 505 0.03 10 2 8
54 8.35% G.S. 2022 14 468 0.03 5 1 4
55 5.69% G.S. 2018 15 455 0.03 7 0 7
56 8.97% G.S. 2030 23 455 0.03 7 3 4
57 6.90% OMC SB 2026 33 395 0.02 5 2 3
58 8.24% G.S. 2018 10 380 0.02 5 0 5
59 8.28% G.S. 2032 23 380 0.02 11 1 10
60 8.13% G.S. 2022 12 285 0.02 4 1 3
61 6.17% G.S. 2023 40 240 0.01 11 3 8
62 6.30% G.S. 2023 27 150 0.01 8 2 6
63 8.20% G.S. 2022 11 120 0.01 6 0 6
64 6.25% G.S. 2018 9 115 0.01 4 0 4
65 10.45% G.S. 2018 1 100 0.01 1 0 1
66 6.05% G.S. 2019 10 100 0.01 5 0 5
67 6.01% G.S. 2028 13 80 0.00 7 0 7
68 10.25% G.S. 2021 5 75 0.00 3 0 3
69 8.33% G.S. 2032 2 65 0.00 1 0 1
70 6.13% G.S. 2028 9 50 0.00 3 1 2
71 7.94% G.S. 2021 4 40 0.00 3 0 3
72 5.64% G.S. 2019 4 25 0.00 3 0 3
73 8.00% OMC SB 2026 2 12 0.00 2 0 2
74 8.35% SBI SB 2024 1 5 0.00 1 0 1
146200 1815288 100.00
102

CC
ILM
on
thly
Ne
wsl
ett
er
statistics
TABLE 38: LIQUIDITY DISTRIBUTION (G-SEC)
Se
pte
mb
er
20
16
5 or more Trades Per Day Less than 5 Trades Per DaySr.No. ISINDESC
DaysTraded
TradesValue(` Cr.)
ISINDESCDaysTraded
TradesValue(` Cr.)
1 7.59% G.S. 2026 21 43871 537644 8.19% G.S. 2020 13 31 580
2 7.59% G.S. 2029 21 32862 389652 8.15% G.S. 2022 12 19 347
3 7.88% G.S. 2030 21 20650 215469 7.95% G.S. 2032 11 22 385
4 7.61% G.S. 2030 21 17484 203982 8.79% G.S. 2021 10 30 1110
5 7.68% G.S. 2023 21 8611 106702 8.24% G.S. 2027 10 21 257
6 7.72% G.S. 2025 21 7063 75588 8.28% G.S. 2032 10 17 335
7 8.27% G.S. 2020 21 3110 62410 7.40% G.S. 2035 9 16 95
8 7.80% G.S. 2021 21 1138 25008 9.23% G.S. 2043 9 20 340
9 7.35% G.S. 2024 21 1765 22473 7.72% G.S. 2055 9 23 150
10 8.12% G.S. 2020 21 613 15263 8.07% G.S. 2017 9 25 1070
11 6.35% G.S. 2020 21 502 10023 8.83% G.S. 2041 9 16 457
12 8.13% G.S. 2045 21 703 9050 6.05% G.S. 2019 9 18 360
13 8.17% G.S. 2044 21 668 7432 8.30% G.S. 2040 8 12 202
14 8.60% G.S. 2028 21 441 6366 7.49% G.S. 2017 8 19 750
15 7.28% G.S. 2019 20 662 15940 8.33% G.S. 2036 8 22 235
16 7.16% G.S. 2023 20 570 12513 6.17% G.S. 2023 8 17 100
17 8.40% G.S. 2024 20 423 9243 7.46% G.S. 2017 8 19 270
18 8.15% G.S. 2026 19 501 5681 9.15% G.S. 2024 8 11 275
19 7.83% G.S.2018 18 330 8890 8.07% G.S. 2017 (JUL) 8 15 285
20 7.73% G.S. 2034 18 505 4770 8.83% G.S. 2023 7 17 245
21 8.24% G.S. 2033 18 265 3040 6.90% G.S. 2019 7 21 500
22 8.08% G.S. 2022 17 244 6106 8.20% G.S. 2025 7 17 175
23 8.28% G.S. 2027 17 227 3165 8.32% G.S. 2032 7 13 375
24 8.83% G.S. 2023 14 141 5843 5.69% G.S. 2018 7 15 455
25 6.90% G.S. 2019 14 190 3380 6.01% G.S. 2028 7 13 80
26 7.50% G.S. 2034 14 206 1921 9.20% G.S. 2030 6 16 128
27 7.80% G.S. 2020 13 119 2755 6.83% G.S. 2039 6 17 105
28 9.20% G.S. 2030 11 151 1495 6.30% G.S. 2023 6 12 65
29 6.83% G.S. 2039 11 126 848 8.20% G.S. 2022 6 11 120
30 7.40% G.S. 2035 11 150 825 8.33% G.S. 2026 5 7 60
31 8.20% G.S. 2025 10 113 2183 8.30% G.S. 2042 5 13 260
32 9.23% G.S. 2043 9 82 920 8.24% G.S. 2018 5 10 380
33 7.72% G.S. 2055 8 71 495 6.05% G.S. 2019 5 10 100
34 8.07% G.S. 2017 7 65 2495 8.08% G.S. 2022 4 8 290
35 8.79% G.S. 2021 7 64 2255 7.50% G.S. 2034 4 7 65
36 8.19% G.S. 2020 7 52 1295 7.80% G.S. 2020 4 8 85
103

statistics
CC
ILM
on
thly
Ne
wsl
ett
er
TABLE 38: LIQUIDITY DISTRIBUTION (G-SEC)
Se
pte
mb
er
20
16
5 or more Trades Per Day Less than 5 Trades Per DaySr.No. ISINDESC
DaysTraded
TradesValue(` Cr.)
ISINDESCDaysTraded
TradesValue(` Cr.)
37 8.32% G.S. 2032 7 61 735 8.26% G.S. 2027 4 10 548
8.30% G.S. 2040 7 74 855 8.97% G.S. 2030 4 6 75
39 7.49% G.S. 2017 6 67 2177 7.99% G.S. 2017 4 8 210
40 8.24% G.S. 2027 6 55 549 8.35% G.S. 2022 4 8 243
41 8.26% G.S. 2027 5 35 590 6.25% G.S. 2018 4 9 115
42 8.33% G.S. 2026 5 78 799 7.83% G.S.2018 3 6 152
43 8.33% G.S. 2036 5 42 420 7.73% G.S. 2034 3 7 110
44 7.95% G.S. 2032 4 42 350 6.90% OMC SB 2026 3 3 105
45 8.83% G.S. 2041 4 28 250 8.13% G.S. 2022 3 7 240
46 8.30% G.S. 2042 4 37 265 10.25% G.S. 2021 3 5 75
47 7.02% G.S. 2016 3 44 1310 7.94% G.S. 2021 3 4 40
48 6.05% G.S. 2019 3 25 570 5.64% G.S. 2019 3 4 25
49 8.97% G.S. 2030 3 17 380 8.15% G.S. 2026 2 5 25
50 6.17% G.S. 2023 3 23 140 8.24% G.S. 2033 2 5 40
51 7.46% G.S. 2017 2 12 3930 8.28% G.S. 2027 2 8 50
52 7.99% G.S. 2017 2 12 3640 7.02% G.S. 2016 2 5 195
53 8.15% G.S. 2022 2 13 400 6.13% G.S. 2028 2 2 10
54 9.15% G.S. 2024 2 13 270 8.00% OMC SB 2026 2 2 12
55 8.07% G.S. 2017 (JUL) 2 13 220 7.28% G.S. 2019 1 2 10
56 6.90% OMC SB 2026 2 30 290 7.16% G.S. 2023 1 3 25
57 6.30% G.S. 2023 2 15 85 8.40% G.S. 2024 1 1 25
58 8.35% G.S. 2022 1 6 225 10.45% G.S. 2018 1 1 100
59 8.28% G.S. 2032 1 6 45 8.33% G.S. 2032 1 2 65
60 8.13% G.S. 2022 1 5 45 8.35% SBI SB 2024 1 1 5
61 6.13% G.S. 2028 1 7 40
Total 680 145498 1801699 Total 333 702 13589
Expected Bond Days 1281 Expected Bond Days 1260
Efficiency 53.08 Efficiency 26.43
104
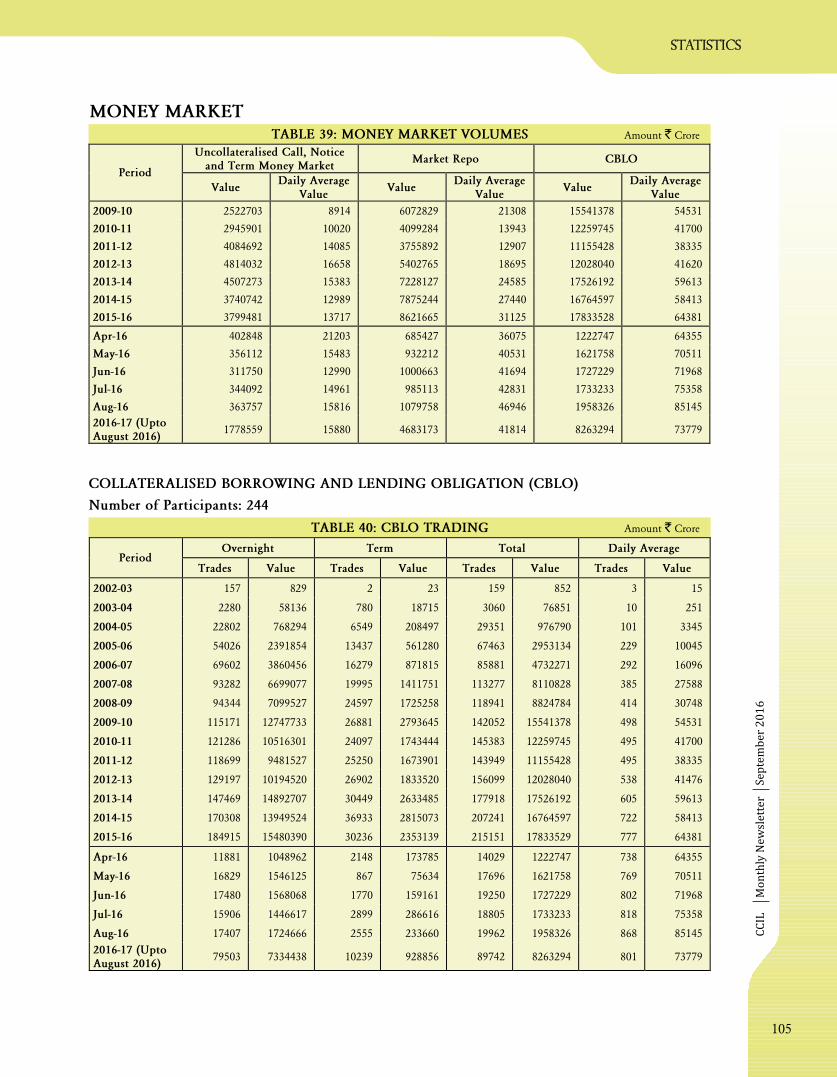
CC
ILM
on
thly
Ne
wsl
ett
er
statistics
Amount Crore`
MONEY MARKETTABLE 39: MONEY MARKET VOLUMES
Se
pte
mb
er
20
16
COLLATERALISED BORROWING AND LENDING OBLIGATION (CBLO)
Number of Participants: 244
TABLE 40: CBLO TRADING Amount Crore`
Uncollateralised Call, Noticeand Term Money Market
Market Repo CBLOPeriod
ValueDaily Average
ValueValue
Daily AverageValue
ValueDaily Average
Value
2009-10 2522703 8914 6072829 21308 15541378 54531
2010-11 2945901 10020 4099284 13943 12259745 41700
2011-12 4084692 14085 3755892 12907 11155428 38335
2012-13 4814032 16658 5402765 18695 12028040 41620
2013-14 4507273 15383 7228127 24585 17526192 59613
2014-15 3740742 12989 7875244 27440 16764597 58413
2015-16 3799481 13717 8621665 31125 17833528 64381
Apr-16 402848 21203 685427 36075 1222747 64355
May-16 356112 15483 932212 40531 1621758 70511
Jun-16 311750 12990 1000663 41694 1727229 71968
Jul-16 344092 14961 985113 42831 1733233 75358
Aug-16 363757 15816 1079758 46946 1958326 85145
2016-17 (UptoAugust 2016)
1778559 15880 4683173 41814 8263294 73779
Overnight Term Total Daily AveragePeriod
Trades Value Trades Value Trades Value Trades Value
2002-03 157 829 2 23 159 852 3 15
2003-04 2280 58136 780 18715 3060 76851 10 251
2004-05 22802 768294 6549 208497 29351 976790 101 3345
2005-06 54026 2391854 13437 561280 67463 2953134 229 10045
2006-07 69602 3860456 16279 871815 85881 4732271 292 16096
2007-08 93282 6699077 19995 1411751 113277 8110828 385 27588
2008-09 94344 7099527 24597 1725258 118941 8824784 414 30748
2009-10 115171 12747733 26881 2793645 142052 15541378 498 54531
2010-11 121286 10516301 24097 1743444 145383 12259745 495 41700
2011-12 118699 9481527 25250 1673901 143949 11155428 495 38335
2012-13 129197 10194520 26902 1833520 156099 12028040 538 41476
2013-14 147469 14892707 30449 2633485 177918 17526192 605 59613
2014-15 170308 13949524 36933 2815073 207241 16764597 722 58413
2015-16 184915 15480390 30236 2353139 215151 17833529 777 64381
Apr-16 11881 1048962 2148 173785 14029 1222747 738 64355
May-16 16829 1546125 867 75634 17696 1621758 769 70511
Jun-16 17480 1568068 1770 159161 19250 1727229 802 71968
Jul-16 15906 1446617 2899 286616 18805 1733233 818 75358
Aug-16 17407 1724666 2555 233660 19962 1958326 868 85145
2016-17 (UptoAugust 2016)
79503 7334438 10239 928856 89742 8263294 801 73779
105

statistics
CC
ILM
on
thly
Ne
wsl
ett
er
Se
pte
mb
er
20
16
MARKET REPO
TABLE 41: REPO TERM ANALYSIS Percent
TABLE 42: INSTRUMENTWISE SETTLEMENT OF REPO TRADES Amount Crore`
O/N 2-3 days 4-7 days 8-14 days >14 daysSettlement
Period% tototaltrades
% tototalvalue
% tototaltrades
% tototalvalue
% tototaltrades
% tototalvalue
% tototaltrades
% tototalvalue
% tototaltrades
% tototalvalue
2002-03 50.05 50.15 30.96 31.01 15.46 15.95 2.26 1.78 1.27 1.11
2003-04 53.00 52.29 32.68 32.94 13.63 14.37 0.58 0.34 0.11 0.06
2004-05 68.29 69.29 26.30 24.23 5.30 6.35 0.09 0.11 0.02 0.02
2005-06 70.93 72.06 25.73 25.11 3.06 2.71 0.19 0.08 0.08 0.04
2006-07 73.68 75.19 21.58 21.06 4.32 3.57 0.12 0.07 0.31 0.11
2007-08 74.00 73.97 22.86 23.25 2.80 2.69 0.03 0.01 0.30 0.09
2008-09 68.24 68.69 27.17 27.04 4.35 4.17 0.07 0.03 0.17 0.07
2009-10 70.42 69.51 23.07 24.25 6.23 6.00 0.19 0.23 0.09 0.02
2010-11 68.51 65.99 27.94 31.12 2.96 2.68 0.27 0.08 0.32 0.13
2011-12 67.46 65.94 26.27 28.53 5.17 5.24 0.39 0.11 0.72 0.18
2012-13 69.06 67.82 27.13 27.75 3.49 4.16 0.14 0.21 0.18 0.05
2013-14 66.29 65.24 27.73 28.34 5.60 6.17 0.16 0.18 0.23 0.07
2014-15 67.08 65.76 27.56 28.22 5.08 5.63 0.25 0.37 0.03 0.02
2015-16 71.79 70.30 23.89 25.40 4.24 4.21 0.06 0.08 0.02 0.02
Apr-16 63.42 61.51 20.67 20.71 15.21 15.63 0.44 1.33 0.27 0.82
May-16 78.27 75.41 20.87 22.08 0.32 0.81 0.36 1.18 0.17 0.51
Jun-16 77.31 75.19 22.14 23.24 0.15 0.35 0.23 0.60 0.17 0.62
Jul-16 65.55 62.22 33.54 35.62 0.14 0.15 0.51 1.16 0.25 0.85
Aug-16 71.73 69.78 22.59 23.44 4.77 4.87 0.50 1.10 0.41 0.81
2016-17 (UptoAugust 2016)
71.82 69.25 24.05 25.29 3.47 3.68 0.40 1.06 0.25 0.72
Cen. Govt. Dated Treasury BillsSettlement
Period ValueAvg.Value
%Share
ValueAvg.Value
%Share
ValueAvg.Value
%Share
2002-03 403971 1360 86.28 64238 216 13.72 20 0 0.00
2003-04 874438 2974 92.71 59222 201 6.28 9530 32 1.01
2004-05 1262149 4322 81.02 286955 983 18.42 8803 30 0.57
2005-06 1369411 4674 80.81 277687 948 16.39 47411 162 2.80
2006-07 2126634 7233 83.19 379165 1290 14.83 50677 172 1.98
2007-08 3569960 12102 90.41 323984 1098 8.20 54807 186 1.39
2008-09 3475348 12109 84.88 583335 2033 14.25 35603 124 0.87
2009-10 5233295 18362 86.18 812537 2851 13.38 26996 95 0.44
2010-11 3253965 11068 79.38 832632 2832 20.31 12688 43 0.31
2011-12 2186877 7515 58.10 1554121 5341 41.29 22878 79 0.61
2012-13 2918337 10098 54.02 2413144 8350 44.66 71282 247 1.32
2013-14 3364069 11442 46.54 3832478 13036 53.02 31580 107 0.44
2014-15 4471896 15582 56.78 3259007 11355 41.38 144343 503 1.83
2015-16 6230697 22493 72.27 2248204 8116 26.08 142765 515 1.66
Apr-16 557526 29343 81.34 122454 6445 17.87 5447 287 0.79
May-16 726724 31597 77.96 162853 7081 17.47 42634 1854 4.57
Jun-16 779817 32492 77.93 150664 6278 15.06 70182 2924 7.01
Jul-16 800550 34807 81.26 133292 5795 13.53 51271 2229 5.20
Aug-16 899769 39120 83.33 104956 4563 9.72 75033 3262 6.95
2016-17 (UptoAugust 2016)
3764386 33611 80.38 674219 6020 14.40 244567 2184 5.22
State Development Loans
106

CC
ILM
on
thly
Ne
wsl
ett
er
statistics
Se
pte
mb
er
20
16
TABLE 43: CROMS TRADING ACTIVITY
Number of Participants: 153 Amount Crore`
TABLE 44: CROMS HISTORICAL SUMMARY Amount Crore`
CROMS Special CROMS Basket CROMS - Total Repo
DateTrades Value WAR Trades Value WAR Trades Value WAR Trades Value WAR
% Shareof
CROMSin Repovolumes
1-Aug-16 161 17614 6.4006 132 20874 6.4809 293 38488 6.4442 304 40405 6.4426 95.26
2-Aug-16 206 18461 6.4100 151 22704 6.4812 357 41165 6.4493 368 43049 6.4458 95.62
3-Aug-16 188 18941 6.4059 155 23116 6.4699 343 42057 6.4411 354 43920 6.4385 95.76
4-Aug-16 190 17792 6.3862 154 23406 6.4626 344 41198 6.4296 357 42832 6.4264 96.19
5-Aug-16 209 18425 6.3663 273 44507 6.4627 482 62932 6.4345 498 66623 6.4345 94.46
8-Aug-16 179 17206 6.4052 156 27010 6.5040 335 44216 6.4656 353 48018 6.4657 92.08
9-Aug-16 193 18515 6.4421 151 26923 6.5391 344 45438 6.4996 360 48672 6.4976 93.36
10-Aug-16 169 15462 6.4628 160 25833 6.5615 329 41295 6.5246 343 43652 6.5233 94.60
11-Aug-16 178 16620 6.4837 190 28397 6.5806 368 45017 6.5448 380 47403 6.5434 94.97
12-Aug-16 187 17374 6.4707 172 33269 6.5217 359 50643 6.5043 372 52641 6.5017 96.20
16-Aug-16 196 18430 6.4502 149 33214 6.5075 345 51644 6.4871 362 55652 6.4873 92.80
18-Aug-16 162 16403 6.4452 185 37525 6.4776 347 53928 6.4677 359 55840 6.4664 96.57
19-Aug-16 184 17912 6.4526 403 74818 6.3928 587 92730 6.4043 602 94887 6.3998 97.73
22-Aug-16 178 16008 6.4469 165 30626 6.4669 343 46634 6.4601 356 48996 6.4577 95.18
23-Aug-16 201 20768 6.4268 131 28070 6.4653 332 48838 6.4490 345 50857 6.4480 96.03
24-Aug-16 196 20244 6.4259 144 29614 6.4753 340 49858 6.4552 353 51775 6.4522 96.30
25-Aug-16 201 18933 6.4244 132 25014 6.4473 333 43947 6.4374 346 45881 6.4347 95.79
26-Aug-16 191 19147 6.3909 131 23293 6.4455 322 42440 6.4209 335 43977 6.4191 96.51
29-Aug-16 197 20280 6.4167 131 25123 6.4590 328 45403 6.4401 348 48640 6.4414 93.34
30-Aug-16 186 19938 6.4408 163 30446 6.4814 349 50384 6.4653 367 53412 6.4603 94.33
31-Aug-16 183 18763 6.4167 162 31583 6.4552 345 50346 6.4409 360 52626 6.4398 95.67
Total 3935 383236 3590 645368 7525 1028604 7822 1079758 95.26
CROMS-SPECIAL CROMS-BASKET CROMS
Period
Trades Value
%Share
inRepo
Trades Value
%Share
inRepo
TradesTotalValue
DailyAverageValue
%Share
inRepo
2008-09 957 93369 9.05 26 853 0.08 983 94222 2298 9.14
2009-10 5336 742575 12.23 9888 3543468 58.38 15224 4286042 17933 70.61
2010-11 8718 810326 19.78 10181 2016259 49.21 18899 2826585 11398 68.98
2011-12 12757 1333933 35.45 9519 1233105 32.77 22276 2567038 10652 68.23
2012-13 18732 1936643 35.85 18543 2927336 54.19 37275 4863979 19692 90.05
2013-14 13780 1287231 17.81 28540 5238049 72.48 42320 6525279 26418 90.29
2014-15 15120 1362280 17.30 36319 5954619 75.61 51439 7316899 30743 92.91
2015-16 29770 2872304 33.31 35142 5280959 61.25 64912 8153264 33691 94.57
Apr-16 2447 181769 26.52 2579 450240 65.69 5026 632009 39501 92.21
May-16 3548 283599 30.42 3239 579995 62.22 6787 863594 39254 92.64
Jun-16 4167 359858 35.96 3319 567716 56.73 7486 927574 42162 92.70
Jul-16 3344 301227 30.58 3438 619473 62.88 6782 920700 46035 93.46
Aug-16 3935 383236 35.49 3590 645368 59.77 7525 1028604 48981 95.26
2016-17 (UptoAugust 2016)
17441 1509689 32.24 16165 2862792 61.13 33606 4372481 43292 93.37
107

statistics
CC
ILM
on
thly
Ne
wsl
ett
er
Se
pte
mb
er
20
16
TABLE 45: TOP 5 SECURITIES - BASKET REPO
TABLE 46: TOP 5 SECURITIES - SPECIAL REPO
Amount Crore`
Amount Crore`
TABLE 47: DEALT TRANSACTIONS ON THE NDS-CALL PLATFORM
CALL MONEY MARKET
Amount Crore`
Security Trades Value Rate
7.28% G.S. 2019 214 51839 6.4924
8.27% G.S. 2020 264 47874 6.4924
8.07% G.S. 2017 168 45799 6.4631
7.83% G.S. 2018 150 43335 6.4769
7.49% G. S. 2017 121 34926 6.4791
Security Trades Value Rate
7.88% G.S. 2030 510 53248 6.3759
8.27% G.S. 2020 340 44507 6.4101
7.59% G.S. 2029 338 33533 6.3611
7.59% G.S. 2026 322 30647 6.4179
7.61% G.S. 2030 213 20307 6.3995
CALL NOTICE Term TotalDate
Trade Value WAR Trade Value WAR Trade Value WAR Trade Value
1-Aug-16 180 14229 6.4256 2 200 6.5000 8 428 6.8168 190 14857
2-Aug-16 123 9218 6.4748 - - - 11 1000 6.8188 134 10218
3-Aug-16 130 9972 6.4870 - - - 10 800 6.8163 140 10772
4-Aug-16 128 9638 6.5185 10 975 6.4654 5 92 6.8668 143 10705
5-Aug-16 218 20067 6.4329 1 17 6.4500 4 112 6.8138 223 20196
6-Aug-16 12 835 6.5590 - - - - - - 12 835
8-Aug-16 136 10507 6.5601 4 418 6.6591 10 790 6.8737 150 11715
9-Aug-16 137 9899 6.5959 - - - 4 360 7.3764 141 10259
10-Aug-16 128 9706 6.5533 1 40 6.6000 3 185 6.7892 132 9931
11-Aug-16 142 11105 6.5296 - - - 3 185 6.8338 145 11290
12-Aug-16 110 8110 6.5408 - - - 4 370 6.8595 114 8480
16-Aug-16 126 10252 6.4964 2 124 6.4855 3 120 7.0458 131 10496
18-Aug-16 90 6935 6.4504 - - - 6 515 6.8214 96 7450
19-Aug-16 188 17756 6.4510 2 200 6.6000 6 370 6.8770 196 18326
20-Aug-16 33 3055 6.4866 - - - - - - 33 3055
22-Aug-16 115 8153 6.4888 - - - 1 20 6.8000 116 8173
23-Aug-16 116 9426 6.4905 - - - 5 740 6.9007 121 10166
24-Aug-16 128 10842 6.5086 4 100 6.4437 2 55 7.2018 134 10996
25-Aug-16 84 6290 6.4907 - - - 1 100 6.9500 85 6390
26-Aug-16 102 7919 6.4723 - - - 4 170 6.9206 106 8089
29-Aug-16 116 8292 6.4982 - - - 2 183 6.7546 118 8475
30-Aug-16 108 7973 6.4962 1 20 6.4000 - - - 109 7993
31-Aug-16 110 8012 6.5072 - - - 2 200 7.2000 112 8212
Total 2760 218191 27 2093 94 6795 2881 227079
108
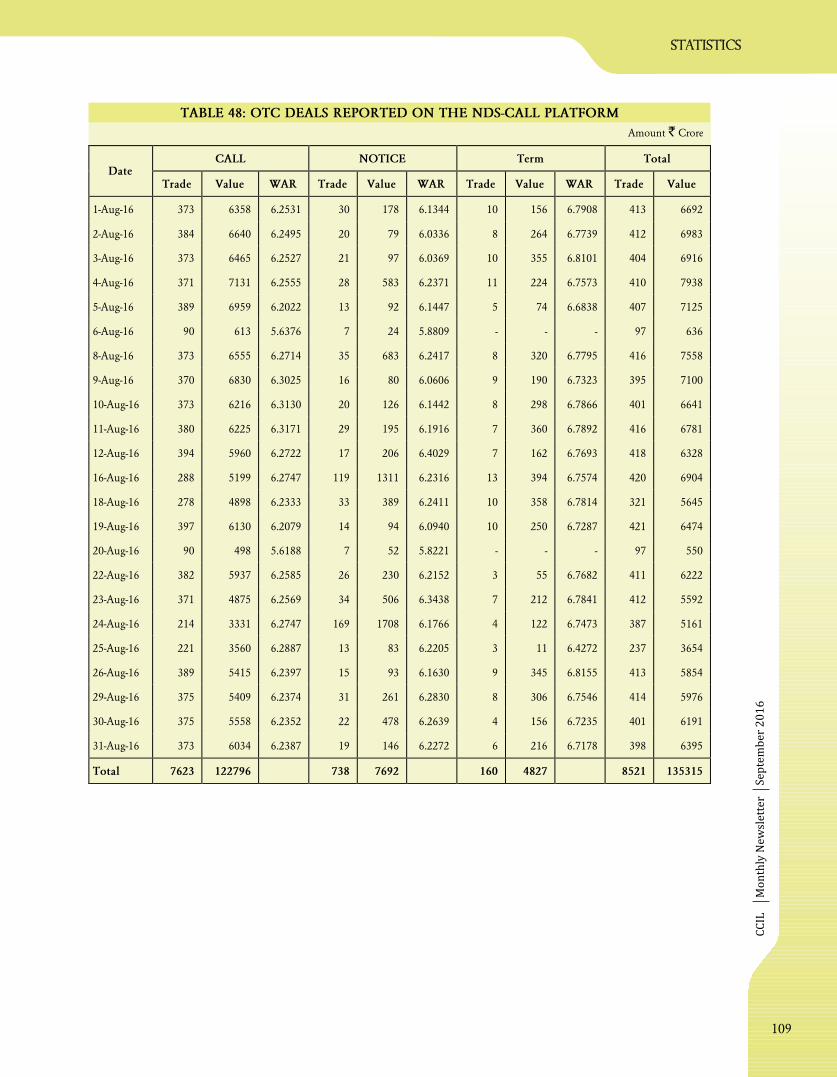
CC
ILM
on
thly
Ne
wsl
ett
er
statistics
Se
pte
mb
er
20
16
TABLE 48: OTC DEALS REPORTED ON THE NDS-CALL PLATFORM
Amount Crore`
CALL NOTICE Term TotalDate
Trade Value WAR Trade Value WAR Trade Value WAR Trade Value
1-Aug-16 373 6358 6.2531 30 178 6.1344 10 156 6.7908 413 6692
2-Aug-16 384 6640 6.2495 20 79 6.0336 8 264 6.7739 412 6983
3-Aug-16 373 6465 6.2527 21 97 6.0369 10 355 6.8101 404 6916
4-Aug-16 371 7131 6.2555 28 583 6.2371 11 224 6.7573 410 7938
5-Aug-16 389 6959 6.2022 13 92 6.1447 5 74 6.6838 407 7125
6-Aug-16 90 613 5.6376 7 24 5.8809 - - - 97 636
8-Aug-16 373 6555 6.2714 35 683 6.2417 8 320 6.7795 416 7558
9-Aug-16 370 6830 6.3025 16 80 6.0606 9 190 6.7323 395 7100
10-Aug-16 373 6216 6.3130 20 126 6.1442 8 298 6.7866 401 6641
11-Aug-16 380 6225 6.3171 29 195 6.1916 7 360 6.7892 416 6781
12-Aug-16 394 5960 6.2722 17 206 6.4029 7 162 6.7693 418 6328
16-Aug-16 288 5199 6.2747 119 1311 6.2316 13 394 6.7574 420 6904
18-Aug-16 278 4898 6.2333 33 389 6.2411 10 358 6.7814 321 5645
19-Aug-16 397 6130 6.2079 14 94 6.0940 10 250 6.7287 421 6474
20-Aug-16 90 498 5.6188 7 52 5.8221 - - - 97 550
22-Aug-16 382 5937 6.2585 26 230 6.2152 3 55 6.7682 411 6222
23-Aug-16 371 4875 6.2569 34 506 6.3438 7 212 6.7841 412 5592
24-Aug-16 214 3331 6.2747 169 1708 6.1766 4 122 6.7473 387 5161
25-Aug-16 221 3560 6.2887 13 83 6.2205 3 11 6.4272 237 3654
26-Aug-16 389 5415 6.2397 15 93 6.1630 9 345 6.8155 413 5854
29-Aug-16 375 5409 6.2374 31 261 6.2830 8 306 6.7546 414 5976
30-Aug-16 375 5558 6.2352 22 478 6.2639 4 156 6.7235 401 6191
31-Aug-16 373 6034 6.2387 19 146 6.2272 6 216 6.7178 398 6395
Total 7623 122796 738 7692 160 4827 8521 135315
109

statistics
CC
ILM
on
thly
Ne
wsl
ett
er
Se
pte
mb
er
20
16
TABLE 49: UNCOLLATERALISED OVERNIGHT TRANSACTIONS (%)
Within +/-10 bpsof FBIL O/N
MIBOR
Within +/-15 bps ofFBIL O/N MIBOR
Within +/-25 bps ofFBIL O/N MIBOR
TotalTRADEDATE
FBILO/N
MIBORRate Trades Value Trades Value Trades Value Trades
Value(` Crore)
01-Aug-16 6.50 20 49 23 55 38 83 553 20586
02-Aug-16 6.50 24 69 26 73 29 78 507 15858
03-Aug-16 6.50 26 68 29 75 31 79 503 16437
04-Aug-16 6.50 23 57 29 73 32 78 499 16770
05-Aug-16 6.48 30 68 31 70 39 83 607 27026
08-Aug-16 6.57 28 69 30 74 32 77 509 17062
09-Aug-16 6.60 27 65 30 70 33 76 507 16729
10-Aug-16 6.60 21 61 23 63 25 70 501 15922
11-Aug-16 6.65 18 50 21 55 24 58 522 17330
12-Aug-16 6.59 18 56 22 65 26 73 504 14070
16-Aug-16 6.50 33 78 36 81 39 83 414 15451
18-Aug-16 6.50 23 67 24 68 29 71 368 11833
19-Aug-16 6.49 30 74 33 79 37 84 585 23886
22-Aug-16 6.51 24 70 28 74 31 78 497 14090
23-Aug-16 6.51 26 78 28 79 30 80 487 14301
24-Aug-16 6.50 40 86 41 86 44 87 342 14173
25-Aug-16 6.51 28 71 33 80 37 83 305 9850
26-Aug-16 6.50 22 65 25 73 28 78 491 13335
29-Aug-16 6.50 25 68 28 74 31 77 491 13701
30-Aug-16 6.50 21 60 26 71 29 77 483 13531
31-Aug-16 6.54 25 68 27 71 31 76 483 14046
110

CC
ILM
on
thly
Ne
wsl
ett
er
statistics
Se
pte
mb
er
20
16
Within +/-10 bps ofFBIL O/N MIBOR
Within +/-15 bps ofFBIL O/N MIBOR
Within +/-25 bps ofFBIL O/N MIBOR
TotalTRADEDATE
FBILO/N
MIBORRate
Trades Value Trades Value Trades Value TradesValue
(` Crore)
01-Aug-16 6.50 53 55 58 61 99 100 180 14229
02-Aug-16 6.50 86 95 92 97 96 100 123 9218
03-Aug-16 6.50 91 95 97 100 98 100 130 9972
04-Aug-16 6.50 79 82 98 100 100 100 128 9638
05-Aug-16 6.48 76 82 77 82 91 95 218 20067
08-Aug-16 6.57 91 97 98 100 100 100 136 10507
09-Aug-16 6.60 88 95 97 99 99 100 137 9899
10-Aug-16 6.60 70 81 76 85 77 85 128 9706
11-Aug-16 6.65 58 63 66 69 73 72 142 11105
12-Aug-16 6.59 70 77 86 90 98 100 110 8110
16-Aug-16 6.50 95 99 99 100 100 100 126 10252
18-Aug-16 6.50 73 86 74 87 81 88 90 6935
19-Aug-16 6.49 82 89 87 93 95 97 188 17756
22-Aug-16 6.51 89 95 96 99 100 100 115 8153
23-Aug-16 6.51 97 99 97 100 99 100 116 9426
24-Aug-16 6.50 98 100 98 100 100 100 128 10842
25-Aug-16 6.51 85 87 95 98 100 100 84 6290
26-Aug-16 6.50 88 90 97 98 99 100 102 7919
29-Aug-16 6.50 89 93 98 100 99 100 116 8292
30-Aug-16 6.50 78 80 94 95 98 100 108 7973
31-Aug-16 6.54 90 94 94 98 100 100 110 8012
TABLE 50: OVERNIGHT TRANSACTIONS DEALT ON NDS-CALL PLATFORM (%)
111

statistics
Within +/-10 bps ofFBIL O/N MIBOR
Within +/-15 bps ofFBIL O/N MIBOR
Within +/-25 bps ofFBIL O/N MIBOR
TotalTRADEDATE
FBILO/N
MIBORRate Trades Value Trades Value Trades Value Trades
Value(` Crore)
01-Aug-16 6.50 4 34 6 41 9 46 373 6358
02-Aug-16 6.50 4 33 5 39 8 47 384 6640
03-Aug-16 6.50 3 25 5 38 8 47 373 6465
04-Aug-16 6.50 4 23 5 37 9 48 371 7131
05-Aug-16 6.48 4 28 6 36 10 49 389 6959
08-Aug-16 6.57 4 25 6 34 8 40 373 6555
09-Aug-16 6.60 4 23 5 28 8 43 370 6830
10-Aug-16 6.60 3 29 4 30 8 46 373 6216
11-Aug-16 6.65 3 27 4 30 6 34 380 6225
12-Aug-16 6.59 4 27 4 33 6 38 394 5960
16-Aug-16 6.50 6 39 9 44 12 50 288 5199
18-Aug-16 6.50 6 39 8 41 12 46 278 4898
19-Aug-16 6.49 5 31 7 39 10 48 397 6130
22-Aug-16 6.51 4 36 7 40 10 48 382 5937
23-Aug-16 6.51 4 35 6 38 8 41 371 4875
24-Aug-16 6.50 5 40 6 41 10 46 214 3331
25-Aug-16 6.51 6 42 9 46 13 52 221 3560
26-Aug-16 6.50 4 28 6 35 10 45 389 5415
29-Aug-16 6.50 5 30 7 35 10 42 375 5409
30-Aug-16 6.50 5 32 6 36 9 45 375 5558
31-Aug-16 6.54 5 34 7 35 11 44 373 6034
TABLE 51: OVERNIGHT TRANSACTIONS REPORTED ON NDS-CALL PLATFORM (%)
CC
ILM
on
thly
Ne
wsl
ett
er
Se
pte
mb
er
20
16
112

CC
ILM
on
thly
Ne
wsl
ett
er
statistics
Se
pte
mb
er
20
16
NDS-CALL Platform (WAR)TRADEDATE
FBIL O/NMIBOR Rate
UncollateralisedO/N Call(WAR) All Trades Trades Upto 4 PM
Trades Reported on NDS-CALL Platform (WAR)
01-Aug-16 6.50 6.37 6.43 6.48 6.25
02-Aug-16 6.50 6.38 6.47 6.48 6.25
03-Aug-16 6.50 6.39 6.49 6.48 6.25
04-Aug-16 6.50 6.41 6.52 6.49 6.26
05-Aug-16 6.48 6.39 6.43 6.47 6.20
08-Aug-16 6.57 6.45 6.56 6.57 6.27
09-Aug-16 6.60 6.48 6.60 6.60 6.30
10-Aug-16 6.60 6.46 6.55 6.60 6.31
11-Aug-16 6.65 6.45 6.53 6.62 6.32
12-Aug-16 6.59 6.43 6.54 6.57 6.27
16-Aug-16 6.50 6.42 6.50 6.51 6.27
18-Aug-16 6.50 6.36 6.45 6.49 6.23
19-Aug-16 6.49 6.40 6.45 6.48 6.21
22-Aug-16 6.51 6.39 6.49 6.50 6.26
23-Aug-16 6.51 6.41 6.49 6.50 6.26
24-Aug-16 6.50 6.45 6.51 6.51 6.27
25-Aug-16 6.51 6.42 6.49 6.50 6.29
26-Aug-16 6.50 6.38 6.47 6.49 6.24
29-Aug-16 6.50 6.40 6.50 6.51 6.24
30-Aug-16 6.50 6.39 6.50 6.52 6.24
31-Aug-16 6.54 6.39 6.51 6.52 6.24
TABLE 52: CALL MARKET AND FBIL O/N MIBOR - RATES (%)
113

CCIL Monthly Newsletter
statis
tic
s
September 2016
TABLE :53 TENORWISE ANALYSIS OF TERM MONEY TRANSACTIONS Amount Crore`
Less Than 30 Days 30-60 Days 60-90 Days 90-120 Days 120-180 Days 180-270 Days 270 Days and More TotalPeriod
Trades Values Trades Values Trades Values Trades Values Trades Values Trades Values Trades Values Trades Values
2006-07 75 4504 74 5209 19 895 52 1347 4 40 8 73 23 2716 255 14784
2007-08 249 13937 209 10332 49 1832 240 10250 27 1625 46 1701 23 1332 843 41008
2008-09 222 13887 187 11679 92 4194 313 15801 34 1543 51 1846 29 659 928 49608
2009-10 162 8727 63 3942 6 755 87 3322 15 1298 32 1610 68 5522 433 25176
2010-11 291 16146 84 6220 27 1493 77 3617 6 312 40 1346 44 2236 569 31370
2011-12 467 34789 162 11218 47 3143 148 9467 5 85 24 1003 29 1057 882 60761
2012-13 997 81555 273 22081 117 8572 243 15673 16 1294 27 1237 37 2977 1710 133389
2013-14 639 40681 244 11765 86 4914 241 12961 30 1685 41 3458 56 2643 1337 78107
2014-15 758 29041 108 4913 136 6040 212 11018 42 2810 47 2256 45 2356 1348 58432
2015-16 1142 43868 161 4678 79 4029 142 6927 32 2453 52 3297 34 1885 1642 67136
Apr-16 146 6941 10 778 18 718 12 865 3 175 3 380 1 10 193 9867
May-16 214 8922 29 1125 4 320 9 530 2 125 4 600 3 42 265 11664
Jun-16 212 8526 27 1068 3 82 9 281 1 100 1 100 1 9 254 10166
Jul-16 193 8617 26 1186 8 437 11 793 2 300 3 125 7 251 250 11708
Aug-16 189 8251 36 1532 9 553 10 588 2 150 2 200 6 347 254 11622
2016-17 (UptoAugust 2016)
954 41256 128 5690 42 2109 51 3057 10 850 13 1405 18 659 1216 55027
114

CCIL Monthly Newsletter
statis
tic
s
September 2016
TABLE 54: NDS-CALL HISTORICAL Amount Crore`
*Trade reporting on NDS-CALL became mandatory from November 2012.**Data from September 18, 2006.
Dealt Reported Reciprocal Total NDS-CALL
Total Average Total Average Total Total Average% Share in NDS-CALL
Total Value ofCall, Notice andTerm Money as
per RBIPeriod
Trades Value Trades Value Trades Value Trades Value Trades Value Trades Value Trades Value Dealt Reported Reciprocal TotalDaily
Average
% Shareof NDS-CALL in
TotalMarket
2006-07** 6853 507998 44 3277 351 5427 2 35 161 30326 7365 543750 48 3508 93.42 1.00 5.58 2209978 14258 24.60
2007-08 31402 2778531 108 9516 3597 26413 12 90 151 20117 35150 2825061 120 9675 98.35 0.93 0.71 3513925 12034 80.40
2008-09 35742 3179134 125 11077 4533 20797 16 72 351 57557 40626 3257488 142 11350 97.59 0.64 1.77 3717091 12952 87.64
2009-10 24530 2124356 86 7454 4735 23877 17 84 91 18470 29356 2166703 103 7602 98.05 1.10 0.85 2522703 8852 85.89
2010-11 26401 2450742 90 8336 7352 49514 25 168 379 76328 34132 2576584 116 8764 95.12 1.92 2.96 2945901 10020 87.46
2011-12 34031 3483245 117 11970 5449 21071 19 72 449 95779 39929 3600095 137 12371 96.75 0.59 2.66 4084692 14037 88.14
2012-13 37174 4124785 129 14273 29554 352449 102 1220 338 58407 67066 4535641 232 15694 90.94 7.77 1.29 4814032 16658 94.22
2013-14 38231 3617702 130 12305 65715 875335 224 2977 503 96025 104449 4589062 355 15609 78.83 19.07 2.09 4507273 15331 101.81
2014-15 33462 2557815 117 8912 70390 1175399 245 4095 278 51625 104130 3784839 363 13188 67.58 31.06 1.36 3740742 13034 101.18
2015-16 33445 2535754 121 9154 85053 1247369 307 4503 110 26894 118608 3810017 428 13657 66.55 32.74 0.71 3799481 13717 99.57
Apr-16 3577 302541 188 15923 6244 98716 329 5196 2 700 9823 401956 517 21156 75.27 24.56 0.17 402848 21203 99.78
May-16 3064 243202 133 10574 8406 112637 365 4897 4 1500 11474 357339 499 15536 68.06 31.52 0.42 356112 15483 100.34
Jun-16 2585 199590 108 8316 8701 110409 363 4600 11 2630 11286 309998 470 12917 64.38 35.62 0.85 311750 12990 99.44
Jul-16 2656 212425 115 9236 8319 130938 362 5693 2 500 10975 343364 477 14929 61.87 38.13 0.15 344092 14961 99.79
Aug-16 2881 227079 125 9873 8521 135315 370 5883 4 800 11402 362394 496 15756 62.66 37.34 0.22 363757 15816 99.63
2016-17 (UptoAugust 2016)
14763 1184836 132 10579 40191 588014 359 5250 23 6130 54960 1775050 491 15849 66.75 33.13 0.35 1778559 15880 99.80
115

CCIL Monthly Newsletter
statis
tic
s
TABLE 55: FOREX SETTLEMENT*
FOREIGN EXCHANGE MARKETFOREX SETTLEMENT
Number of Participants: 89
September 2016
Cash Tom Spot Forward Total AverageSettlement
Period TradesValue(USDMn)
Value(` Cr)
TradesValue(USDMn)
Value(` Cr)
TradesValue(USDMn)
Value(` Cr)
TradesValue(USDMn)
Value(` Cr)
TradesValue(USDMn)
Value(` Cr)
TradesValue(USDMn)
Value(` Cr)
2002-03 - - - - - - 74423 96483 462370 25809 39619 195665 100232 136102 658035 1101 1496 7231
2003-04 1036 5951 26861 1555 9150 41335 251258 354541 1627644 76668 131700 622691 330517 501342 2318531 1425 2161 9994
2004-05 8747 69882 312311 16178 112750 504325 356382 533015 2389936 85020 184133 835863 466327 899780 4042435 1976 3813 17129
2005-06 12946 154626 686160 21307 199621 885585 371059 585089 2594240 84337 240352 1073689 489649 1179688 5239674 2084 5020 22296
2006-07 14292 233010 1050413 25708 316585 1427018 481702 884740 3993765 85106 342646 1551883 606808 1776981 8023078 2550 7466 33710
2007-08 15118 318055 1279466 25598 409979 1652802 609676 1595080 6426403 106683 810551 3368161 757074 3133665 12726832 3181 13167 53474
2008-09 15633 358244 1651695 26536 498767 2299036 675439 1815114 8263760 119912 1086778 4722998 837520 3758904 16937489 3657 16414 73963
2009-10 15733 363904 1719714 27643 484848 2295137 759149 1467601 6951459 81424 672619 3245177 883949 2988971 14211486 3843 12996 61789
2010-11 19778 508131 2311739 32118 651100 2964603 1007258 2119061 9650122 90883 912745 4233688 1150037 4191037 19160153 4792 17463 79834
2011-12 22838 548644 2624112 34391 691043 3304720 1115364 2326368 11141856 110585 1076517 5128924 1283178 4642573 22199612 5579 20185 96520
2012-13 23375 610559 3316787 37349 823910 4477478 1216860 2276085 12374662 118554 1120379 5948085 1396138 4830933 26117013 6018 20823 112573
2013-14 26115 701111 4225846 39467 857366 5151202 1343049 2198833 13243650 103584 986011 5825247 1512215 4743321 28445946 6490 20358 122086
2014-15 29188 837736 5114340 43168 988928 6041012 1560718 2539790 15519691 98632 931337 5868727 1731706 5297790 32543770 7595 23236 142736
2015-16 29214 843416 5512112 43890 1015607 6634573 1708058 2613073 17113232 103967 1017190 6665777 1885129 5489286 35925694 8056 23458 153529
Apr-16 2982 93999 624402 4404 114075 757850 131100 221335 1470615 8444 97199 657238 146930 526607 3510105 9183 32913 219382
May-16 3178 103749 693532 4496 123523 825331 155835 255249 1706473 7910 82844 561004 171419 565364 3786340 8163 26922 180302
Jun-16 3395 116209 781472 4862 138294 929736 159945 245926 1654147 7271 75753 514712 175473 576182 3880068 7976 26190 176367
Jul-16 2697 90083 605227 3828 106464 715627 129225 205612 1383414 6484 66653 455255 142234 468812 3159523 7486 24674 166291
Aug-16 3063 103873 695012 4458 123504 826497 130977 206206 1380300 6583 68961 472165 145081 502544 3373974 6909 23931 160665
2016-17 (UptoAugust 2016)
15315 507913 3399644 22048 605859 4055041 707082 1134328 7594951 36692 391410 2660374 781137 2639509 17710010 7890 26662 178889
116

CC
ILM
on
thly
Ne
wsl
ett
er
statistics
Se
pte
mb
er
20
16
TABLE 56: FOREX TRADE TYPE ANALYSIS Percent
TABLE 57: FOREX DEAL SIZE ANALYSIS Percent
Cash Tom Spot ForwardSettlement Period
Trades Value Trades Value Trades Value Trades Value
2002-03 - - - - 74.25 70.89 25.75 29.11
2003-04 0.31 1.19 0.47 1.83 76.02 70.72 23.20 26.27
2004-05 1.88 7.77 3.47 12.53 76.42 59.24 18.23 20.46
2005-06 2.64 13.11 4.35 16.92 75.78 49.60 17.22 20.37
2006-07 2.36 13.11 4.24 17.82 79.38 49.79 14.03 19.28
2007-08 2.00 10.15 3.38 13.08 80.53 50.90 14.09 25.87
2008-09 1.87 9.53 3.17 13.27 80.65 48.29 14.32 28.91
2009-10 1.78 12.17 3.13 16.22 85.88 49.10 9.21 22.50
2010-11 1.72 12.12 2.79 15.54 87.58 50.56 7.90 21.78
2011-12 1.78 11.82 2.68 14.88 86.92 50.11 8.62 23.19
2012-13 1.67 12.64 2.68 17.05 87.16 47.11 8.49 23.19
2013-14 1.73 14.78 2.61 18.08 88.81 46.36 6.85 20.79
2014-15 1.69 15.81 2.49 18.67 90.13 47.94 5.70 17.58
2015-16 1.55 15.36 2.33 18.50 90.61 47.60 5.52 18.53
Apr-16 2.03 17.85 3.00 21.66 89.23 42.03 5.75 18.46
May-16 1.85 18.35 2.62 21.85 90.91 45.15 4.61 14.65
Jun-16 1.93 20.17 2.77 24.00 91.15 42.68 4.14 13.15
Jul-16 1.90 19.22 2.69 22.71 90.85 43.86 4.56 14.22
Aug-16 2.11 20.67 3.07 24.58 90.28 41.03 4.54 13.72
2016-17(Upto August 2016)
1.96 19.24 2.82 22.95 90.52 42.97 4.70 14.83
< 1 mn 1 mn > 1 mn <= 5 mn > 5 mn <= 10 mn > 10 mn <= 20 mn > 20 mnSettlement
Period% tototaltrades
% tototalvalue
% tototaltrades
% tototalvalue
% tototaltrades
% tototalvalue
% tototaltrades
% tototalvalue
% tototaltrades
% tototalvalue
% tototaltrades
% tototalvalue
2002-03 21.93 7.23 52.61 38.74 24.53 46.47 0.70 4.42 0.19 2.25 0.04 0.89
2003-04 20.74 6.07 49.79 32.82 28.02 50.16 1.07 6.12 0.30 3.18 0.08 1.65
2004-05 21.26 4.77 44.14 22.88 31.22 47.19 1.94 8.70 0.97 8.21 0.47 8.25
2005-06 20.32 3.66 42.70 17.72 31.55 40.18 2.77 10.27 1.58 11.18 1.08 16.99
2006-07 21.57 3.29 39.00 13.32 32.03 34.85 3.68 11.50 1.95 11.41 1.77 25.64
2007-08 16.67 1.81 33.75 8.15 36.19 29.18 8.62 19.93 2.13 8.78 2.63 32.15
2008-09 17.00 1.64 32.19 7.17 35.41 25.85 10.31 22.22 2.16 8.20 2.93 34.92
2009-10 20.10 2.55 44.55 13.18 25.18 23.58 5.90 16.56 1.93 9.78 2.33 34.35
2010-11 18.75 2.21 46.50 12.76 24.77 21.89 5.31 13.81 1.92 9.18 2.75 40.15
2011-12 17.05 2.00 48.47 13.40 22.93 20.98 6.47 17.23 2.13 10.24 2.95 36.16
2012-13 23.80 2.79 46.36 13.40 18.86 17.81 6.25 17.54 1.96 9.88 2.77 38.57
2013-14 27.88 3.63 46.12 14.70 16.68 16.87 4.85 14.94 1.70 9.37 2.78 40.47
2014-15 28.91 4.07 45.66 14.93 16.77 17.27 4.23 13.38 1.61 9.16 2.82 41.19
2015-16 33.13 5.03 42.61 14.63 16.25 17.33 3.06 10.01 1.40 8.30 3.55 44.70
Apr-16 33.47 4.16 39.26 10.96 12.48 8.44 0.53 1.07 0.90 3.70 13.35 71.68
May-16 32.48 4.36 42.18 12.79 12.89 9.61 0.51 1.10 0.71 3.18 11.24 68.96
Jun-16 33.27 4.42 42.88 13.06 12.00 8.91 0.52 1.12 0.69 3.09 10.65 69.40
Jul-16 33.34 4.42 42.29 12.83 12.33 9.09 0.57 1.24 0.75 3.35 10.72 69.06
Aug-16 33.82 4.31 41.21 11.90 12.11 8.56 0.53 1.09 0.88 3.73 11.46 70.42
2016-17 (UptoAugust 2016)
33.25 4.34 41.63 12.32 12.36 8.93 0.53 1.12 0.78 3.40 11.45 69.89
117
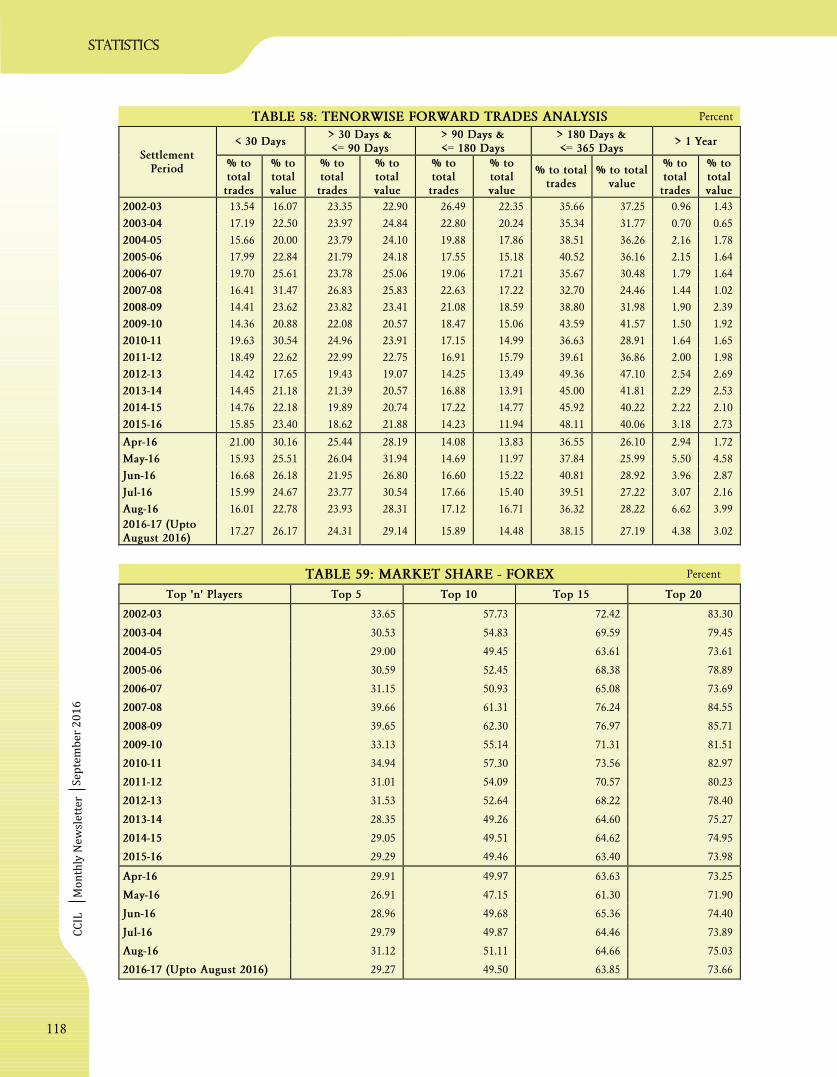
CC
ILM
on
thly
Ne
wsl
ett
er
statistics
Se
pte
mb
er
20
16
TABLE 58: TENORWISE FORWARD TRADES ANALYSIS Percent
TABLE 59: MARKET SHARE - FOREX Percent
< 30 Days> 30 Days &<= 90 Days
> 90 Days &<= 180 Days
> 180 Days &<= 365 Days
> 1 YearSettlement
Period % tototaltrades
% tototalvalue
% tototaltrades
% tototalvalue
% tototaltrades
% tototalvalue
% to totaltrades
% to totalvalue
% tototaltrades
% tototalvalue
2002-03 13.54 16.07 23.35 22.90 26.49 22.35 35.66 37.25 0.96 1.43
2003-04 17.19 22.50 23.97 24.84 22.80 20.24 35.34 31.77 0.70 0.65
2004-05 15.66 20.00 23.79 24.10 19.88 17.86 38.51 36.26 2.16 1.78
2005-06 17.99 22.84 21.79 24.18 17.55 15.18 40.52 36.16 2.15 1.64
2006-07 19.70 25.61 23.78 25.06 19.06 17.21 35.67 30.48 1.79 1.64
2007-08 16.41 31.47 26.83 25.83 22.63 17.22 32.70 24.46 1.44 1.02
2008-09 14.41 23.62 23.82 23.41 21.08 18.59 38.80 31.98 1.90 2.39
2009-10 14.36 20.88 22.08 20.57 18.47 15.06 43.59 41.57 1.50 1.92
2010-11 19.63 30.54 24.96 23.91 17.15 14.99 36.63 28.91 1.64 1.65
2011-12 18.49 22.62 22.99 22.75 16.91 15.79 39.61 36.86 2.00 1.98
2012-13 14.42 17.65 19.43 19.07 14.25 13.49 49.36 47.10 2.54 2.69
2013-14 14.45 21.18 21.39 20.57 16.88 13.91 45.00 41.81 2.29 2.53
2014-15 14.76 22.18 19.89 20.74 17.22 14.77 45.92 40.22 2.22 2.10
2015-16 15.85 23.40 18.62 21.88 14.23 11.94 48.11 40.06 3.18 2.73
Apr-16 21.00 30.16 25.44 28.19 14.08 13.83 36.55 26.10 2.94 1.72
May-16 15.93 25.51 26.04 31.94 14.69 11.97 37.84 25.99 5.50 4.58
Jun-16 16.68 26.18 21.95 26.80 16.60 15.22 40.81 28.92 3.96 2.87
Jul-16 15.99 24.67 23.77 30.54 17.66 15.40 39.51 27.22 3.07 2.16
Aug-16 16.01 22.78 23.93 28.31 17.12 16.71 36.32 28.22 6.62 3.99
2016-17 (UptoAugust 2016)
17.27 26.17 24.31 29.14 15.89 14.48 38.15 27.19 4.38 3.02
Top 'n' Players Top 5 Top 10 Top 15 Top 20
2002-03 33.65 57.73 72.42 83.30
2003-04 30.53 54.83 69.59 79.45
2004-05 29.00 49.45 63.61 73.61
2005-06 30.59 52.45 68.38 78.89
2006-07 31.15 50.93 65.08 73.69
2007-08 39.66 61.31 76.24 84.55
2008-09 39.65 62.30 76.97 85.71
2009-10 33.13 55.14 71.31 81.51
2010-11 34.94 57.30 73.56 82.97
2011-12 31.01 54.09 70.57 80.23
2012-13 31.53 52.64 68.22 78.40
2013-14 28.35 49.26 64.60 75.27
2014-15 29.05 49.51 64.62 74.95
2015-16 29.29 49.46 63.40 73.98
Apr-16 29.91 49.97 63.63 73.25
May-16 26.91 47.15 61.30 71.90
Jun-16 28.96 49.68 65.36 74.40
Jul-16 29.79 49.87 64.46 73.89
Aug-16 31.12 51.11 64.66 75.03
2016-17 (Upto August 2016) 29.27 49.50 63.85 73.66
118

CC
ILM
on
thly
Ne
wsl
ett
er
TABLE 60: CATEGORYWISE FOREX ACTIVITY - DEAL TYPE
Market Share (%)
statistics
Se
pte
mb
er
20
16
TABLE 61: NETTING FACTOR - FOREX Amount in USD Million
Settlement Period Gross Net Netting Factor (%)
2002-03 136102 24687 81.86
2003-04 501342 83849 83.28
2004-05 899778 94395 89.51
2005-06 1179688 115909 90.17
2006-07 1776980 171832 90.33
2007-08 3133665 239169 92.37
2008-09 3758905 209822 94.42
2009-10 2988971 177192 94.07
2010-11 4191037 212265 94.94
2011-12 4642573 214730 95.37
2012-13 4830933 222470 95.39
2013-14 4743321 255080 94.62
2014-15 5297790 280097 94.71
2015-16 5489286 250784 95.43
Apr-16 526607 21322 95.95
May-16 565364 25660 95.46
Jun-16 576182 30289 94.74
Jul-16 468812 25424 94.58
Aug-16 502544 26938 94.64
2016-17 (Upto August 2016) 2639509 129632 95.09
CATEGORY CASH TOM SPOT FORWARD
Foreign Banks 41.40 41.27 34.66 42.86
Public Sector Banks 32.70 32.48 39.87 29.65
Private Sector Banks 25.86 26.22 25.15 27.41
Cooperative Banks 0.04 0.03 0.32 0.08
Financial Institutions 0.01 0.00 0.00 0.00
119

CC
ILM
on
thly
Ne
wsl
ett
er
TABLE 62: FOREX FORWARD SETTLEMENT STATISTICS
* Commenced operation from December 1, 2009# Mandate by RBI for CCP Clearing of Forward trades w.e.f. June, 2014
Number of Participants: 86
FOREX FORWARD
Amount in USD Million
statistics
Se
pte
mb
er
20
16
TABLE 63: CLS SETTLEMENT
CONTINUOUS LINKED SETTLEMENT (CLS)
Number of Participants: 35
Amount in USD Million
Settlement Period Trades Gross Value Net Value Netting Factor (%)
2005-06 43788 67858 10143 85.05
2006-07 138797 327380 33493 89.77
2007-08 188741 681369 51428 92.45
2008-09 247571 499318 53726 89.24
2009-10 295258 391932 52239 86.67
2010-11 394315 469873 60605 87.10
2011-12 441933 647151 76881 88.12
2012-13 570308 724121 55305 92.36
2013-14 594816 629830 54870 91.29
2014-15 571559 592450 51981 91.23
2015-16 682758 585336 61339 89.52
Apr-16 46830 41359 4357 89.47
May-16 60706 55071 4497 91.83
Jun-16 68015 62158 6156 90.10
Jul-16 62339 55192 5202 90.57
Aug-16 56927 50130 5066 89.89
2016-17 (UptoAugust 2016)
294817 263910 25279 90.42
Outstanding AcceptedSettlement Period
Trades Volume Trades Volume
2009-10 * 4965 29671 6969 41092
2010-11 11528 61293 28868 150505
2011-12 17200 100791 40760 240384
2012-13 20419 122937 50146 287697
2013-14 16861 89517 46640 254982
2014-15# 50536 415534 101372 914979
2015-16 42507 371034 94770 964070
Apr-16 42443 358862 8297 84123
May-16 44307 378409 9715 101756
Jun-16 45874 395449 8784 92046
Jul-16 45869 400932 6439 71719
Aug-16 46855 419356 7538 87257
120
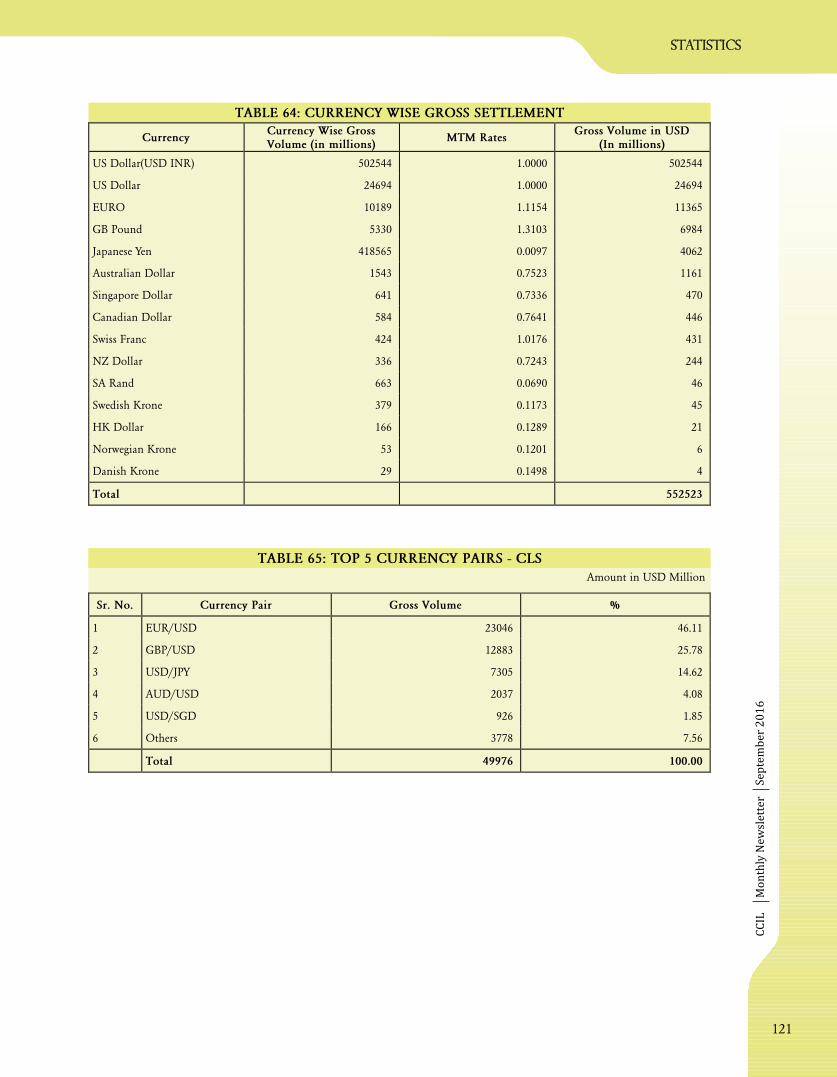
CC
ILM
on
thly
Ne
wsl
ett
er
statistics
TABLE 64: CURRENCY WISE GROSS SETTLEMENT
Se
pte
mb
er
20
16
TABLE 65: TOP 5 CURRENCY PAIRS - CLS
Amount in USD Million
Sr. No. Currency Pair Gross Volume %
1 EUR/USD 23046 46.11
2 GBP/USD 12883 25.78
3 USD/JPY 7305 14.62
4 AUD/USD 2037 4.08
5 USD/SGD 926 1.85
6 Others 3778 7.56
Total 49976 100.00
CurrencyCurrency Wise GrossVolume (in millions)
MTM RatesGross Volume in USD
(In millions)
US Dollar(USD INR) 502544 1.0000 502544
US Dollar 24694 1.0000 24694
EURO 10189 1.1154 11365
GB Pound 5330 1.3103 6984
Japanese Yen 418565 0.0097 4062
Australian Dollar 1543 0.7523 1161
Singapore Dollar 641 0.7336 470
Canadian Dollar 584 0.7641 446
Swiss Franc 424 1.0176 431
NZ Dollar 336 0.7243 244
SA Rand 663 0.0690 46
Swedish Krone 379 0.1173 45
HK Dollar 166 0.1289 21
Norwegian Krone 53 0.1201 6
Danish Krone 29 0.1498 4
Total 552523
121

CC
ILM
on
thly
Ne
wsl
ett
er
statistics
FOREX TRADING PLATFORM: FX-CLEAR
7Number of Participants: 7
TABLE 66: TRADING DETAILS
Amount in USD Million
Se
pte
mb
er
20
16
Spot Daily AveragePeriod
Trades Value Trades Value
2003-04 881 646 5 4
2004-05 3329 2250 13 9
2005-06 16636 11893 67 48
2006-07 46553 33264 190 136
2007-08 73943 49139 297 197
2008-09 79125 46889 330 195
2009-10 99090 53435 415 224
2010-11 111023 58577 448 236
2011-12 124664 65197 522 273
2012-13 171398 87689 708 362
2013-14 223396 113580 919 467
2014-15 335515 188421 1416 795
2015-16 453563 246902 1882 1024
Apr-16 35200 18663 2200 1166
May-16 39682 21364 1804 971
Jun-16 42423 22470 1928 1021
Jul-16 33875 18101 1694 905
Aug-16 41423 23200 1973 1105
2016-17 (UptoAugust 2016)
192603 103796 1907 1028
122

CC
ILM
on
thly
Ne
wsl
ett
er
DERIVATIVES
Number of Participants: 70
INTEREST RATE DERIVATIVES
Amount Crore`
Amount Crore and Share in %`
TABLE : INTEREST RATE SWAP TRANSACTIONS (MATCHED) -67 AUGUST 2016
statistics
Se
pte
mb
er
20
16
TABLE : INTEREST RATE SWAP (MIBOR) MARKET SHARE -68 AUGUST 2016
MIBOR MIFOR INBMK TotalDate
Trades Value Trades Value Trades Value Trades Value
1-Aug-16 136 7700 13 575 - - 149 8275
2-Aug-16 62 4750 - - - - 62 4750
3-Aug-16 82 8700 4 225 - - 86 8925
4-Aug-16 65 4825 - - - - 65 4825
5-Aug-16 68 5825 9 250 - - 77 6075
8-Aug-16 54 3210 11 710 - - 65 3920
9-Aug-16 107 6845 9 450 - - 116 7295
10-Aug-16 115 7905 13 1270 - - 128 9175
11-Aug-16 95 8750 22 2245 - - 117 10995
12-Aug-16 79 5550 8 425 - - 87 5975
16-Aug-16 101 6305 4 175 - - 105 6480
18-Aug-16 110 9625 7 375 - - 117 10000
19-Aug-16 95 10900 - - - - 95 10900
22-Aug-16 164 13565 6 675 - - 170 14240
23-Aug-16 134 12450 6 625 - - 140 13075
24-Aug-16 125 12050 13 740 - - 138 12790
25-Aug-16 97 17390 10 450 - - 107 17840
26-Aug-16 36 3275 3 125 - - 39 3400
29-Aug-16 48 5150 14 1165 - - 62 6315
30-Aug-16 73 6200 9 300 - - 82 6500
31-Aug-16 29 3050 7 300 - - 36 3350
Total 1875 164020 168 11080 - - 2043 175100
Average 89 7810 9 616 - - 97 8338
Buy Sell TotalCategory
DealsMarketShare
NotionalAmount
MarketShare
DealsMarketShare
NotionalAmount
MarketShare
DealsMarketShare
NotionalAmount
MarketShare
Foreign Banks 1199 63.95 120150 73.25 1300 69.33 104730 63.85 2499 66.64 224880 68.55
Nationalized Banks 19 1.01 525 0.32 7 0.37 200 0.12 26 0.69 725 0.22
Primary Dealers 348 18.56 21200 12.93 247 13.17 33875 20.65 595 15.87 55075 16.79
Private Banks 309 16.48 22145 13.50 321 17.12 25215 15.37 630 16.80 47360 14.44
Total 1875 100.00 164020 100.00 1875 100.00 164020 100.00 3750 100.00 328040 100.00
123
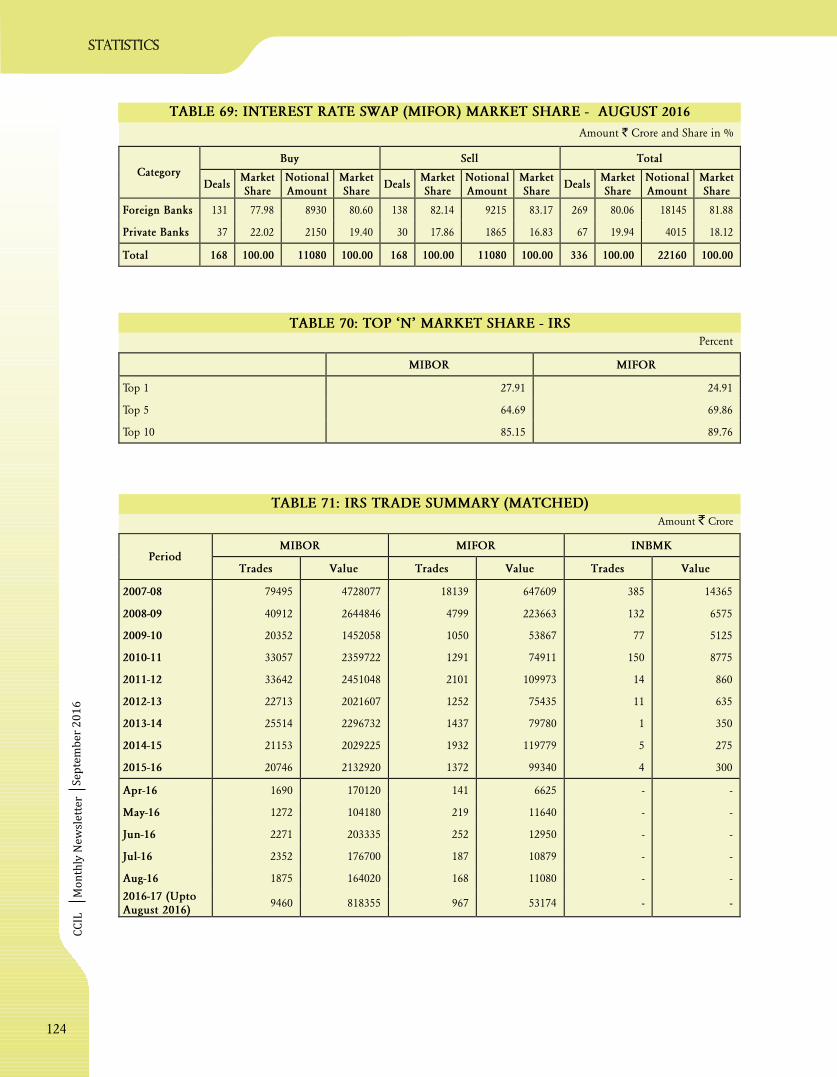
CC
ILM
on
thly
Ne
wsl
ett
er
TABLE 6 : INTEREST RATE SWAP (MIFOR) MARKET SHARE - AUGUST 20169
Amount Crore and Share in %`
TABLE 70: TOP ‘N’ MARKET SHARE - IRS
TABLE 71: IRS TRADE SUMMARY (MATCHED)Amount Crore`
Percent
statistics
Se
pte
mb
er
20
16
MIBOR MIFOR
Top 1 27.91 24.91
Top 5 64.69 69.86
Top 10 85.15 89.76
Buy Sell TotalCategory
DealsMarketShare
NotionalAmount
MarketShare
DealsMarketShare
NotionalAmount
MarketShare
DealsMarketShare
NotionalAmount
MarketShare
Foreign Banks 131 77.98 8930 80.60 138 82.14 9215 83.17 269 80.06 18145 81.88
Private Banks 37 22.02 2150 19.40 30 17.86 1865 16.83 67 19.94 4015 18.12
Total 168 100.00 11080 100.00 168 100.00 11080 100.00 336 100.00 22160 100.00
MIBOR MIFOR INBMKPeriod
Trades Value Trades Value Trades Value
2007-08 79495 4728077 18139 647609 385 14365
2008-09 40912 2644846 4799 223663 132 6575
2009-10 20352 1452058 1050 53867 77 5125
2010-11 33057 2359722 1291 74911 150 8775
2011-12 33642 2451048 2101 109973 14 860
2012-13 22713 2021607 1252 75435 11 635
2013-14 25514 2296732 1437 79780 1 350
2014-15 21153 2029225 1932 119779 5 275
2015-16 20746 2132920 1372 99340 4 300
Apr-16 1690 170120 141 6625 - -
May-16 1272 104180 219 11640 - -
Jun-16 2271 203335 252 12950 - -
Jul-16 2352 176700 187 10879 - -
Aug-16 1875 164020 168 11080 - -
2016-17 (UptoAugust 2016)
9460 818355 967 53174 - -
124

CC
ILM
on
thly
Ne
wsl
ett
er
Number of Participants: 44
TABLE 72: OUTSTANDING POSITION IN IRS TRANSACTIONSAmount Crore`
TABLE 73: NETTING FACTOR - IRS NON-GUARANTEED SETTLEMENT
Amount Crore`
statistics
Se
pte
mb
er
20
16
MIBOR MIFOR INBMK TotalPeriod
TradesNotional
SumTrades
NotionalSum
TradesNotional
SumTrades
NotionalSum
2007-08 61665 3655595 16528 611566 368 13690 78561 4280852
2008-09 23732 1394018 11803 468045 461 18715 35996 1880778
2009-10 29853 1748787 8201 326852 450 20385 38504 2096024
2010-11 43197 2645709 6357 270080 542 26910 50096 2942699
2011-12 27613 1975121 6402 296491 520 25910 34535 2297521
2012-13 20958 1554242 6017 294937 489 24845 27464 1874024
2013-14 17782 1447259 5566 276349 445 22420 23793 1746028
2014-15 17279 1495595 6222 326724 387 19320 23888 1841640
2015-16 16858 1368453 6171 349766 272 13585 23301 1731804
2016-17 (UptoAugust 2016)
21056 1465689 6307 359008 221 10710 27584 1835407
Settlement Period Gross Amount Net Amount Netting %
2009-10 13827 3688 73.33
2010-11 22794 5250 76.97
2011-12 28328 7735 72.69
2012-13 23797 6732 71.71
2013-14 19667 6947 64.67
2014-15 16361 6073 62.88
2015-16 7374 2442 66.89
Apr-16 501 158 68.47
May-16 472 183 61.27
Jun-16 515 220 57.25
Jul-16 521 189 63.64
Aug-16 497 180 63.86
2016-17 (Upto August 2016) 2505 930 62.89
125

CC
ILM
on
thly
Ne
wsl
ett
er
statistics
TABLE : TRADED VOLUME FOR OTC INTERBANK FCY - INR FORWARDS FOR THE MONTH OF7 20164 AUGUST
FOREX DERIVATIVES
* OTHERS includes all the other currency pairs wherein base amount is depicted in USD equivalentTop 5 Currency pairs, in terms of average daily volumes traded during the month, represented with respect to volumes inBase Currency
Se
pte
mb
er
20
16
USD / INR EUR / INR GBP / INR AUD / INR CAD / INR OTHERS *
DateTrades
Volume(in
Million)Trades
Volume(in
Million)Trades
Volume(in
Million)Trades
Volume(in
Million)Trades
Volume(in
Million)Trades
Volume(USD inMillion)
01-Aug-16 442 4,838.04 4 0.26 1 0.03 - - - - - -
02-Aug-16 339 3,712.56 - - 1 0.05 - - - - - -
03-Aug-16 431 7,460.46 5 0.46 4 0.58 1 0.09 - - - -
04-Aug-16 272 2,331.33 2 0.09 - - - - - - - -
05-Aug-16 293 2,715.99 1 0.03 1 0.03 - - - - - -
08-Aug-16 363 2,894.39 - - - - - - - - - -
09-Aug-16 265 2,968.50 1 0.07 - - 1 0.08 - - - -
10-Aug-16 480 3,896.31 1 1.20 1 3.25 - - - - - -
11-Aug-16 330 3,936.89 8 1.08 3 0.12 - - - - - -
12-Aug-16 273 3,274.64 1 0.04 - - - - - - - -
16-Aug-16 329 3,865.73 3 0.28 - - - - 1 0.03 - -
18-Aug-16 291 2,982.93 1 0.05 - - - - - - - -
19-Aug-16 340 3,155.33 4 0.35 - - - - - - - -
22-Aug-16 351 3,602.68 3 0.23 - - - - - - - -
23-Aug-16 370 4,237.22 8 0.83 - - - - - - - -
24-Aug-16 358 4,758.12 4 0.23 - - - - - - - -
25-Aug-16 222 2,207.83 - - 1 0.06 - - - - - -
26-Aug-16 397 4,451.89 1 0.03 - - - - - - - -
29-Aug-16 585 6,378.63 1 0.02 - - - - 1 0.05 1 0.01
30-Aug-16 359 5,219.07 2 0.07 - - - - - - - -
31-Aug-16 530 9,173.62 3 0.16 1 0.03 - - - - - -
Total 7620 88062.16 53 5.46 13 4.15 2 0.17 2 0.08 1 0.01
126
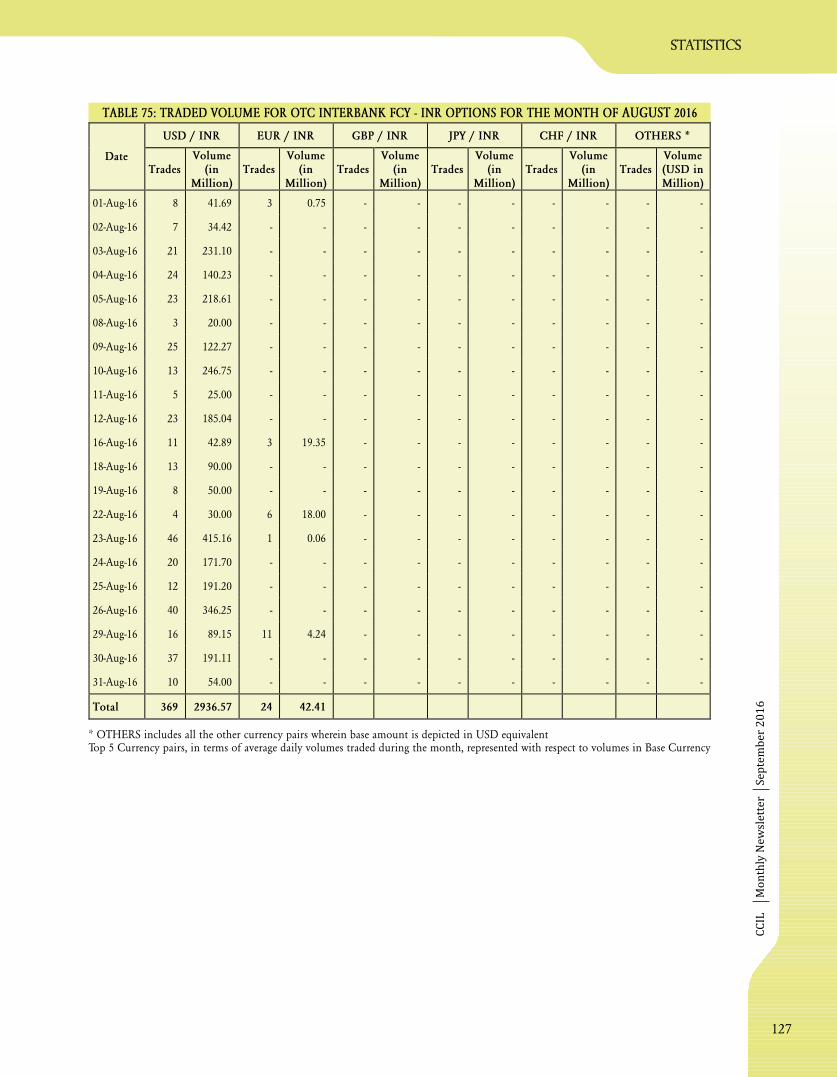
CC
ILM
on
thly
Ne
wsl
ett
er
statistics
TABLE 7 : TRADED VOLUME FOR OTC INTERBANK FCY - INR OPTIONS FOR THE MONTH OF5 AUGUST 2016
* OTHERS includes all the other currency pairs wherein base amount is depicted in USD equivalentTop 5 Currency pairs, in terms of average daily volumes traded during the month, represented with respect to volumes in Base Currency
Se
pte
mb
er
20
16
USD / INR EUR / INR GBP / INR JPY / INR CHF / INR OTHERS *
DateTrades
Volume(in
Million)Trades
Volume(in
Million)Trades
Volume(in
Million)Trades
Volume(in
Million)Trades
Volume(in
Million)Trades
Volume(USD inMillion)
01-Aug-16 8 41.69 3 0.75 - - - - - - - -
02-Aug-16 7 34.42 - - - - - - - - - -
03-Aug-16 21 231.10 - - - - - - - - - -
04-Aug-16 24 140.23 - - - - - - - - - -
05-Aug-16 23 218.61 - - - - - - - - - -
08-Aug-16 3 20.00 - - - - - - - - - -
09-Aug-16 25 122.27 - - - - - - - - - -
10-Aug-16 13 246.75 - - - - - - - - - -
11-Aug-16 5 25.00 - - - - - - - - - -
12-Aug-16 23 185.04 - - - - - - - - - -
16-Aug-16 11 42.89 3 19.35 - - - - - - - -
18-Aug-16 13 90.00 - - - - - - - - - -
19-Aug-16 8 50.00 - - - - - - - - - -
22-Aug-16 4 30.00 6 18.00 - - - - - - - -
23-Aug-16 46 415.16 1 0.06 - - - - - - - -
24-Aug-16 20 171.70 - - - - - - - - - -
25-Aug-16 12 191.20 - - - - - - - - - -
26-Aug-16 40 346.25 - - - - - - - - - -
29-Aug-16 16 89.15 11 4.24 - - - - - - - -
30-Aug-16 37 191.11 - - - - - - - - - -
31-Aug-16 10 54.00 - - - - - - - - - -
Total 369 2936.57 24 42.41
127

CC
ILM
on
thly
Ne
wsl
ett
er
statistics
Se
pte
mb
er
20
16
TABLE 7 : TRADED PRINCIPAL AMOUNT FOR OTC INTERBANK FCY -INR CROSS CURRENCY SWAPS FOR THE MONTH OF 2016
6AUGUST
* OTHERS includes all the other currency pairs wherein base amount is depicted in USD equivalentTop 5 Currency pairs, in terms of average daily volumes traded during the month, represented with respect to volumes in Base Currency
USD - INR EUR - INR GBP - INR JPY - INR CHF - INR OTHERS *
DateTrades
Amountsin
Million,Base
Currency
Trades
Amountsin
Million,Base
Currency
Trades
Amountsin
Million,Base
Currency
Trades
Amountsin
Million,Base
Currency
Trades
Amountsin
Million,Base
Currency
Trades
Amountsin
Million,USD
05-Aug-16 1 10.00 - - - - - - - - - -
08-Aug-16 1 20.00 - - - - - - - - - -
09-Aug-16 2 7.98 - - - - - - - - - -
10-Aug-16 1 1.00 - - - - - - - - - -
12-Aug-16 2 26.20 - - - - - - - - - -
25-Aug-16 1 40.00 - - - - - - - - - -
29-Aug-16 1 7.44 - - - - - - - - - -
30-Aug-16 1 48.47 - - - - - - - - - -
Total 10 161.08
128

CC
ILM
on
thly
Ne
wsl
ett
er
statistics
Se
pte
mb
er
20
16
TABLE 7 : TRADED VOLUME FOR OTC INTERBANK FCY - FCY FORWARDS FOR THE MONTH OF7 AUGUST 2016
* OTHERS includes all the other currency pairs wherein base amount is depicted in USD equivalentTop 5 Currency pairs, in terms of average daily volumes traded during the month, represented with respect to volumes inBase Currency
EUR / USD GBP / USD USD / JPY AUD / USD USD / CAD OTHERS *
DateTrades
Volume(in
Million)Trades
Volume(in
Million)Trades
Volume(in
Million)Trades
Volume(in
Million)Trades
Volume(in
Million)Trades
Volume(USD inMillion)
01-Aug-16 153 88.53 54 48.75 22 43.82 14 20.60 9 3.87 61 46.86
02-Aug-16 119 138.44 64 88.77 22 27.36 53 49.04 3 2.85 54 64.34
03-Aug-16 239 1,035.54 78 195.87 18 48.20 19 16.78 4 4.39 19 48.96
04-Aug-16 126 229.13 67 66.41 25 270.66 19 18.18 1 1.99 19 12.49
05-Aug-16 100 195.49 34 58.80 16 32.41 16 13.73 6 2.54 11 3.98
08-Aug-16 130 181.80 65 103.84 27 22.80 23 65.37 8 4.92 31 66.61
09-Aug-16 112 218.94 65 121.74 16 8.74 16 11.06 5 4.19 30 17.20
10-Aug-16 154 130.45 38 72.41 27 42.95 21 13.35 11 14.08 35 15.57
11-Aug-16 245 312.70 53 123.52 32 28.36 24 34.77 8 3.86 60 20.50
12-Aug-16 244 270.79 99 52.08 35 58.69 27 26.50 21 7.17 62 51.72
15-Aug-16 1 1.00 1 0.50 1 0.99 3 11.25 - - - -
16-Aug-16 386 283.43 74 59.32 62 49.81 45 79.43 23 43.74 47 26.86
17-Aug-16 7 11.70 1 2.00 4 12.18 1 0.50 - - - -
18-Aug-16 357 246.80 78 194.02 29 25.58 32 82.57 17 4.13 38 39.47
19-Aug-16 278 216.62 54 125.75 12 34.31 45 54.24 17 10.76 54 8.22
22-Aug-16 190 177.07 77 46.45 26 30.83 24 27.03 5 4.88 27 17.18
23-Aug-16 301 158.41 91 80.83 21 32.16 29 448.93 8 2.70 30 85.46
24-Aug-16 190 144.17 58 54.35 22 29.38 17 83.21 8 34.09 53 84.21
25-Aug-16 124 132.29 51 79.89 31 196.16 17 56.92 7 3.36 42 47.56
26-Aug-16 177 255.49 54 94.49 47 30.83 24 64.35 20 20.91 64 32.14
29-Aug-16 173 521.48 82 614.25 43 182.37 60 146.45 18 41.30 104 76.20
30-Aug-16 164 304.21 70 125.57 44 86.65 25 89.42 23 48.12 71 117.85
31-Aug-16 228 452.85 64 118.93 40 219.04 20 32.96 14 12.15 41 48.08
Total 4198 5,707.34 1372 2,528.55 622 1,514.28 574 1,446.65 236 275.98 953 931.45
129

TABLE 7 : TRADED PRINCIPAL AMOUNT FOR OTC INTERBANK FCY - FCYCROSS CURRENCY SWAPS FOR THE MONTH OF
9AUGUST 2016
* OTHERS includes all the other currency pairs wherein base amount is depicted in USD equivalentTop 5 Currency pairs, in terms of average daily volumes traded during the month, represented with respect to volumes inBase CurrencyMost of the FCY/FCY trades are with overseas counterparties and hence the reporting is single sided by the domestic counterparty.CCIL shall not be liable for errors committed by the reporting party in the absence of matching of primary economic parameters.
CC
ILM
on
thly
Ne
wsl
ett
er
statistics
Se
pte
mb
er
20
16
TABLE 7 TRADED VOLUME FOR OTC INTERBANK FCY - FCY OPTIONS FOR THE MONTH OF8 AUGUST: 2016
* OTHERS includes all the other currency pairs wherein base amount is depicted in USD equivalentTop 5 Currency pairs, in terms of average daily volumes traded during the month, represented with respect to volumes in Base Currency
EUR / USD GBP / USD USD / JPY AUD / USD USD / CAD OTHERS *
DateTrades
Volume(in
Million)Trades
Volume(in
Million)Trades
Volume(in
Million)Trades
Volume(in
Million)Trades
Volume(in
Million)Trades
Volume(USD inMillion)
01-Aug-16 - - - - - - 2 8.00 - - - -
02-Aug-16 29 379.00 12 480.00 3 15.00 8 130.00 - - - -
03-Aug-16 - - 2 6.20 4 40.00 - - - - - -
04-Aug-16 2 10.00 2 30.00 - - 2 10.00 - - - -
05-Aug-16 2 50.00 - - 1 19.88 - - - - - -
08-Aug-16 3 75.00 7 35.00 7 46.64 2 4.00 1 20.00 - -
09-Aug-16 1 5.00 3 15.00 - - 2 10.00 - - - -
10-Aug-16 2 10.00 - - - - 3 15.00 - - - -
11-Aug-16 9 78.00 4 40.00 - - 1 10.00 - - - -
12-Aug-16 5 45.00 - - - - 2 20.00 1 20.00 - -
16-Aug-16 10 56.00 1 10.00 18 73.00 2 40.00 - - - -
17-Aug-16 - - 1 5.00 4 25.00 - - - - - -
18-Aug-16 6 30.00 - - 3 49.77 3 15.00 - - - -
19-Aug-16 4 25.00 - - - - 1 20.00 - - - -
22-Aug-16 8 45.00 - - - - 2 15.00 - - - -
23-Aug-16 1 5.00 - - - - 1 5.00 - - 1 10.00
24-Aug-16 - - - - 4 18.00 4 50.00 - - - -
25-Aug-16 1 10.00 3 15.00 1 20.00 1 10.00 - - - -
26-Aug-16 2 13.00 - - 3 36.00 1 5.00 - - - -
29-Aug-16 3 20.00 - - 1 39.33 1 10.00 - - - -
30-Aug-16 - - - - 3 14.00 - - - - - -
31-Aug-16 1 10.00 3 75.00 2 30.00 1 10.00 - - - -
Total 89 866.00 38 711.20 54 426.61 39 387.00 2 40.00 1 10.00
EUR-USD USD-JPY AUD-JPY AUD-USD EUR-AUD OTHERS*
DateTrades
Amountsin
Million,Base
Currency
Trades
Amountsin
Million,Base
Currency
Trades
Amountsin
Million,Base
Currency
Trades
Amountsin
Million,Base
Currency
Trades
Amountsin
Million,Base
Currency
Trades
Amountsin
Million,USD
11-Aug-16 - - 1 43.84 - - - - - - - -
12-Aug-16 2 33.02 - - - - - - - - - -
18-Aug-16 1 18.23 - - - - - - - - - -
30-Aug-16 2 0.96 - - - - - - - - - -
Total 5 52.21 1 43.84
130

CC
ILM
on
thly
Ne
wsl
ett
er
statistics
TABLE : TRADED NOTIONAL PRINCIPAL FOR OTC INTERBANK FCY - IRS FOR THE MONTH OF80 AUGUST 2016
* OTHERS includes all the other currency pairs wherein base amount is depicted in USD equivalentTop 5 Currency pairs, in terms of average daily volumes traded during the month, represented with respect to volumes inBase CurrencyMost of the FCY/IRS trades are with overseas counterparties and hence the reporting is single sided by the domestic counterparty.CCIL shall not be liable for errors committed by the reporting party in the absence of matching of primary economic parameters.
Se
pte
mb
er
20
16
USD EUR AUD CAD CHF OTHERS *
DateTrades
Notionalin
Million,Base
Currency
Trades
Notionalin
Million,Base
Currency
Trades
Notionalin
Million,Base
Currency
Trades
Notionalin
Million,Base
Currency
Trades
Notionalin
Million,Base
Currency
Trades
Notionalin
Million,USD
01-Aug-16 8 173.66 - - - - - - - - - -
02-Aug-16 7 52.25 - - - - - - - - - -
03-Aug-16 10 126.60 - - - - - - - - - -
04-Aug-16 12 111.12 - - - - - - - - - -
05-Aug-16 8 206.00 - - - - - - - - - -
08-Aug-16 23 609.60 - - - - - - - - - -
09-Aug-16 16 196.68 - - - - - - - - - -
10-Aug-16 18 558.70 - - - - - - - - - -
11-Aug-16 13 235.94 - - - - - - - - - -
12-Aug-16 13 285.94 - - - - - - - - - -
15-Aug-16 2 121.50 - - - - - - - - - -
16-Aug-16 15 338.85 - - - - - - - - - -
17-Aug-16 1 5.00 - - - - - - - - - -
18-Aug-16 10 252.62 - - - - - - - - - -
19-Aug-16 11 205.95 - - - - - - - - - -
22-Aug-16 21 447.97 - - - - - - - - - -
23-Aug-16 15 393.37 - - - - - - - - - -
24-Aug-16 18 540.76 - - - - - - - - - -
25-Aug-16 11 221.19 - - - - - - - - - -
26-Aug-16 19 371.36 - - - - - - - - - -
29-Aug-16 21 320.57 - - - - - - - - - -
30-Aug-16 11 429.70 - - - - - - - - - -
31-Aug-16 8 105.14 - - - - - - - - - -
Total 291 6310.47
131
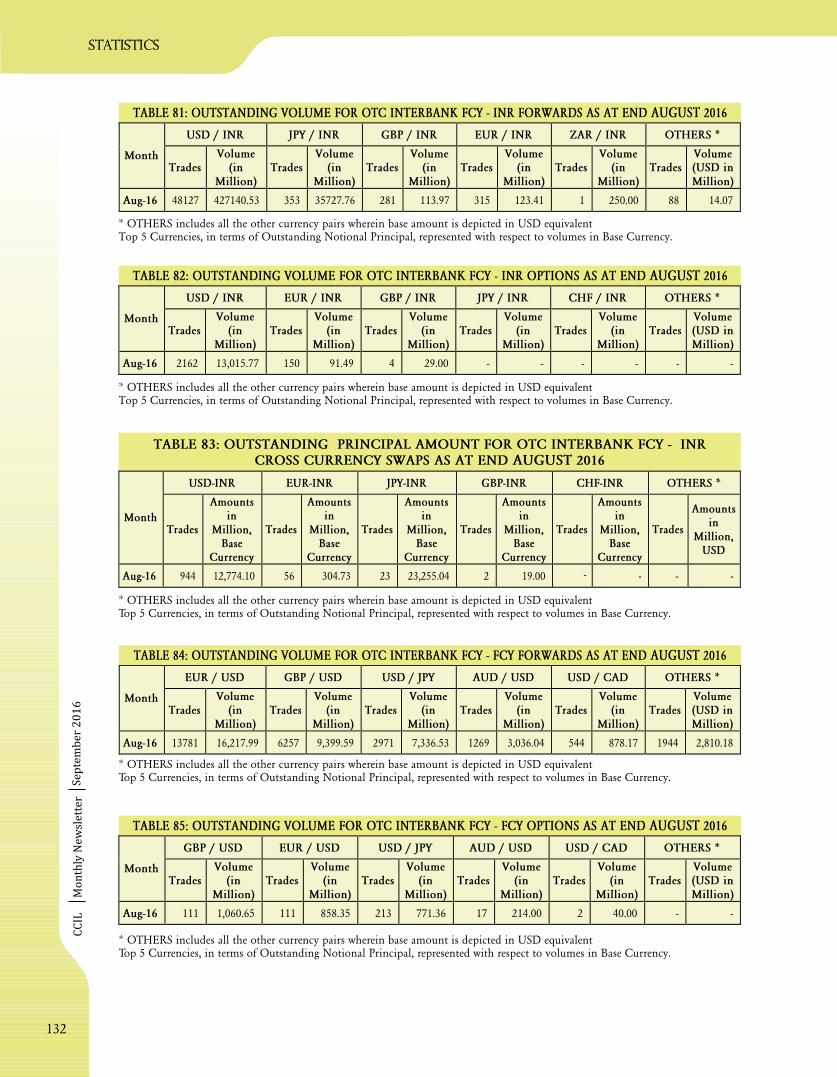
CC
ILM
on
thly
Ne
wsl
ett
er
statistics
TABLE : OUTSTANDING PRINCIPAL AMOUNT FOR OTC INTERBANK FCY - INRCROSS CURRENCY SWAPS AS AT END
83AUGUST 2016
TABLE : OUTSTANDING VOLUME FOR OTC INTERBANK FCY - INR FORWARDS AS AT END81 AUGUST 2016
TABLE : OUTSTANDING VOLUME FOR OTC INTERBANK FCY - INR OPTIONS AS AT END82 AUGUST 2016
* OTHERS includes all the other currency pairs wherein base amount is depicted in USD equivalentTop 5 Currencies, in terms of Outstanding Notional Principal, represented with respect to volumes in Base Currency.
* OTHERS includes all the other currency pairs wherein base amount is depicted in USD equivalentTop 5 Currencies, in terms of Outstanding Notional Principal, represented with respect to volumes in Base Currency.
* OTHERS includes all the other currency pairs wherein base amount is depicted in USD equivalentTop 5 Currencies, in terms of Outstanding Notional Principal, represented with respect to volumes in Base Currency.
TABLE : OUTSTANDING VOLUME FOR OTC INTERBANK FCY - FCY OPTIONS AS AT END8 20165 AUGUST
* OTHERS includes all the other currency pairs wherein base amount is depicted in USD equivalentTop 5 Currencies, in terms of Outstanding Notional Principal, represented with respect to volumes in Base Currency.
Se
pte
mb
er
20
16
TABLE : OUTSTANDING VOLUME FOR OTC INTERBANK FCY - FCY FORWARDS AS AT END8 20164 AUGUST
* OTHERS includes all the other currency pairs wherein base amount is depicted in USD equivalentTop 5 Currencies, in terms of Outstanding Notional Principal, represented with respect to volumes in Base Currency.
USD / INR JPY / INR GBP / INR EUR / INR ZAR / INR OTHERS *
MonthTrades
Volume(in
Million)Trades
Volume(in
Million)Trades
Volume(in
Million)Trades
Volume(in
Million)Trades
Volume(in
Million)Trades
Volume(USD inMillion)
Aug-16 48127 427140.53 353 35727.76 281 113.97 315 123.41 1 250.00 88 14.07
USD / INR EUR / INR GBP / INR JPY / INR CHF / INR OTHERS *
MonthTrades
Volume(in
Million)Trades
Volume(in
Million)Trades
Volume(in
Million)Trades
Volume(in
Million)Trades
Volume(in
Million)Trades
Volume(USD inMillion)
Aug-16 2162 13,015.77 150 91.49 4 29.00 - - - - - -
USD-INR EUR-INR JPY-INR GBP-INR CHF-INR OTHERS *
MonthTrades
Amountsin
Million,Base
Currency
Trades
Amountsin
Million,Base
Currency
Trades
Amountsin
Million,Base
Currency
Trades
Amountsin
Million,Base
Currency
Trades
Amountsin
Million,Base
Currency
Trades
Amountsin
Million,USD
Aug-16 944 12,774.10 56 304.73 23 23,255.04 2 19.00 - - - -
EUR / USD GBP / USD USD / JPY AUD / USD USD / CAD OTHERS *
MonthTrades
Volume(in
Million)Trades
Volume(in
Million)Trades
Volume(in
Million)Trades
Volume(in
Million)Trades
Volume(in
Million)Trades
Volume(USD inMillion)
Aug-16 13781 16,217.99 6257 9,399.59 2971 7,336.53 1269 3,036.04 544 878.17 1944 2,810.18
GBP / USD EUR / USD USD / JPY AUD / USD USD / CAD OTHERS *
MonthTrades
Volume(in
Million)Trades
Volume(in
Million)Trades
Volume(in
Million)Trades
Volume(in
Million)Trades
Volume(in
Million)Trades
Volume(USD inMillion)
Aug-16 111 1,060.65 111 858.35 213 771.36 17 214.00 2 40.00 - -
132

CC
ILM
on
thly
Ne
wsl
ett
er
statistics
TABLE 8 : OUTSTANDING NOTIONAL PRINCIPAL FOR OTC INTERBANK FCY - IRS AS AT END OF7 AUGUST 2016
* OTHERS includes all the other currency pairs wherein base amount is depicted in USD equivalentTop 5 Currency pairs, in terms of average daily volumes traded during the month, represented with respect to volumes inBase Currency for each instrumentMost of the FCY/IRS trades are with overseas counterparties and hence the reporting is single sided by the domestic counterparty.CCIL shall not be liable for errors committed by the reporting party in the absence of matching of primary economic parameters.
TABLE 8 : OUTSTANDING PRINCIPAL AMOUNT FOR OTC INTERBANK FCY -FCY CROSS CURRENCY SWAPS AS AT END
6AUGUST 2016
* OTHERS includes all the other currency pairs wherein base amount is depicted in USD equivalentTop 5 Currency pairs, in terms of average daily volumes traded during the month, represented with respect to volumes inBase Currency
Se
pte
mb
er
20
16
USD-JPY EUR-USD USD-SGD USD-CHF AUD-USD OTHERS *
MonthTrades
Amountsin
Million,Base
Currency
Trades
Amountsin
Million,Base
Currency
Trades
Amountsin
Million,Base
Currency
Trades
Amountsin
Million,Base
Currency
Trades
Amountsin
Million,Base
Currency
Trades
Amountsin
Million,USD
Aug-16 217 4,913.41 310 3,067.50 62 1,698.43 21 405.00 9 424.50 11 184.20
USD EUR JPY SGD AUD OTHERS *
MonthTrades
Notional inMillion,
BaseCurrency
Trades
Notionalin
Million,Base
Currency
Trades
Notionalin
Million,Base
Currency
Trades
Notionalin
Million,Base
Currency
Trades
Notionalin
Million,Base
Currency
Trades
Notionalin
Million,USD
Aug-16 8720 1,37,325.43 65 855.91 58 87,096.50 19 845.00 7 350.00 14 107.44
133

CC
ILM
on
thly
Ne
wsl
ett
er
statistics
HIGHLIGHTS
• Zero coupon yields as on August 31, 2016 moved
to lower levels parallely across the curve as
compared to the yields prevailing a year back. In
the last one month also, the yields moved to
lower level in the short to long term of the curve.
The downward shift was more pronounced in the
long term.
INTEREST RATE MOVEMENT
Chart 1: Zero Coupon Yield Curve
Chart 2: Sovereign Yield Curve
Se
pte
mb
er
20
16
6.30
6.70
7.10
7.50
7.90
8.30
1 2 3 4 5 6 7 8 9 10 11 12 13 14 15 16 17 18 19 20 21 22 23 24 25 26 27 28 29 30 31
Tenor (In years)
Zer
o C
oupon R
ate
(%)
August 31, 2016 July 29, 2016 August 31, 2015
6.30
6.50
6.70
6.90
7.10
7.30
7.50
7.70
7.90
8.10
1 3 5 7 9 11 13 15 17 19 21 23 25 27 29 31
Tenor
(%)
August 31, 2016 July 29, 2016 August 31, 2015
134

CC
ILM
on
thly
Ne
wsl
ett
er
statistics
TABLE 88: SPREAD ANALYSIS - SDL
Note: Spread has been calculated on the basis of deals settled through CCIL taking into account only outright deals of 5 Crore andabove. The methodology and other information on the spread can be requested from Economic Research Department, CCIL
`S
ep
tem
be
r 2
01
6
State Trades Traded Value (` Crore) Average Spread (bps)
ANDHRA PRADESH 132 3127 36
BIHAR 27 743 43
CHATTISGARH 3 55 49
GUJARAT 195 3569 36
HARYANA 201 3517 47
JAMMU AND KASHMIR 14 111 61
JHARKHAND 3 65 40
KARNATAKA 98 1744 41
KERALA 96 2177 37
MADHYA PRADESH 110 2053 36
MAHARASHTRA 547 13403 37
MANIPUR 2 10 34
MEGHALAYA 2 10 23
NAGALAND 2 10 23
ODISHA 7 337 38
PUNJAB 90 2948 35
RAJASTHAN 300 5664 45
TAMIL NADU 269 6414 38
TELANGANA 71 1176 38
UTTAR PRADESH 390 11278 45
UTTARAKHAND 8 263 45
WEST BENGAL 94 3323 38
Total 2661 61998 40
135

CCIL Monthly Newsletter
statis
tic
s
TABLE 89: YIELD MOVEMENTPercent
September 2016
YTMChange inYTM(bps)
YearAugust 31,
2016July 29,2016
June 30,2016
May 31,2016
April 29,2016
March 31,2016
February29, 2016
January29, 2016
December31, 2015
November30, 2015
October30, 2015
September30, 2015
August31,
2015
Monthto
Month
Yearon
Year
2016 7.3803 7.4084 7.3792 7.3957 7.5855
2017 6.8049 6.9130 6.9439 7.0821 7.0607 7.1368 7.3987 7.3400 7.3956 7.4434 7.4143 7.4514 7.7658 -11 -96
2018 5.2752 6.8627 7.0447 7.1156 7.1638 7.1935 7.4577 7.3430 7.6755 7.5362 7.6474 7.4971 7.8128 -159 -254
2019 5.6576 6.9010 7.1317 7.2218 7.2719 7.3670 7.5920 7.4475 7.6136 7.6530 7.5778 7.5389 7.8005 -124 -214
2020 6.4928 6.9945 7.2677 7.3427 7.3899 7.4258 7.6998 7.5809 7.6798 7.8276 7.6807 7.6295 7.8997 -50 -141
2021 7.2180 7.0527 7.3825 7.4479 7.4391 7.5968 7.7916 7.6813 7.8556 7.8792 7.7636 7.7526 8.0027 17 -78
2022 7.1554 7.1662 7.5264 7.5944 7.6099 7.7018 7.9630 7.8072 7.8862 7.9512 7.8125 7.7663 8.0057 -1 -85
2023 7.4038 7.1666 7.5246 7.5882 7.5922 7.6432 7.9329 7.7253 7.7253 7.7825 7.6686 7.6004 7.9121 24 -51
2024 8.0956 7.1757 7.6247 7.5909 7.6014 7.7584 7.9982 7.7842 7.7735 7.8200 7.7991 7.7450 7.9411 92 15
2025 7.7910 7.2260 7.5874 7.6461 7.6278 7.6804 7.8788 7.7832 7.7554 7.7694 7.6358 7.5468 7.7790 56 1
2026 5.5137 7.1748 7.6285 7.4684 7.4415 7.4613 7.6584 7.6551 7.9980 7.9938 7.8558 7.7983 8.0131 -166 -250
2027 7.1823 7.3815 7.6872 7.6134 7.7823 7.8139 8.0987 7.9843 8.0133 8.0058 7.8405 7.8286 7.9669 -20 -78
2028 4.8073 7.3948 7.7203 7.6475 7.8008 7.8462 8.1563 8.0014 8.0258 8.0104 7.8842 7.8152 8.0222 -259 -321
2029 5.7012 7.2704 7.5919 7.6853 7.6381 7.6885 8.0359 7.8840 7.8304 7.7408 7.6342 - - -157 -
2030 6.8453 7.2724 7.6293 7.7572 7.7492 7.8260 8.0667 7.9725 7.9476 7.9120 7.7925 7.6991 7.9142 -43 -107
2032 7.1588 7.4038 7.7650 7.7406 7.8093 7.9314 8.2074 8.1308 8.1193 8.0024 7.8562 7.8299 8.0136 -24 -85
2033 7.3418 7.4110 7.7057 7.8929 7.8628 7.9489 8.2872 8.2252 8.1147 8.0163 7.8574 7.8066 8.0130 -7 -67
2034 6.9675 7.3467 7.6756 7.7748 7.7886 7.8533 8.2255 8.1352 8.0007 7.9270 7.7294 7.9262 8.1365 -38 -117
2035 7.5269 7.2924 7.6868 7.7944 7.7506 7.8842 8.3414 8.0749 8.0694 7.9869 7.8186 7.7856 8.1418 23 -61
2036 6.3969 7.4515 7.7020 7.8725 7.9222 8.0076 8.3971 8.1852 8.1201 7.9870 7.8987 7.8467 8.0348 -105 -164
2039 8.5762 7.2663 7.7273 7.8342 7.9363 8.0315 8.4229 8.3132 8.1972 8.1073 7.9460 7.9557 8.1523 131 42
2040 5.8887 7.3774 7.7735 7.8446 7.8364 7.9425 8.3272 8.2153 8.1250 8.0222 7.8497 7.8487 8.0439 -149 -216
2041 6.7828 7.4351 7.7844 7.8511 7.8456 7.9684 8.3285 8.2271 8.1125 8.0162 7.8611 7.8759 8.0630 -65 -128
2042 7.7362 7.4363 7.7551 7.8534 7.8943 7.9519 8.3362 8.2385 8.1240 8.0213 7.8897 7.8510 8.0375 30 -30
2043 6.4866 7.4374 7.7718 7.9265 7.9256 7.9882 8.3038 8.2685 8.1644 8.0527 7.9410 7.8803 8.0626 -95 -158
2044 8.2418 7.4021 7.7500 7.8755 7.8667 7.9299 8.3012 8.2476 8.0859 7.9969 7.8637 7.8194 7.9981 84 24
2045 7.2830 7.3777 7.7196 7.8475 7.8445 7.9149 8.2813 8.2284 8.0777 7.9932 7.8500 7.8201 7.9874 -9 -70
2055 7.6063 7.3598 7.7291 7.8227 7.8295 7.7769 8.1064 8.0600 7.8822 7.8441 7.7451 - - 25 -
136

CC
ILM
on
thly
Ne
wsl
ett
er
statistics
There were 355 bond issuances in the primary
market for the month of July 2016 against 445
issuances in the previous month. The sector-wise
composition of issuances was as follows: finance
companies -271 issuances , infrastructure
companies-56 issuances, other corporates-21
issuances, manufacturing companies-4 issuances
and oil companies-3 issuances. Fixed coupon
bonds accounted for 70% of the total issuances,
floating rate bonds accounted for 22% of issuances
and the remaining 8% were zero coupon bonds.
The issuances were concentrated mostly in the 2 to
5 year bucket, followed by the 1 to 2 year maturity
bucket.
The maturity wise analysis of the securities issued
during the month is given in the table below:
TABLE 90: PRIMARY MARKET ISSUANCE CORPORATE BONDS - AUGUST 2016
The trading activity in the secondary market for
July 2016 witnessed a 12% increase, with volume
amounting to 83570 crore against 74592 crore in
June 2016.The spreads increased sharply during the
month. AAA 10-year spread and AAA 5-year spread
widened to 78 bps and 96 bps, respectively from 43
bps and 81 bps, respectively in the previous month.
Top two traded corporates for July 2016 were
Reliance Jio Infocomm Limited and Rural
Electrification Corporation Limited.
` `
Source: NSDL
CORPORATE BONDS
Se
pte
mb
er
20
16
TenorBuckets
No. Fixed FloatingZero
Coupon
Avg.Fixed
Coupon(%)
Max.Coupon
(%)
Min.Coupon
(%)Floating Benchmark Remarks
<=1 year 2 2 11.48% 12.25% 10.70% -6 Securities withno specifiedcoupon
> 1 year -<=2 years
92 61 27 4 9.49% 24.00% 0.01%
Nifty 50 Index Linked,HDFC Ltd ShareLinked, Reliance 24Karat Index Linked, 10YR G-sec Index Linked
> 2 years -<=5 years
214 135 66 11 10.00% 20.00% 1.00%Nifty 50 Index Linked,Overnight MIBORLinked
>5 years -<=10 years
47 40 3 2 9.08% 14.30% 7.50% Nifty 50 Index Linked
>10 years-<=15 years
39 36 1 9.10% 12.00% 7.53% -
>15 years 5 5 7.94% 14.30% 0.10% -
Perpetual 3 3 11.28% 12.10% 10.75% -
137

CC
ILM
on
thly
Ne
wsl
ett
er
statistics
PRIMARY ISSUANCE ANALYSIS
FIXED COUPON BONDS
TABLE 91: ANALYSIS OF CORPORATE BOND ISSUANCE
TABLE 92: RATING ANALYSIS OF CORPORATE BOND ISSUANCES
Se
pte
mb
er
20
16
Type Sector Rating No.Avg.
TenorMax.Tenor
Min.Tenor
Avg.Coupon
(%)
Max.Coupon
(%)
Min.Coupon
(%)
PSU Finance AAA 9 5.81 10.01 3.28 7.87 8.02 7.50
PSU Finance AA 1 - - - 10.99 10.99 10.99
PSU Infrastructure AAA 3 12.67 25.02 3.00 7.20 8.03 6.00
PSU Manufacturing AA 2 7.00 7.00 7.00 8.30 8.30 8.30
PVT Finance AAA 71 4.05 10.01 1.25 8.53 9.30 7.65
PVT Finance AA 88 3.89 15.01 1.01 8.88 12.10 8.15
PVT Finance A 18 2.76 3.08 1.00 10.75 12.25 10.00
PVT Finance BBB 3 4.79 6.00 3.00 13.34 14.30 11.41
PVT Finance B 1 2.01 2.01 2.01 20.00 20.00 20.00
PVT Infrastructure AAA 3 6.00 10.00 3.00 8.10 8.24 7.81
PVT Infrastructure AA 8 4.94 10.01 1.72 9.27 10.00 7.60
PVT Infrastructure A 6 3.05 5.00 1.67 10.48 10.50 10.40
PVT Infrastructure BBB 4 3.54 3.67 3.17 11.38 14.00 10.50
PVT Infrastructure BB 4 3.89 5.00 2.60 16.60 19.00 12.00
PVT Infrastructure B 1 1.00 1.00 1.00 10.70 10.70 10.70
PVT Infrastructure NA 20 6.99 14.60 1.08 13.23 24.00 8.00
PVT Manufacturing AAA 3 6.00 10.00 3.00 7.56 7.57 7.53
PVT Manufacturing AA 4 5.17 10.01 2.67 8.82 9.25 8.00
PVT Manufacturing BBB 1 3.03 3.03 3.03 15.75 15.75 15.75
PVT Manufacturing BB 3 3.03 3.03 3.03 16.51 16.68 16.43
PVT Manufacturing NA 2 10.76 20.01 1.50 0.06 0.10 0.01
PVT Others AAA 2 7.50 10.01 5.00 8.08 8.08 8.07
PVT Others AA 9 2.58 5.00 1.50 9.24 11.10 8.25
PVT Others A 3 2.96 3.07 2.80 7.58 10.75 1.25
PVT Others BBB 4 3.57 3.75 3.03 14.44 15.74 14.00
PVT Others BB 4 4.02 5.00 3.03 12.99 17.08 9.00
PVT Others NA 5 5.59 18.01 1.01 18.06 22.50 13.00
Rating No.Avg.
TenorMax.Tenor
Min.Tenor
Avg.Coupon
(%)
Max.Coupon
(%)
Min.Coupon
(%)
AAA 91 4.71 25.02 1.25 8.37 9.30 6.00
AA 112 3.97 15.01 1.01 8.94 12.10 7.60
A 27 2.85 5.00 1.00 10.34 12.25 1.25
BBB 12 3.82 6.00 3.00 13.25 15.75 10.50
BB 11 3.70 5.00 2.60 15.26 19.00 9.00
B 2 1.50 2.01 1.00 15.35 20.00 10.70
NA 27 7.01 20.01 1.01 13.14 24.00 0.01
138
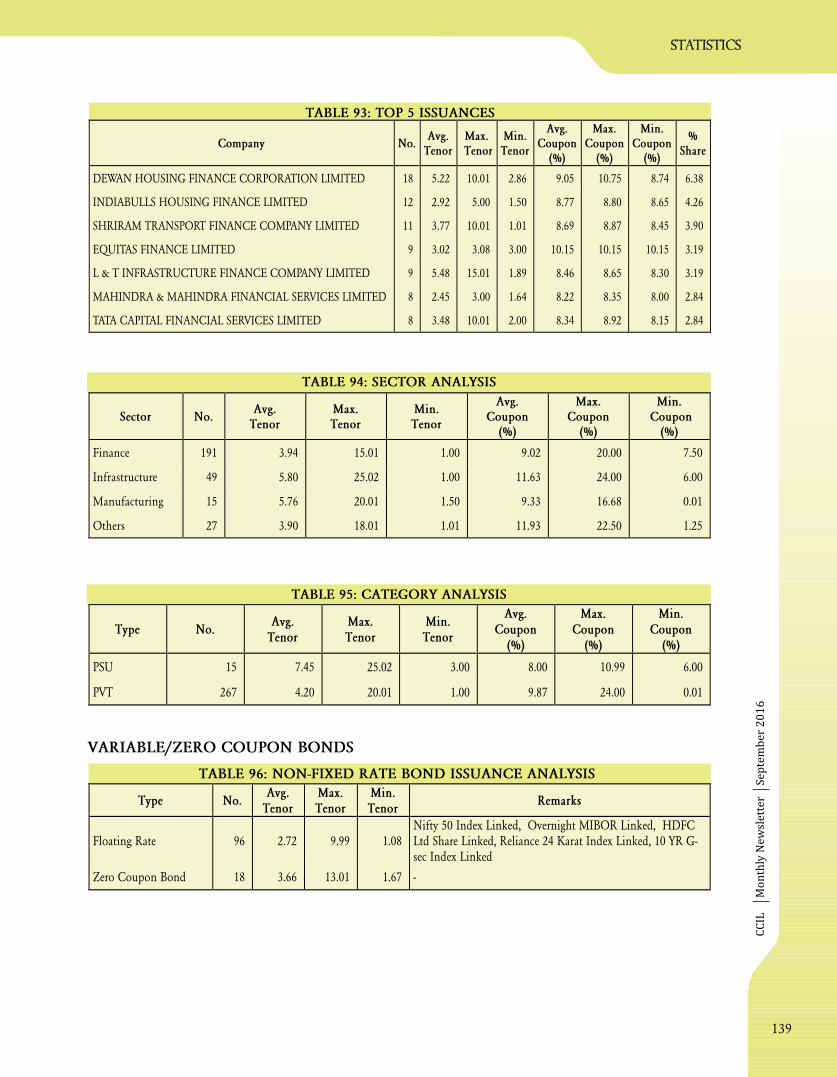
CC
ILM
on
thly
Ne
wsl
ett
er
statistics
TABLE 93: TOP 5 ISSUANCES
TABLE 94: SECTOR ANALYSIS
TABLE 95: CATEGORY ANALYSIS
TABLE 96: NON-FIXED RATE BOND ISSUANCE ANALYSIS
VARIABLE/ZERO COUPON BONDSS
ep
tem
be
r 2
01
6
Company No.Avg.
TenorMax.Tenor
Min.Tenor
Avg.Coupon
(%)
Max.Coupon
(%)
Min.Coupon
(%)
%Share
DEWAN HOUSING FINANCE CORPORATION LIMITED 18 5.22 10.01 2.86 9.05 10.75 8.74 6.38
INDIABULLS HOUSING FINANCE LIMITED 12 2.92 5.00 1.50 8.77 8.80 8.65 4.26
SHRIRAM TRANSPORT FINANCE COMPANY LIMITED 11 3.77 10.01 1.01 8.69 8.87 8.45 3.90
EQUITAS FINANCE LIMITED 9 3.02 3.08 3.00 10.15 10.15 10.15 3.19
L & T INFRASTRUCTURE FINANCE COMPANY LIMITED 9 5.48 15.01 1.89 8.46 8.65 8.30 3.19
MAHINDRA & MAHINDRA FINANCIAL SERVICES LIMITED 8 2.45 3.00 1.64 8.22 8.35 8.00 2.84
TATA CAPITAL FINANCIAL SERVICES LIMITED 8 3.48 10.01 2.00 8.34 8.92 8.15 2.84
Sector No.Avg.
TenorMax.Tenor
Min.Tenor
Avg.Coupon
(%)
Max.Coupon
(%)
Min.Coupon
(%)
Finance 191 3.94 15.01 1.00 9.02 20.00 7.50
Infrastructure 49 5.80 25.02 1.00 11.63 24.00 6.00
Manufacturing 15 5.76 20.01 1.50 9.33 16.68 0.01
Others 27 3.90 18.01 1.01 11.93 22.50 1.25
Type No.Avg.
TenorMax.Tenor
Min.Tenor
Avg.Coupon
(%)
Max.Coupon
(%)
Min.Coupon
(%)
PSU 15 7.45 25.02 3.00 8.00 10.99 6.00
PVT 267 4.20 20.01 1.00 9.87 24.00 0.01
Type No.Avg.
TenorMax.Tenor
Min.Tenor
Remarks
Floating Rate 96 2.72 9.99 1.08Nifty 50 Index Linked, Overnight MIBOR Linked, HDFCLtd Share Linked, Reliance 24 Karat Index Linked, 10 YR G-sec Index Linked
Zero Coupon Bond 18 3.66 13.01 1.67 -
139

CC
ILM
on
thly
Ne
wsl
ett
er
statistics
SECONDARY MARKET ANALYSIS
Amount Crore`TABLE 97: CORPORATE BONDS TRADING DETAILS
TABLE 98: HISTORICAL SUMMARY Amount Crore`
Since April 1, 2014 all Corporate Bond deals are being reported only on the exchanges
Se
pte
mb
er
20
16
Total AveragePeriod
Trades Value Trades Value
2008-09 - 145828 - 621
2009-10 - 402157 - 1690
2010-11 43795 598604 177 2423
2011-12 51439 591979 216 2487
2012-13 66180 736347 275 3055
2013-14 69518 972156 287 4017
2014-15 72364 1013504 305 4276
2015-16 63701 905333 264 3757
Apr-16 5302 64438 331 4027
May-16 5629 63172 256 2871
Jun-16 5751 74592 261 3391
Jul-16 6013 83570 301 4178
Aug-16 5931 80459 282 3831
2016-17 (Upto August 2016) 28625 366230 283 3626
Date Trades Value
1-Aug-16 282 3259
2-Aug-16 235 2919
3-Aug-16 195 3413
4-Aug-16 248 3947
5-Aug-16 246 2607
8-Aug-16 244 2901
9-Aug-16 248 3748
10-Aug-16 322 4233
11-Aug-16 397 4798
12-Aug-16 285 2953
16-Aug-16 83 2676
18-Aug-16 259 2963
19-Aug-16 538 5437
22-Aug-16 310 4473
23-Aug-16 311 3402
24-Aug-16 296 7613
25-Aug-16 264 4692
26-Aug-16 261 2842
29-Aug-16 278 3000
30-Aug-16 352 4932
31-Aug-16 277 3651
Total 5931 80459
Average 282 3831
140

CC
ILM
on
thly
Ne
wsl
ett
er
statistics
TABLE 99: CATEGORYWISE TRADING ANALYSIS
TABLE 100: RATING ANALYSIS
Se
pte
mb
er
20
16
CATEGORY Rating Trades Value (` Crore) Avg. Tenor Avg. Spread (bps)
FINANCE AAA 1542 31620 6.48 89
FINANCE AA 712 5697 9.35 226
FINANCE A 32 697 4.70 443
FINANCE BBB 24 107.1 3.59 447
FINANCE NA 1275 16170 6.10 142
INFRASTRUCTURE AAA 775 9324 9.41 22
INFRASTRUCTURE AA 79 1443 7.65 231
INFRASTRUCTURE A 129 532 7.84 331
INFRASTRUCTURE BBB 19 38 4.77 840
INFRASTRUCTURE BB 10 14 1.96 1144
INFRASTRUCTURE NA 207 4603 5.54 440
MANUFACTURING AAA 11 90 3.13 108
MANUFACTURING AA 90 567 6.82 196
MANUFACTURING NA 51 1162 6.20 162
OIL AAA 7 731 2.44 73
OTHERS AAA 127 3193 6.43 93
OTHERS AA 14 413 2.91 264
OTHERS A 2 1 8.98 391
OTHERS BBB 3 41 4.50 790
OTHERS NA 23 1875 5.16 176
Rating Trades Value (` Crore) Avg. Tenor Avg. Spread (bps)
AAA 2462 44958 7.40 68
AA 895 8120 8.77 224
A 163 1229 7.24 353
BBB 46 186 4.18 647
BB 10 14 1.96 1144
NA 1556 23809 5.97 203
141

CC
ILM
on
thly
Ne
wsl
ett
er
statistics
TABLE 102: BOND TYPE ANALYSIS
TABLE 103: AAA SPREAD ANALYSIS
TABLE :104 CATEGORY ANALYSIS - HISTORICAL Amount Crore`
Se
pte
mb
er
20
16
TABLE 101: CATEGORY ANALYSIS
Maturity Buckets Average Spread (bps)
<=1 year 91
> 1 year -<=2 years 96
> 2 years -<=3 years 80
>3 years -<=5 years 98
>5 years-<=7 years 84
> 7 years 48
CategoriesYear
Finance Infrastructure Manufacturing Oil Others Total
2008-09 102644 17543 7468 4952 1402 134191
2009-10 232669 50546 25739 18186 27285 354424
2010-11 394887 75663 26536 16916 23422 537425
2011-12 344743 99947 8781 13948 13405 480824
2012-13 334871 131421 38073 7613 22158 534135
2013-14 580267 188209 42594 17945 48072 877086
2014-15 536550 248001 41028 15605 85403 926588
2015-16 548616 259910 41691 4182 42286 896686
Apr-16 40572 20452 1223 391 2695 65333
May-16 36833 21724 1972 60 2536 63125
Jun-16 48398 19017 2024 793 4535 74766
Jul-16 49469 19112 3331 4590 7494 83995
Aug-16 54291 15953 1819 731 5522 78316
2016-17(Upto August 2016)
229563 96258 10368 6564 22781 365535
Type of Bond Trades Value (` Crore) Avg. Tenor Avg. Spread (bps)
FIXED 4996 76647 7.43 150
ZERO COUPON 66 749 2.85 125
Floating 32 626 1.23 281
NA 38 294 4.50 300
Category Trades Value (` Crore) Avg. Tenor Avg. Spread (bps)
FINANCE 3585 54291 6.99 142
INFRASTRUCTURE 1219 15953 8.28 173
MANUFACTURING 152 1819 6.30 178
OIL 7 731 2.44 73
OTHERS 169 5522 5.76 148
142

CC
ILM
on
thly
Ne
wsl
ett
er
statistics
TABLE : SPREAD ANALYSIS106 - HISTORICAL (AVERAGE) basis points
Se
pte
mb
er
20
16
TABLE :105 RATING ANALYSIS - HISTORICAL Amount Crore`
RatingsYear
AAA AA A1 A2 A BBB BB B C P1 NA
2008-09 107549 13465 - - 2463 70 - - - 9 10635
2009-10 294268 36550 5 - 12034 15 16 - - 25 11512
2010-11 379542 107514 139 - 8068 260 38 216 - 8510 33138
2011-12 410152 44643 1637 - 3814 451 64 - - - 20063
2012-13 410581 80864 5736 - 7859 564 2966 124 - 201 25241
2013-14 696917 130830 3273 - 20241 2994 186 2 - 50 22594
2014-15 716087 129597 3555 600 35012 1389 3746 108 48 - 36446
2015-16 576773 151808 1835 - 33276 1856 942 174 - - 130022
Apr-16 29331 5631 50 - 822 150 0 135 - - 29214
May-16 32981 5444 - - 815 74 20 - - - 23790
Jun-16 43986 8310 - - 924 83 31 - - - 21433
Jul-16 45965 10851 30 - 837 8 1 - - - 26304
Aug-16 44958 8120 - - 1229 186 14 - - - 23809
2016-17(Upto August 2016)
197221 38356 80 - 4627 501 66 135 - - 124551
RatingsYear
AAA AA A1 A2 A BBB BB B C P1 NA
2011-12 119 189 248 - 202 185 227 - - - 205
2012-13 98 161 231 - 220 308 262 182 - 193 181
2013-14 85 140 275 - 163 291 254 - - 189 176
2014-15 46 123 179 141 149 351 83 138 566 - 148
2015-16 62 164 205 - 237 593 710 281 - - 167
Apr-16 67 198 297 - 330 709 1086 1699 - - 123
May-16 52 210 - - 302 988 880 - - - 157
Jun-16 54 208 - - 312 736 1010 - - - 206
Jul-16 70 229 366 - 390 663 1128 - - - 186
Aug-16 68 224 - - 353 647 1144 - - - 203
2016-17 (Upto(Upto August 2016)
62 216 338 - 336 723 1064 1699 - - 170
143

CCIL Monthly Newsletter
statis
tic
s
TABLE 107: TOP 25 TRADED CORPORATE BONDS
Note: Spread over comparable G-SecDeals apparently viewed as duplicate deals have been excluded.Source for Corporate Bonds:www.fimmda.orgwww.nseindia.comwww.bseindia.comwww.nsdl.co.in
September 2016
No. ISIN No. Security Description Rating Category MaturityCoupon
(%)Trades
Volume( Cr.)`
Yield(%)
1 INE202B07HV0 DEWAN HOUSING FINANCE CORPORATION LIMITED - FINANCE 16-Aug-26 9.30 442 3900 9.1303
2 INE053F07751 INDIAN RAILWAY FINANCE CORPORATION LIMITED ICRA AAA;CARE AAA;CRISIL AAA FINANCE 22-Jan-17 7.83 20 3053 7.0992
3 INE140A07278 PIRAMAL ENTERPRISES LIMITED - OTHERS 9-Aug-19 8.55 6 1500 8.8213
4 INE020B08963 RURAL ELECTRIFICATION CORPORATION LIMITED ICRA AAA;CARE AAA;IND AAA;CRISIL AAA INFRASTRUCTURE 7-Oct-25 8.11 82 1378 7.7073
5 INE134E08IH4 POWER FINANCE CORPORATION LTD - FINANCE 16-Aug-21 7.50 48 1329 7.5092
6 INE110L07054 RELIANCE JIO INFOCOMM LIMITED CRISIL AAA;ICRA AAA INFRASTRUCTURE 29-Apr-19 8.10 19 1303 7.7801
7 INE001A07PB3 HOUSING DEVELOPMENT FINANCE CORPORATION LTD CRISIL AAA;ICRA AAA FINANCE 1-Jun-26 8.44 36 1022 8.0587
8 INE134E08II2 POWER FINANCE CORPORATION LTD. - FINANCE 14-Aug-23 7.63 54 1011 7.6751
9 INE733E07KE8 NTPC LIMITED - INFRASTRUCTURE 23-Aug-26 7.58 39 890 7.5785
10 INE476A08050 CANARA BANK CRISIL AAA;IND AAA;ICRA AAA FINANCE 27-Apr-26 8.40 64 856 7.9540
11 INE148I07CL2 INDIABULLS HOUSING FINANCE LIMITED CARE AAA FINANCE 23-Jun-17 9.28 12 771 8.7227
12 INE020B08930 RURAL ELECTRIFICATION CORPORATION LIMITED IND AAA;CRISIL AAA;CARE AAA INFRASTRUCTURE 10-Apr-25 8.30 48 723 7.7143
13 INE001A07PK4 HOUSING DEVELOPMENT FINANCE CORPORATION LTD - FINANCE 15-Jan-18 8.00 6 700 7.8214
14 INE572E09387 PNB HOUSING FINANCE LTD - FINANCE 26-Jul-23 8.57 130 678 9.5505
15 INE001A07OR2 HOUSING DEVELOPMENT FINANCE CORPORATION LTD ICRA AAA;CRISIL AAA FINANCE 12-Aug-19 8.26 9 668 7.9189
16 INE202B07HQ0 DEWAN HOUSING FINANCE CORPORATION LIMITED - FINANCE 16-Aug-19 9.10 46 642 9.1442
17 INE008A08U84 IDBI BANK LIMITED IND AA+;CRISIL AA- FINANCE 17-Oct-24 10.75 - AT1 134 629 10.0213
18 INE774D07KL9 MAHINDRA & MAHINDRA FINANCIAL SERVICES LIMITED IND AAA FINANCE 4-Nov-16 9.07 9 601 7.5859
19 INE163N08032 ONGC PETRO ADDITIONS LIMITED CARE AAA (SO) OIL 2-Jul-19 8.75 1 600 7.9750
20 INE261F08600 NATIONAL BANK FOR AGRICULTURE AND RURAL DEVELOPMENT - FINANCE 21-Jun-19 7.95 4 600 7.4313
21 INE457A09215 BANK OF MAHARASHTRA CARE A+;CRISIL A+ FINANCE 12-Jan-20 9.48-AT1 17 598 11.0836
22 INE112A08010 CORPORATION BANK IND A+;CRISIL AA FINANCE 9-Feb-20 9.51-AT1 12 591 11.1331
23 INE020B08948 RURAL ELECTRIFICATION CORPORATION LIMITED ICRA AAA;CARE AAA;IND AAA;CRISIL AAA INFRASTRUCTURE 14-Aug-20 8.37 24 558 7.5084
24 INE001A07PC1 HOUSING DEVELOPMENT FINANCE CORPORATION LTD ICRA AAA;CRISIL AAA FINANCE 15-Jun-26 8.46 35 558 8.0960
25 INE936D07067 RELIANCE UTILITIES AND POWER PRIVATE LIMITED CRISIL AAA;CARE AAA INFRASTRUCTURE 26-Apr-23 8.95 27 537 9.1990
144
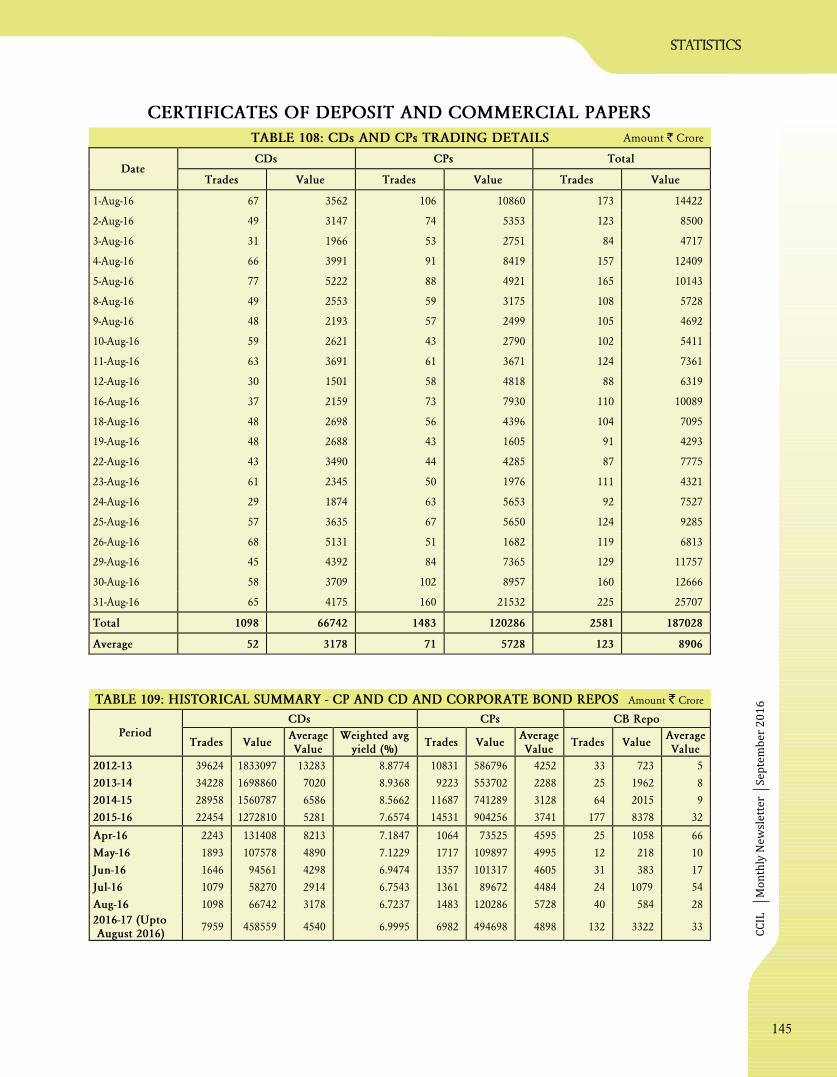
CC
ILM
on
thly
Ne
wsl
ett
er
statistics
CERTIFICATES OF DEPOSIT AND COMMERCIAL PAPERS
TABLE 108: CDs AND CPs TRADING DETAILS Amount Crore`
TABLE 109: HISTORICAL SUMMARY - CP AND CD AND CORPORATE BOND REPOS Amount Crore`
Se
pte
mb
er
20
16
CDs CPs TotalDate
Trades Value Trades Value Trades Value
1-Aug-16 67 3562 106 10860 173 14422
2-Aug-16 49 3147 74 5353 123 8500
3-Aug-16 31 1966 53 2751 84 4717
4-Aug-16 66 3991 91 8419 157 12409
5-Aug-16 77 5222 88 4921 165 10143
8-Aug-16 49 2553 59 3175 108 5728
9-Aug-16 48 2193 57 2499 105 4692
10-Aug-16 59 2621 43 2790 102 5411
11-Aug-16 63 3691 61 3671 124 7361
12-Aug-16 30 1501 58 4818 88 6319
16-Aug-16 37 2159 73 7930 110 10089
18-Aug-16 48 2698 56 4396 104 7095
19-Aug-16 48 2688 43 1605 91 4293
22-Aug-16 43 3490 44 4285 87 7775
23-Aug-16 61 2345 50 1976 111 4321
24-Aug-16 29 1874 63 5653 92 7527
25-Aug-16 57 3635 67 5650 124 9285
26-Aug-16 68 5131 51 1682 119 6813
29-Aug-16 45 4392 84 7365 129 11757
30-Aug-16 58 3709 102 8957 160 12666
31-Aug-16 65 4175 160 21532 225 25707
Total 1098 66742 1483 120286 2581 187028
Average 52 3178 71 5728 123 8906
CDs CPs CB RepoPeriod
Trades ValueAverageValue
Weighted avgyield (%)
Trades ValueAverageValue
Trades ValueAverageValue
2012-13 39624 1833097 13283 8.8774 10831 586796 4252 33 723 5
2013-14 34228 1698860 7020 8.9368 9223 553702 2288 25 1962 8
2014-15 28958 1560787 6586 8.5662 11687 741289 3128 64 2015 9
2015-16 22454 1272810 5281 7.6574 14531 904256 3741 177 8378 32
Apr-16 2243 131408 8213 7.1847 1064 73525 4595 25 1058 66
May-16 1893 107578 4890 7.1229 1717 109897 4995 12 218 10
Jun-16 1646 94561 4298 6.9474 1357 101317 4605 31 383 17
Jul-16 1079 58270 2914 6.7543 1361 89672 4484 24 1079 54
Aug-16 1098 66742 3178 6.7237 1483 120286 5728 40 584 28
2016-17 (UptoAugust 2016)
7959 458559 4540 6.9995 6982 494698 4898 132 3322 33
145
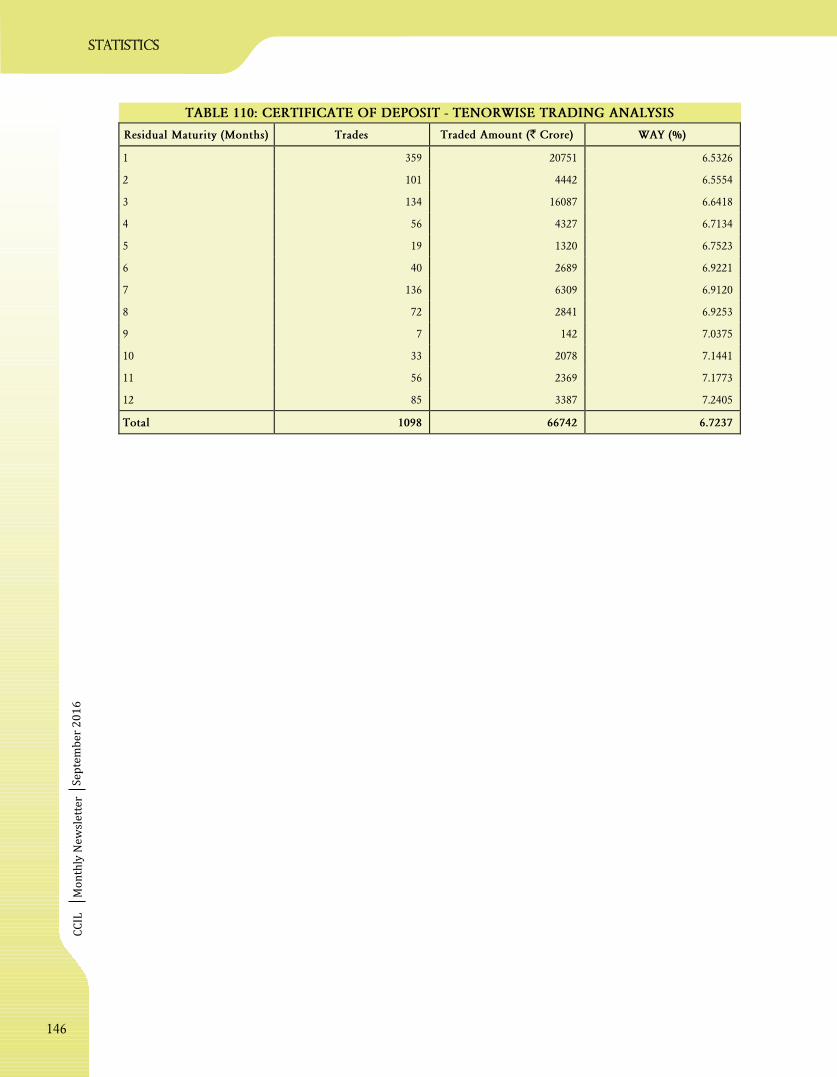
CC
ILM
on
thly
Ne
wsl
ett
er
statistics
TABLE 110: CERTIFICATE OF DEPOSIT - TENORWISE TRADING ANALYSIS
Se
pte
mb
er
20
16
Residual Maturity (Months) Trades Traded Amount (` Crore) WAY (%)
1 359 20751 6.5326
2 101 4442 6.5554
3 134 16087 6.6418
4 56 4327 6.7134
5 19 1320 6.7523
6 40 2689 6.9221
7 136 6309 6.9120
8 72 2841 6.9253
9 7 142 7.0375
10 33 2078 7.1441
11 56 2369 7.1773
12 85 3387 7.2405
Total 1098 66742 6.7237
146

CC
ILM
on
thly
Ne
wsl
ett
er
Se
pte
mb
er
20
16
TABLE 111: COMPARISON OF FBIL TERM MIBOR AND CD WEIGHTED AVERAGE RATE (%)
14 Days 1 Month 3 Month
Date FBILTerm
MIBOR
CD WARRates
Spread inBps
FBILTerm
MIBOR
CD WARRates
Spread inBps
FBILTerm
MIBOR
CD WARRates
Spread inBps
01-Aug-16 6.79 6.51 28 6.85 6.50 35 6.95 - -
02-Aug-16 6.77 6.52 25 6.85 6.47 38 6.93 6.64 29
03-Aug-16 6.75 6.45 30 6.84 6.48 36 6.91 6.67 24
04-Aug-16 6.76 6.51 25 6.84 6.47 37 6.92 6.64 28
05-Aug-16 6.77 6.62 15 6.80 6.58 22 6.92 6.69 23
08-Aug-16 6.80 6.63 17 6.81 6.59 22 6.93 6.78 15
09-Aug-16 6.80 6.76 4 6.83 6.49 34 6.92 6.70 22
10-Aug-16 6.80 6.68 12 6.84 6.64 20 6.92 6.70 22
11-Aug-16 6.81 6.69 12 6.84 6.51 33 6.90 6.68 22
12-Aug-16 6.81 6.50 31 6.83 6.50 33 6.90 - -
16-Aug-16 6.81 6.56 25 6.83 6.44 39 6.90 6.65 25
18-Aug-16 6.78 6.43 35 6.84 6.53 31 6.91 6.69 22
19-Aug-16 6.79 5.99 80 6.83 6.44 39 6.91 6.79 12
22-Aug-16 6.78 6.49 29 6.85 6.48 37 6.91 6.71 20
23-Aug-16 6.79 6.54 25 6.84 6.85 -1 6.91 6.80 11
24-Aug-16 6.80 6.54 26 6.85 6.52 33 6.90 6.71 19
25-Aug-16 6.77 6.48 29 6.84 6.60 24 6.92 6.58 34
26-Aug-16 6.77 6.45 32 6.85 6.51 34 6.94 6.71 23
29-Aug-16 6.78 6.51 27 6.82 6.53 29 6.94 6.69 25
30-Aug-16 6.76 6.51 25 6.83 6.50 33 6.94 6.65 29
31-Aug-16 6.74 6.43 31 6.83 6.65 18 6.91 6.66 25
BENCHMARK RATES
statistics
147

CCIL Monthly Newsletter
statis
tic
s
September 2016
TABLE 112: FBIL FC-RUPEE OPTION VOLATILITY MATRIX RATES - AT THE MONEY (ATM) VOLS (%)
1 WEEK 1 MONTH 3 MONTH 6 MONTH 12 MONTHDATE BID ATM
VolsASK ATM
VolsMID ATM
VolsBID ATM
VolsASK ATM
VolsMID ATM
VolsBID ATM
VolsASK ATM
VolsMID ATM
VolsBID ATM
VolsASK ATM
VolsMID ATM
VolsBID ATM
VolsASK ATM
VolsMID ATM
Vols
1-Aug-16 4.10 4.96 4.53 4.41 4.85 4.63 5.25 5.68 5.47 6.13 6.55 6.34 6.66 7.06 6.86
2-Aug-16 4.23 4.94 4.59 4.44 4.90 4.67 5.24 5.66 5.45 6.16 6.53 6.35 6.66 7.04 6.85
3-Aug-16 4.21 5.27 4.74 4.57 5.03 4.80 5.31 5.82 5.57 6.20 6.56 6.38 6.69 7.05 6.87
4-Aug-16 3.88 5.03 4.46 4.52 4.94 4.73 5.24 5.64 5.44 6.23 6.57 6.40 6.72 7.05 6.89
5-Aug-16 3.79 4.93 4.36 4.51 4.89 4.70 5.19 5.60 5.40 6.18 6.52 6.35 6.68 7.02 6.85
8-Aug-16 3.48 4.50 3.99 4.44 4.88 4.66 5.16 5.60 5.38 6.12 6.46 6.29 6.62 6.97 6.80
9-Aug-16 3.47 4.54 4.01 4.38 4.85 4.62 5.38 5.73 5.56 6.09 6.42 6.26 6.55 6.88 6.72
10-Aug-16 3.46 4.44 3.95 4.39 4.84 4.62 5.32 5.75 5.54 6.06 6.41 6.24 6.50 6.89 6.70
11-Aug-16 3.16 4.09 3.63 4.42 4.80 4.61 5.32 5.72 5.52 6.06 6.37 6.22 6.50 6.89 6.70
12-Aug-16 2.99 4.03 3.51 4.34 4.81 4.58 5.26 5.74 5.50 6.05 6.39 6.22 6.47 6.86 6.67
16-Aug-16 3.43 4.28 3.86 4.42 4.83 4.63 5.23 5.69 5.46 6.02 6.38 6.20 6.46 6.89 6.68
18-Aug-16 3.79 4.48 4.14 4.47 4.93 4.70 5.29 5.74 5.52 6.03 6.38 6.21 6.49 6.85 6.67
19-Aug-16 4.24 4.91 4.58 4.66 5.19 4.93 5.47 5.82 5.65 6.08 6.45 6.27 6.47 6.85 6.66
22-Aug-16 4.32 5.13 4.73 4.84 5.34 5.09 5.45 5.86 5.66 6.04 6.44 6.24 6.48 6.86 6.67
23-Aug-16 4.42 5.18 4.80 4.70 5.28 4.99 5.42 5.87 5.65 6.03 6.40 6.22 6.46 6.80 6.63
24-Aug-16 4.29 5.23 4.76 4.77 5.23 5.00 5.43 5.78 5.61 6.05 6.37 6.21 6.44 6.77 6.61
25-Aug-16 4.21 5.03 4.62 4.66 5.06 4.86 5.41 5.82 5.62 6.00 6.35 6.18 6.41 6.75 6.58
26-Aug-16 3.99 5.01 4.50 4.49 4.89 4.69 5.30 5.76 5.53 5.95 6.29 6.12 6.36 6.69 6.53
29-Aug-16 4.02 4.93 4.48 4.47 5.01 4.74 5.30 5.78 5.54 5.99 6.39 6.19 6.42 6.75 6.59
30-Aug-16 3.77 4.86 4.32 4.46 5.00 4.73 5.33 5.79 5.56 6.02 6.36 6.19 6.47 6.81 6.64
31-Aug-16 3.91 4.79 4.35 4.41 4.90 4.66 5.25 5.74 5.50 5.99 6.32 6.16 6.42 6.80 6.61
148

CC
ILM
on
thly
Ne
wsl
ett
er
Se
pte
mb
er
20
16
25 DELTA RRDATE
1 WEEK 1 MONTH 3 MONTHS 6 MONTHS 12 MONTHS
1-Aug-16 0.36 0.56 0.88 0.95 1.04
2-Aug-16 0.36 0.55 0.77 0.95 1.04
3-Aug-16 0.36 0.55 0.80 0.97 1.04
4-Aug-16 0.35 0.55 0.80 0.97 1.04
5-Aug-16 0.35 0.55 0.79 0.96 1.03
8-Aug-16 0.35 0.55 0.79 0.96 1.03
9-Aug-16 0.35 0.53 0.76 0.96 1.03
10-Aug-16 0.35 0.53 0.74 0.95 1.00
11-Aug-16 0.30 0.50 0.73 0.93 0.99
12-Aug-16 0.29 0.50 0.73 0.93 0.99
16-Aug-16 0.29 0.50 0.73 0.93 0.99
18-Aug-16 0.29 0.50 0.73 0.93 1.00
19-Aug-16 0.29 0.52 0.73 0.93 1.00
22-Aug-16 0.29 0.56 0.74 0.93 1.00
23-Aug-16 0.28 0.55 0.74 0.93 1.00
24-Aug-16 0.28 0.53 0.75 0.93 1.00
25-Aug-16 0.28 0.50 0.74 0.93 1.00
26-Aug-16 0.28 0.43 0.70 0.92 1.00
29-Aug-16 0.28 0.48 0.70 0.92 1.00
30-Aug-16 0.28 0.44 0.70 0.92 1.00
31-Aug-16 0.32 0.45 0.70 0.90 1.00
TABLE 113: FBIL FC-RUPEE OPTION VOLATILITY MATRIX RATES - 25 DELTA RISK REVERSAL (%)
Risk Reversal is the spread between the put and call vol for 25 delta25 delta is the market standard for out of the money option strike
statistics
149

CC
ILM
on
thly
Ne
wsl
ett
er
statistics
Se
pte
mb
er
20
16
TABLE 114: FBIL FC-RUPEE OPTION VOLATILITY MATRIX RATES - 25 DELTA STRANGLE (%)
25 DELTA STRDATE
1 WEEK 1 MONTH 3 MONTHS 6 MONTHS 12 MONTHS
1-Aug-16 0.11 0.11 0.20 0.30 0.39
2-Aug-16 0.10 0.11 0.20 0.30 0.39
3-Aug-16 0.11 0.11 0.20 0.30 0.39
4-Aug-16 0.11 0.11 0.20 0.30 0.39
5-Aug-16 0.10 0.11 0.20 0.30 0.39
8-Aug-16 0.10 0.11 0.21 0.30 0.39
9-Aug-16 0.10 0.11 0.20 0.30 0.39
10-Aug-16 0.10 0.11 0.20 0.30 0.39
11-Aug-16 0.10 0.11 0.21 0.30 0.39
12-Aug-16 0.10 0.11 0.20 0.30 0.39
16-Aug-16 0.11 0.11 0.20 0.30 0.39
18-Aug-16 0.10 0.11 0.21 0.30 0.39
19-Aug-16 0.10 0.11 0.21 0.30 0.39
22-Aug-16 0.11 0.11 0.21 0.30 0.39
23-Aug-16 0.11 0.11 0.20 0.30 0.36
24-Aug-16 0.11 0.11 0.20 0.30 0.36
25-Aug-16 0.11 0.11 0.20 0.30 0.36
26-Aug-16 0.10 0.11 0.20 0.29 0.35
29-Aug-16 0.10 0.11 0.20 0.29 0.35
30-Aug-16 0.10 0.11 0.20 0.29 0.35
31-Aug-16 0.10 0.10 0.20 0.29 0.34
Strangle is the spread between the 25 delta vol and ATM vol25 delta is the market standard for out of the money option strike
150

CC
ILM
on
thly
Ne
wsl
ett
er
milestones
• - Company Incorporated.
• Commenced clearing
and settlement of market trades in
Government Securities co-terminus with
operationalisation of Reserve Bank of India's
Negotiated Dealing System (NDS).
• - Extended facility of
guaranteed settlement for trades in
Government Securities.
• - Commenced guaranteed
settlement of inter-bank foreign exchange
Spot trades in INR/USD and Forward Trades
on Spot Window.
• - Launched new Money
Market Instrument - “Collateralised
Borrowing and Lending Obligation” (CBLO)
a repo variant with several unique features for
NDS Members.
• - Commenced
publication of Zero Coupon Yield Curve on
Website.
• - All trades in the securities
settlement routed through CCIL.
• - Set up a wholly owned
Subsidiary Company - Clearcorp Dealing
Systems (India) Pvt. Ltd. to manage dealing
platforms in Money and Currency Markets.
• - Launched Electronic
Currency Dealing Platform “FX Clear” to
facilitate inter-bank foreign exchange dealing.
• - Commenced net settlements
in Government Securities as per DVP III
Guidelines of Reserve Bank of India.
• - Operationalised “Straight
Through Processing” arrangement for
settlement of foreign exchange trades done on
Fx Clear.
• - Commenced settlement of
cross currency transactions through CLS.
• - Launch of Negotiated
Dealing System-Order Matching Segment
(NDS-OM).
• - CBLOi ((Internet Trading
System for Non-NDS Members) commenced
operations.
• - Version-2 of the NDS-OM
trading platform launched, enabling trading
in Treasury Bill and the When Issued market
• - CCIL receives ISO/IEC 27001:
2005 certification for securing its information
assets.
• - CCIL launched its
eNotice System available to all members for
sending their collateral notices in electronics
form.
• - Launch of NDS -
CALL, an electronic screen-based quote driven
dealing system for all Call, Notice and Term
Money operations was launched.
April 30, 2001
February 15, 2002 -
April 10, 2002
November 8, 2002
January 20, 2003
February 15, 2003
April 1, 2003
June 4, 2003
August 7, 2003
April 2, 2004
June 15, 2004
April 6, 2005
August 1, 2005
August 16, 2005
July 31, 2006
August 2006
September 4, 2006
September 18, 2006
Milestones
Se
pte
mb
er
20
16
151
CC
ILM
on
thly
Ne
wsl
ett
er
milestones
• - NDS Auction module went
live to facilitate bidding in primary Treasury
Bill auctions.
• - Launch of CCIL's
reporting platform for the transactions in
OTC Interest Rate Derivatives (Interest Rate
Swaps and Forward Rate Agreements
(IRS/FRA)) became operational.
• - Rupee settlement at RBI
commenced through RTGS (MNSB) for
Forex, CBLO and ATM segments.
• - CCIL commenced
Non-Guaranteed Settlement of OTC Trades in
Rupee Derivatives through RTGS (MNSB).
• - Launch of Clearcorp
launched 'Clearcorp Repo Order Matching
System' (CROMS), a STP enabled electronic
anonymous order matching platform to
facilitate dealing in market repos in
government securities.
• - CCIL became the first
organization to be granted authorisation by
the Reserve Bank of India under “The
Payment & Settlement Systems Act- 2007”.
• - CCIL commenced the
settlement of forex forward trades with
guarantee from the trade date.
• - Launch of FX-SWAP Dealing
System
• - CCIL successfully
conducted the “Live Operations” of all its
business its applications from DR Pune data
center validating its infrastructure capabilities
and different disaster scenarios.
• - Kurla location became
operational.
• - Launch of CCIL's new web
portal.
• - CCIL on July 28, 2011
successfully carried out a Portfolio
Compression exercise in the OTC Interest
Rate Swaps market.
• - Credit Default Swaps
(CDS) for Corporate Bonds started, with CDS
trade reporting on CCIL's Online Reporting
Engines (CORE).
• - Launch of F-TRAC, for
reporting deals in Corporate bonds,
Corporate bond Repo and CDs/CPs.
• - The settlement MNSB files
for CCIL's Derivatives, Forex, CBLO and
Securities Segment migrated to Core Banking
Solution (CBS) of RBI from RTGS.
• - Web-based NDS-OM module
for online trading in secondary market for
Government Securities by gilt account holders
(GAH) was launched.
• - Launch of the Trade Repository
service for OTC Foreign Exchange
Derivatives.
• - Migration of Securities
Settlement to CBS.
• - Launch of the Phase II of
the Reporting Platform for Inter-bank OTC
Forex Derivatives.
• - Phase III of the Forex Trade
Repository launched with the reporting of
January 3, 2007
August 30, 2007
May 12, 2008
November 27, 2008
January 27, 2009
February 11, 2009
December 1, 2009
May 31, 2010
September 4-9, 2010
May 28, 2011
June 27, 2011
July 28, 2011
December 1, 2011
December 1, 2011
June 14, 2012
June 29, 2012
July 9, 2012
October 29, 2012
November 5, 2012
April 2, 2013
Se
pte
mb
er
20
16
152

CC
ILM
on
thly
Ne
wsl
ett
er
milestones
FCY-FCY and FCY-INR Forwards and FCY-
FCY and FCY-INR Options between
Authorised Dealers and their Clients.
• - CCIL successfully
launched the Phase IV of the Forex Trade
Repository with reporting of Interbank and
Client transactions in Currency Swaps and
FCY Interest Rate Swaps and Forward Rate
Agreements.
• - Reserve Bank of India
granted the status of a Qualified Central
Counterparty (QCCP) to CCIL.
• - RBI selected CCIL to act as
a Local Operating Unit (LOU) for issuing
globally compatible Legal Entity Identifiers
(LEIs) in India.
• - Launch of CCP Clearing of
Rupee denominated Interest Rate Swaps and
Forward Rate Agreements.
•
• - CCIL launched its
services as a Local Operating Unit (LOU) for
issuing globally compatible Legal Entity
Identifiers (LEIs) in India.
• - Portfolio compression
cycle carried out for cleared forward
INR/USD trades.
• Payment-versus-payment
(PvP) mode of settlement launched in the
Forex Settlement Segment, resulting in
substantial reduction of risk for members.
• - New version of FX-CLEAR
and FX-SWAP Platform launched with CCIL
as counter-party from point of trade
concluded in Order Matching Mode, allowing
members to trade on these platforms without
any bilateral limits with various counter-
parties.
• CCIL started disseminating
data on USD-INR forwards and USD-INR
Currency Options.
• CCIL LOU was endorsed by
ROC (Regulatory Oversight Committee).
• Launch of FBIL Overnight
MIBOR, with CCIL as the Calculation Agent.
• Launch of 'Astroid' the
Anonymous IRS Dealing System.
• Launch of FBIL Term
MIBOR with CCIL as the Calculation Agent.
•
•
• -
•
December 30, 2013
January 1, 2014
January 6, 2014
March 28, 2014
November 18, 2014
March 26, 2015
April 6, 2015 -
April 6, 2015
April 13, 2015 -
April 22, 2015 -
July 22, 2015 –
August 03, 2015 –
September 23, 2015 –
December 1, 2015 -
December 15, 2015 -
December 28, 2015
May 5, 2016
The Legal Entity
Identifier (LEI) services of The Clearing
Corporation of India Limited have been hived
off into wholly owned subsidiary (WoS) Legal
Entity Identifier India Limited (LEIL) effective
The Settlement Bank for
the CLS Segment was changed from RBS plc to
UBS Switzerland AG.
CCIL started
disseminating data of USD-INR near Maturity
Swaps i.e. Cash-Tom, Tom-Spot, and Cash-Spot
swaps from on its website.
- Launch of FBIL FC-Rupee
Options Volatility Matrix Rate, with CCIL as
the Calculation Agent.
- Launch of CCIL Integrated
Risk Information System (CCIL IRIS) a web
based real time information system.
September 2014
Se
pte
mb
er
20
16
153

CC
ILM
on
thly
Ne
wsl
ett
er
KEY
PERSONNEL
KEY PERSONNEL/HODs
Se
pte
mb
er
20
16
Name Designation and Department Phone No.
Mrs. Usha Thorat Chairperson 61546512
Mr. R. Sridharan Managing Director 61546511
Mr. Ravi Rajan Executive Vice President 61546363
Mrs. Indirani Rao Chief Forex Officer 61546451
Mr. O.N. Ravi Company Secretary & Corporate Development Officer 61546541/6546
Mr. Deepak Chande Chief Financial Officer 61546561
Dr. Golaka C. Nath Senior Vice President, Economic Research & Surveillance, Membership and HRD 61546581
Mr. Pradeep. K. Naik Senior Vice President, Operations (Fixed Income & Money Market) 61546481
Mr. C Kajwadkar Senior Vice President, Information Technology 61546212
Mr. Kausick Saha Chief Risk Officer 61546441
Mr. Kamal Singhania Senior Vice President, Forex 61546320
Mr. Praveen Mata Senior Vice President, Information Technology 61546213
Mr. Arun Kumar Pandey Senior Vice President, Derivatives 61546470
Mr. K. B. Biju Vice President, Product Development 61546365
Mr. N. Venkatraman Vice President, Operations (Fixed Income & Money Market) 61546390/6490
Mr. Amol Pradhan Asst. Vice President, Collateral & Funds Management 61546482
Mr. Santosh Bhalerao Asst. Vice President, Information Technology 61546214
Mr. Anupam Kumar Mitra Asst. Vice President, Derivatives 61546471
Mr. Rajesh Salunkhe Asst. Vice President, Product Development 61546348
Ms. Ipsita Saha Asst. Vice President, Human Resources 61546519
Mr. S.T.P. Venugopal Jr. Vice President, Risk Management 61546413
Mr. S. Ramesh Jr. Vice President, Product Development 61546333
Mr. Nandan Pradhan Jr. Vice President, Risk Management 61546422
Mrs. Samidha Pandit Jr. Vice President, Finance and Accounts 61546562
Ms. Jigna Thakkar Jr. Vice President, Forex Settlement 61546472
Mr. Chirag N Shah Jr. Vice President, Legal, Secretarial and Compliance 61546548
154

Valuable feedback & suggestions are welcome at [email protected]
Published by the Research Department, CCIL
Previous Issues
DISCLAIMER: This Newsletter contains information relating to the operations of The Clearing Corporation of India Ltd. (CCIL), its Membersand The Reserve Bank of India. While CCIL has taken every care to ensure that the information and/or data provided are accurate and complete,CCIL does not warrant or make any representation as to the accuracy and completeness of the same. Accordingly, CCIL assumes no responsibilityfor any errors and omissions in any section or sub-section of this Newsletter.
The views expressed in the articles by the authors are their own and CCIL does not accept any responsibility. CCIL shall not be liable to anymember or any other person for any direct consequential or other damages arising out of the use of this Newsletter.
Rakshitra Vol I No. I (Jul - Sep ‘02)Rakshitra Vol I No. II (Oct - Dec ‘02)Rakshitra Vol I No. III (Jan - Mar ‘03)Rakshitra Vol II No. I (Apr - Jun ‘03)Rakshitra Vol II No. II (Jul - Sep ‘03)Rakshitra Vol II No. III (Oct - Dec ‘03)Rakshitra Vol II No. IV (Jan - Mar ‘04)Rakshitra Vol III No. I (Apr - Jun ‘04)Rakshitra Vol III No. II (August ‘04)Rakshitra Vol III No. III (September ‘04)Rakshitra Vol III No. IV (October ‘04)Rakshitra Vol III No. V (November ‘04)Rakshitra Vol III No. VI (December ‘04)Rakshitra Vol III No. VII (January ‘05)Rakshitra Vol III No. VIII (February ‘05)Rakshitra Vol III No. IX (March ‘05)Rakshitra Vol III No. X (April ‘05)Rakshitra Vol III No. XI (May ‘05)Rakshitra Vol III No. XII (June ‘05)Rakshitra Vol III No. I (July ‘05)Rakshitra Vol III No. II (August ‘05)3Rakshitra Vol IV No. III (September ‘05)Rakshitra Vol IV No. IV (October ‘05)Rakshitra Vol IV No. V (November ‘05)Rakshitra Vol IV No. VI (December ‘05)Rakshitra Vol IV No. VII (January ‘06)Rakshitra Vol IV No. VIII (February ‘06)Rakshitra Vol IV No. IX (March ‘06)Rakshitra Vol IV No. X (April ‘06)Rakshitra Vol IV No. XI (May ‘06)Rakshitra Vol IV No. XII (June ‘06)Rakshitra Vol V No. I (July ‘06)Rakshitra Vol V No. II (August ‘06)Rakshitra Vol V No. III (September ‘06)Rakshitra Vol V No. IV (October ‘06)Rakshitra Vol V No. V (November ‘06)Rakshitra Vol V No. VI (December ‘06)Rakshitra Vol V No. VII (January ‘07)Rakshitra Vol V No. VIII (February ‘07)Rakshitra Vol V No. IX (March ‘07)Rakshitra Vol V No. X (April '07)Rakshitra Vol V No. XI (May '07)Rakshitra Vol V No. XII (June '07)Rakshitra Vol VI No. I (July '07)Rakshitra Vol VI No. II (August '07)Rakshitra Vol VI No. III (September '07)Rakshitra Vol VI No. IV (October '07)Rakshitra Vol VI No. V (November '07)Rakshitra Vol VI No. VI (December '07)Rakshitra Vol VI No. VII (January '08)Rakshitra Vol VI No. VIII (February '08)
Rakshitra Vol VI No. IX (March '08)Rakshitra Vol VI No. X (April '08)Rakshitra Vol VI No. XI (May '08)Rakshitra Vol VI No. XII (June '08)Rakshitra Vol VII No. I (July '08)Rakshitra Vol VII No. II (August '08)Rakshitra Vol VII No. III (September '08)Rakshitra Vol VII No. IV (October '08)Rakshitra Vol VII No. V (November ‘08)Rakshitra Vol VII No. VI (December ‘08)Rakshitra Vol VII No. VII (January ‘09)Rakshitra Vol VII No. VIII (February ‘09)Rakshitra Vol VII No. IX (March ‘09)Rakshitra Vol VII No. X (April ‘09)Rakshitra Vol VII No. XI (May ‘09)Rakshitra Vol VII No. XII (June ‘09)Rakshitra Vol VIII No. I (July ‘09)Rakshitra Vol VIII No. II (August ‘09)Rakshitra Vol VIII No. III (September ‘09)Rakshitra Vol VIII No. IV (October ‘09)Rakshitra Vol VIII No. V (November ‘09)Rakshitra Vol VIII No. VI (December ‘09)Rakshitra Vol VIII No. VII (January ‘10)Rakshitra Vol VIII No. VIII (February ‘10)Rakshitra Vol VIII No. IX (March ‘10)Rakshitra Vol VIII No. X (April ‘10)Rakshitra Vol VIII No. XI (May ‘10)Rakshitra Vol VIII No. XII (June‘10)Rakshitra Vol IX No. I (July‘10)Rakshitra Vol IX No. II (August ‘10)Rakshitra Vol IX No. III (September ‘10)Rakshitra Vol IX No. IV (October ‘10)Rakshitra Vol IX No. V (November ‘10)Rakshitra Vol IX No. VI (December ‘10)Rakshitra Vol IX No. VII (January ‘11)Rakshitra Vol IX No. VIII (February ‘11)Rakshitra Vol IX No. IX (March ‘11)Rakshitra Vol IX No. X (April ‘11)Rakshitra Vol IX No. XI (May ‘11)Rakshitra Vol IX No. XII (June ‘11)Rakshitra Vol X No. I (July ‘11)Rakshitra Vol X No. II (August ‘11)Rakshitra Vol X No. III (September ‘11)Rakshitra Vol X No. IV (October ‘11)Rakshitra Vol X No. V (November '11)Rakshitra Vol X No. VI (December '11)Rakshitra Vol X No. VII (January '12)Rakshitra Vol X No. VIII (February '12)Rakshitra Vol X No. IX (March '12)Rakshitra Vol X No. X (April '12)Rakshitra Vol X No. XI (May '12)
Rakshitra Vol X No. XII (June '12)Rakshitra Vol XI No. I (July '12)Rakshitra Vol X No. II (August '12)Rakshitra Vol X No. III (September ‘12)Rakshitra Vol X No. IV (October ‘12)Rakshitra Vol X No. V (November ‘12)Rakshitra Vol X No. VI (December ‘12)Rakshitra Vol X No. VII (January ‘13)Rakshitra Vol. X No. VIII (February '13)Rakshitra Vol. X No. IX (March '13)Rakshitra Vol. X No. X (April '13)Rakshitra Vol. X No. XI (May '13)Rakshitra Vol. X No. XII (June '13)Rakshitra Vol. XI No. I (July '13)Rakshitra Vol. XI No. II (August '13)Rakshitra Vol. XI No. III (September '13)Rakshitra Vol. XI No. IV (October '13)Rakshitra Vol. XI No. V (November '13)Rakshitra Vol. XI No. VI (December '13)Rakshitra Vol. XI No. VII (January '14)Rakshitra Vol. XI No. VIII (February '14)Rakshitra Vol. XI No. IX (March '14)Rakshitra Vol. XI No. X (April '14)Rakshitra Vol. XI No. XI (May '14)Rakshitra Vol. XI No. XII (June '14Rakshitra Vol. XII No. I (July '14)Rakshitra Vol. XII No. II (August '14)Rakshitra Vol. XII No. III (September '14)Rakshitra Vol. XII No. IV (October '14)Rakshitra Vol. XII No. V (November '14)Rakshitra Vol. XII No. VI (December '14)Rakshitra Vol. XII No. VII (January '15)Rakshitra Vol. XII No. VIII (February '15)Rakshitra Vol. XII No. IX (March '15)Rakshitra Vol. XII No. X (April '15)Rakshitra Vol. XII No. XI (May '15)Rakshitra Vol. XII No. XII (June '15)Rakshitra Vol. XIII No. I (July '15)Rakshitra Vol. XIII No. II (August '15)Rakshitra Vol. XIII No. III (September '15)Rakshitra Vol. XIII No. IV (October '15)Rakshitra Vol. XIII No. V (November '15)Rakshitra Vol. XIII No. VI (December '15)Rakshitra Vol. XIII No. VII (January '16)Rakshitra Vol. XIII No. VIII (February '16)Rakshitra Vol. XIII No. IX (March '16)Rakshitra Vol. XIII No. X (April '16)Rakshitra Vol. XIII No. XI (May '16)Rakshitra Vol. XIII No. XII (June '16)Rakshitra Vol. XIII No. I (July '16)Rakshitra Vol. XIV No. II (August '16)
Related Documents