MYFOREST Abstracted by “Forestry Abstract s” and “Forest Product s Abstract s” at Commonwealth Forestry Bureau Front Cover : Melia dubia Plantation - Hiriyuru Back Cover : Melia dubia Plantation in Hiriyuru Vol. 47 December 2011 No. 04 CONTENTS Photo by G. Selva Kumar, IFS APCCF (R & U) Bangalore. Sl. Particulars Authors Page No. No. 1. A Study on likely impacts of Bark, Moisture & Height on the yield of C.S. Vedant, IFS and wood (Estimation exercise taken up A.K. Garg, IFS 263 in Appasandra Eucalyptus, second cut plantation in Kolar division) 2. Participatory Research activity - A conceptual understanding G. Selva Kumar, IFS 269 3. Mavinakurve Bamboo Park in Goa Dr. K.A. Kushalappa, IFS (Retd) 271 4. Agroforestry : Sustainability issues and Rajat S. Pal, H.N. Hymavathi 273 future prospects and Richa Kakker

Welcome message from author
This document is posted to help you gain knowledge. Please leave a comment to let me know what you think about it! Share it to your friends and learn new things together.
Transcript
MYFOREST
Abstracted by “Forestry Abstracts” and “Forest Products Abstracts” atCommonwealth Forestry Bureau
Front Cover : Melia dubia Plantation- Hiriyuru
Back Cover : Melia dubia Plantationin Hiriyuru
Vol. 47 December 2011 No. 04
CONTENTS
Photo byG. Selva Kumar, IFSAPCCF (R & U)Bangalore.
Sl. Particulars Authors PageNo. No.
1. A Study on likely impacts of Bark,Moisture & Height on the yield of C.S. Vedant, IFS andwood (Estimation exercise taken up A.K. Garg, IFS 263in Appasandra Eucalyptus, secondcut plantation in Kolar division)
2. Participatory Research activity -A conceptual understanding G. Selva Kumar, IFS 269
3. Mavinakurve Bamboo Park in Goa Dr. K.A. Kushalappa, IFS (Retd) 271
4. Agroforestry :Sustainability issues and Rajat S. Pal, H.N. Hymavathi 273future prospects and Richa Kakker
Published by : THE KARNATAKA FOREST DEPARTMENTPrinted at : SHAKTHI PRINTECH - No. 552/1, 7th Cross, 3rd Main, Ayyappa Temple Road,
Prakashnagar, Bangalore - 21. India. Ph. No. : 080-2313 3097, Telefax : 2313 3235.
5 Assessment of floristic composition Sathish B.N., Kushalappa C. G.,and conservation value of Puttaswamy H.,Brahmagiri Wildlife Sanctuary, Manojkumar Tipati and 285Kodagu district, Central Western Chandrahas VernekarGhat.
6 Anthelmintic evaluation ofsome local weeds P. Ramana 291
7. Plants used for oral care in Sirsi P. Ramana, Renuka NayakRegion of Uttara Kannada District and Afrinnaz Sunti 295of Karnataka
8. Coral Reef Biology and Ecology Mahantappa Sankanur,Saresh N.V., Priyanka Rajput, 303Archana Verma and Bhat S.D.
9. Mass multiplication of VesicularArbuscular Mycorrhizae (VAM) Himavati Bhat 311and its use in Forest ResearchNursery at Sirsi Research Range
10. Studies on Seed Biology, Seed Krishna A., Lebba J.J.Moisture content and Pre-sowing and H. Shivanna 315treatments in Melia Dubia Cav.
11. Influence of seed size and seedinvigouration treatments on seed Krishna A. 325germination & quality in Ashwagandha
12. Effect of Moisture conservation S.N. Bammanahalli,measures & nutrient management G.V. Dasar andon growth of Eucalyptus Pellita in G.O. Manjunatha 333Dharma watershed
13. Variability studies in Pterocarpussantalinus in different aged Dr. A.N. Arun Kumar 343plantations of Karnataka
A STUDY ON LIKELY IMPACTS OF BARK, MOISTURE &HEIGHT ON THE YIELD OF WOOD (ESTIMATION
EXERCISE TAKEN UP IN APPASANDRA EUCALYPTUS,SECOND CUT PLANTATION IN KOLAR DIVISION).
C. S. VEDANT, IFS1 AND A. K. GARG, IFS2
ABSTRACT
The realistic calculation of yield of pulpwood in the Eucalyptus and Acacia planta-tions by the Karnataka Forest Development Corporation can go a long way in fore-casting the exact revenues and hence help in better future planning. In this paper, arelationship between the bark, moisture & height, and the yield has been tried to beestablished. It has been observed that even though the percentage of bark andmoisture is higher in lower girth classes vis-a-vis upper girth classes, the overalldensity of wood is more in lower classes. Hence, a closer spacing and shorterrotation has been suggested in order to get more yield per unit of the area andperiod. Also, as the variation is too large in seed origin plantations, it has beensuggested to take a larger sample.
IntroductionOne of the major activities of the
Karnataka Forest Development Corporation isthe sale of pulpwood from the Eucalyptus andAcacia plantations to the paper & Rayon in-dustries. The sale of pulpwood is done on thebasis of weight. Therefore, the realistic calcu-lation of yield is of paramount importance inorder to forecast the exact quantities of pulp-wood available in the plantations which aredue for extraction, which will have a bearingon the determination of rates and hence, theexpected revenue. It has been found that of-ten the actual yields which are obtained afterextraction, vary, sometimes substantially,from the estimation which is being done bythe Staff of the Corporation.
The methodology being used for this
MyForest, December, 2011Vol.47(4) Page Nos.263-268
1 Principal Chief Conservator of Forests & MD Karnataka Forest Development Corporation, B’lore2 AddI. PCCF & Joint MD, KFDC, Bangalore.
purpose, at present, is to lay sample plots tothe extent of 2% of the area along the gridlines.Then the girths of all the trees in those SPsare measured and they are grouped in differ-ent girth classes. The frequency of existenceof number of trees in each class (in %age) iscomputed and the number of trees in eachgirth class, equal to its percentage frequencyof occurrence, is felled, debarked andweighed. Then again the dry weight is takenafter drying for seven days and on the basisof this dry weight, the total quantity which maybe available in that particular plantation iscomputed. The same methodology has beenused in this study.
Site :
This exercise was carried out inAppasandra, Eucalyptus plantation of Malur

MyForest December 2011
264
unit in Kolar Division. Out of the total planta-tion area of 86 hectares, 37 hectares wastaken up for replanting in 2004 and the bal-ance area of 49 hectares, which is a coppicedarea, is due for second cut in 2011-12.
Volume/weight ratio :
In all the classes, volume estimation isdone using the G2h/4πππππ formula as the exactheight up to the commercially exploitable boleof the 100 cut trees is available. Average
heights and girths in meters in each classwere taken to calculate the volume in eachclass (0.14x1.81; 0.2x3.5; 0.28x5; 0.34x6.57;0.42x8.78, respectively) which was then mul-tiplied by total number of trees cut in eachclass. Then the density was arrived at in eachclass relating the volume in each case withthe actual weight (debarked). It is found thatthe density is maximum(1 cum=780 kg or 1.28cum= 1 ton) in lowest (10-16 cm) class andminimum (1 cum=376 kg or 2.66 cum=1ton)
Category (G x h) no. of volume fresh weight fresh weight/cu (kg)trees (cum) (kg)
1. 0.14 x 1.81 10 0.0282 22 7802. 0.2 x 3.5 36 0.4009 224 558.743. 0.28 x 5 35 1.09 574 526.604. 0.34 x 6.57 13 0.7854 359 4575. 0.42 x 8.78 6 0.7392 278 376
in the highest class of 38-45 cm girth. Bargraph shows that density decreases from low-est to highest class in a definite pattern. Thismay be due to more moisture content and
less wood formation in lower classes (as thedensity of water is almost 1) vis-a-vis the up-per classes where this is reverse.
Wei
ght p
er c
ubic
met
re
Girth classes in cm
900
800
700
600
500
400
300
200
100
010 to 16 17 to 23 24 to 30 31 to 37 38 to 45
MyForest December 2011
265
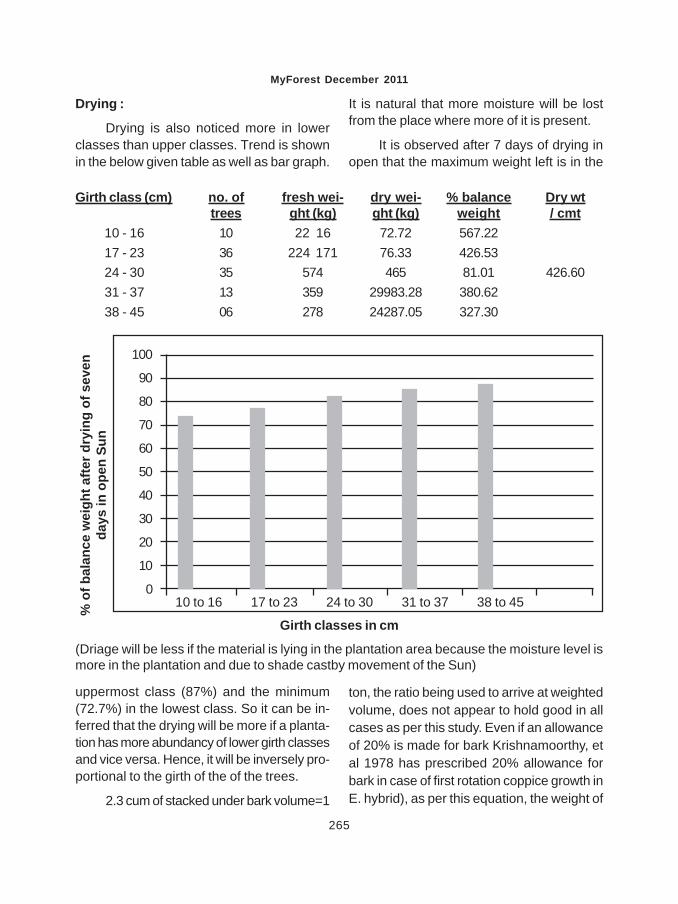
Girth class (cm) no. of fresh wei- dry wei- % balance Dry wttrees ght (kg) ght (kg) weight / cmt
10 - 16 10 22 16 72.72 567.2217 - 23 36 224 171 76.33 426.5324 - 30 35 574 465 81.01 426.6031 - 37 13 359 29983.28 380.6238 - 45 06 278 24287.05 327.30
% o
f bal
ance
wei
ght a
fter d
ryin
g of
sev
enda
ys in
ope
n Su
n
Girth classes in cm
100
90
80
70
60
50
40
30
20
10
010 to 16 17 to 23 24 to 30 31 to 37 38 to 45
(Driage will be less if the material is lying in the plantation area because the moisture level ismore in the plantation and due to shade castby movement of the Sun)
Drying :
Drying is also noticed more in lowerclasses than upper classes. Trend is shownin the below given table as well as bar graph.
It is natural that more moisture will be lostfrom the place where more of it is present.
It is observed after 7 days of drying inopen that the maximum weight left is in the
uppermost class (87%) and the minimum(72.7%) in the lowest class. So it can be in-ferred that the drying will be more if a planta-tion has more abundancy of lower girth classesand vice versa. Hence, it will be inversely pro-portional to the girth of the of the trees.
2.3 cum of stacked under bark volume=1
ton, the ratio being used to arrive at weightedvolume, does not appear to hold good in allcases as per this study. Even if an allowanceof 20% is made for bark Krishnamoorthy, etal 1978 has prescribed 20% allowance forbark in case of first rotation coppice growth inE. hybrid), as per this equation, the weight of
MyForest December 2011
266
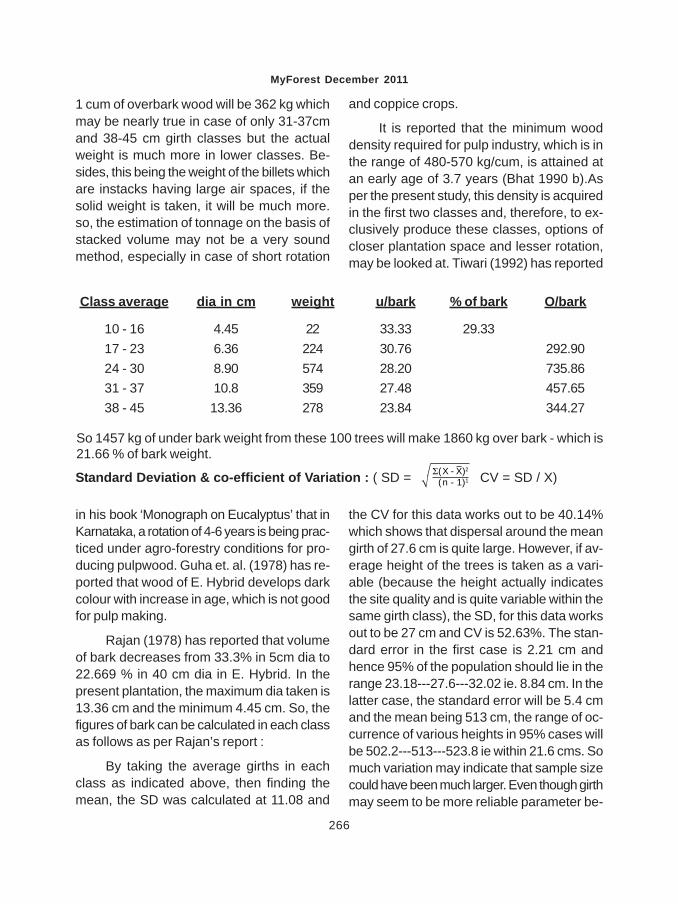
Class average dia in cm weight u/bark % of bark O/bark
10 - 16 4.45 22 33.33 29.3317 - 23 6.36 224 30.76 292.9024 - 30 8.90 574 28.20 735.8631 - 37 10.8 359 27.48 457.6538 - 45 13.36 278 23.84 344.27
1 cum of overbark wood will be 362 kg whichmay be nearly true in case of only 31-37cmand 38-45 cm girth classes but the actualweight is much more in lower classes. Be-sides, this being the weight of the billets whichare instacks having large air spaces, if thesolid weight is taken, it will be much more.so, the estimation of tonnage on the basis ofstacked volume may not be a very soundmethod, especially in case of short rotation
So 1457 kg of under bark weight from these 100 trees will make 1860 kg over bark - which is21.66 % of bark weight.
Standard Deviation & co-efficient of Variation : ( SD = CV = SD / X)
and coppice crops.
It is reported that the minimum wooddensity required for pulp industry, which is inthe range of 480-570 kg/cum, is attained atan early age of 3.7 years (Bhat 1990 b).Asper the present study, this density is acquiredin the first two classes and, therefore, to ex-clusively produce these classes, options ofcloser plantation space and lesser rotation,may be looked at. Tiwari (1992) has reported
in his book ‘Monograph on Eucalyptus’ that inKarnataka, a rotation of 4-6 years is being prac-ticed under agro-forestry conditions for pro-ducing pulpwood. Guha et. al. (1978) has re-ported that wood of E. Hybrid develops darkcolour with increase in age, which is not goodfor pulp making.
Rajan (1978) has reported that volumeof bark decreases from 33.3% in 5cm dia to22.669 % in 40 cm dia in E. Hybrid. In thepresent plantation, the maximum dia taken is13.36 cm and the minimum 4.45 cm. So, thefigures of bark can be calculated in each classas follows as per Rajan’s report :
By taking the average girths in eachclass as indicated above, then finding themean, the SD was calculated at 11.08 and
the CV for this data works out to be 40.14%which shows that dispersal around the meangirth of 27.6 cm is quite large. However, if av-erage height of the trees is taken as a vari-able (because the height actually indicatesthe site quality and is quite variable within thesame girth class), the SD, for this data worksout to be 27 cm and CV is 52.63%. The stan-dard error in the first case is 2.21 cm andhence 95% of the population should lie in therange 23.18---27.6---32.02 ie. 8.84 cm. In thelatter case, the standard error will be 5.4 cmand the mean being 513 cm, the range of oc-currence of various heights in 95% cases willbe 502.2---513---523.8 ie within 21.6 cms. Somuch variation may indicate that sample sizecould have been much larger. Even though girthmay seem to be more reliable parameter be-
√Σ(X - X)2
(n - 1)1
MyForest December 2011
267
cause of its lesser variation, the finding thatdispersal is more if height is taken instead ofgirth, leads to the probable conclusion thatwithin the same girth dimension, variousheights exist. So calculation of weight on thebasis of only girth without taking into consid-eration the height, may lead to faulty estima-tion because even though 2 % of the area hasbeen sampled, the actual estimation of yieldis based on destructive analysis of only 100trees which is further 7.4% of the trees in 2%of the sampled area in only 0.126% of thetotal number of expected trees in the planta-tion. This is too small a sample because wehave selected a sample within a sample andthe data of these 100 trees will hold good onlyfor 1362 trees present in the total sampledarea and not for 79000 odd trees existing inthe entire plantation.
Probably, the better method will be notonly to classify girths but the girths & heighttogether. In this scenario, each girth class willhave different height subclasses. Ocularheights can be taken or, in the beginning,some kind of altimeters or Abeney’s level canbe used so that gradually the staff will get anidea about differences in ocular and actualheights. A larger sample of at least 1% of thetotal trees has to be selected (790 trees inthis case). Then destructive analysis can bedone in each girth cum height class accord-ing to frequency of its occurrence. Also, in-stead of cutting around one or two places, asis being done at present, the cutting shouldbe spread be out to locations of all plots inorder to cover variations are bound to exist.
Felling season :
Shri B K C Rajan has suggested thatfelling should never be done in summer monthswhen the soil moisture will be low which willhamper the coppice formation and cause
mortality.
Conclusions1. The lowest two classes, though consti-tute 46% of the total number of trees, contrib-ute only 16.87% towards the yield.
2. The 2.3 cum = 1 ton ratio is not a soundbasis to calculate the yield and, in actuality,it will weigh much more than a ton. That iswhy some corporations which pay royalty tothe Karnataka Forest Department stacked vol-ume basis, invariably get 20-25 % more ton-nage which they term as ‘hidden profit’.
3. Even though the bark and driage % ageis more in the lowest two girth classes, thedry weight/ cum is found to be more hereincomparison to other classes. Therefore, it maybe worth trying to raise shorter rotation plan-tations, say of 5 years rotation, at closer spac-ing of not more than 1.5 meters in order togrow more weight / hectare / year.
4. The dispersal and variations are foundto be large. The reason may be the geneticand morphological diversity due to the originof the plantation from the seed, the source /sources of which are not known. Hence, itmay be advisable to raise only the clonal plan-tations in which the variation will be lesser.
5. Due to existence of various heights indifferent girth classes, the parameter of heightin the calculation of yield should not be ig-nored.
6. As against the practice of felling the treesfor destructive analysis at one or two spotsonly, the representative tree felling should bespread out to all the locations where the SPsare formed in order to cover various factorsand conditions.
7. At present, the practice is to fell only100 trees for the purpose of destructive analy-
MyForest December 2011
268
References
Bhat K M (1990 B) : Wood quality improve-ment of Eucalyptus in India: an assess-ment of property variation, J Ind. Acad.Wood Sci., 21(2): 33-40.
Guha et al (1978) : High Brightness pulps asfilter for production of urea formaldehydeand melamine formaldehyde mouldingpowder, Indian For., 104(1 : 51-58).
Krishnamoorthy et al (1978) : Productionestimates of Eucalyptus plantations ofsecond rotation : Ledger file, office of theSilviculturist Bangalore.
Rajan B.K.C. (1978) : Versatile Eucalyptus:Diana Publications, Nandidurg Exten-sion, Bangalore.
Tiwari D N (1992) : Monograph on Eucalyp-tus: Surya Publication Nashville RoadDehradun.
sis, irrespective of the total extent of the plan-tation and the number of total trees present init. It is suggested that while the extant maybe retained as a criteria for laying the SPs,as is beige done at present, the number oftrees to be felled for the sake of destructiveanalysis should be linked to the number oftotal trees present in the plantation and should
not be lesser than 1 % because the presentsample size is found to be too small.
8. The debarking operations consume alarge labour component and cause rapid dry-ing in debarked billets thus inflicting a hugerevenue loss to the Corporation. Hence, it issuggested to expose the plantations for saleover bark.
PARTICIPATORY RESEARCH ACTIVITYA CONCEPTUAL UNDERSTANDING
G. SELVA KUMAR, IFS
The traditional Forestry research haslargely had no significant impact to provideinformation and respond to the challenges ofsustainable forestry development and haslargely been constrained with the lack of fi-nancial resources. Traditional research ap-proaches do not provide enough flexibility andrespond insignificantly to changing externalcircumstances and learning processes to for-est researchers. The participatory researchcan generate solutions to local level forestmanagement issues through learning pro-cesses, which will generate site-specific so-lutions to the particular socio-economic andphysical problems.
Participatory research activity (PRA) isan effective and powerful partnership of civiland government stakeholders agreeing with aresearch programme, providing resources,executing and evaluating it continuously andeffectively. In contrast with the dynamic na-ture of community forestry development, for-estry research globally has been slower torespond to the requirements of the local stakeholders. In view of the limitations of more “con-ventional research” and the desire to empowerand support the user group institution, it isnow felt that a renewed and fresh approach isneeded which would focus on site specificproblems, identification of the same and localsolution of problems.
Participatory forestry, known as Com-munity Forestry is now widely adopted ameans to develop sustainable rural livelihoods;
it is focused on forest management and im-proved access to rural people for multiple for-est products.
Participatory research is a different leveland type of local involvement of local stake-holders in the research process. It also en-compasses different methods, tools and ap-proaches.
The rationale for acknowledging the im-portance of participatory research would beto encourage Community participation in or-der to improve the usefulness of research tolocal people. Another reason may be for em-powerment or social transformation tostrengthen the local people’s capacity in de-cision-making in research, and in managementof local resources, in order to improve theirawareness of options and to strengthen theirability to act on their own behalf.
Under the traditional research, the re-searcher sets agenda, controls and under-takes research activities and finally, he ben-efits from the results. Hopefully, communityinteractions will indirectly benefit in the longrun. Capacity of the community is under-esti-mated and people are separated from the re-search process and therefore from the resultsof results of research. Conversely, participa-tory research recognizes the social capital ofthe community. Under participatory research,the researcher and the community identify theproblems together. Activities are planned,
MyForest, December, 2011Vol.47(4) Page Nos.269-270
* Addl. Principal Chief Conservator of Forests, Research and Utilisation, Bangalore.

MyForest December 2011
270
implemented, monitored and evaluated to-gether.
It has been increasingly recognized thatparticipatory research encourages the involve-ment of local people with the objective of im-proving the effectiveness of the research andenhancing its usefulness for the community.The goal of “empowering” participation is toempower marginalized people and communi-ties by strengthening collective and individualcapacity and decision-making power withinwider society. Given the fact that there is highcontrol or ownership over the research pro-cess. local people make decisions with thehelp of the researchers, implement activities,analyze information and use the research fortheir purpose. There is a collective decision-making and negotiation for the improvementof the existing condition.
Strengths of Participatory research
• The participatory action research couldgear up towards Institutional strength-ening/ empowerment of the capacity-building of diverse stakeholders of thegroup/communtity) and this its princi-pal strength.
• Besides this, the other strengths com-
prises of the relatively high focus onunderstanding the multiple perspec-tives/high focus on the quality of par-ticipation, greater degree of the reliabil-ity of the findings (because more inti-mate contact will be maintained forbuilding trust between the researchersand the local stakeholders).
• The strength and quality of the researchalso hinges on the competency of theresearchers using the participatorymethods and hence, it has to be en-hanced with critical understanding ofthe limitations and benefits of tools andmethods, and increasing their aware-ness of power and social relations.
ConclusionParticipatory research would be signifi-
cantly cheaper compared to conventional for-estry research. The research establishment ,protection and maintenance costs are con-siderably lower in participatory research. Thecost evaluation and demonstrate Research-ers’ ability to provide the information neededby clients and make the research institutioneffective and functional.
References
Laya Prasad Uprety : Participatory actionresearch in community forestry.
A. Lawrence : Forestry, Forest users andresearch.
K.P. Acharya and K. Goutam : Cost of doinga research.

MAVINAKURVE BAMBOO PARK IN GOA
DR. K. A. KUSHALAPPA, IFS (RETD.)
Very few government servants / officerswill be recognized for their sincere and hardwork. It is particularly true and rare, especiallyin Forest Department, where the officers workin remote forest areas and away from publiceyes and their work is hardly seen by othersand media, however good and arduous it maybe. Besides, forest officers are also shy ofpublicity. Under such circumstances, the rec-ognition of the services of Shri G. R.Mavinkurve, specially when he was in the for-est Department of Goa is laudable, thoughthe honour came a little late and from a pri-vate entrepreneur.
Shri Mavinkuve has served in Gujarat,Maharastra, Goa and Karnataka in variouscapacities and he was held in high esteemfor his sincerity, hard work, straight - forward-ness, cool mind and ability to take quick andright decisions without heeding to any out-side pressure. In Goa, he served as Conser-vator of Forests (Head of the Forest Depart-ment) during the Goa-liberation in 1961. He
MyForest, December, 2011Vol.47(4) Page Nos.271-273
served in Goa from 1964 to 1968.He waspraised for his valuable assistance to the In-dian Army during liberation, to move fromKarnataka side through in-hospitable, in-ac-cessible evergreen forests of Western Ghatsinto Goa. He was responsible to lay out asound forest management and administrationfor the first time in liberated Goa. His shorttenure in Goa, Diu & Daman, before joiningKarnataka was appreciated and respected byall. He encouraged tourism by constructingseveral forest guest houses at vantage points.
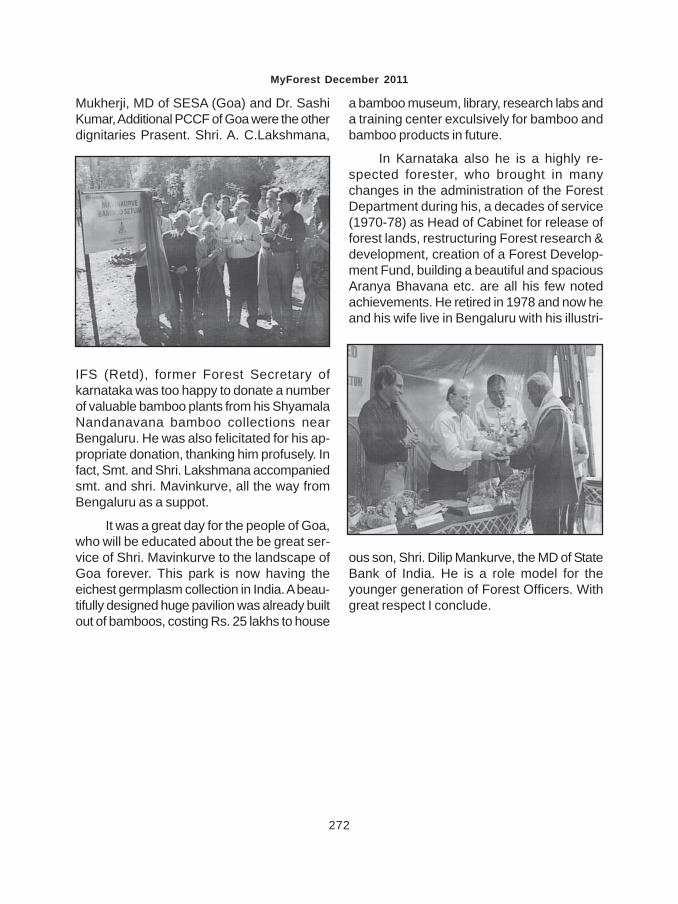
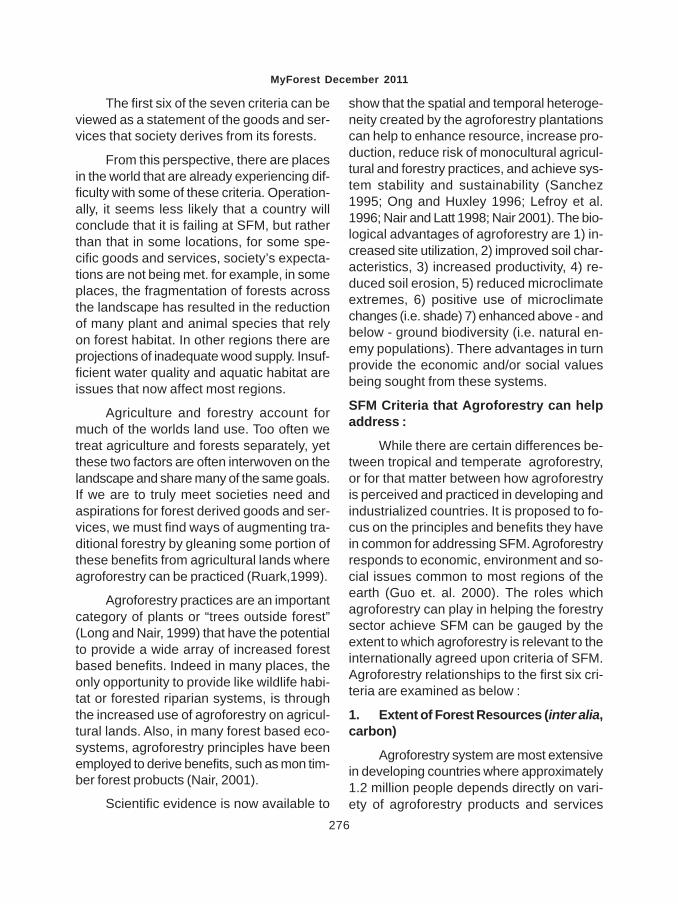
Recently, it is befitting to know that, theGovernment of Goa in collaboration with M/sSESA, Goa (Vedanta group) has created abeautiful bamboo park and named it asGanesh Mavinkurve Bamboo park as a markof respect to this great forester Shri.Mavinkurve. The park was throwm open topublic by Shri Mavinkurve by watering a bam-boo plant. The function was presided over bythe present Hon’ble speaker Shri. PrathapSingh Rane (former CM of Goa). Shri.
Photo - Bamboo Pavilion
No. 666, 3rd Cross, 1st Block, Ramakrishna Nagar, Mysore - 570 023.
MyForest December 2011
272
Mukherji, MD of SESA (Goa) and Dr. SashiKumar, Additional PCCF of Goa were the otherdignitaries Prasent. Shri. A. C.Lakshmana,
IFS (Retd), former Forest Secretary ofkarnataka was too happy to donate a numberof valuable bamboo plants from his ShyamalaNandanavana bamboo collections nearBengaluru. He was also felicitated for his ap-propriate donation, thanking him profusely. Infact, Smt. and Shri. Lakshmana accompaniedsmt. and shri. Mavinkurve, all the way fromBengaluru as a suppot.
It was a great day for the people of Goa,who will be educated about the be great ser-vice of Shri. Mavinkurve to the landscape ofGoa forever. This park is now having theeichest germplasm collection in India. A beau-tifully designed huge pavilion was already builtout of bamboos, costing Rs. 25 lakhs to house
a bamboo museum, library, research labs anda training center exculsively for bamboo andbamboo products in future.
In Karnataka also he is a highly re-spected forester, who brought in manychanges in the administration of the ForestDepartment during his, a decades of service(1970-78) as Head of Cabinet for release offorest lands, restructuring Forest research &development, creation of a Forest Develop-ment Fund, building a beautiful and spaciousAranya Bhavana etc. are all his few notedachievements. He retired in 1978 and now heand his wife live in Bengaluru with his illustri-
ous son, Shri. Dilip Mankurve, the MD of StateBank of India. He is a role model for theyounger generation of Forest Officers. Withgreat respect I conclude.

AGROFORESTRY : SUSTAINABILITY ISSUESAND FUTURE PROSPECTS
RAJAT. S. PAL, H. N. HYMAVATHI AND RICHA KAKKER
ABSTRACT
Agroforestry is an age-old practice and India has been in the forefront of agroforestryresearch ever since organized research in agroforestry started nearly 50 years ago.Considering the country’s unique land-use, demographic, political and socio-cul-tural characteristics as well as its strong record in agricultural and forest rescarch,India’s experience in agroforestry research has contributed to the development ofagroforestry in other developing countries. It is crucial that progressive policy, insti-tutional and legal framework are created to eschew the historical dichotomy be-tween the agriculture and forestry sectors and encourage integrated land-use sys-tems, Agroforestry has got much attention in India from researchers, policymakersand others for its perceived ability to contribute significantly to economic growth,poverty alleviation, environmental amelioration and biological diversity, which makesit an important tool for integrated and sustainable development.
Key words :
Agroforestry, Sustainability issues, Future prospects, SFM criteria, Forest Resources,Food security, Biodiversity
IntroductionAgroforestry is an age-old practice. The
process of human evolution has been fromforests, when man learnt the art of domesti-cating plant and animals after leaving thehunting and gathering habit. Agroforestry is aland use system, which is capable of yield-ing both wood and food while at the sametime conserving and rehabilitating ecosys-tems . This has co-evolved with agricultureand its practice in the country in differentforms. Relationship of man with trees and theland use system can be appreciated in itstemporal and special dimensions across agro-climatic regions. Agroforestry systems havebeen the target of scientific enquiry and analy-sis and thus have been defined by many indifferent ways.
Agroforestry Defined :
As per the various definitions ofAgroforestry, it has the following components(Nair,1989):
(i) It is the deliberate growing of woodyperennials in the same unit of land as agri-cultural crops and / or animals either in somefrom of spatial mixture or in sequence.
(ii) There must be significant interaction(positive/negative) between the woody andnon-woody components of the system, eitherecological and/or economical.
(iii) This is a production system whichtends to harmonize the production of variouscomponents and also maximizes the totalproduction from a given unit of land.
(iv) The production and use is sustain-
MyForest, December, 2011Vol.47(4) Page Nos.273-284
* Tropical Forest Research Institute, OP. RFRC, Mandla Road, Jabalpur - 482 021, India

MyForest December 2011
274
able and makes use of modern technologiesand traditional local experience and is com-patible with the social and cultural life of thelocal population.
(v) It is a long term land managementsystem and the cycle of agroforestry systemis more than one year.
(vi) It is a more complex form of landmanagement both ecologically and economi-cally than other agricultural or forestry sys-tems.
Bene et. al.(1977) defined agroforestryas “a sustainable management system forland that increases overall production, com-bines agricultural crops, tree crops and for-est plants and or animals simultaneously orsequentially and applies management prac-tices that are compatible with the culturalpatterns of the local population”. Several au-thors have attempted to define agroforestryduring the past two decades. The recent defi-nition by Leakey states that , “Agroforestryis a dynamic ecologically based, natural re-source management system that through theintegration of tree in farm and rangeland, di-versifies and sustains small holder produc-tion for increased social, economic and envi-ronmental benefits”. Thus, agroforestry is anefficient land use system where trees/shrubsare grown with arable crops seeking positiveinteractions in enhancing the productivity onsustainable bases.
As per the Planning Commission of In-dia, it needs to be clearly understood thatspecifying the existence of spatial-temporalarrangements among the components doesnot help in defining agroforestry, but its valuelies in classifying agroforestry examples.multiple cropping as opposed to multiple usesin a necessary condition to agroforestry. Pro-duction diversification is not exclusive toagroforestry and does not help in definingagroforestry. The sole existence of economi-
cal interactions among the components is nota sufficient condition to define agroforestry,biological interactions must be present. Simi-larly the term significant interactions amongthe components cannot be used objectivelyin defining agroforestry and, its use shouldbe avoided. The presence of animal is notessential to agroforestry. Agroforestry impliesmanagement of atleast one plant species forforage, and annual or perennial crop produc-tion. Once appropriate time limits are im-posed on the system, time sequences involv-ing atleast two plant species with atleastwoody perennial must be considered asagroforestry. On the basis of this analysis,the final understanding about agroforestry is:
Agroforestry is a form of multicroppingwhich satisfies three basic conditions :
1) Their exists atleast two plant speciesthat interact biologically,
2) Atleast one of the plant species is awoody perennial and
3) Atleast one of the plant species ismanaged for forage, annual or perennial cropproduction).
Thus, agroforestry is a land managingsystem that optimizes in time and spacewhere woody perennial is one of the compo-nents.
Raw material supply and sustainabilityissues:
As per Ruark G.A et. al (2009), forestryis faced with the challenge of meeting andincreasing demand for goods, as well as forand expanding array of services, like cleanwater, soil conservation and wild life habitat,from a fixed or shrinking land base. Solutionsthat balance forestry with the sustainabilityof other sectors, like agriculture and commu-nities, are needed. Agroforestry, the deliber-ate cultivation of trees or other woody plantswith crops or pasture for multiple benefits, is

MyForest December 2011
275
an important category of planted forests thathas the potential to provide farmers, commu-nities, and society at-large with wide array offorest related goods and services. Agrofores-try can complement the efforts of the forestrysector in sustainable forest management byproviding a set of tree based conservation andproduction practices for agricultural lands.Some important sustainability issues onwhich agroforestry can assist forestry are :biological diversity, wood and non timber prod-ucts, ecosystem interiority, soil and waterquality, terrestrial carbon storage and socio-economic benefits. The ecological foundationfor agroforestry lies in the structural and func-tional diversity the plantations create at boththe site and landscape levels. To realizeagroforestry’s capability to provide nultipleservices to land users and society, tools thatmould region-, landscape- and site-scale con-cerns can be used to deploy variety of prac-tices across the landscape in strategic spa-tial arrangements. GIS-coordinated land-usesuitability assessments can assist in identi-fying critical problem areas and desired fu-ture conditions and along with other site leveltools, generate desired alternatives that inte-grate farmer and societal objectives.
During the past 50 years, the earth’spopulation doubled to reach its current levelof its 6 billion. Today, the world population isincreasing by 80 million annually, with the totalprojected to reach 10 billion within 40 moreyears. Humanity must learn to live within theconstraints imposed by the physical environ-ment as both providers of input and a sink forwastes. The fact that more than one billionpeople do not have access to clean waterand 1.7 billion people lack basics and sani-tation illustrates that the demand of the grow-ing human population on natural systems.This raises huge challenges for policy-mak-ers as they seek to reconcile the needs andaspirations of a growing population with re-
source limitations.
Forestry is faced with the challenge ofmeeting an increasing demand for wood prod-ucts as well as for as expanding array of ser-vices, such as clean water, recreation andwild life habitat. In most regions, these needswill have to be met from a fixed or shrinkingland base. Forests may be able to producesufficient wood but production cost will rise.Forest management must consider the po-tential from negative impacts, clean environ-ment, as well as how to cope with the uncer-tainties of weather and climate change.
Ultimately, the challenge is to find waysto sustain the provision of goods and servicesthat society derives from forests in ways that“meet the needs of the present without com-promising the ability of future generation tomeet their own needs”. (Bruntland,1987).
Following the 1992 Earth Summit, therehave been numerous efforts throughout theworld to define sustainable forest manage-ment (SFM). Foremost among these havebeen efforts to establish Criteria and Indica-tors (C&I) that provide a common frame workfor describing, monitoring, and evaluatingSFM. Although, the various C & I efforts origi-nated from country-led efforts, there is sur-prising similarities in the criteria that evolved.All C&I approaches seek to characterize SFMon the basis of the range of benefits derivedfrom forests and they all incorporate elementsof the following criteria (Wijewardana,1998):
1. Extent of Forest Resources2. Healthy Forest Ecosystem3. Productive Functions4. Biological Diversities5. Protective Functions6. Socio Economic Benefits7. Legal, Policy and Institutional
Framework.
MyForest December 2011
276
The first six of the seven criteria can beviewed as a statement of the goods and ser-vices that society derives from its forests.
From this perspective, there are placesin the world that are already experiencing dif-ficulty with some of these criteria. Operation-ally, it seems less likely that a country willconclude that it is failing at SFM, but ratherthan that in some locations, for some spe-cific goods and services, society’s expecta-tions are not being met. for example, in someplaces, the fragmentation of forests acrossthe landscape has resulted in the reductionof many plant and animal species that relyon forest habitat. In other regions there areprojections of inadequate wood supply. Insuf-ficient water quality and aquatic habitat areissues that now affect most regions.
Agriculture and forestry account formuch of the worlds land use. Too often wetreat agriculture and forests separately, yetthese two factors are often interwoven on thelandscape and share many of the same goals.If we are to truly meet societies need andaspirations for forest derived goods and ser-vices, we must find ways of augmenting tra-ditional forestry by gleaning some portion ofthese benefits from agricultural lands whereagroforestry can be practiced (Ruark,1999).
Agroforestry practices are an importantcategory of plants or “trees outside forest”(Long and Nair, 1999) that have the potentialto provide a wide array of increased forestbased benefits. Indeed in many places, theonly opportunity to provide like wildlife habi-tat or forested riparian systems, is throughthe increased use of agroforestry on agricul-tural lands. Also, in many forest based eco-systems, agroforestry principles have beenemployed to derive benefits, such as mon tim-ber forest probucts (Nair, 2001).
Scientific evidence is now available to
show that the spatial and temporal heteroge-neity created by the agroforestry plantationscan help to enhance resource, increase pro-duction, reduce risk of monocultural agricul-tural and forestry practices, and achieve sys-tem stability and sustainability (Sanchez1995; Ong and Huxley 1996; Lefroy et al.1996; Nair and Latt 1998; Nair 2001). The bio-logical advantages of agroforestry are 1) in-creased site utilization, 2) improved soil char-acteristics, 3) increased productivity, 4) re-duced soil erosion, 5) reduced microclimateextremes, 6) positive use of microclimatechanges (i.e. shade) 7) enhanced above - andbelow - ground biodiversity (i.e. natural en-emy populations). There advantages in turnprovide the economic and/or social valuesbeing sought from these systems.
SFM Criteria that Agroforestry can helpaddress :
While there are certain differences be-tween tropical and temperate agroforestry,or for that matter between how agroforestryis perceived and practiced in developing andindustrialized countries. It is proposed to fo-cus on the principles and benefits they havein common for addressing SFM. Agroforestryresponds to economic, environment and so-cial issues common to most regions of theearth (Guo et. al. 2000). The roles whichagroforestry can play in helping the forestrysector achieve SFM can be gauged by theextent to which agroforestry is relevant to theinternationally agreed upon criteria of SFM.Agroforestry relationships to the first six cri-teria are examined as below :
1. Extent of Forest Resources (inter alia,carbon)
Agroforestry system are most extensivein developing countries where approximately1.2 million people depends directly on vari-ety of agroforestry products and services
MyForest December 2011
277
(IPCC 2002). When land conversion was ex-amined, Watson et. al. 2000, documentedthat the latest potential for carbon uptake isthrough the conversion of previously degradedlands into well managed agroforestry system.Schroth et. al. 2002, studied the reforesta-tion of primary forest lands in Amazonia thathave been previously cleared for crops orpasture. Reforestation with multi-strataagroforestry systems allowed for high ratesof biomass accumulation, with the additionalbenefit of the early generation of income fromannual and semi-perennial intercrops. Accord-ing to IPCC (2000), the potential land areasuitable for agroforestry in Africa, Asia andthe America may be as high as 1215 x 106ha.The current area under agroforestry is esti-mated at 400 x 106ha; of this 300 x 106ha areclassified as arable and 100 x 106ha as for-est lands.
Carbon storage - Agroforestry plantationscan sequester substantial carbon (Watson,2000) but it is important to understand theopportunities of climate change mitigationactivities in the context of multiple spatialscales (Allen and Hoekstra, 1992). Agrofore-stry can be used to link forest fragments andother critical habitat as part of a broad land-scape management strategy that enable spe-cies to migrate for reasons of population ge-netics and in response to climate change.Trees and shrubs planted in shelterbelts canstore carbon in their roots and shoots, whileprotecting soil and crops and providingbiodiversity and habitat for wildlife (Pandey,2002). Through either depositions of wind-blown soils or interception of surface runoffsediments, many of the linear-basedagroforestry practices, such as shelter beltsand riparian buffers can trap significantamounts of carbon-rich topsoil that wouldotherwise be lost from these systems (Lalet. al. 1999; Kimble et. al. 2003). Riparianforest buffers are natural carbon sinks and
when suitable trees and shrubs are grown inthese moist environments they also filter outcontaminants from adjacent agricultural orcommunity activities.
In temperate system, agroforestry prac-tices have shown to store large amount ofcarbon (Kort and Turlock, 1999; Schroeder1994). Potential carbon storage fromagroforestry system in temperate regions hasbeen estimated to range from 15-198 t C ha-1
with a model value of 34 t C ha-1 (Dixon, 1995).Nair and Nair, 2003 estimated crabon seques-tration potential through agroforestry prac-tices in the United States by 2025 as 90.3Mt C y-1. In the tropics, Palm et. al. 1999estimated that agroforestry system help toretain 35 percent of the original C stock ofthe cleared forest compared to 12 percent bycrop lines and pastures. Fay et. al. 1998 es-timated the area for potential conversionto agroforestry system at 10.5 X 10⁻⁶ha y-1.Based on a preliminary assessment of ter-restrial C sinks, two primary beneficiary at-tributes of agroforestry system have beenidentified : 1) direct near-term C storage (de-cades to centuries) in trees and 2) Potentialto offset immediate green house gas emis-sions associated with deforestation and sub-sequent shifting cultivation. A projection ofcarbon stocks for small holder agroforestrysystem indicated C sequestration rate rang-ing from 1.5 to 3.5 Mg C ha-1 y-1 and a triplingof C stocks in a 20 year period, to 70 Mg Cha-1 according to one estimate, median car-bon storage by tropical agroforestry practicesis around 9, 21, and 50 Mg C ha-1 in semi-arid, sub-humid eco zones repectively. As-suming that one hectare of agroforestry couldsave 5 hectare from the deforestation and thatagroforestry systems could be establisshedin upto two million hectare in the low latitude(tropical) regions annually, the significant
MyForest December 2011
278
portion of carbon emission caused by defor-estation could be reduced by establishingagroforestry system (Palm et. al. 1999).
2. Healthy forest Ecosystems :Forest activity at a specific site needs
to be interrelated in a broader land-use con-text that considers the management of landand water resources as regional units (Miller,1996). Agroforestry plantation can add struc-tural and functional diversity to landscapesand, if strategically located, they can helprestore many ecological functions (Olson etal. 2000). While agroforests are typically lessdiverse than native forests they do contain asignificant number of plant and animal spe-cies. This diversity can, in time, provide eco-logical resilience and contribute to the main-tenance of beneficial ecological functions(Lefroy et, al. 1999, Vandermeer, 2002). Simi-lar to tree plantations, agroforests can helprelieve some of the purpose to harvest nativeforests (although their presence as such isnot a sufficient condition for old growth for-ests).
3. Productive Functions (Inter alia,Wood/non-timber products) :
Agroforestry practices and agroforestscan be used to produce harvestable wood forfuel-wood, pulp, timber and many other prod-ucts. The potential for agricultural lands toaugment the world food supply is substantial(Watson et. al. 2000), and has the addedbenefits of bolstering on/farm income. Manyagroforestry designs can also be used to pro-duce non timber commercial products.Agroforestry plantations mixed into and at theedges of forest plantations can be used toproduce a white array of products, like me-dicinal, ornamentals and food products, whichare compatible with wood production. This willalso allow for greater structural diversity anddevelopment of more diverse plant communi-ties.
4. Biological Diversity :
There is not enough forested habitat re-maining in some landscapes to support somespecies of plants and animals. Even whenthere are forest reserves in an area they maybe too small to contain the habitat require-ments of all species. In addition, most spe-cies have populations that extend beyondreserve boundaries (Kramer et. al. 1997).Agroforestry provides ways of augmenting thesupply of forest habitat and providing greaterlandscape connectivity. Where croplandsoccupy most of the landscape, linear ripar-ian forest buffers and field shelter belts canbe essential for maintaining plant and animalbiodiversity, especially under scenario ofchanging climate. Agroforestry adds plant andanimal biodiversity to landscapes that mightotherwise contain only monocultures of agri-cultural crops (Noble and Dirzo, 1992 ; Guo,2000).
The use of corridors to connect frag-mented habitats has long being proposed asa mechanism to enhance population pro-cesses (Wilsom and Willies, 1975). There arearguments for and against the use of distinctcorridors (Simberloff et. al. 1992, Perault andLomolino, 2000), but it is important to recog-nize that corridors are not necessarily dis-tinct and linear. Often a ‘corridor’ may simplymean habitat areas that are sufficiently closeto ech other (i.e., functionally linked) to en-able dispersal. If spatial arrangement is con-sidered, agroforestry plantations can be usedto connect forest fragments and other criticalhabitat in the landscape (Freemark, 2002).Modest considerations like mixing tree spe-cies, allowing for small clearing and watercatchments in planting, and incorporatingunderstorey vegetation can greatly improvehabitat for many animals and create micro-site conditions for plant species (Spies andFranklen, 1996).

MyForest December 2011
279
5. Protective Functions : (Inter alia, soil/water)
Agroforestry plantations have the poten-tial to contribute significantly to maintainingor improving soil and water quality in a re-gion, while helping to maintain the carboncycle by sequestering large amounts of car-bon in their biomass. The degree with theseother ecological functions can be provided willdepend on plant species composition andtheir physical structure both above and be-low the ground.
Soil Quality - One of the main conceptualfoundations of tropical agroforestry is thattrees and other vegetation improve the soilbeneath them. Observations of interactionsin natural ecosystems and subsequent sci-entific studies have identified a number of factsthat support this concept. Research resultsduring the past two decades show that threemain tree mediated processes determine theextent and rate of soil improvement in agrofore-stry systems. These are : 1) increased N in-put through biological nitrogen fixation by ni-trogen fixing trees, 2) Enhanced availabilityof nutrients resulting from production anddecomposition of substantial quantities of treebiomass, and 3) Greater uptake and utiliza-tion of nutrients from deeper layers of soil bydeep routed species (Nair et. al. 1999). Theother major avenue of soil improvement ofagroforestry is from soil conservation. Whenproperly designed and managed, agroforestrytechniques can contribute to ecosystemprotecton and restoration functions by reduc-ing water and wind erosion and enhancingsoil productivity.
Water Quality - Most water shades containa mixture of land uses, including forestry andagriculture. Protecting water quality requiresan integrated multi-sectoral approach to wa-tershed management. Streams that course
through agricultural lands are often devoid ofvegetation in their riparian zones and runoffcontaining excess fertilizers, pesticides, ani-mal wastes, and soil sediments enters sur-face water unabated. Agroforestry technolo-gies, like riparian forest buffers, have beenshown to be effective in reducing water pollu-tion from agricultural activities when they arewell designed and properly located in a watershed (Dosskey, 2002). These buffers can sta-bilize stream channels and slow and reducethe transport of runoff to streams. This allowsmore time for infiltration of water and contami-nants into the soil and increase the ability ofthe environment to degrade pesticides andanimal waste product. Linked systems ofupland and riparian tree based buffer systems,designed in regards to other landscape prac-tices and features, can optimize soil andwater conservation in the watershed, alongwith other economic and social services.
6. Socio Economic Benefits : (Inter alia,silvipastoral / green infrastructure)
In societies where a major part of thepopulations still makes their living off the land,the first concerned may be annual incomeand it is here that agroforestry efforts differmost from conventional ‘tree plantation’ ef-forts (Dikson, 1995, Leakey and Sanchez,1997). In addition, communities are increas-ingly looking for ways to address social andenvironmental issues with ‘green’ solutions.Two examples are provided :
Silvipastoral - Research has demonstratedthat many forage plants will yield high levelsof quality biomass when grown under upto50% shade. This knowledge is being used todesign agroforestry timber / grassing systemsin conifer stands. These silvipastural systemsallow trees to be grown as a long-term prod-uct, while on the same piece of land an an-nual income can be generated from grazinglivestock (Clason and Sharrow, 2000). In a
MyForest December 2011
280
silvipastoral system, trees are grown at a lowstocking density to allow about half the sunlight to reach the ground to grow forage. For-age management is encouraged as trees arepruned periodically to maintain proper lightlevels. As a result, most of the wood producedis high value short timber and veneer quality.While farmers often seek economic diversifi-cation as the main motivation for establish-ing silvipasture, other benefits include ero-sion control, improve wild life hatitat and car-bon sequestering. In addition,z the low treestocking and managed understorey makesthem inherently low risks for damage by wild-fires.
Green Infrastructure in communities : Insocieties where many live in urban / subur-ban environments, concerns over the accel-erating loss of open and green space tend tobecome prominent. This is a quality-of-lifeissue to many and raises the potential foragroforestry application at the agricultural /community interface to restore ecologicalfunctions that provide for storm water man-agement, wildlife habitat, recreational oppor-tunities and aesthetic enhancement, as wellas a wide array of non timber roducts(Thaman, 1993). Communities have long un-derstood the need for ‘grey infrastructure’ likewater and sewer lines, power lines and roadways. More recently, the importance of ‘greeninfrastructure’ that consists of a planned andmanaged interconnected network of naturalareas (water ways, wet lines, forests etc.)and adjacent working lands (farms, industriesand corporate lines) has gained recognitionin many communities (The ConservationFund 2002). Agroforestry approaches thatutilize trees, shrubs, and grasses to managestorm water runoff are also being adapted tomeet community needs to detain and treatstorm water. The vegetation can also act asa living filter to improve water quality down-stream and protect stream channels.
The Ecological Foundation for Agrofore-stry
Agroforestry plantation provides us withan excellent tool to meet farmer needs whilerestoring ecological functions to the land-scape. By adding structural and functionaldiversity to the landscape, these tree basedplantations can perform ecological functionsthat can have significance for greater than therelatively small amount of land that they oc-cupy (Guo 2000).
Fostering Use of Agroforestry in Sustain-able Land Use Strategies
Much of the current endeavors inagroforestry worldwide are focussed on meet-ing the needs for human subsistence. Thepressing objective tends to create manage-ment aimed at maximizing that primary con-cern. To create system sustainability, how-ever, requires that multiple concerns are ad-dressed, at least to varying degrees.Agroforestry has tremendous potential to helpfarmers balance the sometimes conflictinggoals of production with stewardship by pro-viding tree-based goods and services whilekeeping the land in agricultural production.Through these services and goods,agroforestry technologies can be used to cre-ate environmental and economic linkageacross the agricultural, urban and forestedcontinuum. Agroforestry is not panacea butshould be included in the set of options whentackling issues of population growth, urbansprawl, landscape fragmentation, and the in-creasing need to produce forest and agricul-tural goods and services on a decreasing landbase.
Although there are some notable excep-tions, the general lack of economic regardsto farmers for the environmental services pro-vided to society by agroforestry practiceshas limited its promotion and adoption(Thaman and Clark, 1993). An operational shift

MyForest December 2011
281
in thinking that recognizes the broader work-ing nature of our managed landscapes, alongwith new ways of valuing the productive andprotective functions agroforestry provides inthese systems, is needed to encourage thegreater adoption of agroforestry in both tem-perate and tropical systems.
Future prospects
1. Commercial regions :
As per the Planning Commission of In-dia, the following recommendations for pro-moting agroforestry/farm-forestry in commer-cial regions of India are made :
In regions where agricultural surplus isproduced and which are familiar with markets,commercial agroforestry should be practiced.About 10 m ha out of 46 m ha irrigated landin the country are facing the problem of waterlogging, soil erosion and salinisation. Agri-culture production is stagnant and soil andwater pollution due to excessive use of chemi-cal interaction is rampant. To circumventthese problems adoption of agroforestry iscrucial in this region. The following strategyshould be adopted for the development ofcommercial agroforestry in this region.
Emphasis on selection of elite clonesof six selected species namelypopulus deltoides, Eucalyptus spp.(Eucalyptus camaldulensis, Eucalyp-tus citriodora, E. Globulus, E. robustaand E. tereticornis), Acacia nilotica,Bamboo spp. (Bambusa vulgaris,Bambusa tulda, Bambusa nutans,Dendrocalamus strictus), Prosopiscineraria, and Casuarina equisetifolia.
Research on harvesting, seasoning,sowing, preservation, processing andnew product development.
Establish perfect marketing infra-structure and ensure support price by
forging strong linkage between farm-ers and industry.
Initiate schemes for linking farmerswith industry, in ways similar to thelinking of popular growing farmers withWINCO in North India and with theITC is run Bhadrachalam paper millsin Andhra Pradesh. The industry pro-duces improved seeds, grows theseedlings in nurseries and givesthem to the farmers for planting. Farm-ers get crop loans from the bank andextension service from the industry.These examples shows that improvedplanting material can improve produc-tivity from 7 to 25 cubic meter / year.A minimum price is guaranteed to thefarmers by the industry, althoughfarmers are free to sale their produceto any one they life.
Improvement in R and D an applica-tion could result in production ofthicker logs suitable for sowing. Newuses of wood could be promoted suchas utilizing wood for power genera-tion through gasifies.
2. Subsistence regions :
As per the Planning Commission of In-dia, the following recommendations for pro-moting agroforestry/farm-forestry in subsis-tence agricultural regions of India are made :
There is no certainty of agricultural pro-duction of rainfed region. Due to poor vegeta-tion and tree cover and farms lying vacant forlong period during the year, wind erosion iscommon. Desertification is a serious threatto arid areas devoid of vegetative cover. Prac-ticing agriculture is uneconomic and migra-tion from these regions to cities and otherdeveloped areas for want of employment fur-ther neglects the region. For holistic and in-tegrated development of rainfed areas, it is
MyForest December 2011
282
crucial to adopt agroforestry. ‘Food For Work’scheme for implementation of agroforestry inwastelands, common lands, cultivable anduncultivable lands will improve food accessi-bility and ecology and economy of the year.As per the Planning Commission of India’sestimates, 2001, it is proposed to adoptagroforestry in 18m ha out of total 96 m harainfed areas in the country. Bamboo andmedicinal plants which are hardy and suit-able to this region should be given priority foradditional income besides meeting basicneeds of people.
3. Agroforestry for food security :
With roughly 60% of the world’s popu-lation depending upon only 1/3rd of the worldsland area, Asia is hard put to provide the ba-sic needs of its expanding population. Al-though past agricultural extensification andthe Green Revolution-led quantum jumps infood grain productivity have averted recurringfamines in parts of Asia, under the ‘businesshas usual scenario’ most Asian countries willnot be able to feed their projected popula-tions in the 21st century. On the one hand,there is less land per person in the Asia to-day than in other parts of the world and onthe other, productive land is displaced by ur-banization. Problems of soil salinization andwater logging, which render arable lands un-productive, also continued unabated. More-over, without proactive efforts, a considerableamount of irrigated lands may go out of pro-duction and that global warming might engi-neer food insecurity in several Asian nations.Woody perennial-based production system,however have the potential to arrest land deg-radation and improve site productivity by theirinteractions among trees, soil, crops and lifestock, and thus return part if not all the de-graded lands, into the production process.
They also have ability to maintain sustain-able production and sequester large quanti-ties of atmosphere CO2. Above all, the intrin-sic ability to provide multiple outputs, gener-ate cash return, improve the standards of liv-ing of rural poor and accomplish social eq-uity are noteworthy. Prominent examples in-clude tropical home gardens, taungya, parkland agroforestry, popular/other tree-basedproduction systems, integrated agricultureaquaculture systems and the slopping agri-cultural land technologies. (Kumar andMohan, 2004).
DiscussionAgroforestry systems have been the tar-
get of scientific enquiry and analysis and thushave been defined by many in different ways.Agroforestry responds to economic, environ-mental and social issues common to mostregions. Agroforestry plantations provide uswith an excellent tool to meet farmer needslike sustainable incomes, water availability,sooil quality, food security while restoringecological functions like biodiversity, sustain-able land use strategies and enhancing thecarbon storage of the landscape. An exami-nation of the impact of agroforestry technol-ogy generation and adoption in different partsof the country highlights the major role of smallland holders as agroforestry producers of thefuture. Therefore it is crucial that progressivepolicy, institutional and legal frameworks arecreated to eschew the historical dichotomybetween the agriculture and forestry sectorsfor encouraging integrated land-use systems.

MyForest December 2011
283
References :
Bruntland Commission. 1987. Our CommonFuture. The World Commission on En-vironment and Development. Oxford Uni-versity Press. Oxford, United Kingdom.P. 43.
Clason, T.R. and S.H. Sharrow. 2000.Silvopasture practices. P. 119-147. In :H.E. Garrett, W.J. Reitveld, and R.F.Fisher. (eds) North American Agrofore-stry : An Integrated Science and Prac-tice. American Society of Agronomy.Madison, Wisconsin, USA.
Dixon, R.K. 1995. Agroforestry systems :Sources or sinks of greenhouse gases?Agroforestry Systems 31 : 99-116.
Dosskey, M.G. 2002. Setting priorities forresearch on pollution reduction functionsof agricultural buffers. EnvironmentalManagement 30 : 641-650.
Fay, C.H. DeForeta, M. Sarait, and T.P.Tomich. 1998. A policy breakthrough forIndonesian farmers in the Krui dammaragroforester. Agroforestry Today 10(2): 25-26.
Freemark, K.E., C Boutin and C.J. Reddy.2002. Importance of farmland habitat forconservation of plant species. Conser-vation Biology 16 : 399-412.
Guo, Q. 2002. Climate change and biodiver-sity conservation in great plains agroecosystems. Global EnvironmentalChange 10 : 289-298.
IPCC (Intergovernmental Panel on ClimateChange) : 2000, ‘Land-use, Land-useChange and Forestry special report.Cambridge University Press, Cam-bridge.
Kimble, J., Heath, L.S., Birdasay, R.A., andLal, R., (eds). The Potential of U.S. For-
est Soils to Sequester Carbon and Miti-gate the Greenhouse Effect. BocaRaton, FL : CRC Press LLC, 429 p.
Kort, J. and R. Turlocj, 1999. Carbon reser-voir and biomass in Canadian prairieshelterbelts. Agroforestry Systems 44: 175-189.
Kramer, P., C.P. Van Shaik, and J. Johnson.1997. Lost stand - protected area andthe defense of tropical biodiversity Ox-ford University Press, Oxford, UK.
Kumar Mohan. B and Muhammed G. Miah.Abstracts : 2004. Oriando, Florida,USA. Pp. 5-5.
Lal, R., Kimble, J.M., Follett, R.R., and C.V.Cole (eds). 1999. The Potential of U.S.Cropland to Sequester Carbon and Miti-gate the Greenhouse Effect. CRC Press,Boca Raton, FL. 128 p.
Leakey, R.R.B., and P.A. Sanchez. 1997.How many people use agroforestry prod-ucts? Agroforestry Today 9 : 4-5.
Lefroy, E.C., Hobbs, R.J., O’Connor, M.H.,and J.S. Pate (eds). 1999. Agricultureas a Mimix of Natual Ecosystems.Kluwer Academic Publishers, Dordrecht,The Netherlands. 438pp.
Long, A.J., and Nair, P.K.R. 1999. Trees out-side forests : Agro - community, and ur-ban forestry. New Forests. 17 : 145-174.
Miller, K.R. 1996. Chapter 27 : ConservingBiodiversity in Managed Landscapes. In: Biodiversity in Managed Landscapes.R.C. Szara and D.W. Johnston 9eds)Oxford University Press, New York. 778pp.
Nair, P.K.R. and C.R. Latt, (eds). 1998. Di-rections in Tropical Agroforestry Re-
MyForest December 2011
284
search. Kluwer Acad. Publishers,Dordrecht, The Netherlands, 245 p.
Nair, P.K.R., R.J. Buresh, D.N. Mugendi, andC.R. Latt. 1999. Nutrient cycling in tropi-cal agroforestry systems : Myths andscience. Pp. 1-31. In : L.E. Buck, J.P.Lassoie, and E.C. Fernandes (eds),Agroforestry in Sustainable AgriculturalSystem. CRC Press, Boca Raton, FL.
Noble, I.R. and R. Dirzo. 1997. Forests ashuman-dominated ecosystems. Sci-ence 277: 522-525.
Olson, R.K., M.M. Schoeneberger, and S.G.Aschmann. 2000. An Ecological Foun-dation for Temperature Agroforestry.P.31-61. In : H.E. Garrett, W.J. Rietveld,and R.F. Fisher. (eds). North AmericanAgroforestry : An Integrated Scienceand Practice. American Society ofAgronomy. Madison, Wisconsin, USA.
Ong, C.K. and Huxley, P.A. (eds) Tree-cropInteractions. CABI, Oxon, U.K., 385 p.
Pandey, D.N. 2002. Carbon sequestration inagroforestry systems. Climate Policy2:367-377.
Planning Commission, Govt. of India. July2001. Report of the Task Force on green-ing India for livelihood security and sus-tainable development.
Ruark, G.A. 1999. Agroforestry andsustainability : making a patchworkquilt. J. of Forestry 97-56.
Ruark, G.A ; N.M. Schoeneberger and P.K.R.Nair. 2009. USDA National Agroforestry,Lincoln, NE USA 68583-0822, and Uni-versity of Florida, Gainesville, FL, USA32611-0410. Conference papers. P. 1-14.
Sanchez, P.A. 1995. Science in agroforestry.Agroforestry Systems 30 : 5-55.
Schroeder, P. 1994. Carbon storage benefitsof agroforestry systems. AgroforestrySystems 27 : 89-97.
Schroth, G.S., A.D’ Angelo, W.G. Teixeira,D. Haag, and R. Lieberei. 2002. Con-version of secondary forest intoagroforestry and monoculture planta-tions in Amazonia : consequences forbiomass, litter, and soil carbon stocksafter seven years. Forest Ecology andManagement 163 : 131-150.
Spies, T.A. and J.F. Franklin 1996. The diver-sity and maintenance of old-growth for-ests. In : Biodiversity in Managed Land-scape. R.C. Szaro and D.W. Johnston(eds) Oxford University Press, NewYork.
Thaman, R.R. 1993. Pacific Island urbanagroforestry. P.145 - 156. In : W.C. Clarkand R. R. Thaman (eds) Agroforestry inthe Pacific Islands : Systems for Sus-tainability. United Nations Press, NY.
The Conservation Fund. 2002. Green Infra-structure: A strategic Approach to GreenSpace Planning and conservation. TheConservation Fund. Washington DC.USA.
Vandermeer, J.H. (ed.) 2002. TropicalAgroecosystems. CRC Press, BocaRaton, FL. 268 p.
Watson, R.T.I.R. Noble, B. Bolin, An. H.Ravindranath, J.D. Verarda, and D.J.Dokken. 2000. Land-use, Land-useChange and Forestry, IPCC Special Re-port. Cambridge University Press, Cam-bridge, 388 pp.
Wijewardana, D. 1998. Criteria and indica-tors for sustainable forest management.ITTO Newsletter. Vol. 8, No. 3.
ASSESSMENT OF FLORISTIC COMPOSITIONAND CONSERVATION VALUE OF BRAHMAGIRIWILDLIFE SANCTUARY, KODAGU DISTRICT,
CENTRAL WESTERN GHAT
SATHISH, B. N.1, KUSHALAPPA, C. G.2, PUTTASWAMY, H.3,MANOJKUMAR TIPATI 4, CHANDRAHAS VERNEKAR 5
ABSTRACT
The present study was carried out in the Brahmagiri Wildlife Sanctuary, in Kodagudistrict, Central Western Ghats. The objective of the study was to assess the floristiccomposition within the smaller management units (compartments) of the sanctuaryand to identify biodiversity rich areas within the sanctuary for efficient conservation.From the study, it was found that, Compartment (CPT) - 9 (Irpu) ranked first in termsof its conservation values (5) followed by CPT - 14 (Theralu) with CPA value of sixconsidering its species richness, diversity, proportion of endemic and threatenedtree species. CPT 11 (KKR -1) is found to be the least conservation significance interms of CPA index (10).
IntroductionBrahmagiri Wildlife Sanctuary (BWS) is
one among the three wildlife sanctuaries inKodagu district. The Sanctuary is formed fromthe two reserves forests viz., Brahmagiri re-serve forest and Urty reserved forest and it isnamed after the highest peak in the sanctu-ary called as Brahmagiri. The total extent ofthe sanctuary is 181.26 sq. km shelteringclose to 10.00 per cent of the total forestedarea and 4.5 per cent of the total geographi-cal area of the district. This protected areaacts as a corridor between northern andsourthern parts of Western Ghats mainly forthe movement of Indian Elephants and Guars.It connects Rajiv Gandhi National Park (popu-larly known as Nagarahole National Park),
Bandipur National Park in the south andTalakavery Wildlife Sanctuary in the North-ern part of the district. The present study wascarried out to assess the floristic composi-tion in the smaller managements units (com-partments) of Srimangala Range, BrahmagiriWildlife Sanctuary with the financial supportfrom the Karnataka Forest Department.
Material and methodBrahmagiri Wildlife sanctuary is situated
in Kodagu district, Karnataka state. It lies inbetween North latitude 110 55` to 120 19` andeast longitude 750 44` to 760 04`. The terrainof the sanctuary is undulating with severalstep valleys and hillocks and the highest peakof the sanctuary is 1607 m. above mean sealevel (MSL).
MyForest, December, 2011Vol.47(4) Page Nos.285-289
1, 2, 3 College of Forestry, Ponnampet, Kodagu - 571 216.4 Deputy Conservator of Forests, Madikeri Wildife Division, Madikeri.5 Range Forest Officer, Srimangala Range (I/C), Madikeri Wildlife Division, Madikeri.
MyForest December 2011
286
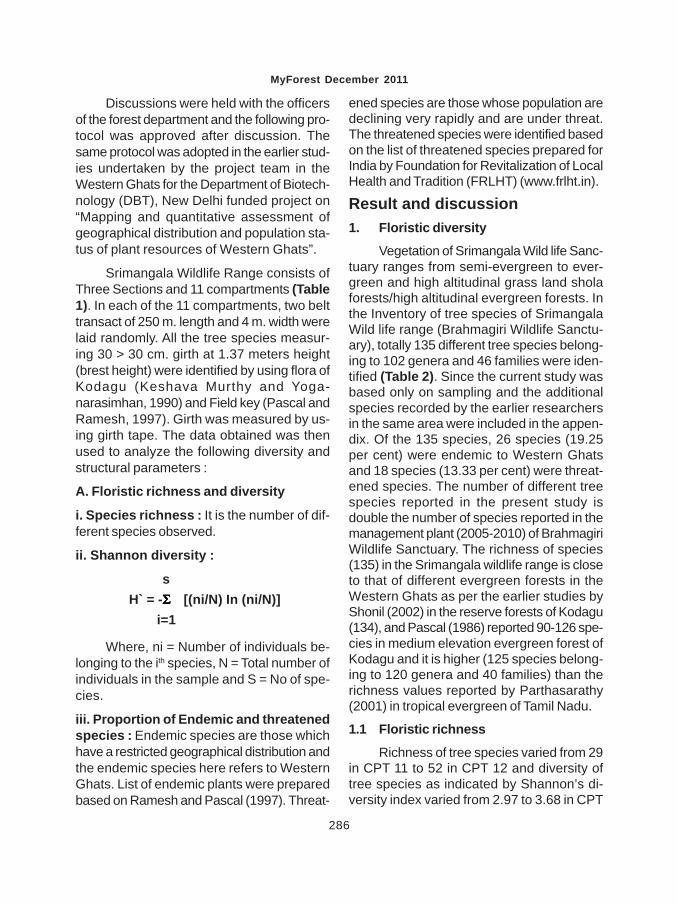
Discussions were held with the officersof the forest department and the following pro-tocol was approved after discussion. Thesame protocol was adopted in the earlier stud-ies undertaken by the project team in theWestern Ghats for the Department of Biotech-nology (DBT), New Delhi funded project on“Mapping and quantitative assessment ofgeographical distribution and population sta-tus of plant resources of Western Ghats”.
Srimangala Wildlife Range consists ofThree Sections and 11 compartments (Table1). In each of the 11 compartments, two belttransact of 250 m. length and 4 m. width werelaid randomly. All the tree species measur-ing 30 > 30 cm. girth at 1.37 meters height(brest height) were identified by using flora ofKodagu (Keshava Murthy and Yoga-narasimhan, 1990) and Field key (Pascal andRamesh, 1997). Girth was measured by us-ing girth tape. The data obtained was thenused to analyze the following diversity andstructural parameters :
A. Floristic richness and diversity
i. Species richness : It is the number of dif-ferent species observed.
ii. Shannon diversity :
Where, ni = Number of individuals be-longing to the ith species, N = Total number ofindividuals in the sample and S = No of spe-cies.
iii. Proportion of Endemic and threatenedspecies : Endemic species are those whichhave a restricted geographical distribution andthe endemic species here refers to WesternGhats. List of endemic plants were preparedbased on Ramesh and Pascal (1997). Threat-
ened species are those whose population aredeclining very rapidly and are under threat.The threatened species were identified basedon the list of threatened species prepared forIndia by Foundation for Revitalization of LocalHealth and Tradition (FRLHT) (www.frlht.in).
Result and discussion1. Floristic diversity
Vegetation of Srimangala Wild life Sanc-tuary ranges from semi-evergreen to ever-green and high altitudinal grass land sholaforests/high altitudinal evergreen forests. Inthe Inventory of tree species of SrimangalaWild life range (Brahmagiri Wildlife Sanctu-ary), totally 135 different tree species belong-ing to 102 genera and 46 families were iden-tified (Table 2). Since the current study wasbased only on sampling and the additionalspecies recorded by the earlier researchersin the same area were included in the appen-dix. Of the 135 species, 26 species (19.25per cent) were endemic to Western Ghatsand 18 species (13.33 per cent) were threat-ened species. The number of different treespecies reported in the present study isdouble the number of species reported in themanagement plant (2005-2010) of BrahmagiriWildlife Sanctuary. The richness of species(135) in the Srimangala wildlife range is closeto that of different evergreen forests in theWestern Ghats as per the earlier studies byShonil (2002) in the reserve forests of Kodagu(134), and Pascal (1986) reported 90-126 spe-cies in medium elevation evergreen forest ofKodagu and it is higher (125 species belong-ing to 120 genera and 40 families) than therichness values reported by Parthasarathy(2001) in tropical evergreen of Tamil Nadu.
1.1 Floristic richness
Richness of tree species varied from 29in CPT 11 to 52 in CPT 12 and diversity oftree species as indicated by Shannon’s di-versity index varied from 2.97 to 3.68 in CPT
H` = -ΣΣΣΣΣ [(ni/N) In (ni/N)]s
i=1
MyForest December 2011
287
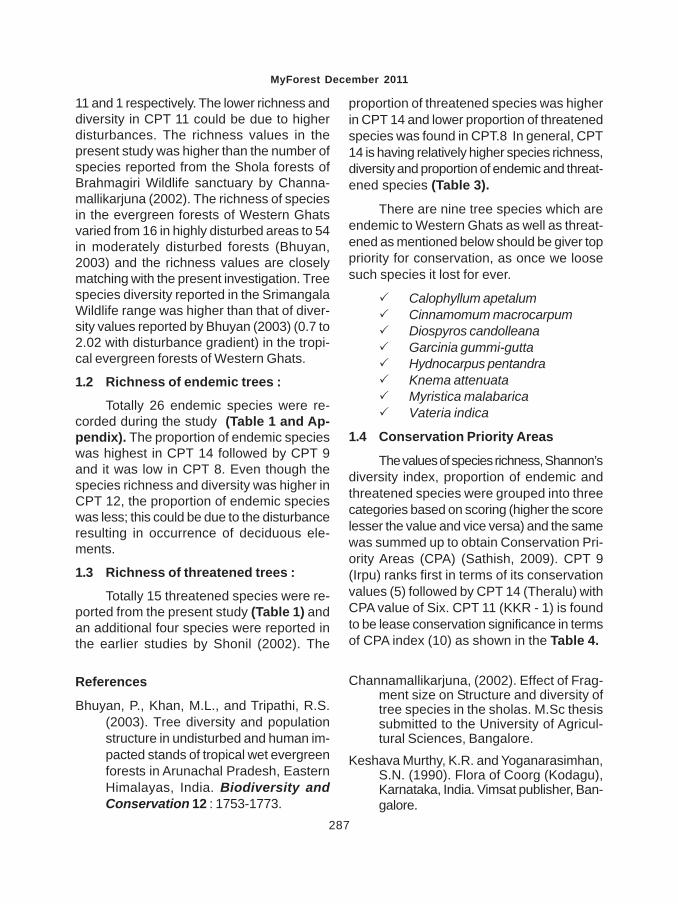
11 and 1 respectively. The lower richness anddiversity in CPT 11 could be due to higherdisturbances. The richness values in thepresent study was higher than the number ofspecies reported from the Shola forests ofBrahmagiri Wildlife sanctuary by Channa-mallikarjuna (2002). The richness of speciesin the evergreen forests of Western Ghatsvaried from 16 in highly disturbed areas to 54in moderately disturbed forests (Bhuyan,2003) and the richness values are closelymatching with the present investigation. Treespecies diversity reported in the SrimangalaWildlife range was higher than that of diver-sity values reported by Bhuyan (2003) (0.7 to2.02 with disturbance gradient) in the tropi-cal evergreen forests of Western Ghats.
1.2 Richness of endemic trees :
Totally 26 endemic species were re-corded during the study (Table 1 and Ap-pendix). The proportion of endemic specieswas highest in CPT 14 followed by CPT 9and it was low in CPT 8. Even though thespecies richness and diversity was higher inCPT 12, the proportion of endemic specieswas less; this could be due to the disturbanceresulting in occurrence of deciduous ele-ments.
1.3 Richness of threatened trees :
Totally 15 threatened species were re-ported from the present study (Table 1) andan additional four species were reported inthe earlier studies by Shonil (2002). The
proportion of threatened species was higherin CPT 14 and lower proportion of threatenedspecies was found in CPT.8 In general, CPT14 is having relatively higher species richness,diversity and proportion of endemic and threat-ened species (Table 3).
There are nine tree species which areendemic to Western Ghats as well as threat-ened as mentioned below should be giver toppriority for conservation, as once we loosesuch species it lost for ever.
Calophyllum apetalumCinnamomum macrocarpumDiospyros candolleanaGarcinia gummi-guttaHydnocarpus pentandraKnema attenuataMyristica malabaricaVateria indica
1.4 Conservation Priority Areas
The values of species richness, Shannon’sdiversity index, proportion of endemic andthreatened species were grouped into threecategories based on scoring (higher the scorelesser the value and vice versa) and the samewas summed up to obtain Conservation Pri-ority Areas (CPA) (Sathish, 2009). CPT 9(Irpu) ranks first in terms of its conservationvalues (5) followed by CPT 14 (Theralu) withCPA value of Six. CPT 11 (KKR - 1) is foundto be lease conservation significance in termsof CPA index (10) as shown in the Table 4.
References
Bhuyan, P., Khan, M.L., and Tripathi, R.S.(2003). Tree diversity and populationstructure in undisturbed and human im-pacted stands of tropical wet evergreenforests in Arunachal Pradesh, EasternHimalayas, India. Biodiversity andConservation 12 : 1753-1773.
Channamallikarjuna, (2002). Effect of Frag-ment size on Structure and diversity oftree species in the sholas. M.Sc thesissubmitted to the University of Agricul-tural Sciences, Bangalore.
Keshava Murthy, K.R. and Yoganarasimhan,S.N. (1990). Flora of Coorg (Kodagu),Karnataka, India. Vimsat publisher, Ban-galore.
MyForest December 2011
288
Parthasarathy N. (2001). Changes in forestcomposition and structure on three sitesof tropical evergreen forests aroundSengatheri, Western Ghats. CurrentScience. 80 (3) 389-393).
Pascal, J.P. (1986). Explanatory booklet onthe forest map of south India (sheets :Belgaum - Dharwad - Panji, Shimoga,Marceera - Mysore) Travaux de la SectionScientifique et Technique. Tome XX, In-stitute of Francais de Pondicherry. pp. 88.
Pascal, J.P. and Ramesh, B.R. (1987). A fieldguide to the trees and lianas of the ev-
ergreen forests of the Western Ghats.Institute of Francise, Pondicherry.
Sathish, B.N. (2009). Studies on Floristiccomposition, regeneration and biomassaccumulation in tropical evergreen for-ests in the Western Ghats of Karnataka,Ph D thesis submitted to the FRI Uni-versity, Dehradun.
Shonil Bhagwat, A., (2002). Biodiversity andconservation of cultural landscapes inthe Western Ghats of India, Ph.D. Thesis,University of Oxford, United Kingdom.
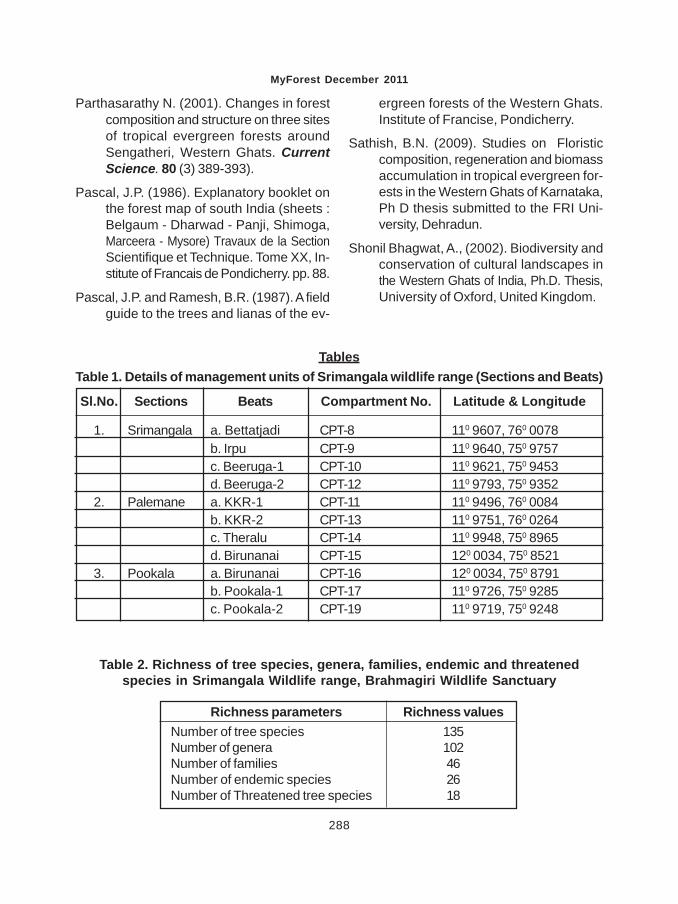
Sl.No. Sections Beats Compartment No. Latitude & Longitude
1. Srimangala a. Bettatjadi CPT-8 110 9607, 760 0078b. Irpu CPT-9 110 9640, 750 9757c. Beeruga-1 CPT-10 110 9621, 750 9453d. Beeruga-2 CPT-12 110 9793, 750 9352
2. Palemane a. KKR-1 CPT-11 110 9496, 760 0084b. KKR-2 CPT-13 110 9751, 760 0264c. Theralu CPT-14 110 9948, 750 8965d. Birunanai CPT-15 120 0034, 750 8521
3. Pookala a. Birunanai CPT-16 120 0034, 750 8791b. Pookala-1 CPT-17 110 9726, 750 9285c. Pookala-2 CPT-19 110 9719, 750 9248
TablesTable 1. Details of management units of Srimangala wildlife range (Sections and Beats)
Table 2. Richness of tree species, genera, families, endemic and threatenedspecies in Srimangala Wildlife range, Brahmagiri Wildlife Sanctuary
Richness parameters Richness valuesNumber of tree species 135Number of genera 102Number of families 46Number of endemic species 26Number of Threatened tree species 18
MyForest December 2011
289
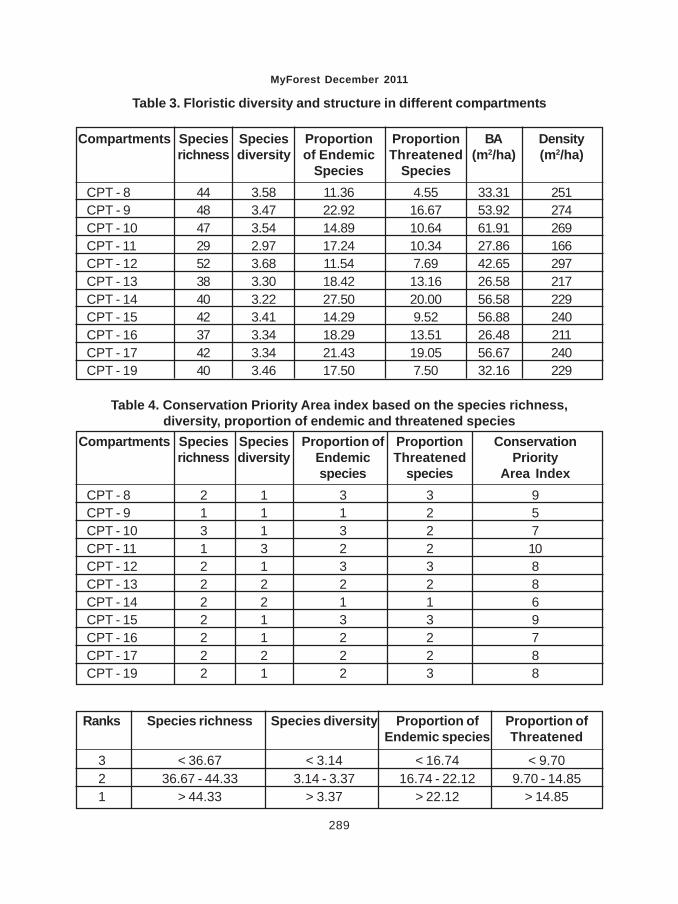
Table 3. Floristic diversity and structure in different compartments
Compartments Species Species Proportion Proportion BA Densityrichness diversity of Endemic Threatened (m2/ha) (m2/ha)
Species SpeciesCPT - 8 44 3.58 11.36 4.55 33.31 251CPT - 9 48 3.47 22.92 16.67 53.92 274CPT - 10 47 3.54 14.89 10.64 61.91 269CPT - 11 29 2.97 17.24 10.34 27.86 166CPT - 12 52 3.68 11.54 7.69 42.65 297CPT - 13 38 3.30 18.42 13.16 26.58 217CPT - 14 40 3.22 27.50 20.00 56.58 229CPT - 15 42 3.41 14.29 9.52 56.88 240CPT - 16 37 3.34 18.29 13.51 26.48 211CPT - 17 42 3.34 21.43 19.05 56.67 240CPT - 19 40 3.46 17.50 7.50 32.16 229
Table 4. Conservation Priority Area index based on the species richness,diversity, proportion of endemic and threatened species
Compartments Species Species Proportion of Proportion Conservationrichness diversity Endemic Threatened Priority
species species Area IndexCPT - 8 2 1 3 3 9CPT - 9 1 1 1 2 5CPT - 10 3 1 3 2 7CPT - 11 1 3 2 2 10CPT - 12 2 1 3 3 8CPT - 13 2 2 2 2 8CPT - 14 2 2 1 1 6CPT - 15 2 1 3 3 9CPT - 16 2 1 2 2 7CPT - 17 2 2 2 2 8CPT - 19 2 1 2 3 8
Ranks Species richness Species diversity Proportion of Proportion ofEndemic species Threatened
3 < 36.67 < 3.14 < 16.74 < 9.702 36.67 - 44.33 3.14 - 3.37 16.74 - 22.12 9.70 - 14.851 > 44.33 > 3.37 > 22.12 > 14.85
MY FORESTQuarterly Journal of Karnataka Forest Department
SUBSCRIBE TO MyForest
Please complete the following in block letters
Name :
Address :
Pin Code
Category & Subscription rates (Postage free)1. Offices and Institutions Rs. 200/- per year (4 issues)
2. Individuals Rs. 100/- per year (4 issues)
3. Postal Charges Extra
(Please add Rs. 20/- (Rupees Twenty only) in case of Outstation cheques).
Please fill in the details and send the cheque/draft in the name of THE EDITOR,MyForest, Silviculturist, Central Zone to be drawn at Bangalore and mail to :
The Editor, MyForest and Chief Conservator of Forests, Research,1st Cross, Arekere MICO Layout,
Doresanipalya Forest Campus, Bannerghatta Road, Bangalore - 560 076.Phone : 080-2658 7663
MY FORESTBook - Reviews
Attention : PUBLISHERS AND AUTHORS
Myforest requests publishers/authors to send 2 copies of the books related to for-estry and allied subjects for reviewing. The reviews will be published in the journal.
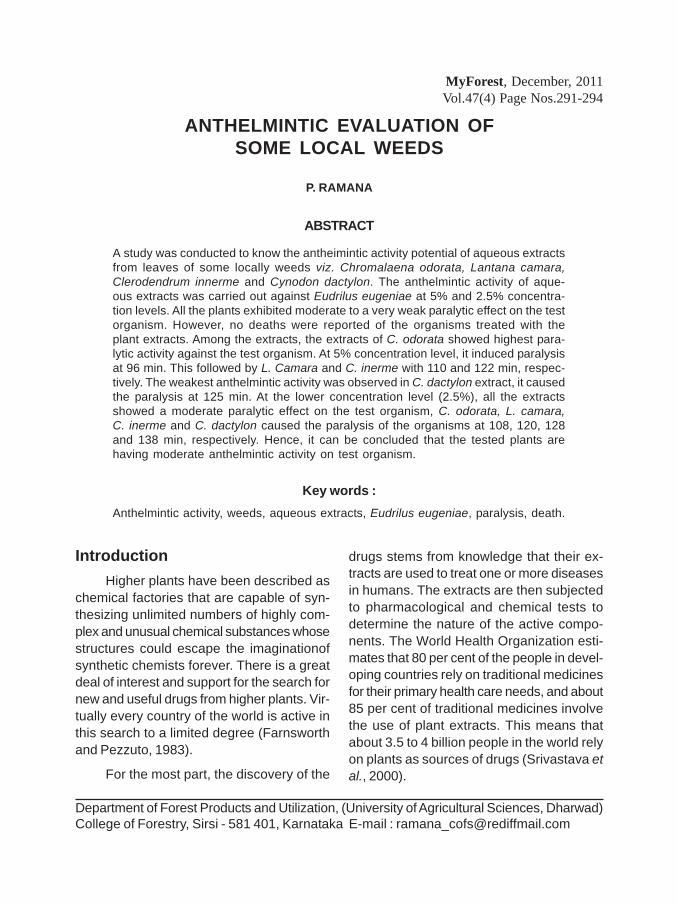
ANTHELMINTIC EVALUATION OFSOME LOCAL WEEDS
P. RAMANA
ABSTRACT
A study was conducted to know the antheimintic activity potential of aqueous extractsfrom leaves of some locally weeds viz. Chromalaena odorata, Lantana camara,Clerodendrum innerme and Cynodon dactylon. The anthelmintic activity of aque-ous extracts was carried out against Eudrilus eugeniae at 5% and 2.5% concentra-tion levels. All the plants exhibited moderate to a very weak paralytic effect on the testorganism. However, no deaths were reported of the organisms treated with theplant extracts. Among the extracts, the extracts of C. odorata showed highest para-lytic activity against the test organism. At 5% concentration level, it induced paralysisat 96 min. This followed by L. Camara and C. inerme with 110 and 122 min, respec-tively. The weakest anthelmintic activity was observed in C. dactylon extract, it causedthe paralysis at 125 min. At the lower concentration level (2.5%), all the extractsshowed a moderate paralytic effect on the test organism, C. odorata, L. camara,C. inerme and C. dactylon caused the paralysis of the organisms at 108, 120, 128and 138 min, respectively. Hence, it can be concluded that the tested plants arehaving moderate anthelmintic activity on test organism.
IntroductionHigher plants have been described as
chemical factories that are capable of syn-thesizing unlimited numbers of highly com-plex and unusual chemical substances whosestructures could escape the imaginationofsynthetic chemists forever. There is a greatdeal of interest and support for the search fornew and useful drugs from higher plants. Vir-tually every country of the world is active inthis search to a limited degree (Farnsworthand Pezzuto, 1983).
For the most part, the discovery of the
Key words :Anthelmintic activity, weeds, aqueous extracts, Eudrilus eugeniae, paralysis, death.
drugs stems from knowledge that their ex-tracts are used to treat one or more diseasesin humans. The extracts are then subjectedto pharmacological and chemical tests todetermine the nature of the active compo-nents. The World Health Organization esti-mates that 80 per cent of the people in devel-oping countries rely on traditional medicinesfor their primary health care needs, and about85 per cent of traditional medicines involvethe use of plant extracts. This means thatabout 3.5 to 4 billion people in the world relyon plants as sources of drugs (Srivastava etal., 2000).
MyForest, December, 2011Vol.47(4) Page Nos.291-294
Department of Forest Products and Utilization, (University of Agricultural Sciences, Dharwad)College of Forestry, Sirsi - 581 401, Karnataka E-mail : [email protected]
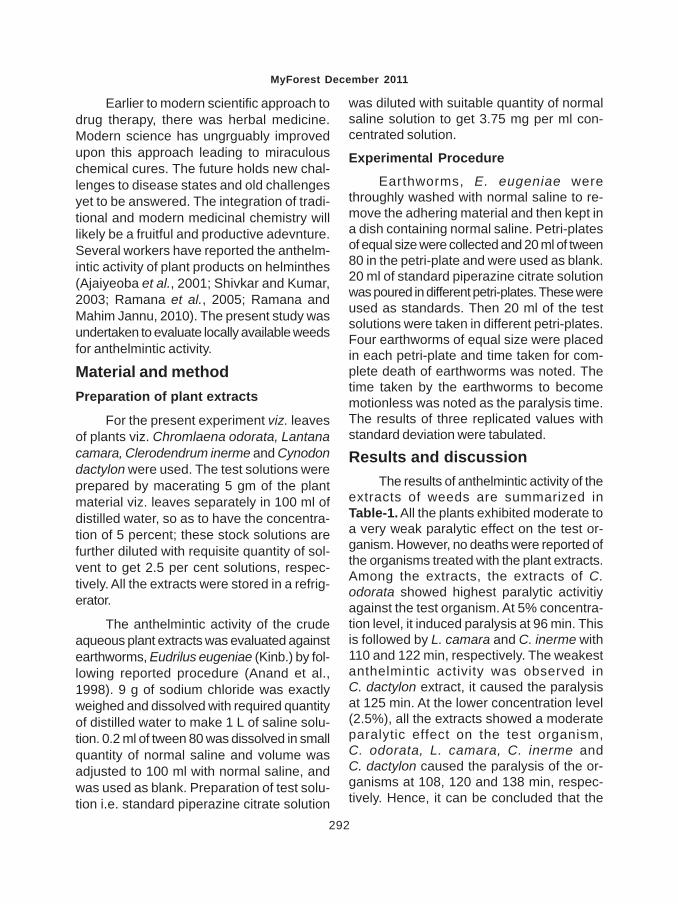
MyForest December 2011
292
Earlier to modern scientific approach todrug therapy, there was herbal medicine.Modern science has ungrguably improvedupon this approach leading to miraculouschemical cures. The future holds new chal-lenges to disease states and old challengesyet to be answered. The integration of tradi-tional and modern medicinal chemistry willlikely be a fruitful and productive adevnture.Several workers have reported the anthelm-intic activity of plant products on helminthes(Ajaiyeoba et al., 2001; Shivkar and Kumar,2003; Ramana et al., 2005; Ramana andMahim Jannu, 2010). The present study wasundertaken to evaluate locally available weedsfor anthelmintic activity.
Material and methodPreparation of plant extracts
For the present experiment viz. leavesof plants viz. Chromlaena odorata, Lantanacamara, Clerodendrum inerme and Cynodondactylon were used. The test solutions wereprepared by macerating 5 gm of the plantmaterial viz. leaves separately in 100 ml ofdistilled water, so as to have the concentra-tion of 5 percent; these stock solutions arefurther diluted with requisite quantity of sol-vent to get 2.5 per cent solutions, respec-tively. All the extracts were stored in a refrig-erator.
The anthelmintic activity of the crudeaqueous plant extracts was evaluated againstearthworms, Eudrilus eugeniae (Kinb.) by fol-lowing reported procedure (Anand et al.,1998). 9 g of sodium chloride was exactlyweighed and dissolved with required quantityof distilled water to make 1 L of saline solu-tion. 0.2 ml of tween 80 was dissolved in smallquantity of normal saline and volume wasadjusted to 100 ml with normal saline, andwas used as blank. Preparation of test solu-tion i.e. standard piperazine citrate solution
was diluted with suitable quantity of normalsaline solution to get 3.75 mg per ml con-centrated solution.
Experimental Procedure
Earthworms, E. eugeniae werethroughly washed with normal saline to re-move the adhering material and then kept ina dish containing normal saline. Petri-platesof equal size were collected and 20 ml of tween80 in the petri-plate and were used as blank.20 ml of standard piperazine citrate solutionwas poured in different petri-plates. These wereused as standards. Then 20 ml of the testsolutions were taken in different petri-plates.Four earthworms of equal size were placedin each petri-plate and time taken for com-plete death of earthworms was noted. Thetime taken by the earthworms to becomemotionless was noted as the paralysis time.The results of three replicated values withstandard deviation were tabulated.
Results and discussionThe results of anthelmintic activity of the
extracts of weeds are summarized inTable-1. All the plants exhibited moderate toa very weak paralytic effect on the test or-ganism. However, no deaths were reported ofthe organisms treated with the plant extracts.Among the extracts, the extracts of C.odorata showed highest paralytic activitiyagainst the test organism. At 5% concentra-tion level, it induced paralysis at 96 min. Thisis followed by L. camara and C. inerme with110 and 122 min, respectively. The weakestanthelmintic activity was observed inC. dactylon extract, it caused the paralysisat 125 min. At the lower concentration level(2.5%), all the extracts showed a moderateparalytic effect on the test organism,C. odorata, L. camara, C. inerme andC. dactylon caused the paralysis of the or-ganisms at 108, 120 and 138 min, respec-tively. Hence, it can be concluded that the
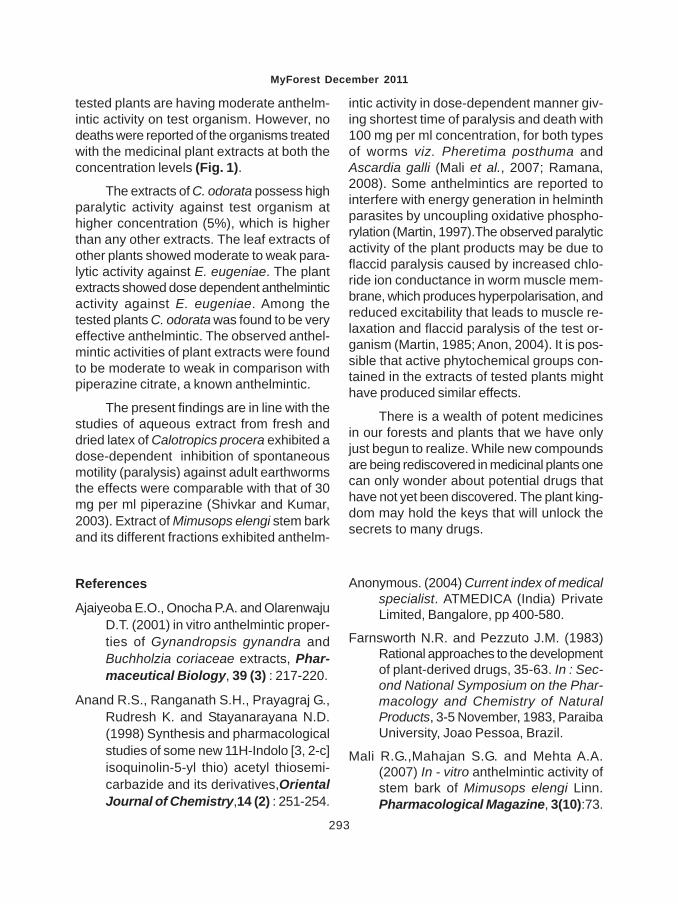
MyForest December 2011
293
tested plants are having moderate anthelm-intic activity on test organism. However, nodeaths were reported of the organisms treatedwith the medicinal plant extracts at both theconcentration levels (Fig. 1).
The extracts of C. odorata possess highparalytic activity against test organism athigher concentration (5%), which is higherthan any other extracts. The leaf extracts ofother plants showed moderate to weak para-lytic activity against E. eugeniae. The plantextracts showed dose dependent anthelminticactivity against E. eugeniae. Among thetested plants C. odorata was found to be veryeffective anthelmintic. The observed anthel-mintic activities of plant extracts were foundto be moderate to weak in comparison withpiperazine citrate, a known anthelmintic.
The present findings are in line with thestudies of aqueous extract from fresh anddried latex of Calotropics procera exhibited adose-dependent inhibition of spontaneousmotility (paralysis) against adult earthwormsthe effects were comparable with that of 30mg per ml piperazine (Shivkar and Kumar,2003). Extract of Mimusops elengi stem barkand its different fractions exhibited anthelm-
intic activity in dose-dependent manner giv-ing shortest time of paralysis and death with100 mg per ml concentration, for both typesof worms viz. Pheretima posthuma andAscardia galli (Mali et al., 2007; Ramana,2008). Some anthelmintics are reported tointerfere with energy generation in helminthparasites by uncoupling oxidative phospho-rylation (Martin, 1997).The observed paralyticactivity of the plant products may be due toflaccid paralysis caused by increased chlo-ride ion conductance in worm muscle mem-brane, which produces hyperpolarisation, andreduced excitability that leads to muscle re-laxation and flaccid paralysis of the test or-ganism (Martin, 1985; Anon, 2004). It is pos-sible that active phytochemical groups con-tained in the extracts of tested plants mighthave produced similar effects.
There is a wealth of potent medicinesin our forests and plants that we have onlyjust begun to realize. While new compoundsare being rediscovered in medicinal plants onecan only wonder about potential drugs thathave not yet been discovered. The plant king-dom may hold the keys that will unlock thesecrets to many drugs.
References
Ajaiyeoba E.O., Onocha P.A. and OlarenwajuD.T. (2001) in vitro anthelmintic proper-ties of Gynandropsis gynandra andBuchholzia coriaceae extracts, Phar-maceutical Biology, 39 (3) : 217-220.
Anand R.S., Ranganath S.H., Prayagraj G.,Rudresh K. and Stayanarayana N.D.(1998) Synthesis and pharmacologicalstudies of some new 11H-Indolo [3, 2-c]isoquinolin-5-yl thio) acetyl thiosemi-carbazide and its derivatives,OrientalJournal of Chemistry,14 (2) : 251-254.
Anonymous. (2004) Current index of medicalspecialist. ATMEDICA (India) PrivateLimited, Bangalore, pp 400-580.
Farnsworth N.R. and Pezzuto J.M. (1983)Rational approaches to the developmentof plant-derived drugs, 35-63. In : Sec-ond National Symposium on the Phar-macology and Chemistry of NaturalProducts, 3-5 November, 1983, ParaibaUniversity, Joao Pessoa, Brazil.
Mali R.G.,Mahajan S.G. and Mehta A.A.(2007) In - vitro anthelmintic activity ofstem bark of Mimusops elengi Linn.Pharmacological Magazine, 3(10):73.
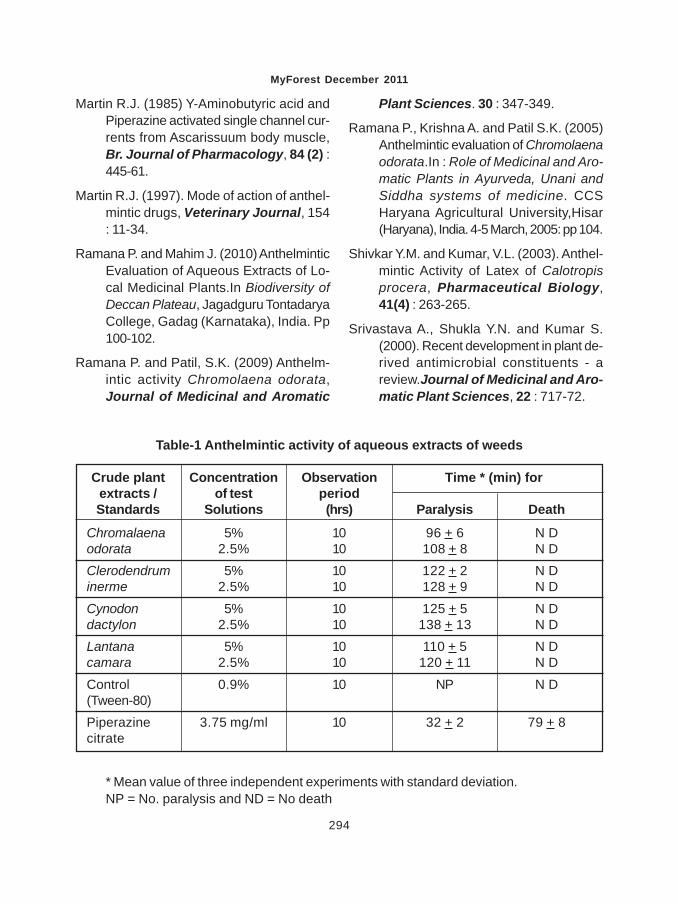
MyForest December 2011
294
Martin R.J. (1985) Y-Aminobutyric acid andPiperazine activated single channel cur-rents from Ascarissuum body muscle,Br. Journal of Pharmacology, 84 (2) :445-61.
Martin R.J. (1997). Mode of action of anthel-mintic drugs, Veterinary Journal, 154: 11-34.
Ramana P. and Mahim J. (2010) AnthelminticEvaluation of Aqueous Extracts of Lo-cal Medicinal Plants.In Biodiversity ofDeccan Plateau, Jagadguru TontadaryaCollege, Gadag (Karnataka), India. Pp100-102.
Ramana P. and Patil, S.K. (2009) Anthelm-intic activity Chromolaena odorata,Journal of Medicinal and Aromatic
Plant Sciences. 30 : 347-349.
Ramana P., Krishna A. and Patil S.K. (2005)Anthelmintic evaluation of Chromolaenaodorata.In : Role of Medicinal and Aro-matic Plants in Ayurveda, Unani andSiddha systems of medicine. CCSHaryana Agricultural University,Hisar(Haryana), India. 4-5 March, 2005: pp 104.
Shivkar Y.M. and Kumar, V.L. (2003). Anthel-mintic Activity of Latex of Calotropisprocera, Pharmaceutical Biology,41(4) : 263-265.
Srivastava A., Shukla Y.N. and Kumar S.(2000). Recent development in plant de-rived antimicrobial constituents - areview.Journal of Medicinal and Aro-matic Plant Sciences, 22 : 717-72.
Table-1 Anthelmintic activity of aqueous extracts of weeds
Crude plant Concentration Observation Time * (min) forextracts / of test periodStandards Solutions (hrs) Paralysis Death
Chromalaena 5% 10 96 + 6 N Dodorata 2.5% 10 108 + 8 N DClerodendrum 5% 10 122 + 2 N Dinerme 2.5% 10 128 + 9 N DCynodon 5% 10 125 + 5 N Ddactylon 2.5% 10 138 + 13 N DLantana 5% 10 110 + 5 N Dcamara 2.5% 10 120 + 11 N DControl 0.9% 10 NP N D(Tween-80)Piperazine 3.75 mg/ml 10 32 + 2 79 + 8citrate
* Mean value of three independent experiments with standard deviation.NP = No. paralysis and ND = No death
PLANTS USED FOR ORAL CARE IN SIRSI REGION OFUTTARA KANNADA DISTRICT OF KARNATAKA
P. RAMANA, RENUKA NAYAK AND AFRINNAZ SUNTI
ABSTRACT
Plants have been used in traditional medicine for several thousand years. Theknowledge of medicinal plants has been accumulated in the course of many centu-ries based on different medicinal systems. The knowledge of these plants is un-documented and transmitted through an ‘oral’ tradition. Around 1800 species aresystematically documented in the codified Indian System of Medicine Documenta-tion of existing resources in and around our place is the need of the day. This paperenlists plants used for oral care in Sirsi region off Uttara Kannada district, Karnataka.A field survey was carried our during 2009. Based on the feed back from the people,traditional healers and women are accorded a significant role in discussions sincethey possess more cognizances about the utility of local herbs. Data pertaining to64 species belonging to 38 families are useful in the treatment were recorded alongwith their vernacular names, plant parts used and medicinal uses. Among the plantparts used leaves accounts for the major share (31.32%) followed by fruits (19.27%),seeds (12.04%), roots (8.45%), bark and twigs (7.22%) each, tuber (3.61%), bulb,buds and stem (2.40%) each, wood essence, gum with 1.20 per cent each, respec-tively. Among the plants, herbs account for the major share (37.50%) followed bytrees (31.25%), shrubs (21.87%), creepers and grass with 4.60 per cent each,respectively. The reported plants are used to cure bad smell, teeth problem, toothache, for gargle, as mouth wash, yellowing of teeth, tooth brush, gum pain and otherpurposes.
IntroductionMaintainance of the oral hygeine dates
back to ancient civilization. The developmentof toothpaste began as long as 300-500 B.C.in China and India. Most of the people livingin urban or suburban areas use toothpastes,massage gels and mouth rinses which con-tain synthetic substances. However, still vil-lage people use the plant or plant parts likeseed/fruits, leaves, stem, bark and gum astooth brush, oral gargle and mouth washes
Key words :
Plants, traditional knowledge, oral care, Sirsi region.
for oral hygiene.
Plants have been used in traditionalmedicine for several thousand years (AbuRabia, 2005). The knowledge of medicinalplants has been accumulated in the courseof many centuries based on different medici-nal systems such as Ayurveda, Unani andSiddha. In India, it is reported that traditionalhealers use 2500 plant species and 100 spe-cies of plants serve as regular sources ofmedicine. During the last few decades therehas been an increasing interest in the study
MyForest, December, 2011Vol.47(4) Page Nos.295-301
Department of Forest Products and Utilization, (University of Agricultural Sciences, Dharwad)College of Forestry, Sirsi - 581 401, Karnataka E-mail : [email protected]
MyForest December 2011
296
of medicinal plants and their traditional usein different parts of the world (Lev, 2006;Gazzaneo et al., 2005; Al-Qura’n, 2005;Hanazaki et al., 2000; Rossato et al., 1999).Documenting the indigenous knowledgethrough ethnobotanical studies is importantfor the conservation and utilization of biologi-cal resources.
Today, according to the World HealthOrganization (WHO), as many as 80% of theworld’s people depend on traditional medicinefor their primary healthcare needs. (Azaizehet al., 2003). Due to less communicationmeans, poverty, ignorance and unavailabilityof modern health facilities, most people es-pecially rural people are still forced to prac-tice traditional medicines for their commonday ailments. Most of these people form thepoorest link in the trade of medicinal plants(Khan, 2002). A vast knowledge of how to usethe plants against different illnesses may beexpected to have accumulated in areas wherethe use of plants is still of great importance(Diallo et al., 1999).
In the developed countries, 25 per centof the medical drugs are based on plants andtheir derivatives (Principle, 1991). Ethno-botany is not new to India because of its richethnic diversity. During the last few decadesthere has been an increasing interest in thestudy of medicinal plants and their traditionaluse in different parts of India and there aremany reports on the use of plants in tradi-tional healing by either tribal people or indig-enous communities of India. Apart from thetribal groups, many other forest dwellers andrural people also possess unique knowledgeabout plants. Traditional knowledge of me-dicinal plants and their use by indigenouscultures are not only useful for conservationof cultural traditions and biodiversity but alsofor community healthcare and drug develop-ment in the present and future. The objectiveof this study was to interact with local tradi-tional healers and others and to document
their knowledge on plants used for oral carein Sirsi region.
Material and methodStudy Area
Uttara Kannada district is unique andrich biogeographic region in the Central West-ern Ghat region of Karnataka, holding multi-farious endemic floral and faunal wealth. Drydeciduous, moist deciduous, semi-evergreenand evergreen forests primarily represent thevegetation of the study area. The climate isprimarily monsoonal and receives Southwestmonsoon rains during June to September. Theregion receives an annual rainfall of 1900-2200mm. The relative humidity is highest exceed-ing 90 per cent during July-August and it isas low as 40 per cent in March-April.
Sirsi town in the Uttara Kannada dis-trict in the Indian state of Karnataka is lo-cated between 140 37` 0 N latitude and 740
50` E longitude. It is a mountain town with apopulation of around 65,000 people. The townis surrounded by lush green rest and the re-gion is popular for a large number of water-falls. Hubli is the nearest large city, and themain businesses around the town are mostlysubsistence and agriculture based. Adike(Supari) (Areca nut) or (Betel nut) is the pri-mary crop grown in the villages that surroundthe town, making it one of the major tradingcentres for Arecanut. The nuts grown hereare transported all over India, and also ex-ported abroad. The region is also popular formany other spices like cardamom, pepper,betel leaves and vanilla. The major food cropis paddy and rice is the staple food of thepeople.
The data presented in this paper is theoutcome of intensive studies conducted dur-ing 2009 among the local traditional medi-cine practioner’s and locals in Sirsi region.During the course of exploration ofethnomedicinal plants of the region, the in-
MyForest December 2011
297
formations have been gathered from the heal-ers found near forest areas where the peopledepend mostly on forests for their need andhave sound knowledge of herbal remedies.Local herbal informants were selected andinterviewed extensively. Interactions weremade with local traditional healers to docu-ment their knowledge on medicinal plants,their usage and the types of diseases treatedetc. The traditional healing systems are stillpopular here. Data on the herbal medicinesalong with their application were gathered fromexperienced and knowledgeable medical menand women.
Results and discussionAn analysis of data in the present com-
munication reveals the uses of 64 speciesbelonging to 38 families for oral care. The datapertaining to their vernacular names, plantparts used and medicinal uses were docu-mented (Table-1). Among the plant partsused leaves accounts for the major share(31.32%) followed by fruits (19.27%), seeds(12.04%), roots (8.45%), bark and twigs(7.22%) each, tuber (3.61%), bulb, buds andstem (2.40%) each, wood, essence, gum with1.20 per cent each, respectively. Among theplants, herbs account for the major share(37.50%) followed by trees (31.25%), shrubs(21.87%), creepers and grass with 4.60 percent each, respectively. The reported polantsare used to cure bad smell, teeth problem,tooth ache, as mouth wash, yellowing ofteeth, tooth brush, gum pain and other pur-poses. The reported data were compared withthose gathered in other studies carried out inUttara Kannada earlier (Thaku Sukru Gouda,1997). The reported plants are known to pos-sess similar medicinal uses as reported byseveral workers (Martin, 1995; Singh andZaheer Anvar Ali, 1996; Sashikumar andJanardhanan, 2002; Hebbar et al., 2004;Ganesan, 2008).
Majority of the persons interviewed de-pended on cheap sources as they could not
afford to the costly modern health care sys-tem. In this study we observed that womenhave more knowledge on herbs and its us-age than men as they use medicinal plantsmore frequently. In the local culture, womenare more attached than men to traditionalknowledge. Also, the relative easiness oftransmission of ethnobotanical informationbetween women may explain the role retainedby women in the traditional therapeutic sys-tem. Generally, medicinal plants and herbalpreparations were freely available without anyphysician’s prescriptions. However, majorityof informants in this study were illiterate.
The present-day traditional healers arevery old. Due to lack of interest among theyounger generation as well as their tendencyto migrate to cities for lucrative jobs, wealthof knowledge in this the area is declining. Sofar no systematic ethnobotanical survey hasbeen made in this area and this is the firstreport on the medicinal plants used by thelocal traditional healers for oral care.
ConclusionsThe present study reveals that around
64 species belonging to 38 families are use-ful for ora/dental care and it revealed that thereis a wide usage of oral care plants by localsfor curing various diseases. The informationcollected about the usage cannot be claimedto be fully reliable. Plants commonly used intraditional medicine are assumed to be safe.This safety is based on their long usage inthe treatment of diseases according to knowl-edge accumulated over centuries. There is aneed to conduct scientific studies to validatethe traditional claims. Some of the listedplants are already being used in manufactur-ing several oral hygiene products.
AcknowledgmentThe authors extend their sincere thanks
to the people who revealed their knowledgeon medicinal herbs used in oral care.
MyForest December 2011
298
References
Abu-Rabia A. (2005) Urinary diseases andethnobotany among pastoral nomads inthe Middle East, Journal of Ethnobi-ology and Ethnomedicine, 1:4
Al-Quran’s S. (2005) Ethnobotanical surveyof folk toxic plants in southern part ofJordan, Toxicon, 46:119-126.
Anonymous (2003) The treasure house of me-dicinal plants, Amruth, 7(3) : 2
Azaizeh H., Fulder S., Khalil K. and Said O(2003) Ethnomedicinal knowledge of lo-cal Arab practitioners in the Middle EastRegion, Fitoterapia, 74:98-108.
Diallo D., Hveem B., Mahmoud M.A., BergeG., Paulsen B.S. and Maiga A. (1999)An ethnobotanical survey of herbaldrugs of Gouma district, Mali, Pharma-ceutical Biology, 37:80-91.
Ganesan S. (2008) Traditional oral care me-dicinal plants survey of Tamil Nadu,Natural Products Readiance, 7(2):166-172.
Gazzaneo L.R., Paiva de Lucena R.F. andPaulino de Albuquerque U. (2005)Knowledge and use of medicinal plantsby local specialists in an region of At-lantic Forest in the state of Pernambuco(Northeastern Brazil), Journal ofEthnobiology and Ethnomedicine, 1:9.
Hanazaki N., Tamashiro J.Y., Leitao-Filho H.and Gegossi A. (2000) Diversity of plantuses in two Caicaras communities fromthe Atlantic forest coast, Brazil,Biodiversity and Conservation, 9:597615.
Hebbar S.S., Harsha V.H., Shripathi V. andHegde G.R. (2004). Ethnomedicine ofDharwad District in Karnataka, Indiaplants used in oral health care, Journalof Ethnopharmacology, 94(2/3): 261-266.
Khan A.U (2002) History of decline and presentstatus of natural tropical thorn forest inPunjab, Pakistan Biological Conser-vation, 63:210-250.
Lev E. (2006) Ethno-diversity within currentethno-pharmacology as part of israeli tra-ditional medicine - A review, Journal ofEthnobiology and ethnomedicine, 2:4
Martin G.J. (1995) Ethnobotany : A MethodsManual. Chapman and Hall, London.Principe P. (1991) Monetising the phar-macological benefits of plants. US En-vironmental protection Agency, Wash-ington, D.C.; 1991.
Rossato S.C., Leitao-Filho H. and GegossiA. (1999) Ethnobotany of Caicaras of theAtlantic forest coast (Brazil), Economicbotany, 53:387-395.
Sashikumar J.M. and janardhanan K. (2002)Ethnomedicinal plants for Womenfolk’sHealth care in Nilgiri Biosphere Reserve,Western Ghats, Indian Journal of For-estry, 9(3/4): 138-143.
Singh V.K. and Zaheer Anvar Ali. (1996) Folkmedicinal plants used for family plan-ning in India. In Ethnobiology in HumanWelfare, Ed. S.K. Jain. Deep Publica-tions, New Delhi, P. 184-186.
Thaku Sukru Gouda (1997) KarnatakaOushadi Sasyagala Parampare - 1.Uttara Kannadadha Halakki Okkaligaru,INCERT, Bangalore.
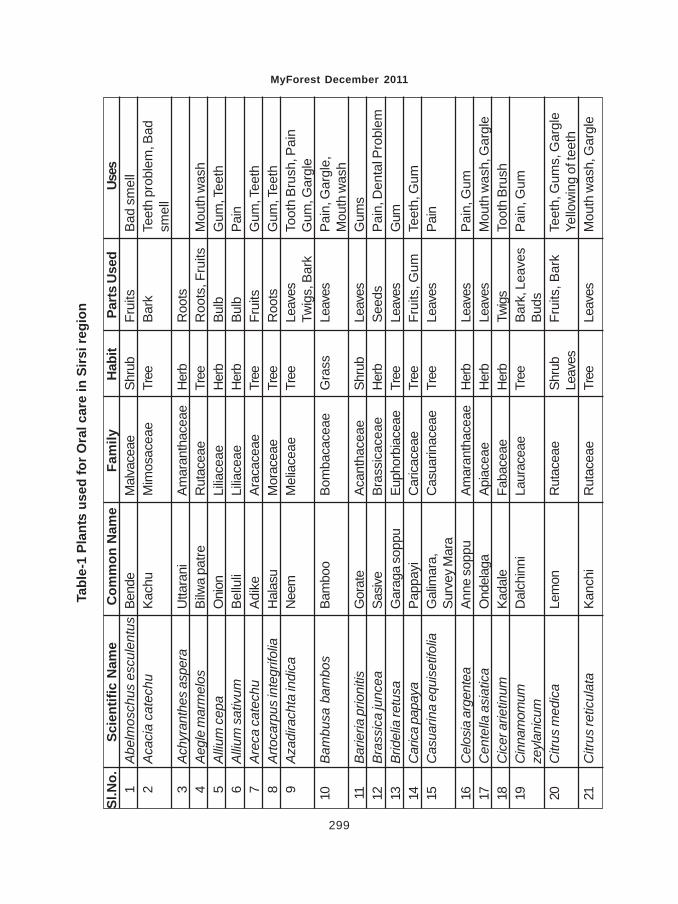
MyForest December 2011
299
Tabl
e-1
Plan
ts u
sed
for O
ral c
are
in S
irsi r
egio
n
Sl.N
o.Sc
ient
ific
Nam
eC
omm
on N
ame
Fam
ilyH
abit
Part
s U
sed
Uses
1A
belm
osch
us e
scul
entu
sBe
nde
Mal
vace
aeSh
rub
Frui
tsBa
d sm
ell
2A
caci
a ca
tech
uKa
chu
Mim
osac
eae
Tree
Bark
Teet
h pr
oble
m, B
adsm
ell
3Ac
hyra
nthe
s as
pera
Utta
rani
Amar
anth
acea
eH
erb
Roo
ts4
Aegl
e m
arm
elos
Bilw
a pa
treR
utac
eae
Tree
Roo
ts, F
ruits
Mou
th w
ash
5A
llium
cep
aO
nion
Lilia
ceae
Her
bBu
lbG
um, T
eeth
6A
llium
sat
ivum
Bellu
liLi
liace
aeH
erb
Bulb
Pain
7A
reca
cat
echu
Adik
eAr
acac
eae
Tree
Frui
tsG
um, T
eeth
8Ar
toca
rpus
inte
grifo
liaH
alas
uM
orac
eae
Tree
Roo
tsG
um, T
eeth
9A
zadi
rach
ta in
dica
Nee
mM
elia
ceae
Tree
Leav
esTo
oth
Brus
h, P
ain
Twig
s, B
ark
Gum
, Gar
gle
10B
ambu
sa b
ambo
sBa
mbo
oBo
mba
cace
aeG
rass
Leav
esPa
in, G
argl
e,M
outh
was
h11
Barie
ria p
rioni
tisG
orat
eAc
anth
acea
eSh
rub
Leav
esG
ums
12B
rass
ica
junc
eaSa
sive
Bras
sica
ceae
Her
bSe
eds
Pain
, Den
tal P
robl
em13
Brid
elia
retu
saG
arag
a so
ppu
Euph
orbi
acea
eTr
eeLe
aves
Gum
14C
aric
a pa
paya
Papp
ayi
Car
icac
eae
Tree
Frui
ts, G
umTe
eth,
Gum
15C
asua
rina
equi
setif
olia
Gal
imar
a,C
asua
rinac
eae
Tree
Leav
esPa
inSu
rvey
Mar
a16
Cel
osia
arg
ente
aAn
ne s
oppu
Amar
anth
acea
eH
erb
Leav
esP
ain,
Gum
17C
ente
lla a
siat
ica
Ond
elag
aAp
iace
aeH
erb
Leav
esM
outh
was
h, G
argl
e18
Cic
er a
rietin
umKa
dale
Faba
ceae
Her
bTw
igs
Toot
h Br
ush
19C
inna
mom
umD
alch
inni
Laur
acea
eTr
eeBa
rk, L
eave
sP
ain,
Gum
zeyl
anic
umBu
ds20
Citr
us m
edic
aLe
mon
Rut
acea
eSh
rub
Frui
ts, B
ark
Teet
h, G
ums,
Gar
gle
Leav
esYe
llow
ing
of te
eth
21C
itrus
retic
ulat
aKa
nchi
Rut
acea
eTr
eeLe
aves
Mou
th w
ash,
Gar
gle

MyForest December 2011
300
22C
oleu
s am
boin
icus
Dod
da P
atre
Lam
iace
aeH
erb
Leav
esB
ad s
mel
l23
Cor
iand
rum
sat
ivum
Cor
iand
erAp
iace
aeH
erb
Leav
es, R
oot
Gar
gle,
Bad
sm
ell
24C
ross
andr
aAb
bali
Acan
thac
eae
Shru
bFl
ower
Pain
infu
ndib
ulifo
rmis
25C
umin
um c
ymin
umJe
era
Apia
ceae
Her
bSe
eds
Teet
h, G
um, P
ain
26C
urcu
ma
long
aTe
rmer
icZi
ngib
erac
eae
Her
bTu
ber
Pain
27D
atur
a M
etel
Dat
ura
Sola
nace
aeSh
rub
Seed
sPa
in28
Dau
cus
caro
taG
ajja
riAp
iace
aeH
erb
Tube
rP
ain,
Gum
, Tee
th29
Ele
phan
topu
s sc
aber
Hak
karik
eAs
tera
ceae
Her
bLe
aves
Gum
, Tee
th30
Eleu
sine
cor
acan
aR
agi
Poac
eae
Gra
ssG
rain
sPa
in31
Euc
alyp
tus
glob
ulus
Nilg
iriM
yrta
ceae
Tree
Leav
es, R
oot
Pain
, Gar
gle
Oils
32Fe
rula
foet
ida
Ingu
Apia
ceae
Her
bLa
tex
Pain
33H
ibis
cus
rosa
- si
nens
isD
asav
ala
Mal
vace
aeSh
rub
Flow
erG
um, T
eeth
34Ja
smin
um o
ffici
nale
Jaji m
allig
eO
leac
eae
Shru
bLe
aves
Pain
Flow
ers
35Ja
troph
a cu
rcas
Erad
deEu
phor
i bia
ceae
Shru
bTw
igs
Toot
h Br
ush,
Den
tal
Prob
lem
s, G
ums
36La
wso
nia
iner
mis
Men
diLy
thra
ceae
Shru
bLe
aves
Pain
, Gar
gle,
Mou
thw
ash
37Li
num
usi
tatis
sim
umAg
ase
Sopp
uLi
nace
aeH
erb
Leav
esG
um, T
eeth
38Ly
cope
rsic
on e
scul
entu
mTo
mat
oSo
lana
ceae
Her
bFr
uits
Gum
, Gar
gle
39M
alus
pum
ilaAp
ple
Ros
acea
eTr
eeFr
uits
Gum
, Tee
th40
Man
gife
ra In
dica
Mav
uAn
acar
diac
eae
Tree
Twig
sTo
oth
Brus
h41
Men
tha
arve
nsis
Pudi
naLa
mia
ceae
Her
bLe
aves
, Tw
igs
Bad
sm
ell,
Bru
sh42
Mus
a pa
radi
siac
aBa
nana
Mus
acea
eSh
rub
Frui
ts, S
tem
Gum
, Tou
nge
43M
yris
tica
fragr
ans
Jyik
ayi
Myr
istic
acea
eTr
eeFr
uits
, See
dsB
ad s
mel
l44
Nic
otia
na ta
bacu
mTa
mba
kuSo
lana
ceae
Her
bLe
aves
Toot
h ac
he, s
mel
l45
Oci
mum
bas
ilicum
Kam
akas
turi
Lam
iace
aeH
erb
Seed
sG
um

MyForest December 2011
301
46O
cim
um s
anct
umTu
lsi
Lam
mia
ceae
Her
bLe
aves
,Tw
igs,
Toot
h br
ush,
Den
tal
Seed
sPr
oble
ms,
Gum
s47
Pipe
r nig
rum
Kala
Men
asu
Pipe
race
aeC
reep
erSe
eds
Pain
48P
iper
bet
lePa
nPi
pera
ceae
Cre
eper
Leav
esTe
eth,
Gum
, Bad
sm
ell
49Po
rtula
ca o
lera
cea
Dod
dago
niPo
rtula
cace
aeH
erb
Leav
esG
um50
Psid
ium
gua
vaPe
ruM
yrta
ceae
Shru
bLe
aves
Pain
, Gan
gle,
Mou
thFr
uits
Was
h51
Puni
ca g
rana
tum
Dal
imbe
,Pu
nica
ceae
Shru
bFr
uits
Gar
gle,
Bad
sm
ell
Leav
es52
Sacc
haru
m o
ffici
naru
mKa
bbu
Poac
eae
Gra
ssSt
emG
um, T
eeth
53S
anta
lum
alb
umSa
ndal
Sant
alac
eae
Tree
Woo
dP
ain,
teet
h, G
umLe
aves
, Bar
kM
outh
was
h54
Sola
num
indi
cum
Mul
lu B
adan
eSo
lana
ceae
Shru
bFr
uits
Gum
55So
lanu
m n
igru
mG
anik
eSo
lana
ceae
Her
bLe
aves
Mou
th w
ash
56S
yzig
ium
cum
ini
Lava
nga
Myr
tace
aeTr
eeBu
ds,
Teet
h, G
um,
Twig
sTo
oth
brus
h, P
ain
57S
yzig
ium
cum
ini
Ner
ale
Myr
tace
aeTr
eeFr
uits
Teet
h, G
um, S
mel
lLe
aves
, Bar
kTo
oth
brus
h58
Term
inal
ia c
hebu
laAn
ale
Com
brat
acea
eTr
eeFr
uits
Mou
th w
ash,
Gar
gle
59V
anilla
Pla
nifo
liaVa
nilla
Orc
hida
ceae
Cre
eper
Ess
ence
Pain
Frui
ts60
Vign
a un
guic
ulat
aAl
asan
diFa
baec
eae
Her
bSe
eds
Gum
61W
ithan
ia S
omni
fera
Soga
de b
eru
Sola
nace
aeSh
rub
Roo
tsG
um62
Zant
hoxy
lum
rhet
saJu
mm
aR
utac
eae
Tree
Frui
tsPa
in63
Zing
iber
offi
cina
leSh
unti
Zing
iber
acea
eH
erb
Tube
rP
ain,
Gar
gle,
Gum
,Te
eth
64Zi
ziph
us m
aurit
iana
Bore
Han
nuR
ham
nace
aeTr
eeR
oots
,B
ad s
mel
l, M
outh
Seed
sw
ash

CORAL REEF BIOLOGY AND ECOLOGY
MAHANTAPPA SANKANUR1, SARESH, N.V 2, ARCHANA VERMA3,PRIYANKA RAJPUT4 AND BHAT, S.D5
ABSTRACT
In this paper importance of the Coral reefs and their biological and ecological be-haviors are discussed in details.
IntroductionCoral reefs are diverse and vulnerable
marine ecosystems characterized by a com-plex interdependence of plants and animals.The reef bio-composition is quite amazing andincludes 180 species of benthic algae, 14species of seaweeds, 12 species of seagrasses, 108 species of sponges, 4 speciesof lobsters, 103 species of echinoderms, 600species of fin fishes and also a good numberof species of crabs, bivalves, gastropos andcephalopods each in Lakshadweep andAndaman and Nicobar islands (Devaraj,1997). Coral reefs are massive limestonestructures build up through the constructionalcementing processes and depositional activi-ties of the animals of the class Anthozoa (or-der : Scleractinia) and all the other calciumcarbonate (CaCO3) secreting animals and thecalcifying algae. The value of coral reefs, bothfor the biosphere and human utilization is wellknow. Reefs are the centres of high biologi-cal productivity, sites of carbon dioxide (CO2)sink, ecosystems of very rich biodiversityhelping in shoreline protection, sources ofhuge deposits of CaCO3 and centres of sci-entific research. Additionally, they are provid-ing us with many natural raw materials for
deriving pharmacological products especiallythe life saving drugs (Pillai, 1997).
Biodiversity of coral reefs is respon-sible for productivity in the sea and these coralreefs are built mainly by corals containingCaCO3 skeleton. The reef building corals arethe hermatypic corals harbouring zooxanthel-lae and the ahermatypic corals, without zoox-anthellae. Coral reefs are found in the welllighted zone of waters upto a depth of 50-70m in having salinity of 32-35 ppt andtempertures above 200 C. In the coral habitata variety of fascinating animal life such asgiant clams, sea cucumbers, sea anemones,sea urchins, sea fans, crown-of-thorns starfish and a variety of coloured fishes abound.Each of these animals has a special niche inthis system (Raghukumar, 1997). Coral reefsare highly productive with annual productionrates ranging from 2,000 to 5,000 g C per m2
per year. Such a higher rate of productivity isdue to the efficient retention and recycling ofnutrients within the reef system. Such inter-nal recycling of nutrients is greater than thatof the other marine ecosystems which is re-sponsible for the higher gross productivity ofcoral reefs. The potential fish yield from theworld reefs is 6-9 million tonnes per year,
MyForest, December, 2011Vol.47(4) Page Nos.303-310
1, 2, 3 Research Scholars, Dept. of Tree improvement and Genetic resources.4 Dept. of Silviculture and Agro-forestry, College of Forestry, Dr. Y. S. Parmar University ofHorticulture and Forestry, Nauni-Solan-173, 230, Himachal Pradesh.5 Assistant Professor, College of Forestry, Sirsi - 581 401, Karnataka.
MyForest December 2011
304
equivalent to 9-12 per cent of all marine fishcatch. Indian reefs together with their shelves,lagoons and submerged banks covering anarea of 1,800 km2 have a potential fish yieldof 0.2 million tonnes per year, or about 10 percent of the annual marine fish production(Wafar, 1990).
Morphology and physiology of the cor-als are very interesting. The term “corallum”is the total coral bush and the “corallite” isthe calcareous cup within which the coralpolyps, the living parts are embedded. Thesepolyps release mucus to entrap plankton andother food particles which are engulfed. Themesentrial filaments in the coelenteron digestthe food materials and the absorption takesplace through simple diffusion. The algal pho-tosynthetic products are directly available tothe hosts and the alage inturn receive nutri-ents and CO2 from the coral polyps. Photo-synthetic activity of zooxanthellae also helpsaltering the CO2 concentration in the tissuesof the coral organisms and increasing the in-nate ability of the organisms to extract moreof CaCO3 from sea water for production of lime.
Ecological and economic values of coralreefs
Coral reefs are among the most diverseand productive communities on Earth. Theyprovide food and shelter to countless fish,crustaceans, and molluscs and remove car-bon dioxide, a green house gas. Coral reefsshelter land from harsh ocean storms andfloods. They are potential source of impor-tant medicines, including drugs with antican-cer, antimicrobial and antiviral activity. Coralreefs provide a living laboratory for studentsand scientists (Annon., 2001).
Coral reef biology and ecology
Thousands of corals species existworldwide. Stony (hermatypic) corals are thebest recognized because of their elaborateand colourful formations. One trait of stony
corals is their capacity to build reef struc-tures that range from tens, to thousands ofmeters across. As they grow, reefs providestructural hapitats for hundreds to thousandsof different vertebrate and invertebrate spe-cies. Although corals are found throughoutthe world, reef-building corals are confined towaters that exhibit a narrow band of charac-teristics. The water must be warm, clear, andsaline. These waters are almost always nu-trient-poor as well. Physiologically and be-haviorally, corals have evolved to take advan-tage of this unique environment and thrive.Not only are reef-building corals confined bya specific range of environmental conditions,but as adults, almost all of them are sessile.This means that for their entire lives, theyremain on the same spot of the sea floor. Thus,reef-building corals have developed reproduc-tive, feeding, and social behaviors that allowthem to gain the maximum survival benefitfrom their situation.
• Reproductive Behavior• Spawning Events• Feeding Behavior and Reef Productivity• Competitive Behavior• Aggressive Behavior• Disturbances
Reproductive Behavior
Over the eons many corals have evolvedwith the ability to reproduce both asexuallyand sexually. In asexual reproduction, newclonal polyps bud off from parent polyps toexpand or begin new colonies (Sumich, 1996).This occurs when the parent polyp reaches acertain size and divides. The process contin-ues throughout the animal’s life, forming anever expanding colony.
The nature of sexual reproduction amongcorals varies by species. About three quar-ters of all stony corals form hermaphroditiccolonies. These colonies have the ability toproduce both male and female gametes. The

MyForest December 2011
305
remainder form gonochoristic colonies whichcan produce either male or female gametes,but not both. The sexuality of corals - whetherhermaphroditic or gonochoristic - tends to beconsistent within species and genera,alghough there are exceptions. As a predomi-nantly sessile group of organisms, aboutthree-quarters of all stony corals employbroadcast spawning to distribute their off-spring over a broad geographic area. Thesecorals release massive number of eggs andsperm into the water column. The gametesfuse in the water column to form planktoniclarvae (planulae). A moderately-sized colonymay produce up to several thousand planu-lae per year. Large numbers of planulae areproduced to compensate for the many haz-ards they inevitably will encounter as theyare carried through the water. The time be-tween planulae formation and settlement is aperiod of exceptionally high mortality amongcorals. In contrast, some coral species broodplanulae within their bodies after internal fer-tilization. While spawning is associated withhigh number of eggs and planulae, broodingresults in fewer, larger and better-developedplanulae (Veron, 2000).
Planulae swim upward toward the light(positive phototaxis) to enter the surface wa-ters and be transported by the current. Thisbehavior is observed not only in nature but inlaboratory experiments as well. After floatingat the surface for some time, the planulaeswim back down to the bottom, where, if con-ditions are favorable, they will settle and be-gin a new colony. In most species, the larvaesettle within two days, although some willswim for up to three weeks, and in one knowninstance, two months. Once the planulaesettle, mortality rates drop steadily as theymetamorphose into polyps and form colonieswhich increase in size. The new colony be-comes sexually mature at a minimum size,depending on the species, Some massivespecies, like Favia doreyensis, reach sexual
maturity when polyps grow to about 10 cm indiameter, which occurs when they are abouteight years old. However, some faster-grow-ing, branching corals, including species ofAcropora, Pocillipora and Stylophora, reachsexual maturity at a younger age (Barnes andHughes, 1999).
Spawning Events
Among sessile corals, the timing of themass release of gametes into the water col-umn (broadcast spawning event) is very im-portant because males and females cannotmove into reproductive contact. Spawningspecies must release their gametes into thewater simultaneously. Because colonies maybe separated by wide distances, this releasemust be both precisely and boradly synchro-nized, and is usually done in response tomultiple environmental cues. The long-termcontrol of spawning (control of the matura-tion of gonads) may be related to tempera-ture, day length and / or rate of temperaturechange (either increasing or decreasing). Theshort-term (getting ready to spawn) controlis usually based on lunar cues. The final re-lease, or spawn, is usually based on the timeof sunset. Cues also may be biological (in-volving chemical messengers) or physical.Brooding species can store unfertilized eggsfor weeks, and thus, require less synchronyfor fertilization. Spawning species requiresynchrony within a time frame of hours (Veron,2000).
This regional synchrony varies geo-graphically. In Australia’s Great Barrier Reef,more than 100 of the 400 plus species ofcorals spawn simultaneously within a fewnights during spring or early summer. Stud-ies have shown that coral species that coralspecies can form hybrids through massspawning (Hatta et al., 1999). Such observa-tions have led to the theory of reticulate evo-lution. Whereas modern coral species cameabout not through the separation of new spe-

MyForest December 2011
306
cies along different lineages, but ratherthrough a continual process of separation andfusion.
In Western Australia and the FlowerGarden Banks of the northern Gulf of Mexico,spawning occurs in late summer or fall andnot necessarily simultaneously. In the north-ern Red Sea, none of the major coral spe-cies reproduce at the same time. In addition,individual corals do not necessarily breedevery year. Evidence indicates that slow-grow-ing, longer lived corals are less likely to spawnevery year than faster-growing, shorter-livedspecies (Levinton, 1995).
Feeding Behavior and Reef ProductivityThe unique mutualism between her-
matypic corals and their photosynthetic zoox-anthellae is the driving force behind the settle-ment, growth and productivity of coral reefs.Zooxanthellae are photosynthetic, single-celled dinoflagellates, living in the endoder-mal tissues of stony corals polyps (intracelularly). Often, zooxanthellae are concen-trated in the polyps’ gastrodermal cells andtentacles (Levinton, 1995). Deep water andsome old water corals lack zooxanthellae,but virtually all reef-building corals possessthem. During photosynthesis, zooxanthellae“fix” large amounts of carbon, part of whichthey pass on to their host polyp. This carbonis largely in the form of glycerol but also in-cludes glucose and alanine. These chemicalproducts are used by the polyp for its meta-bolic functions or as building blocks in themanufacture of proteins, fats and carbohy-drates. The symbiotic algae also enhance thecoral’s ability to synthesize CaCO3 (Lalli andParsons, 1995). Because of their intimate re-lationship with zooxanthellae, hermatypic cor-als respond to the environment in many waysreminiscent of plants. As a result, the distri-bution and growth of corals is strongly light-dependent, as is the overall growth of the reef(Levinton, 1995). The vertical distribution ofliving coral reefs is restricted to the depth of
light penetration, which is why most coralreefs dwell in shallow waters, ranging todepths of approximately 60 to 70 meters. Thenumber of species of hermatypic corals on areef declines rapidly in deeper water; the curveclosely follows that for light extinction. Be-cause of their dependence on light, reef cor-als require clear water. Thus, coral reefs gen-erally are found only where the surroundingwater contains small amounts of suspendedmaterial, i.e., in water of low turbidity and lowproductivity. Thus, corals prefer water that arenutrient-poor, yet paradoxically, are amongthe most productive of marine environments(Barnes, 1987).
Although the zooxanthellae supply amajor part of their energy needs, most coralsalso require zooplankton prey. With someexceptions, most corals feed at night. Whencapturing food particles, corals feed in a man-ner similar to sea anemones. Polyps extendtheir tentacles to capture prey, first stingingthem with toxic nematocyst cells, then draw-ing them toward their mouths. In addition tocapturing zooplankton, many corals also col-lect fine particles in mucous film or strands,which are drawn by cilia into the polyp’smouth. Some species are entirely mucoussuspension feeders, such as the Foliaceousagariciids (“leafy”) which have few or no ten-tacles. Prey ranges in size from small fish tosmall zooplankton, depending on the size ofthe coral polyps. Prey supplies the coral andits zooxanthellae with nitrogen, an elementessential to both organisms, but one that isnot produced in sufficient amounts by either.The symbiotic relationship between corals andzooxanthellae facilitates a tight recycling ofnutrients back and forth between the two. Thedegree to which the coral depends on zoox-anthellae is species-specific. Branching cor-als appear to be more self-nourshing (au-totrophic) than some of the massive corals,largely because the multi-layered growth fromof branching corals allows for a greater sur-
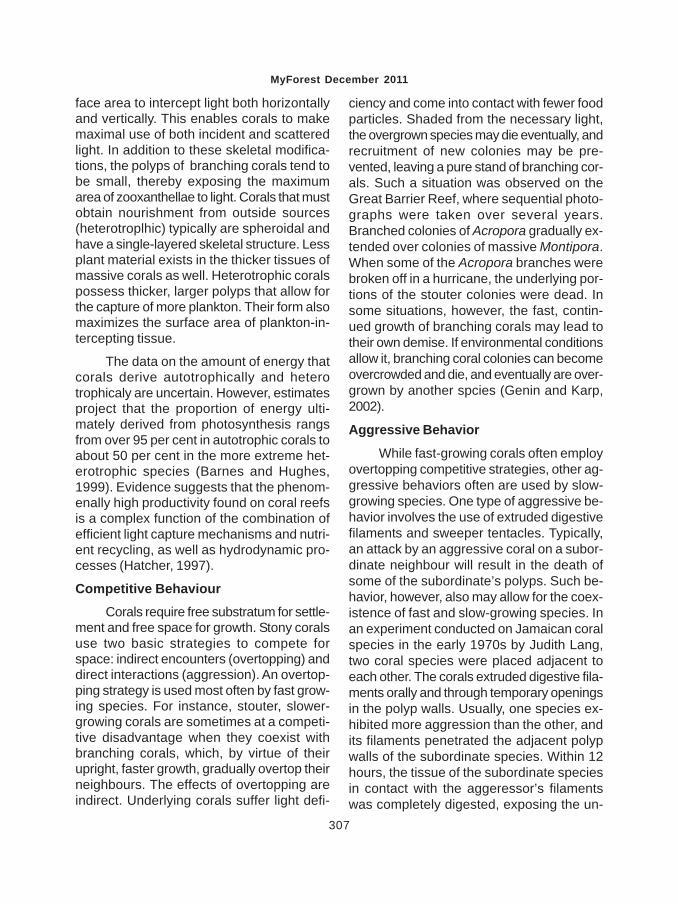
MyForest December 2011
307
face area to intercept light both horizontallyand vertically. This enables corals to makemaximal use of both incident and scatteredlight. In addition to these skeletal modifica-tions, the polyps of branching corals tend tobe small, thereby exposing the maximumarea of zooxanthellae to light. Corals that mustobtain nourishment from outside sources(heterotroplhic) typically are spheroidal andhave a single-layered skeletal structure. Lessplant material exists in the thicker tissues ofmassive corals as well. Heterotrophic coralspossess thicker, larger polyps that allow forthe capture of more plankton. Their form alsomaximizes the surface area of plankton-in-tercepting tissue.
The data on the amount of energy thatcorals derive autotrophically and heterotrophicaly are uncertain. However, estimatesproject that the proportion of energy ulti-mately derived from photosynthesis rangsfrom over 95 per cent in autotrophic corals toabout 50 per cent in the more extreme het-erotrophic species (Barnes and Hughes,1999). Evidence suggests that the phenom-enally high productivity found on coral reefsis a complex function of the combination ofefficient light capture mechanisms and nutri-ent recycling, as well as hydrodynamic pro-cesses (Hatcher, 1997).
Competitive Behaviour
Corals require free substratum for settle-ment and free space for growth. Stony coralsuse two basic strategies to compete forspace: indirect encounters (overtopping) anddirect interactions (aggression). An overtop-ping strategy is used most often by fast grow-ing species. For instance, stouter, slower-growing corals are sometimes at a competi-tive disadvantage when they coexist withbranching corals, which, by virtue of theirupright, faster growth, gradually overtop theirneighbours. The effects of overtopping areindirect. Underlying corals suffer light defi-
ciency and come into contact with fewer foodparticles. Shaded from the necessary light,the overgrown species may die eventually, andrecruitment of new colonies may be pre-vented, leaving a pure stand of branching cor-als. Such a situation was observed on theGreat Barrier Reef, where sequential photo-graphs were taken over several years.Branched colonies of Acropora gradually ex-tended over colonies of massive Montipora.When some of the Acropora branches werebroken off in a hurricane, the underlying por-tions of the stouter colonies were dead. Insome situations, however, the fast, contin-ued growth of branching corals may lead totheir own demise. If environmental conditionsallow it, branching coral colonies can becomeovercrowded and die, and eventually are over-grown by another spcies (Genin and Karp,2002).
Aggressive Behavior
While fast-growing corals often employovertopping competitive strategies, other ag-gressive behaviors often are used by slow-growing species. One type of aggressive be-havior involves the use of extruded digestivefilaments and sweeper tentacles. Typically,an attack by an aggressive coral on a subor-dinate neighbour will result in the death ofsome of the subordinate’s polyps. Such be-havior, however, also may allow for the coex-istence of fast and slow-growing species. Inan experiment conducted on Jamaican coralspecies in the early 1970s by Judith Lang,two coral species were placed adjacent toeach other. The corals extruded digestive fila-ments orally and through temporary openingsin the polyp walls. Usually, one species ex-hibited more aggression than the other, andits filaments penetrated the adjacent polypwalls of the subordinate species. Within 12hours, the tissue of the subordinate speciesin contact with the aggeressor’s filamentswas completely digested, exposing the un-
MyForest December 2011
308
derlying skeleton. Though larger subordinatecolonies suffered only local loss of tissue,colonies less than 3 cm in diameter perishedafter the attack.
Lang’s experiments also revealed thateach coral species attacked only certain spe-cies, and each was attacked itself by certainother species, suggesting an “aggressivepecking order” among the corals. Resultssuggested that the slow - growing massivecorals belonging to the families Mussidae,Meandrinidae, and Faviidae were the mostaggressive species. The fast-growing, branch-ing acroporid corals were intermediatelyaggrerssive, and the foliose agariciids, alsoquick growers, were the least aggressive.Aggressors may attack more than one sub-ordinate at a time, and intermediately aggres-sive corals may attack a less aggressive coraleven while being attacked on another side bya more aggressive coral. Thus, it appears thatatleast on Jamaican reefs, fast - and slow-growing coral species can coexist becausethe speed at which branching corals grow isbalanced by the aggressive nature of mas-sive corals (Lang and Chornesky, 1990). How-ever, such a balanced competitive environ-ment is not universal among reef ecosys-tems. Monospecific stands of corals do ex-ist, and this may be due to a species beingrelatively fast growing while also aggressive.Other factors like spatial position, size andbiological and physical disturbances also in-fluence the outcomes of competition (Conneland Keough, 1985). These local processes,in addition to regional ones, contribute to theformation of species-diverse assemblages ora reef dominated by one or a few species(Cornell and Karlson, 2000).
The coral reefs off the Pacific coast ofPanama illustrate a low species diversity reefand the complex species interactions that canoccur. The shallow reefs are dominated byspecies of fast-growing, branching Pocillopora.
Species of the slow-growing, massive Pavonadominate in deeper waters. In the field, thedistribution of scars left by tentacle encoun-ters between neighbouring corals suggeststhat Pocillopora is dominant over Pavona.However, in laboratory experiments, Pavonacan damage the tissues of Pocillopora within12 hours of tissue contact. Fortunately, long-term experiments have explained the para-dox. After placing Pocillopora and Pavonatogether on the reef, within two days Pavonaextends its mesenterial filaments and killsthe adjacent tissues of Pocillopora. Pavonathen retracts its mesenterial filaments, andalgae quickly cover the bare areas ofPocillopora skeleton. One to two months later,tissue regenerates over the bare patches, andthe polyps on the peripheral branches ofPocillopora adjacent to Pavona convert someof their feeding tentacles into very elongated“sweeper” tentacles that sway passively inthe surge, frequently dragging over the Pavonacolony. Contact with the sweeper tentaclesdamages or kills the affected Pavona tissue.The exposed skeleton is rapidly colonized byfilaments algue and later by encrusting cor-alline algae that prevents further contact be-tween the two corals. The sweeper tentaclesof Pocillopora contract and resume their nor-mal feeding function. Gradually, the faster-growing Pocillopora overtops the Pavona. Itis unclear why Pavona does not retaliate byextending its mesenterial filaments to coun-teract Pocillopora sweeper tentacles. Someresearchers suggest that the sweeper ten-tacles are more powerful than the mesenterialfilaments. Though previously thought to beused only for intercepting zooplankton,sweeper tentacles are structurally similar tothe special tentacles of sea anemones thatare used for aggression between clones(Barnes and Hughes, 1999).

MyForest December 2011
309
Disturbances
In addition to indirect encounters (over-topping) and direct interactions (aggression),the competitive advantage of one stony coralspecies over another may be affected bynatural disturbances. Physical disturbancesand predation can remove member of acommunity’s dominant competitors, thusenhancing species diversity. However, distur-bances do not necessarily increase speciesdiversity. For instance, if a predator prefers asubordinate species, competitive exclusionis enhanced. Any kind of disturbance thatdisrupts the process of competitive exclusion,but does not eliminate competitors, will pro-mote coesistence. Finally, corals must con-tend with other competitors like soft coralsand algae for reef space. Disturbances suchas catastrophic low tides, predation and graz-ing affect the availability of space. Sea ur-chins and herbivorous fish prevent algae frommonopolizing space. Soft corals can be over-topped by stony corals, but their rapid growthand distastefulness too many predators al-low them to rapidly colonize any newly-openedspace (Barnes and Hughes, 1999).
ConclusionCoral reefs are beyond doubt one of the
planets greatest attractions and beautiful pre-sentations. Having a riot of colours, theypresent a breathtaking and enchanting sightto the viewers. Individual coral animals,mostly existing in colonies, are the primarybuilding blocks of the reef. Corals are de-scribed as the rich respository of biodiversitydue to high number of habitat opportunitiesafforded by this environment. In the Indiansubcontinent, the reefs are distributed alongthe east and west coasts at restricted places.Coral reefs provide food & shelter to count-less fish, crustaceans, and mollusks and fixCO2 a green house gas. They shelter landfrom harsh Ocean storms, floods and are
potential source of medicine, including drugswith anticancer, antimicrobial and antiviralactivitiy. Reef resources are traditionalsources of food and income to the localcoastal alagae, reef fishes, holothurians,shrimps, lobsters, crabs, molluscs etc. Sig-nificant increase in human population andpoverty also utilization and competition for thereef resources have resulted in indiscriminateharvest of the biodiversity of the coral reefs.Coral reefs face numerous hazards andthreats; it is because of both natural and an-thropogenic stresses. Destructive naturalevents such as tsunami, disease out breaks,tidal emersions and natural predators. In ad-dition to it, human activities pose grave threatsto the viability of coral reefs viz., run-off, sedi-mentation and pollutant discharge resultedfrom dredging and shoreline modification,coastal development activities, agricultural,deforestation activities, hot water dischargesfrom water treatment plants and large powerplants can significantly alter the water chem-istry in coastal areas. In many other areas,they are over fished/over exploited for recre-ational and commercial purposes, cyanidefishing, deep water trawling and marine basedpollution are disrupt the long term viability re-productive success of coral, rendering themto more vulnerable. The current estimates that10 per cent of all coral reefs are degradedbeyond recovery, 30 per cent are in criticalcondition and may die within 10 to 20 years.They are one of the planets greatest attrac-tions and beautiful presentations. Having ariot of colours, they present a breathtakingand enchanting sight to the viewers. So thereis an urgent need for conservation and man-agement of these wonderful highly produc-tive ecosystems through several conservationand management measures for sustainableutilization.
MyForest December 2011
310
References
Anonymous (2001) Oceanic treasures : Ma-rine life is a source for future medi-cines, Centre for Science and Envi-ronment, pp. 44-45.
Barnes R. and Hughes R. (1999) An Intro-duction to Marine Ecology; Third Edi-tion. Malden, MA : Blackwell Science,Inc. pp. 117-141.
Barnes R.D. (1987) Invertebrate Zoology;Fifth Edition, Fort Worth, TX :LHarcourt Brace Jovanovich College Pub-lishers. pp. 92-96, 127-134, 149-162.
Connel J.H. and Keough M.J. (1985) Distur-bance and patch dynamics of subtidalmarine animals on hard substrata. In:Pickett, S.T.A. and P.S. White (eds.),The Ecology of Natural Disturbancesand Patch Dynamics. pp. 125-151.
Cornell H.V. and Karlson R.H. (2000) Coralspecies richness: ecological versusbiogeographical influences, CoralReefs, 19:37-49.
Devaraj M. (1997) A brief on the contributionof the Central Marine Fisheries Re-search Institute to research and knowl-edge of coral reefs of India. Proc. Re-gional Workshop on the Conser. Sus-tain. Manag. Coral Reefs, organizedby M.S. Swaminathan Research Foun-dation and BOBP of FAO/UN, pp:21-25.
Genin A. and Karp L. (2002) Effects of Flowon Competitive Superiority inScleractinian Corals, Limnology andOceanography, 39 (4) : 913-924.
Hatcher B.G. (1997) Coral reef ecosystems :how much greater is the whole thanthe sum of the parts? In: Lessios, H.A.,Macintyre, I.G. (eds.), Proceedings ofthe 8th International Coral Symposium,Panama, June 24-29, 1996, 1 : 43-56.
Hatta M. Fukami H. Wang W. Omori ShimoikeK. Hayashibara T. Ina Y. Sugiyama T.(1999) Reproductive and genetic evi-dence for a reticulate evolutionarytheory of mass spawning corals, Mo-lecular Biology and Evolution,16(11) : 1607-1613.
Lalli C.M. and Parsons T.R. (1995) Biologi-cal Oceanography : An introduction,Oxford, UK : Butterworth-HeinemannLtd. pp. 220-233.
Lang J. and Chornesky E.A. (1990) Compe-tition between scleractinian Reef Cor-als - A review of mechanisms and ef-fects, In Z. Dibinsky (ed), Coral ReefsEcosystems of the world, 25 : 209-257.
Levintion J.S. (1995) Marine Biology : Func-tion, Biodiversity, and Ecology. NowYork : Oxford University Press, Inc, pp.306-319.
Pillai G.C.S. (1997) A brief resume of researchand understanding of the reef corals andcoral reefs around India. Proc. Regionalworkshop on the Conser. Sustain.Manag. Coral Reefs, organized by M.S.Swaminathan Research Foundation andBOBP of FAO/UN, pp : 13-21.
Raghukumar C. (1997) Crowing corals, Sci.Rep., 34 (11) : 9-15.
Sumich J.L. (1996) An Introduction to the Bi-ology of Marine Life; Sixth Edition.Dubuque, IA : Wm, C. Brown. pp. 255-269.
Verson J.E.N. (2000) Corals in space and time: biogeography and evolution of thescleractinia. Ithica : Comstock, Cornell.pp. 321.
Wafar M.V.M. (1990) Coral reefs - Special-ized ecos and current Trends in CoastalIndia, Indian J. Mar. Sci., 20: 18-22.
MASS MULTIPLICATION OF VESICULAR ARBUSCULARMYCORRHIZAE (VAM) AND ITS USE IN FOREST
RESEARCH NURSERY AT SIRSI RESEARCH RANGE
HIMAVATI BHAT
ABSTRACT
The following paper deals with methodology involved for mass multiplication. VAMfungi and also activities carried out at Sirsi Research Range in this regard. Resultsof experiments conducted using VAM in Vateria indica, Mammea suriga, Artocarpuslakoocha and Putranjiva spp. are also discussed in detail.
IntroductionThe term bio-fertilizers refer to the mi-
cro organisms, which either fix atmosphericnitrogen or enhance the solubility and mobil-ity of nutrients. Microorganisms play an im-portant role in restoring the physico-chemi-cal and biological properties of soil. Some ofthe fungi, bacteria have proved to be effectivebio-fertilizers in forestry.
Mycorrhizae functionally represent mu-tualistic or symbiotic association betweenplants roots and non-pathogenic sooil fungiby which both the partners are benefited.Vesicular Arbuscular Mycorrhizae (VAM)fungi are classified in the familyEndogonaceaea, order Mucorales and classZygomycetes of the phycomycetes group.This fungi enters the root and forms Vesicles(round shaped cells), Arbuscles (branchedhyphae) and intracellular hyphae in the pri-mary cortex of the roots, hence its nameVesicular Arbuscular Mycorrhizae. VAMis prevalent in most Angiosperms, Gymno-sperms, Pteridophytes etc but absent inPinaceae, Orchidaceae also absent in de-graded soils.
Significance of VAM in forestry• The network of hyphal extension in the
soil increases the absorptive surfaceof the roots and thereby increases uptake of nutrients and plant growth.
• It has its well-known effect on phos-phorus uptake, (Gar and Gerdemann,1969), apart from that the reports ofZinc, sulphur, phosphate uptake arealso enhanced (Gilmore 1971, La Rueet al 1973) in plants. They make avail-able phosphorus from organic phos-phates in forest litter.
• It helps to overcome water stress bystomatal regulations.
• It helps the plant to grow in infertile soilbecause of the weathering ability ofVAM fungi.
• It decreases the transplanting shockand thereby increases survival percent-age of seedlings in out planting lead-ing to success of plantation in degradedareas. They are helpful in binding thesand into semi stable aggregates andthis is of importance in semi desert af-forestation.
MyForest, December, 2011Vol.47(4) Page Nos.311-314
Range Forest Officer, Research Range, Sirsi - 581 401.
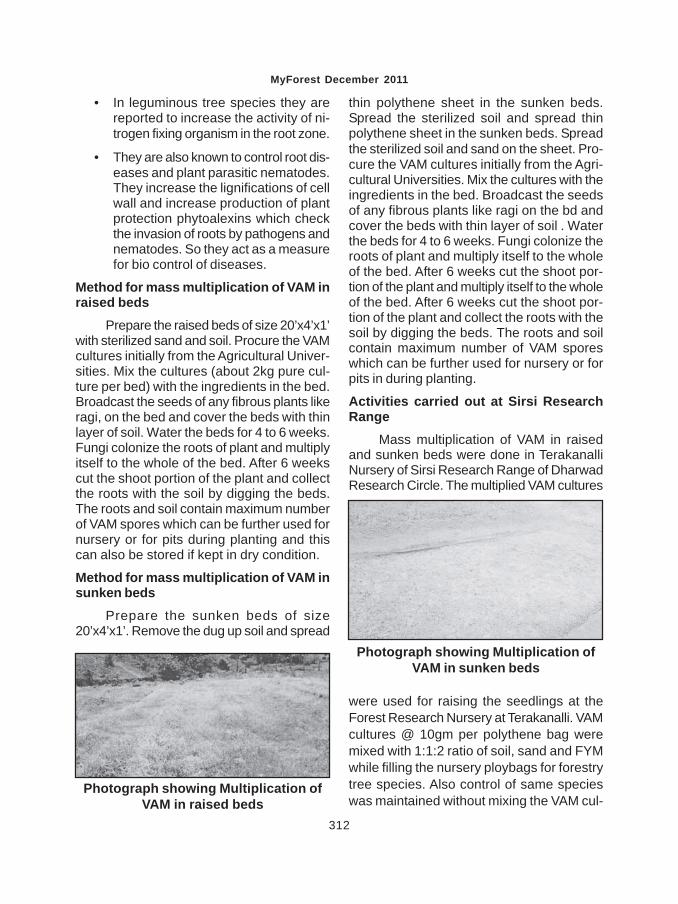
MyForest December 2011
312
• In leguminous tree species they arereported to increase the activity of ni-trogen fixing organism in the root zone.
• They are also known to control root dis-eases and plant parasitic nematodes.They increase the lignifications of cellwall and increase production of plantprotection phytoalexins which checkthe invasion of roots by pathogens andnematodes. So they act as a measurefor bio control of diseases.
Method for mass multiplication of VAM inraised beds
Prepare the raised beds of size 20’x4’x1’with sterilized sand and soil. Procure the VAMcultures initially from the Agricultural Univer-sities. Mix the cultures (about 2kg pure cul-ture per bed) with the ingredients in the bed.Broadcast the seeds of any fibrous plants likeragi, on the bed and cover the beds with thinlayer of soil. Water the beds for 4 to 6 weeks.Fungi colonize the roots of plant and multiplyitself to the whole of the bed. After 6 weekscut the shoot portion of the plant and collectthe roots with the soil by digging the beds.The roots and soil contain maximum numberof VAM spores which can be further used fornursery or for pits during planting and thiscan also be stored if kept in dry condition.
Method for mass multiplication of VAM insunken beds
Prepare the sunken beds of size20’x4’x1’. Remove the dug up soil and spread
thin polythene sheet in the sunken beds.Spread the sterilized soil and spread thinpolythene sheet in the sunken beds. Spreadthe sterilized soil and sand on the sheet. Pro-cure the VAM cultures initially from the Agri-cultural Universities. Mix the cultures with theingredients in the bed. Broadcast the seedsof any fibrous plants like ragi on the bd andcover the beds with thin layer of soil . Waterthe beds for 4 to 6 weeks. Fungi colonize theroots of plant and multiply itself to the wholeof the bed. After 6 weeks cut the shoot por-tion of the plant and multiply itself to the wholeof the bed. After 6 weeks cut the shoot por-tion of the plant and collect the roots with thesoil by digging the beds. The roots and soilcontain maximum number of VAM sporeswhich can be further used for nursery or forpits in during planting.
Activities carried out at Sirsi ResearchRange
Mass multiplication of VAM in raisedand sunken beds were done in TerakanalliNursery of Sirsi Research Range of DharwadResearch Circle. The multiplied VAM cultures
were used for raising the seedlings at theForest Research Nursery at Terakanalli. VAMcultures @ 10gm per polythene bag weremixed with 1:1:2 ratio of soil, sand and FYMwhile filling the nursery ploybags for forestrytree species. Also control of same specieswas maintained without mixing the VAM cul-
Photograph showing Multiplication ofVAM in raised beds
Photograph showing Multiplication ofVAM in sunken beds
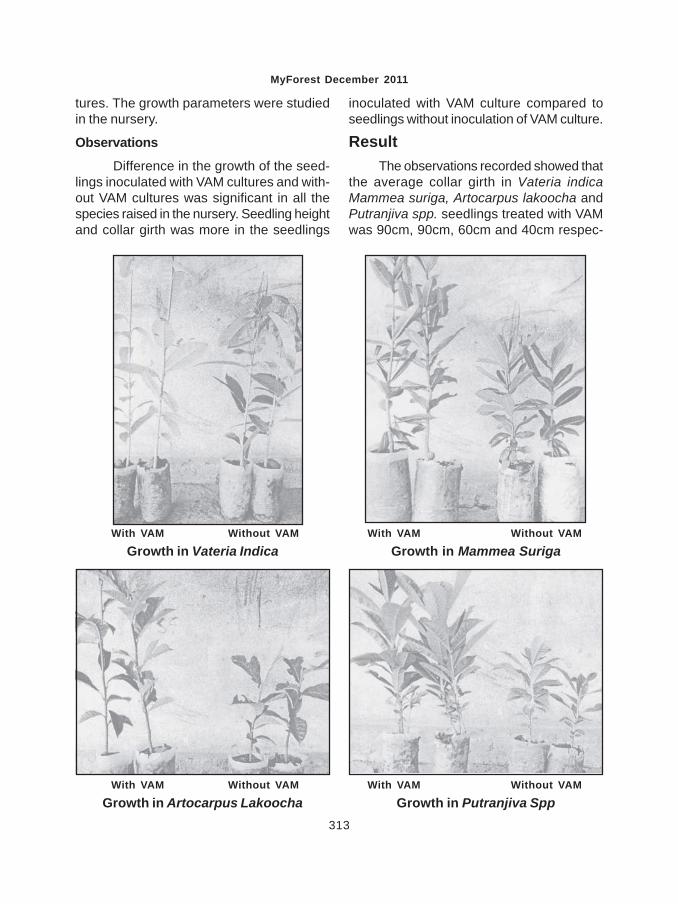
MyForest December 2011
313
tures. The growth parameters were studiedin the nursery.
Observations
Difference in the growth of the seed-lings inoculated with VAM cultures and with-out VAM cultures was significant in all thespecies raised in the nursery. Seedling heightand collar girth was more in the seedlings
inoculated with VAM culture compared toseedlings without inoculation of VAM culture.
ResultThe observations recorded showed that
the average collar girth in Vateria indicaMammea suriga, Artocarpus lakoocha andPutranjiva spp. seedlings treated with VAMwas 90cm, 90cm, 60cm and 40cm respec-
With VAM
Growth in Vateria IndicaWithout VAM With VAM
Growth in Mammea SurigaWithout VAM
With VAM
Growth in Artocarpus LakoochaWithout VAM With VAM
Growth in Putranjiva SppWithout VAM
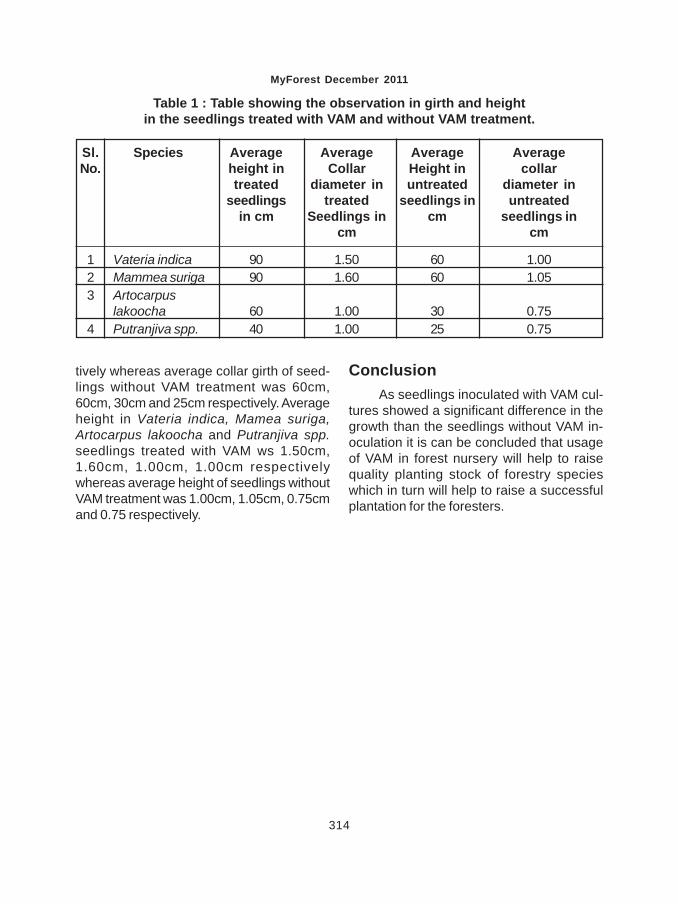
MyForest December 2011
314
Table 1 : Table showing the observation in girth and heightin the seedlings treated with VAM and without VAM treatment.
Sl. Species Average Average Average AverageNo. height in Collar Height in collar
treated diameter in untreated diameter inseedlings treated seedlings in untreated
in cm Seedlings in cm seedlings incm cm
1 Vateria indica 90 1.50 60 1.002 Mammea suriga 90 1.60 60 1.053 Artocarpus
lakoocha 60 1.00 30 0.754 Putranjiva spp. 40 1.00 25 0.75
tively whereas average collar girth of seed-lings without VAM treatment was 60cm,60cm, 30cm and 25cm respectively. Averageheight in Vateria indica, Mamea suriga,Artocarpus lakoocha and Putranjiva spp.seedlings treated with VAM ws 1.50cm,1.60cm, 1.00cm, 1.00cm respectivelywhereas average height of seedlings withoutVAM treatment was 1.00cm, 1.05cm, 0.75cmand 0.75 respectively.
ConclusionAs seedlings inoculated with VAM cul-
tures showed a significant difference in thegrowth than the seedlings without VAM in-oculation it is can be concluded that usageof VAM in forest nursery will help to raisequality planting stock of forestry specieswhich in turn will help to raise a successfulplantation for the foresters.
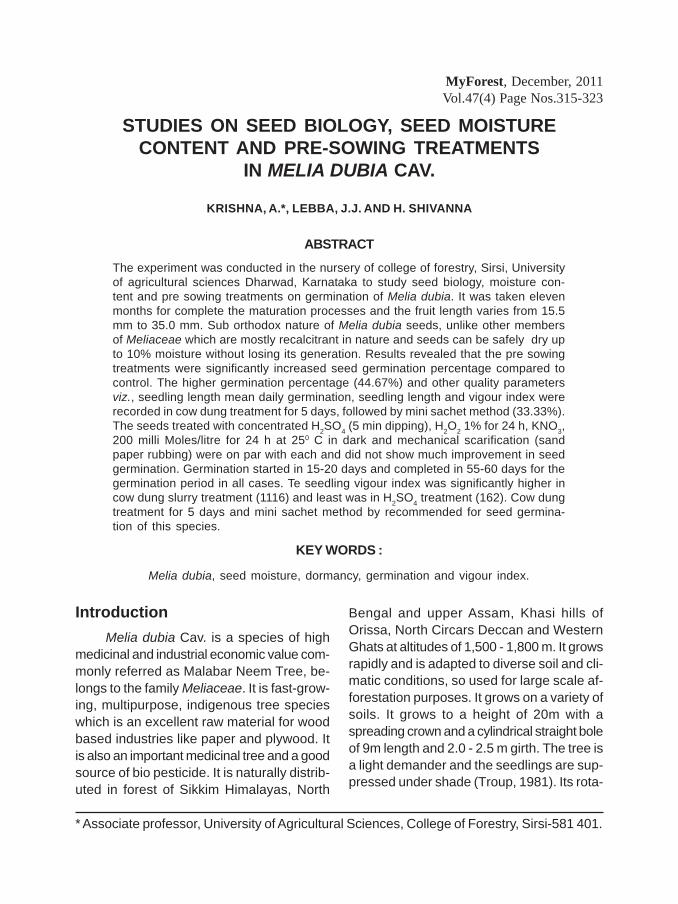
STUDIES ON SEED BIOLOGY, SEED MOISTURECONTENT AND PRE-SOWING TREATMENTS
IN MELIA DUBIA CAV.
KRISHNA, A.*, LEBBA, J.J. AND H. SHIVANNA
ABSTRACT
The experiment was conducted in the nursery of college of forestry, Sirsi, Universityof agricultural sciences Dharwad, Karnataka to study seed biology, moisture con-tent and pre sowing treatments on germination of Melia dubia. It was taken elevenmonths for complete the maturation processes and the fruit length varies from 15.5mm to 35.0 mm. Sub orthodox nature of Melia dubia seeds, unlike other membersof Meliaceae which are mostly recalcitrant in nature and seeds can be safely dry upto 10% moisture without losing its generation. Results revealed that the pre sowingtreatments were significantly increased seed germination percentage compared tocontrol. The higher germination percentage (44.67%) and other quality parametersviz., seedling length mean daily germination, seedling length and vigour index wererecorded in cow dung treatment for 5 days, followed by mini sachet method (33.33%).The seeds treated with concentrated H2SO4 (5 min dipping), H2O2 1% for 24 h, KNO3,200 milli Moles/litre for 24 h at 250 C in dark and mechanical scarification (sandpaper rubbing) were on par with each and did not show much improvement in seedgermination. Germination started in 15-20 days and completed in 55-60 days for thegermination period in all cases. Te seedling vigour index was significantly higher incow dung slurry treatment (1116) and least was in H2SO4 treatment (162). Cow dungtreatment for 5 days and mini sachet method by recommended for seed germina-tion of this species.
IntroductionMelia dubia Cav. is a species of high
medicinal and industrial economic value com-monly referred as Malabar Neem Tree, be-longs to the family Meliaceae. It is fast-grow-ing, multipurpose, indigenous tree specieswhich is an excellent raw material for woodbased industries like paper and plywood. Itis also an important medicinal tree and a goodsource of bio pesticide. It is naturally distrib-uted in forest of Sikkim Himalayas, North
KEY WORDS :
Melia dubia, seed moisture, dormancy, germination and vigour index.
Bengal and upper Assam, Khasi hills ofOrissa, North Circars Deccan and WesternGhats at altitudes of 1,500 - 1,800 m. It growsrapidly and is adapted to diverse soil and cli-matic conditions, so used for large scale af-forestation purposes. It grows on a variety ofsoils. It grows to a height of 20m with aspreading crown and a cylindrical straight boleof 9m length and 2.0 - 2.5 m girth. The tree isa light demander and the seedlings are sup-pressed under shade (Troup, 1981). Its rota-
MyForest, December, 2011Vol.47(4) Page Nos.315-323
* Associate professor, University of Agricultural Sciences, College of Forestry, Sirsi-581 401.
MyForest December 2011
316
tion was reported to be four to six years andhave high productivity compared to commonplantation species. It is having a high poten-tial to become one of the most importantplantation species in the future than thepresent widely planted plantation tree spe-cies like Acacias and Eucalyptus, which areexotics (Parthiban et al., 2009).
A detailed study of seed biology revealsthe secrets of germination problems in naturalcondition and how it can be rectified in con-trolled nursery conditions. The seeds of somespecies will not tolerate any slight change inits desiccation level, that are termed asrecalicitrant while, others will survive to far lowerrate of moisture content are orthodox seeds(Vergheese and Naithani, 2000).
Recently this species is gaining morepopularity in southern states of India for itsfast growth and wide adaptability in diverseand climate conditions. And the demand fornursery grown seedlings of this species hasincreased immensely among farmers. Sothere is need to produce large stock of healthyand vigorous seedlings in short duration, byappropriate pre sowing treatments. The maindifficulty in establishing forest plantation ofthis species is its poor germination capacityof seeds. It also shows a poor recruitment inthe wild. A uniform germination of seed withgood vigour is necessary for the productionof uniform planting stock which is a prerequi-site for any successful domestication andlarge scale afforestation programme. Eventhough vegetative propagation has a solutionfor this problem, seed propagation remainsthe principal mode of propagation of forestryspecies in temperature as well as in tropics.Seeds are produced in large number and arereadily available each year or at a definite in-terval and it can be stored for future use(Fenner and Thompson, 2005). Keeping thisin view, the present investigation was carriedout with an objective of understanding the seed
biology and influence of presowing treatmentson seed germination in Melia dubia.
Material and methodThe experiment was conducted in the
nursery of college of forestry, University ofagricultural sciences, Sirsi. The seeds werecollected manually from ten matured, healthymother trees, from semi-evergreen forest ofIdugundhi forest range, Yellapur division, nearKaiga in Central Western Ghats. Soon aftercollection, from these fruits, various qualita-tive and quantitative characters data wererecorded before the fruit processing. The col-lected fruits were brought to the laboratory ingunny bags, processed to get clean, pureseeds of high physiological quality. The pulpof the fruit is extracted by subjecting tofermination and heating as it difficult to re-move manually. Finally the seed is allowedto air dry in laboratory condition. After seedprocessing was completed the fruits weredried under shade in a well-ventilated placeto study the effect of moisture content on seedgermination. For each treatment, 300 seedswere taken at random in every alternate day’sup to 14 days of drying. This sample thendivide into two, one lot was used for moistureanalysis and second lot was sown in therereplications in the nursery bed to get germi-nation per cent. Aftercare like watering andseeding was done regularly in the beds asand when required throughout the experimen-tal period.
Three hundred randomly collected freshseeds of Melia dubia were used for each treat-ment which is replicated thrice. In controlseeds were sown without any treatment. Fortreatment (T2) the seeds were soaked in ratioof 1:2 proportions of cold water for 24 hours.For mechanical scarification, fruits were cutlongitudinally without damaging seeds. In (T3)the fruit were dipped in concentrated H2SO4for 5 min and is immediately washed withplenty of water. In treatment T5 , T6 seeds were
MyForest December 2011
317
soaked in ratio 1:2 proportions seed to chemi-cal solution (Gibberllic acid with 100 ppm) for8 hours and dried back to their original weight.In treatment T7, T8 seed were soaked inchemical solution at 1:2 proportions in (H2O2and KNO3) for 24 hours and the T8 is immedi-ately kept at dark. For Mini Sachet methodthe seeds were sown in open bed by provid-ing a airtight polyhene covering after giving amulch of dried grass to retain moisture. Thenseeds are exposed to direct sunlight in samecondition for five days. All the treatments weretimed in such a way that all of them wouldend at the same time. And the seeds of eachtreatment were sown in prepared nurserybeds for germination test. The number ofseeds germinated in each day was counted;emergence of plumule was teken as the cri-terion of germination. The germination wasrecorded up to 60 days from the day of sow-ing. The seed quality parameters were re-corded at the end of the germination test pe-riod as per ISTA procedure (Anon, 1996).
Results and discussionSeed biology aspects of Melia dubia are
studied and the data on all the fruit and seedbiology parameters are presented in Table1. The fruit length of Melia dubia varies from15.5mm to 35.0 mm and average fruit lengthwas 22.52mm. The fruit thickness of Meliadubia ranged from 10.2 mm to 20.5 mm andthe average fruit thickness was about13.42mm. The fruits shown a wide variationin fruit thickness compared to length. The fruitof Melia dubia is a drupe with hard seed coatand is of ovate in shape. It ranged from round-ish to elongated ones and some were withwrinkled fruit shape. The fruit weight of Meliadubia ranged from 1.5 grams to 2.5 gramsand the average fruit weight were found to be1.85 grams. The fruit volume of Melia dubiawas estimated using water displacementmethod and was found to be 1.50 cm3. The
average fruit density of Melia dubia was foundto be 1.23g/cm3 in this experiment. The fruitof Melia dubia is 4 to 5 seeded drupe with asoft yellowish pulp and became light brownin colour after processing. The fruit moisturecontent was analyzed by oven dry methodand was found 20 per cent when it is esti-mated from fresh fruits. The results of topo-graphic tetrazollium test shows that the vi-ability percentage of Melia dubia seeds isabout 92 per cent. The cutting test done inMelia dubia seeds found that about 10 percent of total locules counted are empty. Simi-lar results were notices in investigations madeby Chitra devi et al., (2007) in Thespesialampas. The test weight (100 seed weight)was around 185.52 g. On an average one ki-logram of Melia dubia fruits contain about 540drupes. The fruit of Melia dubia takes longperiod to mature in natural condition. It istaken eleven months for completing the de-velopment stages of maturation. The germi-nation pattern showed a distinct variationwhen whole fruit and mechanically extractedseed are when sown. The whole fruit gener-ally produce single seedling, but rarely doesit produce twin seedling, triplet seedling andquadruple seedling from single fruit. Theseresults are in conformity with the findings ofMilimo and Hellum, (1987) and Chauhan andShams (2008).
The fruit moisture content had no influ-ence on the seed germination per cent amongdifferent treatments (Table - 2) (Fig - 1). Thevariation in seed germination percentage wasnegligible between treatments as the reduc-tion in fruit moisture after harvesting. How-ever, the fruit moisture content of fresh seedis found to be 21.2 per cent and it shows agermination of 10.50 per cent. This was re-duced to 17.20 per cent followed by 15.5 percent, 14.32 per cent, 13.68 per cent, 12.01per cent, 11.25 per cent and 10.0 per cent insubsequent drying of two, four, six, eight, ten,

MyForest December 2011
318
12 and 14 days of shade drying respectively.In general, there is no much variation in theseed germination, even reduction in moisturecontent reduced from 21.20 per cent to 10.00per cent. This results reveals the sub ortho-dox nature of Melia dubia seeds, unlike othermembers of Meliaceae which are mostly re-calcitrant in nature and seeds can be safelydry up to 10% moisture without losing itsgermination. These results were augmentingwith the findings of Singh et al., (1997) whoreported that there is no significant differencein germination percent while reducing themoisture content up to 6.06 per cent inAzadirachata indica.
Seed germination was significantlyhigher (44.67%) in cow dung slurry treatmentfor 5 days which is followed by mini sachetmethod (33.33%), mechanical scarification +gibberllic acid 100 ppm 8 h (28.67%),gibberllic acid 100 ppm 8 h (25.33%) (Table-3). The germination percentage was poor inconcentrated H2SO4 (5 min dipping) (6.00%)and followed by H2O2 1% for 24 h (6.67%),KNO3 200 milli Moles/litre for 24 h at 250 c indark (7.33%), mechanical scarification(8.00%) and control (10.67%). Similar resultswere reported by Bharadwaj and Chakraborty(1994) in Terminalia chebula increased ger-mination per cent was observed in cow dungtreatment and Hombe Gowda and Vasudeva,2004 in Mapia. These results were also inconformity with the study conducted by Naiduand Mastan (2001) where seeds ofPterocarpus marsupium treated with cowdung slurry for 6 days showed 74 per centgermination.
The maximum mean daily germination(0.950) was observed in cow dung treatmentfor 5 days which was followed by Mini sachetmethod (0.641), mechanical scarification +gibberllic acit 100 ppm 8 h (0.597), andgibberllic acid 100 ppm 8 h (0.597), andgibberllic acid 100 ppm 8 h (0.507). Therewas an increase of 82.10 per cent in mean
daily germination due to cow dung treatmentfor 5 days was compared to control. The pre-swoing treatments initiated early germinationand reduced period of germination by facili-tating enhanced imbibition of water into coty-ledons and hastened the biochemical reac-tions; intern increased the mean daily germi-nation and peak value. Thus the liberation ofenzyme raidly increases the whole systemthat is already in motion, so that when theseeds are sown, developmental processes goon rapidly. It leads to higher germination withreduced germination period.
The treatment T6 i.e. soaking the seedin cow dung treatment for 5 days showed sig-nificantly highest peak value of 1.117 was fol-lowed by 0.813 in Mini sachet method. Thelowest mean daily germination of 0.013 isrecorded in concentrated H2SO4 5 min dip-ping and is followed by 0.142 in H2O2 1% for24 h, 0.163 in KNO3 200 milli Moles/litre for24 h at 25c in dark, 0.167 in mechanical scari-fication and 0.237 in control. Peak value ofgermination increases 79.29 per cent due tocow dung treatment for 5 days over controlduring the experimentation. It may mobilizesstorage reserves for seed germination, whichhelped to enhance the germination especiallyin Melia dubia, so that developmental pro-cesses occur more rapidly after sowing in pretreated seeds than treated seeds. These re-sults are in line with the results of Rai (1999),who found high mean daily germination andpeak value in cow dung treatment inTerminalia tomentosa and Pterocarpussantalinus.
Maximum seedling height at the end ofgermination period was found to be 26.10 cmin cow dung treatment for 5 days, which wasfollowed by 22.80 cm in mini sachet method.The minimum seedling height of 12.80 cm wasrecorded in KNO3 200 milli Moles/litre for 24h at 250 C in dark.
MyForest December 2011
319
Significantly higher seedling vigour in-dex of 1166.47 is recorded in cow dung treat-ment for 5 days, which was followed by 760.80in mini sachet method. Significantly lowerseedling vigour index values were recordedin concentrated H2SO4 5 dipping (83.93) which
ReferenceAnonymous, 1996, International Rules for
Seed Testing, Seed Sci. and Tech.,(Supplement) : 1-335.
Basavaraj, L.T. Srinivas, V and Devakumar,A.S., 2002, Effect of seed treatmentson seed germination and seedlinggrowth in Elaeocarpus munronil. MyForest 119(5) : 360-366.
Baskin J.M. and Baskin, C.C., 1988 Seeds :Ecology, biogeography and evolution ofdormancy and germination. San Diego.CA : Academic press.
Baskin J.M. and Baskin, C.C., 2000, Evolu-tionary consideration of claims for physi-cal dormancy-break by microbial actionand abrasion by soil particles. SeedSci. Res., 10 : 409-413.
Bharadwaj, S.D. and Chakraborty, A.K. 1994,Studies on time of seed collection, sow-ing and pre-sowing seed treatment ofTerminalia chebula Retz. and Terminaliabellerica Roxb. Indian For., 120(5):430-439.
Chitra devi L., Pandey, S., Anjali Kak andVeena gupta., 2007, Dormancy andseed germination in Thespesia lampasDalz & Cibs : A potential agro-forestryand medicinal Species. Indian For., 133(9) : 1683-1689.
Fenner. M and Thompson K., 2005, The ecol-ogy of seeds. Cambridge UniversityPress. pp. 97-104; 110-131.
Hombe Gowda H.C. and Vasudeva. R., 2004,effect of pre-sowing treatments on seedgermination and seedling parameters of
Nothopodytes nimmoniana : An impor-tant anti cancer drug yielding tree. J.Non-Timber For. Pro., 11(3) : 193-198.
Milimo, P.B. and Hellum, A.L., 1987, Studiesfor the structure and development ofseeds of Melia volkensii. In. Proc. Symp.for seed prob., Harare, Zimbabwe, August 23-September 2, p. 178-195.
Morepeth, D.R. and Hall, A.M., 2000, Micro-bial enhancement of seed germinationin Rosa corymbifera Laxa. Seed Sci.Res., 10 : 489-494.
Naidu, C.V. and Mastan, M., 2001, Seed pretreatment methods to improve germina-tion in Pterocarus santalinus. Indian J.For 24(3) : 342 - 343.
Parthiban, K.T., Bharathi, A.K. Seenivasan,R., Kamala, K. and Rao, M.G. 2009, In-tegrating Melia dubia in agroforestryfarms as alternate pulpwood speciesAsia-Pacific Agro forestry newsletterNo. 34.
Rai, S.N., 1999, Nursery and Planting tech-niques of forest trees in tropical southAsia. Panarvasu publications, Dharwad,pp. 102. Admin, Page 7 1/23/2012.
Singh, B.G.., Mahadevan, N.P., Santhi, K.,Manimuthu, L and Geetha S., 1997, Ef-fect of moisture content on the viabilityand storability of Azadirachta indicaseeds. Indian For., 123 (7) : 631-636.
Vargheese, B. and Naithani, S.C.,2000 Des-iccation induced loss of vigour and vi-ability during storage in Neem(Azadirachta Indica A. Juss.) seeds.Seed Sci. Tech., 26 (1) : 485 - 496.
was followed by H2O2 1% for 24 h (91.27).These results were also in agreement withthe study conducted by Baskin and Baskin(2000) and Morpeth and Hall (2000).

MyForest December 2011
320
Table 1 : Friut and seed biology parameters in Melia dubia
Sl.No. Seed and fruit parameters Resulti Mean Fruit length (mm) 22.52ii Mean Fruit thichness (mm) 13.42iii Fruit shape ovateiv Mean Fruit weight (g) 1.85v Mean Fruit volume (cm3) 1.50vi Mean Fruit density (g/cm3) 1.23vii Fruit colour Light brownviii Mean Fruit moisture content 20.0ix Seed viability (Percentage) 92.0x Fruit emptiness (Percentage) 10.0xi Test weight (g) 185.52xii Fruiting period Januaryxiii Fruit maturation Eleven Months
xiv a) Germination pattern of normal a) Single seedlingwhole fruit. b) Double seedling
c) Triplet seedlingd) Quadruple seedling
xiv b) Germination pattern of mechanically a) Single seedling withextracted individual seed from drupe peculier type of growth
patternxiv c) Germination type Epigeal
Table 2 : Effect of fruit moisture content on seed germination in Melia dubia
Treatments Moisture % Germination %T1 : Immediately after collection (Fresh seed) 21.20 10.50T2 : Two days of drying under shade 17.20 10.25T3 : Four days of drying under shade 15.50 9.20T4 : Six days drying of under shade 14.34 9.50T5 : Eight days of drying under shade 13.68 10.72T6 : Ten days of drying under shade 12.01 8.76T7 : Twelve days of drying under shade 11.25 9.28T8 : Fourteen days of drying under shade 10.00 9.53SEm + 1.87 1.23CD@5% 5.26 3.46
Table 2 : Effect of fruit moisture content on seed germination in Melia dubia
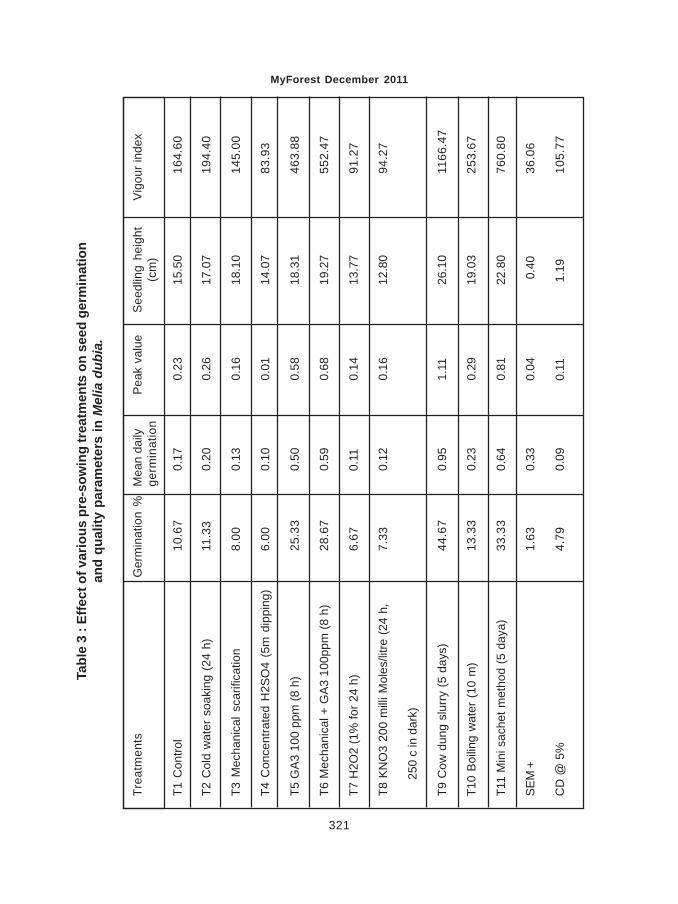
MyForest December 2011
321
Trea
tmen
tsG
erm
inat
ion
%M
ean
daily
Pea
k va
lue
See
dlin
g he
ight
Vig
our i
ndex
germ
inat
ion
(c
m)
T1 C
ontro
l10
.67
0
.17
0.2
3
15.5
016
4.60
T2 C
old
wat
er s
oaki
ng (
24 h
)11
.33
0
.20
0.2
6
17.0
719
4.40
T3 M
echa
nica
l sca
rific
atio
n8.
00
0.1
3
0
.16
18
.10
145.
00
T4 C
once
ntra
ted
H2S
O4
(5m
dip
ping
)6.
00
0.1
0
0
.01
14
.07
83.9
3
T5 G
A3
100
ppm
(8 h
)25
.33
0
.50
0.5
8
18.3
146
3.88
T6 M
echa
nica
l + G
A3
100p
pm (8
h)
28.6
7
0.5
9
0
.68
19
.27
552.
47
T7 H
2O2
(1%
for 2
4 h)
6.67
0
.11
0.1
4
13.7
791
.27
T8 K
NO
3 20
0 m
illi M
oles
/litre
(24
h,7.
33
0.1
2
0
.16
12
.80
94.2
7
2
50 c
in d
ark)
T9 C
ow d
ung
slur
ry (5
day
s)44
.67
0
.95
1.1
1
26.1
011
66.4
7
T10
Boi
ling
wat
er (
10 m
)13
.33
0
.23
0.2
9
19.0
325
3.67
T11
Min
i sac
het m
etho
d (5
day
a)33
.33
0
.64
0.8
1
22.8
076
0.80
SEM
+1.
63
0.3
3
0
.04
0
.40
36.0
6
CD
@ 5
%4.
79
0.0
9
0
.11
1
.19
105.
77
Tabl
e 3
: Effe
ct o
f var
ious
pre
-sow
ing
trea
tmen
ts o
n se
ed g
erm
inat
ion
and
qual
ity p
aram
eter
s in
Mel
ia d
ubia
.

MyForest December 2011
322
Fig
1 : E
ffect
of v
ario
us p
re-s
owin
g tr
eatm
ents
on
seed
ger
min
atio
n in
Mel
ia d
ubia
Germination %
Pre-
sow
ing
Trea
tmen
ts
T1 - Control
T2 - Cold water (24 hrs)
T3 - Mechanical
T4 - Conc. H2SO4 (5 mins)
T5 - Ga3 100 ppm 8 hr
T6 - Mechanical + GA3
T7 - H2O2 (1%, 24 hrs)
T8 - KNO3 (200 mM for 24 hrs)
T9 - Cow dung slurry (5 days)
T10 - Boiling water (10 mins)
T11 - Mini Sachet method ( 5 days)
50 45 40 35 30 25 20 15 10 5 0
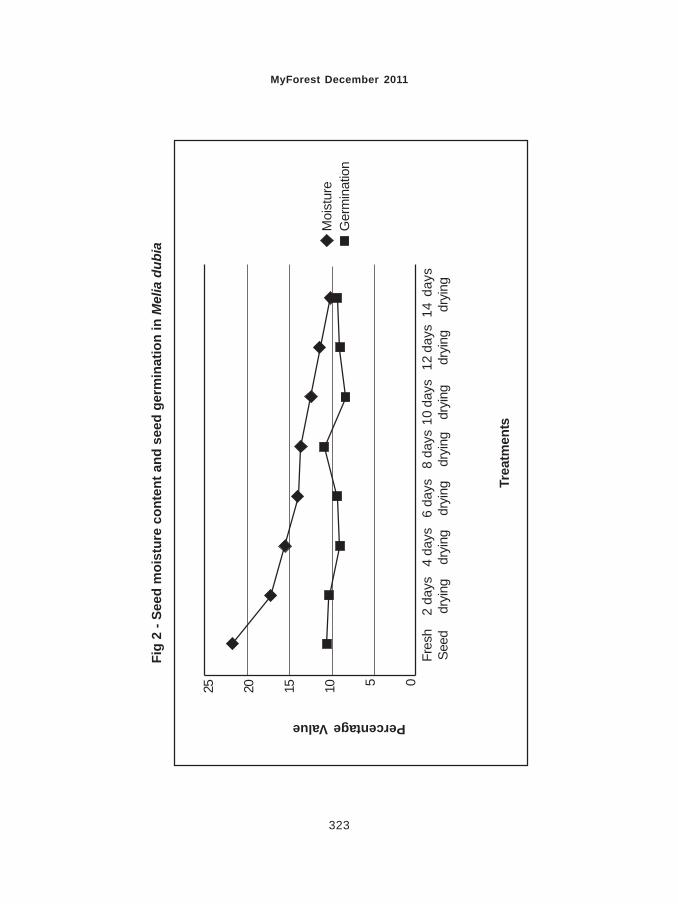
MyForest December 2011
323
Fig
2 - S
eed
moi
stur
e co
nten
t and
see
d ge
rmin
atio
n in
Mel
ia d
ubia
Fres
h2
days
4 da
ys6
days
8 da
ys10
day
s12
day
s14
day
sSe
eddr
ying
dryi
ngdr
ying
dryi
ngdr
ying
dryi
ngdr
ying
Trea
tmen
ts
Percentage Value
Moi
stur
eG
erm
inat
ion
25 20 15 10 5 0


INFLUENCE OF SEED SIZE AND SEED INVIGOURATIONTREATMENTS ON SEED GERMINATION AND
QUALITY IN ASHWAGANDHAKRISHNA, A.
ABSTRACT
A comprehensive laboratory study on Ashwagandha was undertaken at Departmentof Forest Biology and Tree Improvement, College of Forestry, University of Agricul-tural Sciences, Sirsi during 2009-10. Significantly higher germination and speed ofgermination was noticed in big seeds followed by medium seeds. Reduced rate ofspeed germination, seeding dry weight, root length, shoot length and vigour indexwho observed with decrease in the seed size. The difference in seed germinationas influenced seed invigouration treatments were found significant. The maximumseed germination was noticed in seed treated with KNO3 1 per cent solution, fol-lowed by Ga3 100 ppm treatments compared to untreated seeds. Invigouration treat-ments showed significant variation for seedling dry weight, root shoot length andvigour index. The seeds treated with KNO3 significantly produced higher qualityparameters compared to seeds treated with cytokinine (50ppm). The treatmentcombination V1T3 recorded numerically higher values of shoot length and vigor indexcompared to all treatments.
IntroductionAshwagandha (Withania somnifera
Dunal) is cultivated over an area of 10,780 hawith a production of 8,429 tonnes in India.While the annual demand increased from 7028tonnes (2001-02) to 9127 tonnes (2004-05)necessitating the increase in its cultivationand higher production. It stands third withannual growth rate of 9.1 per cent next toAmla and Ashoka. Among the traded medici-nal plants in India, Ashwagandha stands sec-ond in trading with a worth of Rs. 100-120million rupees next to Amla (Tripathi et al.,1996). Due to increasing demand for the rootsin recent times and considering its futuredemand, there exists much scope for exten-sive cultivation of the crop in India.
Seed size variation within a variety,among the genotypes, within species have
received considerable attention by geneti-cists, breeders, seed technologists and pro-gressive farmers. Seed size variation isclosely linked to the seed germination andquality parameters. Common problem of dif-ference in the seed size may owe variation intheir size and weight on account of problemsat seed development stage or insect pestattack. This problem can be solved by seeddensity separation. In case of seed densityseparation the same size seeds are sepa-rated based on seed weight (specific gravity)i.e. separation bold and healthy seeds fromimmature, unfilled, insect attack, broken andempty seeds. However, there is scanty infor-mation available on the effect of seed size onseed quality.
Seed deterioration is said to be irrevers-
MyForest, December, 2011Vol.47(4) Page Nos.325-331
* Associate professor, University of Agricultural Sciences, College of Forestry, Sirsi - 581 401.
MyForest December 2011
326
ible, inexorable and inevitable processes, butrate of deterioration could be slowed downeither by keeping the seed in good storageenvironment or by imposing certain seedtreatment. The invigouration seed treatmentsinclude any physical, chemial and physiologi-cal seed treatments (either wet or dry) withrange of chemicals viz., growth regulators,fungicides, pesticides, agrochemicals, vita-mins, antioxidants, etc or with simple hydra-tion and dehydration treatment (Basu, 1993).Considering the medicinal value, demand andpaucity of information on scientific produc-tion of quality planting material, a compre-hensive laboratory study carried out to knowthe effect of seed size variation andinvigouration on seed germination and seedquality.
Material and methodComprehensive laboratory studies in
Ashwagandha was undertaken at Departmentof Forest Biology and Tree improvement,College of Forestry, University of AgriculturalSciences, Sirsi during of 2009-10. Freshlyharvested and six months old seeds ofAshwagandha were collected from the Aro-matic and medicinal plants Division, Saidpurfarm and Horticulture department, AgriculturalCollege, Dharwad. The fresh seeds were clas-sified based on their size as bit (T1), medium(T2) and smll (T3) using 2.2 mm, 2.0 and 1.8mm round sieves. One sample randomlytaken from seed lot considered as bulk (T4).The four treatments were replicated five timesin the germination test (Anon., 1996). Fresh(V1) and six month old (V2) seeds ofAshwagandha were soaked in ratio of 1:2 pro-portions of seed to chemical solution (Ga3,KNO3, KH2PO4, CaOCl2 and Thiourea) for sixhours and dried back to their original weight.The non invigorated, seeds of both fresh andold were used as control. The seeds of eachtreatment was subjected for germination testin the laboratory. The observations on per centgermination, shoot length, root length, dry
weight of seedling and vigour index were re-corded at the end of the test period (15th day)as per the procedures of ISTA (Anon., 1996).
Result and discussionThe seeds graded through hand sieves
has obtained three size seed fraction viz., bigseed (T1), medium seed (T2), small seed (T3),and bulk seed (T4) ungraded seeds served aseach seed fraction subjected to laboratorygermination test to evaluate the germinationand quality parameters, for successful ger-mination, growth of embryo into a miniatureplant with root system, absorbing water andnutrients is essential. The stored food mate-rial consists of substances with large in-soluble molecules such as protein, vitamin,oils which need to broken down by enzymaticaction into a soluble molecules such as sugar,amino acids, fatty acid and utilized by grow-ing points of the plants.
Seed size may be affected due to envi-ronment and results in production of smallerseed under unfavourable condition. The sizeof seed as a determining factor for germina-tion and establishment of many medicalplants, including Ashwagandha remained forpast many years.
The seed germination differed signifi-cantly due to the seed sizes, which de-creased significantly with increase in seedsize (Table-1). The maximum and minimumseed germination values of 80.00% and64.84% in big seed and small seed, respec-tively. The medium sized seeds (71.60%) andbulk seeds (70.80%) on par with each other.The big seed recorded significantly highergermination compared to all other treatments.Similar observations were notices by Radha(2004), Ponnuswamy et al. (1992), andChavan (1998).
Reduced rate of speed germination wasobserved with decrease in the seed size. Sig-nificantly higher speed of germination wasnoticed in big seeds (0.406) followed by me-

MyForest December 2011
327
dium seeds (0.398). The present study re-sults were corroborated with the results ofKattimani et al., 1999 in Ashwagandha.
Significantly higher seedling dry weightwas recorded in big seeds and lower in smallseeds. There was no significant differencebetween medium and bulk seeds as theyfound on par with each other. This might bedue to presence of immature seeds and re-duced food quality reserves could be the prob-able cause for poor performance os smallerseeds.
Significantly higher root length, shootlength and vigour index were observed in bigseeds followed by medium and bulk seedstend to decrease in size grades (Table-2).Palaniswamy and Ramaswamy (1985) re-ported large seeds of okra, recorded highseedling vigour, root and shoot length, whichfound to decrease with small seeds. Thesefindings are in agreement with findings of Kantand Tomar (1995) in mustard. Increase in rootand shoot length and vigour index rersultedin increased seedling dry weight may due tohigher content of phosphorous, ascorbic acidcontent and increased activities of enzymein large seeds and may also be due to effi-cient utilization of large food reserve fasterrate of photosynthesis producing dry matterproduction large seeds, (Hussaini et al. 1984).
The increase in root length and shootlength of seedlings exhibited by large seedsmay be attributed to the efficient utilization ofhigher amount of food reserves in large seedsproducing vigorous seedlings. The presenttrend of increase in seed size was confirmedby Dhillon and Kler (1976) in cereals.
Seed invigoration by hydration-dehydra-tion was attributed to the physiologicalrecoganition induced by the hydration pro-cess, changes in physico-chemical proper-ties of the cytoplasm (Henckle, 1964). Theseeds become physiologically advanced bycarrying out some of the initial steps of ger-
mination during soaking without radical emer-gence and the subsequent improvement inthe germinability of the stored seed is due tothe fact that such advanced seed would re-tain the ability to carry on from where theyleft off upon reimbibition (Heydecker, 1974).Basu and Rudrappa (1979) opined that muchof the effect of hydration would not involve anymajor biochemical repair system in the celland the effect may be rather than biophysi-cal than biochemical.
The seed germination significantly influ-enced by seed vigour levels, which increasedwith higher vigour levels. The maximum seedgermination for (71.81%) in high vigour levelsseeds and low vigour seeds (67.00%) (Table-3). The difference in seed germination as in-fluenced seed invigouration treatments foundto be significant. The maximum seed germi-nation was noticed in the seeds treated withKNO3 1 per cent solution, followed by Ga3100 ppm treatment as compared to untreatedseeds. The treatment combination of V1T2recorded (83.30%) was noticed. Irrespectiveof seed invigouration, high vigour seeds re-corded significantly higher germination overlow vigour seeds. The reduced seed qualityparameters associated with low vigour seedmay be attributed to seed characters viz age,physiological deterioration, lipid peroxidation,leading to axed metabolized that act uponcell and cell organelles, denaturizing of pro-tein and enzymes and due to chromosomaladnormalities. (Roberts, 1983) and (Delouche,1973).
The high vigour seeds recorded maxi-mum seedling dry weight (12.78 mg) while,low vigour seeds recorded lower seedling dryweight (11.93 mg). Invigouration treatmentsshowed significant variation for seedling dryweight. The seeds treated with KNO3 signifi-cantly produced higher seedling dry weight(13.17 mg) compared to seed treated withcytokinine (50 ppm). Among all the interac-tion V2T7 recorded significantly lower seed-
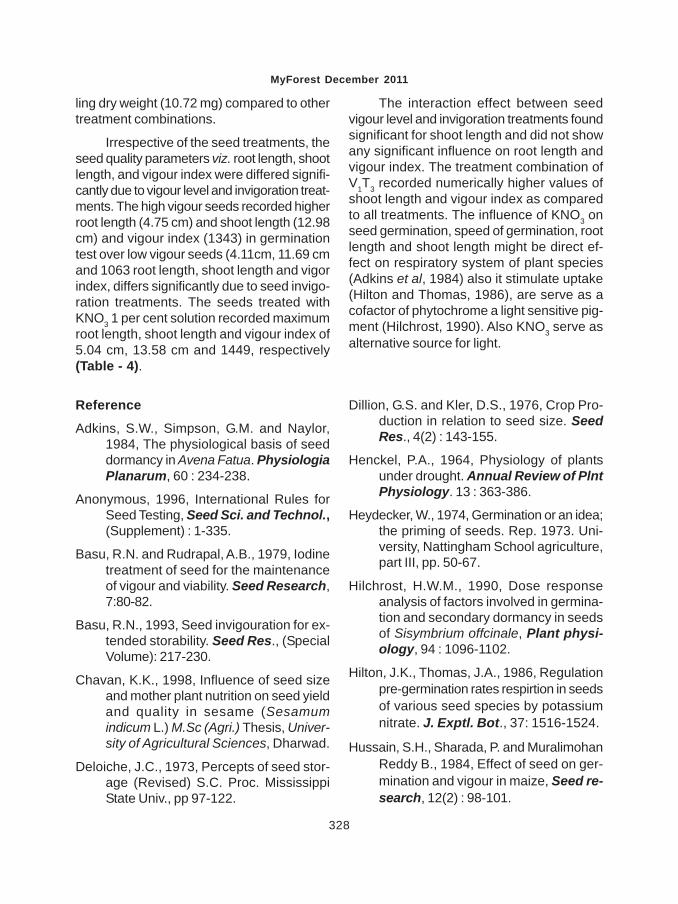
MyForest December 2011
328
ling dry weight (10.72 mg) compared to othertreatment combinations.
Irrespective of the seed treatments, theseed quality parameters viz. root length, shootlength, and vigour index were differed signifi-cantly due to vigour level and invigoration treat-ments. The high vigour seeds recorded higherroot length (4.75 cm) and shoot length (12.98cm) and vigour index (1343) in germinationtest over low vigour seeds (4.11cm, 11.69 cmand 1063 root length, shoot length and vigorindex, differs significantly due to seed invigo-ration treatments. The seeds treated withKNO3 1 per cent solution recorded maximumroot length, shoot length and vigour index of5.04 cm, 13.58 cm and 1449, respectively(Table - 4).
The interaction effect between seedvigour level and invigoration treatments foundsignificant for shoot length and did not showany significant influence on root length andvigour index. The treatment combination ofV1T3 recorded numerically higher values ofshoot length and vigour index as comparedto all treatments. The influence of KNO3 onseed germination, speed of germination, rootlength and shoot length might be direct ef-fect on respiratory system of plant species(Adkins et al, 1984) also it stimulate uptake(Hilton and Thomas, 1986), are serve as acofactor of phytochrome a light sensitive pig-ment (Hilchrost, 1990). Also KNO3 serve asalternative source for light.
Reference
Adkins, S.W., Simpson, G.M. and Naylor,1984, The physiological basis of seeddormancy in Avena Fatua. PhysiologiaPlanarum, 60 : 234-238.
Anonymous, 1996, International Rules forSeed Testing, Seed Sci. and Technol.,(Supplement) : 1-335.
Basu, R.N. and Rudrapal, A.B., 1979, Iodinetreatment of seed for the maintenanceof vigour and viability. Seed Research,7:80-82.
Basu, R.N., 1993, Seed invigouration for ex-tended storability. Seed Res., (SpecialVolume): 217-230.
Chavan, K.K., 1998, Influence of seed sizeand mother plant nutrition on seed yieldand quality in sesame (Sesamumindicum L.) M.Sc (Agri.) Thesis, Univer-sity of Agricultural Sciences, Dharwad.
Deloiche, J.C., 1973, Percepts of seed stor-age (Revised) S.C. Proc. MississippiState Univ., pp 97-122.
Dillion, G.S. and Kler, D.S., 1976, Crop Pro-duction in relation to seed size. SeedRes., 4(2) : 143-155.
Henckel, P.A., 1964, Physiology of plantsunder drought. Annual Review of PlntPhysiology. 13 : 363-386.
Heydecker, W., 1974, Germination or an idea;the priming of seeds. Rep. 1973. Uni-versity, Nattingham School agriculture,part III, pp. 50-67.
Hilchrost, H.W.M., 1990, Dose responseanalysis of factors involved in germina-tion and secondary dormancy in seedsof Sisymbrium offcinale, Plant physi-ology, 94 : 1096-1102.
Hilton, J.K., Thomas, J.A., 1986, Regulationpre-germination rates respirtion in seedsof various seed species by potassiumnitrate. J. Exptl. Bot., 37: 1516-1524.
Hussain, S.H., Sharada, P. and MuralimohanReddy B., 1984, Effect of seed on ger-mination and vigour in maize, Seed re-search, 12(2) : 98-101.

MyForest December 2011
329
Kant, K. and Tomar, S.R.S. 1995, Effect ofseed size on germination, vigour andfield emergence in mustard (Brassicajuncea L.) Cv. Pusa Bold. Seed Res.,23(1) : 40-42.
Kattimani, K.N. Reddy, Y.N. and Rao, B.R.,1999, Effect of pre-sowing seed treat-ment on germination, seedling emer-gence, and seedling vigour and root yieldof Ashwagandha (Withania somniferaDunal). Seed Sci. and Techmol., 27(2);483-488.
Palinisamy, V. and Ramaswamy, K.R., 1985,Effect of seed size and weight on seed-ling vigour in bhendi. Seed Research,13 (1) : 82-85.
Ponnuswamy, A.S., Krishnaswamy, V. andSidheswaran, 1992, Germination andvigour of sesame (Sesamum indicumL.) Cv. Co-1 seeds relative to the posi-tion of capsule on the plants. MadrasAgric J., 79: 130-134.
Radha, 2004, Seed grading and storabilitystudies in radish (Raphanus sativus L.).M.Sc. (Agri) Thesis, Univ. Agric. Sci.,Dharwad.
Roberts, E.H. 1983, Loss of Seed viabilityduring storage, Adv. Res. Technol,seeds., 8:9-34.
Tripathi, A.K. Sukla, Y.N. and Kumar S., 1996,Ashwagandha (Withania somnifera Dunal,Solanaceae) : a Status Report J. Med.and Arom. Pl. Sci., 18(1):46-62.
Table-1 : Effect of seed size variation on seed germination, speed of germinationand seedling dry weight in Ashwagandha
Table-2 : Effect of seed size variation on root length, shoot lengthand vigour index in Ashwagandha
Seed Size Germination (%) Speed of Seedling drygermination weight (mg)
T1 - Big seeds 80.00 (63.44)* 0.406 14.51T2 - Medium seeds 71.60 (57.80) 0.398 13.48T3 - Small seeds 64.60 (53.49) 0.358 12.17T4 - Bulk seeds 70.80 (57.29) 0.382 12.85SEm + 0.94 0.01 0.22CD (p=0.01) 3.72 0.039 0.85
Treatment Root Length (cm) Shoot Length Vigour index(cm)
T1 - Big seeds 5.53 13.54 1525T2 - Medium seeds 5.14 12.93 1295T3 - Small seeds 4.70 12.14 1118T4 - Bulk seeds 5.34 12.77 1282SEm + 0.12 0.16 27CD (p=0.01) 0.47 0.63 105
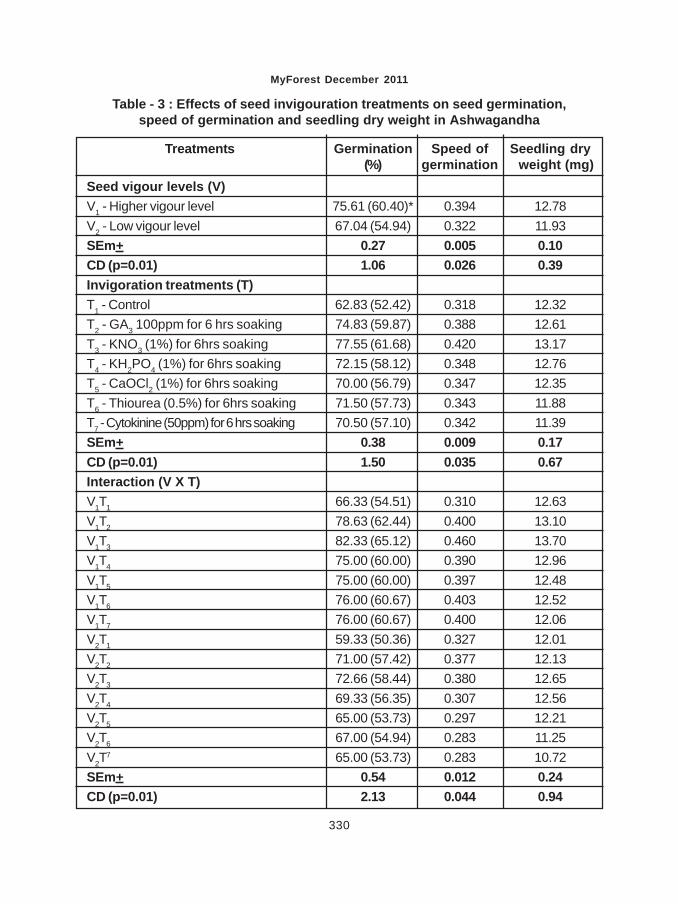
MyForest December 2011
330
Table - 3 : Effects of seed invigouration treatments on seed germination,speed of germination and seedling dry weight in Ashwagandha
Treatments Germination Speed of Seedling dry(%) germination weight (mg)
Seed vigour levels (V)V1 - Higher vigour level 75.61 (60.40)* 0.394 12.78V2 - Low vigour level 67.04 (54.94) 0.322 11.93SEm+ 0.27 0.005 0.10CD (p=0.01) 1.06 0.026 0.39Invigoration treatments (T)T1 - Control 62.83 (52.42) 0.318 12.32T2 - GA3 100ppm for 6 hrs soaking 74.83 (59.87) 0.388 12.61T3 - KNO3 (1%) for 6hrs soaking 77.55 (61.68) 0.420 13.17T4 - KH2PO4 (1%) for 6hrs soaking 72.15 (58.12) 0.348 12.76T5 - CaOCl2 (1%) for 6hrs soaking 70.00 (56.79) 0.347 12.35T6 - Thiourea (0.5%) for 6hrs soaking 71.50 (57.73) 0.343 11.88T7 - Cytokinine (50ppm) for 6 hrs soaking 70.50 (57.10) 0.342 11.39SEm+ 0.38 0.009 0.17CD (p=0.01) 1.50 0.035 0.67Interaction (V X T)V1T1 66.33 (54.51) 0.310 12.63V1T2 78.63 (62.44) 0.400 13.10V1T3 82.33 (65.12) 0.460 13.70V1T4 75.00 (60.00) 0.390 12.96V1T5 75.00 (60.00) 0.397 12.48V1T6 76.00 (60.67) 0.403 12.52V1T7 76.00 (60.67) 0.400 12.06V2T1 59.33 (50.36) 0.327 12.01V2T2 71.00 (57.42) 0.377 12.13V2T3 72.66 (58.44) 0.380 12.65V2T4 69.33 (56.35) 0.307 12.56V2T5 65.00 (53.73) 0.297 12.21V2T6 67.00 (54.94) 0.283 11.25V2T
7 65.00 (53.73) 0.283 10.72SEm+ 0.54 0.012 0.24CD (p=0.01) 2.13 0.044 0.94
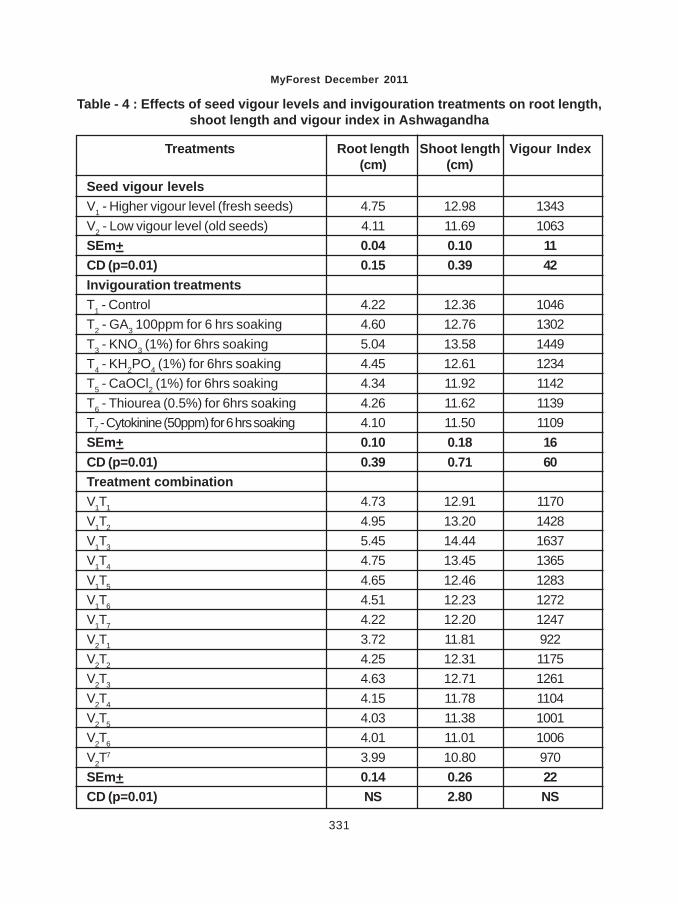
MyForest December 2011
331
Table - 4 : Effects of seed vigour levels and invigouration treatments on root length,shoot length and vigour index in Ashwagandha
Treatments Root length Shoot length Vigour Index(cm) (cm)
Seed vigour levelsV1 - Higher vigour level (fresh seeds) 4.75 12.98 1343V2 - Low vigour level (old seeds) 4.11 11.69 1063SEm+ 0.04 0.10 11CD (p=0.01) 0.15 0.39 42Invigouration treatmentsT1 - Control 4.22 12.36 1046T2 - GA3 100ppm for 6 hrs soaking 4.60 12.76 1302T3 - KNO3 (1%) for 6hrs soaking 5.04 13.58 1449T4 - KH2PO4 (1%) for 6hrs soaking 4.45 12.61 1234T5 - CaOCl2 (1%) for 6hrs soaking 4.34 11.92 1142T6 - Thiourea (0.5%) for 6hrs soaking 4.26 11.62 1139T7 - Cytokinine (50ppm) for 6 hrs soaking 4.10 11.50 1109SEm+ 0.10 0.18 16CD (p=0.01) 0.39 0.71 60Treatment combinationV1T1 4.73 12.91 1170V1T2 4.95 13.20 1428V1T3 5.45 14.44 1637V1T4 4.75 13.45 1365V1T5 4.65 12.46 1283V1T6 4.51 12.23 1272V1T7 4.22 12.20 1247V2T1 3.72 11.81 922V2T2 4.25 12.31 1175V2T3 4.63 12.71 1261V2T4 4.15 11.78 1104V2T5 4.03 11.38 1001V2T6 4.01 11.01 1006V2T
7 3.99 10.80 970SEm+ 0.14 0.26 22CD (p=0.01) NS 2.80 NS


EFFECT OF MOISTURE CONSERVATION MEASURESAND NUTRIENT MANAGEMENT ON GROWTH OFEUCALYPTUS PELLITA IN DHARMA WATERSHED
S.N. BAMMANAHALIL1, G.V. DASAR 2 AND G.O. MANJUNATHA 3
ABSTRACTA field experiment was conducted to study the effect of moisture conservation mea-sures and fertilizer application on growth of Eucalyptus pellita in Dharma Water-shed at Sirsi Taluk, Uttara Kannada district, Karnataka during 2010-2011. The differ-ent moisture conservation structures were made in Eucalyptus pellita plantation.Growth parameters were assessed by measuring the plants at different month’sintervals. Among different treatments combination, significantly higher plant heightincrement was recorded in (Trapezoidal staggered trench with 200:100:200 N, P2O5,K2O kg/ha which was found to be the most efficient in boosting other growth param-eters such as dbh, crown diameter, number of branches and volume of Eucalyptuspellita from 3 to 12 months after treatment.
IntroductionEucalyptus is a native of Australia which
belongs to family Myrtaceae. The genus Eu-calyptus comprises of 700 species and it wasintroduced in India by Tippu Sultan the Rulerof Mysore who planted few species on Nandihills of Mysore in the late 18th century(Rajashekar et al., 2006 a). For conservationand management of water, there are manywater conservation techniques but the tech-nique that may be adopted will be based onclimatological condition of the region andsocioeconomic condition of the prople. Guptaand Muthana (1985) developed circular catch-ment of 1.5 m radius and 2 per cent sloperunoff generating areas. This technique provedeffective in improving the moisture content ofthe plant root zone. While planning and de-signing of soil conservation measures struc-ture, it is desirable to know the runoff, soilconservation structure has been very usefulin improving the growth of several species viz.,
Poplar, Eucalyptus, Acacia, etc., (FAO,1980). It also improves soil structure, soilaeration, infiltration rate, reduction in com-paction and reduces water loss from soil,check the growth of weed.
Fertilizer experiment in the forest plan-tation on the operational basis, however be-gan only in 1950s. Studies of effect on fertil-izers on Eucalyptus showed that growth canbe increased by 50 to 60 per cent (Bonny,1991). Research on fertilizer applicationshowed gains from Nitrogen even to visiblehealthy forest stand (Cromer et al., 1993).Schonau (1983) found in increase from 25 to98 m3/ha over a rotation of 10 years as a re-sult of fertilizer application in Eucalyptusgrandis plantation in South Africa. Keepingthese points in view the experiment was con-ducted to study the optimum moisture con-servation measures and fertilizer dose forEucalyptus pellita plantation.
MyForest, December, 2011Vol.47(4) Page Nos.333-341
1 Dept. of Natural Resource Management COF, Sirsi.2 Associate professor Dept. of Natural Resource Management COF, Sirsi, For correspondence.3 Associate professor Dept. of Forest Products and Utilization COF, Sirsi.
Material and methodThe experiment was conducted in the
two years old plantation of Eucalyptus pellitaat Dasankoppa village, Uttara Kannada dis-trict of Karnataka, which is situated at 140
38’ N latitude and 750.00 E longitudes and analtitude of 490m above mean sea level. Thestudy area falls under tropical climate. Theclimate is primarily monsoon during June-Sep-tember. The rainfall data was collected for theyear 2010-2011. The average annual rainfallin the experimental area was 2198.9 mm.Major portion of the rainfall in the year wasreceived from June to October. The meanannual maximum temperature varied from27.50 to 34.30 and the April month was thehottest.The mean minimum temperature var-ied from 9.70 to 20.20 C during June and Janu-ary was coldest. The experiment was laid outin Split Plot Design with three replicationswhich consisted of 4 main plot treatmentsand 4 subplot treatments. Main plot treatmentsuch as M1 - Trapezoidal Staggered Trenchsize : 60 cm top width. 30 cm bottom width.30 cm depth. 1.5 m Length M2 - Conserva-tion Pit : 45 x 30 x 30 cm M3 - Ring Trench :1.5 diameter Mr-Control. Sub plot treatments: F1 - 200:100:200 of N: P2O5 : K2O in kg/haF2 - 250:125:250 of N : P2O5 : K2O in kg/ha F3- 125:75:75 of N : P2O5 : K2O in kg/ha+FYM(5 t/ha) F4 - Control. Design followed was splitplot. Fertilizers were applied in the circularditch method. The circular ditch of 20 cmdepth, 10 cm wide and 20 cm away aroundthe plant were made with the help of pickaxeand spade. Then, the fertilizer mixtures werespread uniformly in circular ditches and weremixed properly with soil. A gross plot (8m x8m) of 16 plants were considered for eachtreatment, of which five plants were randomlytaken for observations. The observations ongrowth parameters such as plant height, dbh,crown diameter and number of primarybranches were recorded at every three monthswere recorded at every three months interval
for one year period. Volume was calculatedusing standard formula.
Result and discussionHeight increment (cm)
The trapezoidal staggered trench (M1)recorded significantly higher plant height (1.07m, 2.07m, 3.29m and 4.65m) followed by ringtrench (0.91m, 1.78m, 3.03m and 4.29m) andthe lowest was recorded in control (0.63m,1.13m, 2.21m and 3.254m) at 3,6,9 and 12months after treatments respectively. Plantheight increased significantly with applicationof fertilizers at different intervals of the growth.At 3 months after treatments, the plant heightwas (1.02m) noticed at level 200:100:200 ofN, P2O5, K2O kg/ha. Same trend was alsorecorded at 6, 9, 12 months after treatments.In overall interaction, moisture conservationmethods and fertilizer levels, M1F1 (Trapezoi-dal Staggered Trench with 200:100:200 N,P2O5, K2O kg/ha) recorded significantly higherplant height from 3 MAT (1.27m) to 12 monthsafter treatments (5.25m) as compared to othercombinations. The increased plant heightmight be due to application of optimum quan-tity of N, P2O5, K2O fertilizers further applica-tion of nitrogen might influenced chlorophyllformation in the plants, which lead to improvethe photosynthetic activity resulted in vigor-ous vegetative growth and development ofplant Mutanal (1998).
Dbh increment (cm)
The plant diameter increased from 0.47cm to 4.48 cm while passing through differ-ent diameter increment from 3 to 12 monthsafter treatments. Moisture conservation meth-ods and fertilizers levels, M1F1 (TrapezoidalStaggered Trench with 200:100:200 N, P2O5,K2O kg/ha) recorded significantly higher plantdiameter increment from 3 months after treat-ments (1.545 cm) to 12 months after treat-ments (4.48 cm) compared to other combi-nations followed by M1F2 (Trapezoidal Stag-
MyForest December 2011
335
gered Trench with 250:125:250 N, P2O5, K2Okg/ha) (1.40 cm at 3 MAT to 4.28 cm at 12months after treatments) and lowest was re-corded in control from (0.47 cm at 2 monthsafter treatments). An increased plant heightand DBH could be due to higher soil mois-ture available soil moisture during dry sea-son might have favoured the nutrient absorp-tion by plants, which in turn resulted in higherplant height and DBH. Soil moisture conser-vation measures and nutrient managementinfluence plant height and DBH growth(Kushalappa, 1987).
Crown diameter
Moisture conservation methods and fer-tilizers levels, M1F1 (Trapezoidal staggeredtrench with 200:100:200 N, P2O5, K2O kg/ha)recorded significantly higher crown diameterincrement from 3 months after treatments(2.28 cm) to 12 months after treatments(10.86 cm) compared to other combinationsfollowed by M1F2 (2.16 cm at 3 months aftertreatments) and lowest was recorded in con-trol (0.61 cm at 3 months after treatments to2.68 cm at 12 months after treatments). Anincrease in crown diameter increment mightbe due to higher soil moisture available in trap-ezoidal staggered trench. Higher per cent ofavailable soil moisture during dry seasonmight have favoured the nutrient adsorptionby plants, which in turn resulted in highercrown diameter (Nand Kishore, 1987).
Number of branches
The number of branches increased from2.80 to 25.33 while passing through differentgrowth stages from 3 to 12 months after treat-ments. In overall interaction i.e. moisture con-servation methods and fertilizers levels, M1F1(Trapezoidal Staggered Trench with200:100:200 N, P2O5, K2O kg/ha) recordedsignificantly higher number of branches from3 months after treatments (8.50) to 12 monthsafter treatments (25.33) compared to other
combinations followed by trapezoidal stag-gered trench with 250:125:250 N, P2O5 K2Okg/ha (8.16 at 3 months after treatments to24.50 at 12 months after treatments) and low-est was recorded in control (2.80 at 3 monthsafter treatments to 10.86 at 12 months aftertreatments). Increased number of branchescan be attributed to increased availability ofnutrients might have resulted in increasedproduction of photosynthetic and their trans-location into branches and leaves. These re-sults are in conformity with the findings ofHulikatti and Madiwalar (2011).
Volume increment
Moisture conservation methods and fer-tilizers levels, M1F1 (Trapezoidal StaggeredTrench with 200:100:200 N, P205, K2O kg/ha)recorded significantly higher volume incre-ment from 3 months after treatments (0.233m3/ha) to 12 months after treatments (10.02m3/ha) compared to other combinations fol-lowed by M1F2 (0.183 m2 at 3 months aftertreatments to 8.713 m3 at 12 months aftertreatments) and the lowest was recorded incontrol (0.010 at 3 months after treatmentsto 0.513 m2/ha at 12 months after treatments).Trapezoidal staggered trench resulted inhigher volume production, which was attrib-uted to the higher levels of soil moisture con-tent. The increase in soil moisture content.The increase in soil moisture leads to increasein the availability of minerals and these min-erals were utilized by the plants and the pho-tosynthetic activity of the plant is increasedthus resulting in the higher biomass produc-tion. Concurrent views have been expressedin relation to growth parameters of teak(Wasan et al., 1975). Hence the Trapezoidalstaggered trench with 200:100:200 N, P2O5,K2O kg/ha application was found to be mostefficient in boosting growth parameters suchas height, dbh, crown diameter, number ofbranches and volume of Eucalyptus pelllitafrom 3 to 12 months after treatments.

MyForest December 2011
336
Reference
Bonny, L., (1991), Growth of Eucalyptusgrandis plantation following intensive sil-vicultural treatments applied in the sixyears. Forest Commission, New SouthWales, p. 19.
Cromer, R.N., Cameron, D.M. Rance, S. J.,Ryna, P.A. and Brown, M., (1993), Re-sponse to nutrients in Eucalyptusgrandis L. Biomass Accumulation forEcology Management 62: 211-230.
FAO., (1980), Poplars and Willows in the woodproduction and land use. InternationalPopular Commission. FAO, ForestrySeries No. 10.
Gupta J.P. and Muthana, K.D., (1985), Effectof Integrated moisture conservationtechnology on nthe early growth and es-tablishment of Acacia tortilis in the In-dia desert. Indian For., 111(4):477-485.
Hulikatti, M.B. and Madiwalar. S.L., (2011),Management Strategies to enhancegrowth and productivity of Acaciaauriculiformis. Karnataka J. Agric.Sci., 24 (2) : 2004-2006.
Kushalappa, K.A., (1987), Short note ontrenching in teak plantation, My Forest,23 (1): 25-27.
Mutanal, S.M., (1998), Studies on Teak basedagro forestry system and fertigationPh.D. Thesis, Univer. Agric. Sci.Dharwad (India).
Nand Kishore, (1987), Priliminary studies onthe effect of phosphate fertilizer on teakplantation. Indian Forest., 113(6):392-394.
Rajashekar Karajagi., Basavaraj. Banakar.,Naik, A.D. and Kunal, L.B., (2006), pro-jection of supply and demand for Euca-lyptus in Karnataka. My Forest., 42(3): 255-259.
Schonau, A.P.G., (1983), Fertilization in SouthAfrican Forestry. South African For. J.,100 : 27-31.
Wasan, Kaitpraneet, Bunvong. and Thaiutsa.,(1975), Some chemical properties ofsoil at Kiang Dong Teak plantationNakornrachasima province. ResearchNote, Faculty of Forestry, Thailand No.75, p.15.

MyForest December 2011
337
Table 1 - Effect of moisture conservation measures and fertilizerson height increment (m) of Eucalyptus pellita
Treatments Plant Height increment (m) at differentintervals
Main Plots (M) 3 MAT 6MAT 9 MAT 12 MATTrapezoidal Staggered Trench (M1) 1.07 2.07 3.29 4.65Conservation Pit (M2) 0.80 1.51 2.73 3.85Ring Trench (M3) 0.91 1.78 3.03 4.29Control (M4) 0.63 1.13 2.21 3.24SEm + 0.01 0.01 0.02 0.08CD (5%) 0.03 0.03 0.7 0.28Subplots (F)200:100:200 NP2O5K2O kg/ha (F1) 1.02 1.99 3.21 4.55250:125:250 NP2O5K2O kg/hr (F2) 0.94 1.78 3.05 4.28125:75:75 NP2O5K2Okg/ha+FYM(5)t/ha(F3) 0.85 1.67 2.88 4.05Control (F4) 0.60 1.05 2.11 3.16SEm + 0.01 0.01 0.02 0.08CD (5%) 0.03 0.04 0.06 0.24Interaction (M x F)M1F1 1.27 2.46 3.65 5.25M1F2 1.18 2.28 3.53 5.00M1F3 1.05 2.11 3.31 4.66M1F4 0.77 1.45 2.65 3.70M2F1 0.91 1.81 3.06 4.25M2F2 0.86 1.70 2.96 4.10M2F3 0.83 1.62 2.85 4.01M2F4 0.60 0.93 2.03 3.03M3F1 1.10 2.17 3.40 4.85M3F2 0.98 1.84 3.23 4.51M3F3 0.93 1.85 3.16 4.40M3F4 0.65 1.25 2.33 3.41M4F1 0.80 1.52 2.73 3.86M4F2 0.75 1.32 2.49 3.50M4F3 0.60 1.10 2.21 3.13M4F4 0.38 0.58 1.41 2.48SEm + 0.02 0.03 0.03 0.17CD (5%) 0.06 0.09 0.10 0.50
MAT - Months after treatment

MyForest December 2011
338
Table 2 - Effect of moisture conservation measures and fertilizerson DBH increment (m) of Eucalyptus pellita
Treatments DBH increment (m) at different intervalsMain Plots (M) 3 MAT 6MAT 9 MAT 12 MATTrapezoidal Staggered Trench (M1) 1.21 2.13 2.89 3.94
Conservation Pit (M2) 0.85 1.66 2.17 3.13Ring Trench (M3) 1.04 1.90 2.56 3.63
Control (M4) 0.64 1.26 1.72 2.57
SEm + 0.05 0.03 0.01 0.02CD (5%) 0.16 0.10 0.04 0.06
Subplots (F)200:100:200 NP2O5K2O kg/ha (F1) 1.16 2.88 2.78 3.84
250:125:250 NP2O5K2O kg/hr (F2) 1.05 1.92 2.59 3.62125:75:75 NP2O5K2Okg/ha+FYM(5)t/ha(F3) 0.93 1.78 2.38 3.39
Control (F4) 0.60 1.17 1.60 2.43
SEm + 0.04 0.02 0.02 0.03CD (5%) 0.12 0.06 0.06 0.08
Interaction (M x F)M1F1 1.54 2.51 3.40 4.48
M1F2 1.40 2.32 3.20 4.28M1F3 1.18 2.16 2.90 3.96
M1F4 0.75 1.53 2.06 3.06
M2F1 1.02 1.93 2.51 3.53M2F2 0.86 1.70 2.96 4.10
M2F3 0.96 1.86 2.42 3.40M2F4 0.88 1.76 2.28 3.28
M3F1 0.55 1.10 1.48 2.33
M3F2 1.28 2.20 3.03 4.18M3F3 1.14 2.08 2.77 3.83
M3F4 0.65 1.32 1.82 2.82M4F1 0.81 1.65 2.17 3.19
M4F2 0.70 1.43 1.95 2.99M4F3 0.57 1.21 1.70 2.63
M4F4 0.47 0.75 1.04 1.49
SEm + 0.07 0.03 0.03 0.06CD (5%) 0.22 0.10 0.10 0.17
MAT - Months after treatment

MyForest December 2011
339
Table 3 - Effect of moisture conservation measures and fertilizerson crown diameter increment in Eucalyptus pellita
Treatments Crown diameter increment (m) atdifferent intervals
Main Plots (M) 3 MAT 6MAT 9 MAT 12 MATTrapezoidal Staggered Trench (M1) 1.92 3.74 6.60 10.13Conservation Pit (M2) 1.31 3.05 5.64 9.07Ring Trench (M3) 1.65 3.40 6.17 9.62Control (M4) 1.00 2.08 4.38 7.20SEm + 0.22 0.05 0.11 0.10CD (5%) 0.67 0.18 0.34 0.32Subplots (F)200:100:200 NP2O5K2O kg/ha (F1) 1.79 3.72 6.47 9.98250:125:250 NP2O5K2O kg/hr (F2) 1.65 3.37 6.19 9.68125:75:75 NP2O5K2Okg/ha+FYM(5)t/ha(F3) 1.48 3.18 5.89 9.33Control (F4) 0.96 1.99 4.23 7.03SEm + 0.21 0.03 0.07 0.08CD (5%) 0.62 0.08 0.21 0.24Interaction (M x F)M1F1 2.28 4.33 7.26 10.86M1F2 2.16 4.13 7.10 10.63M1F3 1.96 3.73 6.63 10.06M1F4 1.27 2.76 5.44 8.95M2F1 1.57 3.60 6.18 9.64M2F2 1.43 3.34 5.95 9.43M2F3 1.34 3.18 5.78 9.26M2F4 0.91 2.08 4.64 7.95M3F1 2.05 4.08 6.86 10.33M3F2 1.85 3.64 6.50 9.88M3F3 1.67 3.66 6.31 9.75M3F4 1.05 2.24 5.00 8.53M4F1 1.25 2.89 5.59 9.10M4F2 1.17 2.38 5.22 8.78M4F3 0.96 2.17 4.85 8.24M4F4 0.61 0.87 1.85 2.68SEm + 0.41 0.06 0.13 0.17CD (5%) 1.22 0.18 0.39 0.51
MAT - Months after treatment
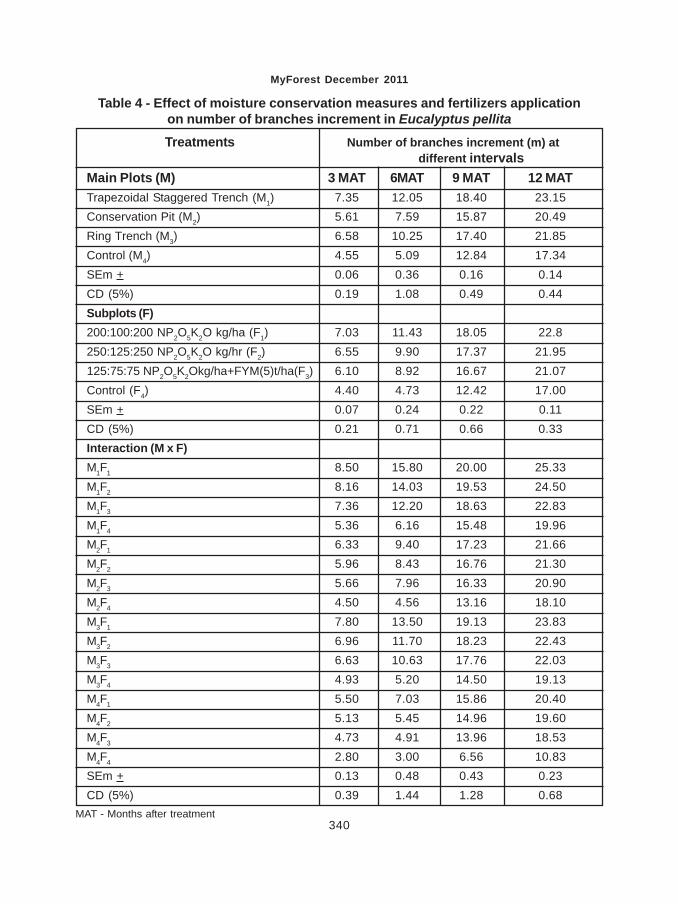
MyForest December 2011
340
Table 4 - Effect of moisture conservation measures and fertilizers applicationon number of branches increment in Eucalyptus pellita
Treatments Number of branches increment (m) atdifferent intervals
Main Plots (M) 3 MAT 6MAT 9 MAT 12 MATTrapezoidal Staggered Trench (M1) 7.35 12.05 18.40 23.15Conservation Pit (M2) 5.61 7.59 15.87 20.49Ring Trench (M3) 6.58 10.25 17.40 21.85Control (M4) 4.55 5.09 12.84 17.34SEm + 0.06 0.36 0.16 0.14CD (5%) 0.19 1.08 0.49 0.44Subplots (F)200:100:200 NP2O5K2O kg/ha (F1) 7.03 11.43 18.05 22.8250:125:250 NP2O5K2O kg/hr (F2) 6.55 9.90 17.37 21.95125:75:75 NP2O5K2Okg/ha+FYM(5)t/ha(F3) 6.10 8.92 16.67 21.07Control (F4) 4.40 4.73 12.42 17.00SEm + 0.07 0.24 0.22 0.11CD (5%) 0.21 0.71 0.66 0.33Interaction (M x F)M1F1 8.50 15.80 20.00 25.33M1F2 8.16 14.03 19.53 24.50M1F3 7.36 12.20 18.63 22.83M1F4 5.36 6.16 15.48 19.96M2F1 6.33 9.40 17.23 21.66M2F2 5.96 8.43 16.76 21.30M2F3 5.66 7.96 16.33 20.90M2F4 4.50 4.56 13.16 18.10M3F1 7.80 13.50 19.13 23.83M3F2 6.96 11.70 18.23 22.43M3F3 6.63 10.63 17.76 22.03M3F4 4.93 5.20 14.50 19.13M4F1 5.50 7.03 15.86 20.40M4F2 5.13 5.45 14.96 19.60M4F3 4.73 4.91 13.96 18.53M4F4 2.80 3.00 6.56 10.83SEm + 0.13 0.48 0.43 0.23CD (5%) 0.39 1.44 1.28 0.68
MAT - Months after treatment

MyForest December 2011
341
Table 5 - Effect of moisture conservation measures and fertilizers onvolume increment (m3/ha) in Eucalyptus pellita
Treatments Volume increment (m3/ha) at differentintervals
Main Plots (M) 3 MAT 6MAT 9 MAT 12 MATTrapezoidal Staggered Trench (M1) 0.147 0.922 2.795 7.225Conservation Pit (M2) 0.060 0.450 1.310 3.801Ring Trench (M3) 0.110 0.570 2.050 5.665Control (M4) 0.027 0.195 0.699 2.285SEm + 0.01 0.04 0.05 0.08CD (5%) 0.03 0.13 0.18 0.24Subplots (F)200:100:200 NP2O5K2O kg/ha (F1) 0.129 0.741 2.515 6.694250:125:250 NP2O5K2O kg/hr (F2) 0.101 0.687 2.090 5.652125:75:75 NP2O5K2O kg/ha+FYM(5)t/ha(F3) 0.078 0.534 1.669 4.699Control (F4) 0.035 0.175 0.580 1.970SEm + 0.01 0.04 0.03 0.06CD (5%) 0.03 0.13 0.10 0.17Interaction (M x F)M1F1 0.233 1.316 4.036 10.02M1F2 0.183 1.150 3.463 8.713M1F3 0.130 0.850 2.626 6.903M1F4 0.043 0.373 1.050 3.266M2F1 0.086 0.603 1.833 5.080M2F2 0.076 0.640 1.633 4.453M2F3 0.060 0.453 1.356 4.086M2F4 0.016 0.106 0.420 1.586M3F1 0.153 0.673 3.000 8.050M3F2 0.123 0.726 2.376 6.333M3F3 0.103 0.686 2.103 5.763M3F4 0.073 0.193 0.723 2.516M4F1 0.053 0.370 1.190 3.626M4F2 0.033 0.236 0.890 2.960M4F3 0.020 0.143 0.586 2.043M4F4 0.010 0.03 0.13 0.513SEm + 0.02 0.09 0.07 0.12CD (5%) 0.06 0.25 0.21 0.35
MAT - Months after treatment

IntroductionForests have been the integral part of
human society since time immemorial. Mostof the civilizations started where the sourceof water was in abundance. It was the adjoin-ing forest that were the perennial source orareas for collection and replenishment of wateras they were one of the most important com-ponents in hydrological cycle. As the timeprogressed, the forests were not only utillizedfor its wood, but also for its various produces.Gradually, the exploitation of this forest re-source resulted in dwindled forest area whichwas a cause of concern, The conservation-ists came into the fore and started hinting atthe extent of loss in flora and fauna due tovarious activities of mankind. In the process,considerable number of plants and animalswere extinct and large numbers of others werepushed into different categories such asthreatened or vulnerable. Realising the harshfact, it was also felt that same of the impor-tant species needs to be studied speciallywith reference to its introduction orperformence in areas other than their naturalhabitat. Human intervention in such situationhas also proved the possibilities of achievingsuccess in species survival and growth.Though, it is a debatable issue but consider-ing the species susceptibility in its own back-yard bue to human exploitation primarily interms of illegal harvest, the option of spread-ing the species far and wide in those hithertowhere it has not grown will always remain asone of the most suitable option.
There is now sufficient research to show
that native hardwood timber species can besuccessfully established where the aim islong-term specialist timber production. Manyof these species will grow successfully out-side their natural range with appropriate siteselection and establishment practices. Whiletheir ecology makes them suitable forsustainably managing as either single ormixed species in even or uneven-aged plantedstands where future harvesting will involve low-impact selection logging techniques.
One such species conveniently fallingin such fragile situation is Pterocarpussantalinus, popularly known as indigenousspecies which is endemic to parts of AndhraPradesh and Tamil Nadu. Red sanders woodis highly valued and is being over exploited.Therefore it is imperative that such specieshas to be protected and utilized and the bestoption is to spread the cultivation of this treespecies far and wide. Therefore, wheneversuch species are introduced in areas otherthan its endemic habitat, it is of general aswell as research interest to see how the spe-cies survives, grows and performs. KarnatakaForest Department has always been a pio-neer in forestry research and shown consid-erable interest in conducting species trial asone of the process in tree improvementprogramme and Pterocarpus santalinus hasalso been a prioritized species and planta-tions have been established in Kolar, Banga-lore and Mandya. To assess the status andresponse of this species in the introducedareas, this project was taken up with follow-ing objectives -
VARIABILITY STUDIES IN PTEROCARPUS SANTALINUSIN DIFFERENT AGED PLANTATIONS OF KARNATAKA
DR. A. N. ARUNKUMAR
MyForest, December, 2011Vol.47(4) Page Nos.343-353
Scientist - D, Institute of Wood Science & Technology, Malleswaram, 18th Cross, Bangalore-560 003.
MyForest December 2011
344
To document variability in growthparametersTo document variability in heart wood,sapwood, bark thicknessTo establish relationship betweengirth and heartwood, if any.
Species description
Pterocarpus santalinus is a deciduoustree, attaining a girth of 1.5-1.9 m, and height9-11 m. The bark is purple and exudes a deepred juice when cut. Leaves are usuallyimparipinnate, leaflets are three and rarely five.Flowers are large and yellow, bisexual, insimple or sparingly branched racemes (Singh,1997). In its natural habitat, the trees flowerfrom March to late May, during the dry sea-son (Rao and Raju, 2002). Pods are 3-8 cmin diameter including the wing. Seeds arereddish brown, smooth, leathery (Singh,1997) and produced prolifically. The wood ofmost trees has a normal grain, and there isalso ‘wavy grain’ which is rare. Efforts hasbeen made to distinguish trees with wavy-grained wood from others using morphologi-cal characteristics (Das and Dayanand, 1984)however Rao and Raju (1992) are of the opin-ion that there does not appear any morpho-logical differences between the normal andwavy-grained trees. As the tree grows inharsh conditions, the growth rate is consid-erably slow. The tree produces profuse seedsand regeneration is not a problem. The treeis said to regenerate well from coppicing, anda 40 year coppice rotation said to be prac-tised in India (Green, 1995).
Distribution:
Red sanders is considered as endemicto India in the southern parts of the EasternGhats in the states of Andhra Pradesh andTamil Nadu (Jain and Rao, 1983). Accordingto Andhra Pradesh Forest Development Cor-poration, it approximately grows in 50,000 haof forest area in Cuddapah, Chittor, Kurnool,
and Nellore districts. According to Rao andRaju (2002), however, it is limited to Cuddapahand Kurnool districts in that state. The spe-cies occurs in the Arcot and Chengalpattudistricts to Tamil Nadu. The natural range isrestricted to typically dry, hilly, often rockyground, at altitudes of 150-900 m (Anon,1994), in areas receiving around 100 mm ofrain in each of the two annual monsoons.P. santalinus does not tolerate overheadshade or waterlogged conditions (Rao andRaju, 2002).
Population status and threats:
Pterocarpus santalinus was classifiedas Endangered in the 1997 IUCN Red List ofThreatened Plants. The species is similarlyassessed as Endangered in the World Listof Threatened Trees (Oldfield et al., 1998) andthe 1994 IUCN Red list due to its small range,fragmented populations and continuing de-cline. Rao and Raju (2002) consider habitatalteration to be the primary threat. Habitat inthe Central Deccan Plateau is consideredunder severe threat from conversion to cashcrop plantations, fuel wood collection, andovergrazing by cattle (Rawat et al., 2001).
The Government of India considered bothlegal and il legal trade threateningP. santalinus and proposed it for inclusion inCITES Appendix II, with its restricted distri-bution and slow generation rate increasingthe level of threat (Anonymous, 1994). How-ever, various initiatives have been taken byAndhra Pradesh Forest Department for thisspecies to thrive and become more popular.
The heartwood, its derived extracts andpowders are the main produce used for vari-ous purpose. The heartwood of P. santalinus(which consists anti diabetic constituentPtersostilbene) is made as a cup and thewater soaked overnight in this cup is con-sumed n the morning to control diabetes. Itis also considered to be astringent, tonic
MyForest December 2011
345
disphoretic, antibilious, antiinflammatory,emetic, febrifuge, in treating boils, scorpion-stings and in skin diseases (Traffic India, 1998).
Uses:
The heartwood of this species is usedin the making of furniture, carvings and musi-cal instruments. In Japan, the heartwood isused to make musical instruments, ‘hankos’(name seals), frames, traditional dishes andcarvings (Kiyono, 2005). Timber with a ‘wavy’grain is in particularly high demand in Japanfor the manufacture of the musical instrumentthe ‘shamisen’, a three-stringed lute used inclassical music. In general, only the neck ofthe shamisen is made of P. santalinus. Theheartwood is also used to produce red pig-ments, specifically santalin, which is used inthe furniture and crafts industry and as acolouring agent in cosmetics and food(Oldfield et al., 1998).
P. santalinus is approved as a food dyefor alcoholic beverages in the USA (Henry,2005), and is approved as a food dye withinEurope, where it has been classified as a“spice extract” rather than a food colourant(Green, 1995). It has therefore not been as-signed an ‘E number’, with the effect that itspresence does not have to be declared onpackaging. It has been imported into Ger-many in the form of powder or as an extract(oleoresin). The species is used in incense,although having little scent of its own; it isused primarily as a base powder. In India,inferior wood is sold as fuel and also for char-coal. The leaves are used for cattle fodder(Green, 1995). In Myanmar, it is used in fragrancesand scented (incense) sticks (Khin, 1995).
Material and method:To achieve the objectives of this study,
preliminary survey was carried out at Nallalof Hoskote Range and Yeshwanthpur area ofKolar Range. However, these plantations werenot considered as most of the trees did not
have clear bole. Therefore, a plantation es-tablished in 1988 at Jarakbande A Block, (Re-search Range Office, Bangalore) was con-sidered for the study. The spacing was 3x3meters and the trees in the plot were measuredfor girth and height. The second plantationconsidered for the study was identified atHulikere, (Mandya Range, Mandya Division)which was established way back in 1963-35.
Core samples were collected using in-crement borer to estimate the bark, sapwoodand heartwood percentage. Two core samplesfrom each tree were drawn at breast height(1.37m) at right angles to each other. Fromthe core samples, heartwood radius, sapwoodradius and bark thickness was estimated (byconverting the tree girth to tree diameter) andpercentage was calculated.
Soil samples were collected from boththe locations and following is the analysis ofvarious soil parameters.
ResultsVariability in girth, heartwood, sapwoodand bark percentage
The present study was primarily aimedat documenting the variability for girth and alsoheartwood content. Field measurements wererecorded for girth at breast height and fromthe core samples collected, heartwood, sap-wood and bark variation was estimated.
Jarakbande ‘A’ Block
Girth data was collected from 130 treesand average girth of the population was49.84cm with a coefficient of variation of19.58% (Table-2). The minimum and maxi-mum girth was 25 and 79cm respectively.
Using the core samples, bark, sapwoodand heartwood percentage was calculated andvariability for these traits is detailed in table-3. Bark percentage at the end of 20 years
MyForest December 2011
346
was 54.52% and ranged from 22.86 to89.51%. Heartwood percentage ranged from0 to 65.71%. Coefficient of variation valuesfor bark, sapwood and heartwood percentagewas 23.88, 33.96 and 72.35% giving an indi-cation of the variability in the population. Thehigh coefficient of variation value for heartwoodpercentage can be attributed to the fact thattrees without heartwood formation wree alsoincluded. Out of the 130 trees studied, heart-wood had formed in 98 trees. For a betterinsight of the population behaviour, it is evi-dent from Table-4 that there was marginalincrease in tree girth and the average in-creased from 49.84 cm (n = 130) to 52.36cm (n = 98) by considering only those treeshaving heartwood.
Bark thickness did not significantlychange, but sapwood and heartwood percent-age changed considerably (Table-5). Themean sapwood percentage reduced from54.52 (n = 130) to 45.68 (N = 98) in case ofsapwood percentage and expectedly in-creased from 26.34 (N = 130) to 35.66 (N =98). Among the trees having heartwood con-tent the lowest heartwood percentage was3.36% and the maximum was 65.71%. Thiswide variability in heartwood percentage canbe used as a trait while selecting genotypesof similar age.
Considering the number of trees with-out heartwood across various girth classes,(Fig.-1) maximum number of trees withoutheartwood content was observed in thosetrees having < 40 cms girth. It is also inter-esting to note that heartwood formation hadnot been initiated in one of the trees having55-60 cm girth class suggesting the complexnature of heartwood formation and its intiationin trees.
Hulikere
Girth data was collected from 98 treesand average girth was 73.83cms with a coef-
ficient of variation of 20.68% (Table-6). Theminimum and maximum girth was 37 and111cms respectively. The maximum growthrate in this area was estimated to be 2.58cm.
Using the core samples, bark, sapwoodand heartwood percentage was calculated andvariability for these traits is detailed in Table-7. Bark percentage varied from 3.81 to20.26% with a mean of 8.88%. The meansapwood percentage at the end of 20 yearswas 30.75% and ranged from 10.70 to87.02%. Heartwood percentage had a maxi-mum value of 81.95%. Coefficient of variationvalues for bark, sapwood and heartwood per-centage was 33.78, 48.21 and 25.90% givinga clear indication of the extent of variation inthe population. In 96.93% of the trees, heart-wood and those trees in which heartwoodcontent was absent were with the girth of 37,46 and 58cms. It is evident from Table-8 thatthe coefficient of variation value for bark sap-wood and heartwood percentage had reducedconsiderably to 30.82, 39.99 and 18.49% re-spectively. In general it is found that heart-wood formation has occured in most of thetrees in this plantation and those trees nothaving heartwood may be younger aged trees.
Relationship between girth, heartwoodand sapwood:
To establish a relationship betweengirth, heartwood, sapwood and bark forJarakbande population, correlation matrix(Table-9) reveals that girth had positively sig-nificant relationship with heartwood and nega-tively significant relationship with sapwood andgirth. As expected there was a strong signifi-cant negative relationship between heartwoodand sapwood.
Similar relationship is observed in caseof Hulikere. It is evident that the positive lin-ear relationship between girth and heartwoodis stronger as the tree age increases as evi-
MyForest December 2011
347
dent from Table-10.
Considerable variability has been re-corded for the tree girth at Jarakbande A Blockand Hulikere. Heartwood percentage washighly variable at Jarakbande A Block com-pared to Hulikere. Significant positive relation-ship has been observed for girth and heart-wood content in both the study area.
Summary and conclusion:Pterocarpus santalinus (Redsanders) is
a highly valued threatened endemic tree spe-cies native to parts of Andhra Pradesh andTamil Nadu. Karnataka Forest Department inits tree improvement programme had estab-lished plantations of this important as a spe-cies trial. Two plantations aged 20 and 45years were taken for the study to record thegrowth variability for girth and alsocommercialy valuable heartwood content soas to arrive at the feasibility of growing thisimportant species from commercial s well asconservation perspective.
Preliminary results indicate that consid-erable variability exists for girth and heartwoodcontent in the younger aged plantation at
Jarakbande ‘A’ Block. It was found that heart-wood formation had not been initiated in treesless than 30 cm girth and there was a strongrelationship between girth and heartwood inboth the plantations.
Following is the research findings of thestudy :
• Heartwood formation has been ob-served at 20 years.
• Considerable variation exists withina given aged plantation.
• Heartwood content was observed in70% of the trees in 20 year old plan-tation and 97% of the trees in caseof 45 year old plantation.
• Significant positive relationship ex-ist between girth and heartwood con-tent.
• While selecting genotypes for su-perior heartwood content, it is es-sential to select it from those plan-tations which are 20 to 25 year oldwhen the variability is at its best.
• Red sanders plantations can be fur-ther established in Kolar, Bangaloreand Mandya districts of Karnataka.
References :
Anonymous (1994) : Inclusion of Pterocarpussantalinus in Appendix II. Governmentof India.
Das, T.L. and Dayanand T. (1984) : Somedistinguishing characteristics betweenwavy-gained and straight-grained treesof Red Sanders (Pterocarpus santalinusLinn. F.). Indian Journal of Forestry7(1) : 69-71.
Green, C.L. (1995) : Natural colorants anddye stuff. - 116 pp., FAO, Rome, Italy(Non-wood forest products 4).
Henry L., TRAFFIC North America (2005) : Inlitt. to TRAFFIC International im/
im0201_full.html.
Jain, S.K. and Rao, R.R. (Eds.) (1983) Anassessment of threatened plants of In-dia. Proceedings fo the seminar held atDehradun, 14-17.09.1981. - xiii+334 pp.,Botanical Survery of India, Dept. Envi-ronment, Howrah, India.
Khin Maung Lwin (1995) : Non-wood forestproducts in Myanmar. In : Durst, P.B.and Bishop, A. (Eds.) : Beyond timber.Social, economic and cultural dimen-sions of non-wood forest products inAsia and the Pacific. pp. 227-234, FAORegional Office Asia and the Pacific,Bangkok, Thailand (RAP Publication1995/13).
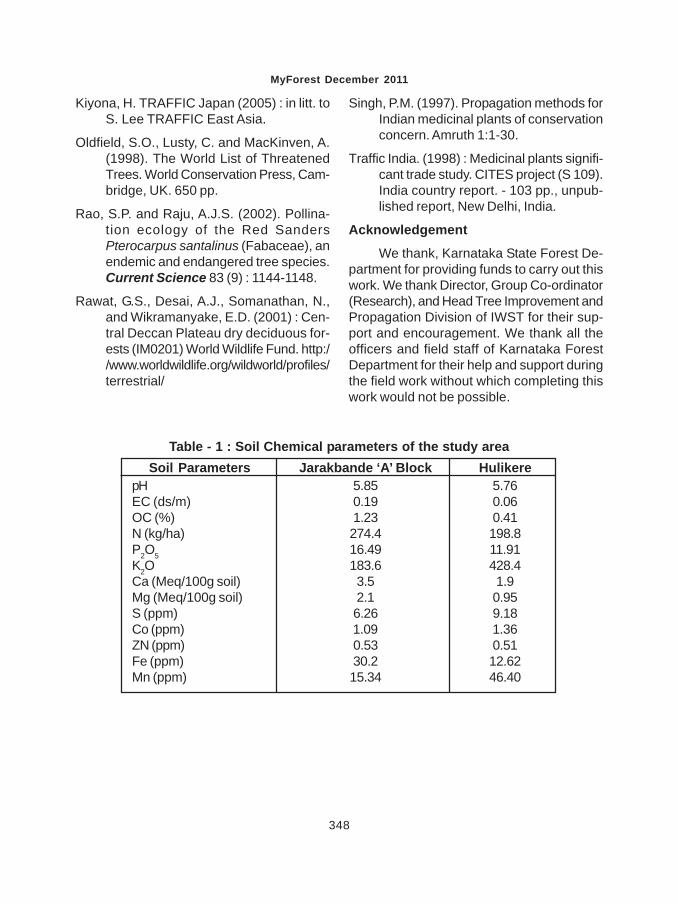
MyForest December 2011
348
Kiyona, H. TRAFFIC Japan (2005) : in litt. toS. Lee TRAFFIC East Asia.
Oldfield, S.O., Lusty, C. and MacKinven, A.(1998). The World List of ThreatenedTrees. World Conservation Press, Cam-bridge, UK. 650 pp.
Rao, S.P. and Raju, A.J.S. (2002). Pollina-tion ecology of the Red SandersPterocarpus santalinus (Fabaceae), anendemic and endangered tree species.Current Science 83 (9) : 1144-1148.
Rawat, G.S., Desai, A.J., Somanathan, N.,and Wikramanyake, E.D. (2001) : Cen-tral Deccan Plateau dry deciduous for-ests (IM0201) World Wildlife Fund. http://www.worldwildlife.org/wildworld/profiles/terrestrial/
Singh, P.M. (1997). Propagation methods forIndian medicinal plants of conservationconcern. Amruth 1:1-30.
Traffic India. (1998) : Medicinal plants signifi-cant trade study. CITES project (S 109).India country report. - 103 pp., unpub-lished report, New Delhi, India.
Acknowledgement
We thank, Karnataka State Forest De-partment for providing funds to carry out thiswork. We thank Director, Group Co-ordinator(Research), and Head Tree Improvement andPropagation Division of IWST for their sup-port and encouragement. We thank all theofficers and field staff of Karnataka ForestDepartment for their help and support duringthe field work without which completing thiswork would not be possible.
Table - 1 : Soil Chemical parameters of the study areaSoil Parameters Jarakbande ‘A’ Block Hulikere
pH 5.85 5.76EC (ds/m) 0.19 0.06OC (%) 1.23 0.41N (kg/ha) 274.4 198.8P2O5 16.49 11.91K2O 183.6 428.4Ca (Meq/100g soil) 3.5 1.9Mg (Meq/100g soil) 2.1 0.95S (ppm) 6.26 9.18Co (ppm) 1.09 1.36ZN (ppm) 0.53 0.51Fe (ppm) 30.2 12.62Mn (ppm) 15.34 46.40

MyForest December 2011
349
Table - 2 : Descriptive statistics for girth (cm) for the treesgrown in Jarakbande ‘A’ Block (n = 130)
Girth (cm)Mean 49.84Median 49.00SD 9.76CV (%) 19.58Skewness 0.69Kurtosis 0.73Range 54Minimum 25Maximum 79
Table - 4 : Descriptive statistics for girth (cm) for the trees withheartwood grown in Jarakbande ‘A’ Block (n = 98)
Girth (cm)Mean 52.36Median 51.00SD 9.47CV (%) 18.08Skewness 0.76Kurtosis 0.48Range 47.00Minimum 32.00Maximum 79.00
Table - 3 : Descriptive statistics for bark, sapwood and heartwoodpercentage for the trees grown in Jarakbande ‘A’ Block (n = 130)
Bark (%) Sapwood Heartwood(%) (%)
Mean 19.14 54.52 26.34Median 18.74 48.51 30.63SD 4.57 18.52 19.05CV 23.88 33.96 72.35Skewness 0.99 0.31 -0.25Kurtosis 2.58 1.22 -1.25Range 28.44 66.65 65.71Minimum 10.59 22.86 00.00Maximum 38.93 89.51 65.71
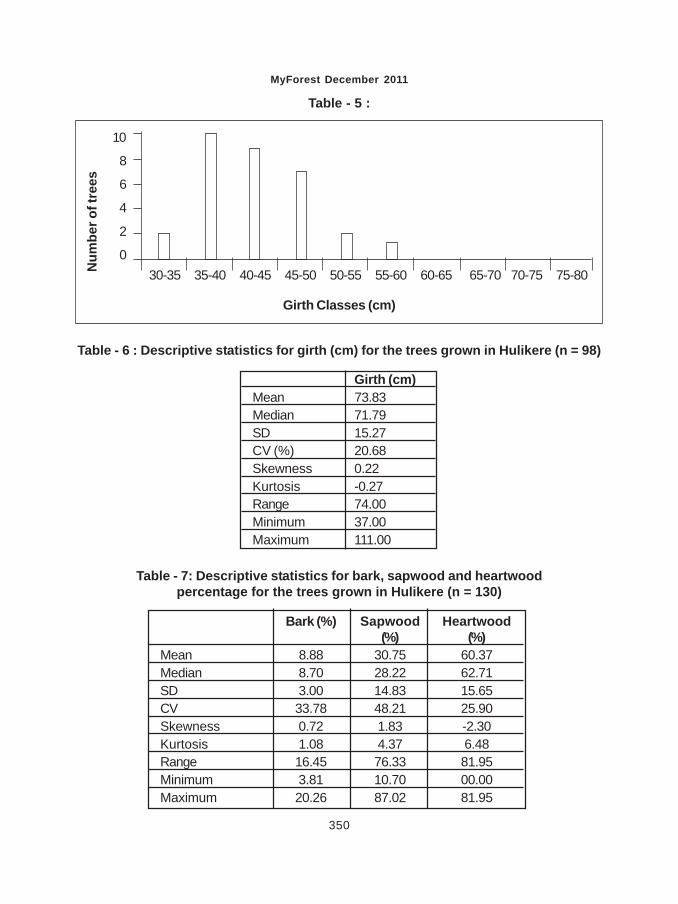
MyForest December 2011
350
Table - 5 :N
umbe
r of t
rees
Girth Classes (cm)
10
8
6
4
2
030-35 35-40 40-45 45-50 50-55 55-60 60-65 65-70 70-75 75-80
Table - 6 : Descriptive statistics for girth (cm) for the trees grown in Hulikere (n = 98)
Girth (cm)Mean 73.83Median 71.79SD 15.27CV (%) 20.68Skewness 0.22Kurtosis -0.27Range 74.00Minimum 37.00Maximum 111.00
Table - 7: Descriptive statistics for bark, sapwood and heartwoodpercentage for the trees grown in Hulikere (n = 130)
Bark (%) Sapwood Heartwood(%) (%)
Mean 8.88 30.75 60.37Median 8.70 28.22 62.71SD 3.00 14.83 15.65CV 33.78 48.21 25.90Skewness 0.72 1.83 -2.30Kurtosis 1.08 4.37 6.48Range 16.45 76.33 81.95Minimum 3.81 10.70 00.00Maximum 20.26 87.02 81.95
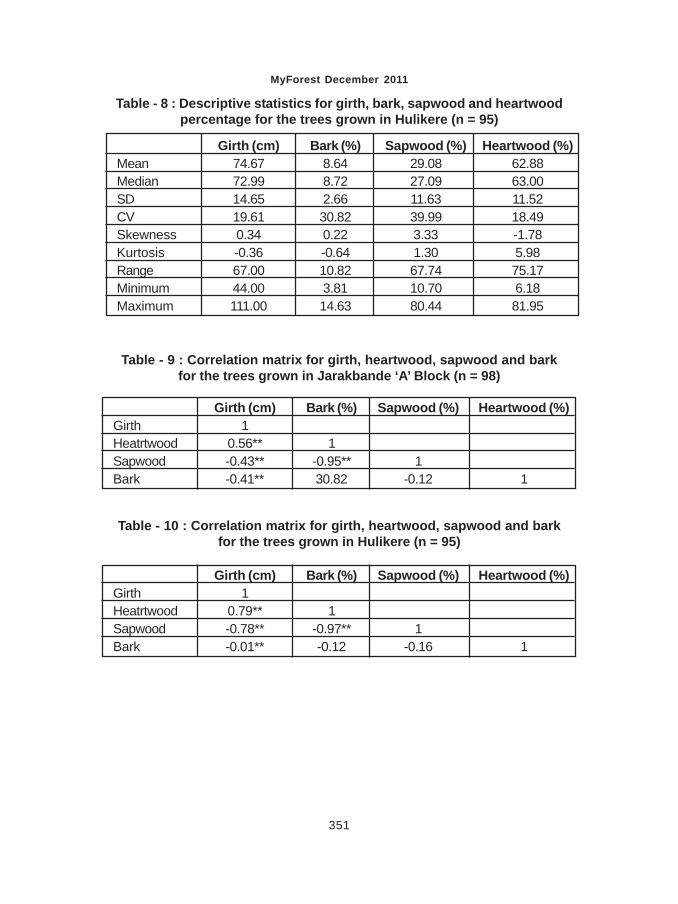
MyForest December 2011
351
Table - 8 : Descriptive statistics for girth, bark, sapwood and heartwoodpercentage for the trees grown in Hulikere (n = 95)
Girth (cm) Bark (%) Sapwood (%) Heartwood (%)Mean 74.67 8.64 29.08 62.88Median 72.99 8.72 27.09 63.00SD 14.65 2.66 11.63 11.52CV 19.61 30.82 39.99 18.49Skewness 0.34 0.22 3.33 -1.78Kurtosis -0.36 -0.64 1.30 5.98Range 67.00 10.82 67.74 75.17Minimum 44.00 3.81 10.70 6.18Maximum 111.00 14.63 80.44 81.95
Table - 9 : Correlation matrix for girth, heartwood, sapwood and barkfor the trees grown in Jarakbande ‘A’ Block (n = 98)
Table - 10 : Correlation matrix for girth, heartwood, sapwood and barkfor the trees grown in Hulikere (n = 95)
Girth (cm) Bark (%) Sapwood (%) Heartwood (%)Girth 1Heatrtwood 0.56** 1Sapwood -0.43** -0.95** 1Bark -0.41** 30.82 -0.12 1
Girth (cm) Bark (%) Sapwood (%) Heartwood (%)Girth 1Heatrtwood 0.79** 1Sapwood -0.78** -0.97** 1Bark -0.01** -0.12 -0.16 1
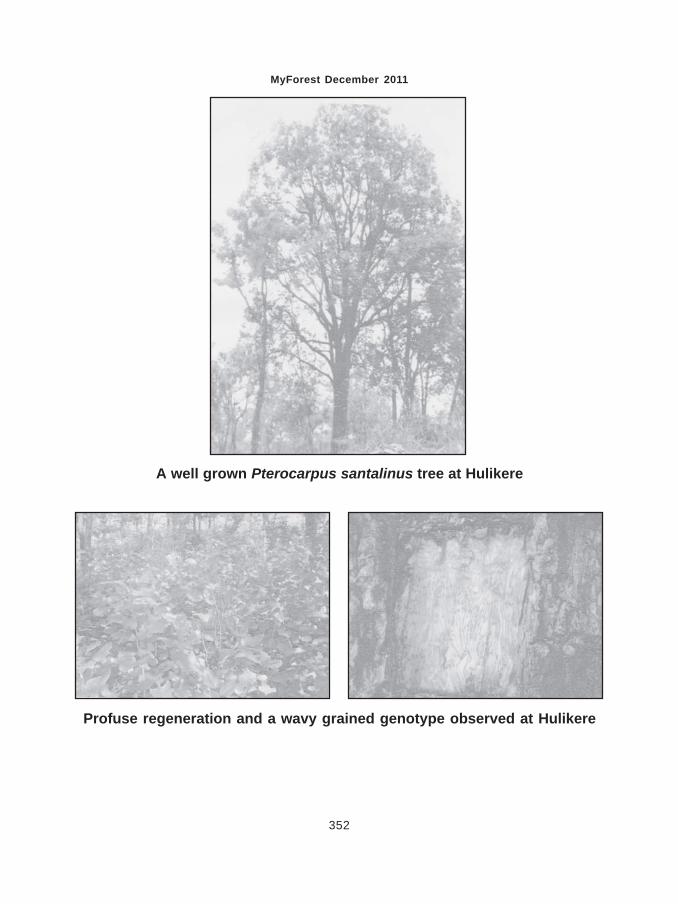
MyForest December 2011
352
A well grown Pterocarpus santalinus tree at Hulikere
Profuse regeneration and a wavy grained genotype observed at Hulikere
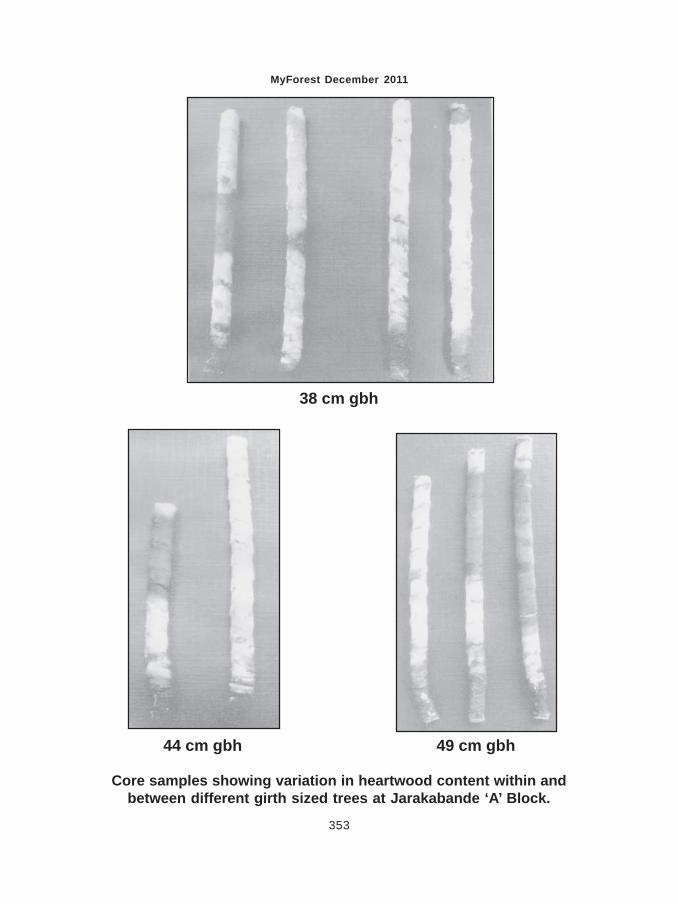
MyForest December 2011
353
38 cm gbh
Core samples showing variation in heartwood content within andbetween different girth sized trees at Jarakabande ‘A’ Block.
44 cm gbh 49 cm gbh
Related Documents