[email protected] [email protected] Attractive MORGAN STANLEY & CO. LLC David R. Lewis EQUITY ANALYST +1 415 576-2324 Mason Austen RESEARCH ASSOCIATE +1 212 761-6974 Medical Technology North America IndustryView Medical Technology Medical Technology | North America North America Spine Survey: Robotic Inflection Very Likely The spine market appears to be stable if not improving. Robotics is becoming more competitive, but inflection looks increasingly likely in 2020/21. We conducted an AlphaWise survey of 140 spine surgeons to explore multiple dynamics in spine. See Survey Respondent Demographics for further details of the survey. The beginning of a robotic renaissance. Despite structurally lower growth, the spine market remains large (~$9B) and profitable. For this reason, most major players are demonstrating a renewed commitment through M&A and innovation (see Exhibit 32) with >$5bn deployed since mid-2016. Implant development is taking a back seat as companies race to assemble integrated navigation, imaging and robotic platforms. See Robotics Adoption Growing: Who Stands to Benefit the Most? Core implant dynamics are stable. Following more consistent market growth in '14-16 of 1.5-2.5%, momentum slowed in 2017 (-150 bps) and again 2018 (-50 bps) which may have reflected pricing or an acceleration in SCS adoption (see Is SCS Destimulating the Spine Market?). Our respondents see spine procedure growth as relatively stable at ~4% y/y (~2% net of price), consistent with 2018 and our spine model of 1.7% organic growth in '19 (vs. 1% in '18). This is likely risk-adjusted given 2Q market growth of ~2%, implying ~150 bps of momentum improvement (see Exhibit 31 for our spine model). Battle for share. Each player has adopted a different strategy to grow above market (discussed in Vendor Share Dynamics), and we see continued share gains in 2020 as most likely for NuVasive (+40 bps) and Globus (+20 bps). We forecast modest share gains for Stryker (+30 bps) during the first full year of K2 commercialization, which is slightly ahead of survey data implying stability. We are more cautious on J&J and Zimmer Biomet prospects into 2020, as J&J (MSe - 60 bps) has lagged peers in innovation and robotics and Zimmer Biomet has taken longer to stabilize LDR and Rosa spine launch was delayed. This is consistent with our survey data suggesting J&J cedes ~1 pt of share and Zimmer Biomet remains stable. Medtronic was the largest discrepancy between our survey (+10 bps) and market model (-40 bps), which is likely predicated on Mazor implant pull-through. If Medtronic share is stable in FY21 it would imply an additional 50 bps to RTG growth, 15 bps to corporate. The robotic adoption curve is likely steep. Intuitive’s da Vinci and Stryker's Mako have showcased the power of robotics. As we suggested in Is Robotics a Competitive Necessity?, integrated technology offerings will be critical to maintaining/growing share. Our survey suggests ~6% of spine procedures are Morgan Stanley does and seeks to do business with companies covered in Morgan Stanley Research. As a result, investors should be aware that the firm may have a conflict of interest that could affect the objectivity of Morgan Stanley Research. Investors should consider Morgan Stanley Research as only a single factor in making their investment decision. For analyst certification and other important disclosures, refer to the Disclosure Section, located at the end of this report. 1 September 18, 2019 04:01 AM GMT

Welcome message from author
This document is posted to help you gain knowledge. Please leave a comment to let me know what you think about it! Share it to your friends and learn new things together.
Transcript
Attractive
MORGAN STANLEY & CO. LLC
David R. LewisEQUITY ANALYST
+1 415 576-2324
Mason AustenRESEARCH ASSOCIATE
+1 212 761-6974
Medical Technology
North AmericaIndustryView
Medical TechnologyMedical Technology || North America North America
Spine Survey: Robotic InflectionVery LikelyThe spine market appears to be stable if not improving.Robotics is becoming more competitive, but inflection looksincreasingly likely in 2020/21.
We conducted an AlphaWise survey of 140 spine surgeons to explore multiple
dynamics in spine. See Survey Respondent Demographics for further details of
the survey.
The beginning of a robotic renaissance. Despite structurally lower growth, the
spine market remains large (~$9B) and profitable. For this reason, most major
players are demonstrating a renewed commitment through M&A and innovation
(see Exhibit 32) with >$5bn deployed since mid-2016. Implant development is
taking a back seat as companies race to assemble integrated navigation, imaging
and robotic platforms. See Robotics Adoption Growing: Who Stands to Benefit the
Most?
Core implant dynamics are stable. Following more consistent market growth in
'14-16 of 1.5-2.5%, momentum slowed in 2017 (-150 bps) and again 2018 (-50 bps)
which may have reflected pricing or an acceleration in SCS adoption (see Is SCS
Destimulating the Spine Market?). Our respondents see spine procedure growth
as relatively stable at ~4% y/y (~2% net of price), consistent with 2018 and our
spine model of 1.7% organic growth in '19 (vs. 1% in '18). This is likely risk-adjusted
given 2Q market growth of ~2%, implying ~150 bps of momentum improvement
(see Exhibit 31 for our spine model).
Battle for share. Each player has adopted a different strategy to grow above
market (discussed in Vendor Share Dynamics), and we see continued share gains
in 2020 as most likely for NuVasive (+40 bps) and Globus (+20 bps). We
forecast modest share gains for Stryker (+30 bps) during the first full year of K2
commercialization, which is slightly ahead of survey data implying stability. We
are more cautious on J&J and Zimmer Biomet prospects into 2020, as J&J (MSe -
60 bps) has lagged peers in innovation and robotics and Zimmer Biomet has
taken longer to stabilize LDR and Rosa spine launch was delayed. This is
consistent with our survey data suggesting J&J cedes ~1 pt of share and Zimmer
Biomet remains stable. Medtronic was the largest discrepancy between our
survey (+10 bps) and market model (-40 bps), which is likely predicated on
Mazor implant pull-through. If Medtronic share is stable in FY21 it would imply
an additional 50 bps to RTG growth, 15 bps to corporate.
The robotic adoption curve is likely steep. Intuitive’s da Vinci and Stryker's Mako
have showcased the power of robotics. As we suggested in Is Robotics a
Competitive Necessity?, integrated technology offerings will be critical to
maintaining/growing share. Our survey suggests ~6% of spine procedures are
Morgan Stanley does and seeks to do business withcompanies covered in Morgan Stanley Research. As aresult, investors should be aware that the firm may have aconflict of interest that could affect the objectivity ofMorgan Stanley Research. Investors should considerMorgan Stanley Research as only a single factor in makingtheir investment decision.For analyst certification and other important disclosures,refer to the Disclosure Section, located at the end of thisreport.
1
September 18, 2019 04:01 AM GMT

currently being done with robotics, which is estimated to triple in three years to
~20%. This closely mirrors the recon robotic prediction in our 2018 Knee Survey
(see Exhibit 13) and Mako's adoption which moved to 30% over 5 years. Mako
was alone and there are currently two (Mazor, ExcelsiusGPS) and soon to be
four (Rosa Spine 1H20 and NuVasive 1H21) systems on the market which could
accelerate adoption. As it relates to existing systems, Mazor X's integration with
Stealth removes a key point of differentiation vs. ExcelsiusGPS driving greater
comparability consistent with our survey data (see Which Systems are Receiving
the Most Attention?).
What to expect at NASS. The primary focus is the unveiling of NuVasive's robotic
system integrated with Pulse. What we know: (1) system will be competitive with
current robotic offerings, (2) first generation will include features beyond pedicle
screw placement, (3) the system will be technically "open" but enhancements
likely create an effective "closed" system, (4) commercialization is planned for
early 2021 (see here). Natural comparisons will occur to ExcelsiusGPS and Mazor
X Stealth given all three systems will include integrated navigation. Globus and
Medtronic should highlight additional planned indications for existing systems (ie
interbody cages, deformity, decompression, etc) including timelines. Stryker is
likely to provide updates on commercial progress with K2M, which we discuss
further below. Si-Bone has signaled surgeon panels should echo enthusiasm for
iFuse Bedrock for adult deformity and the associated "trickle down" effect on SI-
joint fusion.
Can Stryker spine turn the corner? Stryker's acquisition of K2M (see Why Spine?)
gave investors pause as (1) the acquisition was WAMGR dilutive, and (2)
integration and commercial challenges are common in spine. Our respondent
data implies little disruption seen to date (see Exhibit 24) but 1H19 performance
has been sluggish at ~2% pro-forma growth. Management reiterated its
commitment for mid-single digit pro-forma growth (4-6%) in 2019 at our
conference last week, with an improvement expected in both 3Q and 4Q. The
segment needs to average ~8% growth for the remainder of the year (against
tougher comps) to reach 5%. Stryker has spent ~$2B on spine in the past twelve
months to accelerate growth, create an integrated platform, and potentially
accelerate robotics with the recently acquired Mobius (see here). 2020 will be a
Globus: Excelsius placements in 1Q ushered in concerns over the
competitive environment but 2Q placements rebounded to ~11 (-2 y/y). At
our Healthcare conference, management reiterated 2019 robot placements
will grow y/y, despite tracking below 2018 levels to date (25 vs. 17), and
acceleration is expected in 2020 where we model 48 placements (+6 y/y)
driving 90 bps to growth (with each incremental placement driving 15 bps).
Medtronic: Medtronic US spine growth accelerated 130 bps and 380 bps in
3FQ and 4FQ, with Mazor X Stealth pull-through being a key contributor.
1FQ20 US growth of 2.3% was the highest absolute growth since mid-FY17,
although represented 2 pts of momentum deceleration. System disclosure
will be limited moving forward given the competitive environment.
Medtronic/Mazor robotic share of 70-75% is unlikely maintained but we
see the company sustaining majority share in robotic placements in the
intermediate term given their commercial leadership, and pull-through
dynamics should continue alongside.
2
key barometer on this strategy as 6% organic growth can drive ~50 bps to
corporate growth versus a near zero contribution since 2013.
Waiting for Si-Bone inflection. For SI joint fusion, clinical data was most valued
among respondents (see Exhibit 28). As the only company with randomized
controlled data (see The Other Kind of Fusion), Si-Bone is the clear market leader
with ~70% share. Our survey implied a market nearly half our ~$1bn estimate
which reflects the key debate on the stock and need for greater commercial
investment. Still, this suggests the market is very underpenetrated at <10-20%.
Adoption hurdles are not new and include diagnosis difficulty, payor coverage,
physician awareness and reimbursement (see Exhibit 29). Our thesis centers on
investment to drive growth and Si-Bone is set to increase physician training by
~25% and the commercial organization by ~60% this year relative to revenue
guidance of 17-20% growth. The publication of 5-year iFuse data, which
management stated is a key variable for payors like Cigna at our Healthcare
conference is a potential near-term catalyst. Inflection is less likely into 3Q19 but
we remain comfortable modeling ~20% growth in 2019 accelerating to ~24% in
2020.
3

AlphaWise
Survey Respondent Demographics
We surveyed 140 surgeons that specialize in spine surgery. Our survey consisted of an
even split between neurosurgeons and orthopedic spine surgeons; however, all
respondents specialized in spine surgery. The 140 surgeons we surveyed perform an
aggregate of 5.5k surgical procedures per month (~65k per year), with over half of the
procedures being instrumented spinal surgeries (i.e., fusions, disc replacements, etc.). The
average respondent performs 20 instrumented spinal procedures per month or ~250
annually.
4
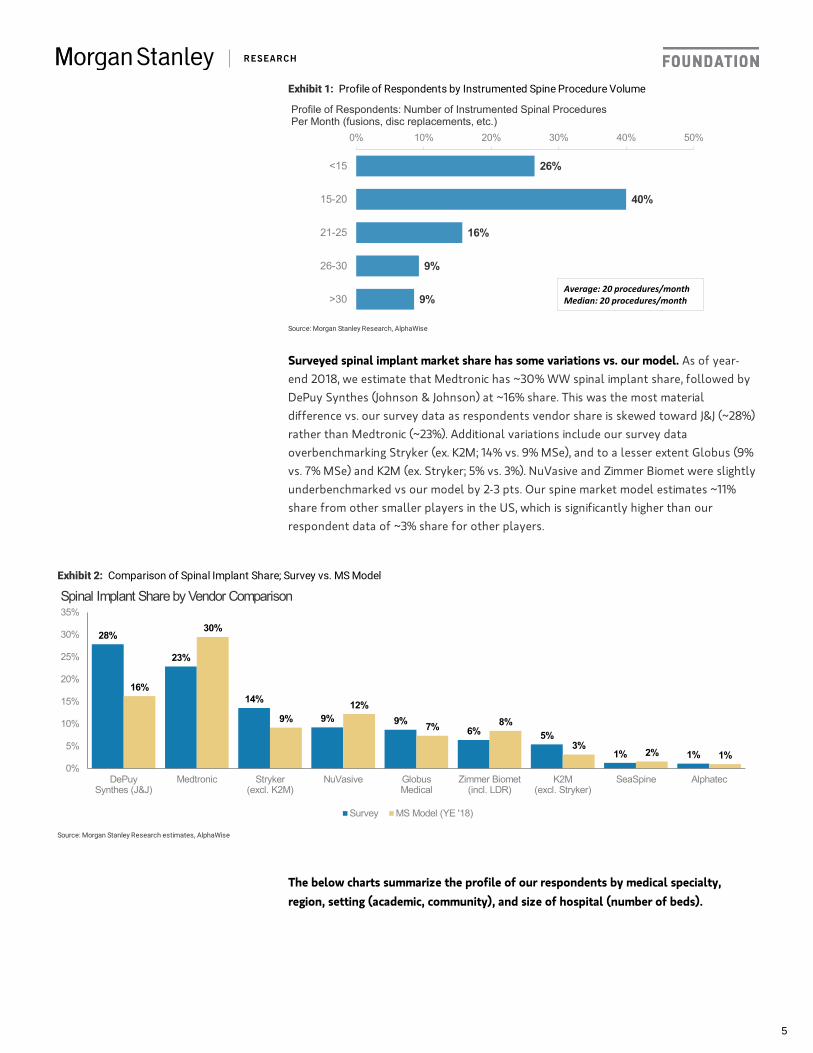
Surveyed spinal implant market share has some variations vs. our model. As of year-
end 2018, we estimate that Medtronic has ~30% WW spinal implant share, followed by
DePuy Synthes (Johnson & Johnson) at ~16% share. This was the most material
difference vs. our survey data as respondents vendor share is skewed toward J&J (~28%)
rather than Medtronic (~23%). Additional variations include our survey data
overbenchmarking Stryker (ex. K2M; 14% vs. 9% MSe), and to a lesser extent Globus (9%
vs. 7% MSe) and K2M (ex. Stryker; 5% vs. 3%). NuVasive and Zimmer Biomet were slightly
underbenchmarked vs our model by 2-3 pts. Our spine market model estimates ~11%
share from other smaller players in the US, which is significantly higher than our
respondent data of ~3% share for other players.
The below charts summarize the profile of our respondents by medical specialty,
region, setting (academic, community), and size of hospital (number of beds).
Exhibit 1: Profile of Respondents by Instrumented Spine Procedure Volume
26%
40%
16%
9%
9%
0% 10% 20% 30% 40% 50%
<15
15-20
21-25
26-30
>30
Profile of Respondents: Number of Instrumented Spinal ProceduresPer Month (fusions, disc replacements, etc.)
Average: 20 procedures/monthMedian: 20 procedures/month
Source: Morgan Stanley Research, AlphaWise
Exhibit 2: Comparison of Spinal Implant Share; Survey vs. MS Model
28%
23%
14%
9% 9%6% 5%
1% 1%
16%
30%
9%12%
7% 8%
3%2% 1%
0%
5%
10%
15%
20%
25%
30%
35%
DePuySynthes (J&J)
Medtronic Stryker(excl. K2M)
NuVasive GlobusMedical
Zimmer Biomet(incl. LDR)
K2M(excl. Stryker)
SeaSpine Alphatec
Spinal Implant Share by Vendor Comparison
Survey MS Model (YE '18)
Source: Morgan Stanley Research estimates, AlphaWise
5
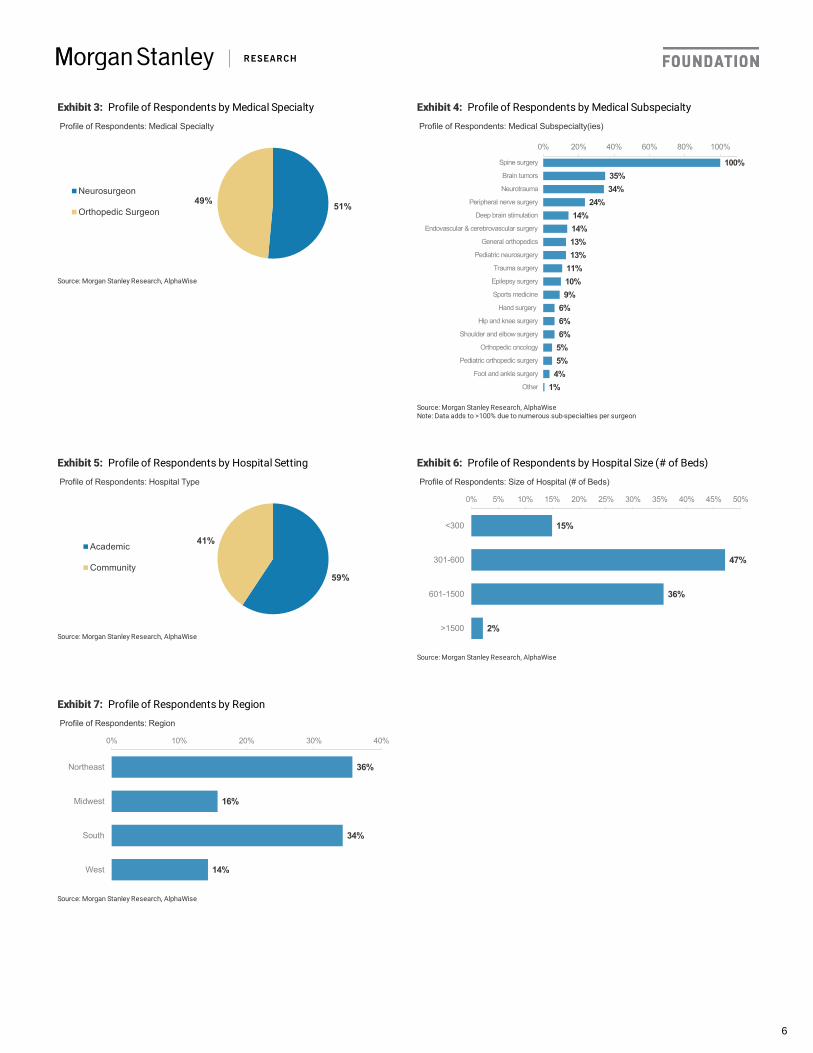
Exhibit 3: Profile of Respondents by Medical Specialty
51%49%
Profile of Respondents: Medical Specialty
Neurosurgeon
Orthopedic Surgeon
Source: Morgan Stanley Research, AlphaWise
Exhibit 4: Profile of Respondents by Medical Subspecialty
100%35%34%
24%14%14%13%13%
11%10%9%
6%6%6%
5%5%
4%1%
0% 20% 40% 60% 80% 100%
Spine surgery
Brain tumors
Neurotrauma
Peripheral nerve surgery
Deep brain stimulation
Endovascular & cerebrovascular surgery
General orthopedics
Pediatric neurosurgery
Trauma surgery
Epilepsy surgery
Sports medicine
Hand surgery
Hip and knee surgery
Shoulder and elbow surgery
Orthopedic oncology
Pediatric orthopedic surgery
Foot and ankle surgery
Other
Profile of Respondents: Medical Subspecialty(ies)
Source: Morgan Stanley Research, AlphaWiseNote: Data adds to >100% due to numerous sub-specialties per surgeon
Exhibit 5: Profile of Respondents by Hospital Setting
59%
41%
Profile of Respondents: Hospital Type
Academic
Community
Source: Morgan Stanley Research, AlphaWise
Exhibit 6: Profile of Respondents by Hospital Size (# of Beds)
15%
47%
36%
2%
0% 5% 10% 15% 20% 25% 30% 35% 40% 45% 50%
<300
301-600
601-1500
>1500
Profile of Respondents: Size of Hospital (# of Beds)
Source: Morgan Stanley Research, AlphaWise
Exhibit 7: Profile of Respondents by Region
36%
16%
34%
14%
0% 10% 20% 30% 40%
Northeast
Midwest
South
West
Profile of Respondents: Region
Source: Morgan Stanley Research, AlphaWise
6

Market Stable; Slight Share Shifts Occurring
Spine Procedure Volumes
From the Survey
We surveyed respondents regarding y/y growth in instrumented spinal procedures in
2018 and expected y/y change in 2019. Note the respondent data is based on procedure
volume growth and does not incorporate pricing pressure, and thus cannot be viewed as
a market growth rate. See Exhibit 8 for corresponding data on spinal procedure volume
growth.
What the data said:
The Takeaway
Market growth expected to be stable. Our respondent data implying ~4% y/y growth in
instrumented spine procedures in 2019 is consistent with 2018 growth and relatively in
line with company commentary. We note the ~4% procedure growth should not be
viewed as a market growth rate as it does not factor in pricing pressure, which has
generally been in the low to mid single digits (2-3 pts). We note only ~6% of
respondents are projecting a decline in instrumented spinal procedures in 2019, noting
the market will likely be at least stable. Our spine model implies a 2018 market growth
rate of 1%, and forecasts 2019 market growth of 1.7% (170 bps of comp-adjusted
acceleration, see Exhibit 31) implying 2-3 pts of pricing pressure annually which is
generally consistent with company commentary. We note the pure plays (Globus and
NuVasive particularly) have cited continued technological innovation as having helped
mitigate the pricing pressure in a more material way than the more diversified large caps.
2018 spinal procedure volume growth of 4.0% is expected to be stable y/y at 4.2%
in 2019.
86/139 respondents (~62%) saw an increase in spinal procedure volume in 2018,
compared to 96/139 (~69%) expecting procedure volume to grow in 2019.
43/139 respondents (~31%) saw no change in spinal procedure volume in 2018,
compared to 34/139 (~24%) expecting no change in procedure volume in 2019.
10/139 respondents (~7%) saw a decrease in spinal procedure volume in 2018,
compared to 9/139 (~6%) expecting procedure volume decline in 2019.
7

Vendor Share Dynamics
From the Survey
We surveyed respondents regarding their respective implant share across various spine
providers, and how this has changed over the past year, and how they expect share to
change over the next one and three years. The data is displayed on an average, equal-
weighted basis (as opposed to procedure-weighted). We note given Stryker's acquisition
of K2M in August 2018, respondent data could be mixed depending on timing of rep
transitions. We note several companies were under/over-represented when compared to
our spine model as discussed above (see Survey Respondent Demographics). See Exhibit
9 for corresponding data on vendor share.
What the data said:
The Takeaway
Companies demonstrating commitment to spine. As we discussed in NASS: The Quest
for Above Market Growth, spine is an attractive end-market despite lower market
growth, given its size and profitability, and companies remain focused on innovation as it
has the ability to drive share gains. Since 2013, share gains have been mainly seen among
the spine pure-plays as Globus and NuVasive have captured 4.5 and 2.5 pts of share,
Exhibit 8: Spinal Procedure Volume Growth Projected to be Stable at ~4% y/y
5%
13%
17%
27%
31%
4%
1%
0%
2%
2%
13%
20%
34%
24%
4%
1%
0%
1%
0% 10% 20% 30% 40%
Increase by >15%
Increase by 11-15%
Increase by 6-10%
Increase by 1-5%
No change (0%)
Decrease by 1-5%
Decrease by 6-10%
Decrease by 11-15%
Decrease by >15%
YoY Change Instrumented Spinal Procedure Volume
2018 2019 (Est.)
2018 Average: +4.0%2019 (Est.) Average: +4.2%
Source: Morgan Stanley Research, AlphaWise
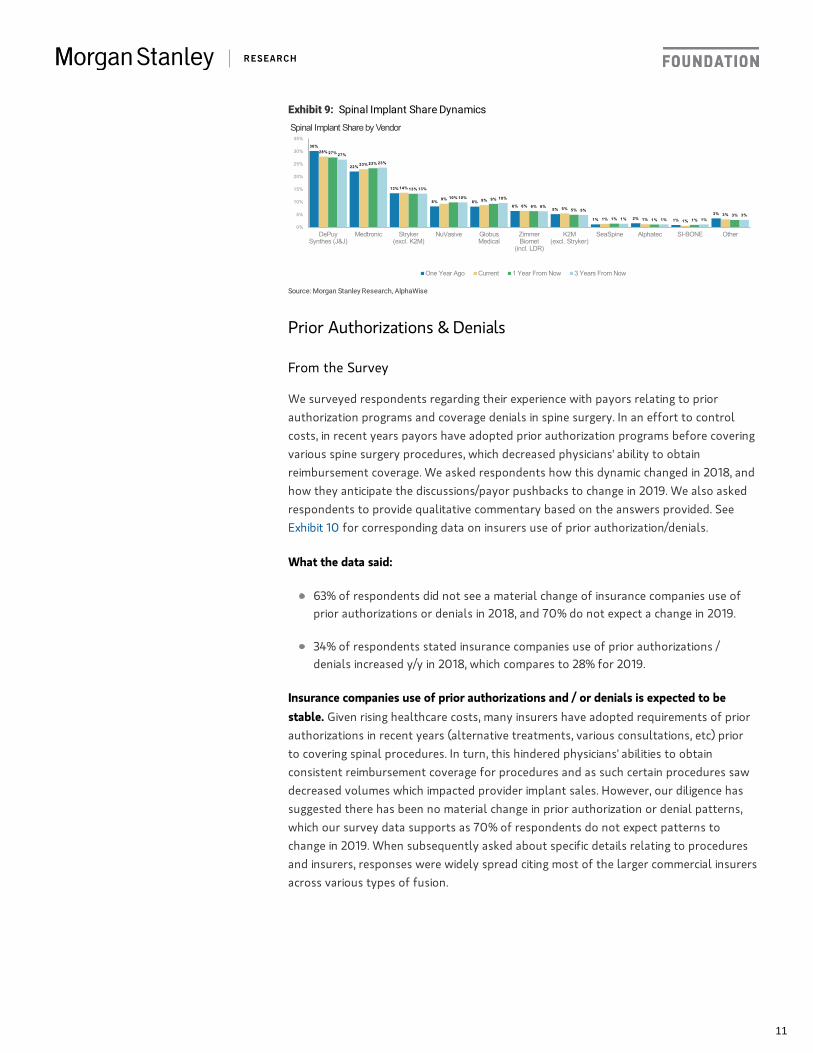
J&J currently has 28% market share among our respondents, followed by Medtronic
(23%), Stryker, ex. K2M (14%), NuVasive (9%) and Globus (9%).
Over the past year, J&J ceded the most share at 2 pts, followed by Alphatec at 1 pt,
whereas Medtronic, Stryker, NuVasive, and Globus each captured 1 pt of share
each.
Share shifts are anticipated to be relatively muted at +/- 1 pt for each vendor over
the next three years, but Medtronic, NuVasive, and Globus are each slated to
demonstrate gradual increases.
8
respectively, while Medtronic and J&J have ceded 4.5 and 3.5 pts of share, respectively.
Despite this, the large caps have demonstrated a commitment to spine as (1) J&J has
stabilized its sales force and is launching new products, (2) Stryker acquired K2M (see
Why Spine?), and most recently Mobius (see Moving to Where the Puck is with Mobius) ,
(3) Medtronic acquired Mazor (discussed below and inside), and (4) Zimmer Biomet is
aiming to stabilize the segment and launching Rosa Spine in early 2020. We outline
further details regarding each company's path forward and forecasted share changes
below.
Medtronic taking share, likely due to robotic initiatives with Mazor. Our survey data
implies Medtronic is the only large cap company to demonstrate share gains over the
next one to three years, while J&J, Stryker and Zimmer Biomet are all poised to maintain
or cede share. This is likely driven by the company's acquisition of Mazor (see Why Buy
Mazor?) to drive its presence in robotics and further maintain and/or gain share in spine.
However we note Medtronic share among our respondents is likely underrepresented at
~23% vs. our estimate at ~33% (see Exhibit 31). As we will discuss further inside (and
here: NASS: Is Robotics a Competitive Necessity?), the robotic presence in spine
represents a key competitive advantage (and likely turns into a necessity) to driving
further implant share as Medtronic and Globus have commented on willingness to place
robotic systems at a discount (or for free) in exchange for committed volumes. Our
survey data implies Medtronic taking 50-75 bps of share over the next three years,
which differs from our market model implying ~1 pt of share loss.
J&J likely continues to cede share without a robotic presence. While J&J's spine business
has improved in recent quarters to down low single digits (vs. down mid to upper single
digits in late 2017 / early 2018), the company has reiterated its commitment to spine and
believes that the business is turning a corner with increased product launches and sales
force stabilization as our conversations have suggested J&J has lost competitive reps to
Globus and NuVasive in recent years. Additionally, we have discussed J&J as coming from
behind on the enabling technology front without the presence of a robotic system
(knees remains primary focus for Orthotaxy, although could include a spine application
in the future). Given the duration of J&J's struggles and limited differentiation, we see
limited visibility towards reaching or exceeding market growth in the coming years. Our
survey data suggests J&J is expected to continue to cede ~50 bps of share annually,
which is consistent with our market model.
Stryker's integration of K2M will be closely monitored; recent Mobius acquisition
reiterates commitment to spine. Management has reiterated commitment to mid single
digit pro-forma spine growth; however, we note following 2% pro-forma growth in 1H
the segment needs to average ~8% growth for the remainder of the year to reach 5%
(MSD). As we will discuss further inside (see Stryker / K2M: Only Time Will Tell), our
survey was conducted prior to the cross-selling initiatives that took place in 2Q, thus we
believe this to be a key reason why our respondents viewed little disruptions to sales
force changes thus far. Management commentary suggests the integration remains on
track, although we maintain a more cautious view during the 2019 integration. 2020
onward, we model 5% organic growth for Stryker's spine business, and our survey data
suggests Stryker share to be relatively stable over the next three years, consistent with
our market model (pro-forma for K2M). Further, the company's recent $500mn
acquisition of Mobius confirms the company's commitment to spine and validates the
evolving industry trend toward integrated imaging, navigation, and robotics (see here). In
9

addition to acquiring a commercial imaging system with Airo TruCT, Stryker now also
controls the future development pipeline of the navigation/robotics platform which can
be additive to its current navigation systems in cranial. Previously management has
signaled the commercialization of its spine robot is not planned near-term, and while no
timeline updates were provided with this acquisition, this deal likely accelerates its time
to market.
Zimmer Biomet expects spine to gradually improve. Along with other idiosyncratic
issues in the business, Zimmer Biomet has worked to integrate the LDR acquisition and
move distributors to exclusive agreements. The company will anniversary this headwind
later this year, and expects spine to continue to improve with Mobi-C performing well
and Rosa Spine launching in early 2020 (slightly pushed out to focus on early
commercialization of Rosa knee). However, it is clear the company's spine segment has
been challenged and will remain a "show me story" once Rosa Spine launches early next
year, although we have discussed spine robotics as becoming increasingly more
competitive. Our survey data suggests stagnant share for Zimmer Biomet over the next
three years, consistent with our market model.
Robotics is key for Globus, but competitive pressures are increasing. Globus has
attributed share gains in spine to competitive rep hires, product launches and innovation,
and robotics. Management commentary points to key rep hires coming from the larger
spine players, which we see as likely given relative disruptions seen in recent years.
Globus has discussed pull-through from ExcelsiusGPS placements as having partly
contributed to recent high single digit organic growth in spine (ex. biologics); however, 1Q
robotic placements were materially weaker than consensus expected (see here) due to
(1) seasonality / pent-up demand in 1Q18, (2) elongated selling cycle, (3) aggressive
marketing tactics from competitors which we will discuss further. However, 2Q
placements of ~11 cleared expectations and slightly eased investor concerns regarding a
structural challenge near-term. We expect Globus to maintain its technological lead vs.
Mazor systems as the company pursues additional indications for the robot (interbody
cages, decompression, rod bending, etc.), however monitoring quarterly placement
trends will be key to determining whether competitive dynamics will be a significant
structural headwind moving forward. Our survey data suggests Globus gaining ~1 pt of
share over the next three years, consistent with our market model.
Investor Day outlined strategy for NuVasive; robotics at NASS will be a key focus. New
CEO Chris Barry has posted two solid quarters thus far into his role, effectively de-
risking 2019 guidance. The Investor Day in August set forth achievable targets for
NuVasive through 2024 that included 5-7% topline growth (we estimate 4-6% organic)
and incorporated "prudent" targets for the respective segments. Spine growth CAGR of
~5% will be led by continued adoption of minimally invasive procedures, X360 traction,
and further penetration of core XLIF franchises. US Surgical Support CAGR of ~4% only
includes ~$50mn of incremental revenue over the next five years, which appears
conservative given Pulse and robotics will be reported here (discussed further in Could
Pulse Make a Difference?). The upcoming robotics event at NASS will be a key focus
item to outlining the strategy for robotics adoption over the next 5-years, and our
conversations suggest the system is expected to be competitive with others on the
market, and incorporate more than just pedicle screw placement. Our survey data
suggests NuVasive gaining ~1 pt of share over the next three years, consistent with our
market model.
10
Prior Authorizations & Denials
From the Survey
We surveyed respondents regarding their experience with payors relating to prior
authorization programs and coverage denials in spine surgery. In an effort to control
costs, in recent years payors have adopted prior authorization programs before covering
various spine surgery procedures, which decreased physicians' ability to obtain
reimbursement coverage. We asked respondents how this dynamic changed in 2018, and
how they anticipate the discussions/payor pushbacks to change in 2019. We also asked
respondents to provide qualitative commentary based on the answers provided. See
Exhibit 10 for corresponding data on insurers use of prior authorization/denials.
What the data said:
Insurance companies use of prior authorizations and / or denials is expected to be
stable. Given rising healthcare costs, many insurers have adopted requirements of prior
authorizations in recent years (alternative treatments, various consultations, etc) prior
to covering spinal procedures. In turn, this hindered physicians' abilities to obtain
consistent reimbursement coverage for procedures and as such certain procedures saw
decreased volumes which impacted provider implant sales. However, our diligence has
suggested there has been no material change in prior authorization or denial patterns,
which our survey data supports as 70% of respondents do not expect patterns to
change in 2019. When subsequently asked about specific details relating to procedures
and insurers, responses were widely spread citing most of the larger commercial insurers
across various types of fusion.
Exhibit 9: Spinal Implant Share Dynamics
30%
22%
13%
8% 8%6%
5%
1% 2% 1%3%
28%
23%
14%
9% 9%6% 5%
1% 1% 1%3%
27%
23%
13%
10% 9%
6%5%
1% 1% 1%3%
27%
23%
13%
10% 10%
6%5%
1% 1% 1%3%
0%
5%
10%
15%
20%
25%
30%
35%
DePuySynthes (J&J)
Medtronic Stryker(excl. K2M)
NuVasive GlobusMedical
ZimmerBiomet
(incl. LDR)
K2M(excl. Stryker)
SeaSpine Alphatec SI-BONE Other
Spinal Implant Share by Vendor
One Year Ago Current 1 Year From Now 3 Years From Now
Source: Morgan Stanley Research, AlphaWise
63% of respondents did not see a material change of insurance companies use of
prior authorizations or denials in 2018, and 70% do not expect a change in 2019.
34% of respondents stated insurance companies use of prior authorizations /
denials increased y/y in 2018, which compares to 28% for 2019.
11
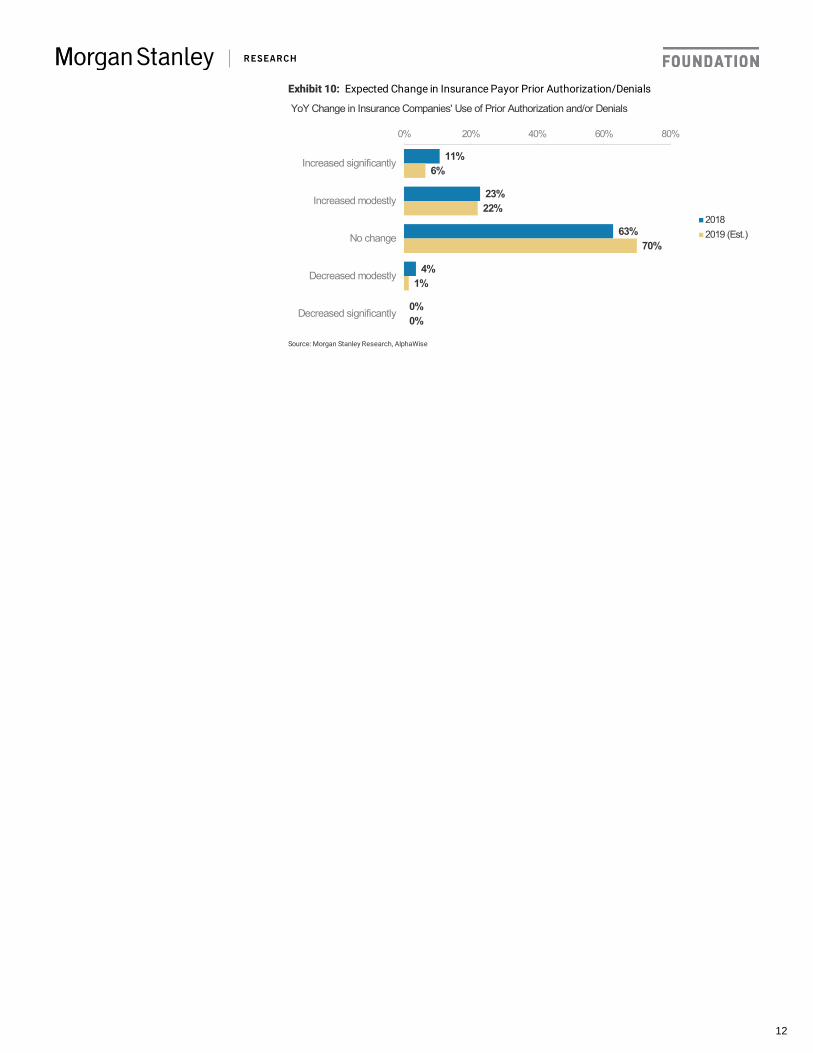
Exhibit 10: Expected Change in Insurance Payor Prior Authorization/Denials
11%
23%
63%
4%
0%
6%
22%
70%
1%
0%
0% 20% 40% 60% 80%
Increased significantly
Increased modestly
No change
Decreased modestly
Decreased significantly
YoY Change in Insurance Companies' Use of Prior Authorization and/or Denials
20182019 (Est.)
Source: Morgan Stanley Research, AlphaWise
12
Robotics Adoption Growing: Who Stands to Benefit the Most?
Robotic Systems in Spine Surgery
From the Survey
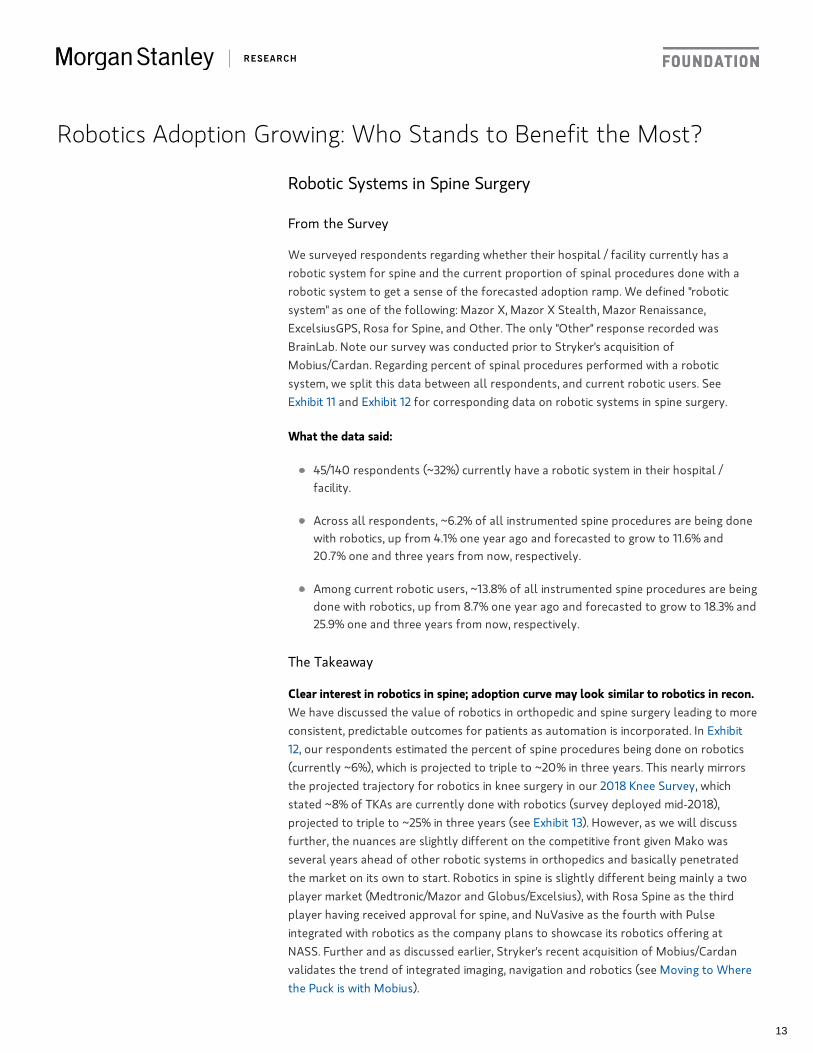
We surveyed respondents regarding whether their hospital / facility currently has a
robotic system for spine and the current proportion of spinal procedures done with a
robotic system to get a sense of the forecasted adoption ramp. We defined "robotic
system" as one of the following: Mazor X, Mazor X Stealth, Mazor Renaissance,
ExcelsiusGPS, Rosa for Spine, and Other. The only "Other" response recorded was
BrainLab. Note our survey was conducted prior to Stryker's acquisition of
Mobius/Cardan. Regarding percent of spinal procedures performed with a robotic
system, we split this data between all respondents, and current robotic users. See
Exhibit 11 and Exhibit 12 for corresponding data on robotic systems in spine surgery.
What the data said:
The Takeaway
Clear interest in robotics in spine; adoption curve may look similar to robotics in recon.
We have discussed the value of robotics in orthopedic and spine surgery leading to more
consistent, predictable outcomes for patients as automation is incorporated. In Exhibit
12, our respondents estimated the percent of spine procedures being done on robotics
(currently ~6%), which is projected to triple to ~20% in three years. This nearly mirrors
the projected trajectory for robotics in knee surgery in our 2018 Knee Survey, which
stated ~8% of TKAs are currently done with robotics (survey deployed mid-2018),
projected to triple to ~25% in three years (see Exhibit 13). However, as we will discuss
further, the nuances are slightly different on the competitive front given Mako was
several years ahead of other robotic systems in orthopedics and basically penetrated
the market on its own to start. Robotics in spine is slightly different being mainly a two
player market (Medtronic/Mazor and Globus/Excelsius), with Rosa Spine as the third
player having received approval for spine, and NuVasive as the fourth with Pulse
integrated with robotics as the company plans to showcase its robotics offering at
NASS. Further and as discussed earlier, Stryker's recent acquisition of Mobius/Cardan
validates the trend of integrated imaging, navigation and robotics (see Moving to Where
the Puck is with Mobius).
45/140 respondents (~32%) currently have a robotic system in their hospital /
facility.
Across all respondents, ~6.2% of all instrumented spine procedures are being done
with robotics, up from 4.1% one year ago and forecasted to grow to 11.6% and
20.7% one and three years from now, respectively.
Among current robotic users, ~13.8% of all instrumented spine procedures are being
done with robotics, up from 8.7% one year ago and forecasted to grow to 18.3% and
25.9% one and three years from now, respectively.
13

Which Systems are Receiving the Most Attention?
Exhibit 11: ~1/3 of respondents have a robotic system in their facility
68%
32%
Respondents with Robotic Systems in Hospital (Currently)
No Robotic System
Has Robotic System
Source: Morgan Stanley Research, AlphaWise
Exhibit 12: Robotic Spine Procedures Anticipated to Grow
4.1%6.2%
11.6%
20.7%
8.7%
13.8%
18.3%
25.9%
0%
5%
10%
15%
20%
25%
30%
1-Year Ago Today 1-Year From Now 3-Years From Now
Percent of Instrumented Spine Procedures Performed With Robotics
Average (All Respondents) Average (Current Robotic Users)
Source: Morgan Stanley Research, AlphaWise
Exhibit 13: Comparison: Robotic Knee Procedure Growth Forecast (From Knee Survey: RoboticInflection on Horizon; SYK Remains the Winner)
4%
8%
16%
24%
0%
5%
10%
15%
20%
25%
One Year Ago Currently One Year From Now Three Years From Now
Robotic Solutions Share of Total Knee Arthroplasty Procedures
Source: Morgan Stanley Research, AlphaWise
14
From the Survey
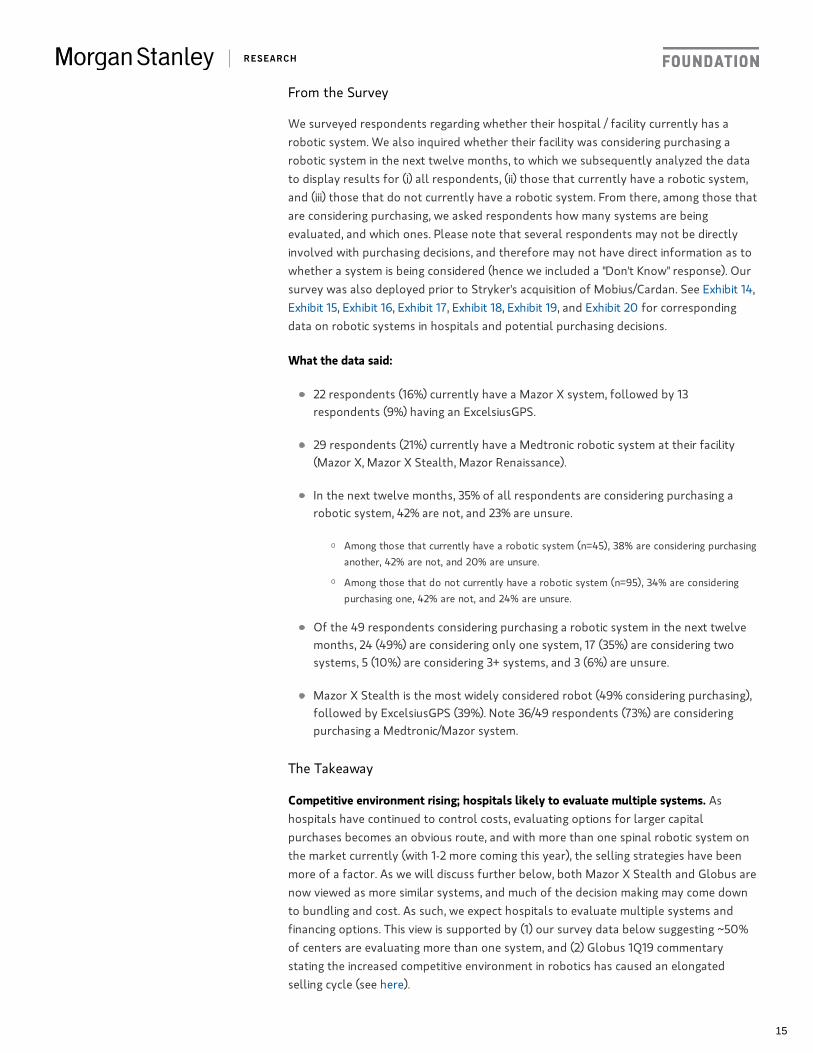
We surveyed respondents regarding whether their hospital / facility currently has a
robotic system. We also inquired whether their facility was considering purchasing a
robotic system in the next twelve months, to which we subsequently analyzed the data
to display results for (i) all respondents, (ii) those that currently have a robotic system,
and (iii) those that do not currently have a robotic system. From there, among those that
are considering purchasing, we asked respondents how many systems are being
evaluated, and which ones. Please note that several respondents may not be directly
involved with purchasing decisions, and therefore may not have direct information as to
whether a system is being considered (hence we included a "Don't Know" response). Our
survey was also deployed prior to Stryker's acquisition of Mobius/Cardan. See Exhibit 14,
Exhibit 15, Exhibit 16, Exhibit 17, Exhibit 18, Exhibit 19, and Exhibit 20 for corresponding
data on robotic systems in hospitals and potential purchasing decisions.
What the data said:
The Takeaway
Competitive environment rising; hospitals likely to evaluate multiple systems. As
hospitals have continued to control costs, evaluating options for larger capital
purchases becomes an obvious route, and with more than one spinal robotic system on
the market currently (with 1-2 more coming this year), the selling strategies have been
more of a factor. As we will discuss further below, both Mazor X Stealth and Globus are
now viewed as more similar systems, and much of the decision making may come down
to bundling and cost. As such, we expect hospitals to evaluate multiple systems and
financing options. This view is supported by (1) our survey data below suggesting ~50%
of centers are evaluating more than one system, and (2) Globus 1Q19 commentary
stating the increased competitive environment in robotics has caused an elongated
selling cycle (see here).
22 respondents (16%) currently have a Mazor X system, followed by 13
respondents (9%) having an ExcelsiusGPS.
29 respondents (21%) currently have a Medtronic robotic system at their facility
(Mazor X, Mazor X Stealth, Mazor Renaissance).
In the next twelve months, 35% of all respondents are considering purchasing a
robotic system, 42% are not, and 23% are unsure.
Among those that currently have a robotic system (n=45), 38% are considering purchasing
another, 42% are not, and 20% are unsure.
Among those that do not currently have a robotic system (n=95), 34% are considering
purchasing one, 42% are not, and 24% are unsure.
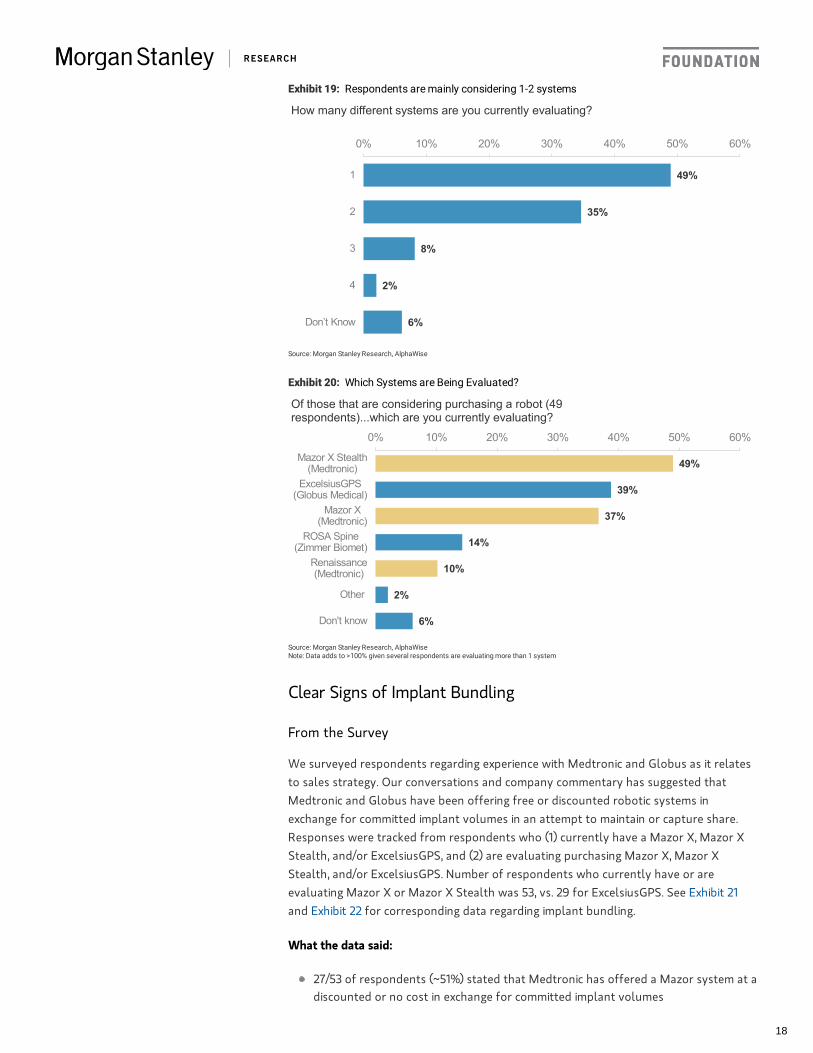
Of the 49 respondents considering purchasing a robotic system in the next twelve
months, 24 (49%) are considering only one system, 17 (35%) are considering two
systems, 5 (10%) are considering 3+ systems, and 3 (6%) are unsure.
Mazor X Stealth is the most widely considered robot (49% considering purchasing),
followed by ExcelsiusGPS (39%). Note 36/49 respondents (73%) are considering
purchasing a Medtronic/Mazor system.
15

Mazor likely maintains majority share. Commentary on Medtronic's recent earnings
calls suggest the company has 70%+ market share in spinal robotics, with 3.5x the
amount of robots placed as the closest competitor (ExcelsiusGPS). We estimate Globus
to have placed 70-75 systems, implying an install base of ~250 for Mazor. Although we
note Medtronic will no longer be disclosing placements moving forward for competitive
purposes (see 1FQ20 Device Derivatives). Among our respondents, Medtronic systems
(Mazor X Stealth, Mazor X, Mazor Renaissance) hold a ~60% share, vs. Excelsius at
~20%. We see intensive marketing tactics and bundling as a key component of
Medtronic's ability to maintain share (see Clear Signs of Implant Bundling); however,
since launch in late 2017, we estimate Globus to have taken 15-25 pts of share from
Mazor. Notably, of the 49 respondents evaluating robotic systems for purchase over the
next twelve months, 36 (75%) are evaluating a Medtronic system vs. 39% evaluating
Excelsius.
Globus has been most vocal regarding additional applications. Prior to Mazor's
integration of Medtronic's Stealth, our diligence has suggested that integrated
navigation was a key differentiator between Mazor X and Globus. However, following
the integration, the systems are viewed as much more similar as the differentiation is
very nuanced (strength of arm, workflow, mobility of system). Beyond this, Globus has
discussed additional applications planned for Excelsius that include (1) interbody cages
(recent approval, see here), (2) deformity module integrating SurgiMap (filing for
approval late 2019), (3) cranial application (filing for approval late 2019), (4) rod
insertion / bending (late 2019 / early 2020 submission), and (5) decompression /
discectomy (beyond 2020). While Globus has been most vocal regarding planned
upgrades and indications, we understand Medtronic is working on similar pursuits to
incorporate: interbodies and powered instruments, decompression, rod bending, and
further planning and navigation upgrades, while planned timing is unclear. Zimmer
Biomet has not specifically commented on future applications / timing, however our
conversations suggest the company will likely pursue additional indications in the
future.
Rosa spine presence could reflect upgrades from cranial application. Zimmer Biomet
received approval for Rosa Spine at the end of March 2019, and we were surprised to
learn that 11 respondents (8%) claimed to have the Rosa system for spine in early 2Q
when our survey was deployed. While possible that Zimmer Biomet placed these de
novo spine systems, it is much more likely to reflect upgrades from centers that have
the Rosa system for cranial application as our conversations suggest the upgrade
process can be done relatively quickly. Further, Zimmer Biomet has been vocal that Rosa
Spine launch is set for early 2020 as the company focuses on early commercialization
efforts of Rosa Knee. Our survey data suggests 7/49 respondents (~14%) that are
considering a robot are considering Rosa spine. We do not view this as surprising given
the system only recently received approval and Zimmer Biomet plans to begin more
actively selling in early 2020.
16

Exhibit 14: Robotic Systems in Hospitals
16%
9%
8%
7%
6%
1%
4%
64%
0% 10% 20% 30% 40% 50% 60% 70%
Mazor X(Medtronic)
ExcelsiusGPS(Globus Medical)
ROSA Spine(Zimmer Biomet)Mazor X Stealth
(Medtronic)Renaissance(Medtronic)
Other
Don't know
None
Robotic Systems Currently in Respondent Hospitals
Source: Morgan Stanley Research, AlphaWiseNote: Data adds to >100% given hospitals can have >1 system
Exhibit 15: Robotic Systems in Hospitals (Among Those Who Have aSystem)
34%
20%
17%
15%
12%
2%
0% 10% 20% 30% 40%
Mazor X(Medtronic)
ExcelsiusGPS(Globus Medical)
ROSA Spine(Zimmer Biomet)
Mazor X Stealth(Medtronic)
Renaissance(Medtronic)
Other
Robotic Systems Currently in Respondent Hospitals
Source: Morgan Stanley Research, AlphaWise
Exhibit 16: Hospitals Considering Purchasing a Robotic System
35%
23%
42%
Is Your Hospital Considering Purchasing a Robotic System in the NextTwelve Months?
Yes Don't know No
Source: Morgan Stanley Research, AlphaWise
Exhibit 17: Of those that have a robotic system...
38%
20%
42%
Of those that currently have a robotic system (45respondents)....are you considering another?
YesDon’t knowNo
Source: Morgan Stanley Research, AlphaWise
Exhibit 18: Of those that do not have a robotic system...
34%
24%
42%
Of those that do not currently have a robotic system(95 respondents)....are you purchasing one?
YesDon’t knowNo
Source: Morgan Stanley Research, AlphaWise
17
Clear Signs of Implant Bundling
From the Survey
We surveyed respondents regarding experience with Medtronic and Globus as it relates
to sales strategy. Our conversations and company commentary has suggested that
Medtronic and Globus have been offering free or discounted robotic systems in
exchange for committed implant volumes in an attempt to maintain or capture share.
Responses were tracked from respondents who (1) currently have a Mazor X, Mazor X
Stealth, and/or ExcelsiusGPS, and (2) are evaluating purchasing Mazor X, Mazor X
Stealth, and/or ExcelsiusGPS. Number of respondents who currently have or are
evaluating Mazor X or Mazor X Stealth was 53, vs. 29 for ExcelsiusGPS. See Exhibit 21
and Exhibit 22 for corresponding data regarding implant bundling.
What the data said:
Exhibit 19: Respondents are mainly considering 1-2 systems
49%
35%
8%
2%
6%
0% 10% 20% 30% 40% 50% 60%
1
2
3
4
Don’t Know
How many different systems are you currently evaluating?
Source: Morgan Stanley Research, AlphaWise
Exhibit 20: Which Systems are Being Evaluated?
49%
39%
37%
14%
10%
2%
6%
0% 10% 20% 30% 40% 50% 60%
Mazor X Stealth(Medtronic)
ExcelsiusGPS(Globus Medical)
Mazor X(Medtronic)
ROSA Spine(Zimmer Biomet)
Renaissance(Medtronic)
Other
Don't know
Of those that are considering purchasing a robot (49respondents)...which are you currently evaluating?
Source: Morgan Stanley Research, AlphaWiseNote: Data adds to >100% given several respondents are evaluating more than 1 system
27/53 of respondents (~51%) stated that Medtronic has offered a Mazor system at a
discounted or no cost in exchange for committed implant volumes
18

The Takeaway
Medtronic is intensively offering bundling solutions. Within our survey, ~50% of
respondents cited Medtronic has offering free to discounted robotic systems in
exchange for committed volumes. However, this includes 40% of respondents who
answered "Don't know"; thus adjusting for this to include only responses with a definitive
answer this equates to ~85% claiming they were offered bundling solutions. This closely
mirrors Medtronic's commentary on the 4FQ earnings call stating 21 of the 25-26 (80-
85%) Mazor sales in 1CQ were placed with a usage based agreement. Additionally, the
company has cited many of the placements and usage based agreements were targeted
at competitive accounts where Medtronic is underrepresented in share. As we discuss
below, Globus cited lighter 1CQ robotic placements partly due to intense marketing
tactics by competitors creating a longer selling cycle (see here), which in part is likely
attributable to the bundling solutions offered by Medtronic.
Globus has signaled a willingness to offer bundling; however, it lacks the scale of
Medtronic. Prior to Excelsius, Globus typically did not sell larger capital equipment and
operated as a traditional pure-play spine company. Prior to Medtronic's acquisition of
Mazor, the selling strategy(ies) of the robotic systems were not entirely a debate,
however when Medtronic could leverage its share and scale, selling strategies were
adjusted. Globus has recently discussed a willingness to offer discounted (or free)
systems in exchange for committed volumes, however our survey data supports our
view of this being done to a lesser extent given the company lacks the scale of
Medtronic. Rather than compete on bundling (which both companies are now doing),
Globus has modified its positioning to differentiate ExcelsiusGPS clinically vs. Mazor and
focus on the clinical benefit and future applications.
Early signs of pull-through being seen. While there is value in initial capital sales, we
have repeatedly discussed the longer-term implant pull-through value of robotics as
underappreciated. While our survey data was inconclusive on this front, both Globus
and Medtronic have attributed some of the recent performance in spine to higher case
volumes and additional implant share, particularly in competitive accounts.
10/29 of respondents (~35%) stated that Globus has offered an ExcelsiusGPS
system at a discounted or no cost in exchange for committed implant volumes
5/53 respondents (~9%) stated that Medtronic has not offered any bundling
options
8/29 respondents (~28%) stated that Globus has not offered any bundling options
38-40% of respondents answered "Don't Know / Not Applicable," likely due to the
respondent not specifically being involved in purchasing decisions
19

Could Pulse Make a Difference?
From the Survey
We surveyed respondents regarding their (1) familiarity of NuVasive's Pulse system, and
(2) whether the pending development of Pulse (with a robotics application) will affect
planned purchasing decisions for robotics. We tracked responses from all physicians,
and subsequently calculated the average share among those respondents in each
category to get a sense if there was a skew to NuVasive loyalist accounts, or accounts
that do not have a significant NuVasive share. See Exhibit 23 for corresponding data on
NuVasive's Pulse platform as it relates to purchasing decisions.
What the data said:
Exhibit 21: ~50% of respondents stated Medtronic has offered usage based contracts (n=53)
23%
28%
9%
40%
0% 10% 20% 30% 40% 50%
Yes, offered robot at no cost in exchange forcommitted volumes
Yes, offered discounts & rebates toward robot inexchange for committed volumes
No, not offered bundling options
Don’t know/not applicable
Medtronic (Mazor): Robot & Implant Bundling Offers
Source: Morgan Stanley Research, AlphaWise
Exhibit 22: Globus is also offering bundling contracts, however less intensively than Medtronic(n=29)
14%
21%
28%
38%
0% 10% 20% 30% 40% 50%
Yes, offered robot at no cost in exchange forcommitted volumes
Yes, offered discounts & rebates toward robot inexchange for committed volumes
No, not offered bundling options
Don’t know/not applicable
Globus (ExcelsiusGPS): Robot & Implant Bundling Offers
Source: Morgan Stanley Research, AlphaWise
45/140 respondents (32%) would like to review NuVasive's Pulse platform prior to
making a purchasing decision on robotics. These respondents averaged ~14%
NuVasive implant share.
20
The Takeaway
What is NuVasive's Pulse? Pulse is NuVasive's ecosystem for capital equipment and
software to improve spine procedure workflow. Pulse incorporates a number of the
company's prior technologies including NUVAMap, Bendini (rod bending), LessRay
(imaging with reduced radiation), and Neuromonitoring, while adding 2D and 3D
navigation and imaging. The system was unveiled at NASS 2018, and launched in early
July. Management has framed the value proposition of the system as (1) an integrated
system to improve spine procedure workflow and reduce variation of outcomes, (2) the
ability to use the system in a majority of spine procedures, and (3) more cost effective
than competitive robotics offerings (Pulse at ~$500k vs. robotics at ~$1mn). While the
system does not currently have a robotics application, management has widely
discussed the plans for automation to be incorporated as we will discuss below.
Robotics: what do we know thus far? NuVasive is set to unveil its robotics application
integrated with Pulse at NASS in late September. While details have been minor and
incremental to date, we have learned that (1) management is confident the offering will
be competitive with initial systems on the market, (2) it will include a combination of
both internal and external development, (3) the first generation of the system will
include offerings beyond pedicle screw placement, and (4) the system will be technically
an "open" platform but enhancements likely drive an effective "closed" system. The
selling strategy is likely comparable to standalone Pulse and will remain flexible
(outright sales, leases, etc). At our Healthcare conference, we learned from CEO Chris
Barry that the regulatory process is likely to take place in 2020, with commercialization
planned for 2021.
Framing relative contribution of Pulse & robotics. At NuVasive's Investor Day in August,
management outlined 5-year growth targets for each segment. US Surgical Support
targets included $50mn in incremental revenue from '19-24, which we see as
conservative given Pulse and robotics revenue will be reported here. Assuming flat to 1%
growth for the remainder of the portfolio, this implies Pulse and robotics contribution of
~$40mn over the LRP which we see as conservative given (1) Pulse was launched this
year and is compatible with the majority of spine procedures, and (2) management
agreed that the ramp/trajectory of robotics can be viewed as a decent proxy.
Management has reiterated projections for Pulse and robotics are modest throughout
the LRP. For reference, 25-50 incremental Pulse placements in 2020 would drive an
additional 80-160 bps to total growth (assuming 50/50 outright vs. usage-based mix). It
is unclear what management plans to set the robotics ASP as; however, assuming
$1.25mn at a 50/50 outright vs. usage-based mix, 40 systems can drive ~3 pts to growth
in 2022, or nearly the entire of the ~$40mn discussed.
31/140 respondents (22%) stated the pending development of NuVasive's Pulse
platform will not impact their purchasing decision on robotics. These respondents
averaged ~11% NuVasive implant share.
64/140 respondents (46%) are not aware of NuVasive's Pulse platform. These
respondents averaged ~5% NuVasive implant share.
21
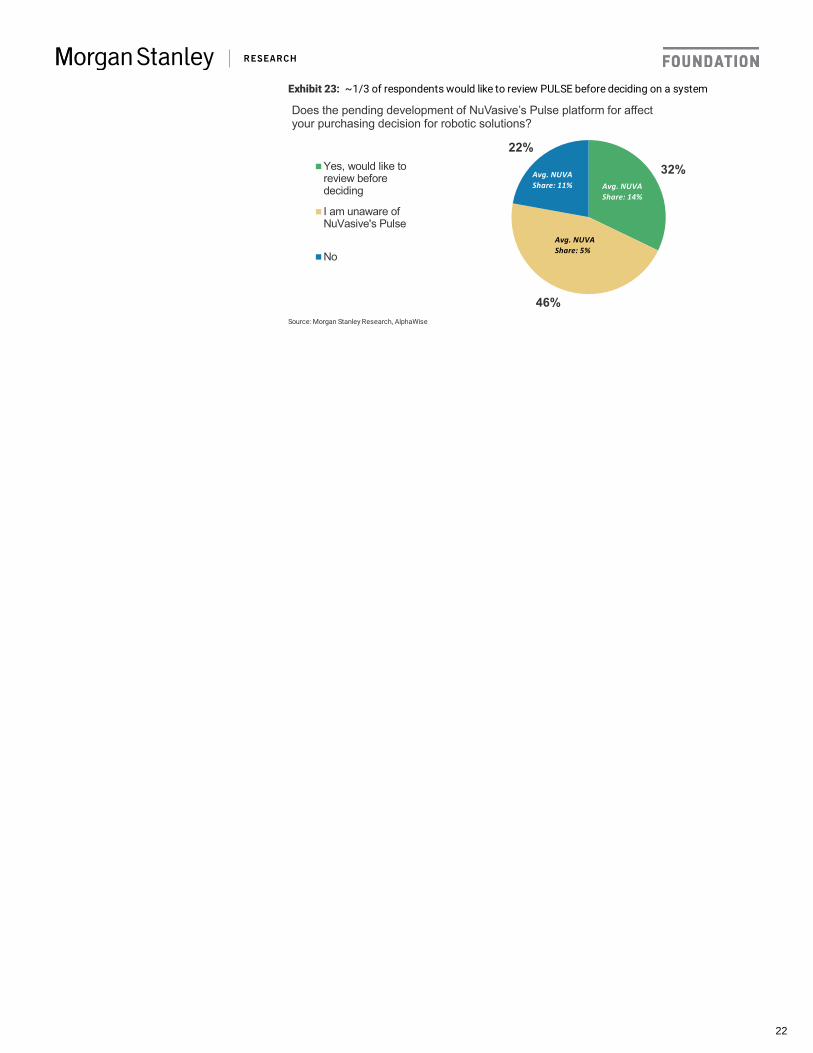
Exhibit 23: ~1/3 of respondents would like to review PULSE before deciding on a system
32%
46%
22%
Does the pending development of NuVasive’s Pulse platform for affectyour purchasing decision for robotic solutions?
Yes, would like toreview beforedeciding
I am unaware ofNuVasive's Pulse
No
Avg. NUVAShare: 11% Avg. NUVA
Share: 14%
Avg. NUVAShare: 5%
Source: Morgan Stanley Research, AlphaWise
22
Stryker / K2M: Only Time Will Tell
From the Survey
We surveyed respondents regarding any potential changes they have seen or noticed in
sales rep relationships or product offerings following Stryker's acquisition of K2M in
August 2018. Responses were tracked and analyzed to include only respondents with
>0% share for Stryker and/or K2M (80 respondents or ~57%), however we note that
only 18 respondents (~13%) have >0% share for both Stryker and K2M. See Exhibit 24
for corresponding data on Stryker and K2M rep changes.
What the data said:
The Takeaway
Why spine? Stryker announced the acquisition of K2M in August 2018 for ~$1.4bn (see
Why Spine?). We discussed historical challenges with spine acquisitions given sales force
integration disruptions; however, we were slightly more optimistic on this deal given (1)
<10% sales force overlap between the two companies, (2) K2M provides a refresh of
Stryker's deformity portfolio, and (3) K2M CEO Eric Major is leading the new division.
Our M&A analysis suggested defensible returns of 7-8% by 2022.
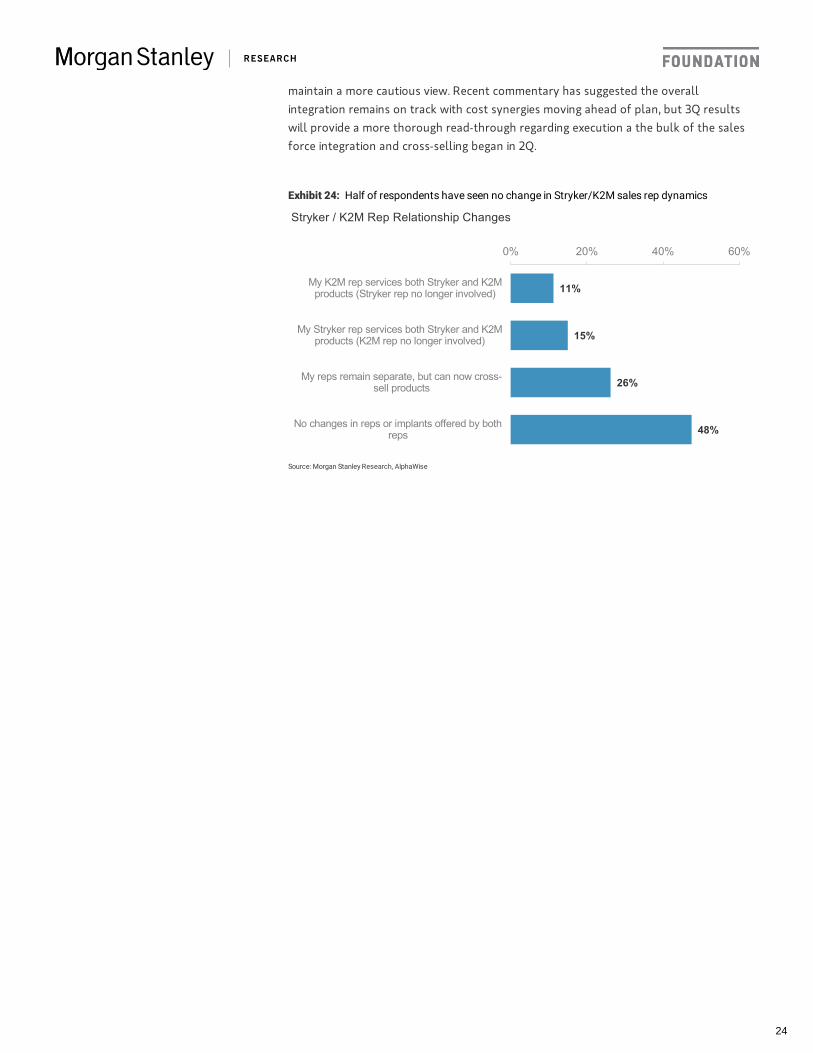
Survey suggests little disruption to date; however, that could be a factor of timing. Our
survey data implies little disruption thus far in the integration process as ~50% of
respondents have not noticed any changes in reps or products, with another 25% seeing
no change in reps, only increased breadth of product offered. However, this could be a
factor of timing as our survey was deployed in late 1Q and was likely too early in the
integration to make an adequate judgement. During our CEO meeting (see here),
management admitted integration challenges were seen in 1H, although these were fully
anticipated. We previewed spine weakness ahead of 2Q results as the bulk of the cross-
training / selling was set to occur in 2Q, and results of ~2% pro-forma growth in 2Q did
not signal an improvement vs. 1Q.
We remain cautious on Stryker's spine during the integration. Management has
reiterated commitment to mid single digit pro-forma spine growth in 2019, however we
note following 2% pro-forma growth in 1H the segment needs to average ~8% growth
for the remainder of the year to reach 5%. While 1H results were not alarming, we
9/80 respondents (11%) stated their K2M rep services both Stryker and K2M
products (Stryker rep is no longer involved).
12/80 respondents (15%) stated their Stryker rep services both Stryker and K2M
products (K2M rep is no longer involved).
21/80 respondents (26%) stated reps remain separate, however reps can now offer
both Stryker and K2M products.
38/80 respondents (48%) have not seen a change in reps or implants offered by
either Stryker or K2M rep.
23
maintain a more cautious view. Recent commentary has suggested the overall
integration remains on track with cost synergies moving ahead of plan, but 3Q results
will provide a more thorough read-through regarding execution a the bulk of the sales
force integration and cross-selling began in 2Q.
Exhibit 24: Half of respondents have seen no change in Stryker/K2M sales rep dynamics
11%
15%
26%
48%
0% 20% 40% 60%
My K2M rep services both Stryker and K2Mproducts (Stryker rep no longer involved)
My Stryker rep services both Stryker and K2Mproducts (K2M rep no longer involved)
My reps remain separate, but can now cross-sell products
No changes in reps or implants offered by bothreps
Stryker / K2M Rep Relationship Changes
Source: Morgan Stanley Research, AlphaWise
24

SI Joint Fusion
From the Survey
We surveyed respondents on various dynamics in sacroiliac joint (SI joint) fusion. All
respondents were asked (i) opinions on market sizing as it relates to % of lower back
pain attributable to the SI joint, (ii) monthly procedure volume, (iii) adequate physician
reimbursement rates, (iv) barriers to adoption. Subsequently, among the 75 that
currently perform SI joint fusion, we inquired about ( i) approximate market share
among vendors, (ii) most important considerations when choosing an implant provider.
See Exhibit 25, Exhibit 26, Exhibit 27, Exhibit 29, Exhibit 28, and Exhibit 30 for
corresponding data on SI joint fusion. We discuss this market in great detail in our Si-
Bone initiation of coverage (see The Other Kind of Fusion).
What the data said:
The Takeaway
Respondents view the market for SI joint fusion as smaller than our estimate. On
average, our survey respondents believe ~11% of lower back pain is attributable to the SI
joint, roughly half of our 22.5% estimate and lower than the 15-30% range discussed in
published literature. Unlike lower back pain in general, the esoteric nature of the
sacroiliac joints to the average patient makes it slightly more difficult for patients to
identify the source of pain, thus more challenging to estimate the true prevalence of SI
joint pain. Our respondents market estimate was not overly surprising to us, as this has
been a key debate in the adoption views of SI joint fusion. Our market model (assuming
22.5% of LBP is attributable to the SI joint) implies a market opportunity of 900k-1mn SI
joint fusion procedures per year or a ~$1bn TAM. Using this estimate, our model implies
75/140 (54%) of respondents currently perform SI joint fusion, which is expected to
grow to 91 (65%) one-year from now and 98 (70%) three-years from now.
Respondents view an average of ~11% of lower back pain as attributable to the SI
joint, with 78% responding within the range of 10-20%.
Respondents perform an average of 2.5 SIJF procedures per month, up from 1.8
one-year ago, and expected to grow to 3.7 and 5.6 per month one and three years
from now, respectively.
Clinical data is the most important consideration among respondents when
choosing a provider of SIJF implants, followed by ease of procedure and
cost/economics.
Diagnosis difficulty was the #1 barrier to adoption among our respondents,
followed by non-surgical alternatives being equally effective and physician training.
Respondents on average view $1,225 as an adequate level of physician
reimbursement for minimally invasive SI joint fusion, with $1k as the median (note
current physician reimbursement ~$715).
25

~10% market penetration. If we adjust to cut our market estimate in half (consistent
with our survey), the new implied TAM would drop to ~$500mn to which the market
would be ~20% penetrated. See our Si-Bone Initiation of Coverage for a more detailed
breakdown of our market assumptions.
Irrespective of TAM, the SI joint fusion market is growing rapidly. Among all
respondents, SI joint fusion procedures are projected to grow at a ~31% CAGR over the
next three years. As the market leader with 70-80% market share (underrepresented in
our survey), Si-Bone stands to benefit the most given (i) significant investment in market
development via surgeon training and education, (ii) sales force hires, and (iii) clinically
differentiated implant as we will discuss below. Our respondent data supports our
thesis of market growth and inflection leaving us comfortable in Si-Bone's topline
acceleration, growing at a ~24% CAGR over the next three years. As we have discussed
(see here and here), we expect 2H19 to be a more material inflection point for the
company as (1) sales rep hires from 2H18 / 1H19 begin to contribute, (2) there is
continued focus on surgeon education expanding active surgeons by 100 y/y, and (3)
incremental payor coverage decisions.
Clinical data as most important vendor consideration significantly favors Si-Bone. Si-
Bone's patented triangular implant, iFuse, is backed by two randomized trials and
multiple peer review studies in which iFuse was shown to significantly decrease pain vs.
non-surgical management and is the only implant for SIJF that has supporting clinical
evidence in randomized trials. This data arsenal alongside the support of leading clinical
societies (NASS, ISASS, etc.) has helped catalyze momentum in building a significant
foundation of ~260mn covered lives, and obtaining reimbursement coverage from the
larger commercial payors is the next frontier, which we have discussed is likely catalyzed
by five-year follow-up data later this summer / early fall. We are unaware of any
competitors engaging in clinical studies for their screw implants, and are thus
comfortable with Si-Bone maintaining majority market share.
Various hurdles preventing broad-based adoption. Our extensive diligence has
suggested many physicians are unwilling to routinely perform SI joint fusions for a
variety of reasons stemming from lack of surgeon training and awareness, to inadequate
reimbursement coverage. Our respondents view diagnosis difficulty as the primary
barrier to broad based adoption, given the standard diagnostic process is relatively
subjective and includes a series of provocative tests. Although physician reimbursement
was noted as the least significant factor preventing broader adoption, this may be
underrepresented in our survey given the following chart (Exhibit 30) clearly cites
reimbursement as inadequate and our conversations has suggested this is a key hurdle,
as we will discuss further below.
Current physician reimbursement is insufficient. We have discussed current physician
reimbursement rates of $715 for minimally invasive SI joint fusion as insufficient and a
primary hinderance of physician willingness to perform the procedure. In July, CMS
released proposed rates for FY20, and there was no change to payments for minimally
invasive SI joint fusion (see Three Codes; Four Implications). Recall in 2017 CMS had
raised CPT code 27279 as potentially misvalued suggesting stakeholders were
recommending an increase in RVU to 14.23 (~$900), however language in this year’s
federal register suggests stakeholders have suggested an RVU of 20 (in-line with open
SIJF) may be more appropriate (~$1.1k). Although CMS has proposed to maintain the
26

RVU and payment rate essentially constant vs last year, the organization will be
soliciting public comments. We have discussed an increase to ~$1k would be more in line
with comparable procedures and is likely to drive additional physician interest in
performing the procedure, which is consistent with respondent data from our survey.
We note current Si-Bone guidance does not incorporate any changes to reimbursement
rates, and any increases in rates is likely an upside catalyst for procedure volume.
Exhibit 25: % of Lower Back Pain Attributable to the SI Joint
9%
45%
33%
11%
3%
0% 20% 40% 60%
The SI joint is not a primarysource of lower back pain
<10%
11-20%
21-30%
>30%
What percent of lower back pain is directly attributable to theSacroiliac (SI) joint?
Average: 11%
Source: Morgan Stanley Research, AlphaWise
Exhibit 26: SIJF Procedure Volume Growth
1.82.5
3.7
5.6
3.3
4.6
6.3
8.3
0.0 0.00.7
2.4
0.01.02.03.04.05.06.07.08.09.0
1-Year Ago Today 1-Year From Now 3-Years From Now
Average Number of SI Joint Fusion Procedures per Month
All SIJF Users Non-SIJF Users
Source: Morgan Stanley Research, AlphaWise
Exhibit 27: SI Joint Fusion Market Share
45%
26%
19%
6%4%
46%
28%
16%
6% 4%
45%
31%
16%
5% 4%
44%
31%
15%
5% 5%
0%
10%
20%
30%
40%
50%
Medtronic (Rialto) SI-BONE (iFuse) Globus Medical(SI-LOK)
RTI Surgical / Zyga(SImmetry)
Other
SI Joint Fusion Implant Share by Vendor
1 Year Ago Current 1 Year From Now 3 Years From Now
Source: Morgan Stanley Research, AlphaWise
27

Exhibit 28: Clinical data is most important to respondents when choosing an SIJF provider
1.8
2.3
2.9
3.7
4.2
1 2 3 4 5
Clinical Data / Effectiveness
Ease of Procedure
Cost / Economics
Sales Rep
Implant Bundling
When choosing a provider for SI joint fusion implants, what is mostimportant? (1=Most Important; 5=Least Important)
Source: Morgan Stanley Research, AlphaWise
Exhibit 29: Most Common Barriers to Adoption in SI Joint Fusion
2.5
2.8
2.9
3.2
3.6
1 2 3 4 5
Diagnosisdifficulty
Non-surgical alternativesare equally effective
Physiciantraining
Commercial payorcoverage
Physicianreimbursement
Barriers to Adoption of SI Joint Fusion (1=Most Significant; 5=LeastSignificant)
Source: Morgan Stanley Research, AlphaWise
Exhibit 30: Respondents believe $1-1.3k is an adequate level of physician reimbursement
20%
4%
4%
4%
29%
0%
9%
1%
1%
28%
0% 10% 20% 30% 40% 50%
<$715
$716-800
$801-900
$900-1000
$1000-1100
$1100-1200
$1200-1300
$1300-1400
$1400-1500
>$1500
Satisfactory level of physician reimbursement for minimally invasiveSI joint fusion
Average: ~$1,225Median: ~$,1000
Source: Morgan Stanley Research, AlphaWise
28
Key Exhibits
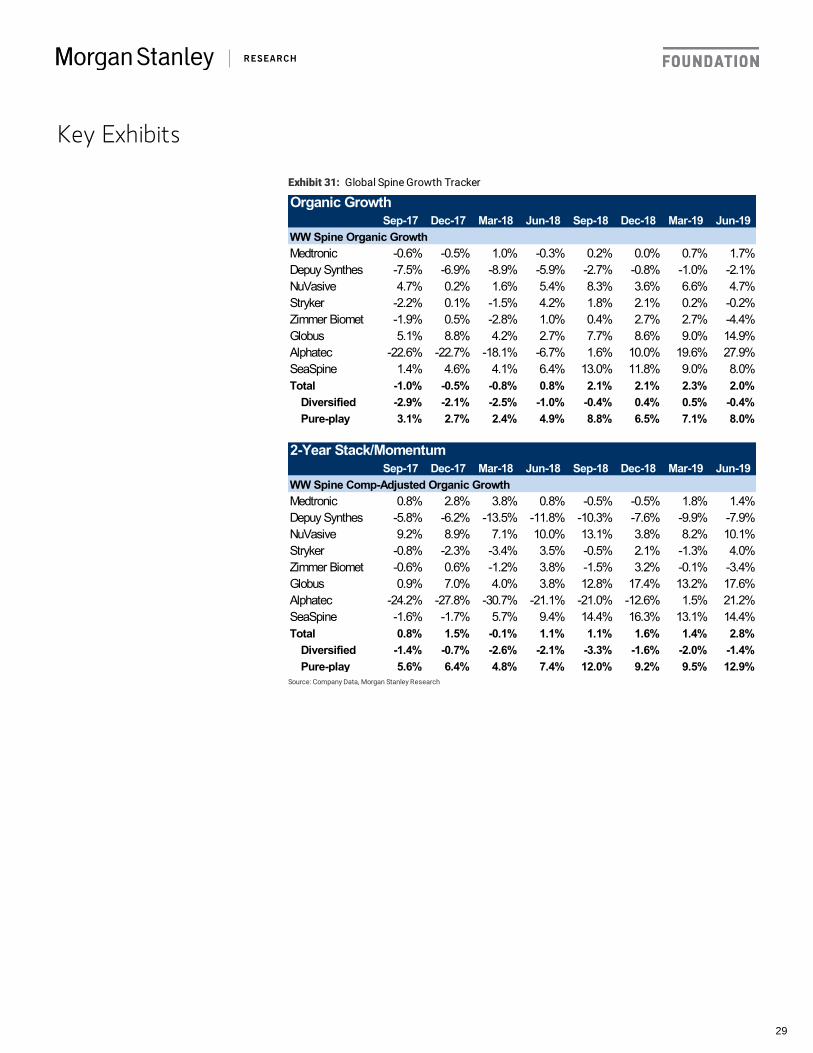
Exhibit 31: Global Spine Growth Tracker
Organic GrowthSep-17 Dec-17 Mar-18 Jun-18 Sep-18 Dec-18 Mar-19 Jun-19
WW Spine Organic GrowthMedtronic -0.6% -0.5% 1.0% -0.3% 0.2% 0.0% 0.7% 1.7%Depuy Synthes -7.5% -6.9% -8.9% -5.9% -2.7% -0.8% -1.0% -2.1%NuVasive 4.7% 0.2% 1.6% 5.4% 8.3% 3.6% 6.6% 4.7%Stryker -2.2% 0.1% -1.5% 4.2% 1.8% 2.1% 0.2% -0.2%Zimmer Biomet -1.9% 0.5% -2.8% 1.0% 0.4% 2.7% 2.7% -4.4%Globus 5.1% 8.8% 4.2% 2.7% 7.7% 8.6% 9.0% 14.9%Alphatec -22.6% -22.7% -18.1% -6.7% 1.6% 10.0% 19.6% 27.9%SeaSpine 1.4% 4.6% 4.1% 6.4% 13.0% 11.8% 9.0% 8.0%Total -1.0% -0.5% -0.8% 0.8% 2.1% 2.1% 2.3% 2.0%
Diversified -2.9% -2.1% -2.5% -1.0% -0.4% 0.4% 0.5% -0.4%Pure-play 3.1% 2.7% 2.4% 4.9% 8.8% 6.5% 7.1% 8.0%
2-Year Stack/MomentumSep-17 Dec-17 Mar-18 Jun-18 Sep-18 Dec-18 Mar-19 Jun-19
WW Spine Comp-Adjusted Organic GrowthMedtronic 0.8% 2.8% 3.8% 0.8% -0.5% -0.5% 1.8% 1.4%Depuy Synthes -5.8% -6.2% -13.5% -11.8% -10.3% -7.6% -9.9% -7.9%NuVasive 9.2% 8.9% 7.1% 10.0% 13.1% 3.8% 8.2% 10.1%Stryker -0.8% -2.3% -3.4% 3.5% -0.5% 2.1% -1.3% 4.0%Zimmer Biomet -0.6% 0.6% -1.2% 3.8% -1.5% 3.2% -0.1% -3.4%Globus 0.9% 7.0% 4.0% 3.8% 12.8% 17.4% 13.2% 17.6%Alphatec -24.2% -27.8% -30.7% -21.1% -21.0% -12.6% 1.5% 21.2%SeaSpine -1.6% -1.7% 5.7% 9.4% 14.4% 16.3% 13.1% 14.4%Total 0.8% 1.5% -0.1% 1.1% 1.1% 1.6% 1.4% 2.8%
Diversified -1.4% -0.7% -2.6% -2.1% -3.3% -1.6% -2.0% -1.4%Pure-play 5.6% 6.4% 4.8% 7.4% 12.0% 9.2% 9.5% 12.9%
Source: Company Data, Morgan Stanley Research
29

Exhibit 32: Recent Spine M&A Deals
Date Acquiror Target Value ($bn)Jun-16 Zimmer Biomet LDR $1.0Jul-16 Zimmer Biomet Medtech $0.2Jul-16 Globus Alphatec Int'l $0.1Jan-17 J&J Interventional Spine N/AJun-17 J&J Sentio N/AAug-17 Globus KB Medical N/ASep-17 NuVasive Vertera N/ADec-17 NuVasive SafePassage N/AFeb-18 Stryker Vexim $0.2Aug-18 Stryker K2 $1.4Sep-18 J&J EIT N/ASep-18 Globus Surgimap N/ASep-18 Medtronic Mazor $1.6May-19 Medtronic Titan Spine N/ASep-19 Stryker Mobius $0.5Total $5.0
Source: Company Data, Morgan Stanley ResearchNote: Includes select M&A deals in Spine since June 2016
30
Valuation Methodology & Risks
GMED.N
Our $45 price target is based on 15x 2020 EBITDA, in-line with SMID cap device peers
which we see as warranted given outsized organic growth profile, however offset by
exposure to a lower growth end-market and limited margin expansion opportunities
Key risks to our price target include (i) increases in turnover among sales force or
distributors, (ii) ineffective balance sheet deployment, (iii) margins move significantly
lower and, (iv) robotics uptake / competition.
JNJ.N
Our price target of $145 for JNJ is based on a 15.8x multiple off of our base case 2020e
EPS. We assume J&J trades at a slight discount to the S&P 500 given growth
acceleration in Pharma and a flexible balance sheet. Pharma slows in 2019 given several
competitive headwinds but this is offset by pipeline contributions and improvement on
Devices and Consumer. J&J trades at a greater discount to the S&P than historical levels
given higher Pharma mix. Talc litigation remains an overhang for investors.
Risks to our Equal-weight rating include (i)Pharma pipeline is unable to offset biosimilar
and competitive risks, (ii)Margin expansion initiatives fail to materialize and/or pricing and
mix become material headwinds, (iii) Turnarounds in Consumer and MD&D fail to
materialize or occur more slowly than expected, (iv) Bear case in talc litigation plays out.
MDT.N
Our price target of $111 reflects ~19x our CY20e EPS, a ~2 turn discount to large cap
peers. Medtronic's long-term profile is mid-single digit organic growth, with 40-50 bps of
margin expansion, and high-single-digit EPS growth for a 10% total return profile.
However, questions about the durability and achievability of this profile in FY20 lead to
a discount versus peers.
Key risks to our price target include: (i) Material competitive landscape changes (SCS,
CRM, DBS, TAVR, DCB, and LINQ); (ii) A slowdown or acceleration in emerging markets;
and (iii) Lower repurchase activity or a material acquisition.
NUVA.O
Our price target of $67. Derived from our base case scenario. Our 14x EV/EBITDA
multiple reflects a 1 turn discount to SMID cap peers, which we believe is justified given
the outsized exposure to a pressured end-market. Organic sales growth maintains mid-
single digit levels while the company drives 50-100 bps of annual margin improvements.
Robotics does not make a material impact in the spine market in the near-term.
Key risks to our price target include (i) industry consolidation, (ii) poor execution on
acquisitions, (iii) margins trend significantly higher or lower than our expectations and (iv)
large, diversified spine players, make above market growth more difficult.
SIBN.O
Our price target of $24 for Si-Bone is based on our DCF valuation assuming a ~9.5%
31

WACC. We model terminal year operating margins at ~25%, similar to spine
comparables. Our price target implies a ~6.8x multiple to our base case 2020e sales,
which is a premium to core spine comparables given outsized growth, and a slight
discount to high growth SMID cap device companies given acceleration in the business
has yet to be proven out.
Risks to our price target include (i) inability to gain additional reimbursement coverage
from commercial payors, (ii) physician interest remains limited given relatively low
reimbursement, (iii) SI joint fusion market does not develop as expected and operates as
a small niche market, and (iv) limited visibility into pipeline efforts or additional product
offerings beyond iFuse.
SYK.N
Our price target for SYK is $230. Our 25x multiple is a four turn premium to peers and
reflects Stryker's above-peer top-line growth, diversity in revenue, its opportunities for
leverage, and additional balance sheet capacity.
Risks to our price target include: organic sales growth slows, lower than expected
growth in orthopedic procedure volumes, slower growth in hospital capital spending,
sage business does not recover as anticipated and, dilutive capital deployment.
ZBH.N
Our price target for ZBH is $150. Derived from base case scenario. We value Zimmer
Biomet at 18x 2020 EPS. Our 18x multiple is a ~3 turn discount to peers, given outsized
exposure to the slow growth recon end market and a challenged balance sheet..
Risks to our price target include (i) pricing pressure may accelerate and pressure growth
and gross margins, (ii) cash flow generation may be less than we anticipate, (iii) Execution
on supply recovery continues to take longer, (iv) Warning letter leads to further action
by FDA impacting sales and costs and, (v) Stryker's Mako launch drives material share
away from Zimmer Biomet.
32
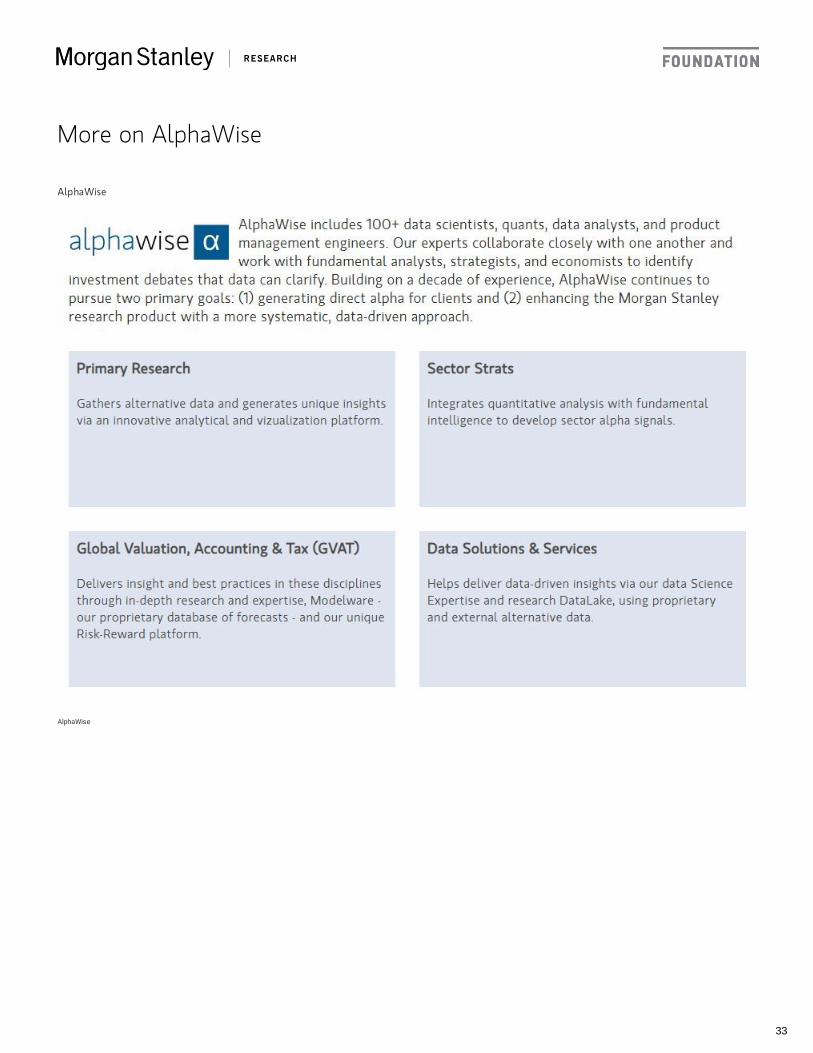
More on AlphaWise
AlphaWise
AlphaWise
33

Disclosure SectionThe information and opinions in Morgan Stanley Research were prepared by Morgan Stanley & Co. LLC, and/or Morgan Stanley C.T.V.M. S.A., and/or MorganStanley Mexico, Casa de Bolsa, S.A. de C.V., and/or Morgan Stanley Canada Limited. As used in this disclosure section, "Morgan Stanley" includes MorganStanley & Co. LLC, Morgan Stanley C.T.V.M. S.A., Morgan Stanley Mexico, Casa de Bolsa, S.A. de C.V., Morgan Stanley Canada Limited and their affiliatesas necessary.For important disclosures, stock price charts and equity rating histories regarding companies that are the subject of this report, please see the MorganStanley Research Disclosure Website at www.morganstanley.com/researchdisclosures, or contact your investment representative or Morgan StanleyResearch at 1585 Broadway, (Attention: Research Management), New York, NY, 10036 USA.For valuation methodology and risks associated with any recommendation, rating or price target referenced in this research report, please contact the ClientSupport Team as follows: US/Canada +1 800 303-2495; Hong Kong +852 2848-5999; Latin America +1 718 754-5444 (U.S.); London +44 (0)20-7425-8169;Singapore +65 6834-6860; Sydney +61 (0)2-9770-1505; Tokyo +81 (0)3-6836-9000. Alternatively you may contact your investment representative or MorganStanley Research at 1585 Broadway, (Attention: Research Management), New York, NY 10036 USA.Analyst CertificationThe following analysts hereby certify that their views about the companies and their securities discussed in this report are accurately expressed and that theyhave not received and will not receive direct or indirect compensation in exchange for expressing specific recommendations or views in this report: David R.Lewis.Unless otherwise stated, the individuals listed on the cover page of this report are research analysts.Global Research Conflict Management PolicyMorgan Stanley Research has been published in accordance with our conflict management policy, which is available atwww.morganstanley.com/institutional/research/conflictpolicies. A Portuguese version of the policy can be found at www.morganstanley.com.brImportant US Regulatory Disclosures on Subject CompaniesA household member of the following analyst or strategist is an employee, officer, director or has another position at a company named within the research:David R. Lewis; IRHYTHM TECHNOLOGIES INC, David R. Lewis; Nevro Corp, David R. Lewis; Shockwave Medical Inc., David R. Lewis; SI-BONE Inc., DavidR. Lewis; Transmedics Group Inc.As of August 30, 2019, Morgan Stanley beneficially owned 1% or more of a class of common equity securities of the following companies covered in MorganStanley Research: Abbott Laboratories, Baxter International, Becton Dickinson, DexCom Inc, Intuitive Surgical Inc., SI-BONE Inc..Within the last 12 months, Morgan Stanley managed or co-managed a public offering (or 144A offering) of securities of Axonics Modulation Technologies Inc.,Baxter International, Insulet Corp., IRHYTHM TECHNOLOGIES INC, Shockwave Medical Inc., SI-BONE Inc., Transmedics Group Inc.Within the last 12 months, Morgan Stanley has received compensation for investment banking services from Abbott Laboratories, Axonics ModulationTechnologies Inc., Baxter International, Insulet Corp., IRHYTHM TECHNOLOGIES INC, Medtronic PLC, Shockwave Medical Inc., SI-BONE Inc., StrykerCorporation, Transmedics Group Inc.In the next 3 months, Morgan Stanley expects to receive or intends to seek compensation for investment banking services from Abbott Laboratories, Abiomed,Alcon Inc, Avanos Medical Inc, Axonics Modulation Technologies Inc., Baxter International, Becton Dickinson, Boston Scientific, DexCom Inc, EdwardsLifesciences, Globus Medical Inc, Haemonetics Corporation, Hill-Rom Holdings Inc., Hologic, Inc., Insulet Corp., Intuitive Surgical Inc., IRHYTHMTECHNOLOGIES INC, Johnson & Johnson, Medtronic PLC, Nevro Corp, NuVasive Inc, Shockwave Medical Inc., SI-BONE Inc., Stryker Corporation, TeleflexInc., Transmedics Group Inc, ViewRay Inc, Zimmer Biomet Holdings Inc.Within the last 12 months, Morgan Stanley has received compensation for products and services other than investment banking services from AbbottLaboratories, Becton Dickinson, Boston Scientific, Edwards Lifesciences, Hologic, Inc., Johnson & Johnson, Medtronic PLC, Stryker Corporation, TeleflexInc., Zimmer Biomet Holdings Inc.Within the last 12 months, Morgan Stanley has provided or is providing investment banking services to, or has an investment banking client relationship with,the following company: Abbott Laboratories, Abiomed, Alcon Inc, Avanos Medical Inc, Axonics Modulation Technologies Inc., Baxter International, BectonDickinson, Boston Scientific, DexCom Inc, Edwards Lifesciences, Globus Medical Inc, Haemonetics Corporation, Hill-Rom Holdings Inc., Hologic, Inc., InsuletCorp., Intuitive Surgical Inc., IRHYTHM TECHNOLOGIES INC, Johnson & Johnson, Medtronic PLC, Nevro Corp, NuVasive Inc, Shockwave Medical Inc., SI-BONE Inc., Stryker Corporation, Teleflex Inc., Transmedics Group Inc, ViewRay Inc, Zimmer Biomet Holdings Inc.Within the last 12 months, Morgan Stanley has either provided or is providing non-investment banking, securities-related services to and/or in the past hasentered into an agreement to provide services or has a client relationship with the following company: Abbott Laboratories, Baxter International, BectonDickinson, Boston Scientific, Edwards Lifesciences, Hologic, Inc., Johnson & Johnson, Medtronic PLC, Nevro Corp, Stryker Corporation, Teleflex Inc., ZimmerBiomet Holdings Inc.Morgan Stanley & Co. LLC makes a market in the securities of Abbott Laboratories, Abiomed, Avanos Medical Inc, Baxter International, Becton Dickinson,Boston Scientific, DexCom Inc, Edwards Lifesciences, Globus Medical Inc, Hill-Rom Holdings Inc., Hologic, Inc., Insulet Corp., Intuitive Surgical Inc., Johnson& Johnson, Medtronic PLC, Nevro Corp, NuVasive Inc, Shockwave Medical Inc., SI-BONE Inc., Stryker Corporation, Zimmer Biomet Holdings Inc.The equity research analysts or strategists principally responsible for the preparation of Morgan Stanley Research have received compensation based uponvarious factors, including quality of research, investor client feedback, stock picking, competitive factors, firm revenues and overall investment bankingrevenues. Equity Research analysts' or strategists' compensation is not linked to investment banking or capital markets transactions performed by MorganStanley or the profitability or revenues of particular trading desks.Morgan Stanley and its affiliates do business that relates to companies/instruments covered in Morgan Stanley Research, including market making, providingliquidity, fund management, commercial banking, extension of credit, investment services and investment banking. Morgan Stanley sells to and buys fromcustomers the securities/instruments of companies covered in Morgan Stanley Research on a principal basis. Morgan Stanley may have a position in the debtof the Company or instruments discussed in this report. Morgan Stanley trades or may trade as principal in the debt securities (or in related derivatives) thatare the subject of the debt research report.Certain disclosures listed above are also for compliance with applicable regulations in non-US jurisdictions.STOCK RATINGSMorgan Stanley uses a relative rating system using terms such as Overweight, Equal-weight, Not-Rated or Underweight (see definitions below). MorganStanley does not assign ratings of Buy, Hold or Sell to the stocks we cover. Overweight, Equal-weight, Not-Rated and Underweight are not the equivalent ofbuy, hold and sell. Investors should carefully read the definitions of all ratings used in Morgan Stanley Research. In addition, since Morgan Stanley Researchcontains more complete information concerning the analyst's views, investors should carefully read Morgan Stanley Research, in its entirety, and not infer thecontents from the rating alone. In any case, ratings (or research) should not be used or relied upon as investment advice. An investor's decision to buy or sell astock should depend on individual circumstances (such as the investor's existing holdings) and other considerations.Global Stock Ratings Distribution(as of August 31, 2019)
34

The Stock Ratings described below apply to Morgan Stanley's Fundamental Equity Research and do not apply to Debt Research produced by the Firm.For disclosure purposes only (in accordance with NASD and NYSE requirements), we include the category headings of Buy, Hold, and Sell alongside ourratings of Overweight, Equal-weight, Not-Rated and Underweight. Morgan Stanley does not assign ratings of Buy, Hold or Sell to the stocks we cover.Overweight, Equal-weight, Not-Rated and Underweight are not the equivalent of buy, hold, and sell but represent recommended relative weightings (seedefinitions below). To satisfy regulatory requirements, we correspond Overweight, our most positive stock rating, with a buy recommendation; we correspondEqual-weight and Not-Rated to hold and Underweight to sell recommendations, respectively.
COVERAGE UNIVERSE INVESTMENT BANKING CLIENTS (IBC) OTHER MATERIALINVESTMENT SERVICES
CLIENTS (MISC)STOCK RATINGCATEGORY
COUNT % OFTOTAL
COUNT % OFTOTAL IBC
% OFRATING
CATEGORY
COUNT % OFTOTAL
OTHERMISC
Overweight/Buy 1126 36% 290 43% 26% 522 37%Equal-weight/Hold 1432 46% 306 46% 21% 661 47%Not-Rated/Hold 1 0% 0 0% 0% 1 0%Underweight/Sell 568 18% 74 11% 13% 231 16%TOTAL 3,127 670 1415
Data include common stock and ADRs currently assigned ratings. Investment Banking Clients are companies from whom Morgan Stanley received investmentbanking compensation in the last 12 months. Due to rounding off of decimals, the percentages provided in the "% of total" column may not add up to exactly100 percent.Analyst Stock RatingsOverweight (O). The stock's total return is expected to exceed the average total return of the analyst's industry (or industry team's) coverage universe, on arisk-adjusted basis, over the next 12-18 months.Equal-weight (E). The stock's total return is expected to be in line with the average total return of the analyst's industry (or industry team's) coverage universe,on a risk-adjusted basis, over the next 12-18 months.Not-Rated (NR). Currently the analyst does not have adequate conviction about the stock's total return relative to the average total return of the analyst'sindustry (or industry team's) coverage universe, on a risk-adjusted basis, over the next 12-18 months.Underweight (U). The stock's total return is expected to be below the average total return of the analyst's industry (or industry team's) coverage universe, on arisk-adjusted basis, over the next 12-18 months.Unless otherwise specified, the time frame for price targets included in Morgan Stanley Research is 12 to 18 months.Analyst Industry ViewsAttractive (A): The analyst expects the performance of his or her industry coverage universe over the next 12-18 months to be attractive vs. the relevant broadmarket benchmark, as indicated below.In-Line (I): The analyst expects the performance of his or her industry coverage universe over the next 12-18 months to be in line with the relevant broad marketbenchmark, as indicated below.Cautious (C): The analyst views the performance of his or her industry coverage universe over the next 12-18 months with caution vs. the relevant broad marketbenchmark, as indicated below.Benchmarks for each region are as follows: North America - S&P 500; Latin America - relevant MSCI country index or MSCI Latin America Index; Europe -MSCI Europe; Japan - TOPIX; Asia - relevant MSCI country index or MSCI sub-regional index or MSCI AC Asia Pacific ex Japan Index.Important Disclosures for Morgan Stanley Smith Barney LLC CustomersImportant disclosures regarding the relationship between the companies that are the subject of Morgan Stanley Research and Morgan Stanley Smith BarneyLLC or Morgan Stanley or any of their affiliates, are available on the Morgan Stanley Wealth Management disclosure website atwww.morganstanley.com/online/researchdisclosures. For Morgan Stanley specific disclosures, you may refer towww.morganstanley.com/researchdisclosures.Each Morgan Stanley Equity Research report is reviewed and approved on behalf of Morgan Stanley Smith Barney LLC. This review and approval is conductedby the same person who reviews the Equity Research report on behalf of Morgan Stanley. This could create a conflict of interest.Other Important DisclosuresMorgan Stanley & Co. International PLC and its affiliates have a significant financial interest in the debt securities of Abbott Laboratories, Avanos Medical Inc,Baxter International, Becton Dickinson, Boston Scientific, DexCom Inc, Edwards Lifesciences, Hologic, Inc., Insulet Corp., Johnson & Johnson, Nevro Corp,Stryker Corporation.Morgan Stanley Research policy is to update research reports as and when the Research Analyst and Research Management deem appropriate, based ondevelopments with the issuer, the sector, or the market that may have a material impact on the research views or opinions stated therein. In addition, certainResearch publications are intended to be updated on a regular periodic basis (weekly/monthly/quarterly/annual) and will ordinarily be updated with thatfrequency, unless the Research Analyst and Research Management determine that a different publication schedule is appropriate based on current conditions.Morgan Stanley is not acting as a municipal advisor and the opinions or views contained herein are not intended to be, and do not constitute, advice within themeaning of Section 975 of the Dodd-Frank Wall Street Reform and Consumer Protection Act.Morgan Stanley produces an equity research product called a "Tactical Idea." Views contained in a "Tactical Idea" on a particular stock may be contrary to therecommendations or views expressed in research on the same stock. This may be the result of differing time horizons, methodologies, market events, or otherfactors. For all research available on a particular stock, please contact your sales representative or go to Matrix at http://www.morganstanley.com/matrix.Morgan Stanley Research is provided to our clients through our proprietary research portal on Matrix and also distributed electronically by Morgan Stanley toclients. Certain, but not all, Morgan Stanley Research products are also made available to clients through third-party vendors or redistributed to clients throughalternate electronic means as a convenience. For access to all available Morgan Stanley Research, please contact your sales representative or go to Matrix athttp://www.morganstanley.com/matrix.Any access and/or use of Morgan Stanley Research is subject to Morgan Stanley's Terms of Use (http://www.morganstanley.com/terms.html). By accessing
35
and/or using Morgan Stanley Research, you are indicating that you have read and agree to be bound by our Terms of Use(http://www.morganstanley.com/terms.html). In addition you consent to Morgan Stanley processing your personal data and using cookies in accordance withour Privacy Policy and our Global Cookies Policy (http://www.morganstanley.com/privacy_pledge.html), including for the purposes of setting your preferencesand to collect readership data so that we can deliver better and more personalized service and products to you. To find out more information about how MorganStanley processes personal data, how we use cookies and how to reject cookies see our Privacy Policy and our Global Cookies Policy(http://www.morganstanley.com/privacy_pledge.html).If you do not agree to our Terms of Use and/or if you do not wish to provide your consent to Morgan Stanley processing your personal data or using cookiesplease do not access our research.Morgan Stanley Research does not provide individually tailored investment advice. Morgan Stanley Research has been prepared without regard to thecircumstances and objectives of those who receive it. Morgan Stanley recommends that investors independently evaluate particular investments andstrategies, and encourages investors to seek the advice of a financial adviser. The appropriateness of an investment or strategy will depend on an investor'scircumstances and objectives. The securities, instruments, or strategies discussed in Morgan Stanley Research may not be suitable for all investors, andcertain investors may not be eligible to purchase or participate in some or all of them. Morgan Stanley Research is not an offer to buy or sell or the solicitationof an offer to buy or sell any security/instrument or to participate in any particular trading strategy. The value of and income from your investments may varybecause of changes in interest rates, foreign exchange rates, default rates, prepayment rates, securities/instruments prices, market indexes, operational orfinancial conditions of companies or other factors. There may be time limitations on the exercise of options or other rights in securities/instrumentstransactions. Past performance is not necessarily a guide to future performance. Estimates of future performance are based on assumptions that may not berealized. If provided, and unless otherwise stated, the closing price on the cover page is that of the primary exchange for the subject company'ssecurities/instruments.The fixed income research analysts, strategists or economists principally responsible for the preparation of Morgan Stanley Research have receivedcompensation based upon various factors, including quality, accuracy and value of research, firm profitability or revenues (which include fixed income tradingand capital markets profitability or revenues), client feedback and competitive factors. Fixed Income Research analysts', strategists' or economists'compensation is not linked to investment banking or capital markets transactions performed by Morgan Stanley or the profitability or revenues of particulartrading desks.The "Important US Regulatory Disclosures on Subject Companies" section in Morgan Stanley Research lists all companies mentioned where Morgan Stanleyowns 1% or more of a class of common equity securities of the companies. For all other companies mentioned in Morgan Stanley Research, Morgan Stanleymay have an investment of less than 1% in securities/instruments or derivatives of securities/instruments of companies and may trade them in ways differentfrom those discussed in Morgan Stanley Research. Employees of Morgan Stanley not involved in the preparation of Morgan Stanley Research may haveinvestments in securities/instruments or derivatives of securities/instruments of companies mentioned and may trade them in ways different from thosediscussed in Morgan Stanley Research. Derivatives may be issued by Morgan Stanley or associated persons.With the exception of information regarding Morgan Stanley, Morgan Stanley Research is based on public information. Morgan Stanley makes every effort touse reliable, comprehensive information, but we make no representation that it is accurate or complete. We have no obligation to tell you when opinions orinformation in Morgan Stanley Research change apart from when we intend to discontinue equity research coverage of a subject company. Facts and viewspresented in Morgan Stanley Research have not been reviewed by, and may not reflect information known to, professionals in other Morgan Stanley businessareas, including investment banking personnel.Morgan Stanley Research personnel may participate in company events such as site visits and are generally prohibited from accepting payment by thecompany of associated expenses unless pre-approved by authorized members of Research management.Morgan Stanley may make investment decisions that are inconsistent with the recommendations or views in this report.To our readers based in Taiwan or trading in Taiwan securities/instruments: Information on securities/instruments that trade in Taiwan is distributed by MorganStanley Taiwan Limited ("MSTL"). Such information is for your reference only. The reader should independently evaluate the investment risks and is solelyresponsible for their investment decisions. Morgan Stanley Research may not be distributed to the public media or quoted or used by the public media withoutthe express written consent of Morgan Stanley. Any non-customer reader within the scope of Article 7-1 of the Taiwan Stock Exchange RecommendationRegulations accessing and/or receiving Morgan Stanley Research is not permitted to provide Morgan Stanley Research to any third party (including but notlimited to related parties, affiliated companies and any other third parties) or engage in any activities regarding Morgan Stanley Research which may create orgive the appearance of creating a conflict of interest. Information on securities/instruments that do not trade in Taiwan is for informational purposes only and isnot to be construed as a recommendation or a solicitation to trade in such securities/instruments. MSTL may not execute transactions for clients in thesesecurities/instruments.Morgan Stanley is not incorporated under PRC law and the research in relation to this report is conducted outside the PRC. Morgan Stanley Research doesnot constitute an offer to sell or the solicitation of an offer to buy any securities in the PRC. PRC investors shall have the relevant qualifications to invest insuch securities and shall be responsible for obtaining all relevant approvals, licenses, verifications and/or registrations from the relevant governmentalauthorities themselves. Neither this report nor any part of it is intended as, or shall constitute, provision of any consultancy or advisory service of securitiesinvestment as defined under PRC law. Such information is provided for your reference only.Morgan Stanley Research is disseminated in Brazil by Morgan Stanley C.T.V.M. S.A. located at Av. Brigadeiro Faria Lima, 3600, 6th floor, São Paulo - SP,Brazil; and is regulated by the Comissão de Valores Mobiliários; in Mexico by Morgan Stanley México, Casa de Bolsa, S.A. de C.V which is regulated byComision Nacional Bancaria y de Valores. Paseo de los Tamarindos 90, Torre 1, Col. Bosques de las Lomas Floor 29, 05120 Mexico City; in Japan byMorgan Stanley MUFG Securities Co., Ltd. and, for Commodities related research reports only, Morgan Stanley Capital Group Japan Co., Ltd; in Hong Kongby Morgan Stanley Asia Limited (which accepts responsibility for its contents) and by Morgan Stanley Asia International Limited, Hong Kong Branch; inSingapore by Morgan Stanley Asia (Singapore) Pte. (Registration number 199206298Z) and/or Morgan Stanley Asia (Singapore) Securities Pte Ltd(Registration number 200008434H), regulated by the Monetary Authority of Singapore (which accepts legal responsibility for its contents and should becontacted with respect to any matters arising from, or in connection with, Morgan Stanley Research) and by Morgan Stanley Asia International Limited,Singapore Branch (Registration number T11FC0207F); in Australia to "wholesale clients" within the meaning of the Australian Corporations Act by MorganStanley Australia Limited A.B.N. 67 003 734 576, holder of Australian financial services license No. 233742, which accepts responsibility for its contents; inAustralia to "wholesale clients" and "retail clients" within the meaning of the Australian Corporations Act by Morgan Stanley Wealth Management AustraliaPty Ltd (A.B.N. 19 009 145 555, holder of Australian financial services license No. 240813, which accepts responsibility for its contents; in Korea by MorganStanley & Co International plc, Seoul Branch; in India by Morgan Stanley India Company Private Limited; in Indonesia by PT. Morgan Stanley SekuritasIndonesia; in Canada by Morgan Stanley Canada Limited, which has approved of and takes responsibility for its contents in Canada; in Germany and theEuropean Economic Area where required by Morgan Stanley Europe S.E., regulated by Bundesanstalt fuer Finanzdienstleistungsaufsicht (BaFin); in Spain byMorgan Stanley, S.V., S.A., a Morgan Stanley group company, which is supervised by the Spanish Securities Markets Commission (CNMV) and states thatMorgan Stanley Research has been written and distributed in accordance with the rules of conduct applicable to financial research as established underSpanish regulations; in the US by Morgan Stanley & Co. LLC, which accepts responsibility for its contents. Morgan Stanley & Co. International plc, authorizedby the Prudential Regulatory Authority and regulated by the Financial Conduct Authority and the Prudential Regulatory Authority, disseminates in the UKresearch that it has prepared, and approves solely for the purposes of section 21 of the Financial Services and Markets Act 2000, research which has beenprepared by any of its affiliates. RMB Morgan Stanley Proprietary Limited is a member of the JSE Limited and A2X (Pty) Ltd. RMB Morgan Stanley ProprietaryLimited is a joint venture owned equally by Morgan Stanley International Holdings Inc. and RMB Investment Advisory (Proprietary) Limited, which is whollyowned by FirstRand Limited. The information in Morgan Stanley Research is being disseminated by Morgan Stanley Saudi Arabia, regulated by the Capital
36

Market Authority in the Kingdom of Saudi Arabia , and is directed at Sophisticated investors only.The information in Morgan Stanley Research is being communicated by Morgan Stanley & Co. International plc (DIFC Branch), regulated by the DubaiFinancial Services Authority (the DFSA), and is directed at Professional Clients only, as defined by the DFSA. The financial products or financial services towhich this research relates will only be made available to a customer who we are satisfied meets the regulatory criteria to be a Professional Client.The information in Morgan Stanley Research is being communicated by Morgan Stanley & Co. International plc (QFC Branch), regulated by the QatarFinancial Centre Regulatory Authority (the QFCRA), and is directed at business customers and market counterparties only and is not intended for RetailCustomers as defined by the QFCRA.As required by the Capital Markets Board of Turkey, investment information, comments and recommendations stated here, are not within the scope ofinvestment advisory activity. Investment advisory service is provided exclusively to persons based on their risk and income preferences by the authorized firms.Comments and recommendations stated here are general in nature. These opinions may not fit to your financial status, risk and return preferences. For thisreason, to make an investment decision by relying solely to this information stated here may not bring about outcomes that fit your expectations.The trademarks and service marks contained in Morgan Stanley Research are the property of their respective owners. Third-party data providers make nowarranties or representations relating to the accuracy, completeness, or timeliness of the data they provide and shall not have liability for any damages relatingto such data. The Global Industry Classification Standard (GICS) was developed by and is the exclusive property of MSCI and S&P.Morgan Stanley Research, or any portion thereof may not be reprinted, sold or redistributed without the written consent of Morgan Stanley.Indicators and trackers referenced in Morgan Stanley Research may not be used as, or treated as, a benchmark under Regulation EU 2016/1011, or any othersimilar framework.
INDUSTRY COVERAGE: Medical Technology
COMPANY (TICKER) RATING (AS OF) PRICE* (09/17/2019)
David R. LewisAbbott Laboratories (ABT.N) O (01/02/2018) $83.58Abiomed (ABMD.O) E (08/01/2019) $190.54Alcon Inc (ALC.N) O (04/09/2019) $59.83Avanos Medical Inc (AVNS.N) U (10/12/2015) $37.42Axonics Modulation Technologies Inc. (AXNX.O) O (11/26/2018) $31.94Baxter International (BAX.N) O (01/02/2019) $87.57Becton Dickinson (BDX.N) E (01/04/2016) $258.15Boston Scientific (BSX.N) O (10/16/2015) $42.32DexCom Inc (DXCM.O) E (01/03/2017) $153.70Edwards Lifesciences (EW.N) O (07/06/2015) $219.42Globus Medical Inc (GMED.N) E (01/02/2019) $51.32Haemonetics Corporation (HAE.N) O (01/02/2018) $127.05Hill-Rom Holdings Inc. (HRC.N) E (01/02/2018) $103.71Hologic, Inc. (HOLX.O) U (01/02/2019) $50.00Insulet Corp. (PODD.O) E (11/02/2015) $145.07Intuitive Surgical Inc. (ISRG.O) O (01/04/2016) $530.17IRHYTHM TECHNOLOGIES INC (IRTC.O) O (11/14/2016) $79.72Johnson & Johnson (JNJ.N) E (08/10/2010) $129.67Medtronic PLC (MDT.N) E (01/03/2017) $109.34Nevro Corp (NVRO.N) O (03/20/2019) $89.85NuVasive Inc (NUVA.O) E (09/14/2015) $65.30Shockwave Medical Inc. (SWAV.O) E (04/01/2019) $33.09SI-BONE Inc. (SIBN.O) O (11/12/2018) $19.54Stryker Corporation (SYK.N) O (01/08/2010) $218.40Teleflex Inc. (TFX.N) O (09/06/2017) $338.64Transmedics Group Inc (TMDX.O) E (05/28/2019) $23.80ViewRay Inc (VRAY.O) E (12/11/2018) $3.75Zimmer Biomet Holdings Inc (ZBH.N) O (01/05/2015) $138.84
Stock Ratings are subject to change. Please see latest research for each company.* Historical prices are not split adjusted.
© 2019 Morgan Stanley
37
Related Documents


![WRF/Chem MADRID: Incorporation of an aerosol module into ......[6] In this study, a 5‐day (1200 GMT August 28–0600 GMT September 2) episode from the TexAQS2000 is used as an initial](https://static.cupdf.com/doc/110x72/6024e5f71cc145011e0543a8/wrfchem-madrid-incorporation-of-an-aerosol-module-into-6-in-this-study.jpg)