Copyright © 2008 Copyright © 2008 Confidential and Proprietary Confidential and Proprietary September 16, 2008 September 16, 2008

Welcome message from author
This document is posted to help you gain knowledge. Please leave a comment to let me know what you think about it! Share it to your friends and learn new things together.
Transcript

Copyright © 2008Copyright © 2008Confidential and ProprietaryConfidential and Proprietary
September 16, 2008September 16, 2008

Copyright © 2008Copyright © 2008
Why Are we Here?
Why Are we Here?

Copyright © 2008Copyright © 2008
Why are we here?Why are we here?•Ohio is a major distribution State with great potential.
•This project presents an opportunity for incremental export and import opportunities
•Opportunities for Ohio’s intermodal network
•Opportunities for Ohio Ports• Seaway Regulatory Issues being addressed• US/ Canadian Flagged Carriers prepared to create
feeder service
••Ohio is a major distribution State with great potential.Ohio is a major distribution State with great potential.
••This project presents an opportunity for incremental This project presents an opportunity for incremental export and import opportunitiesexport and import opportunities
••Opportunities for OhioOpportunities for Ohio’’s s intermodalintermodal networknetwork
••Opportunities for Ohio PortsOpportunities for Ohio Ports•• Seaway Regulatory Issues being addressedSeaway Regulatory Issues being addressed•• US/ Canadian Flagged Carriers prepared to create US/ Canadian Flagged Carriers prepared to create
feeder servicefeeder service

Copyright © 2008Copyright © 2008
Ohio Valley: 1,830 K
New England: 407 K
Midwest: 3,139 K
Ontario: 625 K
Quebec: 721 K
Atlantic Canada: 73 K
Source: PIERS; Norbridge AnalysisNote: Origin/Destination Data is N/A for 2.3 M units
The Market 2005The Market 2005

Copyright © 2008Copyright © 2008
Ohio Valley: 560 K
Midwest: 856 K
Ontario: 300 K
Quebec: 408 K
Atlantic Canada: 40 K
Source: PIERS; Norbridge AnalysisNote: Origin/Destination Data is N/A for 2.3 M units
North Europe
Mediterranean
Indian Subcontinent
Southeast Asia
The Market from Melford Competitive Origins 2005The Market from Melford Competitive Origins 2005

Copyright © 2008Copyright © 2008
Our Objective?Our Objective?•Create “Distribution Destinations”.••Create Create ““Distribution DestinationsDistribution Destinations””..
•Criteria:• Served by Intermodal access and/or Port
• Potential of 1000 TEU in and 1000 TEU out per week, export and import opportunities within a one day dray.
•There are a number of opportunities in Ohio
•That’s why we are here.
••Criteria:Criteria:•• Served by Intermodal access and/or PortServed by Intermodal access and/or Port
•• Potential of 1000 TEU in and 1000 TEU out per week, export Potential of 1000 TEU in and 1000 TEU out per week, export and import opportunities within a one day dray.and import opportunities within a one day dray.
••There are a number of opportunities in OhioThere are a number of opportunities in Ohio
••ThatThat’’s why we are here.s why we are here.

Copyright © 2008Copyright © 2008Confidential and ProprietaryConfidential and Proprietary
Melford Container Port & Intermodal Logistics Park
Project
Melford Container Port & Intermodal Logistics Park
Project

Copyright © 2008Copyright © 2008

Copyright © 2008Copyright © 2008
Strait of Canso, Nova ScotiaStrait of Canso, Nova Scotia

Copyright © 2008Copyright © 2008
Causeway Lock Size:
24.4 m Wide9.8 m Depth
250 m Length
Causeway Lock Size:
24.4 m Wide9.8 m Depth
250 m Length
Canso Causeway, Strait of Canso, Nova ScotiaCanso Causeway, Strait of Canso, Nova Scotia
Looking EastLooking East

Copyright © 2008Copyright © 2008
The Strait of CansoCapable of Handling the World’s Largest Ships
The Strait of CansoCapable of Handling the World’s Largest Ships
14,000 acre 14,000 acre industrial reserveindustrial reserve
Terminal Site
Copyright © 2008Copyright © 2008
Melford International Terminals:• Phase One: Private Sector Project• Three components:
• Marine Terminal (315 acre)• Intermodal Rail Terminal • Logistics Park (1500 acre)
Melford International Terminals:• Phase One: Private Sector Project• Three components:
• Marine Terminal (315 acre)• Intermodal Rail Terminal • Logistics Park (1500 acre)

Copyright © 2008Copyright © 2008
Project Site Aerial ViewProject Site Aerial View

Copyright © 2008Copyright © 2008
Road and Rail AccessRoad and Rail Access

Copyright © 2008Copyright © 2008
Terminal and Logistic ParkTerminal and Logistic Park

Copyright © 2008Copyright © 2008
Global Trends & Conditions
Global Trends & Conditions

International Maritime Cargo Demand Trends
International Maritime Cargo Demand Trends
Copyright © 2007Copyright © 2007

Copyright © 2008Copyright © 2008
World Bank’s 2010 “Global Economic Prospects”
World Bank’s 2010 “Global Economic Prospects”
00
World Output will Increase 33% in 10 yearsWorld Output will Increase 33% in 10 years
Trill
ions
$Tr
illio
ns $
1010
2020
3030
4040
20002000
$ 30 Trillion$ 30 Trillion
20102010
$ 40 Trillion$ 40 Trillion

Copyright © 2008Copyright © 2008
World Container Traffic Has Been Growing at 3 Times World GDP Growth.World GDP & Containerized Traffic Growth
Source: Morgan Stanley ResearchSource: Morgan Stanley ResearchRebased to 100 for 1980 figures, percentages are CAGR (1980-2006)Rebased to 100 for 1980 figures, percentages are CAGR (1980-2006)
World Container Traffic 9.1%
World Trade Growth 7.4%
World GDP 3.5%
Rebased to 100 in 1980

Copyright © 2008Copyright © 2008
World Container Forecast to 2024 in TEUs(186% Increase in Next 20 Years)
World Container Forecast to 2024 in TEUs(186% Increase in Next 20 Years)
Source: Global InsightSource: Global Insight
2007:96 M
2024:243 MForecast
Growth Rate (CAGR)1994 to 2004: 8.3 %

The Growing Asian Trade Challenge
The Growing Asian Trade Challenge
Copyright © 2007Copyright © 2007

Copyright © 2008Copyright © 2008
Mainland China Container Port Growth (Compound Annual Growth Rates)
Mainland China Container Port Growth (Compound Annual Growth Rates)
27.3 %
25.9 %
35.4 %17.1 %
30.1 %
5 Yr Average = 27.2%Increased Volume

Copyright © 2008Copyright © 2008
Shanghai International Shipping CenterYangshan Deep Port & Logistics Park
54 New Berths54 New Berths
New Logistics ParkNew Logistics Park
New Port CityNew Port City
20 Mile New Port Access Bridge Constructed in 3 yrs

Copyright © 2008Copyright © 2008
Shanghai International Shipping CenterYangshan Deep Port - 20 Mile Bridge Access

Copyright © 2008Copyright © 2008
Southeast Asian Manufacturing Centroid ShiftCurrent Inbound U.S. Cargo Flow
Southeast Asian Manufacturing Centroid ShiftCurrent Inbound U.S. Cargo Flow
U.S. IntermodalRail Flow
U.S. IntermodalRail Flow
Eastbound: All Water FlowEastbound: US Intermodal Rail Flow Eastbound: All Water FlowEastbound: US Intermodal Rail Flow
Western Centroid Shift Western Centroid Shift

Copyright © 2008Copyright © 2008
Southeast Asian Manufacturing Centroid Shift Current Inbound U.S. Cargo Flow
Southeast Asian Manufacturing Centroid Shift Current Inbound U.S. Cargo Flow
U.S. Intermodal Rail FlowU.S. Intermodal Rail Flow
WesternCentroidShift
WesternCentroidShift
Westbound All Water/Suez FlowWestbound All Water/Suez FlowWestbound Intermodal U.S. FlowWestbound Intermodal U.S. Flow
U.S. Intermodal Rail FlowU.S. Intermodal Rail Flow
WesternCentroidShift
WesternCentroidShift
Westbound All Water/Suez FlowWestbound All Water/Suez FlowWestbound Intermodal U.S. FlowWestbound Intermodal U.S. Flow
North AmericanPort & Intermodal Capacity Trends
North AmericanPort & Intermodal Capacity Trends
Copyright © 2007Copyright © 2007

Copyright © 2008Copyright © 2008
North American Containerized Tonnage Forecast
North American Containerized Tonnage Forecast
Source: DRI/McGraw HillSource: DRI/McGraw Hill
0
20
40
60
80
100
0
20
40
60
80
100
1990 1995 2000 2005 20101990 1995 2000 2005 2010
CAGRCAGR
NE (Maine to Virginia)SE (NC to Tampa)Gulf (Mobile to El Paso)SW (San Diego to OaklandNW (Oregon to Alaska)
NE (Maine to Virginia)SE (NC to Tampa)Gulf (Mobile to El Paso)SW (San Diego to OaklandNW (Oregon to Alaska)
6.3%
6.6%7.6%
7.2%
6.3%
6.6%7.6%
7.2%
1,00
0,00
0 To
ns1,
000,
000
Tons
Total 79.2 119.5 188.7 236.6 355.6 7.8%Total 79.2 119.5 188.7 236.6 355.6 7.8%
By 2020 Most Container Port GatewaysWill Double or Triple in Volume

Copyright © 2008Copyright © 2008
North American Maritime Container Current and Future Trade Growth
North American Maritime Container Current and Future Trade Growth
(TEUs in thousands)
2020202020042004 1,4371,437
6,1656,165
HoustonHouston
13,10113,101
LA/LBLA/LB
1,6651,665
6,8486,848
2,0432,043 3,3823,382
OaklandOakland
4,4784,478
15,83515,835
NY/NJNY/NJ
1,8091,8095,5665,566
VirginiaVirginia
1,8601,860
6,6396,639
CharlestonCharleston
1,6621,662
9,4209,420
SavannahSavannah
1,7981,7984,3964,396
TacomaTacoma
1,7761,776 2,5572,557
SeattleSeattle
59,42059,420VancouverVancouver
Source: USDOT - Forecast figures based on 6 year linear regressionSource: USDOT - Forecast figures based on 6 year linear regression
By 2020 demand will exceed current capacity of many North American ports by as much as 200%.
(Top 10 Ports)

Copyright © 2008Copyright © 2008
5.8
14.5
8.98.07.4
18.4
9.7 10.0
7.8
19.5
11.4 10.9
0
5
10
15
20
25
Pacific NorthwestPacific Northwest Pacific SouthwestPacific Southwest North AtlanticNorth Atlantic South Atlantic/ GulfSouth Atlantic/ Gulf
Demand 2004Demand 2004 Capacity 2010Capacity 2010 Demand 2010Demand 2010
US Port and Terminal 2010 Forecast Demand vs. Capacity (MM TEU)
Source: Modern Terminals LimitedSource: Modern Terminals Limited
Container Vessel Technology
Trends
Container Vessel Technology
TrendsCopyright © 2007Copyright © 2007

Copyright © 2008Copyright © 2008
World Container Ship EvolutionWorld Container Ship Evolution
8,600 TEU8,600 TEU
1,700 TEU1,700 TEU
2,305 TEU2,305 TEU
3,220 TEU3,220 TEU
4,848 TEU4,848 TEU
5th Generation (2000 - 2006)5th Generation (2000 - 2006)Super Post PanamaxSuper Post Panamax
1st Generation (Pre-1960 - 1970)1st Generation (Pre-1960 - 1970)
2nd Generation (1970 - 1980)2nd Generation (1970 - 1980)
3rd Generation (1985)3rd Generation (1985)
4th Generation (1986 - 2000)4th Generation (1986 - 2000)
Ideal XIdeal X
PanamaxPanamax
Post PanamaxPost Panamax
Full CellularFull Cellular
TEU CapacityTEU Capacity
6th Generation (2006-2012)6th Generation (2006-2012)
Ultra Post PanamaxUltra Post Panamax 12,000+ TEU12,000+ TEU

Copyright © 2008Copyright © 2008Source: Journal of Commerce August 2006, Marine Log December 2006 Source: Journal of Commerce August 2006, Marine Log December 2006
The new-build known as “M/S Emma Maersk”, was christened at the Odense-Lindo Shipyard in Denmark in August 2006.
The nominal capacity of the new vessel could be as high as 14,000 TEUs based on its reported LOA of 397 m, Beam of 56 m, Draft of 15.5 m, Gross Tonnage 170,974 gt, Speed 25.5 knots
The new-build known as “M/S Emma Maersk”, was christened at the Odense-Lindo Shipyard in Denmark in August 2006.
The nominal capacity of the new vessel could be as high as 14,000 TEUs based on its reported LOA of 397 m, Beam of 56 m, Draft of 15.5 m, Gross Tonnage 170,974 gt, Speed 25.5 knots
A.P. Moller-Maersk September 2006 Service Announcement for 14,000 TEU Vessel
A.P. Moller-Maersk September 2006 Service Announcement for 14,000 TEU Vessel
S Class6800 TEUS Class
6800 TEU
L Class14,000 TEU
L Class14,000 TEU
US Roads and Rails are Congested
US Roads and Rails are Congested
Copyright © 2007Copyright © 2007

Copyright © 2008Copyright © 2008
Future US Truck Traffic GrowthIn Urban Consumption Zones
Future US Truck Traffic GrowthIn Urban Consumption Zones
TodayToday 20202020
Source: USDOT FHWA Freight Analysis FrameworkSource: USDOT FHWA Freight Analysis Framework

Copyright © 2008Copyright © 2008
Future US Rail Traffic FlowsFuture US Rail Traffic FlowsTodayToday 20202020

Copyright © 2008Copyright © 2008
Project CatalystsProject Catalysts

Copyright © 2008Copyright © 2008
Global Trends and Conditions:Global Trends and Conditions:
• Increasing Asian Trade
• Ships Getting Bigger
• US Port, Rail and Road Congestion
• Increasing Asian Trade
• Ships Getting Bigger
• US Port, Rail and Road Congestion

Copyright © 2008Copyright © 2008
Current Global Impacts
Current Global Impacts

Copyright © 2008Copyright © 2008
Today’s Sector Drivers:Today’s Sector Drivers:• World Economic
Conditions
• Price of Oil, Impact on Transportation Costs
• Carbon Footprint
• World Economic Conditions
• Price of Oil, Impact on Transportation Costs
• Carbon Footprint

Copyright © 2008Copyright © 2008
Consequences of Global Impacts
Consequences of Global Impacts

Copyright © 2008Copyright © 2008
Future Carrier Demands:Future Carrier Demands:• Vessels will Continue to
get Larger
• There will be Fewer Destinations
• Discharge Percentages will Increase
• Vessels will Continue to get Larger
• There will be Fewer Destinations
• Discharge Percentages will Increase
Copyright © 2008Copyright © 2008
Melford’sValue Proposition
Exceeds The Demands
Melford’sValue Proposition
Exceeds The Demands

Canada’s Intermodal Land Bridge Advantage
Canada’s Intermodal Land Bridge Advantage
Copyright © 2007Copyright © 2007

Copyright © 2008Copyright © 2008
Canada’s Strategic Global Location(Shortest Trade Routes to Asia and Europe)
Canada’s Strategic Global Location(Shortest Trade Routes to Asia and Europe)
Trans-Pacific Route
Trans-Pacific Route
Trans-Atlantic (EU-NAFTA)
Trans-Atlantic (EU-NAFTA)
North South (NAFTA)
North South (NAFTA)

Copyright © 2008Copyright © 2008
• Geography:Closest North American Mainland Deep Water Port to Europe/Suez• 29 Hour Advantage on New York• 36 Hour Advantage on Norfolk
• Geography:Closest North American Mainland Deep Water Port to Europe/Suez•• 29 Hour Advantage on New York29 Hour Advantage on New York•• 36 Hour Advantage on Norfolk36 Hour Advantage on Norfolk
““Our Value PropositionOur Value Proposition””
At 22 Knots down from 24.3 Knots, even if it adds an extra vessel to the rotation

Copyright © 2008Copyright © 2008
• Through-put Efficiencies• Green Field Site• Latest: Technology/Design/Equipment• Optimum Vessel to Rail Transfer• Estimated Double Digit Savings
• Modern Labour Work Rules• Work Rules to Match Technology• Estimated Double Digit Savings
• Lowest Cost Operating Environment in North America• Real Estate Costs • Taxes• Labour• Construction
• Through-put Efficiencies•• Green Field SiteGreen Field Site•• Latest: Technology/Design/EquipmentLatest: Technology/Design/Equipment•• Optimum Vessel to Rail TransferOptimum Vessel to Rail Transfer•• Estimated Double Digit SavingsEstimated Double Digit Savings
• Modern Labour Work Rules•• Work Rules to Match TechnologyWork Rules to Match Technology•• Estimated Double Digit SavingsEstimated Double Digit Savings
• Lowest Cost Operating Environment in North America•• Real Estate Costs Real Estate Costs •• TaxesTaxes•• LabourLabour•• ConstructionConstruction
““Our Value PropositionOur Value Proposition””

Copyright © 2008Copyright © 2008
• Security• Advanced Technology – On site US &
Canadian Customs
• On-Dock Logistic Park• Added Value, Deconsolidation,
Consolidation, FTZ
• Intermodal Excellence• Designed to Optimize CN’s IMX Strategy
• Green and Sustainable
• Security• Advanced Technology – On site US &
Canadian Customs
• On-Dock Logistic Park• Added Value, Deconsolidation,
Consolidation, FTZ
• Intermodal Excellence• Designed to Optimize CN’s IMX Strategy
• Green and Sustainable
““Our Value PropositionOur Value Proposition””

Copyright © 2008Copyright © 2008
Great LakesFeeder OpportunityShort Sea Shipping
Great LakesFeeder OpportunityShort Sea Shipping

Copyright © 2008Copyright © 2008
Causeway Lock Size:
24.4 m Wide9.8 m Depth
250 m Length
Causeway Lock Size:
24.4 m Wide9.8 m Depth
250 m Length
Canso Causeway, Strait of Canso, Nova ScotiaCanso Causeway, Strait of Canso, Nova Scotia
Looking EastLooking East
Copyright © 2008Copyright © 2008
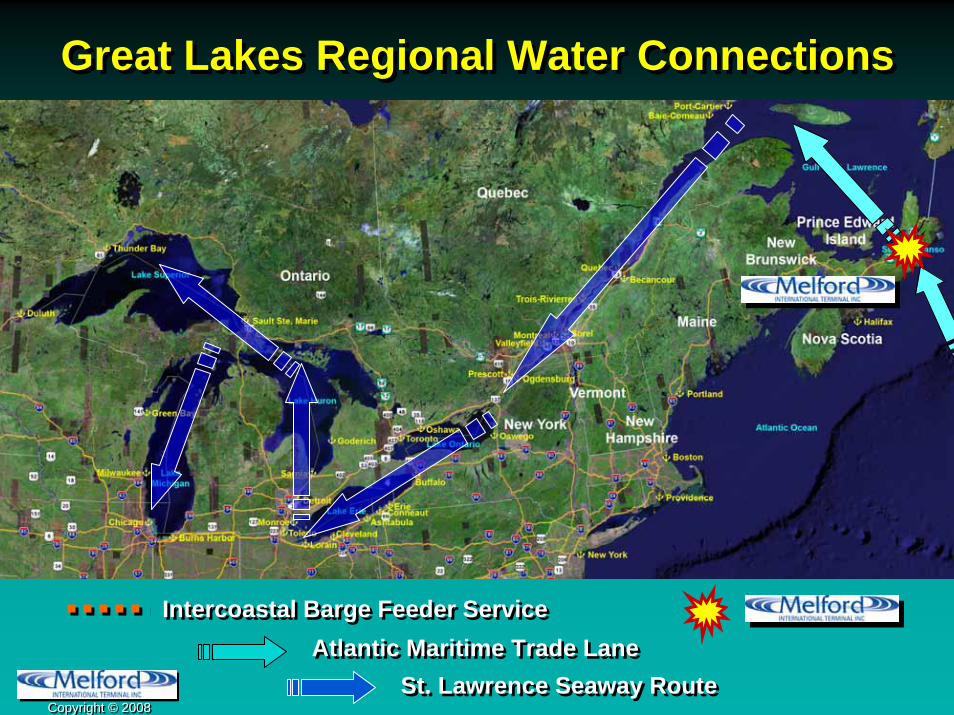
Atlantic Maritime Trade LaneAtlantic Maritime Trade LaneIntercoastal Barge Feeder ServiceIntercoastal Barge Feeder Service
St. Lawrence Seaway RouteSt. Lawrence Seaway Route
Great Lakes Regional Water ConnectionsGreat Lakes Regional Water Connections

Copyright © 2008Copyright © 2008
Great Lakes Regional Rail Corridor AccessGreat Lakes Regional Rail Corridor Access
CN & CP RouteCN & CP RouteCSX Sea level RouteCSX Sea level Route
Class 1 Railroad Mainlines:Class 1 Railroad Mainlines:
Copyright © 2008Copyright © 2008
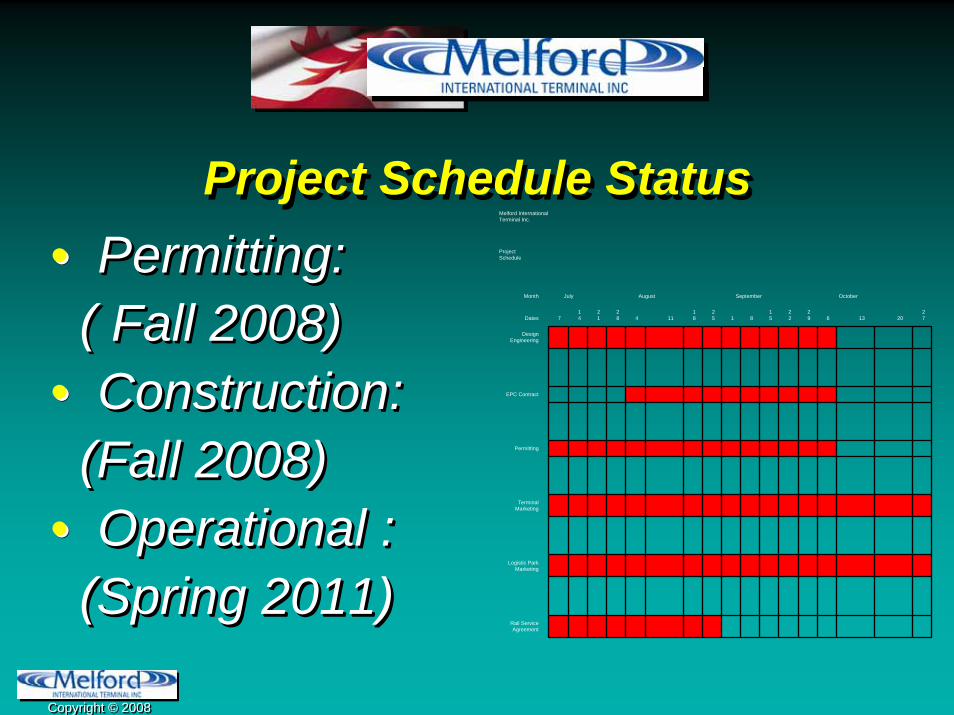
Project Schedule Status Project Schedule Status • Permitting:
( Fall 2008)• Construction:
(Fall 2008)• Operational :
(Spring 2011)
•• Permitting: Permitting: ( Fall 2008)( Fall 2008)
•• Construction: Construction: (Fall 2008)(Fall 2008)
•• Operational : Operational : (Spring 2011) (Spring 2011)
Melford International Terminal Inc.
Project Schedule
Month July August September October
Dates 714
21
28 4 11
18
25 1 8
15
22
29 6 13 20
27
Design Engineering
EPC Contract
Permitting
Terminal Marketing
Logistic Park Marketing
Rail Service Agreement

Copyright © 2008Copyright © 2008
Current TrendsCurrent Trends

Copyright © 2008Copyright © 2008

Copyright © 2008Copyright © 2008

Copyright © 2008Copyright © 2008

Copyright © 2008Copyright © 2008

Copyright © 2008Copyright © 2008

Copyright © 2008Copyright © 2008

Copyright © 2008Copyright © 2008

Copyright © 2008Copyright © 2008

Copyright © 2008Copyright © 2008

Copyright © 2008Copyright © 2008
Eye For TransportThe Impact of High Fuel Prices on the Logistics Industry Report 2008/9
America’s Top 3PLs, Shippers & Carriers share their views on how soaring fuel prices are impacting their business
Eye For TransportThe Impact of High Fuel Prices on the Logistics Industry Report 2008/9
America’s Top 3PLs, Shippers & Carriers share their views on how soaring fuel prices are impacting their business
One Conclusion
“A new trend in the logistics industry is short sea shipping. Moving freight along coasts and inland waterways is helping 3Pls, shippers and carriers cutting fuel costs and improving their green credentials”.
One Conclusion
“A new trend in the logistics industry is short sea shipping. Moving freight along coasts and inland waterways is helping 3Pls, shippers and carriers cutting fuel costs and improving their green credentials”.

Copyright © 2008Copyright © 2008
Thank YouThank You
Related Documents