The same but different: Gender and investor behavior in Vanguard retail accounts Vanguard Research May 2020 Jennie Huang, Ph.D., and Thomas J. De Luca ■ Although prior research has shown large gender differences in risk-taking behavior, we find that among Vanguard retail investors, gender differences in aggregate portfolio risk are negligible. ■ However, women and men do differ in the types of funds they hold, and they differ dramatically in terms of their digital attention and trading behavior. Compared with men, women hold 23% more of their assets in balanced funds and 12% more assets in target-date funds. They are also up to 50% less digitally active and trade up to 50% less than men. Women at the margin appear more aligned with Vanguard’s long-term investing principles, such as diversification and discipline. ■ The magnitude of gender differences is generally larger for “single-member” Vanguard households—where only one member is a Vanguard client—than it is for dual-member Vanguard households. This is consistent with the hypothesis that household members who have each chosen Vanguard as a retail investment provider may exhibit a higher level of coordination on other financial decisions, reducing gender differences in portfolio construction. ■ For half of dual-member Vanguard households, men and women in the same household have similar portfolios. Even so, we still find a substantial degree of variation among the other half—suggesting the need for further research on the factors motivating such differences.

Welcome message from author
This document is posted to help you gain knowledge. Please leave a comment to let me know what you think about it! Share it to your friends and learn new things together.
Transcript
The same but different: Gender and investor behavior in Vanguard retail accounts
Vanguard Research May 2020
Jennie Huang, Ph.D., and Thomas J. De Luca
■ Although prior research has shown large gender differences in risk-taking behavior, we find that among Vanguard retail investors, gender differences in aggregate portfolio risk are negligible.
■ However, women and men do differ in the types of funds they hold, and they differ dramatically in terms of their digital attention and trading behavior. Compared with men, women hold 23% more of their assets in balanced funds and 12% more assets in target-date funds. They are also up to 50% less digitally active and trade up to 50% less than men. Women at the margin appear more aligned with Vanguard’s long-term investing principles, such as diversification and discipline.
■ The magnitude of gender differences is generally larger for “single-member” Vanguard households—where only one member is a Vanguard client—than it is for dual-member Vanguard households. This is consistent with the hypothesis that household members who have each chosen Vanguard as a retail investment provider may exhibit a higher level of coordination on other financial decisions, reducing gender differences in portfolio construction.
■ For half of dual-member Vanguard households, men and women in the same household have similar portfolios. Even so, we still find a substantial degree of variation among the other half—suggesting the need for further research on the factors motivating such differences.

2
Introduction
Prior research on investment and retirement savings behavior has highlighted significant gender differences, where women invest more conservatively, are less likely to participate in the stock market, display lower financial literacy and so are less likely to plan for retirement, and are less likely to trade in their portfolios compared with men.1 Several factors have been put forth as reasons for these differences, including the gender wage gap, work force participation, risk aversion, actual and perceived financial literacy, and overconfidence.2
More recently, research on gender differences using administrative records from Vanguard’s defined contribution (DC) plans found that the gender gap is closing—thanks in part to automatic enrollment—and that under voluntary plans, women are more likely to join their workplace savings plan and have higher savings rates after controlling for income (Young and Young, 2019). Men and women in the aggregate also hold similar equity allocations, but for a variety of reasons these patterns may be different in the retail setting.3
In this paper, we examine gender differences in retail investment accounts in Vanguard’s U.S. retail business. We focus on asset class allocations, product and fund choices, and digital attention and trading. Finally, we explore the potential effect of household coordination on gender differences in investor behavior. A better understanding of gender-related differences in investor behavior can help inform decisions on targeted investor education, choice architecture design, and advice services.
Methodology
We compare men and women’s product choices and investment behavior at the individual level.4 Our study is based on over 4 million Vanguard U.S. self-directed retail investors between the ages of 18 and 95 in Vanguard households with two members or less (see Figure 1).5 Women make up 46% of our sample.
1 See Bajtelsmit and Bernasek (1996); Bajtelsmit, Bernasek, and Jianakopolos (1999); Almenberg and Dreber (2015); Lusardi and Mitchell (2008); and Barber and Odean (2001). Research on trading behavior among 8.4 million Vanguard clients has also found that single-female and joint households trade less compared with single-male households (Clark, Utkus, and Young, 2019).
2 See Blau and Kahn (2017); Levine, Mitchell, and Phillips (1999); Charness and Gneezy (2012); Dwyer, Gilkeson, and List (2002); Lusardi and Mitchell (2008); Almenberg and Dreber (2015); and Barber and Odean (2001).
3 Retail investors have self-selected to open an account. They are required to make more direct and active choices from a wide range of investment options, including mutual funds, exchange-traded funds (ETFs), and individual stocks and bonds. As a result, gender differences in investment decisions may compound.
4 We are limited in our interpretation of how households make decisions, particularly for households with multiple members. For example, individuals within the same household can make decisions completely separately, they can decide together and execute the same investment strategy on all accounts, or they can decide together to execute different investment strategies across different accounts. In the absence of a detailed survey on household decision-making, we take the next best approach: We limit our analysis to Vanguard households with only one or two members at Vanguard. As a robustness check, we repeat our analysis separately for Vanguard households with only one member versus two members.
5 We use Vanguard data as of December 31, 2019. Our results are consistent if we include all self-directed investors ages 18 through 95, regardless of Vanguard household size.
3
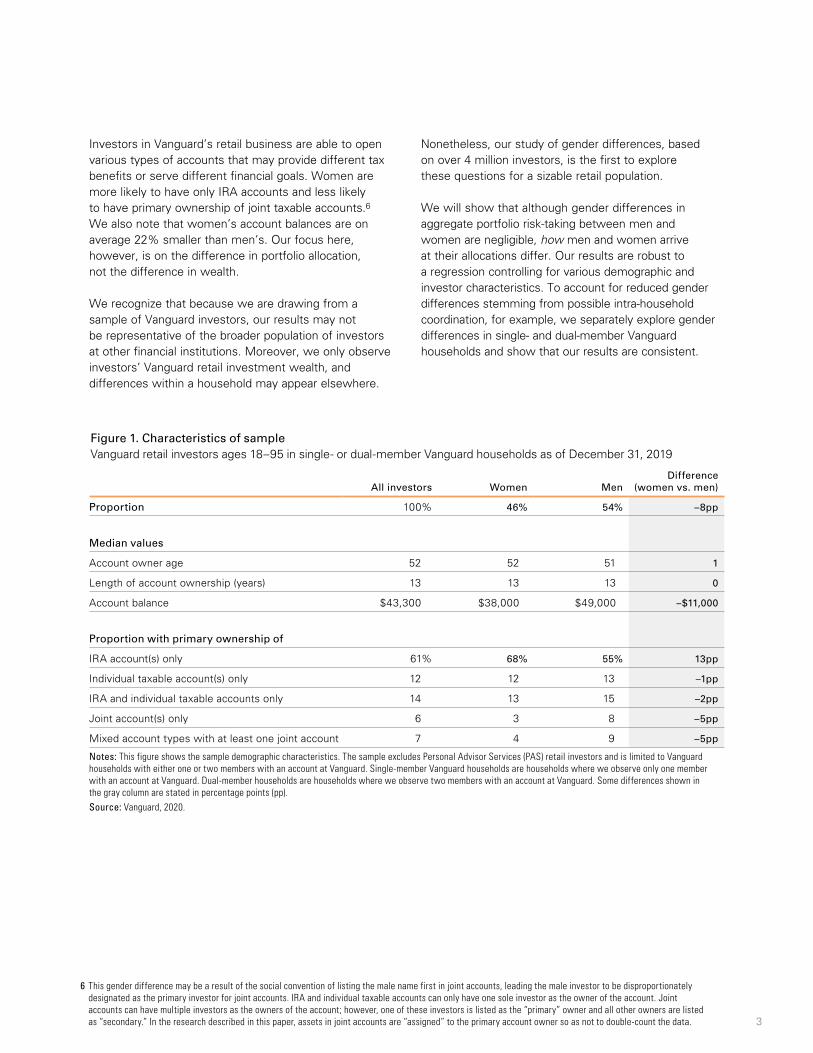
Investors in Vanguard’s retail business are able to open various types of accounts that may provide different tax benefits or serve different financial goals. Women are more likely to have only IRA accounts and less likely to have primary ownership of joint taxable accounts.6 We also note that women’s account balances are on average 22% smaller than men’s. Our focus here, however, is on the difference in portfolio allocation, not the difference in wealth.
We recognize that because we are drawing from a sample of Vanguard investors, our results may not be representative of the broader population of investors at other financial institutions. Moreover, we only observe investors’ Vanguard retail investment wealth, and differences within a household may appear elsewhere.
Nonetheless, our study of gender differences, based on over 4 million investors, is the first to explore these questions for a sizable retail population.
We will show that although gender differences in aggregate portfolio risk-taking between men and women are negligible, how men and women arrive at their allocations differ. Our results are robust to a regression controlling for various demographic and investor characteristics. To account for reduced gender differences stemming from possible intra-household coordination, for example, we separately explore gender differences in single- and dual-member Vanguard households and show that our results are consistent.
6 This gender difference may be a result of the social convention of listing the male name first in joint accounts, leading the male investor to be disproportionately designated as the primary investor for joint accounts. IRA and individual taxable accounts can only have one sole investor as the owner of the account. Joint accounts can have multiple investors as the owners of the account; however, one of these investors is listed as the “primary” owner and all other owners are listed as “secondary.” In the research described in this paper, assets in joint accounts are “assigned” to the primary account owner so as not to double-count the data.
Figure 1. Characteristics of sample Vanguard retail investors ages 18–95 in single- or dual-member Vanguard households as of December 31, 2019
All investors Women MenDifference
(women vs. men)
Proportion 100% 46% 54% –8pp
Median values
Account owner age 52 52 51 1
Length of account ownership (years) 13 13 13 0
Account balance $43,300 $38,000 $49,000 –$11,000
Proportion with primary ownership of
IRA account(s) only 61% 68% 55% 13pp
Individual taxable account(s) only 12 12 13 –1pp
IRA and individual taxable accounts only 14 13 15 –2pp
Joint account(s) only 6 3 8 –5pp
Mixed account types with at least one joint account 7 4 9 –5pp
Notes: This figure shows the sample demographic characteristics. The sample excludes Personal Advisor Services (PAS) retail investors and is limited to Vanguard households with either one or two members with an account at Vanguard. Single-member Vanguard households are households where we observe only one member with an account at Vanguard. Dual-member households are households where we observe two members with an account at Vanguard. Some differences shown in the gray column are stated in percentage points (pp). Source: Vanguard, 2020.

4
Gender differences in portfolio asset class allocation are negligible
In portfolio construction, the central question is, how much risk will an investor take on? Given that prior literature shows women to be more risk-averse than men, we would expect women to be less likely to choose equity assets and more likely to hold less-risky assets, such as cash. However, we find that aggregate gender differences in risk-taking are negligible in the absolute—and they are even smaller once we control for demographic characteristics.
Figure 2, Panel A shows the gender differences apparent from our descriptive statistics on average asset class allocation. Panel B shows these results are robust to a regression controlling for various demographics and investor characteristics.7 Women hold 0.4 percentage points less equity, and 1.2 percentage points less cash, compared with men. Instead—and strikingly—lower cash and equity allocation translates to higher fixed income assets. Women hold 1.5 percentage points more assets in fixed income. This absolute difference is small, but the relative difference is not; it means that in aggregate, women’s fixed income allocations are 10% higher than men’s.
7 Regression specifications are available from the authors upon request.
Average asset class allocation
All investors Women Men
Difference (women vs. men)
Equity 64% 63% 65% ▼–2pp
Fixed income 15 16 14 ▲ 2pp
Cash 21 21 21 0pp
Figure 2. Gender differences in aggregate portfolio risk are negligible
Vanguard retail investors ages 18–95 in single- or dual-member Vanguard households as of December 31, 2019
Panel A. Descriptive statistics Difference stated in percentage points (pp)
Equity share Fixed income share
Asset class
Cash share
–1.2pp–6%
1.5pp10%
–0.4pp–1%
Notes: This figure shows the gender differences in aggregate portfolio risk. Panel A shows the descriptive statistics. Panel B shows the absolute marginal effect of being female (in percentage points) as well as the relative effect (in percent) on aggregate portfolio risk after controlling for age, tenure, estimated income, account balance, being a Vanguard defined contribution (DC) client, percentage of balance in different account types (e.g., IRA, individual taxable, and joint taxable accounts), and whether the investor is in a single- or dual-member Vanguard household. All differences are statistically significant at the 1% level.Source: Vanguard, 2020.
Panel B. Marginal effect of being female
Absolute effect stated in percentage points (pp) Relative effect stated in percent (%)
5
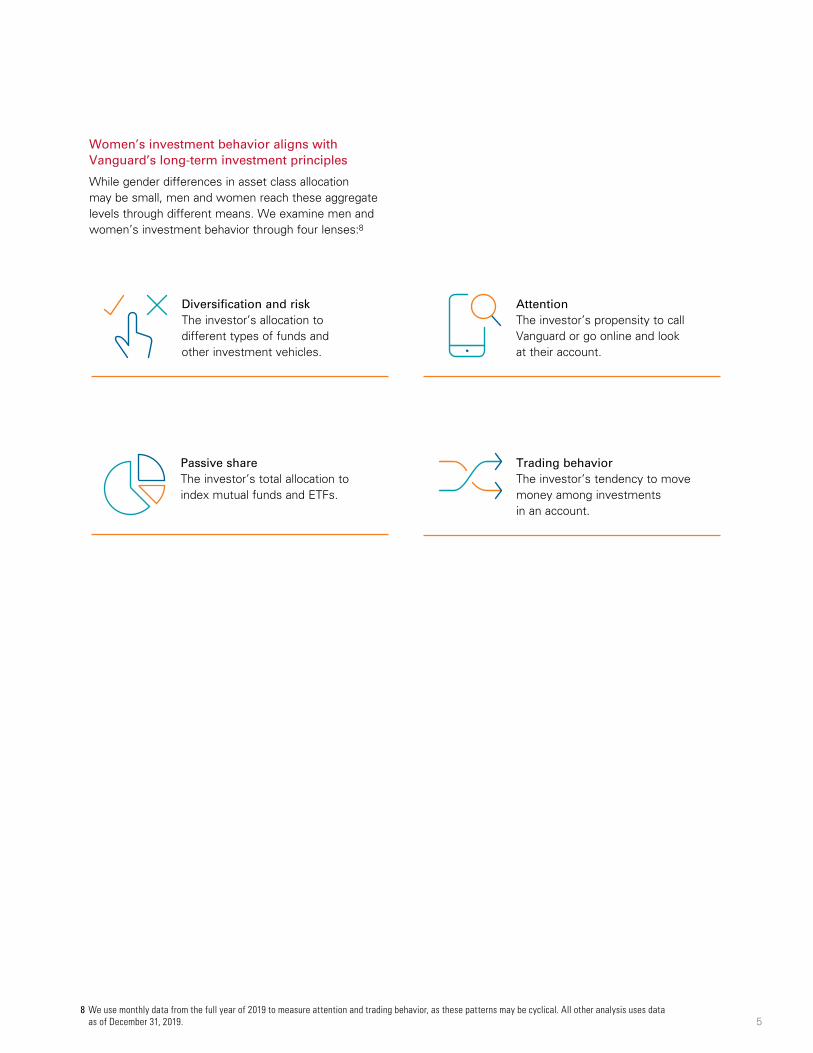
Women’s investment behavior aligns with Vanguard’s long-term investment principles
While gender differences in asset class allocation may be small, men and women reach these aggregate levels through different means. We examine men and women’s investment behavior through four lenses:8
8 We use monthly data from the full year of 2019 to measure attention and trading behavior, as these patterns may be cyclical. All other analysis uses data as of December 31, 2019.
Diversification and risk The investor’s allocation to different types of funds and other investment vehicles.
Trading behavior The investor’s tendency to move money among investments in an account.
Passive share The investor’s total allocation to index mutual funds and ETFs.
Attention The investor’s propensity to call Vanguard or go online and look at their account.
6
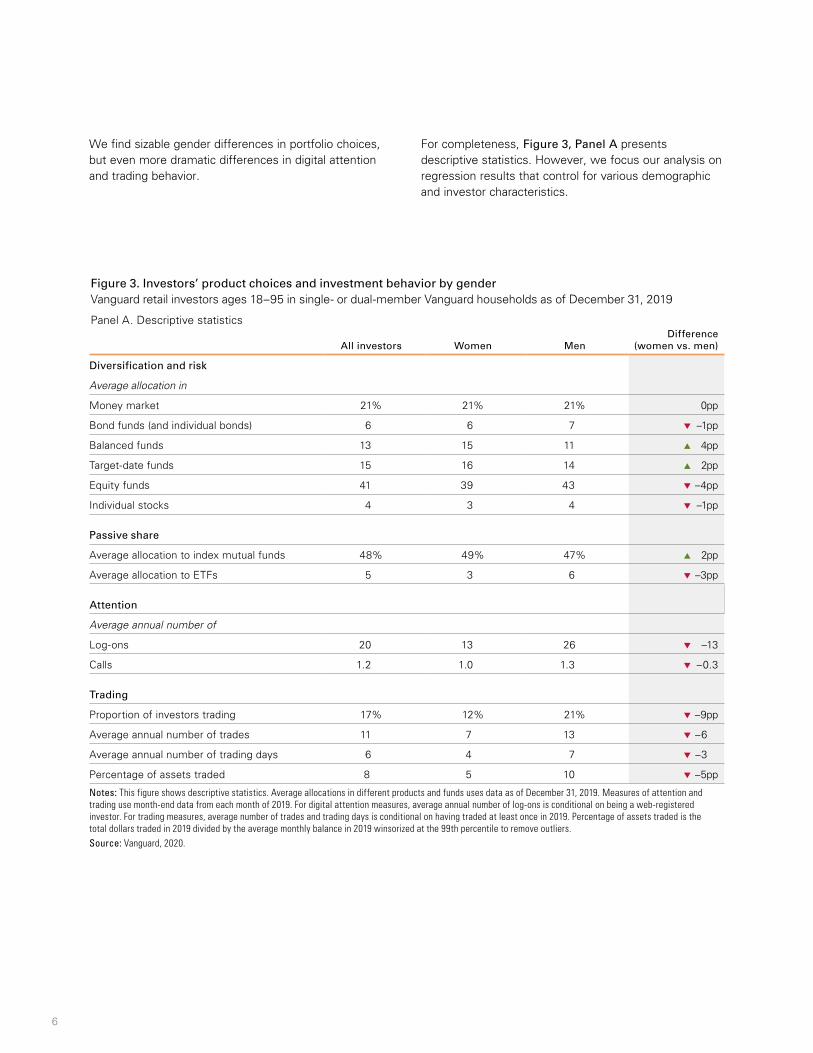
We find sizable gender differences in portfolio choices, but even more dramatic differences in digital attention and trading behavior.
For completeness, Figure 3, Panel A presents descriptive statistics. However, we focus our analysis on regression results that control for various demographic and investor characteristics.
Figure 3. Investors’ product choices and investment behavior by gender Vanguard retail investors ages 18–95 in single- or dual-member Vanguard households as of December 31, 2019
Panel A. Descriptive statistics
All investors Women MenDifference
(women vs. men)
Diversification and risk
Average allocation in
Money market 21% 21% 21% 0pp
Bond funds (and individual bonds) 6 6 7 ▼ –1pp
Balanced funds 13 15 11 ▲ 4pp
Target-date funds 15 16 14 ▲ 2pp
Equity funds 41 39 43 ▼ –4pp
Individual stocks 4 3 4 ▼ –1pp
Passive share
Average allocation to index mutual funds 48% 49% 47% ▲ 2pp
Average allocation to ETFs 5 3 6 ▼ –3pp
Attention
Average annual number of
Log-ons 20 13 26 ▼ –13
Calls 1.2 1.0 1.3 ▼ –0.3
Trading
Proportion of investors trading 17% 12% 21% ▼ –9pp
Average annual number of trades 11 7 13 ▼ –6
Average annual number of trading days 6 4 7 ▼ –3
Percentage of assets traded 8 5 10 ▼ –5pp
Notes: This figure shows descriptive statistics. Average allocations in different products and funds uses data as of December 31, 2019. Measures of attention and trading use month-end data from each month of 2019. For digital attention measures, average annual number of log-ons is conditional on being a web-registered investor. For trading measures, average number of trades and trading days is conditional on having traded at least once in 2019. Percentage of assets traded is the total dollars traded in 2019 divided by the average monthly balance in 2019 winsorized at the 99th percentile to remove outliers.Source: Vanguard, 2020.
7
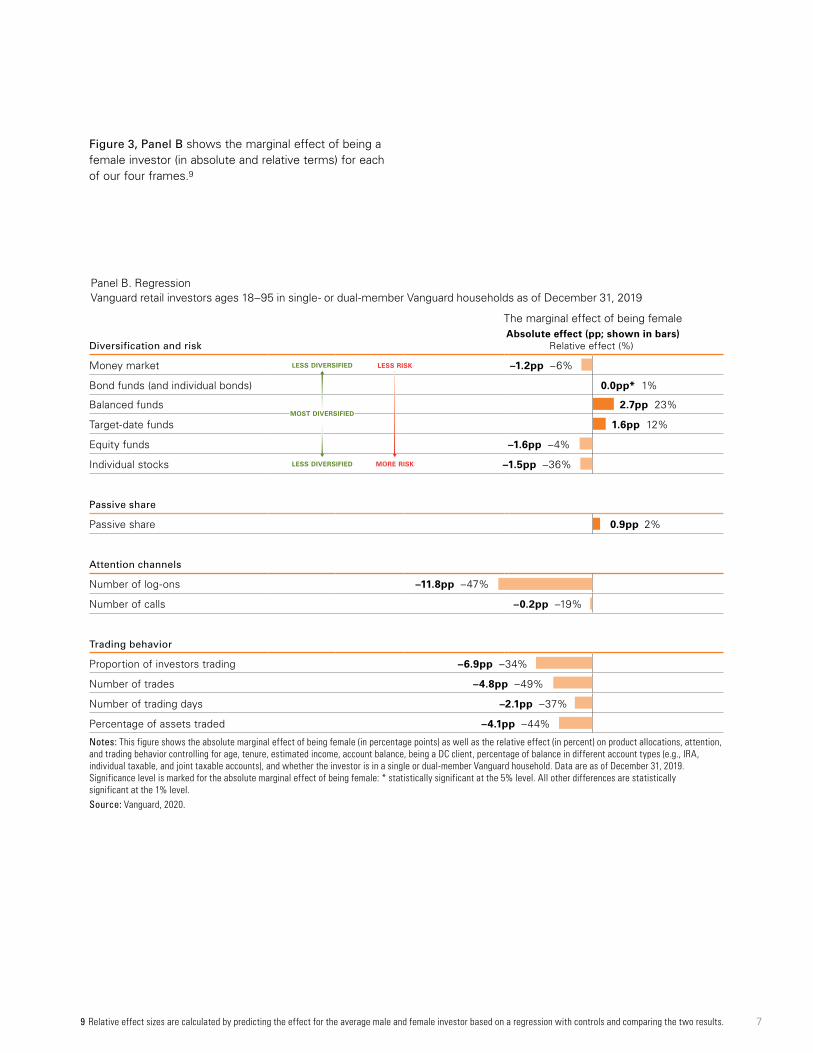
Figure 3, Panel B shows the marginal effect of being a female investor (in absolute and relative terms) for each of our four frames.9
9 Relative effect sizes are calculated by predicting the effect for the average male and female investor based on a regression with controls and comparing the two results.
Panel B. Regression Vanguard retail investors ages 18–95 in single- or dual-member Vanguard households as of December 31, 2019
The marginal effect of being female
Diversification and risk Absolute effect (pp; shown in bars)
Relative effect (%)
Money market –1.2pp –6%
Bond funds (and individual bonds) 0.0pp* 1%
Balanced funds 2.7pp 23%
Target-date funds 1.6pp 12%
Equity funds –1.6pp –4%
Individual stocks –1.5pp –36%
Passive share
Passive share 0.9pp 2%
Attention channels
Number of log-ons –11.8pp –47%
Number of calls –0.2pp –19%
Trading behavior
Proportion of investors trading –6.9pp –34%
Number of trades –4.8pp –49%
Number of trading days –2.1pp –37%
Percentage of assets traded –4.1pp –44%
Notes: This figure shows the absolute marginal effect of being female (in percentage points) as well as the relative effect (in percent) on product allocations, attention, and trading behavior controlling for age, tenure, estimated income, account balance, being a DC client, percentage of balance in different account types (e.g., IRA, individual taxable, and joint taxable accounts), and whether the investor is in a single or dual-member Vanguard household. Data are as of December 31, 2019. Significance level is marked for the absolute marginal effect of being female: * statistically significant at the 5% level. All other differences are statistically significant at the 1% level. Source: Vanguard, 2020.
less risk
more risk
less diversified
less diversified
most diversified
Diversification and risk
Prior work on gender and risk aversion may lead us to believe that the effect of being a woman on the tendency to hold an investment product should be monotonic and decreasing with risk—that is, we should see the largest positive differences under money market allocation and the largest negative differences under individual stock allocation. However, as the results presented in Figure 3 show, this is not the case.
On average, women have lower allocations to money market funds, equity funds, and individual stocks compared with men. Instead, women allocate 2.7 percentage points more to balanced funds and 1.6 percentage points more to target-date funds, corresponding to 23% and 12% increases, respectively.
Passive share
Women, at the margin, hold 0.9 percentage points more assets in passive funds. However, we note that men hold double the level of ETFs. In fact, being female decreases the ETF share (out of the total passive share) by 3.3 percentage points, a relative difference of 31%.10
This could suggest that men have a greater propensity to be interested in intraday trading or that they have a marginally higher level of familiarity with newer investment products.
Attention
On average, women log on to their account 11.8 fewer times per year compared with men. That is, women log on half as much as men do. Women also call Vanguard 0.2 fewer times (a relative decrease of almost 20%).
Trading behavior
Consistent with the literature, we find that women are significantly less likely to trade. Women are 6.9 percentage points (or a relative 34%) less likely than men to trade at all (in our time period). As a percentage of assets, women traded 4.1 percentage points less than men did, a relative difference of 44%.
Overall, we find that women, at the margin, choose more balanced funds and target-date funds. The most dramatic differences appear in measures of attention and trading, with women half as (digitally) active as men and trading at least 34% less than men. From these choices, it appears that women, at the margin, are more closely aligned with Vanguard’s long-term investment principles of diversification and discipline.
Household coordination and gender investment behavior
One reason we may see lower-than-expected gender differences in allocation is because household members may be coordinating and moderating each other’s behavior. In order to explore how household coordination may attenuate gender differences, we will separately explore gender effects for each of the two types of Vanguard households in our sample: single- and dual-member.11 For example, we know that in dual-member Vanguard households, both investors have chosen to adopt the same investment management firm, a form of household coordination. As such, dual-member Vanguard households may also be more willing to coordinate on other financial decisions, such as allocations, compared with single-member Vanguard households. Indeed, we find that single- and dual-member Vanguard households have directionally consistent results; however, the magnitude of gender differences is generally larger for single-member Vanguard households.
We note that we can only identify the number of Vanguard members within a household. Given this limitation, the category “single-member Vanguard households” consists of single investors as well as households with multiple members where only one person has chosen to invest assets at Vanguard. Similarly, the category of “dual-member Vanguard households” includes any household with two or more members where two people have chosen to invest assets at Vanguard.
8
10 Results available upon request.11 To do this, we count the number of unique (primary and secondary) investors in a given household and keep only observations where the number of unique investors
in a given household is one (single-member) or two (dual-member). As we can only identify the number of members in any given household based on Vanguard data, it is possible that the Vanguard household size does not equal the actual number of members in the household.
9
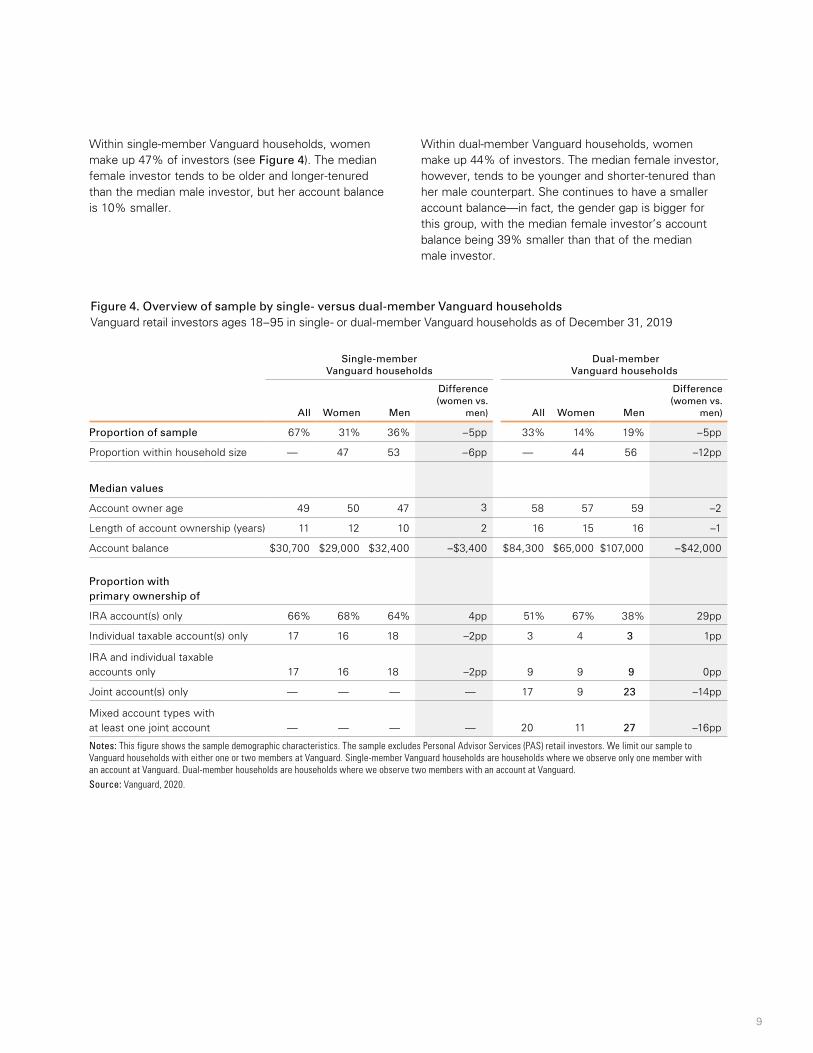
Within single-member Vanguard households, women make up 47% of investors (see Figure 4). The median female investor tends to be older and longer-tenured than the median male investor, but her account balance is 10% smaller.
Within dual-member Vanguard households, women make up 44% of investors. The median female investor, however, tends to be younger and shorter-tenured than her male counterpart. She continues to have a smaller account balance—in fact, the gender gap is bigger for this group, with the median female investor’s account balance being 39% smaller than that of the median male investor.
Figure 4. Overview of sample by single- versus dual-member Vanguard households Vanguard retail investors ages 18–95 in single- or dual-member Vanguard households as of December 31, 2019
Single-member Vanguard households
Dual-member Vanguard households
All Women Men
Difference (women vs.
men) All Women Men
Difference (women vs.
men)
Proportion of sample 67% 31% 36% –5pp 33% 14% 19% –5pp
Proportion within household size — 47 53 –6pp — 44 56 –12pp
Median values
Account owner age 49 50 47 3 58 57 59 –2
Length of account ownership (years) 11 12 10 2 16 15 16 –1
Account balance $30,700 $29,000 $32,400 –$3,400 $84,300 $65,000 $107,000 –$42,000
Proportion with primary ownership of
IRA account(s) only 66% 68% 64% 4pp 51% 67% 38% 29pp
Individual taxable account(s) only 17 16 18 –2pp 3 4 3 1pp
IRA and individual taxable accounts only 17 16 18 –2pp 9 9 9 0pp
Joint account(s) only — — — — 17 9 23 –14pp
Mixed account types with at least one joint account — — — — 20 11 27 –16pp
Notes: This figure shows the sample demographic characteristics. The sample excludes Personal Advisor Services (PAS) retail investors. We limit our sample to Vanguard households with either one or two members at Vanguard. Single-member Vanguard households are households where we observe only one member with an account at Vanguard. Dual-member households are households where we observe two members with an account at Vanguard. Source: Vanguard, 2020.

10
This larger account-balance gap could be partially explained by differences in the proportion of primary ownership by account type.12 Only 20% of women are the primary owners of (at least) one joint account, compared with 50% of men. As a result, women appear to hold only 16% of assets in joint accounts but hold 34% of total assets in individually registered accounts.
Gender differences are generally smaller for dual-member Vanguard households
Our results hold true regardless of whether the Vanguard household is single- or dual-member: A regression analysis shows similar patterns in asset class allocation, product choice, and investment behavior. However, gender differences generally appear to be stronger in single-member compared with dual-member Vanguard households (see Figure 5).13
This is consistent with the hypothesis that dual- member Vanguard households, having chosen the same investment provider for a portion of their wealth, may be more likely to coordinate on other financial decisions, reducing observed gender differences. For example, in single-member Vanguard households, women allocate 2.1 percentage points (or a relative 14%) more assets to target-date funds compared with men. On the other hand, in dual-member Vanguard households, the effect of being a woman is only 0.3 percentage points (or a relative 3%).
12 Again, we may be seeing this difference because of the social convention of listing the male name first (primary) in joint accounts, which leads the male investor to be disproportionately designated as the primary investor for joint accounts.
13 A regression for the interaction effect of being female with whether the investor is in a single- or dual-member Vanguard household shows that the difference between the marginal effect of being female across single- and dual-member Vanguard households is significant at the 1% level for all regressions with the exception of proportion of investors trading, which is significant at the 10% level.

11
Figure 5. Regression: Gender differences in asset class allocation and investment behavior by household size Vanguard retail investors ages 18–95 in single- or dual-member households as of December 31, 2019
Asset class allocation Absolute effect (pp)
Relative effect (%)
Equity share
–1.0pp –2% 0.1pp 0%
Fixed income share
1.7pp 12% 1.3pp 8%
Cash share
–0.6pp –3% –1.4pp –9%
Diversification and risk
Money market
–0.6pp –3%
–1.5pp –10%
Bond funds (and individual bonds)
0.0pp* 0% 0.3pp 4%
Balanced funds
2.9pp 26% 2.1pp 15%
Target-date funds
2.1pp 14% 0.3pp 3%
Equity funds –2.6pp –6% –0.2pp† 0%
Individual stocks –1.6pp –40% –1.1pp –25%
Passive share
Passive share
0.7pp 1% 0.6pp 1%
Attention
Number of log-ons
–10.0pp –46% –14.7pp –47%
Number of calls
–0.1pp –8% –0.5pp –31%
Trading behavior
Proportion of investors trading
–6.7pp –38% –6.6pp –27%
Number of trades
–5.0pp –53% –4.2pp –41%
Number of trading days
–2.2pp –41% –1.8pp –30%
Percentage of assets traded
–4.5pp –50% –3.2pp –31%
Notes: This figure shows the absolute marginal effect of being female (in percentage points) as well as the relative effect (in percent) on product allocations, attention, and trading behavior controlling for age, tenure, estimated income, account balance, being a DC client, and percentage of balance in different account types (e.g., IRA, individual taxable, and joint taxable accounts). Data are as of December 31, 2019. Significance levels are marked for the absolute marginal effect of being female for single and dual-member Vanguard households: * not statistically significant. † statistically significant at the 5% level. All other differences are statistically significant at the 1% level. Source: Vanguard, 2020.
less risk
more riskless diversified
less diversified
■Single-member Vanguard households ■Dual-member Vanguard households
more diversified
The marginal effect of being female
12
One exception to this pattern may be on investor attention. Regression results show that women log on 10 fewer times in a year in single-member Vanguard households and 15 fewer times in dual-member Vanguard households. However, on average, dual-member Vanguard households log on and call more.14 As such, on a relative basis, women are nearly half as digitally active compared with men, regardless of Vanguard household size.
Dual-member Vanguard households appear to have a higher rate and volume of trading compared with single-member ones.15 But we continue to find stark differences in trading behavior regardless of Vanguard household size, with single-member Vanguard households exhibiting an equal or stronger gender effect across all measures.
Variation between men and women in the same household
While these differences appear to be more muted in dual-member Vanguard households, we find that there is still large variation. In this next section we explore gender differences in equity risk-taking within the same household for dual-member Vanguard households only.
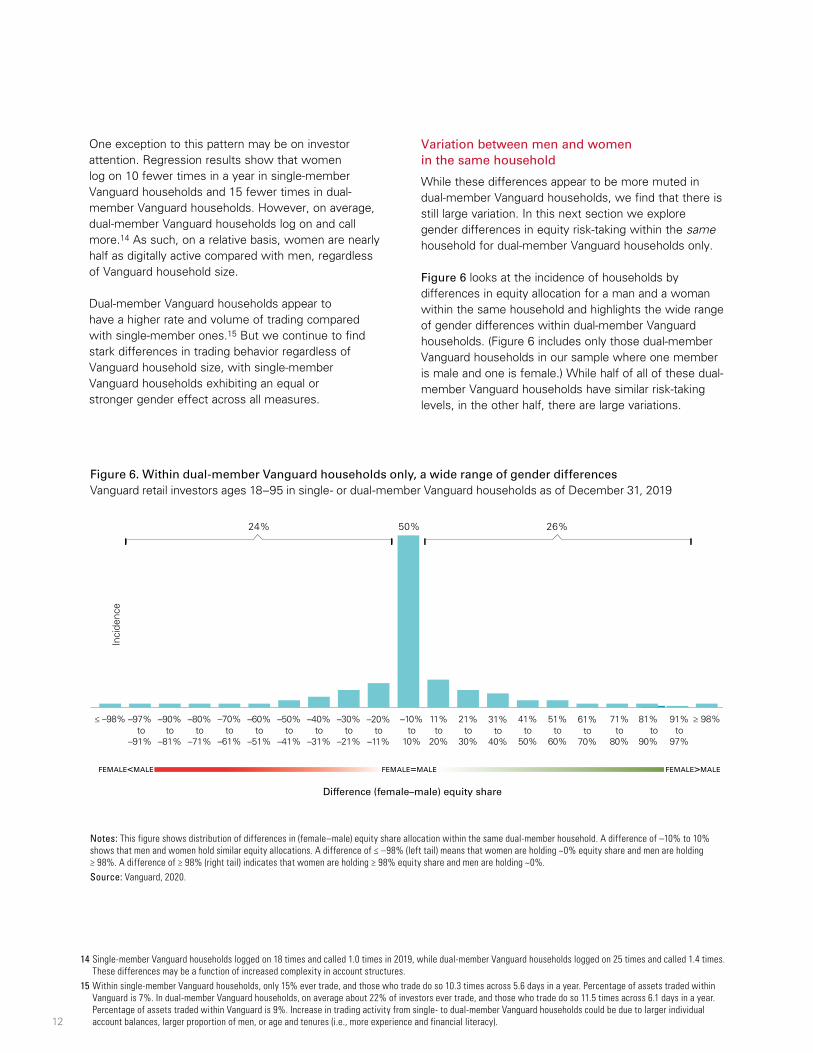
Figure 6 looks at the incidence of households by differences in equity allocation for a man and a woman within the same household and highlights the wide range of gender differences within dual-member Vanguard households. (Figure 6 includes only those dual-member Vanguard households in our sample where one member is male and one is female.) While half of all of these dual-member Vanguard households have similar risk-taking levels, in the other half, there are large variations.
14 Single-member Vanguard households logged on 18 times and called 1.0 times in 2019, while dual-member Vanguard households logged on 25 times and called 1.4 times. These differences may be a function of increased complexity in account structures.
15 Within single-member Vanguard households, only 15% ever trade, and those who trade do so 10.3 times across 5.6 days in a year. Percentage of assets traded within Vanguard is 7%. In dual-member Vanguard households, on average about 22% of investors ever trade, and those who trade do so 11.5 times across 6.1 days in a year. Percentage of assets traded within Vanguard is 9%. Increase in trading activity from single- to dual-member Vanguard households could be due to larger individual account balances, larger proportion of men, or age and tenures (i.e., more experience and financial literacy).
Figure 6. Within dual-member Vanguard households only, a wide range of gender differences Vanguard retail investors ages 18–95 in single- or dual-member Vanguard households as of December 31, 2019
Notes: This figure shows distribution of differences in (female–male) equity share allocation within the same dual-member household. A difference of –10% to 10% shows that men and women hold similar equity allocations. A difference of ≤ –98% (left tail) means that women are holding ~0% equity share and men are holding ≥ 98%. A difference of ≥ 98% (right tail) indicates that women are holding ≥ 98% equity share and men are holding ~0%. Source: Vanguard, 2020.
50% 26%24%
Difference (female–male) equity share
≤ –98% –97% to
–91%
Inci
denc
e
–90%to
–81%
–80%to
–71%
–70%to
–61%
–60%to
–51%
–50%to
–41%
–40%to
–31%
–30%to
–21%
–20%to
–11%
–10%to
10%
11%to
20%
21%to
30%
31%to
40%
41%to
50%
51%to
60%
61%to
70%
71%to
80%
81%to
90%
91%to
97%
≥ 98%
FEMALE<MALE FEMALE>MALEFEMALE=MALE
13
The distribution of intra-household differences in equity risk-taking is also fairly symmetric here, with an almost equal number of incidences where women hold lower equity allocations than men (24% of total) and those where the opposite was true (26%). Interestingly, if women are indeed more risk- averse than men and only some households coordinate, we might expect the distribution of incidence to be skewed toward the left (that is, we would see more women holding lower equity share compared with men). This does not appear to be the case.
Note that we are unable to say if the wide variation seen here comes from a lack of intra-household coordination—where investors in the same Vanguard household have decided to make decisions separately—or because they have jointly decided to allocate assets differently in their different accounts.
Implications
Contrary to popular belief and earlier research, gender differences in aggregate portfolio risk among Vanguard retail investors are negligible. That is, women do not appear more cautious or risk-averse compared with men. Women and men do differ in the types of funds they hold, however, and they differ dramatically in terms of digital financial attention and trading behavior. Compared with men, women hold 23% more assets in balanced funds and 12% more assets in target-date funds. They are also up to 50% less digitally active and trade up to 50% less than men. Women, at the margin, appear more aligned with Vanguard’s long-term investing principles such as diversification and discipline.
We note that gender differences may be muted because household members are coordinating their decisions. That is, household members who have both chosen Vanguard as a retail investment provider may exhibit a higher level of coordination on other investment areas, thereby reducing apparent gender differences in portfolio construction. Indeed, dual-member Vanguard households exhibit directionally consistent but weaker results compared with single-member Vanguard households. For half of male-female dual-member Vanguard households, men and women in the same household have similar portfolios—but we still find a substantial degree of variation among the other half. To us, this suggests the need for further research on the factors motivating such differences.
Taken together, the research described in this paper shows that risk-taking differences, at least among Vanguard investors, are negligible. In this regard, our paper on retail accounts echoes our previous work on DC accounts. Moreover, while female financial literacy in the aggregate may be lower than male financial literacy, there may be particular subgroups (such as the subgroup used in this research, Vanguard investors) where this may not hold true. Indeed, our evidence suggests that, at the margin, women are slightly more diversified and balanced in their investment allocations, are less digitally active, and trade less than men in terms of both volume and frequency.

14
References
Almenberg, Johan, and Anna Dreber, 2015. Gender, Stock Market Participation and Financial Literacy. Economics Letters 137: 140–142.
Bajtelsmit, Vickie L., Alexandra Bernasek, and Nancy A. Jianakopolos, 1999. Gender Differences in Defined Contribution Pension Decisions. Financial Services Review 8: 1–10.
Bajtelsmit, Vickie L., and Alexandra Bernasek, 1996. Why Do Women Invest Differently Than Men? Journal of Financial Counseling and Planning 7: 1–10.
Barber, Brad M., and Terrance Odean, 2001. Boys Will Be Boys: Gender, Overconfidence, and Common Stock Investment. The Quarterly Journal of Economics 116(1): 261–292.
Blau, Francine D., and Lawrence M. Kahn, 2017. The Gender Wage Gap: Extent, Trends, and Explanations. Journal of Economic Literature 55(3): 789–865.
Charness, Gary, and Uri Gneezy, 2012. Strong Evidence for Gender Differences in Risk Taking. Journal of Economic Behavior & Organization 83(1): 50–58.
Clark, Jeffrey W., Stephen P. Utkus, and Jean A. Young, 2019. Understanding Household Trading Behavior 2011–2018. Valley Forge, Pa.: The Vanguard Group.
Dwyer, Peggy D., James H. Gilkeson, and John List, 2002. Gender Differences in Revealed Risk Taking: Evidence From Mutual Fund Investors. Economics Letters 76(2): 151–158.
Levine, Phillip J., Olivia S. Mitchell, and John W. Phillips, 1999. Worklife Determinants of Retirement Income Differentials Between Men and Women. NBER Working Paper No. 7243.
Lusardi, Annamaria, and Olivia S. Mitchell, 2008. Planning and Financial Literacy: How Do Women Fare? American Economic Review 98(2): 413–17.
Young, Galina, and Jean A. Young, 2019. Women Versus Men in DC Plans. Valley Forge, Pa.: The Vanguard Group.
Xu, Carrie Wenjing, YinYin Yu, Jane E. Henshaw, and Stephen P. Utkus, 2019. Introduction to Digital Financial Attention. Valley Forge, Pa.: The Vanguard Group.

15

Connect with Vanguard® > vanguard.com
All investing is subject to risk, including the possible loss of the money you invest. Diversification does not ensure a profit or protect against a loss. Investments in bonds are subject to interest rate, credit, and inflation risk.
Investments in target-date funds are subject to the risks of their underlying funds. The year in the fund name refers to the approximate year (the target date) when an investor in the fund would retire and leave the workforce. The fund will gradually shift its emphasis from more aggressive investments to more conservative ones based on its target date. An investment in a target-date fund is not guaranteed at any time, including on or after the target date.
Vanguard Research
© 2020 The Vanguard Group, Inc. All rights reserved. Vanguard Marketing Corporation, Distributor.
ISGRGD 052020
Related Documents