Sentinel Data Dashboard User Guide Issue: 2 Release: 2 Author The Dashboard Team

Welcome message from author
This document is posted to help you gain knowledge. Please leave a comment to let me know what you think about it! Share it to your friends and learn new things together.
Transcript
Sentinel Data Dashboard User Guide Page 0/17
Sentinel Data Dashboard
User Guide Issue: 2 Release: 2 Author The Dashboard Team
SERCO PUBLIC Date: 26 October 2018
Ref: COPE-SERCO-TN-16-0054 Issue: 2 Release: 2
Sentinel Data Dashboard User Guide Page 1/17
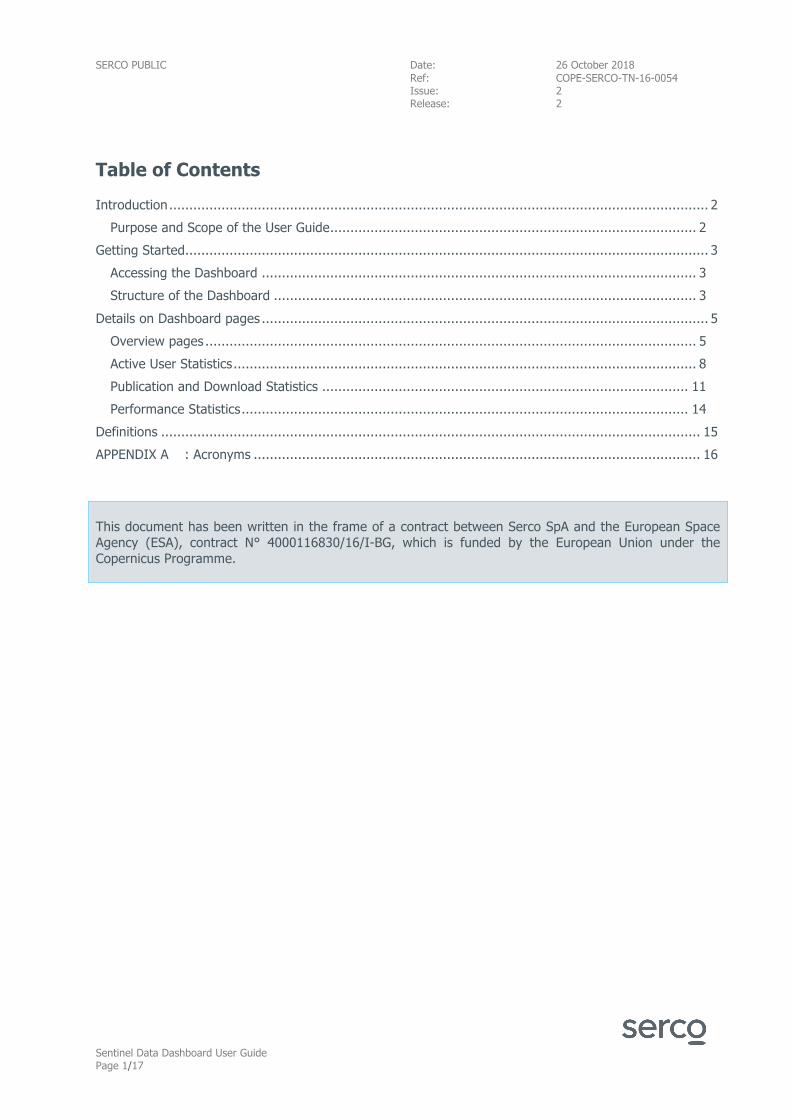
Table of Contents Introduction ...................................................................................................................................... 2
Purpose and Scope of the User Guide ........................................................................................... 2 Getting Started .................................................................................................................................. 3
Accessing the Dashboard ............................................................................................................ 3 Structure of the Dashboard ......................................................................................................... 3
Details on Dashboard pages ............................................................................................................... 5 Overview pages .......................................................................................................................... 5 Active User Statistics ................................................................................................................... 8 Publication and Download Statistics ........................................................................................... 11 Performance Statistics ............................................................................................................... 14
Definitions ...................................................................................................................................... 15 APPENDIX A : Acronyms ............................................................................................................... 16
This document has been written in the frame of a contract between Serco SpA and the European Space Agency (ESA), contract N° 4000116830/16/I-BG, which is funded by the European Union under the Copernicus Programme.
Sentinel Data Dashboard User Guide Page 2/17
Introduction The Sentinel Data Dashboard presents summary statistics for tracking the uptake of Copernicus Sentinel data from ESA’s Data Access System, and for reporting on the overall performance of the system itself. All of the statistics are updated on a daily basis, with the exception of the numbers on the Main Facts and Dissemination statistics pages, which are updated on an hourly basis.
The Dashboard is a web app which has been developed for ESA by Serco SpA. The web page is compatible with most web browsers and mobile devices, and in general the optimal browser to use is Google Chrome. Microsoft Internet Explorer/Edge compatibility is not ensured.
The Sentinel Data Dashboard is available online at:
https://dashboard.copernicus.eu
Purpose and Scope of the User Guide This document is a comprehensive guide for users wishing to consult the Dashboard and provides help for interpreting the information presented. In particular, the document describes:
How to access and navigate the Sentinel Data Dashboard; and Precise meanings and clarifications for the data presented in the Dashboard.
The information in this document is organised in the following sections:
Getting Started: Describes how the Sentinel Data Dashboard can be accessed and navigated; Details on Dashboard pages: Provides details about the parameters chosen to generate the
statistics shown in the Dashboard, to assist the user in interpreting the data; Definitions: Explains the meaning of specific terms used in this document.
This document applies to versions after 1.5.3 (included) of the Sentinel Data Dashboard, released on 26 Oct 2018, and it is also available online on the bottom of the Sentinel Data Dashboard page clicking on
the button .
SERCO PUBLIC Date: 26 October 2018
Ref: COPE-SERCO-TN-16-0054 Issue: 2 Release: 2
Sentinel Data Dashboard User Guide Page 3/17
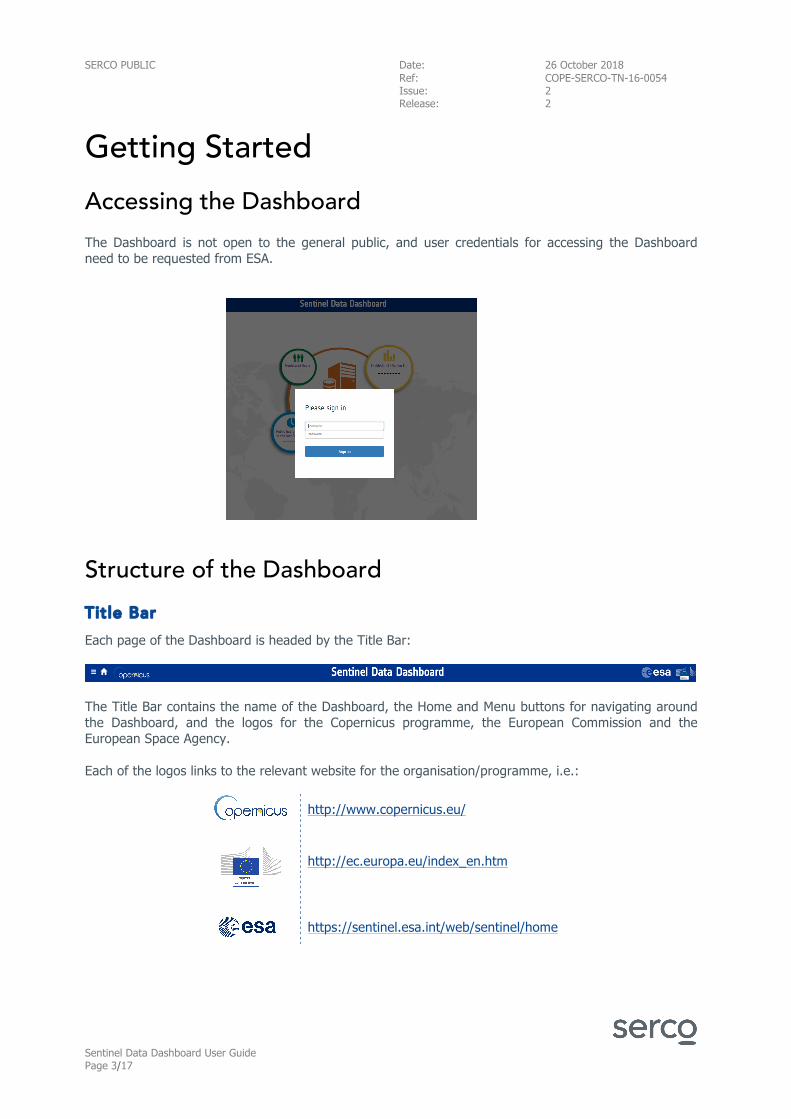
Getting Started Accessing the Dashboard The Dashboard is not open to the general public, and user credentials for accessing the Dashboard need to be requested from ESA.
Structure of the Dashboard Title Bar Each page of the Dashboard is headed by the Title Bar:
The Title Bar contains the name of the Dashboard, the Home and Menu buttons for navigating around the Dashboard, and the logos for the Copernicus programme, the European Commission and the European Space Agency. Each of the logos links to the relevant website for the organisation/programme, i.e.:
http://www.copernicus.eu/
http://ec.europa.eu/index_en.htm
https://sentinel.esa.int/web/sentinel/home
SERCO PUBLIC Date: 26 October 2018
Ref: COPE-SERCO-TN-16-0054 Issue: 2 Release: 2
Sentinel Data Dashboard User Guide Page 4/17
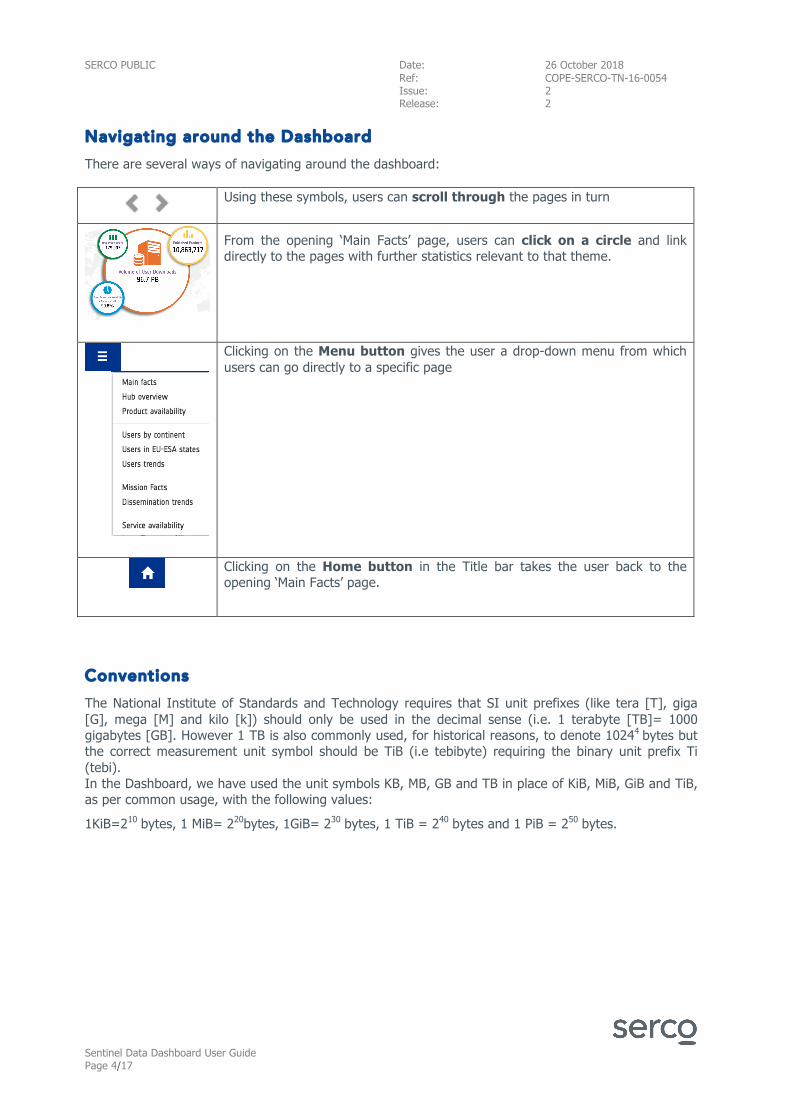
Navigating around the Dashboard There are several ways of navigating around the dashboard:
Using these symbols, users can scroll through the pages in turn
From the opening ‘Main Facts’ page, users can click on a circle and link directly to the pages with further statistics relevant to that theme.
Clicking on the Menu button gives the user a drop-down menu from which users can go directly to a specific page
Clicking on the Home button in the Title bar takes the user back to the opening ‘Main Facts’ page.
Conventions The National Institute of Standards and Technology requires that SI unit prefixes (like tera [T], giga [G], mega [M] and kilo [k]) should only be used in the decimal sense (i.e. 1 terabyte [TB]= 1000 gigabytes [GB]. However 1 TB is also commonly used, for historical reasons, to denote 10244 bytes but the correct measurement unit symbol should be TiB (i.e tebibyte) requiring the binary unit prefix Ti (tebi). In the Dashboard, we have used the unit symbols KB, MB, GB and TB in place of KiB, MiB, GiB and TiB, as per common usage, with the following values:
1KiB=210 bytes, 1 MiB= 220bytes, 1GiB= 230 bytes, 1 TiB = 240 bytes and 1 PiB = 250 bytes.
SERCO PUBLIC Date: 26 October 2018
Ref: COPE-SERCO-TN-16-0054 Issue: 2 Release: 2
Sentinel Data Dashboard User Guide Page 5/17
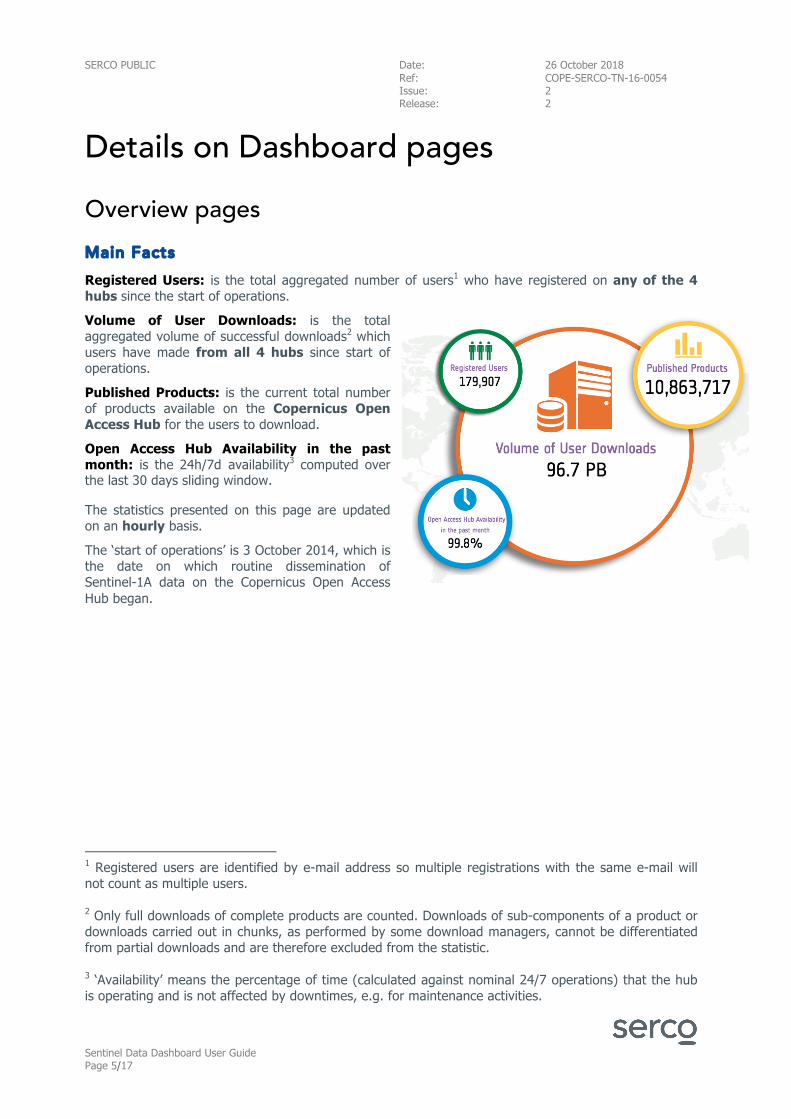
Details on Dashboard pages Overview pages Main Facts Registered Users: is the total aggregated number of users1 who have registered on any of the 4 hubs since the start of operations.
Volume of User Downloads: is the total aggregated volume of successful downloads2 which users have made from all 4 hubs since start of operations.
Published Products: is the current total number of products available on the Copernicus Open Access Hub for the users to download.
Open Access Hub Availability in the past month: is the 24h/7d availability3 computed over the last 30 days sliding window.
The statistics presented on this page are updated on an hourly basis.
The ‘start of operations’ is 3 October 2014, which is the date on which routine dissemination of Sentinel-1A data on the Copernicus Open Access Hub began.
1 Registered users are identified by e-mail address so multiple registrations with the same e-mail will not count as multiple users. 2 Only full downloads of complete products are counted. Downloads of sub-components of a product or downloads carried out in chunks, as performed by some download managers, cannot be differentiated from partial downloads and are therefore excluded from the statistic. 3 ‘Availability’ means the percentage of time (calculated against nominal 24/7 operations) that the hub is operating and is not affected by downtimes, e.g. for maintenance activities.
SERCO PUBLIC Date: 26 October 2018
Ref: COPE-SERCO-TN-16-0054 Issue: 2 Release: 2
Sentinel Data Dashboard User Guide Page 6/17
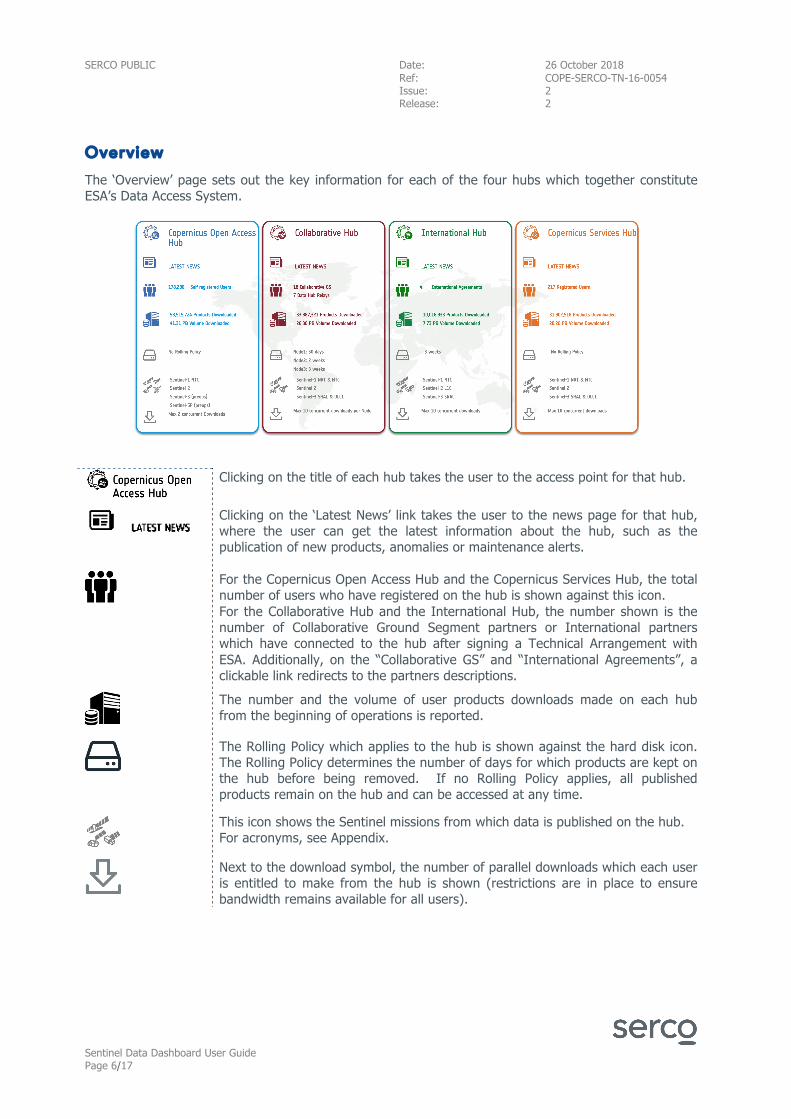
Overview The ‘Overview’ page sets out the key information for each of the four hubs which together constitute ESA’s Data Access System.
Clicking on the title of each hub takes the user to the access point for that hub.
Clicking on the ‘Latest News’ link takes the user to the news page for that hub, where the user can get the latest information about the hub, such as the publication of new products, anomalies or maintenance alerts.
For the Copernicus Open Access Hub and the Copernicus Services Hub, the total number of users who have registered on the hub is shown against this icon. For the Collaborative Hub and the International Hub, the number shown is the number of Collaborative Ground Segment partners or International partners which have connected to the hub after signing a Technical Arrangement with ESA. Additionally, on the “Collaborative GS” and “International Agreements”, a clickable link redirects to the partners descriptions.
The number and the volume of user products downloads made on each hub from the beginning of operations is reported.
The Rolling Policy which applies to the hub is shown against the hard disk icon. The Rolling Policy determines the number of days for which products are kept on the hub before being removed. If no Rolling Policy applies, all published products remain on the hub and can be accessed at any time.
This icon shows the Sentinel missions from which data is published on the hub. For acronyms, see Appendix.
Next to the download symbol, the number of parallel downloads which each user is entitled to make from the hub is shown (restrictions are in place to ensure bandwidth remains available for all users).
SERCO PUBLIC Date: 26 October 2018
Ref: COPE-SERCO-TN-16-0054 Issue: 2 Release: 2
Sentinel Data Dashboard User Guide Page 7/17
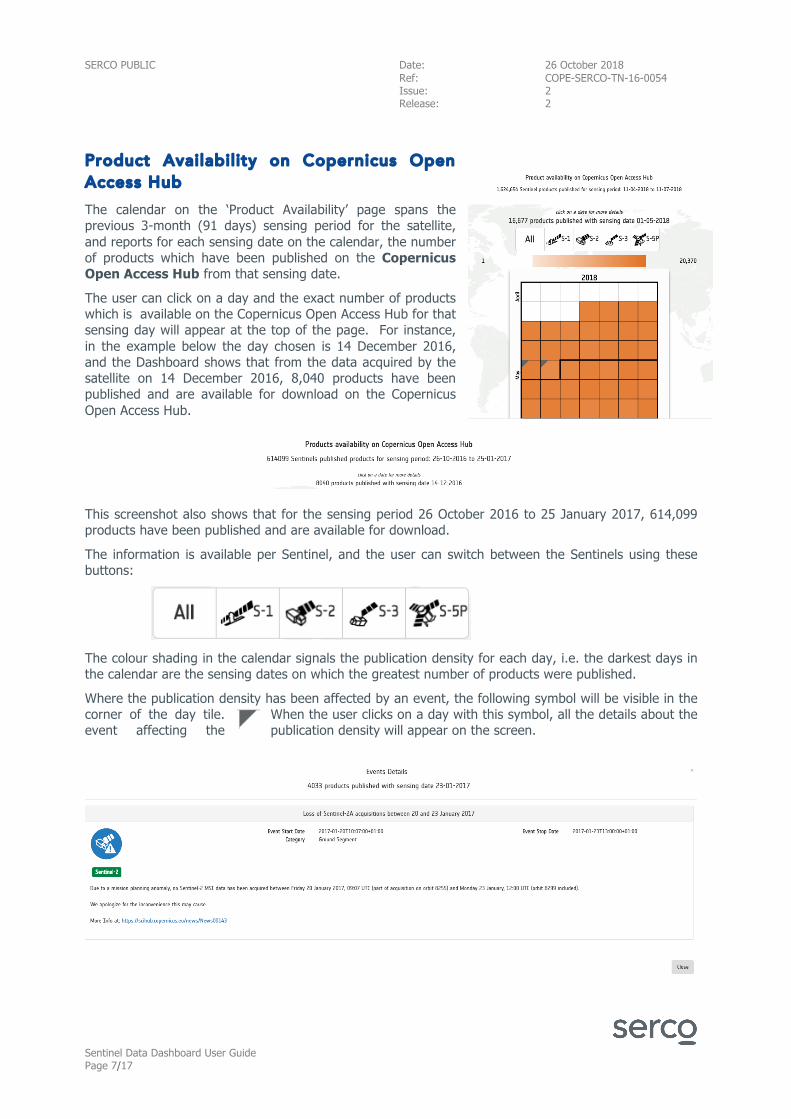
Product Availabil ity on Copernicus Open Access Hub The calendar on the ‘Product Availability’ page spans the previous 3-month (91 days) sensing period for the satellite, and reports for each sensing date on the calendar, the number of products which have been published on the Copernicus Open Access Hub from that sensing date.
The user can click on a day and the exact number of products which is available on the Copernicus Open Access Hub for that sensing day will appear at the top of the page. For instance, in the example below the day chosen is 14 December 2016, and the Dashboard shows that from the data acquired by the satellite on 14 December 2016, 8,040 products have been published and are available for download on the Copernicus Open Access Hub.
This screenshot also shows that for the sensing period 26 October 2016 to 25 January 2017, 614,099 products have been published and are available for download.
The information is available per Sentinel, and the user can switch between the Sentinels using these buttons:
The colour shading in the calendar signals the publication density for each day, i.e. the darkest days in the calendar are the sensing dates on which the greatest number of products were published.
Where the publication density has been affected by an event, the following symbol will be visible in the corner of the day tile. When the user clicks on a day with this symbol, all the details about the event affecting the publication density will appear on the screen.
SERCO PUBLIC Date: 26 October 2018
Ref: COPE-SERCO-TN-16-0054 Issue: 2 Release: 2
Sentinel Data Dashboard User Guide Page 8/17
Active User Statistics It is important to note that the statistics in the Active Users pages are generated from the information which users provide when they first register for access to the Copernicus Open Access Hub4. During the registration procedure, users register their email address (which is verified during registration), state their country, and provide some basic information about the field in which they intend to use the data. There is no active verification of this additional information, so the statistics presented here assume the information entered by the user is truthful and correct.
An ‘active user’ is a registered user who performs at least one full product download during the period in question.
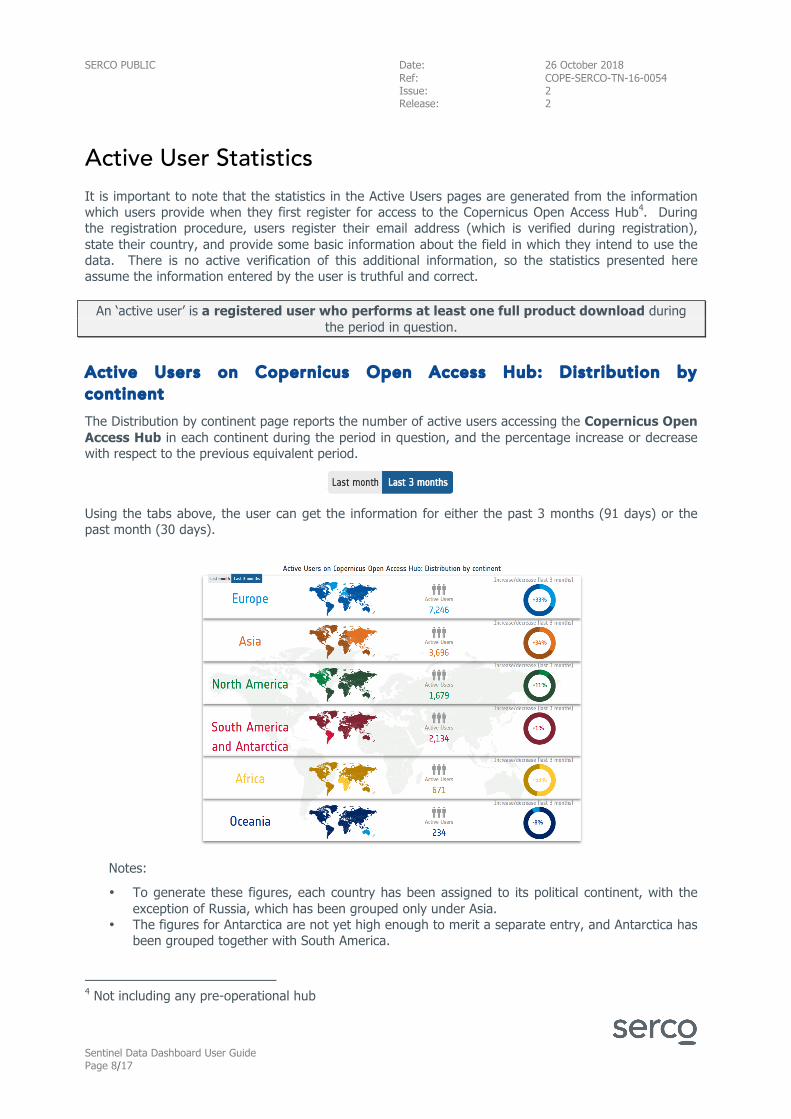
Active Users on Copernicus Open Access Hub: Distribution by continent The Distribution by continent page reports the number of active users accessing the Copernicus Open Access Hub in each continent during the period in question, and the percentage increase or decrease with respect to the previous equivalent period.
Using the tabs above, the user can get the information for either the past 3 months (91 days) or the past month (30 days).
Notes:
• To generate these figures, each country has been assigned to its political continent, with the exception of Russia, which has been grouped only under Asia.
• The figures for Antarctica are not yet high enough to merit a separate entry, and Antarctica has been grouped together with South America.
4 Not including any pre-operational hub
SERCO PUBLIC Date: 26 October 2018
Ref: COPE-SERCO-TN-16-0054 Issue: 2 Release: 2
Sentinel Data Dashboard User Guide Page 9/17
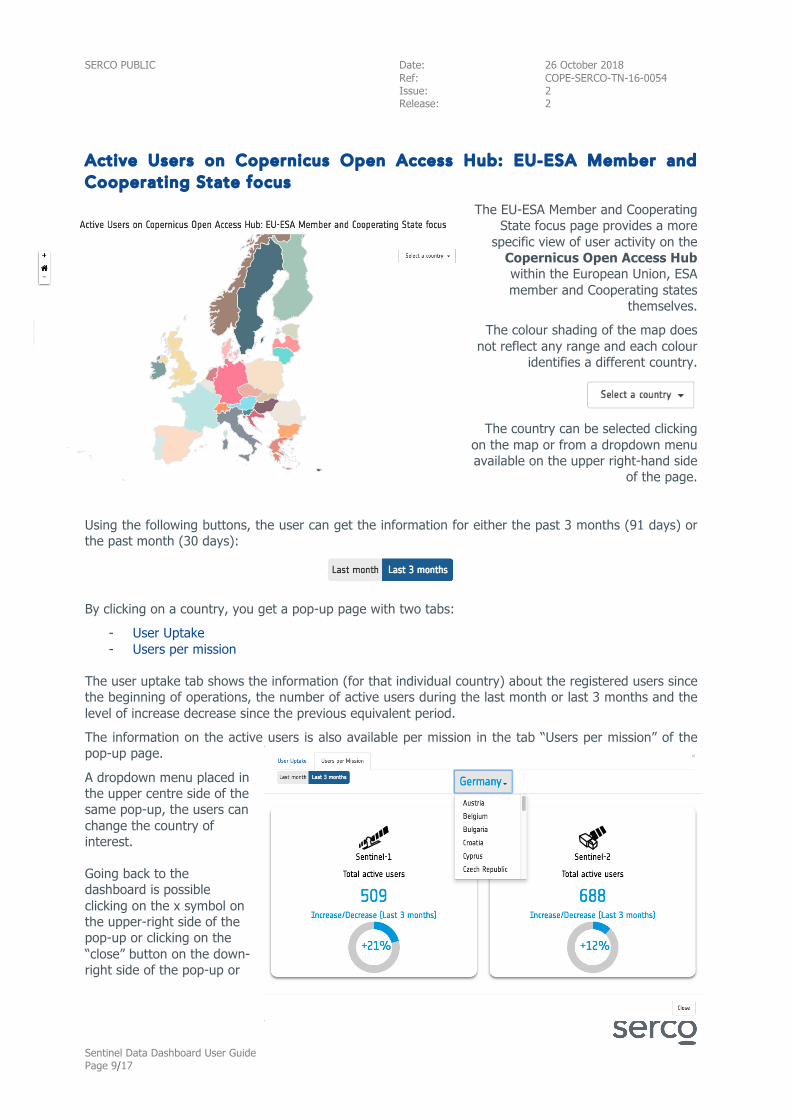
Active Users on Copernicus Open Access Hub: EU-ESA Member and Cooperating State focus
The EU-ESA Member and Cooperating State focus page provides a more
specific view of user activity on the Copernicus Open Access Hub within the European Union, ESA member and Cooperating states
themselves.
The colour shading of the map does not reflect any range and each colour
identifies a different country.
The country can be selected clicking on the map or from a dropdown menu available on the upper right-hand side
of the page.
Using the following buttons, the user can get the information for either the past 3 months (91 days) or the past month (30 days):
By clicking on a country, you get a pop-up page with two tabs:
- User Uptake - Users per mission
The user uptake tab shows the information (for that individual country) about the registered users since the beginning of operations, the number of active users during the last month or last 3 months and the level of increase decrease since the previous equivalent period.
The information on the active users is also available per mission in the tab “Users per mission” of the pop-up page.
A dropdown menu placed in the upper centre side of the same pop-up, the users can change the country of interest.
Going back to the dashboard is possible clicking on the x symbol on the upper-right side of the pop-up or clicking on the “close” button on the down-right side of the pop-up or
SERCO PUBLIC Date: 26 October 2018
Ref: COPE-SERCO-TN-16-0054 Issue: 2 Release: 2
Sentinel Data Dashboard User Guide Page 10/17
just clicking outside the pop-up page.
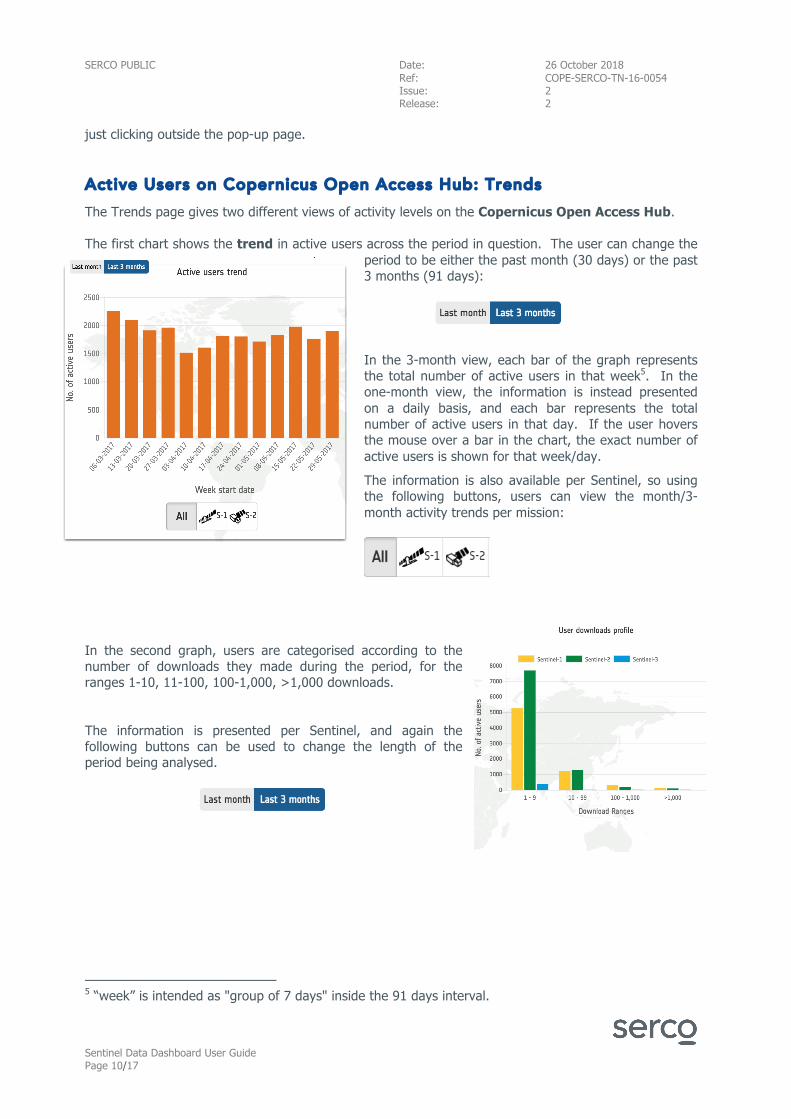
Active Users on Copernicus Open Access Hub: Trends The Trends page gives two different views of activity levels on the Copernicus Open Access Hub.
The first chart shows the trend in active users across the period in question. The user can change the period to be either the past month (30 days) or the past 3 months (91 days):
In the 3-month view, each bar of the graph represents the total number of active users in that week5. In the one-month view, the information is instead presented on a daily basis, and each bar represents the total number of active users in that day. If the user hovers the mouse over a bar in the chart, the exact number of active users is shown for that week/day.
The information is also available per Sentinel, so using the following buttons, users can view the month/3-month activity trends per mission:
In the second graph, users are categorised according to the number of downloads they made during the period, for the ranges 1-10, 11-100, 100-1,000, >1,000 downloads.
The information is presented per Sentinel, and again the following buttons can be used to change the length of the period being analysed.
5 “week” is intended as "group of 7 days" inside the 91 days interval.
SERCO PUBLIC Date: 26 October 2018
Ref: COPE-SERCO-TN-16-0054 Issue: 2 Release: 2
Sentinel Data Dashboard User Guide Page 11/17
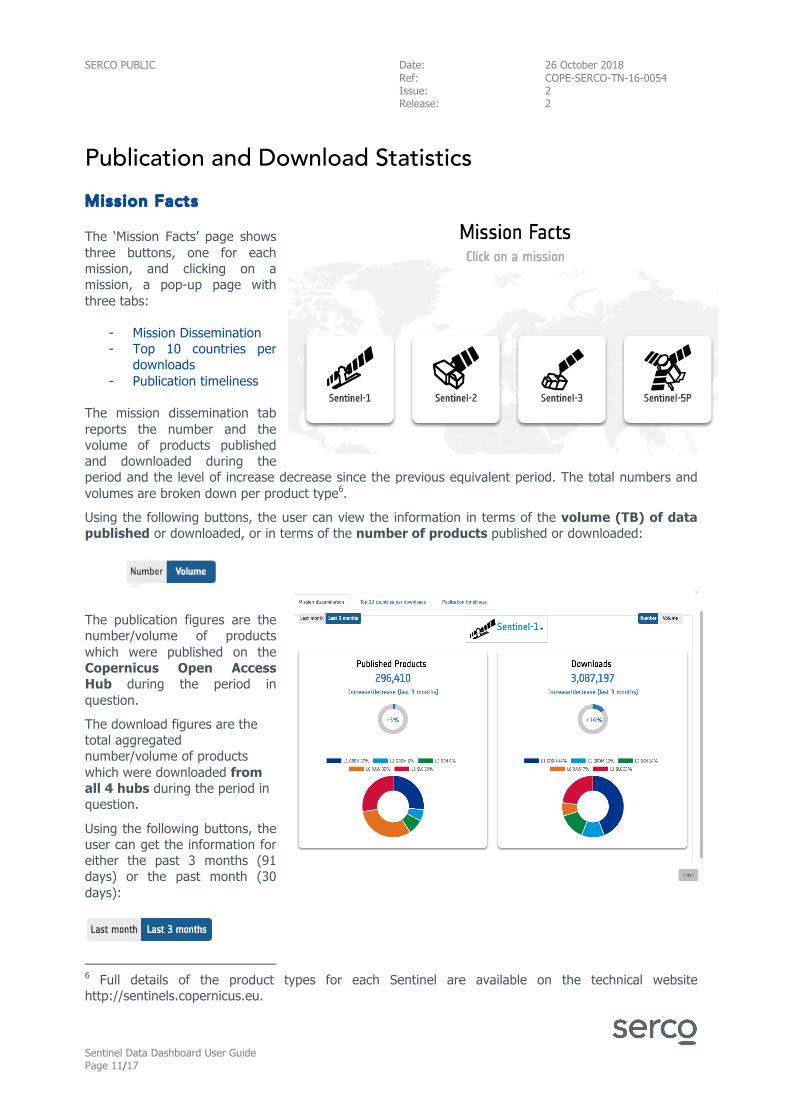
Publication and Download Statistics Mission Facts
The ‘Mission Facts’ page shows three buttons, one for each mission, and clicking on a mission, a pop-up page with three tabs:
- Mission Dissemination - Top 10 countries per
downloads - Publication timeliness
The mission dissemination tab reports the number and the volume of products published and downloaded during the period and the level of increase decrease since the previous equivalent period. The total numbers and volumes are broken down per product type6.
Using the following buttons, the user can view the information in terms of the volume (TB) of data published or downloaded, or in terms of the number of products published or downloaded:
The publication figures are the number/volume of products which were published on the Copernicus Open Access Hub during the period in question.
The download figures are the total aggregated number/volume of products which were downloaded from all 4 hubs during the period in question.
Using the following buttons, the user can get the information for either the past 3 months (91 days) or the past month (30 days):
6 Full details of the product types for each Sentinel are available on the technical website http://sentinels.copernicus.eu.
SERCO PUBLIC Date: 26 October 2018
Ref: COPE-SERCO-TN-16-0054 Issue: 2 Release: 2
Sentinel Data Dashboard User Guide Page 12/17
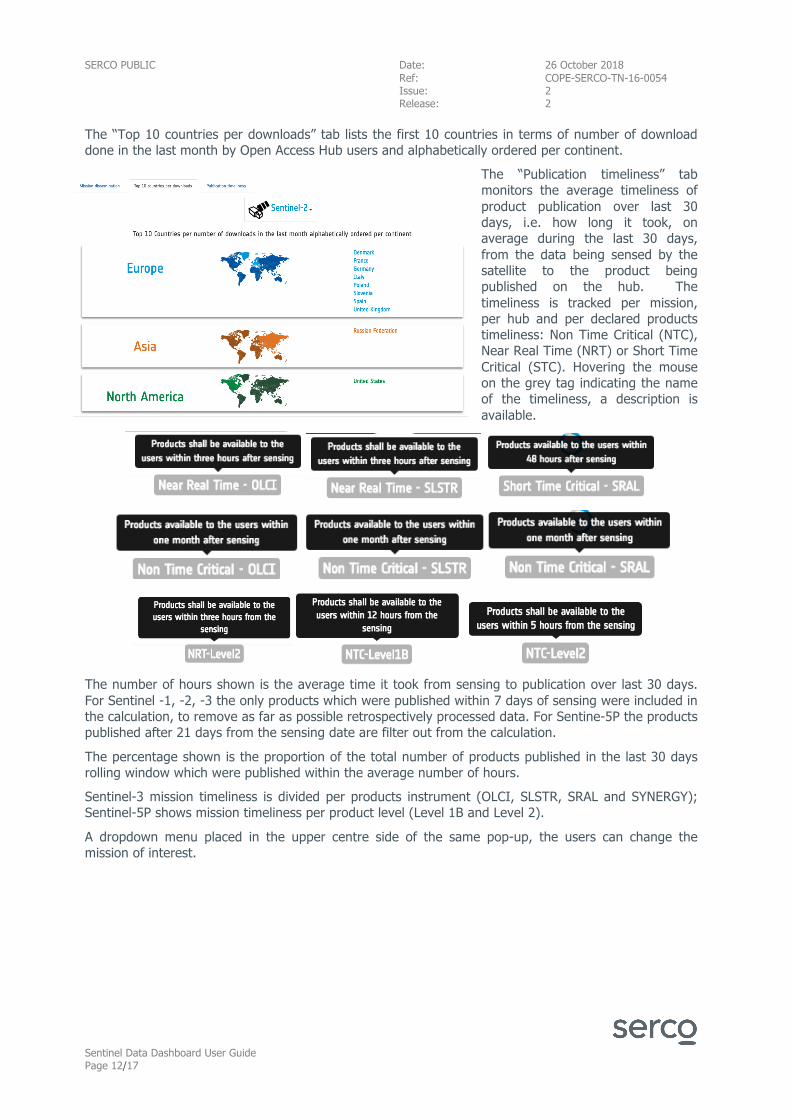
The “Top 10 countries per downloads” tab lists the first 10 countries in terms of number of download done in the last month by Open Access Hub users and alphabetically ordered per continent.
The “Publication timeliness” tab monitors the average timeliness of product publication over last 30 days, i.e. how long it took, on average during the last 30 days, from the data being sensed by the satellite to the product being published on the hub. The timeliness is tracked per mission, per hub and per declared products timeliness: Non Time Critical (NTC), Near Real Time (NRT) or Short Time Critical (STC). Hovering the mouse on the grey tag indicating the name of the timeliness, a description is available.
The number of hours shown is the average time it took from sensing to publication over last 30 days. For Sentinel -1, -2, -3 the only products which were published within 7 days of sensing were included in the calculation, to remove as far as possible retrospectively processed data. For Sentine-5P the products published after 21 days from the sensing date are filter out from the calculation.
The percentage shown is the proportion of the total number of products published in the last 30 days rolling window which were published within the average number of hours.
Sentinel-3 mission timeliness is divided per products instrument (OLCI, SLSTR, SRAL and SYNERGY); Sentinel-5P shows mission timeliness per product level (Level 1B and Level 2).
A dropdown menu placed in the upper centre side of the same pop-up, the users can change the mission of interest.
SERCO PUBLIC Date: 26 October 2018
Ref: COPE-SERCO-TN-16-0054 Issue: 2 Release: 2
Sentinel Data Dashboard User Guide Page 13/17
Going back to the dashboard is possible clicking on the x symbol on the upper-right side of the pop-up or clicking on the “close” button on the down-right side of the pop-up or just clicking outside the pop-up page.
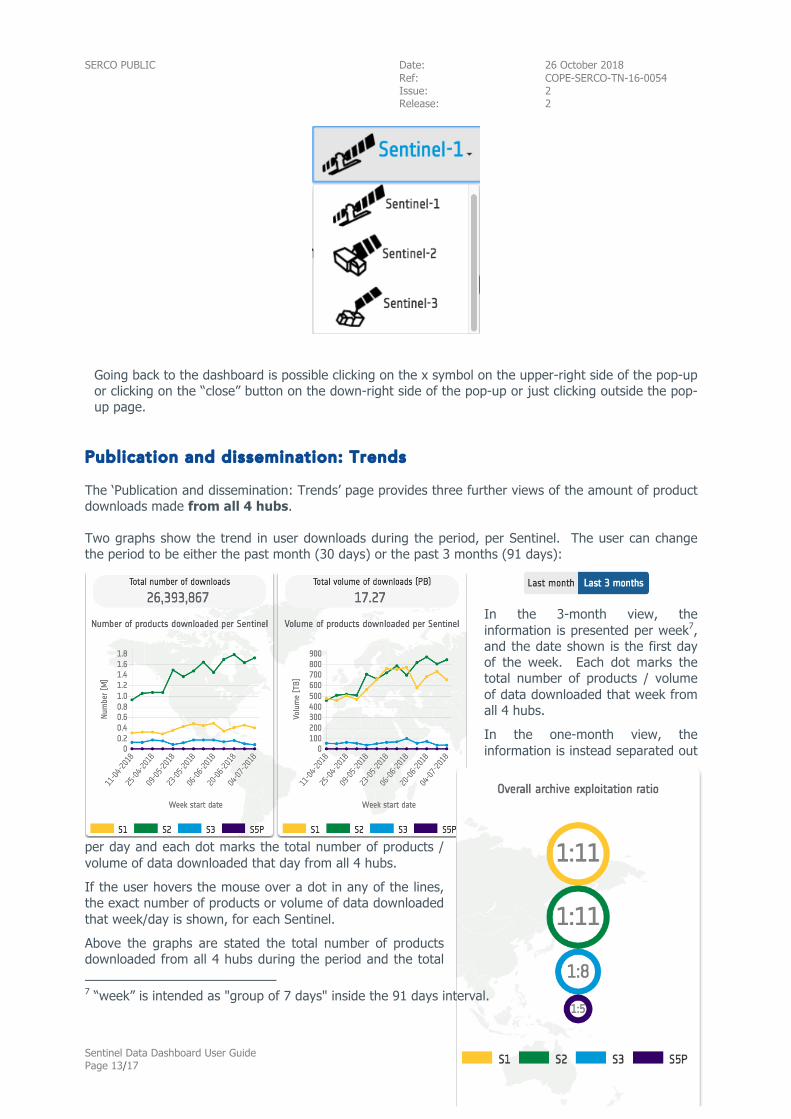
Publication and dissemination: Trends
The ‘Publication and dissemination: Trends’ page provides three further views of the amount of product downloads made from all 4 hubs.
Two graphs show the trend in user downloads during the period, per Sentinel. The user can change the period to be either the past month (30 days) or the past 3 months (91 days):
In the 3-month view, the information is presented per week7, and the date shown is the first day of the week. Each dot marks the total number of products / volume of data downloaded that week from all 4 hubs.
In the one-month view, the information is instead separated out
per day and each dot marks the total number of products / volume of data downloaded that day from all 4 hubs.
If the user hovers the mouse over a dot in any of the lines, the exact number of products or volume of data downloaded that week/day is shown, for each Sentinel.
Above the graphs are stated the total number of products downloaded from all 4 hubs during the period and the total
7 “week” is intended as "group of 7 days" inside the 91 days interval.
SERCO PUBLIC Date: 26 October 2018
Ref: COPE-SERCO-TN-16-0054 Issue: 2 Release: 2
Sentinel Data Dashboard User Guide Page 14/17
volume of data downloaded from all 4 hubs during the period.
The ‘Publication and dissemination: Trends’ page also shows three circles which present, for each Sentinel, the average number of times each product has been used since the start of operations. This figure is calculated as the total number of products for that Sentinel which have been download from all of the 4 hubs since the start of operations, divided by the number of products for that Sentinel which have been published on any one of the hubs since the start of operations.
The size of the circles grows or decreases in proportion to the size of this archive exploitation ratio.
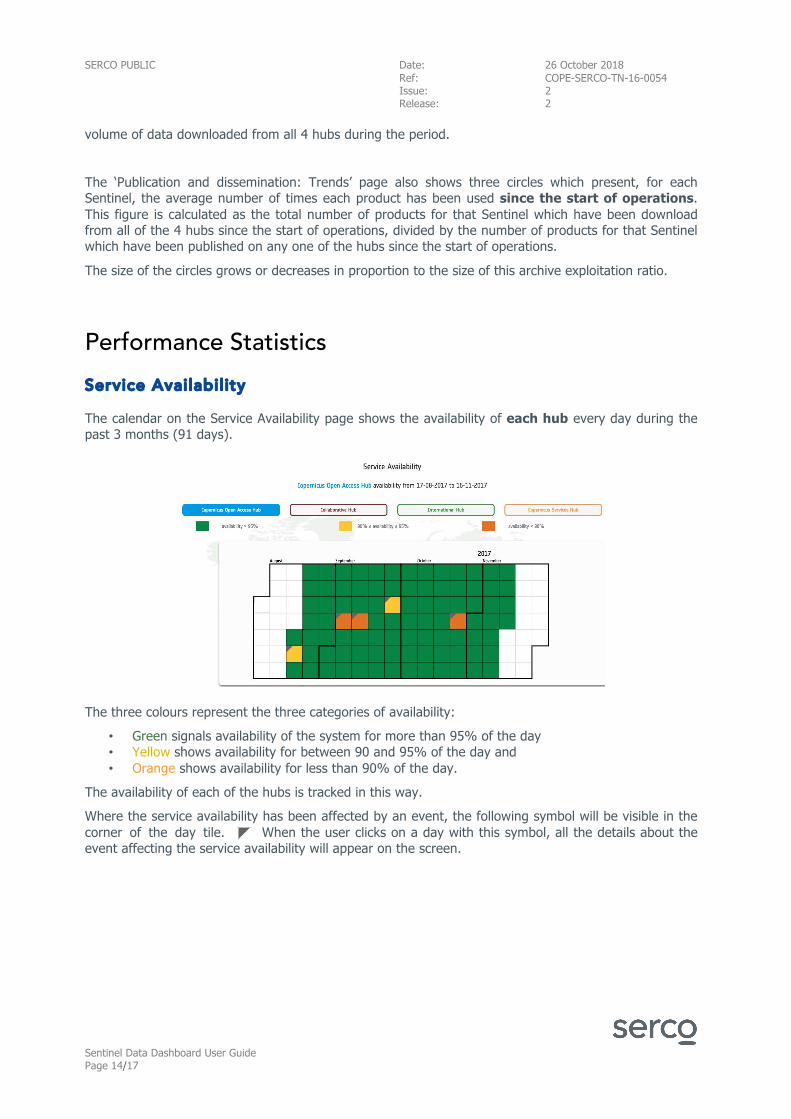
Performance Statistics Service Availabil ity
The calendar on the Service Availability page shows the availability of each hub every day during the past 3 months (91 days).
The three colours represent the three categories of availability:
• Green signals availability of the system for more than 95% of the day • Yellow shows availability for between 90 and 95% of the day and • Orange shows availability for less than 90% of the day.
The availability of each of the hubs is tracked in this way.
Where the service availability has been affected by an event, the following symbol will be visible in the corner of the day tile. When the user clicks on a day with this symbol, all the details about the event affecting the service availability will appear on the screen.
SERCO PUBLIC Date: 26 October 2018
Ref: COPE-SERCO-TN-16-0054 Issue: 2 Release: 2
Sentinel Data Dashboard User Guide Page 15/17
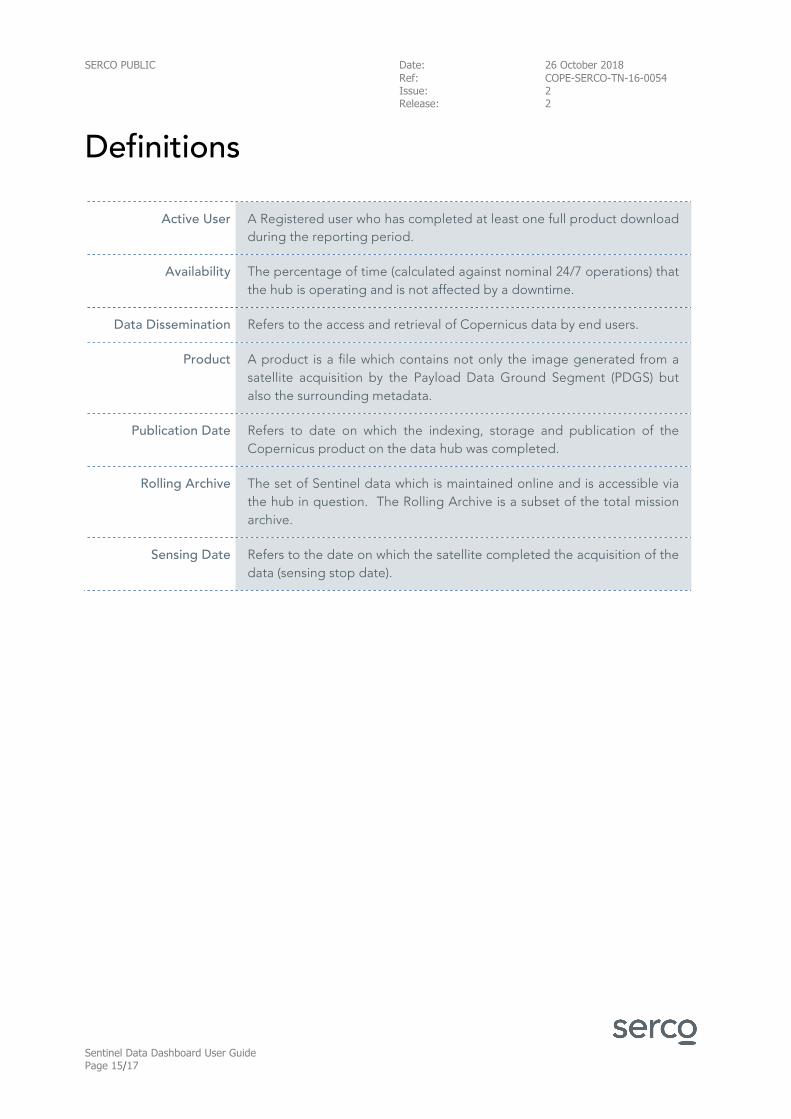
Definitions
Active User A Registered user who has completed at least one full product download during the reporting period.
Availability The percentage of time (calculated against nominal 24/7 operations) that the hub is operating and is not affected by a downtime.
Data Dissemination Refers to the access and retrieval of Copernicus data by end users.
Product A product is a file which contains not only the image generated from a satellite acquisition by the Payload Data Ground Segment (PDGS) but also the surrounding metadata.
Publication Date Refers to date on which the indexing, storage and publication of the Copernicus product on the data hub was completed.
Rolling Archive The set of Sentinel data which is maintained online and is accessible via the hub in question. The Rolling Archive is a subset of the total mission archive.
Sensing Date Refers to the date on which the satellite completed the acquisition of the data (sensing stop date).
SERCO PUBLIC Date: 26 October 2018
Ref: COPE-SERCO-TN-16-0054 Issue: 2 Release: 2
Sentinel Data Dashboard User Guide Page 16/17
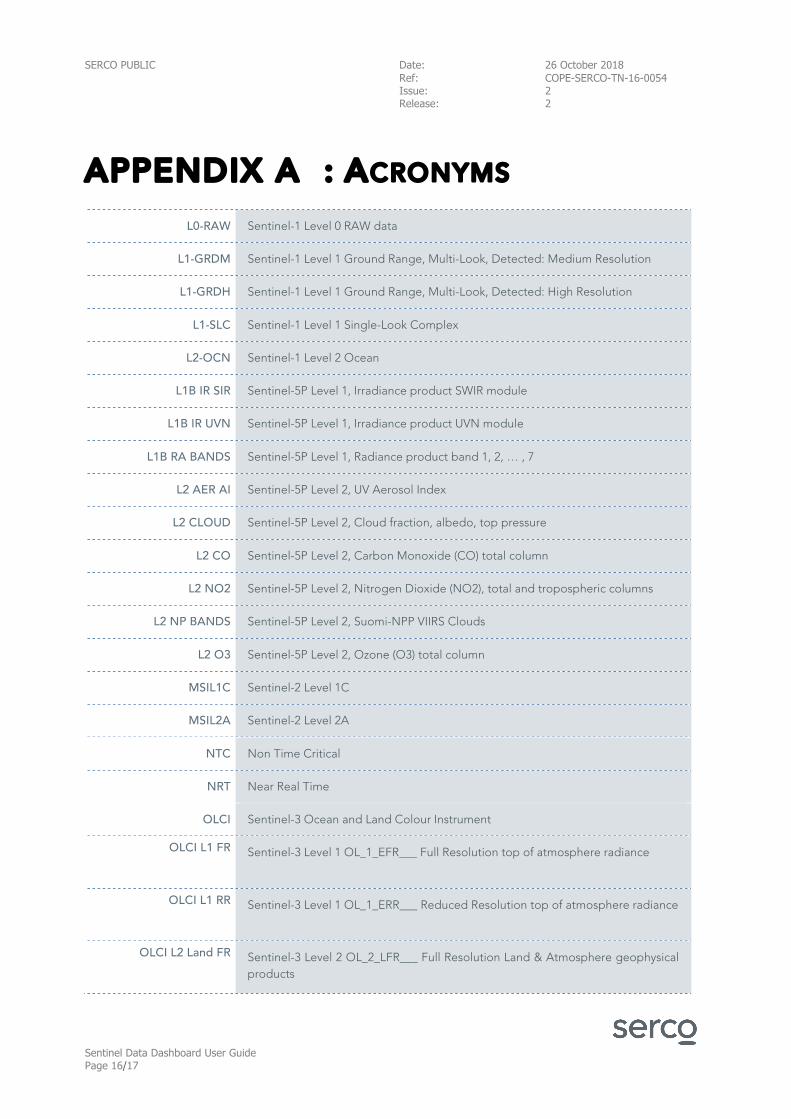
APPENDIX A : ACRONYMS
L0-RAW Sentinel-1 Level 0 RAW data
L1-GRDM Sentinel-1 Level 1 Ground Range, Multi-Look, Detected: Medium Resolution
L1-GRDH Sentinel-1 Level 1 Ground Range, Multi-Look, Detected: High Resolution
L1-SLC Sentinel-1 Level 1 Single-Look Complex
L2-OCN Sentinel-1 Level 2 Ocean
L1B IR SIR Sentinel-5P Level 1, Irradiance product SWIR module
L1B IR UVN Sentinel-5P Level 1, Irradiance product UVN module
L1B RA BANDS Sentinel-5P Level 1, Radiance product band 1, 2, … , 7
L2 AER AI Sentinel-5P Level 2, UV Aerosol Index
L2 CLOUD Sentinel-5P Level 2, Cloud fraction, albedo, top pressure
L2 CO Sentinel-5P Level 2, Carbon Monoxide (CO) total column
L2 NO2 Sentinel-5P Level 2, Nitrogen Dioxide (NO2), total and tropospheric columns
L2 NP BANDS Sentinel-5P Level 2, Suomi-NPP VIIRS Clouds
L2 O3 Sentinel-5P Level 2, Ozone (O3) total column
MSIL1C Sentinel-2 Level 1C
MSIL2A Sentinel-2 Level 2A
NTC Non Time Critical
NRT Near Real Time
OLCI Sentinel-3 Ocean and Land Colour Instrument
OLCI L1 FR
Sentinel-3 Level 1 OL_1_EFR___ Full Resolution top of atmosphere radiance
OLCI L1 RR
Sentinel-3 Level 1 OL_1_ERR___ Reduced Resolution top of atmosphere radiance
OLCI L2 Land FR
Sentinel-3 Level 2 OL_2_LFR___ Full Resolution Land & Atmosphere geophysical products
SERCO PUBLIC Date: 26 October 2018
Ref: COPE-SERCO-TN-16-0054 Issue: 2 Release: 2
Sentinel Data Dashboard User Guide Page 17/17
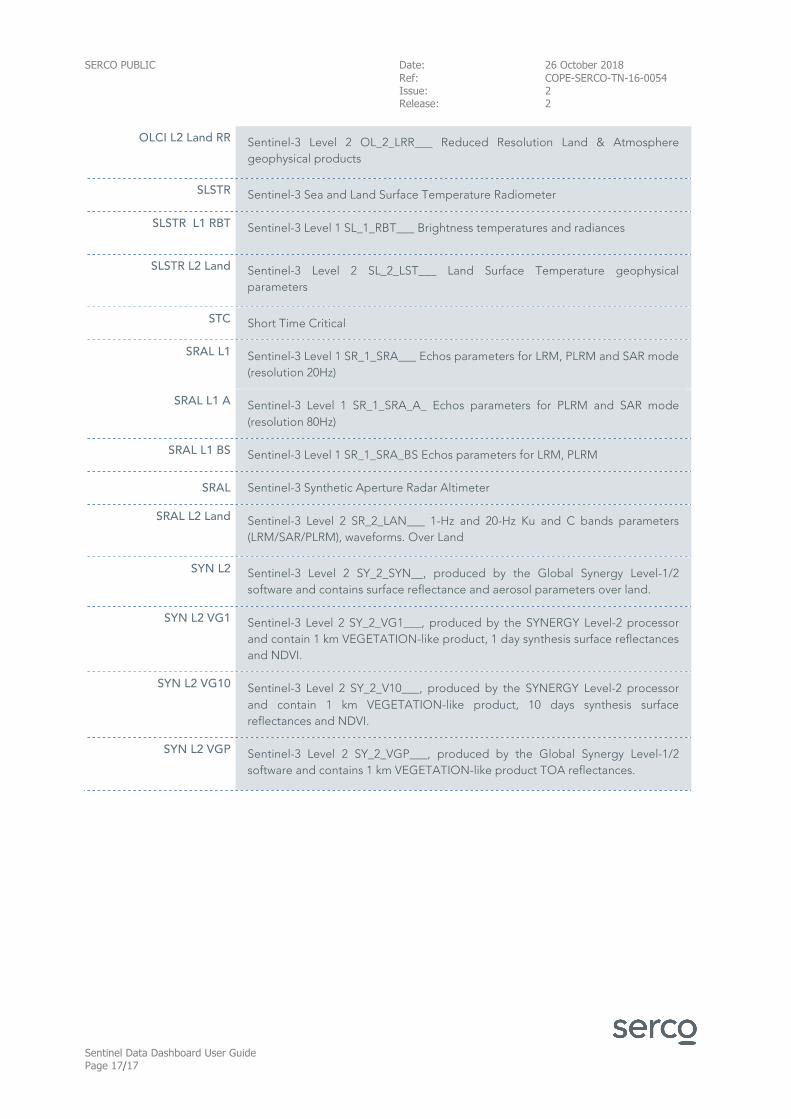
OLCI L2 Land RR
Sentinel-3 Level 2 OL_2_LRR___ Reduced Resolution Land & Atmosphere geophysical products
SLSTR Sentinel-3 Sea and Land Surface Temperature Radiometer
SLSTR L1 RBT
Sentinel-3 Level 1 SL_1_RBT___ Brightness temperatures and radiances
SLSTR L2 Land
Sentinel-3 Level 2 SL_2_LST___ Land Surface Temperature geophysical parameters
STC Short Time Critical
SRAL L1 Sentinel-3 Level 1 SR_1_SRA___ Echos parameters for LRM, PLRM and SAR mode (resolution 20Hz)
SRAL L1 A
Sentinel-3 Level 1 SR_1_SRA_A_ Echos parameters for PLRM and SAR mode (resolution 80Hz)
SRAL L1 BS Sentinel-3 Level 1 SR_1_SRA_BS Echos parameters for LRM, PLRM
SRAL Sentinel-3 Synthetic Aperture Radar Altimeter
SRAL L2 Land
Sentinel-3 Level 2 SR_2_LAN___ 1-Hz and 20-Hz Ku and C bands parameters (LRM/SAR/PLRM), waveforms. Over Land
SYN L2
Sentinel-3 Level 2 SY_2_SYN__, produced by the Global Synergy Level-1/2 software and contains surface reflectance and aerosol parameters over land.
SYN L2 VG1
Sentinel-3 Level 2 SY_2_VG1___, produced by the SYNERGY Level-2 processor and contain 1 km VEGETATION-like product, 1 day synthesis surface reflectances and NDVI.
SYN L2 VG10
Sentinel-3 Level 2 SY_2_V10___, produced by the SYNERGY Level-2 processor and contain 1 km VEGETATION-like product, 10 days synthesis surface reflectances and NDVI.
SYN L2 VGP
Sentinel-3 Level 2 SY_2_VGP___, produced by the Global Synergy Level-1/2 software and contains 1 km VEGETATION-like product TOA reflectances.
Related Documents