Novell® Sentinel ™ www.novell.com 6.0.2 October 2008 Volume II – SENTINEL USER GUIDE

Welcome message from author
This document is posted to help you gain knowledge. Please leave a comment to let me know what you think about it! Share it to your friends and learn new things together.
Transcript

Novell® Sentinel™
www.nove l l . c om 6.0.2
October 2008
Vo l um e I I – S EN T IN EL USER GU IDE
Legal Notices Novell, Inc. makes no representations or warranties with respect to the contents or use of this documentation, and specifically disclaims any express or implied warranties of merchantability or fitness for any particular purpose. Further, Novell, Inc. reserves the right to any and all parts of Novell software, to revise this publication and to make changes to its content, at any time, without obligation to notify any person or entity of such revisions or changes. Any products or technical information provided under this Agreement may be subject to U.S. export controls and the trade laws of other countries. You agree to comply with all export control regulations and to obtain any required licenses or classification to export, re-export, or import deliverables. You agree not to export or re-export to entities on the current U.S. export exclusion lists or to any embargoed or terrorist countries as specified in the U.S. export laws. You agree to not use deliverables for prohibited nuclear, missile, or chemical biological weaponry end uses. Please refer to http://www.novell.com/info/exports/ for more information on exporting Novell software. Novell assumes no responsibility for your failure to obtain any necessary export approvals. Copyright © 1999-2007 Novell, Inc. All rights reserved. No part of this publication may be reproduced, photocopied, stored on a retrieval system, or transmitted without the express written consent of the publisher. Novell, Inc. has intellectual property rights relating to technology embodied in the product that is described in this document. In particular, and without limitation, these intellectual property rights may include one or more of the U.S. patents listed at http://www.novell.com/company/legal/patents/ and one or more additional patents or pending patent applications in the U.S. and in other countries. Novell, Inc. 404 Wyman Street, Suite 500 Waltham, MA 02451 U.S.A. www.novell.com Online Documentation: To access the online documentation for this and other Novell products and to get updates, see www.novell.com/documentation.

Novell Trademarks For Novell trademarks, see the Novell Trademark and Service Mark list (http://www.novell.com/company/legal/trademarks/tmlist.html).
Third-Party Materials All third-party trademarks are the property of their respective owners.
Third Party Legal Notices This product may include the following open source programs that are available under the LGPL license. The text for this license can be found in the Licenses directory. edtFTPj-1.2.3 is licensed under the Lesser GNU Public License. For more information, disclaimers and
restrictions see http://www.enterprisedt.com/products/edtftpj/purchase.html.
Enhydra Shark, licensed under the Lesser General Public License available at: http://shark.objectweb.org/license.html.
Esper. Copyright © 2005-2006, Codehaus. FESI is licensed under the Lesser GNU Public License. For more information, disclaimers and restrictions, see
http://www.lugrin.ch/fesi/index.html.
jTDS-1.2.2.jar is licensed under the Lesser GNU Public License. For more information, disclaimers and restrictions see http://jtds.sourceforge.net/.
MDateSelector. Copyright © 2005, Martin Newstead, licensed under the Lesser General Public License. For more information, disclaimers and restrictions see http://web.ukonline.co.uk/mseries.
Tagish Java Authentication and Authorization Service Modules, licensed under the Lesser General Public License. For more information, disclaimers and restrictions see http://free.tagish.net/jaas/index.jsp.
This product may include the following software developed by The Apache Software Foundation (http://www.apache.org/) and licensed under the Apache License, Version 2.0 (the "License"); the text for this license can be found in the Licenses directory or at http://www.apache.org/licenses/LICENSE-2.0. Unless required by applicable law or agreed to in writing, software distributed under the License is distributed on an "AS IS" BASIS, WITHOUT WARRANTIES OR CONDITIONS OF ANY KIND, either express or implied. See the License for the specific language governing permissions and limitations under the License. Apache Axis and Apache Tomcat, Copyright © 1999 to 2005, Apache Software Foundation. For more
information, disclaimers and restrictions, see http://www.apache.org/licenses/.
Apache FOP.jar, Copyright 1999-2007, Apache Software Foundation. For more information, disclaimers and restrictions, see http://www.apache.org/licenses/.
Apache Lucene, Copyright © 1999 to 2005, Apache Software Foundation. For more information, disclaimers and restrictions, see http://www.apache.org/licenses/.
Bean Scripting Framework (BSF), licensed by the Apache Software Foundation Copyright © 1999-2004. For more information, disclaimers and restrictions see http://xml.apache.org/dist/LICENSE.txt.
Skin Look and Feel (SkinLF). Copyright © 2000-2006 L2FProd.com. Licensed under the Apache Software License. For more information, disclaimers and restrictions see https://skinlf.dev.java.net/.
Xalan and Xerces, both of which are licensed by the Apache Software Foundation Copyright © 1999-2004. For more information, disclaimers and restrictions see http://xml.apache.org/dist/LICENSE.txt.
This product may include the following open source programs that are available under the Java license. JavaBeans Activation Framework (JAF). Copyright © Sun Microsystems, Inc. For more information,
disclaimers and restrictions see http://www.java.sun.com/products/javabeans/glasgow/jaf.html and click download > license.

Java 2 Platform, Standard Edition. Copyright © Sun Microsystems, Inc. For more information, disclaimers and restrictions see http://java.sun.com/j2se/1.5.0/docs/relnotes/SMICopyright.html.
JavaMail. Copyright © Sun Microsystems, Inc. For more information, disclaimers and restrictions see http://www.java.sun.com/products/javamail/downloads/index.html and click download > license.
This product may include the following open source and third party programs. ANTLR. For more information, disclaimers and restrictions, see http://www.antlr.org.
Boost. Copyright © 1999, Boost.org.
Concurrent, utility package. Copyright © Doug Lea. Used without CopyOnWriteArrayList and ConcurrentReaderHashMap classes.
ICEsoft ICEbrowser. ICEsoft Technologies, Inc. Copyright © 2003-2004.
ILOG, Inc. Copyright © 1999-2004.
Java Ace, by Douglas C. Schmidt and his research group at Washington University. Copyright © 1993-2005. For more information, disclaimers and restrictions see http://www.cs.wustl.edu/~schmidt/ACE-copying.html and http://www.cs.wustl.edu/~schmidt/ACE.html.
Java Service Wrapper. Portions copyrighted as follows: Copyright © 1999, 2004 Tanuki Software and Copyright © 2001 Silver Egg Technology. For more information, disclaimers and restrictions, see http://wrapper.tanukisoftware.org/doc/english/license.html.
JIDE. Copyright © 2002 to 2005, JIDE Software, Inc.
JLDAP. Copyright © 1998-2005 The OpenLDAP Foundation. All rights reserved. Portions Copyright © 1999 - 2003 Novell, Inc. All Rights Reserved.
Monarch Charts. Copyright © 2005, Singleton Labs.
OpenSSL, by the OpenSSL Project. Copyright © 1998-2004. For more information, disclaimers and restrictions, see http://www.openssl.org.
Oracle Help for Java. Copyright © 1994-2006, Oracle Corporation.
Rhino. Usage is subject to Mozilla Public License 1.1. For more information, see http://www.mozilla.org/rhino/.
SecurityNexus. Copyright © 2003 to 2006. SecurityNexus, LLC. All rights reserved.
Sonic Software Corporation. Copyright © 2003-2004. The SSC software contains security software licensed from RSA Security, Inc.
Tao (with ACE wrappers) by Douglas C. Schmidt and his research group at Washington University, University of California, Irvine and Vanderbilt University. Copyright © 1993-2005. For more information, disclaimers and restrictions see http://www.cs.wustl.edu/~schmidt/ACE-copying.html and http://www.cs.wustl.edu/~schmidt/ACE.html.
Tinyxml. For more information, disclaimers and restrictions see http://grinninglizard.com/tinyxmldocs/index.html.
yWorks. Copyright © 2003 to 2006, yWorks.
NOTE: As of the publication of this documentation, the above links were active. In the event you find that any of the above links are broken or the linked web pages are inactive, please contact Novell, Inc., 404 Wyman Street, Suite 500, Waltham, MA 02451 U.S.A.

Preface The Sentinel Technical documentation is general-purpose operation and reference guide. This documentation is intended for Information Security Professionals. The text in this documentation is designed to serve as a source of reference about Sentinel’s Enterprise Security Management System. There is additional documentation available on the Novell Web Portal (http://www.novell.com/documentation/).
Sentinel Technical documentation is broken down into six different volumes. They are:
Volume I – Sentinel Install Guide Volume II – Sentinel User Guide Volume III – Sentinel Collector Builder User Guide Volume IV – Sentinel User Reference Guide Volume V – Sentinel 3rd Party Integration Volume VI – Sentinel Patch Installation Guide
Volume I – Sentinel Install Guide This guide explains how to install:
Sentinel Server Sentinel Console Sentinel Correlation Engine Sentinel Crystal Reports
Collector Builder Collector Manager Advisor
Volume II – Sentinel User Guide This guide discusses:
Sentinel Console Operation Sentinel Features Sentinel Architecture Sentinel Communication Shutdown/Startup of Sentinel Vulnerability assessment Event monitoring Event filtering Event correlation Sentinel Data Manager
Event Configuration for Business Relevance
Mapping Service Historical reporting Collector Host Management Incidents Cases User management Workflow
Volume III – Collector Builder User Guide This guide discusses:
Collector Builder Operation Collector Manager Collectors
Collector Host Management Building and maintaining Collectors
Volume IV - Sentinel User Reference Guide This guide discusses:
Collector scripting language Collector parsing commands Collector administrator functions Collector and Sentinel meta-tags
Sentinel correlation engine User Permissions Correlation command line options Sentinel database schema
Volume V - Sentinel 3rd Party Integration Guide Remedy HP OpenView Operations
HP Service Desk
Volume VI - Sentinel Patch Installation Guide Patching from Sentinel 4.x to 6.0 Patching from Sentinel 5.1.3 to 6.0
Feedback We want to hear your comments and suggestions about this manual and the other documentation included with this product. Use the User Comments feature at the bottom of each page of the online documentation and provide your comments there.
Additional Documentation The other manuals on this product are available at http://www.novell.com/documentation. The additional documentation available on Sentinel:
Sentinel Installation Guide Sentinel Patch Installation Guide Sentinel User Reference Guide
Documentation Conventions The following are the conventions used in this manual:
Notes and Warnings NOTE: Notes provide additional information that might be useful or for reference.
WARNING: Warnings provide additional information that helps you identify and stop performing actions in the system that cause damage or loss of data.
Commands appear in courier font. For example: useradd –g dba –d /export/home/oracle –m –s /bin/csh oracle
Go to Start > Program Files > Control Panel to perform this action: Multiple actions in a step.
References For more information, see “Section Name” (if in the same Chapter). For more information, see section, “Chapter Name” (if in the same Guide). For more information, see Section Name in Chapter Name, Name of the
Guide (if in a different Guide).

Other References The following manuals are available with the Sentinel install CDs.
Sentinel User Guide Sentinel Collector Builder User Guide Sentinel User Reference Guide Sentinel 3rd Party Integration Guide Release Notes
Contacting Novell Website: http://www.novell.com Novell Technical Support:
http://support.novell.com/phone.html?sourceidint=suplnav4_phonesup Self Support:
http://support.novell.com/support_options.html?sourceidint=suplnav_supportprog Patch Download Site: http://download.novell.com/index.jsp 24x7 support: http://www.novell.com/company/contact.html. For Collectors/Connectors/Reports/Correlation/Hotfixes/TIDS:
http://support.novell.com/products/sentinel.

Contents
1 Sentinel Control Center 1-1 About Sentinel Control Center 1-1
Active Views 1-1 Incidents 1-1 iTRAC 1-2 Analysis 1-2 Advisor 1-2 Admin 1-2 Correlation 1-3 Event Source Management 1-3
Log in to the Sentinel Control Center 1-4 Log in to the Sentinel Control Center 1-4 Introduction to the User Interface 1-5
Menu Bar 1-5 Toolbar 1-6 Tabs 1-6 Frames 1-7 Navigating through Sentinel Control Center 1-7 Changing the appearance of Sentinel Control Center 1-7 Saving User Preferences 1-8 Changing Password 1-9 Hostname updates 1-9
2 Active Views™ Tab 2-1 Understanding Active Views 2-1 Introduction to the User Interface 2-2 Reconfiguring Total Display Time 2-4 Viewing Real Time Events 2-5
To Reset Parameters and Chart Type of an Active View 2-6 Rotating a 3D Bar or Ribbon Chart 2-8
Showing and Hiding Event Details 2-8 Sending Messages about Events and Incidents by e-Mail 2-8 Creating Incidents 2-10 Viewing Events that Triggered Correlated Events 2-11 Investigating an Event or Events 2-11
Investigate – Graph Mapper 2-12 Investigate – Event Query 2-13 Historical Event Query 2-13 Active Browser 2-15
Viewing Advisor Data 2-17 Viewing Asset Data 2-18 Viewing Vulnerabilities 2-19 Ticketing System Integration 2-22 Using Custom Menu Options with Events 2-23 Managing Columns in a Snapshot or Visual Navigator Window 2-23 Taking a Snapshot of a Visual Navigator Window 2-24 Sorting Columns in a Snapshot 2-24 Closing a Snapshot or Visual Navigator 2-25 Adding Events to an Incident 2-25
3 Correlation Tab 3-1 Understanding Correlation 3-1
Contents 1
Technical Implementation 3-2 Introduction to the User Interface 3-3 Correlation Rules 3-3
Opening the Correlation Rule Manager 3-3 Creating a Rule Folder 3-4 Renaming a Rule Folder 3-4 Creating a Correlation Rule 3-4 Correlation Rule Types 3-5 Deploying/Undeploying Correlation Rules 3-12 Enabling/Disabling Rules 3-13 Renaming and Deleting a Correlation Rule 3-14 Moving a Correlation Rule 3-14 Importing a Correlation Rule 3-14 Exporting a Correlation Rule 3-15
Dynamic Lists 3-16 Adding a Dynamic List 3-16 Modifying a Dynamic List 3-17 Deleting a Dynamic List 3-17 Removing Dynamic List Elements 3-18 Using a Dynamic List in a Correlation Rule 3-18 Starting or Stopping Correlation Engine 3-19 Renaming Correlation Engine 3-19
Correlation Action Manager 3-19 Correlation Action Types 3-19 Correlation Action Administration 3-25 JavaScript Correlation Actions 3-26
4 Incidents Tab 4-1 Understanding an Incident 4-1 Introduction to User Interface 4-1
Incident View 4-2 Incident 4-2
Manage Incident Views 4-3 Adding a View 4-3 Modifying a View 4-6 Deleting a View 4-6 Default View 4-6
Manage Incidents 4-6 Creating Incidents 4-7 Viewing an Incident 4-7 Attaching Workflows to Incidents 4-8 Adding Notes to Incidents 4-8 Adding Attachments to Incidents 4-8 Configuring the Attachment Viewer 4-8 Modifying Incidents 4-9 Deleting Incidents 4-10 Emailing an Incident 4-10
Switch between existing Incident Views 4-10
5 iTRAC™ Workflows 5-1 Understanding iTRAC Workflows 5-1 Introduction to the User Interface 5-2 Template Manager 5-3
Default Templates 5-3 Template Builder Interface 5-4
Creating Templates 5-5 Managing Templates 5-6
Steps 5-7 Start Step 5-8
2 Sentinel User’s Guide

Manual Steps 5-8 Decision Steps 5-10 Mail Steps 5-11 Command Steps 5-11 Activity Steps 5-12 End Step 5-12 Adding Steps to a Workflow 5-12 Managing Steps 5-13
Transitions 5-16 Unconditional Transitions 5-17 Conditional Transitions 5-17 Else Transitions 5-21 Timeout Transitions 5-21 Alert Transitions 5-22 Error Transition 5-22 Managing Transitions 5-23
Activities 5-23 Incident Command Activity 5-24 Incident Internal Activity 5-24 Incident Composite Activity 5-24 Creating Activities 5-25 Managing Activities 5-28
Process Management 5-29 Instantiating a Process 5-30 Automatic Step Execution 5-30 Manual Step Execution 5-30 Display Status 5-30 Displaying Status of a Process 5-31 Changing Views in Process Manager 5-32 Starting or Terminating a Process 5-33
6 Work Items 6-1 Understanding Work Items 6-1
Work Item Summary 6-1 Processing a Work Item 6-4
Accepting a Work Item 6-4 Completing the Work Item 6-5
Manage Work Items Of Other Users 6-6
7 Analysis Tab 7-1 Understanding Analysis 7-1 Introduction to the User Interface 7-1
Top Ten Reports 7-2 Running a Report from Crystal Reports 7-4 Running an Event Query Report 7-4
Offline Query 7-5 Creating an Offline Query 7-5 Viewing, Exporting or Deleting an Offline Query 7-6
8 Advisor Usage and Maintenance 8-1 Understanding Advisor 8-1 Installing Advisor 8-2 Viewing Advisor Data 8-2
Viewing Advisor Data using Right-Click Menu Option 8-2 Running Advisor Reports 8-2
Maintaining Advisor 8-3 Updating Data in Advisor Tables 8-3 Resetting Advisor Password (Direct Download Only) 8-4 Changing the Advisor Email Configuration 8-5
Contents 3
Changing the Scheduled Data Update Time 8-5
9 Event Source Management 9-1 Understanding Event Source Management 9-1
Collector Workspace and Collector Directory 9-2 Introduction to the User Interface 9-2
Menu Bar 9-2 Tool Bar 9-3 Zoom 9-4 Frames 9-4
Plug-in Repository 9-8 Auxiliary Files 9-9
Live View 9-9 Graphical ESM View 9-9 Tabular ESM View 9-11 Right-click Menu 9-12
Components of Event Source Hierarchy 9-13 Component Status Indicators 9-14
Adding Components to Event Source Hierarchy 9-15 Collectors 9-15
Adding Connectors/Collector Plug-ins 9-15 Updating Connector/Collector Plugins 9-17 Deploying a Collector 9-20 Deploying a Connector 9-20 Deploying an Event Source 9-20 Deploying Event Source Servers 9-21 Connect to Event Source 9-22 Debugging Collectors 9-29 Debugging Using Raw Data 9-30
Export Configuration 9-31 Import Configuration 9-33
Enable/Disable Import Configuration 9-33 Save Preferences 9-35 Close 9-35 Reset Layout 9-35 Undo Layout 9-36 Redo Layout 9-36
Event Source Management Scratchpad 9-36 Comparison between Sentinel 5.x and Sentinel 6.0 9-36
10 Administration 10-1 Understanding Admin Tab 10-1 Introduction to User Interface 10-2 Archive Configuration Tab 10-3 Reporting Configuration Options for Analysis and Advisor Reports 10-4 Server Views 10-5
Monitoring a Process 10-6 Creating a Servers View 10-7 Starting, Stopping and Restarting Processes 10-7
Filters 10-7 Public Filters 10-8 Private Filters 10-8 Global Filters 10-8 Configuring Public and Private Filters 10-10
Configure Menu Options 10-12 Adding an Option to the Menu Configuration Menu 10-14 Cloning a Menu Configuration Option 10-15 Modifying a Menu Configuration Option 10-15 Viewing Menu Configuration Option Parameters 10-16
4 Sentinel User’s Guide

Activating or Deactivating a Menu Configuration Option 10-16 Rearranging Event Menu Options 10-16 Deleting a Menu Configuration Option 10-16 Editing Your Menu Configuration Browser Settings 10-16
DAS Statistics 10-17 Color Filter Configuration 10-19 Mapping 10-21
Adding Map Definitions 10-22 Adding a Number Range Map Definition 10-25 Editing Map Definitions 10-27 Deleting Map Definitions 10-28 Updating Map Data 10-29
Event Configuration 10-31 Event Mapping 10-31 Renaming Tags 10-35
Reporting Data 10-36 User Configurations 10-41
Oracle and Microsoft SQL 2005 Authentication: 10-41 Windows Authentication: 10-41 Opening the User Manager Window 10-41 Creating a User Account 10-41 Modifying a User Account 10-44 Viewing Details of a User Account 10-44 Cloning a User Account 10-44 Deleting a User Account 10-45 Terminating an Active Session 10-45 Adding an iTRAC Role 10-45 Deleting an iTRAC Role 10-45 Viewing Details of a Role 10-45
Solution Pack 10-45
11 Sentinel Data Manager 11-1 Understanding Sentinel Data Manager 11-1 Starting the SDM GUI 11-1
Partitions Tab 11-3 Tablespaces Tab 11-6 Partition Configuration 11-7
SDM Command Line 11-9
12 Utilities 12-1 Introduction to Sentinel Utilities 12-1 Starting and Stopping Sentinel Server 12-1
Starting a Sentinel Server 12-2 Stopping a Sentinel Server 12-2
Sentinel Scripts 12-2 Operational Scripts 12-2 Troubleshooting Scripts 12-4
Version Information 12-7 Executable Version Information 12-7 Sentinel .dll and .exe File Version Information 12-8 Sentinel .jar Version Information 12-8
Configuring Sentinel E-mail 12-9 Updating Your License Key 12-11
13 Quick Start 13-1 Security Analysts 13-1
Active Views Tab 13-1 Exploit Detection 13-2 Asset Data 13-3
Contents 5

Event Query 13-3 Creating Incidents 13-4 iTRAC 13-6
Instantiating a Process 13-6 Report Analyst 13-16
Analysis Tab 13-16 Administrators 13-18
Simple Correlation 13-18
14 Solution Packs 14-1 Solution Packs 14-1
Components of a Solution Pack 14-2 Permissions for Using Solution Packs 14-3
Solution Manager 14-4 Solution Manager Interface 14-4
Managing Solution Packs 14-6 Importing Solution Packs 14-6 Opening Solution Packs 14-8 Installing Content from Solution Packs 14-10 Implementing Controls 14-16 Testing Controls 14-17 Uninstalling Controls 14-17 Viewing Solution Pack Status 14-19 Deleting Solution Packs 14-21
Solution Designer 14-22 Solution Designer Interface 14-22 Connection Modes 14-23 Creating a Solution Pack 14-24 Managing Content Hierarchy Nodes 14-25 Adding Content to a Solution Pack 14-26 Documenting a Solution Pack 14-29 Editing a Solution Pack 14-30
Deploying an Edited Solution Pack 14-31
A Sentinel Architecture A-1 Sentinel Features A-1 Functional Architecture A-1 Architecture Overview A-1
iSCALE Platform A-2 Sentinel Event A-3 Event Source Management A-8 Application Integration A-8 Time A-8 System Events A-9 Processes A-10
Logical Architecture A-12 Collection and Enrichment Layer A-13 Business Logic Layer A-16
Presentation Layer A-23 Active Browser A-24
B System Events for Sentinel B-1 Authentication Events B-1
Authentication B-1 Creating Entry For External User B-1 Duplicate User Objects B-1 Failed Authentication B-1 Locked Account B-2
6 Sentinel User’s Guide

Locked User B-2 No Such User Event B-2 Too Many Active Users B-2 User Discovered B-2 User Logged In B-3 User Logged Out B-3
User Management B-3 Add Users To Role B-3 Create Role B-3 Create User B-4 Creating User Account B-4 Delete Role B-4 Deleting User Account B-4 Locking User Account B-4 Remove Users From Role B-4 Resetting Password B-5 Unlocking User Account B-5 Updating User B-5
Database Event Management B-5 Database Space Reached Specified Percent Threshold B-5 Database Space Reached Specified Time Threshold B-5 Database Space Very Low B-6 Database Stat B-6 Error inserting events B-6 Error Moving Completed File B-6 Error Processing Event Message B-7 Error Saving Failed Events B-7 Event Insertion is blocked B-7 Event Insertion is resumed B-7 Event Message Queue Overflow B-8 Event Processing Failed B-8 Low Space In The Database B-8 No Space In The Database B-8 Opening Archive File failed B-8 Partition Configuration B-9 Writing to Archive File failed B-9 Writing to the overflow partition (P_MAX) B-9
Database Aggregation B-9 Creating Summary B-9 Deleting Summary B-10 Disabling Summary B-10 Enabling Summary B-10 Error inserting summary data into the database B-10 Saving Summary B-10
Mapping Service B-11 Error B-11 Error initializing map with ID B-11 Error Refreshing Map B-11 Get File Size B-12 Loaded Large Map B-12 Long time To load Map B-12 Refreshing Map from Cache B-13 Refreshing Map from Server B-13 Save Data File B-13 Saved Data File B-13 Timed Out Waiting For Callback B-14 Timeout Refreshing Map B-14 Update B-14 Update B-14
Event Router B-15 Event Router B-15
Event Router is Initializing B-15
Contents 7

Event Router is Running B-15 Event Router is Stopping B-15 Event Router is Terminating B-15
Correlation Engine B-16 Correlation Action Definition B-16 Correlation Engine Configuration B-16 Correlation Engine is Running B-16 Correlation Engine is Stopped B-16 Correlation Rule B-16 Correlation Rule Configuration B-17 Deploy Rules With Actions To Engine B-17 Disabling Rule B-17 Enabling Rule B-17 Rename Correlation Engine B-17 Rule Deployment is Modified B-18 Rule Deployment is Started B-18 Rule Deployment is Stopped B-18 Starting Engine B-18 Stopping Engine B-18 UnDeploy All Rules From Engine B-19 UnDeploy Rule B-19 Update Correlation Rule Actions B-19
Event Source Management-General B-19 Collector Manager Initialized B-19 Collector Manager Is Down B-19 Collector Manager Started B-19 Collector Manager Stopped B-20 Collector Service Callback B-20 Cyclical Dependency B-20 Event Source Manager Callback B-20 Initializing Collector Manager B-20 Lost Contact With Collector Manager B-21 No Data Alert B-21 Persistent Process Died B-21 Persistent Process Restarted B-21 Port Start B-21 Port Stop B-22 Reestablished Contact With Collector Manager B-22 Restart Plugin Deployments B-22 Restarting Collector Manager (Cold Restart) B-22 Restarting Collector Manager (Warm Restart) B-22 Start Event Source Manager B-23 Starting Collector Manager B-23 Stop Event Source Manager B-23 Stopping Collector Manager B-23
Event Source Management-Event Sources B-24 Event Source Management-Collectors B-24 Event Source Management-Event Source Servers B-24 Event Source Management-Connectors B-25
Data Received After Timeout B-25 Data Timeout B-25 File Rotation B-25 Process Auto Restart Error B-26 Process Start Error B-26 Process Stop B-26 WMI Connector Status Message B-26
Active Views B-27 Active View Created B-27 Active View Joined B-27 Active View No Longer Permanent B-27 Active View Now Permanent B-27 Idle Active View Removed B-28
8 Sentinel User’s Guide
Contents 9
Idle Permanent Active View Removed B-28 Data Objects B-28
Activity Definition B-28 Configuration B-28 Viewing Configuration Store B-29 Write Data B-29
Activities B-29 Incidents and Workflows B-30 General B-33
Configuration Service B-33 Controlled Process is started B-33 Controlled Process is stopped B-33 Importing Auxiliary B-33 Importing Plugin B-34 Load Esec Taxonomy To XML B-34 Process Auto Restart Error B-34 Process Restarts B-34 Proxy Client Registration Service (medium) B-34 Restarting Process B-35 Restarting Processes B-35 Starting Process B-35 Starting Processes B-35 Stopping Process B-35 Stopping Processes B-36 Store Esec Taxonomy From XML B-36 Watchdog Process is started B-36 Watchdog Process is stopped B-36
Summary B-37

1 Sentinel Control Center
Topic Page
About Sentinel Control Center 1-1Log in to the Sentinel Control Center 1-4Introduction to the User Interface 1-5
About Sentinel Control Center Sentinel™ is a Security Information and Event Management solution that receives information from many sources throughout an enterprise, standardizes it, prioritizes it and presents it to you to make threat, risk and policy related decisions. The Sentinel Control Center (SCC) is the main user interface for viewing and interacting with this data.
Sentinel gathers and correlates security and non-security information from across an organization's networked infrastructure, as well as third-party systems, devices and applications. Sentinel presents the collected data in a more sensible GUI, identifies security or compliance issues, and tracks remediation activities, streamlining previously error-prone processes and building a more rigorous and secure management program.
The Sentinel Control Center includes the following functional tabs and interfaces:
“Active Views” “Incidents” “iTRAC” “Analysis” “Advisor” “Admin” “Correlation”
Active Views The Active Views tab presents events in near-real time.
In the Active Views tab, you can:
View events occurring in near real-time Investigate events Graph events Perform historical queries to collect data for a specified period Invoke right-click functions Initiate manual incidents and remediation workflows
Incidents An incident is a set of events that require attention (for example, a possible attack). Incidents centralize the data and typically comprise a correlated event, the associated events that triggered a correlation rule, asset details of the affected systems, vulnerability state of the affected systems and any remediation information, if known. Incidents can be associated with a remediation workflow in iTRAC, if specified. An incident associated to an iTRAC workflow allows users to track the remediation state of the incident.
Sentinel Control Center 1-1
In the Incidents Tab, you can:
Manage incident views View and manage incidents and their associated data Switch between existing incident views
iTRAC iTRAC’s stateful incident remediation workflow capability allows you to incorporate your organization’s incident response processes into Sentinel.
In the iTRAC tab, you can:
Create custom workflow templates Edit workflow templates Create custom activities Edit activities Associate activities with workflow steps Initiate and execute Processes
Analysis The Analysis tab is the historical reporting interface for Sentinel. Reports are published on a Web server and can be rendered in the analysis tab or in an external browser. You can also run and save an Offline Query for later quick retrieval of search results.
Advisor Advisor is an optional module that provides real-time correlation between detected IDS attacks and vulnerability scan output in order to immediately indicate increased risk to an organization.
Admin The Admin tab provides you access to perform the administrative actions and configuration settings in Sentinel.
In the Admin tab, can import and manage Sentinel content focused on regulatory compliance using Solution Packs. You can also configure:
Archive Reports Events Global Filters Color Filter Mapping Menus Filters Users Das Statistics Event File Info Reporting Data
With Server View Manager you can monitor (Stop/Start/Restart) the processes that Sentinel holds.
1-2 Sentinel User Guide

Correlation The Correlation tab provides an interface to create and deploy rules to detect suspicious or malicious patterns of events.
In the Correlation tab, you can:
Create and edit rules Deploy/Undeploy rules Add an action and associate it to a rule Configure dynamic lists
Event Source Management The Event Source Management (ESM) interface is available through the Sentinel Control Center menu. It allows you to manage and monitor connections between Sentinel and its event sources using Sentinel Connectors and Sentinel Collectors.
In the ESM, you can:
Import/export Connectors and Collectors from/to the centralized repository available in ESM
Add/edit connections to event sources through the configuration wizards View the real-time status of the connections to event sources Monitor data flowing through the Collectors and Connector
Sentinel Collectors The Collectors parse the data and deliver a richer event stream by injecting taxonomy, exploit detection and business relevance into the data stream before events are correlated and analyzed and sent to the database.
Sentinel Connectors The Connectors use industry standard methods to connect to the data source to get raw data.
Sentinel Control Center 1-3
Log in to the Sentinel Control Center To Start the Sentinel Control Center on Windows:
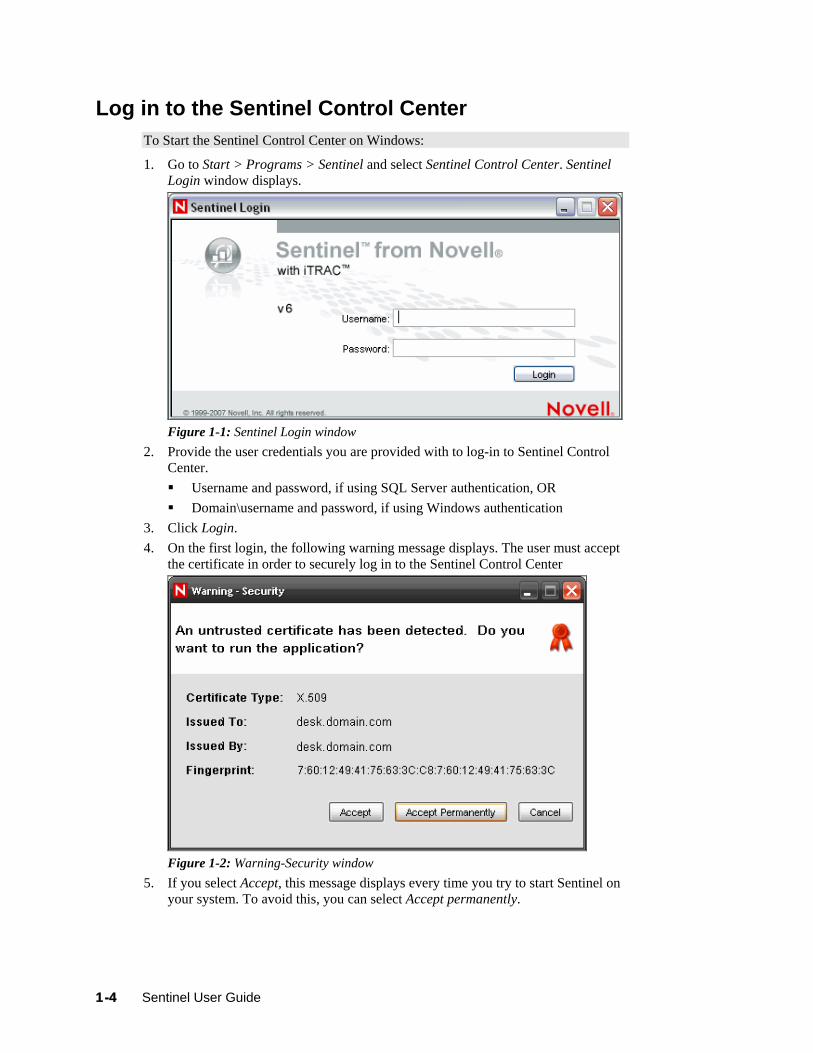
1. Go to Start > Programs > Sentinel and select Sentinel Control Center. Sentinel Login window displays.
Figure 1-1: Sentinel Login window
2. Provide the user credentials you are provided with to log-in to Sentinel Control Center. Username and password, if using SQL Server authentication, OR Domain\username and password, if using Windows authentication
3. Click Login. 4. On the first login, the following warning message displays. The user must accept
the certificate in order to securely log in to the Sentinel Control Center
Figure 1-2: Warning-Security window
5. If you select Accept, this message displays every time you try to start Sentinel on your system. To avoid this, you can select Accept permanently.
1-4 Sentinel User Guide

To Start the Sentinel Control Center on Linux and Solaris:
1. As the Sentinel Administrator User (esecadm), change directory to:
$ESEC_HOME/bin
2. Run the following command:
control_center.sh
3. Provide your username and password and click OK. 4. A Certificate window displays, if you select Accept, this message displays every
time you try to start Sentinel on your system. To avoid this, you can select Accept permanently.
Introduction to the User Interface In the Sentinel Control Center user interface, you can perform the activities through the following components:
“Menu Bar” “Toolbar” “Tabs” “Frames”
Sentinel Control Center provides you the “dockable” framework, which allows you to move the Toolbars, Tabs or Frames from their default location to user-specific locations for ease-of-use.
Figure 1-3: Sentinel Control Center
Menu Bar The menu bar has the menus required to Navigate, perform activities and change the appearance of Sentinel Control Center.
Figure 1-4: Menu Bar
The File, Options, Event Source Management, Windows and Help menus are always available. The availability of other menus depends on your location in the console and permissions.
Sentinel Control Center 1-5

Toolbar The Tool Bar allows you to perform the Tab specific functions. There are four system-wide toolbar buttons that are always displayed. These toolbar buttons are View Sentinel Help, Cascade All Display Windows, Tile All Display Windows and Save User Preferences. The availability of other toolbar buttons depends on your location in the console and permissions.
System-Wide Toolbar The system-wide toolbar buttons are:
Figure 1-5: System-Wide Toolbar
Tab Specific Toolbar buttons Tab-specific toolbar buttons allows you to perform the functions related to each tab.
Active Views
Correlation
Incidents
iTRAC
Analysis
Admin
Table 1-1: Tab Specific Toolbar Buttons
For more information on Tabs-specific toolbar buttons, see the sections on each of the Tabs mentioned in the list above.
Tabs Depending on your access permissions, Sentinel Control Center displays the following tabs.
1-6 Sentinel User Guide

Active Views™ Correlation Incidents iTRAC™ Analysis Advisor Admin
For more information about Tabs, see the sections on each tab.
Frames Sentinel provides a dock-able framework which allows you to drag frames on the screen to place them in user preferred locations. In a frame the following buttons displays, which allow you to drag/hide frames.
Toggle Floating Toggle Auto-hide
Figure 1-6: Navigator Frame
To drag a frame to any location:
1. Click Toggle Floating icon on the Frame or hold the frame and drag it to the desired location.
To hide a frame:
1. Click Toggle Auto-hide icon.
NOTE: You can undo dragging or reset to default position using the toolbar buttons.
Navigating through Sentinel Control Center To navigate using Toolbar:
1. Click the tab you need to work on. 2. Click toolbar buttons to perform the actions.
To navigate using Menu bar:
1. Click the tab menu in the Menu bar. 2. Select an action you need to perform.
NOTE: This procedure is generic for all the tabs in Sentinel Control Center. Navigation specific procedures for tabs are discussed in the relevant sections.
Changing the appearance of Sentinel Control Center You can change the Sentinel Control Center’s look by:
Sentinel Control Center 1-7

“Setting the Tab Position” “Cascading Windows” “Tiling Windows” “Minimizing and Restoring Windows” “Closing all open Windows” “Docking or Floating a frame” “Showing or Hiding a frame”
Setting the Tab Position
To set the tab position:
1. Click Options > Tab Placement. 2. Select either Top or Bottom.
Cascading Windows
To cascade windows:
1. Click Windows > Cascade All. All open windows in the right panel cascade.
Tiling Windows
To Tile Windows:
1. Click Windows > Tile All. 2. Select from the following to meet your requirement:
Tile Best Fit Tile Vertical Tile Horizontal
Minimizing and Restoring Windows
To minimize all windows:
1. Click Windows > Minimize All. All open windows in the right panel minimize.
To restore windows to original size:
1. Click Windows > Restore All. All open windows in the right panel restores to their original size.
NOTE: Use the Minimize and Restore options provided on the top-right corner of the tab to minimize individual tabs.
Closing all open Windows
To close all windows:
1. Click Windows > Close All.
Saving User Preferences If the user has permissions to save their workspace, they can save the following preferences:
Permanent windows that are not dependent on data that was available at the time of their original creation.
Active Views Summary displays
1-8 Sentinel User Guide

Window positions Window sizes, including the application window Tab positions Navigator docked or floating and showing or hidden
The following preferences are not saved when the user logs out:
Snapshots Historical event queries Secondary windows opened from one of the primary windows in the Admin Navigator Column widths in Active Views
To save your preferences:
1. Click File > Save Preferences or click .
Changing Password To change your Sentinel Control Center password:
1. Click Options > Change Password. 2. Provide the old password. 3. Provide the new password and matching confirm password. 4. Click OK.
NOTE: For more information on password security, see Setting Passwords in Best Practices section in Sentinel Installation Guide.
Hostname updates If the hostname of a system is changed, you might need to perform some of the following actions on the system depending on the Sentinel components installed on it.
IMPORTANT:
Stop Sentinel Service before you perform these actions.
You might need to update all the machines (which have components affected by the hostname change) before you restart Sentinel service on any machine.
Scenario 1: Change in Sentinel Database Hostname In this scenario, the affected components are DAS and SDM. So you might need to
Update the DAS Update SDM
The configuration file enables DAS to connect to the database. So, you need to update the configuration files to update DAS.
To update DAS:
1. Login to the machine where DAS is installed as esecadm (on UNIX), or as an administrator (on Windows).
2. Stop the Sentinel Services running on the machine. 3. Go to ESEC_HOME\bin:
On Unix, type the command cd $ESEC_HOME/bin
Sentinel Control Center 1-9

On Windows, type the command cd /d %ESEC_HOME%\bin 4. Update DAS configuration files on Unix and Windows using the following
commands. On Unix, execute ./dbconfig -a ../config -h <new DB hostname>. On Windows, execute .\dbconfig -a ..\config -h <new DB hostname>.
You require the Database Hostname to login to SDM. To login to SDM, you might need to update the Database Hostname in SDM login window.
To Update SDM
1. Open Sentinel Data Manager. 2. In the login window, provide details of the Database, new hostname and other
required details. 3. Click Connect.
Scenario 2: Change in Sentinel Communication Server Hostname In this scenario, the affected components are Communication Server, DAS, Correlation Engine, Sentinel Collector Manager and Sentinel Control Center. So you might need to
Update the Communication Server Update DAS, Correlation Engine, Sentinel Collector Manager, Sentinel Control
Center
You might need to re-install the Communication Server to update the Hostname change.
To re-install Communication Server:
1. Login as root (Unix) or administrator (Windows) on the system where the Communication Server is installed.
2. Run Sentinel Uninstaller. In the Select components to Uninstall window, select Communication Server and deselect all other options. Follow instructions in Uninstalling Sentinel in Sentinel Installation Guide as required and complete uninstallation.
3. Click Finish. 4. Insert (and mount, on Solaris/Linux only) the Sentinel Installer CD. 5. Run the setup file. In the Select components to Install window, select
Communication Server only. Follow the instructions in Installing Sentinel 6.0 in Sentinel Installation Guide as required and complete installation.
6. Reboot the system.
The configuration file that connects the Communication Server and Sentinel processes needs to be updated. You might need to perform the steps given below on all machines with DAS, Correlation Engine, Collector Manager, and Sentinel Control Center installed.
To update DAS, Correlation Engine, Collector Manager, and Sentinel Control Center:
1. Go to ESEC_HOME/config/ and edit configuration.xml. 2. Replace the four occurrences of the Communications Server Hostname with the
new Hostname. 3. Save and exit the configuration.xml file.
IMPORTANT:
1-10 Sentinel User Guide

Sentinel Control Center 1-11
After the steps mentioned above are performed, restart the Sentinel Services for the changes to take affect.
2 Active Views™ Tab
Topic Page
Understanding Active Views 2-1Introduction to the User Interface 2-2Reconfiguring Total Display Time 2-4Viewing Real Time Events 2-5Showing and Hiding Event Details 2-8Sending Messages about Events and Incidents by e-Mail 2-8Creating Incidents 2-10Viewing Events that Triggered Correlated Events 2-11Investigating an Event or Events 2-11Viewing Advisor Data 2-17Viewing Asset Data 2-18Viewing Vulnerabilities 2-19Ticketing System Integration 2-22Using Custom Menu Options with Events 2-23Managing Columns in a Snapshot or Visual Navigator Window 2-23Taking a Snapshot of a Visual Navigator Window 2-24Sorting Columns in a Snapshot 2-24Closing a Snapshot or Visual Navigator 2-25Adding Events to an Incident 2-25
Understanding Active Views The Active Views tab presents events in near-real time. In the Active Views tab, you can:
View events occurring in near real time Investigate events Graph Events Perform Historical Statistical Analysis Invoke right-click functions Initiate manual incidents and remediation workflows
An event represents a normalized log record reported to Sentinel from a third party security, network, or application device or from an internal Sentinel source. There are several types of events:
External Events (event received from a security device), such as: An attack detected by an Intrusion Detection System (IDS) A successful login reported by an operating system A customer-defined situation such as a user accessing a file
Internal Events (an event generated by Sentinel), including: A correlation rule being disabled Database filling up
You can monitor the events in a tabular form or using several different types of charts, you can perform queries for recent events.
Active Views™ Tab 2-1

NOTE: Access to these features can be enabled or disabled for each user. For more information, see Sentinel Database Users, Roles and Access Permissions in Sentinel User Reference Guide.
Introduction to the User Interface In Active Views, you can see Create Active View and Event Query. You can navigate to these functions from:
a. The Active View menu in the Menu Bar
b. When you create a filter, The Active View menu has these additional options.
c. The Navigation Tree in the Navigation Pane
d. The Toolbar Buttons
Table 2-1: Active View-User Interface
2-2 Sentinel User Guide

Active Views provides two types of views which display the events in Tables and Graphs.
Table Format displays the variables of the events as columns in a table. You can sort the information in the grid by clicking on the column name.
Figure 2-1: Active View-Tabular Format
Graphical Format displays events as Graphs. You can change the chart types to display other chart types.
Figure 2-2: Active View-Graphical Format
A near Real Time Event Table with graphical presentation and Snapshot are the two types of Active Views.
Near Real Time Event Table: Holds up to 750 events per 30-second period. If there are more than 750
events, the events are displayed in the following priority order: correlated events, events that are sent to the GUI only using a global filter, and all remaining events.
By default, the client maintains a 24-hour period of cached events. This is configurable through “Active View Properties”.
By default, the smallest possible display interval of an active view is 30 seconds. This is represented by a gray line in the event table.
Figure 2-3: Gray Line- Smallest Possible Display Interval
In the event when there are more than 750 per 30-second time period, a red separation line displays indicating that there are more events than what is displayed.
Figure 2-4: Red Line- More Events then Displayed
Active Views™ Tab 2-3

On saving user preferences, system continues to collect data for 4 days. For instance, if you save your preferences, log out and log back in the following day, your Active View displays data as if you never logged off.
If an Active View is created and not saved, it will continue to collect data for an hour. Within that hour time frame if an identical Active View is created, the Active View displays data for the last hour.
Snapshot: Time-stamped views of a Real Time Event View table.
The following is what makes an Active View unique.
Filter assigned to an Active View The z-axis attribute The security filter assigned to a user
The Active Views Tab allows you to:
“Reconfigure Total Display Time” “Add Events to an incident” “Close a Snapshot or Visual
Navigator Window” “Create an Incident” “Custom Menu Options with Events” “Investigate Event Query" “Investigate Graph Map” “View Advisor Data” “Manage Columns”
“Send messages about Events by e-mail”
“Show or Hide Event Details” “Snapshot of a Visual Navigator
Window” “View Events that triggered a correlated
event” “View Vulnerability Visualization” “View Asset Data” “Ticketing System Integration”
You can change values (column names) to display logical names and populate them throughout the system. You can apply attributes to the event stream that are relevant to your business. For more information, see Sentinel Data Manager section and the Sentinel Collector Builder User Guide.
Reconfiguring Total Display Time Active View Properties allows you to configure the cached time in each client. The default cache time value in an Active View is 24 hours.
To configure Maximum Total Display Time:
1. Click the Active Views tab. 2. Click Active Views > Properties. 3. Make your changes. Click OK.
Figure 2-5: Active View Properties window
NOTE: The new values will not take effect until you restart the Sentinel Control Center.
2-4 Sentinel User Guide

Viewing Real Time Events To View Real Time Events:
1. Click the Active Views tab. 2. Click Active Views > Create Active View or click Create Active View icon.
. 3. In the Event Visualization Wizard window, click the down arrows to select your
Event Attribute (Z Axis), Filter and to Display Events (Yes or No).
NOTE: In the Filter Selection window you can build your own filter or select one of the already built filters. Selecting the All filter allows all events to display in your window. When creating an Active View, if the filter assigned to the Active View is changed or deleted after creation of the Active View, the Active View is unaffected.
Figure 2-6: Active View Wizard After making your selection, you can click Next or Finish. If you select Finish, the following default values are selected: Display Interval and Refresh rate of 30 seconds Total Display Time of 15 minutes Y-axis as Event Count Chart type: Stacked Bar 2D
4. If you click Next, click the down arrows to select your: Display Interval and Refresh rate:
Display Interval is the Time interval to display events. Refresh Rate is the rate at which Active Views should refresh.
Total Display Time: Amount of time to display the chart Y-axis: Either total Event Count or Event Count per Second
Active Views™ Tab 2-5

Click Next. 5. Select your chart type from the drop-down list and click Finish.
Chart type: Stacked Bar 2D, Bar 3D, Line and Ribbon Your graph looks similar to:
Figure 2-7: Active View-Real Time Events The five buttons to the left of the chart perform the following functions:
Lock/Unlock the Chart: Used when performing a drill-down, zoom in,
zoom out, zoom to selection and saving a chart as an html file.
Increase Display Interval: Increases the display time interval for
incoming events
Decrease Display Interval: Decreases the display time interval for
incoming events
Increase Display Time: Increase the time interval along the x-axis
Decrease Display Time: Decreases the time interval along the x-axis
Table 2-2: Active View Chart Buttons When you click the Lock button, additional available buttons are:
Lock/Unlock the Chart: Used when performing a drill-down, zoom in,
zoom out, zoom to selection and saving a chart as an html file.
Zoom In: Zooms in without changing any of the time settings of the
chart
Zoom Out: Zooms out without changing any of the time settings of the
chart
Zoom to Selection: Zooms in on a selection of time intervals of events.
Snapshot Active View: Save as an html file with chart as images and
events in a tabular format. Table 2-3: Additional Active View Chart Buttons
To Reset Parameters and Chart Type of an Active View When viewing an Active View, you can reset your chart parameters, change your chart type.
2-6 Sentinel User Guide

To Reset Parameters and Chart Type of an Active View:
1. Within an Active View displaying a chart, right-click and select Properties.
Figure 2-8: Active Views Properties-Parameters Under the Parameters tab, you can set: Display Interval: Time between each interval Refresh Rate: Number of seconds for event rate to be updated Total Display Time: Amount of time to display the chart Y-axis: Either total Event Count or Event Count per Second
Under the Chart Types tab, you can set your chart to Stacked Bar2D, Bar 3D, Line or Ribbon.
Figure 2-9: Active Views Properties-Chart Types
Active Views™ Tab 2-7

Rotating a 3D Bar or Ribbon Chart To rotate a 3D bar or ribbon chart:
1. Click anywhere on the chart and hold the mouse button. 2. Reposition the chart as desired by moving the mouse and holding the button.
Showing and Hiding Event Details To show event details:
1. In a Real Time Event Table of the Visual Navigator or Snapshot, double-click or right-click an event and click Show Details. An event details displays in the left panel of the Real Time Event Table.
Figure 2-10: Show Details
To hide an event detail:
1. In an Real Time Event Table of the Visual Navigator or Snapshot, with event details displayed in the left panel, right-click an event and click Show Details. The Event Details window closes.
Sending Messages about Events and Incidents by e-Mail
Ability to send emails is set in the execution.properties file during installation. This file can be edited after installation. This file is located:
For Windows: %ESEC_HOME%\config
For UNIX:
$ESEC_HOME/config
For more information on configuring email, see the section Configuring Sentinel email in Utilities section.
2-8 Sentinel User Guide

To send an event message by e-mail:
1. In a Real Time Event Table of the Visual Navigator or Snapshot, select an event or a group of events, right-click and select Email.
Figure 2-11: Email Events window
2. Provide the following information: Email Address Email Subject Email Message
3. Click OK.
To e-mail an Incident:
1. After you save your incident, click the Incidents tab, Incidents > Incidents View. 2. Click All Incidents option in the Switch View drop down list located at the bottom
right corner. 3. Double-click an Incident. 4. Click Email Incident.
. 5. Provide the following information:
Email Address Email Subject Email Message
6. Click OK. The e-mail messages have html attachments that address incident details, events, assets, vulnerabilities, advisor information, attachment information, Incident Notes and incident history.
Active Views™ Tab 2-9
Creating Incidents NOTE: To perform this function you must have user permission to create Incident(s).
This is useful in grouping a set of events together as a whole representing something of interest (group of similar events or set of different events that indicate a pattern of interest such an attack).
NOTE: If events are not initially displayed in a newly created Incident, it is most likely because of a lag in the time between display in the Real Time Events window and insertion into the database. If this occurs, it will take a few minutes for the original events to finally be inserted into the database and display in the incident.
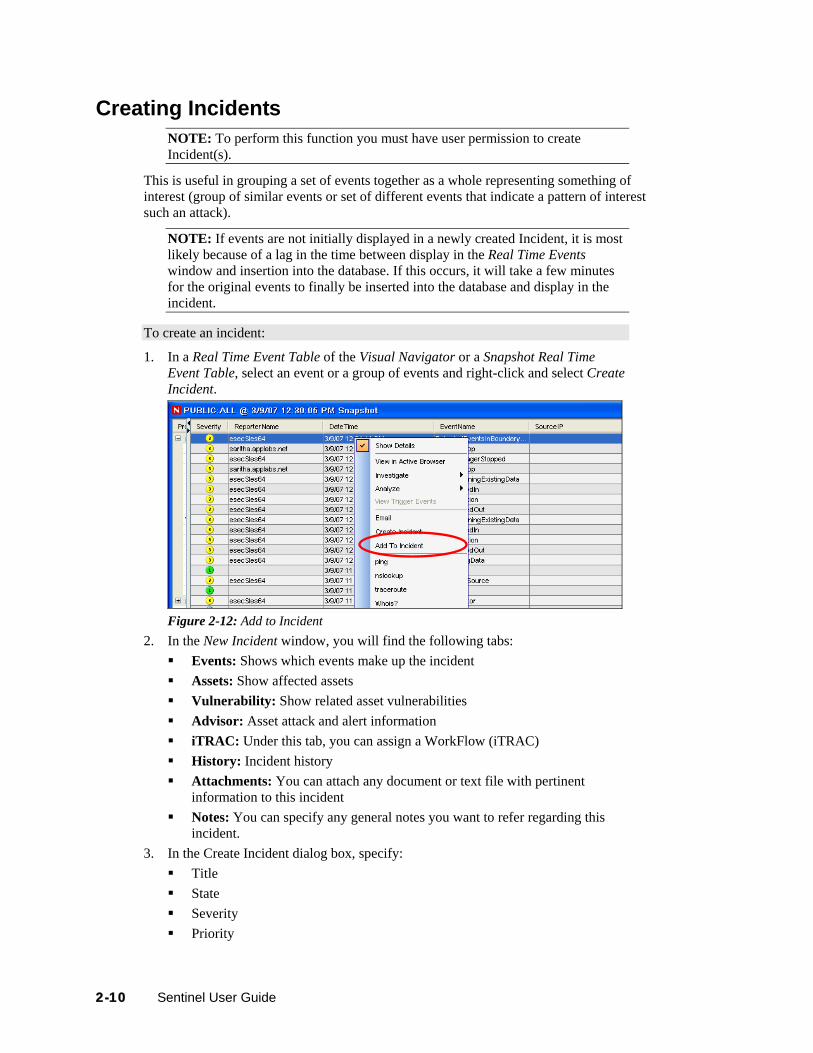
To create an incident:
1. In a Real Time Event Table of the Visual Navigator or a Snapshot Real Time Event Table, select an event or a group of events and right-click and select Create Incident.
Figure 2-12: Add to Incident
2. In the New Incident window, you will find the following tabs: Events: Shows which events make up the incident Assets: Show affected assets Vulnerability: Show related asset vulnerabilities Advisor: Asset attack and alert information iTRAC: Under this tab, you can assign a WorkFlow (iTRAC) History: Incident history Attachments: You can attach any document or text file with pertinent
information to this incident Notes: You can specify any general notes you want to refer regarding this
incident. 3. In the Create Incident dialog box, specify:
Title State Severity Priority
2-10 Sentinel User Guide

Category Responsible Description Resolution
4. Click Create. The incident is added under the Incidents tab of the Sentinel Control Center.
Viewing Events that Triggered Correlated Events You must right-click a correlated event in order to view the events that triggered the correlated event. In the event table from which you are selecting the event, look in the summary display panel on the right for an event that has a property of SensorType with a Value of C (C: correlated event).
To view events that triggered a correlated event:
1. In a Real Time Event Table of the Visual Navigator or Snapshot, or an Event Query table, right-click a correlated event and select View Trigger Events. A window opens showing the events that triggered the rule and the name of the Correlation Rule.
Figure 2-13: Viewing Correlated Events
Investigating an Event or Events This function allows you to:
Perform a Event Query for the last hour on a single event for: Destination IP addresses Source IP addresses Event Name
NOTE: You cannot perform a query on a null (empty) field.
Graphically display the source fields (IP, port, event, sensor type, Collector) mapped to the destination fields (IP, port, event, sensor type, Collector name) of the selected events.
Below is an illustration of source IP addresses mapped to destination IP addresses.
Active Views™ Tab 2-11

Figure 2-14: Graph Mapper
Investigate – Graph Mapper To create a graph map:
1. In Real Time Event Table right-click an event or events and select Investigate>Show Graph.
Figure 2-15: Creating a Graph Map
2. You must specify the From and To IPs and click Finish. The Graph Mapper window displays. The following is a graphic depiction of Sensor Name to Event Name of severity 5 in an organic format. You can view a graphic mapping in the following formats: Circular Hierarchical
Organic Orthogonal
2-12 Sentinel User Guide

Figure 2-16: Graph Mapper
Investigate – Event Query This function allows you to perform Event Query within the last hour.
To perform an Event Query using the Investigate function:
1. In a Visual Navigator or Snapshot window, right-click an event>Investigate> <select one of three options below>
Option Function Show More Events to this target Destination IP address Show More Events to this source Source IP address What are the target objects of this event? Event Name
Table 2-4: Options available in Visual Navigator
Historical Event Query You can query the database for the past events through Historical Event Query. The events can be queried according to the filter and severity criteria in required batch size. You can export the results in HTML or CSV file format.
To query events in Historical Event Query window:
1. In the Active Views tab, select Active Views > Event Query. Historical Event Query window displays. You can also open Historical Event Query window by clicking Historical Query Icon on the toolbar. Click Filter.
Active Views™ Tab 2-13
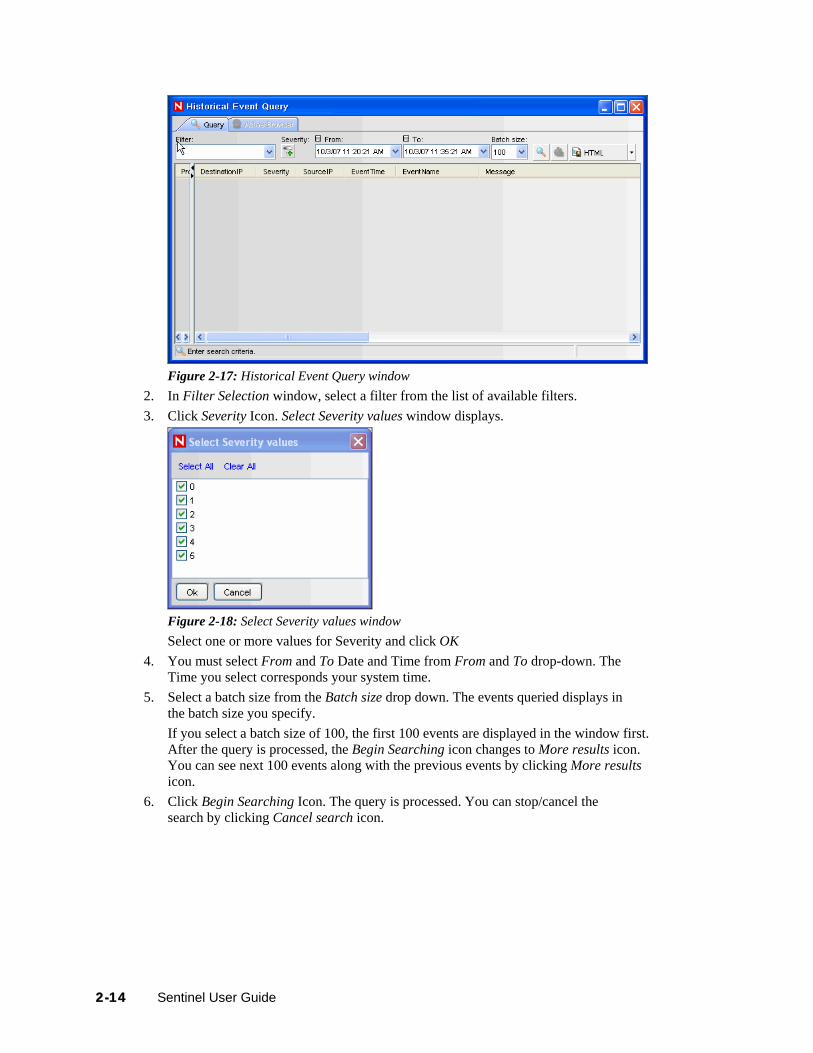
Figure 2-17: Historical Event Query window
2. In Filter Selection window, select a filter from the list of available filters. 3. Click Severity Icon. Select Severity values window displays.
Figure 2-18: Select Severity values window Select one or more values for Severity and click OK
4. You must select From and To Date and Time from From and To drop-down. The Time you select corresponds your system time.
5. Select a batch size from the Batch size drop down. The events queried displays in the batch size you specify. If you select a batch size of 100, the first 100 events are displayed in the window first. After the query is processed, the Begin Searching icon changes to More results icon. You can see next 100 events along with the previous events by clicking More results icon.
6. Click Begin Searching Icon. The query is processed. You can stop/cancel the search by clicking Cancel search icon.
2-14 Sentinel User Guide

Figure 2-19: Historical Query window-Processed Query
TIP:
Select HTML or CSV from the drop-down list to export query results.
Active Browser You can view the selected events in the Active Views in Active Browser. You can perform all the right-click activities that are available in Active Views in Active Browser too. When you open the Active Browser using Analysis > Offline Query and click Browse against a specific offline query, the events table is displayed only when the number of events are less than or equal to1000.
The events are grouped according to the metatags. In these metatags various sub-categories are defined. The numbers in the parentheses against these sub-categories displays the total number of event counts corresponding to the value of the metatag.
To view events in Active Browser:
1. In the Active Views tab, highlight the event/s you want to view in Active Browser. 2. Right-click event/s and select View in Active Browser. The selected event/s
displays in the Active Browser window. Or
1. In the Active Views tab, select Active Views > Event Query. Historical Event Query window displays.
2. In the Historical EventQuery window, run a Query and click Active Browser tab. The selected Query displays in the Active Browser window.
NOTE: The Active Browser tab will be enabled only if the Query results in at least one event displays.
To view events in Active Browser in Analysis tab:
1. In the Analysis tab, highlight the Query you want to view in Active Browser. 2. Click Browse. The selected Query result displays in the Active Browser window.
Active Views™ Tab 2-15

Figure 2-20: Active Browser window
To search in Active Browser:
1. Specify the value or text you want to search for in the Search field 2. Press Enter or click the Search icon against the search field to search.
NOTE: You can move between the various searches by using the Forward and Backward button above the search field.
To add attributes in Active Browser:
1. Click Add an attribute for categorization icon as shown below:
Figure 2-21: Add an attribute categorization icon
2. Select an attribute in the Add an attribute for categorization window that displays.
2-16 Sentinel User Guide
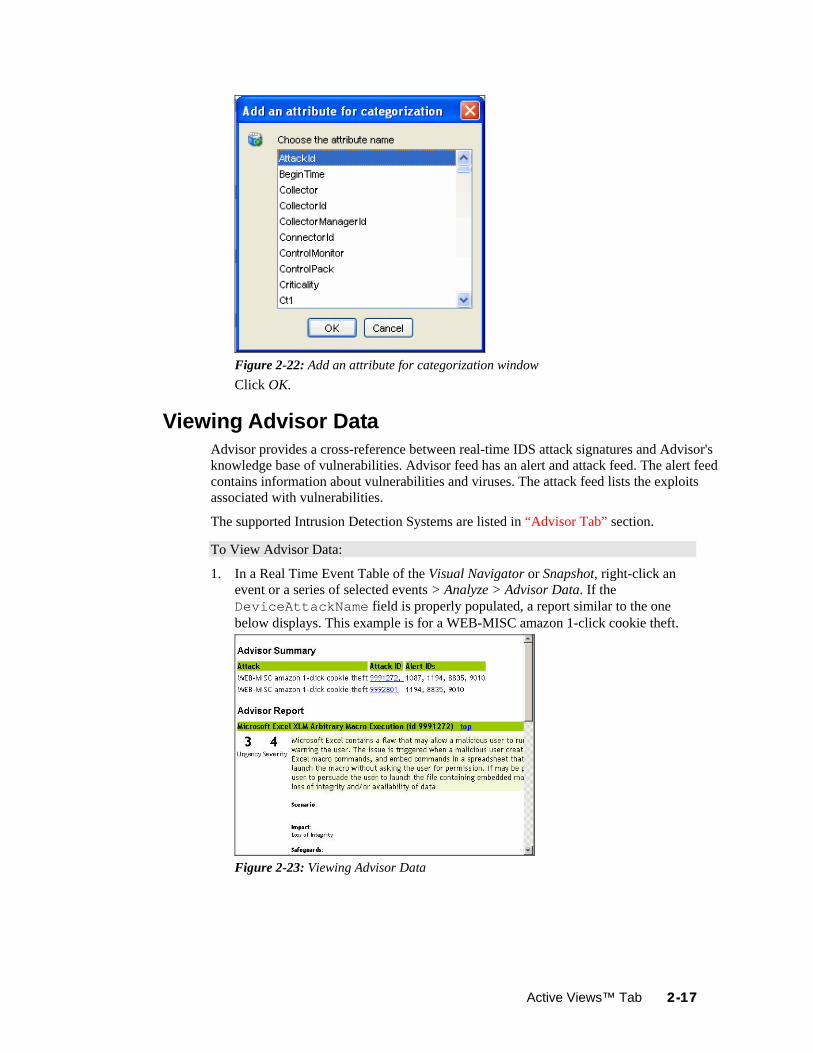
Figure 2-22: Add an attribute for categorization window Click OK.
Viewing Advisor Data Advisor provides a cross-reference between real-time IDS attack signatures and Advisor's knowledge base of vulnerabilities. Advisor feed has an alert and attack feed. The alert feed contains information about vulnerabilities and viruses. The attack feed lists the exploits associated with vulnerabilities.
The supported Intrusion Detection Systems are listed in “Advisor Tab” section.
To View Advisor Data:
1. In a Real Time Event Table of the Visual Navigator or Snapshot, right-click an event or a series of selected events > Analyze > Advisor Data. If the DeviceAttackName field is properly populated, a report similar to the one below displays. This example is for a WEB-MISC amazon 1-click cookie theft.
Figure 2-23: Viewing Advisor Data
Active Views™ Tab 2-17

Viewing Asset Data This function allows you to view and save your view as an HTML file of your Asset Report. You must run your asset management Collector to view this data. The available data for viewing are:
Hardware MAC Address Name Type Vendor Product Version
Value Criticality Sensitivity Environment Location
Network IP Address Hostname
Software Name Type Vendor
Product Version
Contacts Order Name Role
Email Phone Number
Location Room Rack
Address
Table 2-5: Available Data
To view Asset Data:
1. In a Real Time Event Table of the Visual Navigator or Snapshot window, right-click an event or events>Analyze>Asset Data. Window similar to the one below displays.
Figure 2-24: Viewing Asset Data
2-18 Sentinel User Guide

Viewing Vulnerabilities Vulnerability Visualization provides a textual or graphical representation of the vulnerabilities of selected destination systems. Vulnerabilities for the selected destination IPs can be seen for the current time or for the time of the selected events.
Vulnerability Visualization requires that a vulnerability Collector is running and adding vulnerability scan information to the Sentinel database. The Novell Web site (http://support.novell.com/products/sentinel/collectors.html) provides Collectors for several industry-standard vulnerability scanners, and additional vulnerability Collectors can be written using Collector Builder.
NOTE: Vulnerability Collectors are distinct from Event Collectors and use different commands.
There are several Vulnerability Visualization views:
HTML Graphical
Circular Organic Hierarchical Orthogonal
The HTML view is a report view that lists relevant fields, depending on which vulnerability scanner you have:
IP Host Vulnerability Port/protocol
Figure 2-25: Viewing Vulnerability
The graphical display is a rendering of vulnerabilities that link them to an event through common ports. Below are the examples of the four available views:
Active Views™ Tab 2-19

Figure 2-26: Organic View
Figure 2-27: Hierarchical View
2-20 Sentinel User Guide

Figure 2-28: Circular View
Figure 2-29: Orthogonal View
In the graphical display there are four panels. They are:
Graph panel Tree panel Control panel Details/events panel
The graph panel display associates vulnerabilities to a port/protocol combination of a resource (IP address). For example, if a resource has five unique port/protocol combinations that are vulnerable, there are five nodes attached to that resource. The resources are grouped together under the scanner that scanned the resources and reported the vulnerabilities. If two different scanners are used (ISS and Nessus), there are two independent scanner nodes that will have vulnerabilities associated with them.
NOTE: Event mapping takes place only between the selected events and the vulnerability data returned.
The tree panel organizes data in same hierarchy as the graph. The tree panel also allows users to hide/show nodes at any level in the hierarchy.
The control panel exposes all the functionality available in the display. This includes:
Four different algorithms to display
Active Views™ Tab 2-21

Ability to show all or selected nodes which have events mapped to them Zooming in and out of selected areas of the graph
There are two tabs in the Details/Events panel. When in the Details tab, clicking on a node results in displaying node details. When in the Events tab, clicking on an event associated with a node the node displays in tabular form as in a Real Time or Event Query window.
To run a Vulnerability Visualization:
1. In an Real Time Event Table of the Visual Navigator or Snapshot, right-click an event or a series of selected events and click: Analysis:
Current Vulnerability: Queries the database for vulnerabilities that are active (effective) at the current date and time.
Event Time Vulnerability: Queries the database for vulnerabilities that were active (effective) at the date and time of the selected event.
Figure 2-30: Vulnerability Visualization
2. At the bottom the vulnerability results window, click either: Event to Vulnerability Graph Vulnerability Report
3. (For Event to Vulnerability Graph) Within the display, you can: move nodes and their labels use one of four different layout algorithms to display the graph show all nodes or only those nodes that have events mapped to them in-line tree filtering in the event that a large number of resources are returned
as vulnerable zoom in and out of selected areas
Ticketing System Integration Novell provides optional integration modules for HP Service Desk or BMC Remedy that allows you to send events from any display screen to one of these external ticketing systems.
You can also send incidents and their associated information (asset data, vulnerability data, or attached files) to Service Desk or Remedy. Updates in Service Desk and Remedy
2-22 Sentinel User Guide

will then be sent back to the Sentinel Control Center so Sentinel users know when the issue’s status changes.
For more information about sending incidents and events to an external ticketing system, see the 3rd Party Integration Guide.
NOTE: The permission to create Service Desk or Remedy incidents is controlled by the administrator on a user-by-user basis.
Using Custom Menu Options with Events To use a custom menu option with an event:
1. In an existing Real Time Event Table of the Visual Navigator or Snapshot, right-click an event and select a menu option. The default custom menu options are as follows: ping nslookup tracert Whois?
You can further assign user permission to View Vulnerability and to perform HP Actions. You can add options using the Menu Configuration window that’s available in the Admin tab.
Figure 2-31: Customizing Menu Options
Managing Columns in a Snapshot or Visual Navigator Window
To select and arrange columns in a Snapshot or Visual Navigator:
1. With a Snapshot or Visual Navigator window open, click Active View > Event Real Time > Manage Columns or click the Manage Columns of Real Time Event Table.
2. Use the Add and Remove buttons to move column titles between the Available
Columns list and the Show these columns in this order list. The Insert button can
Active Views™ Tab 2-23

be used to insert an available column item into a specific location. For example, in the illustration below clicking Insert will place AttackId above DateTime.
Figure 2-32: Managing Columns Use the Up and Down arrow buttons to arrange the order of the columns as you want them to display in the Real Time Event Table. The top to bottom order of column titles in the Manage Column dialog box determines the left to right order of the columns in the Real Time Event Table.
3. In the Manage Column dialog box, click OK. 4. If you want your columns to display the next time you open the Sentinel Control
Center, click File > Save Preferences or click Save User Preference icon
.
Taking a Snapshot of a Visual Navigator Window To perform this function you must have user permission Snapshot.
This is useful to study events of interest because the Visual Navigator refreshes automatically and the alert or alerts of interest will scroll off the screen. Also, within a snapshot, you can sort by column.
To take a snapshot of a Real Time Event Table:
1. With a Visual Navigator window open, click Active View > Event Real Time > Snapshot or click Snapshot Event Real Time Table icon
. A Snapshot window opens and is added to the Snap Shots folder list under Active Views in the Navigator. The graphical display will not be part of the snapshot.
Sorting Columns in a Snapshot To sort columns in a Snapshot:
1. Click any column header once to sort by ascending value and twice to sort by descending value.
2-24 Sentinel User Guide

Closing a Snapshot or Visual Navigator To close a Snapshot or a Real Time Event Table:
1. With a Snapshot or Visual Navigator open, close by using the Close button (upper right corner in Windows or upper right corner in Windows/SUSE Linux/Red Hat Linux or upper left corner in Solaris).
NOTE: The view or snapshot will not redisplay when you close and reopen the Sentinel Control Center.
Adding Events to an Incident To perform this function you must have user permissions to Modify Incident(s) and Add to existing Incident(s).
To add events to an incident:
1. In a Real Time Event Table or a Snapshot, select an event or a group of events and right-click. Click Add To Incident.
2. In the Add Events To Incident dialog box, click Browse to list the available incidents.
Figure 2-33: Adding Events to Incident
3. Select Incident window displays. Click Search to view a list of incidents. List of incidents of selected criteria displays.
NOTE: You can define your criteria to better search for a particular incident or incidents in Select Incident window.
Active Views™ Tab 2-25

Figure 2-34: Select Incident window
4. Highlight an incident and click Add. 5. Click OK. The event or events selected are added to the incident in the Incidents
Navigator.
NOTE: If events are not initially displayed in a newly created Incident, it is most likely because of a lag in the time between display in the Real Time Events window and insertion into the database. If this occurs, it will take a few minutes for the original events to finally be inserted into the database and display in the incident.
2-26 Sentinel User Guide

3 Correlation Tab
Topic Page
Understanding Correlation 3-1Introduction to the User Interface 3-3Dynamic Lists 3-16
3-19Correlation Action Manager
Understanding Correlation Sometimes, an event viewed in the system might not necessarily draw your attention. But, when you correlate a set of similar or comparable events in a given period, it might lead you to an alarming event. Sentinel helps you correlate such events with the rules you create and deploy in the Correlation engine and take appropriate action to mitigate any alarming situation.
Correlation adds intelligence to security event management by automating analysis of the incoming event stream to find patterns of interest. Correlation allows you to define rules that identify critical threats and complex attack patterns so that you can prioritize events and initiate effective incident management and response. Starting with Sentinel 6.0, the correlation engine is built with a pluggable framework, which allows the addition of new correlation engines in the future.
Correlation rules define a pattern of events that should trigger, or fire, a rule. Using either the correlation rule wizard or the simple RuleLG language, you can create rules that range from simple to extremely complex, for example:
High severity event from a finance server High severity event from any server brought online in the past 10 days Five failed logins in 2 minutes Five failed logins in 2 minutes to the same server from the same username Intrusion detection event targeting a server, followed by an attempted login to root
originating from that same server within 60 seconds
Two or more of these rules can be combined into one composite rule. The rule definition determines the conditions under which the composite rule fires:
All subrules must fire A specified number of subrules must fire The subrules must fire in a particular sequence
After the rule is defined, it should be deployed to an active Correlation Engine, and one or more actions can be associated with it. After the rule is deployed, the Correlation Engine processes events from the real-time event stream to determine whether they should trigger any of the active rules to fire.
NOTE: Events that are sent directly to the database or dropped by a Global Filter is not processed by the Correlation Engine.
When a rule fires, a correlated event is sent to the Sentinel Control Center, where it can be viewed in the Active Views window.
Correlation Tab 3-1

Figure 3-1: Active View window
The correlated event can also trigger actions, such as sending an email with the correlated event’s details or creating an incident associated with an iTRAC workflow.
Technical Implementation All correlation is done in-memory on the machine (or machines) that host the correlation engine. This model allows fast, distributed processing that does not contend with database operations such as inserting events into the database.
For environments with large numbers of correlation rules or extremely high event rates, it might be advantageous to install more than one correlation engine and redeploy some rules to the new correlation engine. The ability to deploy multiple correlation engines provides the ability to scale as the Sentinel system incorporates additional data sources or as event rates increase.
Sentinel’s correlation is near real-time and depends on the timestamp for the individual events. To synchronize time, you can use an NTP (Network Time Protocol) server to synchronize the time on all devices on your network, or you can rely on the time on the Collector Manager servers and synchronize only those few machines.
Correlation relies on the data that is collected, parsed, and normalized by the Collectors, so a working understanding of the data is necessary to write rules. Many Novell correlation rules rely on an event taxonomy that ensures that a “failed login” and an “unsuccessful logon” from two devices are classified the same.
In the Correlation tab, you can:
Create/Modify Correlation rules and rule folders Deploy Correlation rules on Correlation Engine Create and associate an action to a role
3-2 Sentinel User Guide

Configure Dynamic lists
NOTE: Access to the correlation functions can be enabled by the administrator on a user-by-user basis.
Introduction to the User Interface In Correlation, you can see the Correlation Rule Manager, Correlation Engine Manager, Correlation Action Manager and Dynamic Lists.
You can navigate to these functions from:
The Correlation menu in the Menu Bar
The Navigation Tree in the Navigation Pane
The Toolbar Buttons
Table 3-1: Correlation-User Interface
Correlation Rules Correlation Rules are created, modified, renamed, deployed/undeployed in the Correlation Rule Manager. Correlation Rules are organized into Rule Folders, which can also be managed in the Correlation Rule Manager.
NOTE: There is no limit to the number of users that can access Correlation Rules. When more than one user is editing the same rule, the last person to save overwrites all previous saves.
Opening the Correlation Rule Manager To open the Correlation Rules Manager:
1. Click Correlation tab. 2. In the navigator, click Correlation Rules Manager. Alternatively, click
Correlation Rules Manager button in the Tool Bar. The Correlation Rule Manager window displays.
Correlation Tab 3-3

Figure 3-2: Correlation Rule Manager window
Creating a Rule Folder To create a Rule Folder:
1. Open the Correlation Rules Manager window and click Manage Folder. 2. Highlight and right-click a folder and select Add Folder. 3. Specify Rule Folder name.
Renaming a Rule Folder To rename a Rule Folder:
1. Open the Correlation Rules Manager window and click Manage Folder. 2. Select a folder and click Rename. Change the name of the folder.
To delete a Rule Folder:
1. Open the Correlation Rules Manager window and click Manage Folder. 2. Select a folder and click Delete. Click Yes when the system asks for confirmation.
Creating a Correlation Rule To create a Correlation Rule:
1. Open the Correlation Rules Manager window and select a folder from the Folder drop-down list to which this rule is added.
2. Click Add button located on the top left corner of the screen. 3. The Rule Wizard displays. Select one of the following rule types and follow the
steps for that particular rule type: Simple Composite Aggregate Sequence Custom/Freeform
4. Define the update criteria for the rule. If you select Continue to perform actions every time this rule fires, the rule fires every time the criteria is met. If you select Do not perform actions every time this rule fires for the next (t) time the events fires only once as per user-defined time period. All the other events that match the correlation rule within the specified time are grouped together with this correlated event. This user-defined time period can be a certain number of seconds, minutes, or hours.
5. Click Next. 6. Provide the rule name. The syntax of the rule is checked at the time it is created.
3-4 Sentinel User Guide

7. Under Namespace, select a correlation rule folder in which to store the rule. 8. Type the description of the rule. 9. Click Next. The rule is created and displays in the Correlation Rules Manager
window. 10. Select Yes if you want to create another rule or No if you do not want to create
another rule. Click Next.
The rule types and the steps to create them are described below.
Correlation Rule Types Correlation rules can be defined in the Correlation Rule wizard by walking through the wizard or by choosing the Custom/Freeform option to write the rule in the proprietary RuleLG language. All rule definitions are stored in the database in RuleLG.
Correlation rules can be defined based on any populated event field.
NOTE: When creating a Rule, you can add a dynamic list to it. For more information, see “Associating Dynamic List with Correlation Rule”.
Simple Rule A simple rule is defined by specifying which events can trigger the rule to fire (For example, firewall events, firewall events of severity 3 or higher). The filter criteria can be intersected (using the “all”option in the GUI or the “AND” operator in RuleLG) or the filter criteria can be unioned (using the “any” option in the GUI or the “OR” operator in RuleLG).
For example, a rule might be defined so that it fires anytime an event takes place on a server that is on the critical list. Another rule might be defined to fire anytime an event of severity 4 or greater takes place on a server that is on the critical list.
A simple rule requires only one event in order to fire.
NOTE: For users familiar with the correlation rule language (RuleLG), the defining operator for a simple rule is the “filter” operator. For more information about RuleLG, see the Sentinel Correlation Engine RuleLG Language in Sentinel User Reference Guide.
NOTE: In Sentinel 6, filter criteria must be defined in the correlation rule wizard. You cannot use existing public filters.
To create a simple rule:
1. Open the Correlation Rules Manager window and select a folder from the drop-down list to which this rule is added.
2. Click Add button located on the top left corner of the screen. The Correlation Rule window displays. Select Simple Rule.
Correlation Tab 3-5

Figure 3-3: Correlation Rule-Simple Rule window
3. In the Simple Rule window, define a condition for this rule. Select the Property and Operator values from the drop-down lists and specify data in value field.
Figure 3-4: Correlation Rule-Simple Rule window
4. Click Add to add additional definitions for this rule. 5. You can preview the rule in the RuleLG preview window. For example,
filter(e.sev=3). Click Next. The Update Criteria window displays.
3-6 Sentinel User Guide

Figure 3-5: Correlation Rule-Update Criteria window
6. Enable the update criteria for the rule to fire and click Next. The General Description window displays.
Figure 3-6: Correlation Rule-General Description window
7. Provide a name to this rule. You have an option to modify the rule folder. 8. Provide rule description and click Next. 9. You have an option to create another rule from this wizard. Select your option
and click Next.
Aggregate Rule An aggregate rule is defined by specifying a subrule and the number of times the subrule must fire within a specific time window in order to trigger the aggregate rule. For example, an aggregate rule might require that a subrule fire 10 times within 5 minutes for the aggregate rule to fire.
Aggregate rules have an optional group by field, which can be any populated field from the events. For example, an aggregate rule might require that a subrule fire 10 times within 5 minutes where each of the 10 events has the same destination server.
NOTE: For users familiar with the correlation rule language (RuleLG), the defining operator for an aggregate rule is the “trigger” operator. The trigger clause might also use the “discriminator” operator to define the group by field. For more information about RuleLG, see the Sentinel Correlation Engine RuleLG Language in Sentinel User Reference Guide.
To create an aggregate rule:
1. Open the Correlation Rules Manager window and select a folder from the drop-down list to which this rule is added.
Correlation Tab 3-7

2. Click Add button located on the top left corner of the screen. The Correlation Rule window displays. Select Aggregate Rule.
Figure 3-7: Correlation Rule-Aggregate Rule window
3. In Aggregate Rule window, you can select a sub-rule to create an aggregate rule. To select a sub-rule, click Add Rule button. Add Rule window displays.
Figure 3-8: Add Rule window
NOTE: You can select only one sub-rule when creating an aggregate rule.
4. Select a rule and click OK. 5. Set parameters for the rule to fire. 6. To group event tags according to the attributes, Click Add/Edit. The Attribute List
window displays.
3-8 Sentinel User Guide
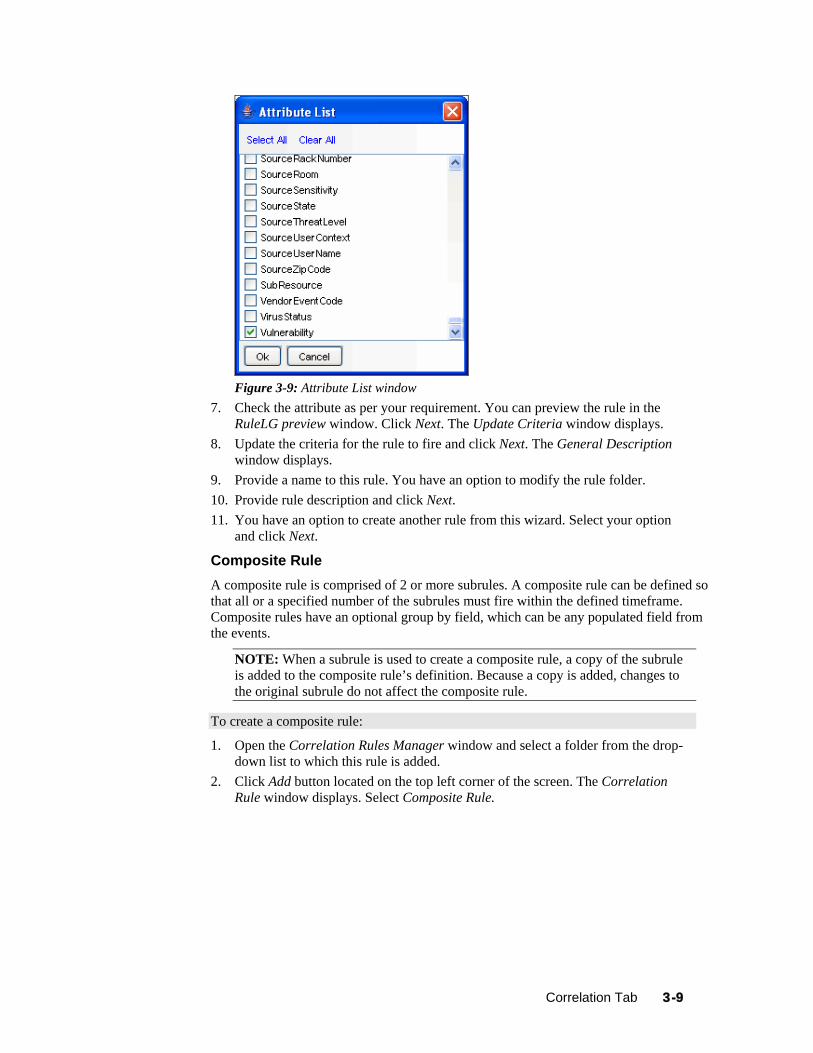
Figure 3-9: Attribute List window
7. Check the attribute as per your requirement. You can preview the rule in the RuleLG preview window. Click Next. The Update Criteria window displays.
8. Update the criteria for the rule to fire and click Next. The General Description window displays.
9. Provide a name to this rule. You have an option to modify the rule folder. 10. Provide rule description and click Next. 11. You have an option to create another rule from this wizard. Select your option
and click Next.
Composite Rule A composite rule is comprised of 2 or more subrules. A composite rule can be defined so that all or a specified number of the subrules must fire within the defined timeframe. Composite rules have an optional group by field, which can be any populated field from the events.
NOTE: When a subrule is used to create a composite rule, a copy of the subrule is added to the composite rule’s definition. Because a copy is added, changes to the original subrule do not affect the composite rule.
To create a composite rule:
1. Open the Correlation Rules Manager window and select a folder from the drop-down list to which this rule is added.
2. Click Add button located on the top left corner of the screen. The Correlation Rule window displays. Select Composite Rule.
Correlation Tab 3-9

Figure 3-10: Correlation Rule-Composite Rule window
3. In Composite Rule window, you can select sub-rules to create a composite rule. To select a sub-rule, click Add Rule button. Add Rule window displays.
4. Select a rule or a set of rules (hold control on your keyboard to select a set of rules) and click OK.
5. Set parameters for the rule to fire. 6. To group event tags according to the attributes, Click Add/Edit. The Attribute
window displays. 7. Check the attribute as per your requirement. You can preview the rule in RuleLg
preview box. Click Next, the Update Criteria window displays. 8. Update criteria for the rule to fire and click Next. 9. Provide a name to this rule. You have an option to modify the rule folder. 10. Provide rule description and click Next. 11. You have an option to create another rule from this wizard. Select your option
and click Next.
Sequence A sequence rule is comprised of 2 or more subrules that must have been triggered in a specific order within the defined timeframe. Sequence rules have an optional group by field, which can be any populated field from the events.
NOTE: When a subrule is used to create a sequence rule, a copy of the subrule is added to the sequence rule’s definition. Because a copy is added, changes to the original subrule do not affect the sequence rule.
To create a sequence rule:
1. Open the Correlation Rules Manager window and select a folder from the Folder drop-down list to which this rule is added.
2. Click Add button located on the top left corner of the screen. The Correlation Rule window displays. Select Sequence Rule.
3-10 Sentinel User Guide

Figure 3-11: Correlation Rule-Sequence Rule window
3. In Sequence Rule window, you can select a sub-rule to create a sequence rule. To select a sub-rule, click Add Rule button. Add Rule window displays.
4. Select a rule and click OK. 5. Set parameters for the rule to fire. To group event tags according to the attributes,
Click Add/Edit. The Attribute List window displays. 6. Check the attribute as per your requirement. You can preview the rule in RuleLg
preview box. Click Next, the Update Criteria window displays. 7. Update criteria for the rule to fire and click Next. 8. Provide a name to this rule. You have an option to modify the rule folder. 9. Provide rule description and click Next. 10. You have an option to create another rule from this wizard. Select your option
and click Next.
Custom or Freeform Correlation Rules The custom or freeform rule option is the most powerful option for creating a correlation rule. This allows the user to create any of the previous types of rules by typing the RuleLG correlation rule language directly into the Correlation Rule Wizard.
TIP:
You can select the Functions, Operators and Meta-Tags from the drop-down list selection. Specify e. or w. in the Correlation Rule section to view the drop-down lists.
To create a custom or freeform rule:
1. Open the Correlation Rules Manager window and select a folder from the Folder drop-down list to which this rule is added.
2. Click the Add button located on the top left corner of the screen. The Correlation Rule window displays. Select Custom/Freeform Rule.
Correlation Tab 3-11

Figure 3-12: Correlation Rule-Custom/Freeform Rule window
3. In the Custom/Freeform Rule window, write the condition for the rule and click Validate to test the validity of the rule.
4. After validation of the rule, click Next, the Update Criteria window displays. Update the criteria for the rule to fire and click Next.
5. Provide a name to this rule. You have an option to modify the rule folder. 6. Provide rule description and click Next. 7. You have an option to create another rule from this wizard. Select your option
and click Next.
Deploying/Undeploying Correlation Rules Correlation rules can be deployed or undeployed from the Correlation Engine Manager or the Correlation Rule Manager. You can undeploy all rules or a single rule.
To deploy Correlation Rules (in Correlation Engine Manager):
1. Open the Correlation Engine Manager window. 2. Highlight and right-click the engine you want to deploy the rule on and select
Deploy Rules. 3. In the Rules tab, check the rules you want to deploy.
Figure 3-13: Select Rule window
NOTE: By default, rules deployed are in enabled state.
4. In the Actions tab, check the action you want to associate with the rule and click Deploy.
3-12 Sentinel User Guide

To deploy Correlation Rules (in Correlation Rule Manager):
1. Open the Correlation Rule Manager window. 2. Highlight a rule and click Deploy rules link. The Deploy Rule window displays.
Figure 3-14: Deploy Rule window
3. In the Deploy Rule window, select the Engine to deploy the rule from the drop-down list.
4. [Optional] Select an action or add a new action. If nothing is selected, a Correlated Event with default values is created.
5. Click OK.
To Undeploy a Single Rule:
1. In the Correlation Engine Manager, right-click the rule and select Undeploy Rule. 2. Alternatively, in the Correlation Rule Manager, highlight the rule and click
Undeploy rule link.
To Undeploy All Correlation Rules:
1. Open the Correlation Engine Manager window. 2. Right-click the Correlation Engine and select Undeploy All Rules.
Enabling/Disabling Rules To Enable/Disable Rule:
1. Open the Correlation Engine Manager window. 2. Highlight and right-click the rule or set of rules and select Enable Rule or Disable
Rule.
Figure 3-15: Selecting Enable Rule or Disable Rule
Correlation Tab 3-13
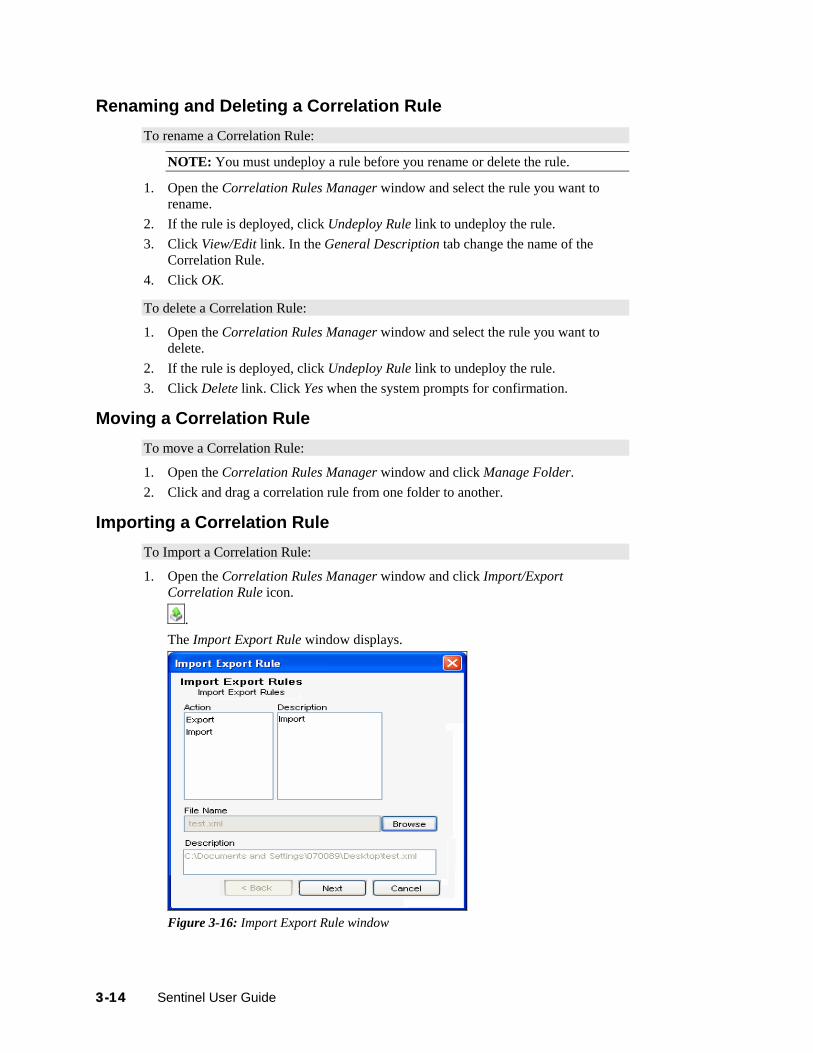
Renaming and Deleting a Correlation Rule To rename a Correlation Rule:
NOTE: You must undeploy a rule before you rename or delete the rule.
1. Open the Correlation Rules Manager window and select the rule you want to rename.
2. If the rule is deployed, click Undeploy Rule link to undeploy the rule. 3. Click View/Edit link. In the General Description tab change the name of the
Correlation Rule. 4. Click OK.
To delete a Correlation Rule:
1. Open the Correlation Rules Manager window and select the rule you want to delete.
2. If the rule is deployed, click Undeploy Rule link to undeploy the rule. 3. Click Delete link. Click Yes when the system prompts for confirmation.
Moving a Correlation Rule To move a Correlation Rule:
1. Open the Correlation Rules Manager window and click Manage Folder. 2. Click and drag a correlation rule from one folder to another.
Importing a Correlation Rule To Import a Correlation Rule:
1. Open the Correlation Rules Manager window and click Import/Export Correlation Rule icon.
. The Import Export Rule window displays.
Figure 3-16: Import Export Rule window
3-14 Sentinel User Guide

2. Select the Import option from the Action pane. The Description in the Description pane changes to Import.
3. Click Browse to select the Correlation Rule you want to import. Select the file and click Import. Click Next. The Import Rule window displays.
Figure 3-17: Import Rule window
4. Select the folder you want to import the Correlation rule into. Click Finish.
NOTE: When importing a correlation rule in a folder, if the correlation rule with the same name exists, the system displays a message and does not import the file.
IMPORTANT:
If you import a correlation rule using the inlist operator, the dynamic list aligned to that rule must exist or you must create the dynamic list with the same name on the system to it is imported.
Exporting a Correlation Rule To Export a Correlation Rule:
1. Open the Correlation Rules Manager window and click Import/Export Correlation Rule icon. The Import Export Rule window displays.
2. Select the Export option from the Action pane. The Description in the Description pane changes to Export.
3. Click Browse to export the rule. Specify a file name and click Export. Click Next. The Export Rule window displays.
Figure 3-18: Export Rule window
Correlation Tab 3-15

4. Select the Correlation Rule you want to export. Click Finish.
Dynamic Lists Dynamic Lists are distributed list structures that can be used to store string elements, such as IP addresses, server names, or usernames. The lists are then used within a correlation rule for a quick lookup to see whether an incoming event includes an element from the Dynamic List. Some examples of Dynamic Lists include:
Terminated user lists Suspicious user watchlist Privileged user watchlist Authorized ports and services list Authorized server list
A Dynamic List can be built using the text values for any event metatag. Elements can be added to the list manually (by an administrator) or automatically whenever a correlation rule fires. Elements can be removed from a list if manually (by an administrator), automatically whenever a correlation rule fires, when their time limit expires, or when the maximum list size is reached.
IMPORTANT:
The Time To Live (TTL) must be between 60 seconds and 90 days and the maximum list size is 100,000.
Regardless of how the values were added, they can be Persistent (active until manually removed or until the maximum list size is reached) or Transient (active only for a specified timeframe after being added to the list, also known as the Time to Live). The Time to Live can range from 60 seconds to 90 days.
NOTE: If the Time to Live period is updated on an active Dynamic List, the change is not retroactive to elements already on the list. Elements that are already added to the dynamic list retains their original Time to Live.
Adding a Dynamic List To add Dynamic Lists:
1. Click Correlation on the Menu Bar and select Dynamic Lists. Alternatively, you can click Dynamic Lists button on the Tool Bar.
2. Click Add button located on the top left corner of the screen. Dynamic List Properties window displays.
3. Provide the Name of the List.
NOTE: The name cannot contain special characters, such as quotations or hyphens.
3-16 Sentinel User Guide

Figure 3-19: Dynamic List Properties window
4. Click Add. The Add Element window displays:
Figure 3-20: Add Element window
5. Provide name of the Element. To make the Element persistent, check Make Persistent Check box and Click OK.
NOTE: To make an existing element persistent, select the checkbox before the element name in the Dynamic Properties window.
6. Select Transient elements life span. It specify the time the persistent values are active in the list
7. Specify the Maximum Number of Elements. The number defined here limits the number of elements in the list.
8. Click OK.
NOTE: Select a filter type from Quick Filter drop-down list and specify the name of the element, to filter the available elements.
Modifying a Dynamic List To edit a Dynamic List:
1. Click Correlation on the Menu Bar and select Dynamic Lists. Alternatively, you can click Dynamic Lists button on the Tool Bar.
2. Select a Dynamic List and click View/Edit link. 3. The Dynamic List Properties window displays. Edit the options as required and
click OK.
Deleting a Dynamic List WARNING:
Correlation Tab 3-17

Do not delete a Dynamic List that is part of a correlation rule or rules.
To delete a Dynamic List:
1. Click Correlation on the Menu Bar and select Dynamic Lists. Alternatively, you can click the Dynamic Lists button on the Tool Bar.
2. Select a Dynamic List and click Delete link against it. Confirmation message alert displays.
3. Click Yes to delete.
Removing Dynamic List Elements There are several ways an element can be removed from a Dynamic List.
A user can remove it manually The element can be removed by a correlation rule action The Transient elements life span can expire If the maximum number of elements for a Dynamic List is reached, elements are
removed from the list to keep the list at or below the maximum list size. The transient elements are removed (from oldest to newest) before any persistent elements are removed.
Using a Dynamic List in a Correlation Rule Dynamic Lists can be referenced in a Correlation Rule by using the Custom/Freeform option of the Correlation Rule Wizard. For example:
filter(e.<tagname> inlist <Dynamic List Name>)
where
e.<tagname> represents a metatag in the incoming event, such as e.shn (Source Host Name) or e.dip (Destination IP address)
<Dynamic List Name> is the name of an existing Dynamic List, such as CriticalServerList
The following instructions assume that a Dynamic List already exists.
To add a Dynamic List to correlation rule:
1. Open the Correlation Rules Manager window and select a folder from the drop-down list to which this rule is added.
2. Click Add button located on the top left corner of the screen. The Correlation Rule window displays. Select Custom/Freeform Rule.
3. In the Custom/Freeform Rule window, write the condition for the rule including the name of the dynamic list. For example, filter(e.sev inlist Severity) where Severity is the dynamic list name.
4. Click Validate to test the validity of the rule. 5. After validation of the rule, click Next, the Update Criteria window displays. 6. Update the criteria for the rule to fire and click Next. 7. Provide a name to this rule. You have an option to modify the rule folder. 8. Provide rule description and click Next.
3-18 Sentinel User Guide
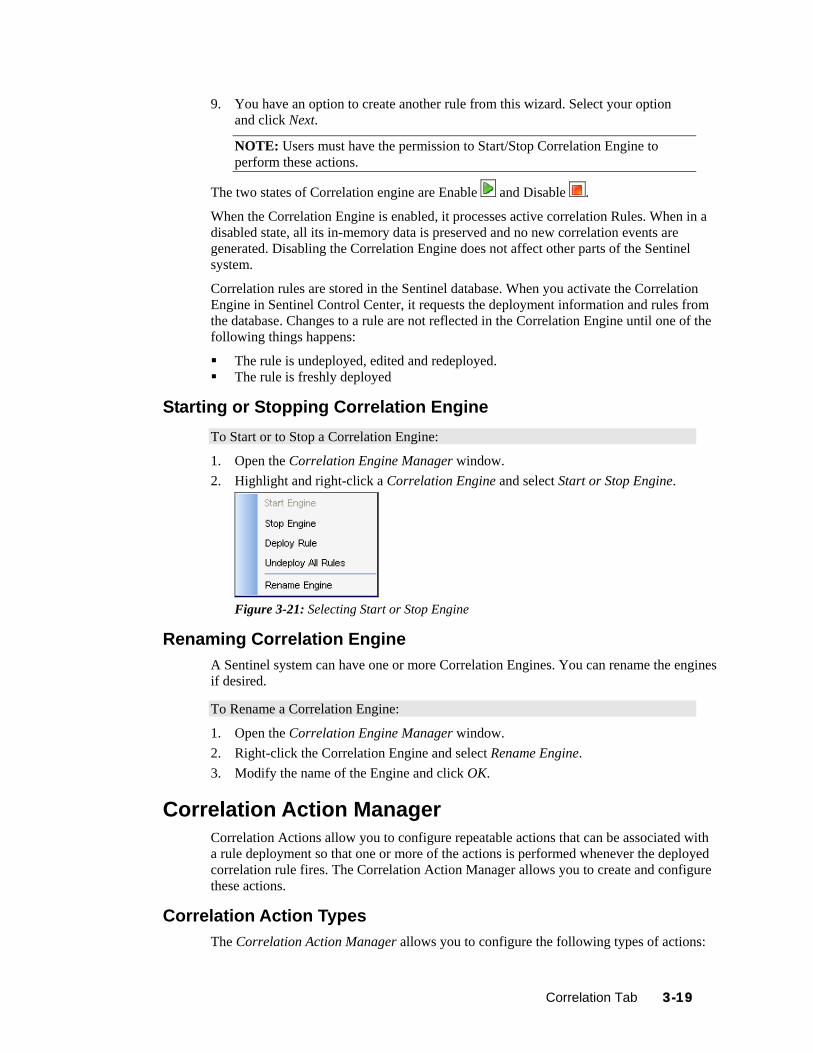
9. You have an option to create another rule from this wizard. Select your option and click Next.
NOTE: Users must have the permission to Start/Stop Correlation Engine to perform these actions.
The two states of Correlation engine are Enable and Disable .
When the Correlation Engine is enabled, it processes active correlation Rules. When in a disabled state, all its in-memory data is preserved and no new correlation events are generated. Disabling the Correlation Engine does not affect other parts of the Sentinel system.
Correlation rules are stored in the Sentinel database. When you activate the Correlation Engine in Sentinel Control Center, it requests the deployment information and rules from the database. Changes to a rule are not reflected in the Correlation Engine until one of the following things happens:
The rule is undeployed, edited and redeployed. The rule is freshly deployed
Starting or Stopping Correlation Engine To Start or to Stop a Correlation Engine:
1. Open the Correlation Engine Manager window. 2. Highlight and right-click a Correlation Engine and select Start or Stop Engine.
Figure 3-21: Selecting Start or Stop Engine
Renaming Correlation Engine A Sentinel system can have one or more Correlation Engines. You can rename the engines if desired.
To Rename a Correlation Engine:
1. Open the Correlation Engine Manager window. 2. Right-click the Correlation Engine and select Rename Engine. 3. Modify the name of the Engine and click OK.
Correlation Action Manager Correlation Actions allow you to configure repeatable actions that can be associated with a rule deployment so that one or more of the actions is performed whenever the deployed correlation rule fires. The Correlation Action Manager allows you to create and configure these actions.
Correlation Action Types The Correlation Action Manager allows you to configure the following types of actions:
Correlation Tab 3-19

Configure a Correlated Event Add to Dynamic List Remove from Dynamic List Execute a Command Send an Email Create an Incident Execute Script
Each action type has a set of configurable parameters.
One or more of these action types can be associated with a correlation rule when the correlation rule is deployed. If none of these action types are selected, a correlated event is created by default. When a default correlation event is triggered, it contains the following values:
Field Name Default Values Severity 4 Event Name CorrelatedEvent Message <empty> Resource Correlation SubResource <Rule Name>
Configure Correlated Event
Figure 3-22: Configure Correlated Event
Instead of using the default values for a correlated event, an action can be created to populate the following fields in the correlated event:
Severity Event Name Message Resource SubResource
3-20 Sentinel User Guide

Add to Dynamic List
Figure 3-23: Adding to Dynamic List
This action type can be used to add a constant value or the value of an event attribute (such as Destination IP or Source User Name) to an existing Dynamic List. Any values that are repeated across multiple events are only be added to the dynamic list once. The various parameters available are:
Element Values: Specify a constant value here. Element Type: Persistent or Transient Dynamic List Name: Select an existing Dynamic List from the dropdown menu. Attribute Names: For every event that is part of a correlated event, the value or
values of this event attribute is added to the Dynamic List.
If there are entries for both Element Values and Attribute Names, both are added to the Dynamic List when the rule fires. If the Element Value is filled in and the Element Type is Transient, the timestamp for the element in the Dynamic List are updated each time the rule fires.
Correlation Tab 3-21
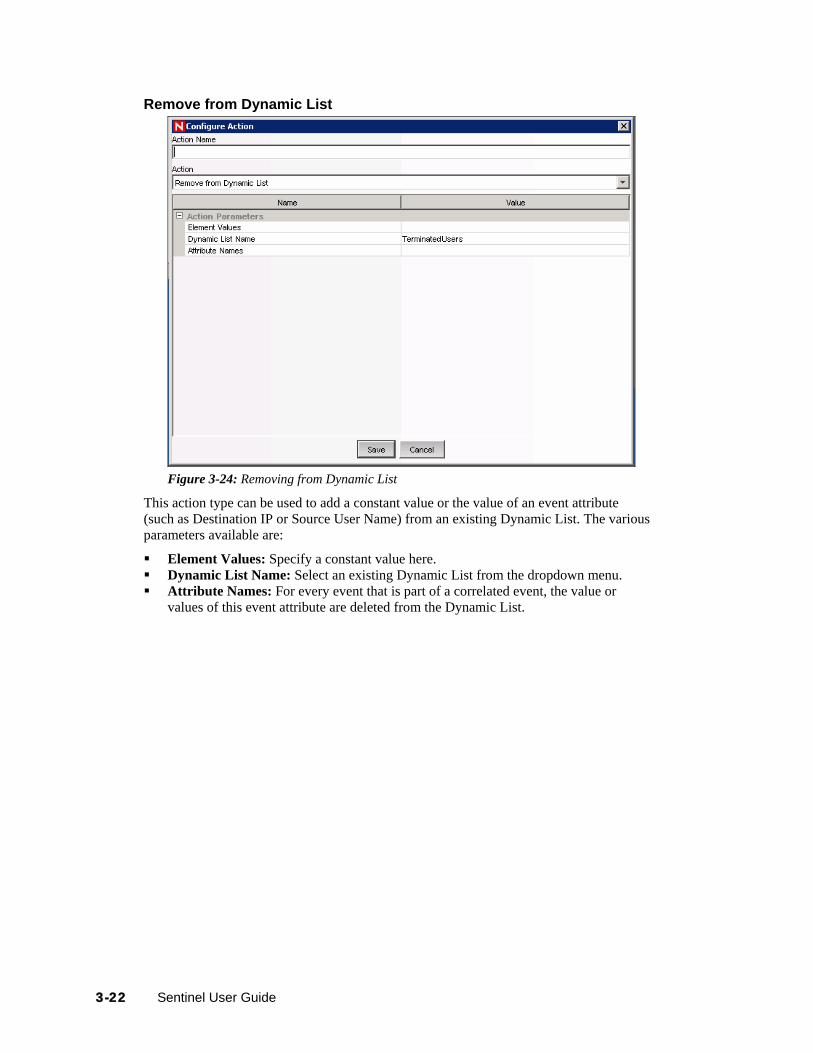
Remove from Dynamic List
Figure 3-24: Removing from Dynamic List
This action type can be used to add a constant value or the value of an event attribute (such as Destination IP or Source User Name) from an existing Dynamic List. The various parameters available are:
Element Values: Specify a constant value here. Dynamic List Name: Select an existing Dynamic List from the dropdown menu. Attribute Names: For every event that is part of a correlated event, the value or
values of this event attribute are deleted from the Dynamic List.
3-22 Sentinel User Guide

Execute a Command
Figure 3-25: Executing a Command
This action type can be used to execute a command when a correlated event triggers. You can set the following parameters:
Command
NOTE: For actions that execute a command or run a script, the command or script must reside in the $ESEC_HOME/config/exec or %ESEC_HOME\config\exec folder on the Correlation Engine. Symbolic links on UNIX are not supported.
Arguments: This can include constants or references to an event attribute in the last event, the one that caused the rule to fire.
NOTE: References to event attributes must use the values in the metatag column enclosed in % symbols. For example, Source IP must be %sip%. For more information on Meta-tags, see Meta-tags in Sentinel Reference Guide.
Command actions can be created to perform a non-interactive action, such as modifying a firewall policy, entering a record in a database, or deactivating a user account. For an action that generates output, such as a command to run a vulnerability scan, the command should refer to a script that runs the command and then writes the output to a file.
NOTE: By default, the action output is stored to the working directory, $ESEC_HOME/data. The action output can be written to a different directory by specifying a different storage location of the output file in the script
Correlation Tab 3-23

Create Incident
Figure 3-26: Configure Action- Create Incident
This action type create an incident whenever a correlated event fires. You can also initiate an iTRAC workflow process for remediation of that incident. For more information about the values of the following parameters, see “Incidents Tab” section.
Responsible Title Category Severity Priority State iTRAC Process Script Name
WARNING:
Do not enable the Create Incident action until the correlation rule has been tuned. If the rule fires frequently, the system can create more incidents or initiate more iTRAC workflow processes than desired.
Execute a Script
Figure 3-27: Configure Action- Execute a Script
3-24 Sentinel User Guide
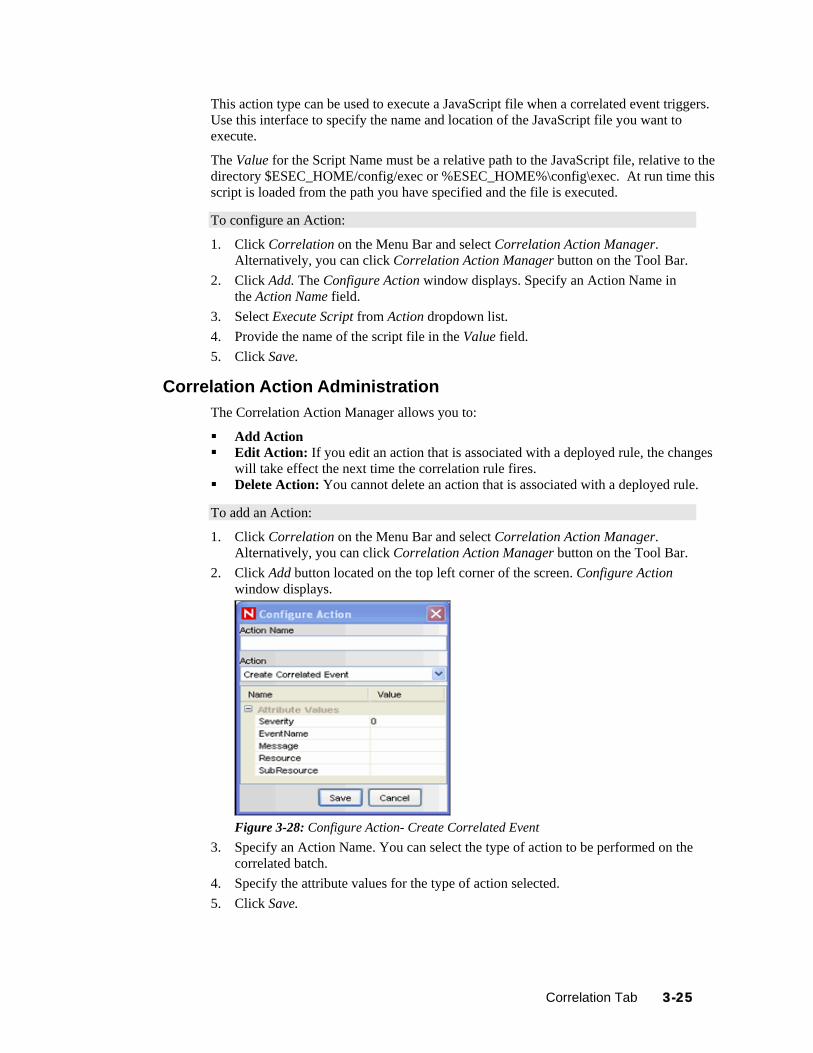
This action type can be used to execute a JavaScript file when a correlated event triggers. Use this interface to specify the name and location of the JavaScript file you want to execute.
The Value for the Script Name must be a relative path to the JavaScript file, relative to the directory $ESEC_HOME/config/exec or %ESEC_HOME%\config\exec. At run time this script is loaded from the path you have specified and the file is executed.
To configure an Action:
1. Click Correlation on the Menu Bar and select Correlation Action Manager. Alternatively, you can click Correlation Action Manager button on the Tool Bar.
2. Click Add. The Configure Action window displays. Specify an Action Name in the Action Name field.
3. Select Execute Script from Action dropdown list. 4. Provide the name of the script file in the Value field. 5. Click Save.
Correlation Action Administration The Correlation Action Manager allows you to:
Add Action Edit Action: If you edit an action that is associated with a deployed rule, the changes
will take effect the next time the correlation rule fires. Delete Action: You cannot delete an action that is associated with a deployed rule.
To add an Action:
1. Click Correlation on the Menu Bar and select Correlation Action Manager. Alternatively, you can click Correlation Action Manager button on the Tool Bar.
2. Click Add button located on the top left corner of the screen. Configure Action window displays.
Figure 3-28: Configure Action- Create Correlated Event
3. Specify an Action Name. You can select the type of action to be performed on the correlated batch.
4. Specify the attribute values for the type of action selected. 5. Click Save.
Correlation Tab 3-25

To edit an Action:
1. Click Correlation on the Menu Bar and select Correlation Action Manager. Alternatively, you can click Correlation Action Manager button on the Tool Bar.
2. Select Correlated Action and click View/Edit link against it. 3. The Configure Action window diplays. Edit the options as required and click
Save.
To delete an Action:
1. Click Correlation on the Menu Bar and select Correlation Action Manager. Alternatively, you can click Correlation Action Manager button on the Tool Bar.
2. Select Correlated Action and click Delete link against it. Confirmation message alert diplays.
3. Click Yes to delete.
JavaScript Correlation Actions The action defined using JavaScript can be executed when the correlation rule fires. The script can be executed either as a standalone action or with an incident creation action.
Using JavaScript, you can access Sentinel system methods to execute actions such as:
Start/Stop the Collectors Add/Remove from Dynamic Lists Get Current Event Get Correlated Event Get Correlation Event Collection Get Incident
To create a JavaScript Correlation Action:
1. Create a JavaScript file with .js extension.
NOTE: For information about the API for developing JavaScript scripts for Sentinel correlation, see Sentinel JavaScript Correlation Action API on the Novell documentation site:
http://www.novell.com/documentation/sentinel6.
2. Place the .js file in the default working directory on the machine where Correlation Engine is running. The default working directory for the script is $ESEC_HOME/config/exec or %ESEC_HOME\config\exec.
NOTE: The working directory for the script can be changed by specifying a value for the property exec.location in the execution.properties file located in $ESEC_HOME/config or %ESEC_HOME%\config. For example: exec.location = C:\\
Restart the correlation engine process to activate the changes made to the execution.properties file.
Changing the working directory for Execute Script (JavaScript) correlation actions also changes the working directory for Execute Command correlation actions and right-click menu actions.
3-26 Sentinel User Guide

3. In the Sentinel Control Center, create a Correlation Action to execute a JavaScript file. For more information on creating an action, see “Correlation Action Administration”. For example: Action Name: JavaScriptAction Action: Execute Script Script Name: action.js
Figure 3-29: Configure Action- JavaScript Action
4. Create a Correlation Rule. For more information on creating a Correlation Rule, see “Creating a Correlation Rule”.
5. Deploy Correlation Rule and associate the new Correlation Action to the Correlation Rule. For more information on deploying correlation rule, see “Deploying/Undeploying Correlation Rules”.
Figure 3-30: Deploy Rule window
Sample JavaScript Correlation Actions The code sample below starts or stops a Collector based on information in the correlated event.
Correlation Tab 3-27

importPackage(java.lang); var CollectorName = "TC_5"; var evt = scriptEnv.getCurrentEvent(); var collNm = evt.getPort(); var outfile = new java.io.PrintWriter(new java.io.FileWriter("/opt/jaya/strtcoll.txt", true)); if(collNm && collNm.equals(CollectorName)) { var collist = ESM.collectorsForName(collNm); if (collist.size() > 0) { var coll = collist.get(0); outfile.println("Stopping " + CollectorName); coll.stop(); Thread.sleep(60000); outfile.println("starting " +CollectorName); coll.start(); } } else { outfile.println("JSTest collector does not exist"); } outfile.close();
JavaScript Debugger You can debug JavaScript files from the Sentinel Control Center with the help of the JavaScript debugger. The JavaScript Debugger is a local debugger that executes scripts with respect to the machine on which the Sentinel Control Center is running. The JavaScript Debugger instantiates a debug session from the Correlation Engine Manager.
A JavaScript Correlation Action can only be debugged after it is associated with a fired Correlation Rule. Therefore, a prerequisite to debugging is to create a correlation rule that is guaranteed to fire, then associate the JavaScript Correlation Action with that rule.
The debugger has the following controls:
Run Run the script until the next breakpoint is encountered.
Step Into Step into a function, one line at a time.
Pause Pause the running script.
Stop Stop the script.
3-28 Sentinel User Guide

Step Over Step over a function to the next line in the script.
Step Out Step out of the function to the next
line in the script. Table 3-2: Debugger Controls
To open a JavaScript Debugger:
1. Click Correlation on the Menu Bar and select Correlation Engine Manager. Alternatively, you can click Correlation Engine Manager button on the Tool Bar.
Figure 3-31: Correlation Engine Manager-Debug
2. Select a JavaScript Action associated with Correlation Rule. Right click and select Debug. The Debug JavaScript Correlation Action window displays.
Figure 3-32: Debugging JavaScript Correlation Action
Correlation Tab 3-29
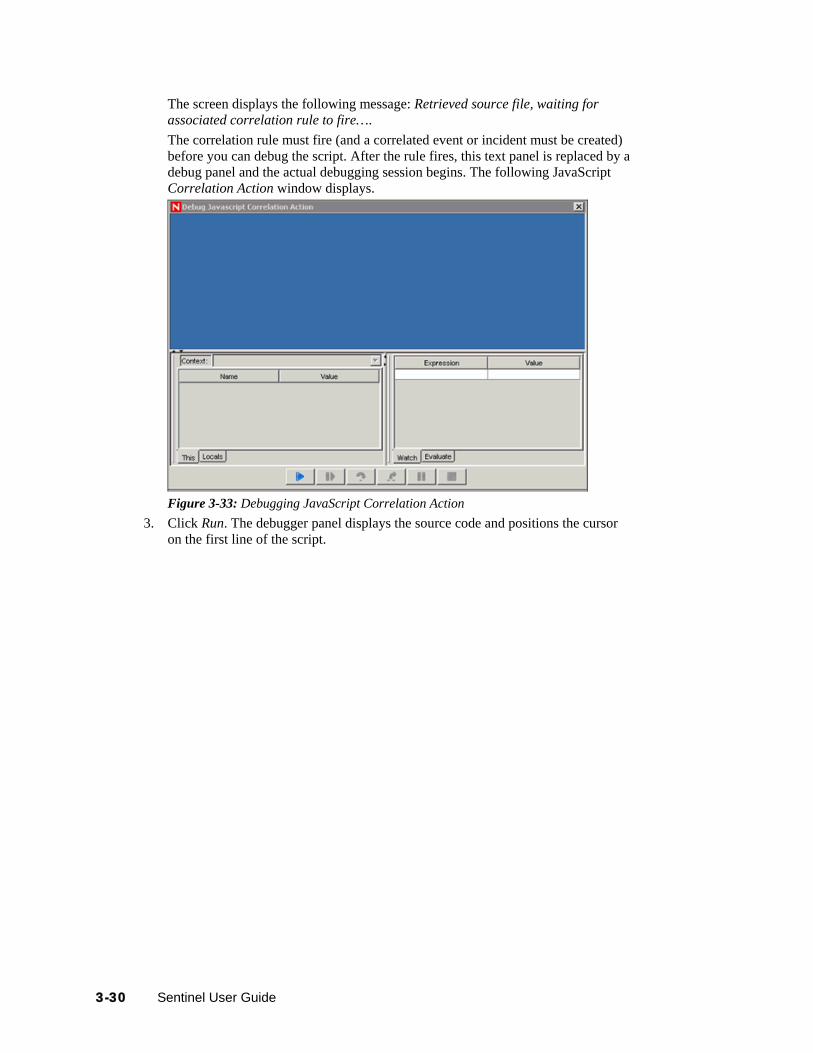
The screen displays the following message: Retrieved source file, waiting for associated correlation rule to fire…. The correlation rule must fire (and a correlated event or incident must be created) before you can debug the script. After the rule fires, this text panel is replaced by a debug panel and the actual debugging session begins. The following JavaScript Correlation Action window displays.
Figure 3-33: Debugging JavaScript Correlation Action
3. Click Run. The debugger panel displays the source code and positions the cursor on the first line of the script.
3-30 Sentinel User Guide

Correlation Tab 3-31
Figure 3-34: Debugger window You can debug the script as many times as needed (without requiring a new correlation rule to fire). After the debugger gets to the end of the script (or after you click the Stop button), click Run again.
4. To debug the script using a different rule, different correlated event, or different incident, close the Debug Javascript Correlation Action window and repeat the debugging process.
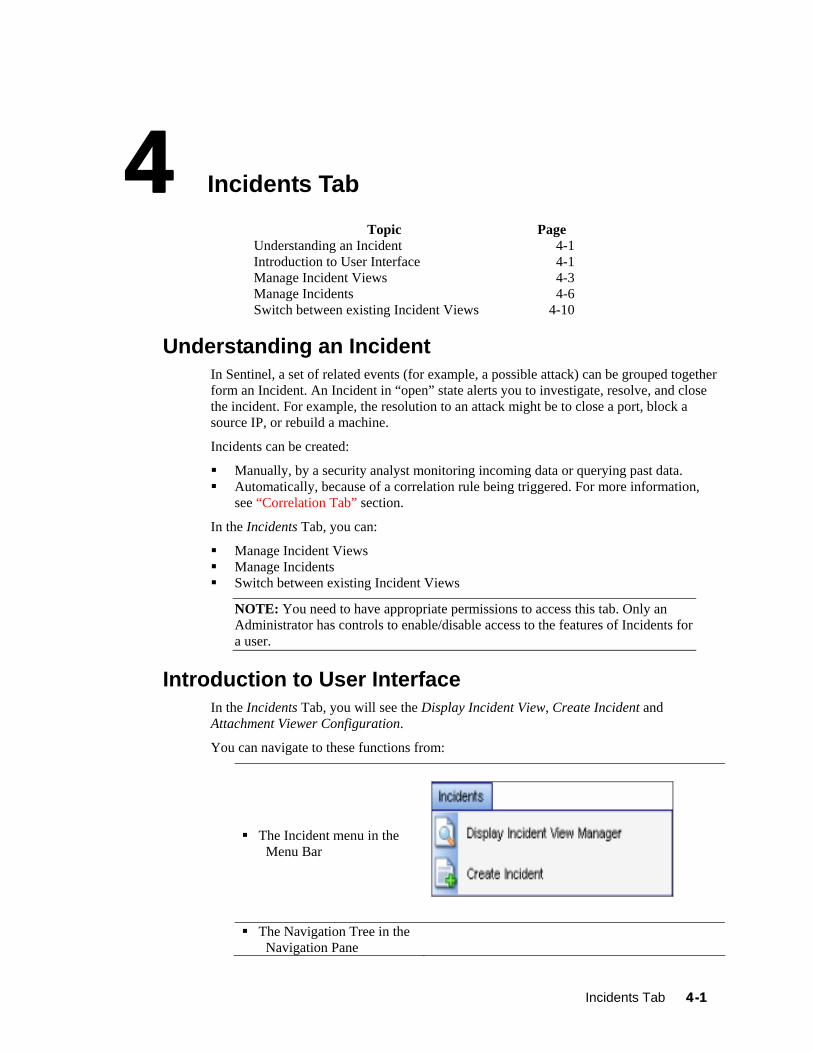
4 Incidents Tab
Topic Page Understanding an Incident
4-1Introduction to User Interface 4-1Manage Incident Views 4-3Manage Incidents 4-6Switch between existing Incident Views 4-10
Understanding an Incident In Sentinel, a set of related events (for example, a possible attack) can be grouped together form an Incident. An Incident in “open” state alerts you to investigate, resolve, and close the incident. For example, the resolution to an attack might be to close a port, block a source IP, or rebuild a machine.
Incidents can be created:
Manually, by a security analyst monitoring incoming data or querying past data. Automatically, because of a correlation rule being triggered. For more information,
see “Correlation Tab” section.
In the Incidents Tab, you can:
Manage Incident Views Manage Incidents Switch between existing Incident Views
NOTE: You need to have appropriate permissions to access this tab. Only an Administrator has controls to enable/disable access to the features of Incidents for a user.
Introduction to User Interface In the Incidents Tab, you will see the Display Incident View, Create Incident and Attachment Viewer Configuration.
You can navigate to these functions from:
The Incident menu in the Menu Bar
The Navigation Tree in the Navigation Pane
Incidents Tab 4-1
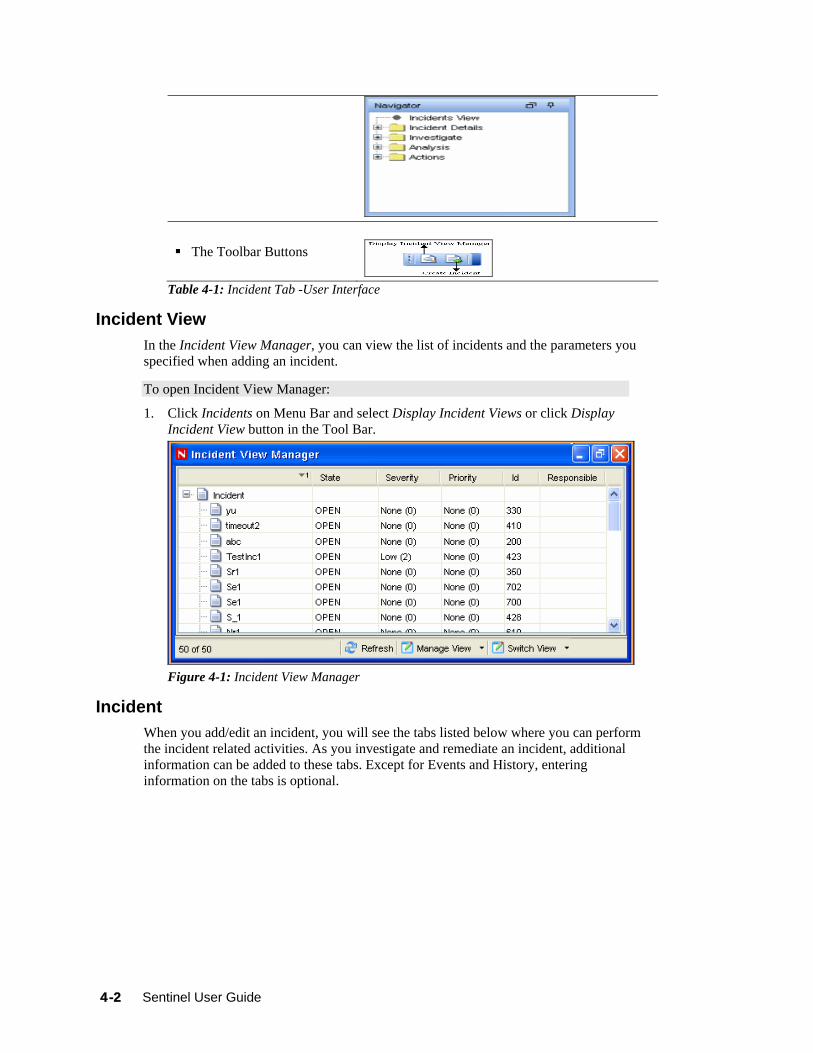
The Toolbar Buttons
Table 4-1: Incident Tab -User Interface
Incident View In the Incident View Manager, you can view the list of incidents and the parameters you specified when adding an incident.
To open Incident View Manager:
1. Click Incidents on Menu Bar and select Display Incident Views or click Display Incident View button in the Tool Bar.
Figure 4-1: Incident View Manager
Incident When you add/edit an incident, you will see the tabs listed below where you can perform the incident related activities. As you investigate and remediate an incident, additional information can be added to these tabs. Except for Events and History, entering information on the tabs is optional.
4-2 Sentinel User Guide

Figure 4-2: Add/Edit Incident Events: Lists events attached to this incident. You can attach events to incidents in
Active Views. Assets: Lists assets affected by the events of this incident. Vulnerability: Lists asset vulnerabilities. Advisor: Displays Asset attack and alert information. iTRAC: Allows you to add a workflow to incident from iTRAC Tab. History: Lists activities performed on the current incident. Attachments: Allows you to add an attachment to the incident created in the system. Notes: Allows you to add notes to the incident.
Manage Incident Views Manage View allows you to:
Add Views Edit Views Delete Views Mark a View as default
Adding a View To add an Incident View:
1. Click Incidents > Display Incident View Manager. Alternatively, click Display Incident View button on the Tool Bar.
2. Open the View Options by either: Clicking the down-arrow on the Manage Views button located in bottom right
corner of the window and selecting Add View. or
Incidents Tab 4-3
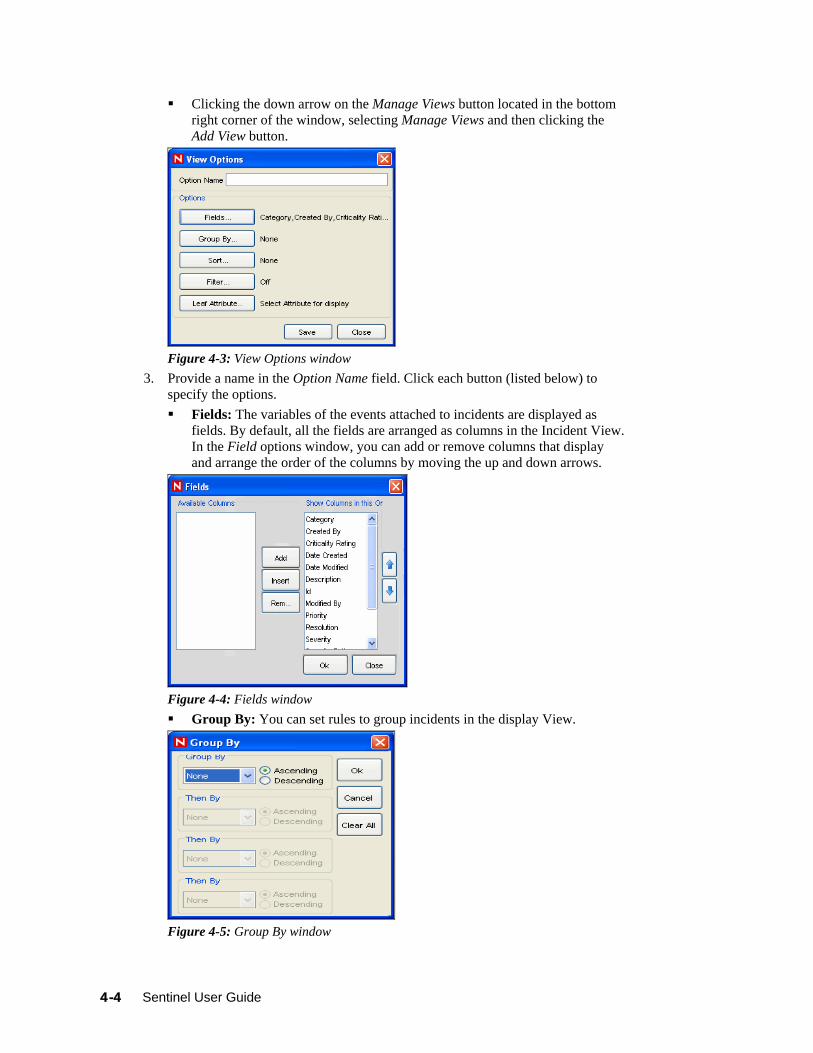
Clicking the down arrow on the Manage Views button located in the bottom right corner of the window, selecting Manage Views and then clicking the Add View button.
Figure 4-3: View Options window
3. Provide a name in the Option Name field. Click each button (listed below) to specify the options. Fields: The variables of the events attached to incidents are displayed as
fields. By default, all the fields are arranged as columns in the Incident View. In the Field options window, you can add or remove columns that display and arrange the order of the columns by moving the up and down arrows.
Figure 4-4: Fields window Group By: You can set rules to group incidents in the display View.
Figure 4-5: Group By window
4-4 Sentinel User Guide

Sort By: You can set rules to sort the incidents in the display view.
Figure 4-6: Sort window Filter: You can set Incident filters. Only the Incidents that match your filter
displays in the View.
Figure 4-7: Criteria window Leaf Attribute: You can select an attribute from the list which is displayed
as the first column in the Incident View.
Figure 4-8: Select Attribute window
4. Click Save.
Incidents Tab 4-5

Modifying a View To edit an Incident View:
1. Click Incidents > Display Incident View or click Display Incident View Manager button on the Tool Bar.
2. Open a view by: Clicking the down-arrow on the Switch View button in the bottom right
corner, select the view you want to edit. Click the down-arrow on the Manage View button located in bottom right corner of the screen and select Edit Current View from the list. or
Clicking the down arrow on the Manage Views button located in the bottom right corner of the window, select Manage Views. Select a view to edit and click View/Edit.
3. Edit the options as required and click Save.
Deleting a View To delete an Incident View:
1. Click Incidents > Incident View Manager or click Display Incident View button on the Tool Bar.
2. Click the down-arrow on the Manage Views button located in bottom right corner of the screen and select Manage View from the list. The Manage View window displays. Select a view and click Delete. A confirmation message alert displays.
3. Click Yes to delete.
Default View To mark a View as default:
1. Click Incidents > Display Incident View Manager, or click Display Incident View Manager icon on the Tool Bar.
2. Click the down-arrow on the Manage Views button located in bottom right corner of the screen and select Manage Views from the list. The Incident View window displays.
3. Select the incident view you want as default, and click Mark as Default.
Manage Incidents You can perform the following activities related to Incidents:
Create an Incident Attach Workflows to Incidents Add Attachments to Incidents Add Notes to Incidents Edit an Incident Delete an Incident
4-6 Sentinel User Guide

Creating Incidents To create an Incident:
1. Click Incidents > Create Incident, or click Create Incident button on the Tool Bar. The New Incident window displays.
Figure 4-9: New/Edit Incident window
2. Specify the following information: Title: Specify the Title of the Incident. State: To set state of the incident, select from the drop-down list. Severity: To mention the severity of the incident, select from the drop-down
list. Priority: To mention the priority of the incident, select from the drop-down
list. Category: Specify the category of the Incident. Responsible: To assign the responsibility to investigate and close the
incident, select from the drop-down list. Description: Specify the description of the Incident in the text area. Resolution: Specify the resolution description in the text area.
3. Click Create. The Incident ID automatically generates after you click Create.
NOTE: For more information on creating an incident grouping events, see Creating Incident in “Active Views Tab” section.
Viewing an Incident To open an Incident
1. Click Incidents > Display Incident View Manager or click Display Incident View Manager button on the Tool Bar.
2. Open an Incident by:
Incidents Tab 4-7
Selecting a view from the Switch Views button in the bottom right corner. Double click an incident in the Incident View Manager window.
Attaching Workflows to Incidents To attach a workflow to an Incident:
1. Open an incident. 2. In the Incident window, click iTRAC Tab. 3. Select an iTRAC process from the drop-down list. 4. Click Save.
NOTE: You can attach only one process to an incident.
Adding Notes to Incidents To add a note to an Incident:
1. In the Incident window, click Notes Tab. 2. Click Add. Add Notes to Incident window displays. 3. Provide your notes and click OK. 4. Click Save.
NOTE: To edit or delete the note, select a note in the Notes tab of the Incident window, right-click the note and select edit or delete.
Adding Attachments to Incidents To add an attachment to Incident:
1. In the Incident window, click Attachments Tab. 2. Click Add. Add Attachment to Incident window displays. 3. Click Browse, navigate to the attachment, and select it. 4. Provide the following information, or accept the default entries:
Name Description Type Subtype
Click OK, click Save.
NOTE: Right-click the attachment to view or save.
Configuring the Attachment Viewer To configure the Attachment Viewer:
1. On the Incident tab, open an incident and double-click an Attachment without an associated viewer in the Incident window > Attachment Tab or click Incidents > Attachment Viewer Configuration or click Configure Attachment Viewers button.
. The Attachment Viewer Configuration window displays.
4-8 Sentinel User Guide

Figure 4-10: Attachment Viewer Configuration window
2. Click Add. The Attachment Viewer Configuration window displays.
Figure 4-11: Attachment Identification window Specify the extension type (such as .doc, .xls, .txt, .html and so on) and click Browse or type in the application program to launch the file type (such as notepad.exe for Notepad).
3. Click OK.
Modifying Incidents To edit an Incident:
1. Click Incident tab. Click Incidents > Display Incident View. Alternatively, click Display Incident View button on the Tool Bar. Incident View window displays with the list of incidents.
2. Right-click the incident you want to edit and select Modify. 3. Incident window displays. Edit the following information:
Title State Severity Priority Category Responsible Description Resolution
Incidents Tab 4-9

4-10 Sentinel User Guide
4. Click Save.
NOTE: Save button gets active only if you modify any information in Incidents screen.
Deleting Incidents To delete an Incident:
1. Click Incident tab. Click Incidents > Display Incident View Manager, or click Display Incident View button on the Tool Bar. The Incident View window displays.
2. Right-click the incident you want to delete and select Delete. 3. A confirmation Message displays. Select Yes.
Emailing an Incident To email an incident, the administrator must have configured Sentinel to work with a mail server either during Sentinel installation or later, in the execution.properties file. For more information, see “Utilities” section.
To email an Incident:
1. Click the Incidents tab. Click Incidents > Display Incident View or click the Display Incident View button
. 2. Double click an Incident View name. 3. Double-click an incident. 4. Click Email Incident button.
5. Provide:
Email Address Email Subject Email Message
6. Click OK. The e-mail message have HTML attachments that address incident details, events, assets, vulnerabilities, advisor attacks, incident history and attachments.
Switch between existing Incident Views To switch between Incident views:
1. Click the down-arrow on the Switch View button on the bottom right corner of the screen which displays a list of existing views.
2. Select a view.

5 iTRAC™ Workflows
Topic Page
Understanding iTRAC Workflows 5-1 Introduction to the User Interface 5-2Template Manager 5-3Template Builder Interface 5-4Steps 5-7Transitions 5-16Activities 5-23Process Management 5-29
Understanding iTRAC Workflows iTRAC Workflows are designed to provide a simple, flexible solution for automating and tracking an enterprise’s incident response processes. It leverages Sentinel’s internal incident system to track security or system problems from identification (through correlation rules or manual identification) through resolution.
Workflows can be built using manual and automated steps. Advanced features such as branching, time-based escalation, and local variables are supported. Integration with external scripts and plug-ins allows for flexible interaction with third-party systems. Comprehensive reporting allows administrators to understand and fine-tune the incident response processes.
NOTE: Access to manage iTRAC templates, activities, and processes can be enabled on a user-by-user basis by any user with the ability to change user permissions.
The iTRAC system uses three Sentinel objects that can be defined outside the iTRAC framework:
Incident Incidents within Sentinel are groups of events that represent an actionable security incident, plus associated state and meta-information. Incidents are created manually or through correlation rules, and can, but need not be associated with a workflow process. They can be viewed on the Incidents tab.
Activity An Activity is a pre-defined automatic unit of work, with defined inputs, command-driven activity, and outputs (For example, automatically attaching asset data to the incident or sending an e-mail). Activities can be used within workflow templates, triggered by a correlation rule, or executed by a right-click when viewing events.
iTRAC™ Workflows 5-1

Role Sentinel users can be assigned to one or more Roles. Manual steps in the workflow processes can be assigned to a Role.
Table 5-1: Sentinel Objects used by iTRAC
iTRAC Workflows have four major components that are unique to iTRAC:
Step A Step is an individual unit of work within a workflow; there are manual steps, decision steps, command steps, mail steps, and activity-based steps. Each step displays as an icon within a given workflow template.
Transition A Transition defines how the workflow moves from one state (Activity) to another – this can be determined by an analyst action, by the value of a variable, or by the amount of time elapsed. .
Templates A Template is a design for a workflow that controls the flow of execution of a process in iTRAC. The template consists of a network of manual and automated Steps. Activities and criteria for transition between them. Workflow templates define how an incident is responded to after a process based on that template is instantiated (see below). A template can be associated with many incidents.
Processes A process is a specific instance of a workflow template that is actively being tracked by the workflow system. It includes all the relevant information relating to the instance, including the current step in the workflow, the associated incident, the results of Steps, attachments, and notes. Each workflow process is associated to one and only one incident.
Table 5-2: Major components of iTRAC
Introduction to the User Interface Within the Sentinel Control Center, you access the iTRAC administrative functions by selecting the iTRAC tab from the main screen. This tab gives you access to the Activity Manager (where you define Activities), the Template Manager (where you define Templates), and the Process View Manager (where you manage instantiated workflow Processes).
You can navigate to these functions from:
The iTRAC menu in the Menu Bar
5-2 Sentinel User Guide
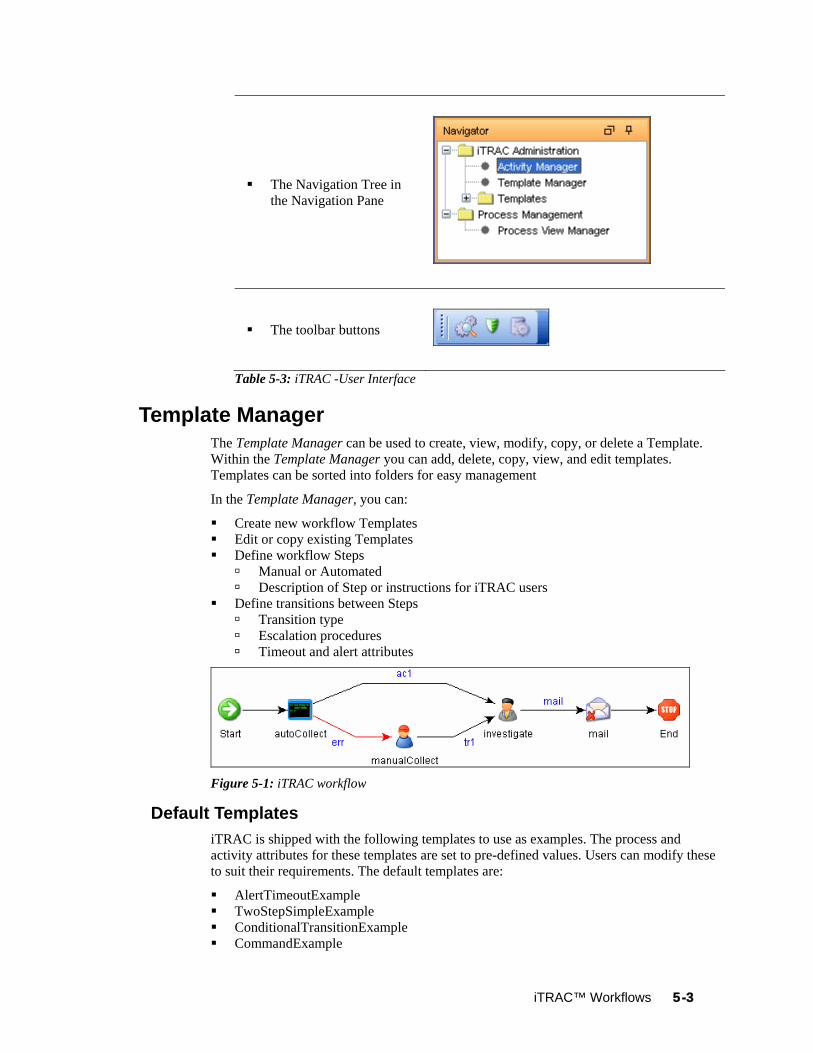
The Navigation Tree in the Navigation Pane
The toolbar buttons
Table 5-3: iTRAC -User Interface
Template Manager The Template Manager can be used to create, view, modify, copy, or delete a Template. Within the Template Manager you can add, delete, copy, view, and edit templates. Templates can be sorted into folders for easy management
In the Template Manager, you can:
Create new workflow Templates Edit or copy existing Templates Define workflow Steps
Manual or Automated Description of Step or instructions for iTRAC users
Define transitions between Steps Transition type Escalation procedures Timeout and alert attributes
Figure 5-1: iTRAC workflow
Default Templates iTRAC is shipped with the following templates to use as examples. The process and activity attributes for these templates are set to pre-defined values. Users can modify these to suit their requirements. The default templates are:
AlertTimeoutExample TwoStepSimpleExample ConditionalTransitionExample CommandExample
iTRAC™ Workflows 5-3

Template Builder Interface
Figure 5-2: Template Builder Interface
The following panes displays in the Template Builder window:
Process Tree: This pane displays the Steps, Transitions and Variables added to the Template. User can add Steps or Variables, Edit or Remove Steps, Variables and Transitions.
To perform an action on a Step, Variable or Transition: Expand the relevant group in the Tree. Select and right-click an existing attribute. Select action you want to perform.
Process: This is the main GUI for viewing and creating a Workflow template. For more information on creating a Workflow Template, see “Creating Templates”.
Quick Edit: Select a Step or Transition to see its properties. This pane allows you to edit process attributes.
To edit the details of steps using Quick Edit: Click the Process Attribute value in the Quick Edit Pane. The attribute values are highlighted indicating Edit Mode. Modify the value and click anywhere outside the Quick Edit frame to save the
new value. Messages: This pane displays messages if Steps or Transitions are
incomplete. You must resolve any issues listed here before saving the Template.
Overview: This pane displays an overview of the entire Template. Step Palette: There are four types of Steps in the Step Palette. You can Drag
and Drop the Steps into the Process pane. Decision Step
5-4 Sentinel User Guide

Mail Step Manual Step Command Step
Activities: The activities added in the Activity Manager are shown in this pane and can be added to a workflow template. The user can also Add, Edit and Remove Activities. For more information, see “Managing Activities”.
WARNING:
Use caution when editing or deleting an Activity that is already in use.
The following icons are used in the Template Builder to represent the Steps:
Icon Description
Start Step: All workflow templates have a Start Step.
Decision Step: This step provides different execution paths depending on the value of a variable defined in a previous Step.
Mail Step: This step sends a pre-written email.
Manual Step: This step indicates that manual work must be performed, often outside the Sentinel system (For example, telephoning the owner of the affected system or analyzing the results of a scan).
Activity Step: This step is a pre-defined set of Activities.
Command Step: This step executes a command or script on the iTRAC workflow server, usually installed in the same place as the Data Access Service (DAS). The output of the command can be stored in a string variable and used as input to a Decision Step.
End Step: This step signifies the completion of a workflow process.
Table 5-4: Template Builder Icons
Creating Templates To create a New Template:
1. Click the iTRAC tab. 2. In the navigation pane, click iTRAC Administration > Template Manager. 3. Click Add. The iTRAC Template Builder window displays.
iTRAC™ Workflows 5-5

Figure 5-3: iTRAC Template Builder window
4. In the Process Details window, provide a name and description (optional) of the template and click OK.
5. Drag and drop a Step from the Step Palette or an Activity from the Activities pane into the Process window. Or click the New Step drop-down button in the upper left corner and select one of the following Step types. Or right-click Start step, select Insert New and select one of the following Step types.
Decision Step Mail Step
Manual Step Command Step
6. Add as many Steps and Activities as needed to create the Template. 7. Create transitions between each Step. To create Transitions, right-click the step
after which you need to add transition and click Add Transition.
NOTE: Any step (except for the End step) might have one or more exit transition lines. A Decision step must have at least two exit lines.
8. Right-click each final step in the Template and click Add End Transition.
NOTE: On the bottom of the iTRAC Template Builder is a message pane that lists any warnings or errors about incomplete steps during the construction.
9. To save your process, go to File>Save or click Save button.
Managing Templates After creating a template, you can modify, copy, delete the Template.
Viewing/Editing Templates
To view/edit an Existing Template:
1. In the Navigator, click iTRAC Administration > Template Manager. 2. Highlight a template and click View/Edit. The Template builder displays.
5-6 Sentinel User Guide

Figure 5-4: Template Builder Interface
Copying Templates One way to create a new workflow Template is to copy one of the default Templates and modify it.
To copy a Template:
1. Click the iTRAC tab. 2. In the Navigator, click iTRAC Administration > Template Manager. 3. Highlight a template and click Copy. A Template Builder with the copied
template displays. 4. Provide a new name, save and edit the template as needed.
Deleting Templates Even if you delete a Template, any instantiated workflow processes that are based on that Template still completes normally.
To delete a Template:
1. Click the iTRAC tab. 2. In the Navigator, click iTRAC Administration > Template Manager. 3. Highlight a template and click Delete.
Steps Steps are the basic components of a Template. Every Template must have a Start Step and an End Step. The Start Step exists by default. You can also add the following types of Steps to a Template:
Manual Step Decision Step Mail Step Command Step Activity Step
iTRAC™ Workflows 5-7

End Step
Start Step Every workflow template must have one and only one Start step. The transition from a Start step is always Unconditional.
Manual Steps
This type of step indicates that manual work must be performed. Every manual step in a Template must be assigned to a Role. The users in that role are notified through a worklist item when an instantiated workflow process reaches the Manual Step. When a user accepts the worklist item, it is removed from the queue of the other users in that Role. For more information about worklists and stepping through a workflow process, see “Work Item Summary” section.
The description of the step should indicate what work needs to be performed. The user is expected to perform that work and then acknowledge completion.
A Manual Step includes the following attributes:
Name of step Role Variables
Delete Add
Description
Variables The user can also be asked to set one or more variables to appropriate values. Four variable types can be assigned to manual steps: (1) Integer, (2) Boolean, (3) String and (4) Float. This variable can be set to an explicit default value during the Step definition, or the user can set the value at run-time as part of the workflow process. The value can be optional or required.
The value of the variable can be used as part of a Conditional transition to determine the path the workflow follows. It can also be used later as part of a Conditional Transition from a Decision step to determine the workflow path.
NOTE: If the value is going to be used later as part of a Decision step, it should be marked “Required.”
For example, an integer variable can be set by the user to hold the event rate. Output transitions from the Manual Step can be defined so that if the event rate is greater than 500, one path is followed; else another path is followed.
To create a variable:
1. Click iTRAC tab. 2. In the Navigator, click iTRAC Administration > Template Manager. 3. Click Add button in upper left corner to open a new template or highlight an
existing template, click View/Edit. 4. Right click Variables in the Process Tree and select the type of variable to add or
right-click the variable type and select Add [type] Variable.
5-8 Sentinel User Guide

Figure 5-5: Adding Variable
5. Give the variable a name and specify the Default Value, if desired. Boolean Variable:
Figure 5-6: Process Variable window-Boolean Variable Type Integer Variable:
Figure 5-7: Process Variable window-Integer Variable Type
iTRAC™ Workflows 5-9

String Variable:
Figure 5-8 Process Variable window-String Variable Type Float Variable
Figure 5-9 Process Variable window-Float Variable Type
6. Click OK.
From a Manual Step, you can set Conditional, Unconditional, Timeout, or Alert transitions.
Decision Steps
5-10 Sentinel User Guide

This type of step selects between exit transitions depending on the values of variables defined in prior steps. See “Manual Step” for the available variable types. The Decision Step itself is very simple; you can edit only the step name and description. The workflow path is determined by the transitions.
From a Decision Step, you can set Conditional and Else transitions. Every Decision Step must have an Else transition and at least one Conditional transition. The Else transition leads to a workflow path that is followed if none of the criteria for the Conditional transitions is met.
Mail Steps
This step sends a pre-written email. A Mail Step includes the following attributes:
Name of step To addressee From addressee Subject of email Body of email
From a Mail Step, you can set a Conditional, Unconditional, Timeout, Alert, or Error transition. An Error transition should always be included so error conditions can be handled properly.
NOTE: If the first step of a workflow fails without an error transition, the iTRAC process cannot proceed.
Command Steps
A Command Step is a step in which an operating-system level command or script (shell, batch, perl and so on) is executed. The name of the command can be provided explicitly or set as a string variable, and parameters can be passed in the same manner. Output from the command can also be placed back into a string variable.
A Command Step includes the following attributes:
Name of step Description Command (Can be explicit or variable-driven) Arguments (Can be explicit or variable-driven) Output Variable
NOTE: The command (or a batch file or script that refers to the command) must be stored in the %ESEC_HOME%\config\exec or $ESEC_HOME/config/exec directory on the iTRAC workflow server, usually the same machine where the Data Access Server (DAS) is installed. Symbolic links are not supported
Variables The command output can also be used to set a variable to the appropriate values. Command steps must use String variable types.
iTRAC™ Workflows 5-11

The value of the variable can be used as part of a Conditional transition to determine the path the workflow follows. It can also be used later as part of a Decision step to determine the workflow path.
For example, a command step can return a value of 0 for failure and 1 for success. This output can be assigned to a variable, and then a Conditional transition or a Decision step can use this value to determine which workflow path to take.
The command and its arguments can each be specified explicitly by the person designing the workflow or be set as a string variable. If either one is set as a string variable, there must be a previous step in the Template where the variable is set to a string value.
From a Command Step, you can set Conditional, Unconditional, Timeout, or Alert, or Error transitions. An Error transition should always be included so error conditions can be handled properly.
NOTE: If the first step of a workflow fails without an error transition, the iTRAC process cannot proceed.
Activity Steps
An Activity Step is a type of automated step that can be used in a workflow Template. Activity Steps are created in the Activity Manager and can consist of internal Sentinel operations or external scripted operations. After Activity Steps are created, the user can select from the library of these Activities and drop them into the workflow. See “Creating an Activity” for information on creating each type of pre-defined Activity.
An Activity Step includes the following attributes:
Name Description Activity Assignment
From an Activity Step, you can set Conditional, Unconditional, Timeout, or Alert, or Error transitions. An Error transition should always be included so error conditions can be handled properly.
NOTE: If the first step of a workflow fails without an error transition, the iTRAC process cannot proceed.
End Step Every workflow template must have an End Step to complete every branch of the workflow path.
Adding Steps to a Workflow Steps can be added to a workflow using the Step Palette or using a right-click in the Process Builder. When adding steps to a workflow, a yellow entry field indicates an invalid entry.
To add a Step from the Step Palette:
1. Drag and drop a step from the Step Palette. 2. Right-click the step and select Edit Step. 3. Edit the details of the step and click Save.
5-12 Sentinel User Guide

To add a Step using a Right-Click:
1. Right-click an existing step in the Process Builder and select Insert New. 2. Edit the details of the step and click Save. 3. Select Manual, Decision, Mail, Command or End Step. 4. Edit the details of the step and click Save.
To add an Activity Step:
1. Click and drag an Activity from the Activity Pane to the Process Builder.
To add an End Step:
1. Right-click a Step with no transition and select Add End Transition.
Figure 5-10: Adding End Transition
Managing Steps Steps can be copied, edited, or deleted.
Copying Steps
To copy a Step:
1. Click the iTRAC tab. 2. In the Navigator, click iTRAC Administration > Template Manager. 3. Highlight an existing template, click View/Edit. iTRAC Process Builder window
displays. 4. Select an existing step, right-click, and select Copy Step. 5. The Step window opens in edit mode with all the attributes of the selected step.
Specify a name to the new step. 6. Edit step attributes as required. Click OK.
Modifying Steps
To edit a Step:
1. Click the iTRAC tab. 2. In the Navigator, click iTRAC Administration > Template Manager. 3. Highlight an existing template, click View/Edit. iTRAC Process Builder window
displays. 4. Select an existing step, right-click, and select Edit Step.
iTRAC™ Workflows 5-13

5. Edit the step attributes. Click OK.
To edit a Manual Step:
1. Right-click a Manual Step and select Edit Step.
Figure 5-11: Manual Step window
2. Provide a Name for the step. 3. Attach a Role to this step by selecting a Role from the drop-down list. (For more
information on Roles, see “Admin Tab” section. 4. Click Associate to associate a Variable; select the variable from the list or create
new variables to be associated. Set a default value as desired. 5. Check the Read-Only box if this variable is to be forced to the default value. 6. Click Description tab to provide description for this step. 7. Click Preview to preview the step you created. 8. Click OK.
To edit a Decision Step:
1. Right-click a Decision Step and select Edit Step.
Figure 5-12: Decision Step window
2. Provide Name.
5-14 Sentinel User Guide

3. Click Description tab to provide description for this step. 4. Click OK
To edit a Mail Step:
1. Right-click a Mail Step and select Edit Step.
Figure 5-13: Mail Step window
2. Provide Name for the step. 3. Provide To and From mail addresses and Subject in the General Tab. 4. Click Body tab and type the message. 5. Click OK.
To edit a Command Step:
1. Right-click a Command Step and select Edit Step.
Figure 5-14: Command Step window
iTRAC™ Workflows 5-15

2. Provide a Name for this step. 3. Specify the path and name of the command or script to execute (relative to the
$ESEC_HOME/config/exec or %ESEC_HOME%\config\exec directory) 4. If you want to run a command or script referenced in a variable that gets
populated during the workflow process, check the Use Variables box. 5. Specify any command-line arguments to pass to the command or script. If you
want to use the contents of a variable that gets populated during the workflow process, check the Use Variables box.
6. Specify a variable to hold output from the command or script. Any standard output is placed into these variables.
7. Click Description tab to provide description for this step. 8. Click OK.
Deleting Steps
To delete a Step:
1. Click iTRAC tab. 2. In the Navigator, click iTRAC Administration > Template Manager. 3. Highlight an existing template, click View/Edit. iTRAC Process Builder window
displays. 4. Select an existing step, right-click, and select Delete Step. 5. In the Alert Message window, select Yes to delete.
Transitions Transitions are used to connect steps. There are several types of transitions:
Unconditional Conditional Timeout
Alert Else Error
A Transition can have the following attributes:
Name Description Destination: Step to which the transition links Expression Timeout Values
Different steps have different properties and therefore they are associated with different transition types.
Step Type Valid Transitions Decision Conditional
Else Manual Unconditional
Timeout Alert
Command Mail Activity
Unconditional Timeout Alert Error
Table 5-5: Steps and Valid Transitions
5-16 Sentinel User Guide

Unconditional Transitions An unconditional transition must always be used from a Start step. Manual, Command, Activity, and Mail Steps can also have unconditional transitions. The only parameter for an unconditional transition is the next step.
This path is taken when the current step is completed (unless a timeout transition is configured and the timeout period elapses).
To add an Unconditional Transition:
1. Open the Process Builder. 2. Select an existing step, right-click and select Add Transition. 3. Specify a name for the transition. 4. Select the Transition type Unconditional from the list.
Figure 5-15: Transitions window
5. Click the down arrow for the Destination field and select a step.
Figure 5-16: Destination field
6. Provide a description for this transition and click OK.
Conditional Transitions Select an exit path based on an expression using iTRAC variables set in a Manual or Command step.
NOTE: You can add Conditional Transitions only from a Decision Step to any other step.
When creating a Conditional Transition, the conditional expressions can be based on comparing a variable that is populated during the workflow process to a specific value or to another variable populated during the workflow process. Multiple conditional expressions can be combined or nested using the AND and OR operator.
To add a Conditional Transition:
1. Open the Process Builder. 2. Select an existing Decision step, right-click and select Add Transition.
iTRAC™ Workflows 5-17

3. Provide a name for the transition. 4. Select the Transition type Conditional from the list.
Figure 5-17: Transitions window
5. Specify the destination Step. 6. Click Set to add an expression. The empty Expression window displays.
Figure 5-18: Expression window
7. Click EXP to add the first expression. The evaluation expression is an expression that evaluates to TRUE or FALSE during the workflow process. Select the appropriate dropdown under Relations to compare a variable to a constant value (Variables and Values) or to another variable (Variables and Variables).
5-18 Sentinel User Guide

Figure 5-19: Selection Relations Type
8. Select a variable from the Attribute dropdown or add a new one if desired. 9. Select a condition from the Condition dropdown. The condition list varies
depending on the type of Attribute variable chosen. String Variable Conditions:
Figure 5-20: String Variable Conditions Integer and Float Variable Conditions:
Figure 5-21: Integer and Float Variable Conditions
iTRAC™ Workflows 5-19

Boolean Variable Conditions:
Figure 5-22: Boolean Variable Conditions
10. Set the Value. 11. Click OK. 12. If a second expression is desired, highlight the root folder.
13. Repeat steps 7-12 as needed. 14. By default, all expressions at the root level is separated by AND operators. To
nest expressions or to use the OR operator, click the appropriate operator button and drag and drop expressions onto that operator.
Figure 5-23: Furnished Expression
5-20 Sentinel User Guide

15. When the expression is complete, click OK.
NOTE: You can edit/delete an existing expression using the Edit and Delete buttons in the Expression window.
16. Click OK. The expressions you provided displays in Transition window under Expression section.
17. Provide a description for your transition and click OK.
Else Transitions An Else transition leads to a path that is taken from a Decision Step when the criteria for the Conditional transitions are not met. This transition only applies to Decision Steps, and every Decision Step must have an Else transition. The workflow path with the Else transition is only followed if none of the criteria for the Conditional transitions is met.
NOTE: You can add Else Transitions only from a Decision Step to any other step.
To add an Else Transition:
1. Open the Process Builder. 2. Select an existing Decision step, right-click and select Add Transition. 3. Select the Transition type Else from the list. 4. Specify the destination Step. 5. Provide a description for this step and click OK.
Timeout Transitions A Timeout transition leads to a path that is taken when a user-specified amount of time (minutes, hours or days) elapses after a Base Time, which is either step_activated_time or step_accepted_time. Step_activated_time is the time that iTRAC activates this step within the workflow process. Step_accepted_time is the time when a user accepts (or takes ownership) of the worklist item for this step. If the timeout time period passes without the step being completed, control moves to the next step.
Timeout transitions can be set for a Manual Step or a Command Step. Step_accepted_time is only relevant for Manual Steps and should not be selected for a Command Step.
This transition is represented by a red line.
To add a Timeout Transition:
1. Open the Process Builder. 2. Select an existing Decision step, right-click and select Add Transition. 3. Select the Transition type Timeout from the list. 4. Specify the destination Step. 5. Click Set to specify the Timeout details. Timeout details window displays. 6. Specify the timeout value in minutes, hours, or days. Click OK. 7. Select Base Time. 8. Provide a description for your transition and click OK.
iTRAC™ Workflows 5-21

Alert Transitions An Alert transition leads to a path that is taken when a user-specified amount of time (minutes, hours or days) elapses after step_activated_time or step_accepted_time. At this point, the workflow process is usually escalated to a user who can intervene and take action.
Step_activated_time is the time that iTRAC activates this step within the workflow process. Step_accepted_time is the time when a user accepts (or takes ownership) of the worklist item for this step.
If the alert time period passes without the step being completed, the workflow process branches into two active paths. The original step remains active for user intervention. The alert path is also initiated. For example, the alert path might escalate the workflow process to the attention of a supervisor, although the main path is still open and the original owner still has the option to complete the worklist item. Another example is that if a command is taking too long to run, you might want to alert an analyst to investigate the delay or possibly run the command manually.
Alert transitions can be set for a Manual Step or a Command Step. Step_accepted_time is only relevant for Manual Steps and should not be selected for a Command Step.
This transition is represented by a yellow line.
To add an Alert Transition:
1. Open the Process Builder. 2. Select an existing Decision step, right-click and select Add Transition. 3. Select the Transition type Alert from the list. 4. Specify the destination Step. 5. Click Set to provide the Alert details. Alert details window displays. 6. Specify the Alert Time value, in minutes, hours, or days. Click OK. 7. Provide a description for your transition and click OK.
Error Transition An Error transition leads to a path that is taken if an automated step cannot successfully complete. Error transitions can be used for Command, Mail, and Activity Steps (for example, if a Command Step fails to execute).
Error Transitions should typically lead to some kind of notification. For example, an Error Transition might lead to a Manual Step in which the user is instructed to manually run a process that previously failed.
NOTE: The Error transition is only taken if the iTRAC call to the Command, Mail, or Activity Step fails. If there is an internal error with the Command script or the mail server fails, this does not satisfy the conditions for an Error transition.
Only the destination Step can be specified, along with a description.
To add an Error Transition:
1. Open the Process Builder. 2. Select an existing Decision step, right-click and select Add Transition. 3. Select the Transition type Error from the list. 4. Specify the destination Step.
5-22 Sentinel User Guide
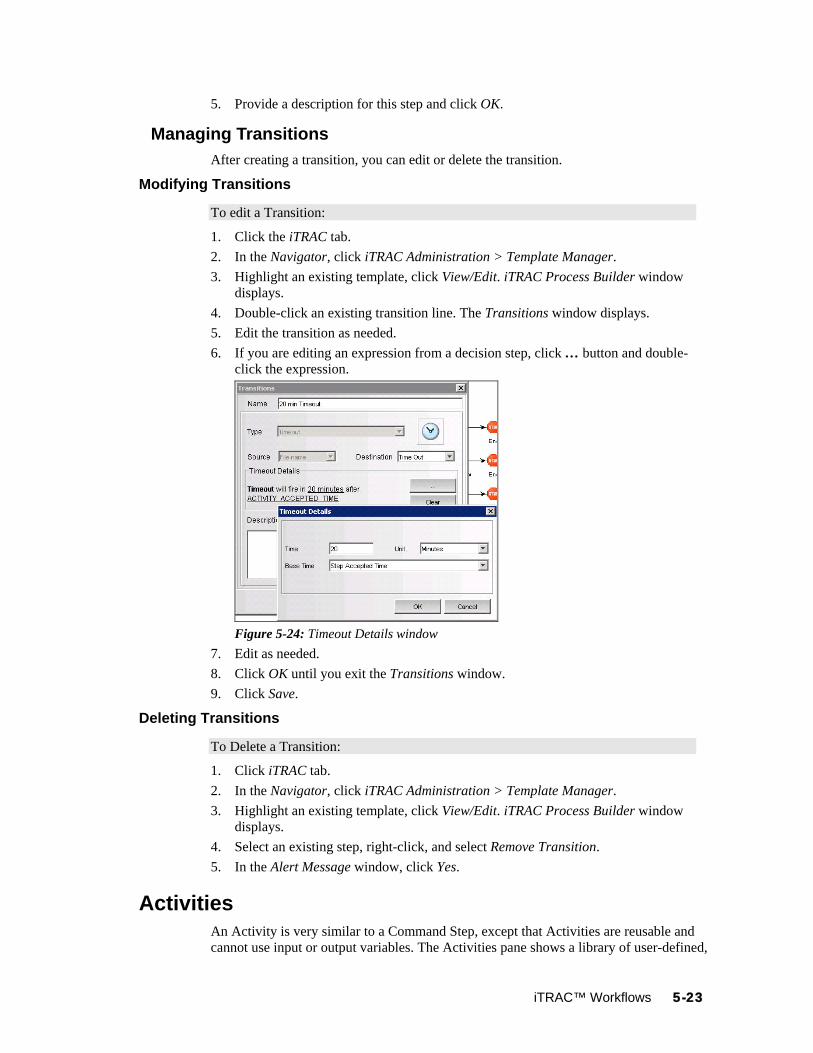
5. Provide a description for this step and click OK.
Managing Transitions After creating a transition, you can edit or delete the transition.
Modifying Transitions
To edit a Transition:
1. Click the iTRAC tab. 2. In the Navigator, click iTRAC Administration > Template Manager. 3. Highlight an existing template, click View/Edit. iTRAC Process Builder window
displays. 4. Double-click an existing transition line. The Transitions window displays. 5. Edit the transition as needed. 6. If you are editing an expression from a decision step, click … button and double-
click the expression.
Figure 5-24: Timeout Details window
7. Edit as needed. 8. Click OK until you exit the Transitions window. 9. Click Save.
Deleting Transitions
To Delete a Transition:
1. Click iTRAC tab. 2. In the Navigator, click iTRAC Administration > Template Manager. 3. Highlight an existing template, click View/Edit. iTRAC Process Builder window
displays. 4. Select an existing step, right-click, and select Remove Transition. 5. In the Alert Message window, click Yes.
Activities An Activity is very similar to a Command Step, except that Activities are reusable and cannot use input or output variables. The Activities pane shows a library of user-defined,
iTRAC™ Workflows 5-23

reusable Activities that can reduce the amount of configuration necessary when building Templates.
Activities are exported or imported as xml files. These files can be exported or imported from one system to another.
Figure 5-25: Activity Pane
Sentinel provides three types of actions that can be used to build Activities:
Incident Command Activity Incident Internal Activity Incident Composite Activity
Incident Command Activity An Incident Command Activity enables you to launch a specific command with or without arguments. The following fields from the incident associated with the workflow process can be used as input to the command:
DIP [Destination IP] DIP:Port RT1 (DeviceAttackName)
SIP [Source IP] SIP:Port Text (incident information in name value
pair format)
NOTE: The command (or a batch file or script that refers to the command) must be stored in the %ESEC_HOME%\config\exec or $ESEC_HOME/config/exec directory on the iTRAC workflow server, usually the same machine where the Data Access Server (DAS) is installed.
Incident Internal Activity An Incident Internal Activity enables you to mail and/or attach information from the Sentinel database to the incident associated with the workflow process. Each of these options has a prerequisite:
Vulnerability for the Source IP address (SIP) or the Destination IP address (DIP): This requires that you run a vulnerability scanner and bring the results of the scan into Sentinel using a Vulnerability (or “information”) Collector
Advisor attack-related data: This requires the purchase and installation of the optional Advisor data subscription service.
Asset data: This requires that you run an asset management tool such as NMAP and bring the results into Sentinel using an Asset Collector.
Incident Composite Activity An Incident Composite Activity enables combine one or more existing Command and Internal activities.
5-24 Sentinel User Guide

Creating Activities To create an Activity:
1. Click iTRAC tab. 2. In the Navigator, click iTRAC Administration > Activity Manager or click the
Add button in the Activity Pane.
Figure 5-26: Activity Pane
3. Highlight an existing activity and click > Add button. Activity Wizard window displays.
4. Select an Activity type: Command, Internal, or Composite. 5. Provide a name and description for this activity. Click Next.
Figure 5-27: Activity Wizard- Activity Wizard
6. Configure the necessary settings for the type of activity you chose. Incident Command Activity
iTRAC™ Workflows 5-25

In the Command Arguments Wizard, specify the Command. Provide the Arguments for this command. You can select None, Incident
Output (Values from the Drop-down list), or provide Custom values.
Figure 5-28: Activity Wizard- Command Arguments Wizard
Click Next. You can configure an Incident Command Activity to email the output to a
specific address and/or attach the output to the incident associated with the workflow process in this window.
Select Mail and specify the To and From email address and Subject.
Figure 5-29: Activity Wizard- Command Activity Mail and Attachment Wizard
Select Attach to Incident, if required. Click Next.
5-26 Sentinel User Guide

View and confirm the details you chose in the Summary page and click Finish.
Incident Internal Activity In the Command Arguments wizard, specify the Command. Provide the Arguments for this command. You can select None, Incident
Output (Values from the Drop-down list), or specify Custom values.
Figure 5-30: Activity Wizard- Internal Activity Mail and Attachment Wizard Click Next.
Select your options (Mail and attach). If you select Mail, you are prompted to provide To, From email address and
Subject. Provide this information and click Next. View and confirm the details you chose in the Summary page and click
Finish. Incident Composite Activity
Select the activities from the list of available activities and click Next.
iTRAC™ Workflows 5-27

Figure 5-31: Activity Wizard- Composite Activity Wizard View and confirm the details you chose in the Summary page and click Finish.
Managing Activities After creating an Activity, you can modify, import or export it.
Modifying Activities
To modify an Activity:
1. Click the iTRAC tab. 2. In the Navigator, click iTRAC Administration > Activity Manager. 3. Highlight activity that needs modification and click View/Edit. Edit Activity
window displays. 4. Edit information in General, Arguments and Attachment tabs. 5. Click OK.
Exporting Activities
To export an Activity:
1. Click iTRAC tab. 2. In the Navigator, click iTRAC Administration > Activity Manager. 3. Click Import/Export Activity icon. Import/Export Wizard window displays.
5-28 Sentinel User Guide

Figure 5-32: Activity Wizard- Activity Import/Export
4. Select Export Activity and click Explore. 5. Navigate to where you want save your exported file. 6. Click Next. 7. Select one or more activities to be exported. 8. Click Next and click Finish.
Importing Activities
To import an Activity:
1. Click iTRAC tab. 2. In the Navigator, click iTRAC Administration > Activity Manager.
3. Click Import/Export Activity icon . Import/Export Wizard window displays. 4. Select Import Activity and click Explore. 5. Navigate to your import file. Click Import. 6. Click Next. You will see a list of activities that are imported. 7. Click Next and click Finish.
Process Management Process Management allows you to view the incident’s progress in the workflow or terminate a workflow process. Process Management allows you to:
Display Status of your Process Start your Process Terminate your Process
iTRAC™ Workflows 5-29

Process Execution is the time period during which the process is operational, with prinstances being created and managed.
When an iTRAC process is executed or instantiated in the iTRAC server, a process instance is created, managed and eventually terminated by the iTRAC server in accordance with the process definition. As the process progresses towards completion or termination it executes various ac
ocess
tivities defined in the workflow template based on the
ngle associated incident; there is therefore a onenecessarily attached to processes, however.
cident can be associated to an iTRAC process instance.
criteria for the transitions between them. The iTRAC workflow server processes Manual and Automatic Steps differently.
An iTRAC process must be created with a si-to-one match between iTRAC processes and incidents. Not all incidents are
NOTE: Only one in
Instantident to
nt creation
cess to an incident through correlation
ciating a process to an incident, see “Incidents Tab” section.
Automa
might be defined to ping a server; when this Activity is executed e Activity runs and attach the results to the associated incident.
Manual
as assigned to a role then a work item is ts for the user to complete the
work it
For more information, see “Work Item Summary” section.
All Manual Steps must be assigned to a Role, or group of users.
iating a Process An iTRAC process can be instantiated in the iTRAC server by associating an incan iTRAC process by the following three methods
Associate an iTRAC process to the incident at the time of incide Associate an iTRAC process to incident after an incident has been created Associate an iTRAC pro
For more information on asso
tic Step Execution When the process instance executes an automatic Activity Step, Command Step, or Mail Step, it executes the associated Activity or command defined in the Template, and stores the result in process variables. It then transitions to the next Step in the iTRAC template.
For example, an Activityin a workflow process th
Step Execution On encountering a Manual Step, the iTRAC server sends out notifications in the form of work items to the assigned resource. If the Step wsent to all users within the role. The iTRAC server then wai
em before proceeding to the next activity.
NOTE:
Display
s visually by clicking on the Refresh button, the process monitor also provides an audit trail of all the actions performed by the iTRAC server when executing the process.
Status The Display Status function is to monitor the progress of a process. As the process instance progresses from one activity the user might track the progres
5-30 Sentinel User Guide

Figure 5-33: All Processes window
Activities that are running are represented by and those completed by and terminated by icons.
Displaying Status of a Process To display Status:
1. Click iTRAC tab. 2. Click Display Process Manager icon.
3. Click down-arrow on the Switch Views button to select a view or create a new
view. 4. In the Process Manager window, highlight and right-click a process and select
Actions > Display Status.
Figure 5-34: Processes View window
5. The current step is highlighted in red.
iTRAC™ Workflows 5-31
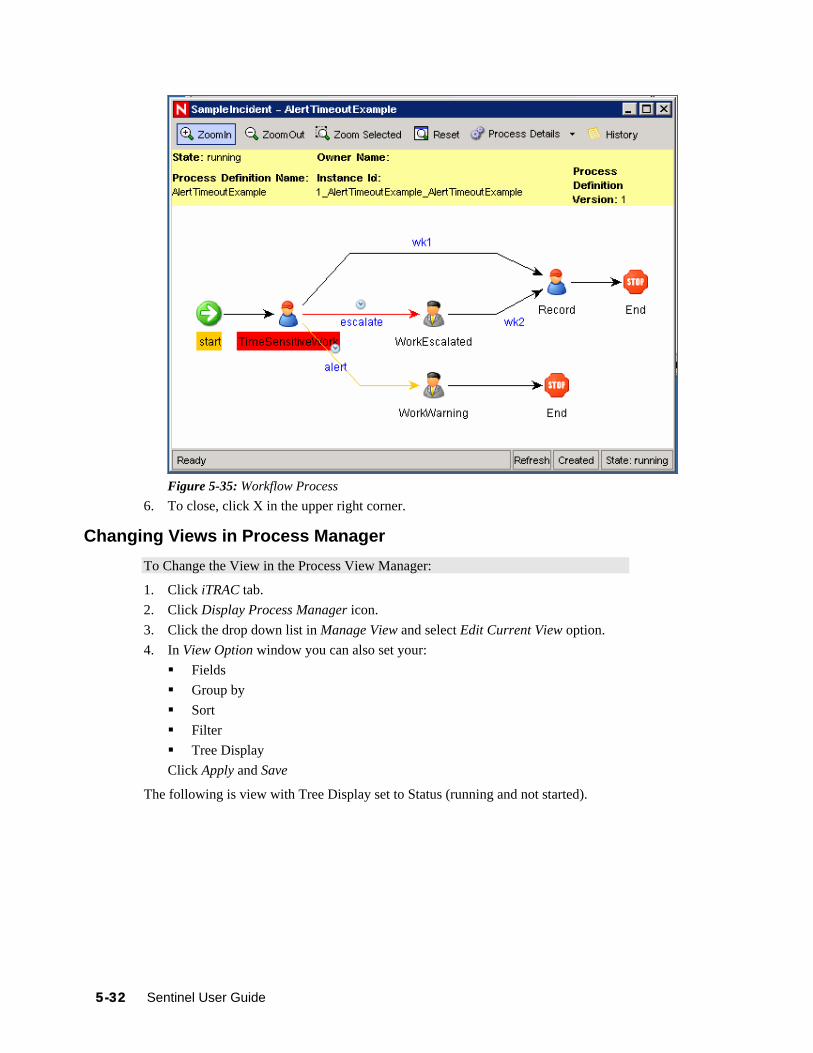
Figure 5-35: Workflow Process
6. To close, click X in the upper right corner.
Changing Views in Process Manager To Change the View in the Process View Manager:
1. Click iTRAC tab. 2. Click Display Process Manager icon. 3. Click the drop down list in Manage View and select Edit Current View option. 4. In View Option window you can also set your:
Fields Group by Sort Filter Tree Display
Click Apply and Save
The following is view with Tree Display set to Status (running and not started).
5-32 Sentinel User Guide

iTRAC™ Workflows
Figure 5-36: Process View Manager
Starting or Terminating a Process To Start or Terminate a Process:
1. Click iTRAC tab. 2. Click Display Process Manager icon
Alternatively, you can select iTRAC > Display Process Manager.
3. Click drop down arrow on the Switch Views button to select a view or create a new view.
4. In the Process View Manager window, highlight a process, right-click and select Actions > Start Process or Terminate Process.
5-33

6 Work Items
Topic Page
Understanding Work Items 6-1Processing a Work Item 6-4Manage Work Items Of Other Users 6-6
Understanding Work Items A Work Item is a workflow task assigned to a particular user or role in the iTRAC application. The individual activities to be performed to complete an iTRAC process are listed as work items in Work Item Summary in the Sentinel Control Center. For more information on iTRAC processes, see “iTRAC Workflows” section. You can access the work items from any tab in the Sentinel Control Center.
NOTE: To have access to a work item, you must assign it to you or acquire the work item management permissions. If you have Work Item management permission, you can manage work items of other users.
Work Item Summary The Work Item Summary lists the work items allocated to a user as an individual and as a member of a group; it can be referred as an incident workflow to-do list for a user who is a part of the Incident response process. In the Work Item Summary, you can access the work items and:
View the details of a work item Process the work item to complete the task
In the Work Item Summary, work items are grouped by current user and by other users with similar role. The following example is for a user who is a member of the Admin, Analyst, Jr Analyst and Admin Asst group.
Figure 6-1: Work Item Summary
The following is an example of a user who is a member of the Analyst group who has a process assigned to his role (group).
Work Items 6-1

Figure 6-2 : Work Item Summary-Example
To access a Work Item:
1. In the Work Item Summary, click the yellow or green bar. A work item list for the group or the current user displays.
Figure 6-3: Work Items window
2. Select Work Item and click View Details. Work Item Details window displays.
Figure 6-4: Work Item details window-Process Status tab
3. The Process Status tab in this window displays the Work flow. Click Process Details tab to view the process details.
6-2 Sentinel User Guide

Figure 6-5: Work Item details window-Process Details tab
You can also add comment and attachments to the process. Attachments appear in the Incidents tab.
The Description Tab displays the Step Description and Process Description you provided when creating workflow in iTRAC. For more information on iTRAC processes, see “iTRAC Workflows” section.
Figure 6-6: Work Item details window-Description tab
Work Items 6-3

Processing a Work Item A Work Item can be run under any tab of the Sentinel Control Center.
You can still process a Work Item in a group even if you have login as a different user. However you cannot acquire a step if you have login as a different user.
The Work Item remains with the user of a group who have acquired it. If a single of succession of steps are with a user followed by a step of another group
and returns back to the original role, the step does not revert to the user. It is assigned to the group.
The two stages of processing a work item are
Accepting a work item Completing a work item
Accepting a Work Item To accept Work items:
1. In the Work Item Summary, click the yellow or green bar. A work item list for the group or the current user displays.
Figure 6-7: Work Item window
2. To assign an iTRAC process to you, high-light the process and click Acquire.
Figure 6-8: Work Item window-Acquire The Work Item Summary changes from yellow to green.
Work item assigned to a group (role)
Work item assigned to the user under the Analyst role.
Table 6-1: Work Item Summary
6-4 Sentinel User Guide

NOTE: When acquiring (accepting) a process, all other users in the same role you are in, no longer see the process. You can place the process back to the group by clicking Release.
3. Click View Details. 4. The current step within a Work Item is high-lighted in red.
Figure 6-9: Workflow
5. To take action on the step, click the Process Details tab. In the case of a manual step and depending on the type of variable (Integer, String, Boolean and Float) assigned to that step, click the down arrow and select a decision. If needed, you can add comments or add an attachment. In all other cases, the steps are automatic.
6. When running a process, if the process disappears that means that it changed groups.
7. Click Complete to complete the process.
Completing the Work Item Completing the work item signals the completion of the task to the iTRAC server. The updateable variables from the work item are processed by the server to move to the next activity based on some criteria. The work item is removed from the worklist. A work item has to be acquired before it can be completed.
To complete Work Items:
1. Click View work items link in Work Item Summary pane. Work Items window displays.
2. Click Complete.
Figure 6-10: Process View Manager
Work Items 6-5

6-6 Sentinel User Guide
Manage Work Items Of Other Users The Administration function allows an administrative user to release a Work Item from a specific user back to everyone in a role. This is beneficial in the event that a Work Item is in already in process but the assigned user cannot complete the work.
To release a Work Item back to a role (Admin):
1. Login into Sentinel as a user with iTRAC – Manage Work Items Of Other Users user rights.
2. In the Summary pane, click View work items.
Figure 6-11: Work Item Summary
3. In the Work Items window, set the following:
Figure 6-12: Work Item window User: Name of the user that has acquired the process Group: Name of the Group that the user belongs to. In the above example,
the user belongs to the Analyst group. Owner: Select either <All> (all processes acquired or not), me (acquired
processes) or Group (un-acquired processes). Process: Name of the process.
In the above example, all processes acquired by jr1, who belongs to Group Analyst, with all processes listed.
4. To release the Work Item, high light the Work item and click Release. Release changes to Acquire (not available). In this example, only a member of the Analyst group can acquire this Work Item.
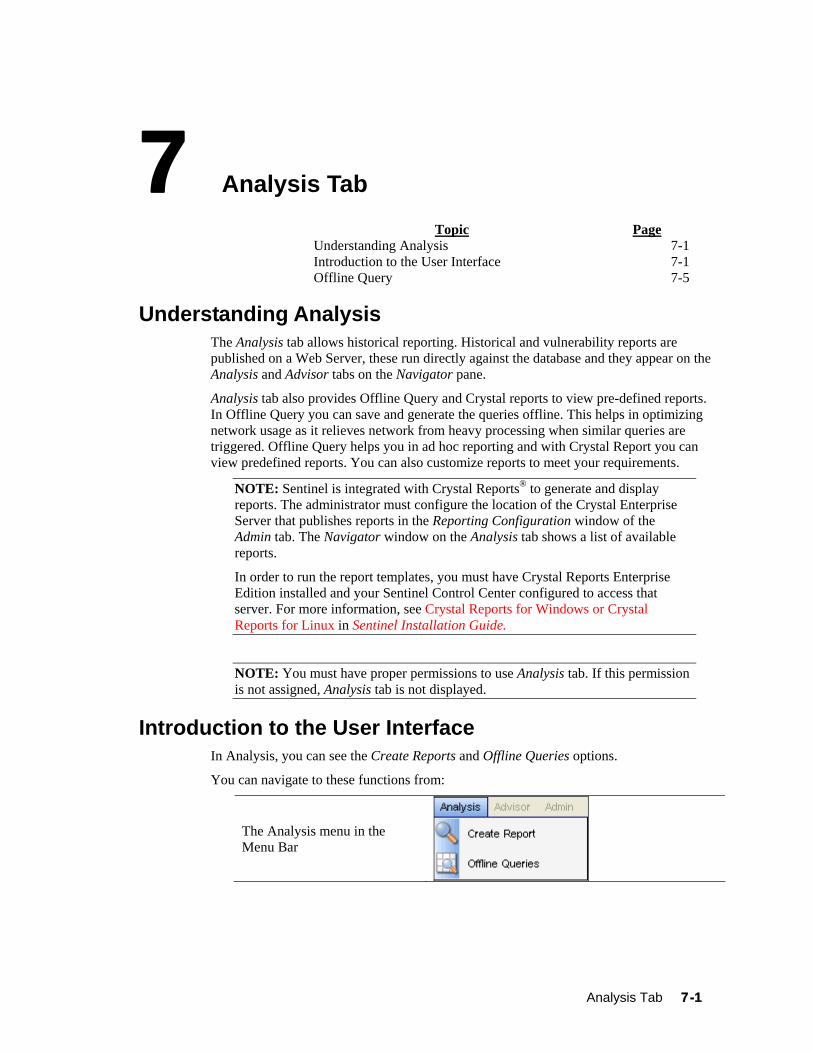
7 Analysis Tab
Topic Page
Understanding Analysis 7-1Introduction to the User Interface 7-1Offline Query 7-5
Understanding Analysis The Analysis tab allows historical reporting. Historical and vulnerability reports are published on a Web Server, these run directly against the database and they appear on the Analysis and Advisor tabs on the Navigator pane.
Analysis tab also provides Offline Query and Crystal reports to view pre-defined reports. In Offline Query you can save and generate the queries offline. This helps in optimizing network usage as it relieves network from heavy processing when similar queries are triggered. Offline Query helps you in ad hoc reporting and with Crystal Report you can view predefined reports. You can also customize reports to meet your requirements.
NOTE: Sentinel is integrated with Crystal Reports® to generate and display reports. The administrator must configure the location of the Crystal Enterprise Server that publishes reports in the Reporting Configuration window of the Admin tab. The Navigator window on the Analysis tab shows a list of available reports.
In order to run the report templates, you must have Crystal Reports Enterprise Edition installed and your Sentinel Control Center configured to access that server. For more information, see Crystal Reports for Windows or Crystal Reports for Linux in Sentinel Installation Guide.
NOTE: You must have proper permissions to use Analysis tab. If this permission is not assigned, Analysis tab is not displayed.
Introduction to the User Interface In Analysis, you can see the Create Reports and Offline Queries options.
You can navigate to these functions from:
The Analysis menu in the Menu Bar
Analysis Tab 7-1

The Navigation Tree in the Navigation Pane
The Toolbar Buttons
Table 7-1: Analysis Tab -User Interface
Top Ten Reports The following are the Top 10 reports which are available in Sentinel 6:
Top 10 Correlation Rules Triggered Top 10 Destination Host Names Top 10 Destination IP Addresses Top 10 Destination Port Numbers Top 10 Destination User Names Top 10 Destination Event Names Top 10 Destination Source Host Names Top 10 Destination Source IP Addresses Top 10 Destination Source to Destination IP Pairs Top 10 Destination Source User Names Top 10 Virus Names Event Count by Top 10 Assets Event Count by Top 10 Departments Event Count by Top 10 Taxonomy Level Incidents by Top 10 Assets Incidents by Top 10 Users
The Top 10 reports are enabled by default, and the following summaries are turned on to enable the Top 10 reports:
EventDestSummary EventSevSummary EventSrcSummary
If Top 10 reports are not needed, you can disable these summaries, or you can enable additional summaries in order to use them for reporting. If the summary service is not in use, you can disable it.
To enable/disable Aggregation:
1. In Sentinel Control Center, go to Admin > Server Views. 2. Right-click DAS Aggregation and select Start/Stop to enable/disable Aggregation.
7-2 Sentinel User Guide

To enable/disable summaries:
1. In Sentinel Control Center, go to Admin > Reporting Data. 2. Highlight the Summary to enable/disable and click the status (Active/Inactive) of
that summary.
Figure 7-1: Reporting Data window
3. Select Yes to confirm that you want to change the status of the summary.
To enable or disable EventFileRedirectService:
1. At your DAS machine, using text editor, open: For UNIX:
$ESEC_HOME/config/das_binary.xml
For Windows:
%ESEC_HOME%\config\das_binary.xml
2. For EventFileRedirectService, change the status to on or off, as appropriate. For example:
<property name="status">off</property>
3. Log into the Sentinel Control Center as the Sentinel Administrator. 4. Go to Admin > Servers View.
Analysis Tab 7-3

Figure 7-2: Servers View
5. Right-click DAS_Binary and select Restart.
Running a Report from Crystal Reports To run a report:
1. Click the Analysis tab. 2. In the Analysis Navigator, click a report from the available reports.
NOTE: To run any Top 10 reports, aggregation must be enabled and “EventFileRedirectService” in DAS_Binary.xml must be set to on. For information on how to enable aggregation, see Reporting Data section in “Administration Tab” section.
3. Click Analysis > Create Report or click Create Report.
4. Complete the information prompts and click OK. The report displays.
Running an Event Query Report To create an Event Query report:
1. Click the Analysis tab. 2. In the Analysis Navigator, open the Historical Events folder. 3. Click Historical Event Queries. 4. Click Analysis > Create Report or click Create Report icon. An Event Query
window displays. 5. Set the following:
time frame filter severity level
7-4 Sentinel User Guide

batch size (this is the number of events to view – events display from oldest events to newer events)
6. Click Begin Searching. 7. To view the next batch of events, click More results icon. 8. Rearrange the columns by dragging and dropping them and arrange the sort order
by clicking in the column heading. 9. When your query is complete, it is added to the list of quick queries in the
Navigator.
Offline Query Offline Query is most often used to run queries against large amounts of data. Offline Query will continue to run even after the user logs out of the Sentinel Control Center, if necessary.
NOTE: You can view the result of your query only after it is completely processed.
After the query has completely finished processing, the results are available to the user who initiated the Offline Query and other Sentinel users with the same security filter. When you attempt to browse or save the result as HTML or CSV, the data is transferred from the server to the local machine running the Sentinel Control Center.
NOTE: The Offline Query generates 100000 result sets only. This limitation prevents database and Active Browser from slowing down. For better results, you must specify a better filter or a smaller time range when creating an Offline Query.
Creating an Offline Query To create an Offline Query:
1. Click Analysis on the Menu Bar. The Offline Query window displays. Alternatively, you can click Offline Query button on the Tool Bar.
2. In the Offline Query window, Click Add button located on the top left corner of the screen. The Add Offline Query window displays.
Figure 7-3 : Add Offline Query window
Analysis Tab 7-5

7-6 Sentinel User Guide
3. Provide a Query Name. Select an existing filter to be used for generation of offline query. For more information on the selection and creation of filters see “Active Views” section.
4. Select the Start Date and End Date for which you want to generate an offline query.
5. Specify the description in the Description Tab. 6. Click OK. The Offline Query gets listed in the Offline Query window.
Viewing, Exporting or Deleting an Offline Query To view, export or delete an Offline Query:
1. Click Analysis on the Menu Bar. The Offline Query window displays. Alternatively, you can click Offline Query button on the Tool Bar.
2. In the Offline Query window, select an offline query. The following options are available: Browse: Click Browse to view the output of the Offline Query in the Active
Browser window. CSV: Click CSV to generate a Comma Separated Value file with the queried
information. HTML: Click HTML to generate an HTML file with the queried information. Delete: Click Delete to delete the Offline Query. Confirmation message alert
displays. Click Yes to delete. Details: Click Details to view the details of the Offline Query as specified
when adding the Query.
8 Advisor Usage and Maintenance
Topic Page
Understanding Advisor 8-1Installing Advisor 8-2Maintaining Advisor 8-3Changing the Scheduled Data Update Time 8-5
Understanding Advisor Advisor is an optional subscription service that provides device-level correlation between real-time events from intrusion detection and prevention systems and enterprise vulnerability scan results. By providing normalized attack information, Advisor acts as an early warning service to detect attacks against vulnerable systems. It also provides associated remediation information.
NOTE: You must also have the optional Advisor license in order to view the tab correctly. Otherwise a notification displays that you are not licensed for Advisor. In addition, access to the Advisor tab is controlled by the administrator on a user-by-user basis.
The Advisor data feed is updated on a regular basis as new attacks and vulnerabilities are reported. It contains two types of data:
Alert Data: Information relating to known security vulnerabilities and threats Attack Data: Normalization of intrusion detection signatures and vulnerability
scanning plug-ins
The following intrusion detection and intrusion prevention systems are supported by Advisor:
Cisco Secure IDS Cisco IOS Firewall Enterasys Dragon Host Sensor Enterasys Dragon Network Sensor Intrusion.com (SecureNet_Provider) ISS BlackICE PC Protection ISS RealSecure Desktop ISS RealSecure Network
ISS RealSecure Server Sensor ISS RealSecure Guard Sourcefire Snort/Phalanx Symantec Network Security 4.0
(ManHunt) Symantec Intruder Alert McAfee IntruShield
The following enterprise vulnerability scanners are supported by Advisor:
eEYE Retina Foundstone Foundscan ISS Database Scanner ISS Internet Scanner ISS System Scanner
ISS Wireless Scanner Nessus nCircle IP360 Qualys QualysGuard
Advisor Tab 8-1
Installing Advisor Advisor installation is explained in detail in the Sentinel installation guide. For more information, see Advisor Configuration in Sentinel Installation Guide.
Viewing Advisor Data Advisor data can be viewed in two ways: by right-clicking on an event with an attack signature, or by running reports from the Advisor tab of the Sentinel Control Center.
NOTE: Until the initial data feed is completely loaded, Advisor will not be fully functional.
Viewing Advisor Data using Right-Click Menu Option To View Advisor Data:
1. You can view using right-click menu options from: Active Views Tab
Click Active Views tab. Incidents
Click Incidents tab. In the Events tab, the associated events display.
Analysis Offline Query a. Click Analysis Tab. b. Go to Offline Query and highlight a Query and click Browse. c. Event grid displays in Active Browser. Analysis Historical Query
Click Analysis Tab > Historical Query. Event Grid displays in the Query tab and the Active Browser Tab.
2. Select and right-click an event or a set of events from the Event Grid. 3. From the right-click menu options, select Analyze > Advisor data. 4. A new window with Advisor data displays.
NOTE: The right-click function will not be fully operational until the first download of Advisor data has been fully loaded into the database.
NOTE: You can analyze Advisor data only if the selected event are from the intrusion detection systems (IDS's) supported by Advisor.
NOTE: Data in Advisor database must be up-to-date for accurate results.
Running Advisor Reports To create an Advisor report:
1. Click the Advisor tab. 2. In the Advisor Navigator, click a report template. 3. Click Advisor > Create Report. 4. Complete the information in the template and click View Report.
8-2 Sentinel User Guide

Maintaining Advisor Several maintenance tasks for Advisor that are described in the Sentinel installation guide:
Updating Advisor data: To be effective, the Advisor data must be updated on a regular basis as new attacks and vulnerabilities are added to the data feed. The Advisor data feed can be configured to run regularly scheduled updates, or it can be updated manually.
Changing the password Advisor uses for automatic data updates Changing the configuration for Advisor notification emails Changing the scheduled update time
Updating Data in Advisor Tables The Advisor data feed is updated on a regular basis as new vulnerabilities are reported. It contains two parts:
Alert Data: Information relating to known security vulnerabilities and threats Attack Data: Normalization of intrusion detection signatures and vulnerability
scanning plug-ins
To update Advisor, new datafiles need to be downloaded from Novell’s Advisor server and loaded into the Sentinel database on a regular basis. This update process depends on whether Advisor was installed with the Standalone or Direct Internet Download option.
Advisor Updates with Standalone Installation If you have selected Standalone Installation of Advisor in the Sentinel installer, follow the procedure given below to update Advisor data manually.
NOTE: Novell recommends that you install the latest service pack for Sentinel. However, if you still use Sentinel 6.0 SP1 or below, the manual update procedures are different. For more information, see “Advisor Tab” section. The instructions below apply to Sentinel 6.0 SP2 and above.
To update Advisor feed manually:
1. Go to the following URL and provide your Novell eLogin username and password. https://secure-www.novell.com/sentinel/advisor/advisordata
NOTE: The Novell eLogin username and password must be associated with the optional Advisor license.
2. Download the .zip files for all data since the previous download. 3. Place the new feed data files (zip files) on your computer.
NOTE: Do not place the zip file in the attack and alert directories.
4. Unzip the data feed .zip files to the location specified during install for Advisor data files.
5. Run the following command: For Windows:
advisor.bat
For UNIX:
./advisor.sh
Advisor Tab 8-3

NOTE: advisor.sh and advisor.bat updates the database and then deletes the attack and alert files that were unzipped into the attack and alert directories.
Advisor Updates with Direct Internet Download Installation If you select the Direct Internet Download installation of Advisor in the Sentinel installer, data updates will take place automatically on a scheduled basis. However, to force an update, you can use the following procedure.
To update Manual Advisor Feed – Direct Internet Download:
1. Go to the following directory: For Windows:
%ESEC_HOME%\bin
For UNIX:
$ESEC_HOME/bin
2. Run the following command: For Windows:
advisor.bat
For UNIX:
./advisor.sh
NOTE: advisor.sh and advisor.bat updates the database and then deletes the attack and alert files that were unzipped into the attack and alert directories.
Resetting Advisor Password (Direct Download Only) If you are running Advisor in Direct Download mode and you’ve obtained a new Advisor password or the Advisor password you set during installation was incorrect, you must update the encrypted Advisor eLogin password stored in Advisor’s configuration file. This procedure must also be performed if the .keystore file is updated with a new encryption key.
NOTE: This procedure is required if you update Advisor from Sentinel 6.0 SP1 or below to Sentinel 6.0 SP2 or above because of changes in the Advisor authentication.
There is no need to update the password if you are running Advisor in a Standalone configuration. In this mode, the password is provided manually and not stored in a file.
To reset the password for automatic Advisor downloads:
1. For UNIX, log into the machine where Advisor is installed as the Sentinel Administrator User (esecadm by default). For Windows, login as a user with administrative rights.
2. Go to the following location: For UNIX:
$ESEC_HOME/bin
For Windows:
8-4 Sentinel User Guide

%ESEC_HOME%\bin
3. Execute the following command: For UNIX:
./adv_change_passwd.sh <newpassword>
For Windows:
adv_change_passwd.bat <newpassword>
where <newpassword> is the updated Advisor password.
Changing the Advisor Email Configuration If an email server is configured, Advisor sends a notification if there is an error in the data loading process. Depending on the installation settings, Advisor might also send notifications for successful Advisor updates. The “to” and “from” addresses can be changed in the configuration files for Advisor.
To change your Advisor server email configuration:
1. For UNIX, log in as Sentinel Administrator User. For Windows, log in with administrative rights.
2. Go to: For UNIX:
$ESEC_HOME/config
For Windows:
%ESEC_HOME%\config
3. Open advisor_client.xml in a text editor and make changes to the highlighted areas shown below in both files.
<property name="advisor.mail.from">[email protected]</property>
<property name="advisor.mailto.list">[email protected]</property>
NOTE: To send messages to more than one address, provide email addresses as comma separated, without spaces.
Changing the Scheduled Data Update Time When installing Advisor in Direct Download mode, the administrator can select to update Advisor on a 6-hour or 12-hour schedule. By default, the data update times are:
Six Hour: 01:00, 07:00, 13:00 and 19:00 Twelve Hour: 02:00 and 14:00
To change the Advisor scheduled update times:
1. Login to your Advisor machine (In UNIX, log in as Sentinel Administrator User and in Windows log in with administrative rights.).
2. To edit your data feed times: For UNIX: Use the “crontab” command
Advisor Tab 8-5

8-6 Sentinel User Guide
For Windows: Use the Scheduled Tasks utility under Control Panel to edit the Sentinel_Advisor task.

9 Event Source Management
Topic Page
Understanding Event Source Management 9-1Introduction to the User Interface 9-2Plug-in Repository 9-8Live View 9-9Components of Event Source Hierarchy 9-13Adding Components to Event Source Hierarchy 9-15Collectors 9-15Export Configuration 9-31Import Configuration 9-33Event Source Management Scratchpad 9-36Comparison between Sentinel 5.x and Sentinel 6.0 9-36
Understanding Event Source Management Event Source Management (ESM) panel provides a set of tools to manage and monitor connections between Sentinel and its event sources.
NOTE: You need to have appropriate permissions to access this tab. Only an Administrator has controls to enable/disable access to the ESM panel for a user.
The Event Source Management tools available in the ESM panel include the following:
Graphical and Tabular views of the configuration of connections to event sources with the real-time status of these connections overlaid.
Configuration wizard to assist the user in adding and editing connections to event sources.
Various other tools that allow the user to investigate the status of connections to event sources, monitor the data flowing through them, and debug Collectors.
Export and import configuration wizards that allow the user to export their configuration to a file and later import it back.
Through ESM, you can:
Add/edit connections to event sources using Configuration wizards. View the real-time status of the connections to event sources. Import/export configuration of event sources to or from Live View/Scratchpad. Import/export Connectors and Collectors from or to a centralized repository Monitor data flowing through the Collectors and Connectors Debug Collectors Design, configure and create the components of the Event Source Hierarchy, and
execute required actions using these components. For more information, see “Live View and Scratchpad”.
Event Source Management 9-1
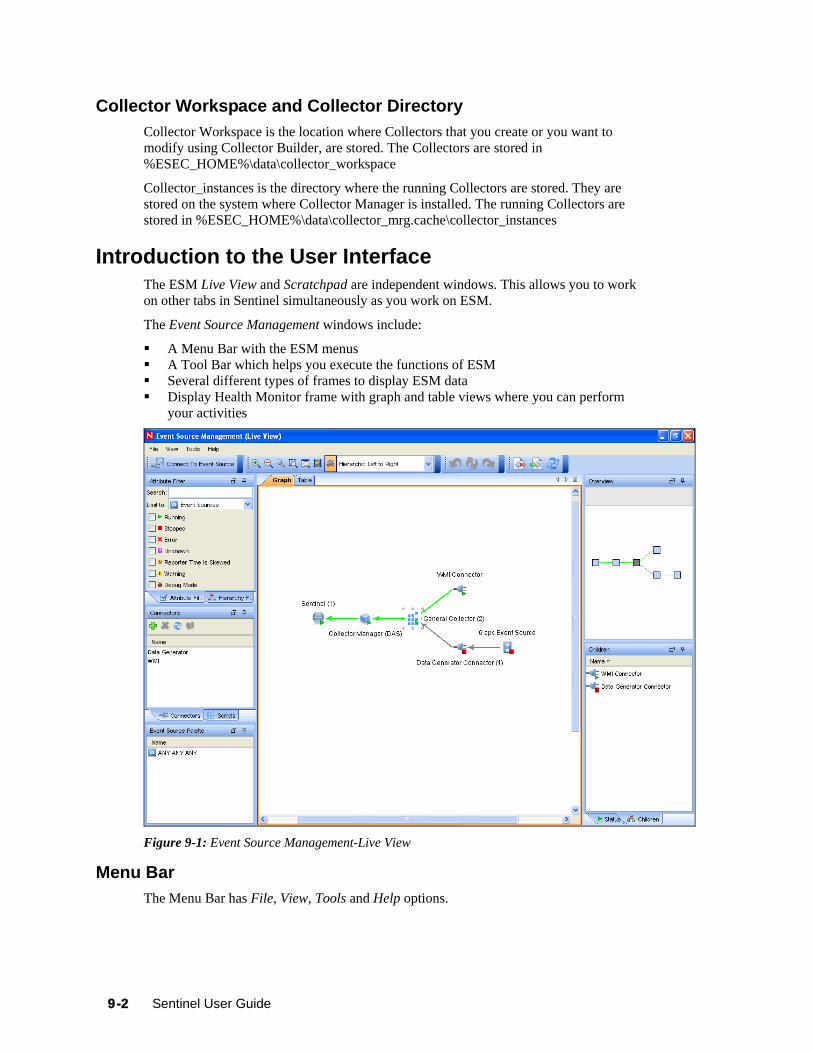
Collector Workspace and Collector Directory Collector Workspace is the location where Collectors that you create or you want to modify using Collector Builder, are stored. The Collectors are stored in %ESEC_HOME%\data\collector_workspace
Collector_instances is the directory where the running Collectors are stored. They are stored on the system where Collector Manager is installed. The running Collectors are stored in %ESEC_HOME%\data\collector_mrg.cache\collector_instances
Introduction to the User Interface The ESM Live View and Scratchpad are independent windows. This allows you to work on other tabs in Sentinel simultaneously as you work on ESM.
The Event Source Management windows include:
A Menu Bar with the ESM menus A Tool Bar which helps you execute the functions of ESM Several different types of frames to display ESM data Display Health Monitor frame with graph and table views where you can perform
your activities
Figure 9-1: Event Source Management-Live View
Menu Bar The Menu Bar has File, View, Tools and Help options.
9-2 Sentinel User Guide

Figure 9-2: Event Source Management-Menu Bar
The following are the options available in the each of the Menu Bar options which are described in the document:
File Export Configuration Import Configuration Save Preferences Close
View Reset Layout Redo Layout Undo Layout
Tools Connect to Event Source Import plug-in
Help About Help
These options allow you to perform a set of actions mentioned below:
Tool Bar Launch the wizard for connecting to a new Event Source
Import/Export & Reload Event Source Management Configurations and plugging
The tool bar contains several tools for displaying objects in ESM. You can zoom the entire Graphical view in and out, or zoom directly to a selected region. The Magnifying Glass allows you to enlarge the text and icons for a small portion of the Graphical view without affecting the overall zoom level. The Fit to Screen option adjusts the ESM view to fit the screen.
Event Source Management 9-3

You can select from several different layouts to display the objects in ESM. You can also enable/disable animations during transition from one layout to the other in the Graphical view of the Health Monitor Display.
You can reset to the default settings too.
Table 9-1: Event Source Management -User Interface
Zoom In ESM, you can use Magnifying Glass to zoom into a region.
TIP:
To enable/disable magnifying glass in ESM, use the local zooming using a Magnifying Glass button on the toolbar.
Hot Keys: You can increase or decrease the magnification factor with the following key combinations:
To increase or decrease the size of magnification glass cursor:
To increase: Ctrl key + Backward scrolling of the Mouse wheel To decrease: Ctrl key + Forward scrolling of the Mouse wheel
To increase or decrease the zooming of the nodes:
To Zoom in: Forward movement of the Mouse wheel To Zoom out: Backward movement of the Mouse wheel
NOTE: Magnification glass is available only in the Graphical View of ESM window.
Frames You can see the following Frames in the Live View or Scratchpad window.
Attribute Filter The Attribute Filter allows you to display the components of ESM. You can specify the components to be displayed based on the component name and status.
9-4 Sentinel User Guide

Figure 9-3: Attribute Filter frame Text Filter: It allow you to filter the nodes that are displayed in the graphical and
tabular view based on the text they type in. State Filter: It allows you to filter the nodes that are displayed in the graphical and
tabular view based on the current state of the node.
Hierarchy Filter The Hierarchy filter sets the display based on the hierarchy you select in this frame. It allows the user to filter the nodes that are displayed in the graphical and tabular view based on the node hierarchy. All children and parents of selected nodes are shown.
Figure 9-4: Hierarchy Filter frame
To set Hierarchy filter for displaying components:
1. In Sentinel Control Center, click the Event Source Management in the menu bar and select Live View or Scratch Pad.
2. Click the Hierarchy Filter frame. 3. Select the Hierarchy Level to display the components.
Connectors Connectors are plug-ins in Sentinel. Importing a Connector implements the Connector mechanism in the system. Connectors frame allows you to Add, Remove, and Refresh connectors and Add auxiliary file in the system.
Event Source Management 9-5

Figure 9-5: Connector frame
Add Add Connectors to the system.
Delete Delete Connectors.
Refresh Refreshes the list.
Add Auxiliary Files
Add Auxiliary Files. For more information, see “Add Auxiliary Files”
Table 9-2: Connector frame Icons
To add Connector Plug-ins:
1. In Sentinel Control Center, click the Event Source Management in the menu bar and select Live View or Scratch Pad.
2. Click the Script or Connectors frame. You can plug-in connectors from here. For more information, see “Add Plug-In”.
Scripts Collectors are plug-ins in Sentinel. The Collector Script plug-in adds the ability to parse raw data from an event source. Scripts frame allows you to import plugins, remove Collectors, refresh the list of Collectors and add auxiliary files in the system.
Figure 9-6: Scripts frame
Add Add Scripts to the system.
Delete Delete Collectors.
9-6 Sentinel User Guide

Refresh Refreshes the list.
Add Auxiliary Files
Add Auxiliary Files. For more information, see “Add Auxiliary Files”.
Table 9-3: Scripts frame Icons
To add Collector Plug-ins:
1. In Sentinel Control Center, click the Event Source Management in the menu bar and select Live View or Scratch Pad.
2. Click the Script or Connectors frame. You can plug-in Collectors from here. For more information, see “Add Plug-In”.
Event Source Palette This frame displays the list of Devices or Event Sources supported by the existing Collectors in the Central Repository.
Figure 9-7: Event Source Palette
Children This frame displays names of immediate children nodes of a parent (main) node when you click the parent node. This frame is useful to manage children of nodes which have been contracted in the Graphical View. To perform any action in ESM, right-click a component and select from options listed. For more information, see “Right-click Menu”.
Figure 9-8: Children frame
Status Details This frame displays the status details of a selected component in the Health Monitor Display frame.
Event Source Management 9-7

Available status information includes the current state, the number bytes processed, the number of records sent, the number of Sentinel™ Events sent, and various other status and statistical information.
NOTE: The status information varies based on the type of component that is selected.
Figure 9-9: Status Details frame
Overview The overview frame allows you to quickly move across the graphical view. This is particularly useful when there are a lot of objects in the screen.
Figure 9-10: Overview frame
Plug-in Repository A plug-in is a package of code that provides additional functionality to Sentinel and the most common plug-ins are Collector Scripts and Connectors. Implementing these features as plug-ins allows Novell to deliver enhancements to our event collection system without the need to deliver a new version of the Sentinel platform.
9-8 Sentinel User Guide
Collector Script: The Collector Script plug-in adds the ability to parse raw data from an Event Source. This is similar to the Collector Script in Sentinel 5, however in Sentinel 6 the plug-in also provides additional meta-data to enable the ESM panel to prompt the user for parameter values as well as enable ESM to automatically select supported connection methods that work well with the Collector Script. This meta-data is added to the Collector Script plug-in by the plug-in developer.
Connector: In Sentinel 6, all Connectors are pluggable. A Connector plug-in contains both the implementation of the connection mechanism as well as the GUI screens needed to configure the Connector. This allows for a user to easily add additional Connectors to Sentinel.
Hot Fixes and New Functionality: In the future, some Sentinel enhancements and defect fixes might be available as plug-ins.
After you import a plug-in into Sentinel, it is centrally stored in the Plug-in Repository. The appropriate Sentinel components on other machines, automatically starts using the plug-in.
Auxiliary Files Some plug-ins such as database Connectors, require one or more auxiliary files in order to function. Auxiliary files are any such files that can not be included with the standard plug-in files such as user-specific configuration file or third party libraries that require specific licenses.
To add an Auxiliary File to a specific plug-in:
1. Select the plug-in to which the Auxiliary file will be added and then click Add Auxiliary File.
2. A wizard guides users through the process of importing the Auxiliary file.
Live View The ESM panel provides the main user interface to Event Source Management. You can view configuration data in Graphical or Tabular view.
Graphical ESM View The Graphical view of ESM is the default view in Event Source Management. In Graphical view, you can view the status of a Collector and access the configuration settings of Collectors and Collector related objects as a graph of connected nodes.
Event Source Management 9-9

Figure 9-11: Graphical View
By default, the Health Monitor Display frame displays in the Graphical View. The data can be displayed in seven different layouts. The default layout in graph is the “Hierarchic Left to Right” layout. You can change between these layouts by selecting the layout format from the drop-down list in the Tool Bar.
Figure 9-12: Layout Selection
TIP:
Click in the Graphical ESM view and use “+” or “-”sign to zoom in or zoom out. Alternatively use mouse wheel to zoom in and zoom out.
In the Graphical View, the lines connecting the components are color-coded to indicate data flow.
Green Line: Indicates data is flowing between the components. Grey Line: Indicates the connection is not live and there is no data flow. Blue dashed Line: Indicates the logical relation of Event Source Servers to their
associated Collector Managers and Event Sources.
The terminology used for nodes are:
Parent Node: A Node from which child nodes originate Immediate Children: The sub nodes that are logically and functionally linked to a
Parent Node.
9-10 Sentinel User Guide

Collapsed/Expanded nodes: To improve the manageability and performance of the Graphical display, Sentinel automatically contracts any node with 20 or more immediate children. This is especially useful for Connectors such as Syslog or Novell Audit that have the ability to automatically configure a large number of event sources.
TIP:
Collapsed Nodes are identified by a “-” sign on the node and Expanded Nodes by “+” sign.
Double-click a node to expand or collapse.
In collapsed state, a node displays the number of immediate children next to the node; for example, WMI Connector (3) [Collector name (Number of immediate children)]. The “Children” panel of a contracted node shows the immediate children of that node, each of which can be managed in the same way as nodes in the Tabular ESM View.
NOTE: Event Source Server node do not have “+” or “-” sign after its name even if it contains children.
Double-clicking a parent node changes the state from collapsed to expanded and vice versa. Double-clicking a node with no children displays the status details for that node. If an additional node is added to an expanded parent with over 20 children the node is contracted automatically. If an additional node is added to a manually expanded parent with over 20 children the node will not be contracted automatically.
The parent node can take several minutes to expand if the parent node has a large enough number of child nodes to potentially cause the UI to become unresponsive; an alert message displays on the user interface to warn you about the delay in response. Click Yes to continue.
Figure 9-13: Expand Selected Node prompt
If you chose not to show this message again, the preferences are saved on that machine and any user logging into Sentinel from that machine will not get an alert again.
Tabular ESM View The components visible in the Graphical view of ESM can also be viewed in tabular format. In Tabular view, you can view the status of a Collector in a table and access the configuration settings of Collectors and Collector related objects.
Event Source Management 9-11

Figure 9-14: Tabular View
The columns in the ESM Tabular View are:
Configured Status: The On state the object is configured to be in. This is the state that is stored in the database and do not necessarily match the actual On state of the object. For example, the two states will not match if a parent object is turned off or if there is an error.
Actual Status: The On state of the object as being reported by the actual running Collector Manager.
Connection Info (populated for Event Sources only): A textual description of the Event Source connection.
Error: A textual description of an error that occurred in the running object.
TIP:
Use the Table/Graph tabs to change to Tabular/Graphical views.
Right-click Menu The Health Monitor Display View provides a set of right-click menus that helps you execute a set of actions, as described below:
NOTE: The right-click actions available depend on the kind of object you clicked on.
Status Details: You can view all information known about the status of the selected object.
Start: You can set the object to be running.
NOTE: The selected object will only start after the parent nodes starts and its running.
Stop: You can stop the running object. Edit: You can modify the editable information (Filter information, Object name and
so on) with this option. Debug: You can debug the Collector. You must stop the running Collector before you
debug it. Move: You can move the selected object from its current parent object to another
parent object. You can move objects between the views that is live view to scratchpad and vice versa.
Clone: You can create a new object that has its configuration information pre-populated with the settings of the currently selected object. This allows you to quickly create a large number of similar Event Sources without having to retype in the same information over and over again. You can clone objects between the views that is live view to scratchpad and vice versa. Cloning an object Copies all the settings except the “Run” status. New objects created using the Clone command will always be in the Stopped state after creation.
9-12 Sentinel User Guide

Remove: You can delete a selected object from the system. Contract: Contract the child nodes into this node. This option is only available on
parent nodes that are currently in an expanded state. Expand: Expand the child nodes of this node. This option is only available on parent
nodes that are currently in a contracted state. Add Collector: It allows you to open an Add Collector wizard that guides you
through the process of adding a Collector to the selected Collector Manager. Add Connector: It allows you to open an Add Connector wizard that guides you
through the process of adding a Connector to the selected Collector. Add Event Source: It allows you to open an Add Event Source wizard that guides
you through the process of adding an event source to the selected Connector. Open Raw Data Tap: You can view the live stream of raw data from an Event
Source or flowing through the selected object. Open Active View: You can open Active View window that only displays events that
have been generated by data from or flowing through the selected object. Zoom: You can zoom in the graphical view display on the selected object. Show in Tabular/Graphical View: You can switch over to the other view (to tabular
view if on graphical view, or to graphical view if on tabular view) and automatically selects the object that is selected in the current view. When switching to graphical view, it also zooms in on the selected object.
Raw Data Filter: It allows you to filter the raw data flowing through the selected node. The raw data filter is available on Collectors, Connectors, and Event Sources. If a filter is specified to drop data, the data to be dropped will not be passed to the parent node and, therefore, will not be converted into events.
Import Configuration: You can import the configuration of ESM objects. Export Configuration: You can export the configuration of ESM objects Add Event Source Server : It allows you to add Event Source Server to the selected
Collector Manager Add Collector Manager: In Scratchpad mode, you can add a Collector Manager to
the scratchpad by using this option. In the Live view, Collector Manager objects are created automatically as each Collector Manager connects to the Sentinel system.
When you select multiple objects in the ESM panel and right click. The following options are available:
Start: To start all the objects Stop: To stop all the objects Remove selected objects: To remove the selected objects along with its children
TIP:
Press “Shift” and click the object to select multiple objects.
Components of Event Source Hierarchy ESM displays the information on the Collectors and other components in a hierarchy specific to ESM.
Figure 9-15: ESM Hierarchy
NOTE: ESM allows you to add Collector, Event Source and Connector.
Event Source Management 9-13
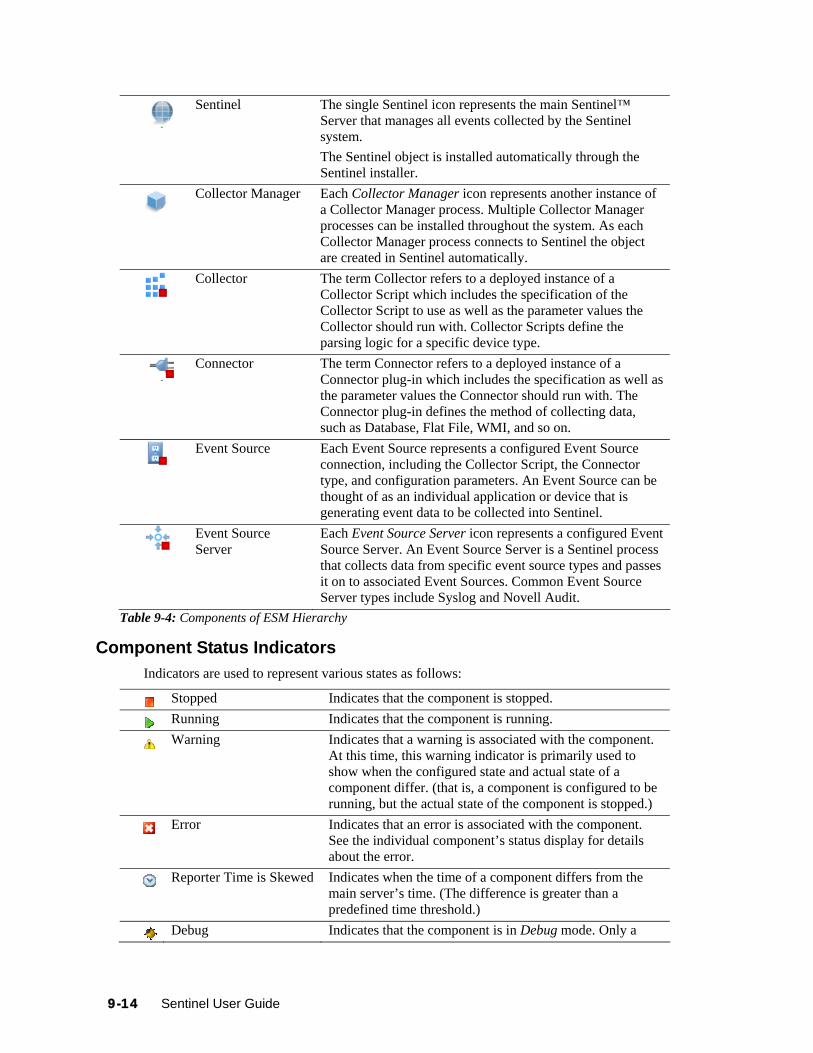
Sentinel The single Sentinel icon represents the main Sentinel™
Server that manages all events collected by the Sentinel system. The Sentinel object is installed automatically through the Sentinel installer.
Collector Manager Each Collector Manager icon represents another instance of
a Collector Manager process. Multiple Collector Manager processes can be installed throughout the system. As each Collector Manager process connects to Sentinel the object are created in Sentinel automatically.
Collector
The term Collector refers to a deployed instance of a Collector Script which includes the specification of the Collector Script to use as well as the parameter values the Collector should run with. Collector Scripts define the parsing logic for a specific device type.
Connector The term Connector refers to a deployed instance of a
Connector plug-in which includes the specification as well as the parameter values the Connector should run with. The Connector plug-in defines the method of collecting data, such as Database, Flat File, WMI, and so on.
Event Source
Each Event Source represents a configured Event Source connection, including the Collector Script, the Connector type, and configuration parameters. An Event Source can be thought of as an individual application or device that is generating event data to be collected into Sentinel.
Event Source Server
Each Event Source Server icon represents a configured Event Source Server. An Event Source Server is a Sentinel process that collects data from specific event source types and passes it on to associated Event Sources. Common Event Source Server types include Syslog and Novell Audit.
Table 9-4: Components of ESM Hierarchy
Component Status Indicators Indicators are used to represent various states as follows:
Stopped Indicates that the component is stopped.
Running Indicates that the component is running.
Warning
Indicates that a warning is associated with the component. At this time, this warning indicator is primarily used to show when the configured state and actual state of a component differ. (that is, a component is configured to be running, but the actual state of the component is stopped.)
Error Indicates that an error is associated with the component. See the individual component’s status display for details about the error.
Reporter Time is Skewed Indicates when the time of a component differs from the main server’s time. (The difference is greater than a predefined time threshold.)
Debug Indicates that the component is in Debug mode. Only a
9-14 Sentinel User Guide

Collector can be in Debug mode.
Unknown This indicator is displayed when the status of the object in the ESM panel is not yet known.
Table 9-5: Component Status Indicators
To set Attribute filter for displaying components:
1. In Sentinel Control Center, click the Event Source Management in the menu bar and select Live View or Scratch Pad.
2. Click the Attribute Filter frame. 3. Specify the Search and Limit to criteria. 4. Check Running and/or Stopped checkbox to specify the status of the components.
To hide components based on type:
1. In Sentinel Control Center, click the Event Source Management in the menu bar and select Live View or Scratch Pad.
2. Click Attribute Filter frame. 3. Specify the Search and Limit to criteria. 4. Select the component type by which to limit the view.
Adding Components to Event Source Hierarchy Collectors, Connectors and Event Sources can also be added to the system through the right-click menus on the main ESM display.
Collectors To run the Collectors and generate the Events as per your requirements, you need to:
Download Collectors from Novell Collector Download page (http://support.novell.com/products/sentinel/collectors.html).
Import and Deploy Collectors After downloading Collectors, import and deploy the Collectors.
Generate Events Start (Right-click the Collector and select Start) the Collector to generate Events.
Debug Collectors For any errors in the output of a Collector, select the Collector, right-click and
select Debug. For more information, see “Debugging Collectors”.
Edit Collectors To troubleshoot any misbehavior of a Collector, you can edit the Collector. To
edit Collectors, copy the Collector Script to a machine that has Collector Builder installed.
For more information on editing Collectors, see Sentinel Collector Builder User Guide.
Re-Import and deploy Collectors
Adding Connectors/Collector Plug-ins NOTE: When you use the Sentinel Control Center to browse to locate a file on the Desktop of the Collector Manager, clicking Desktop takes you to the Desktop
Event Source Management 9-15
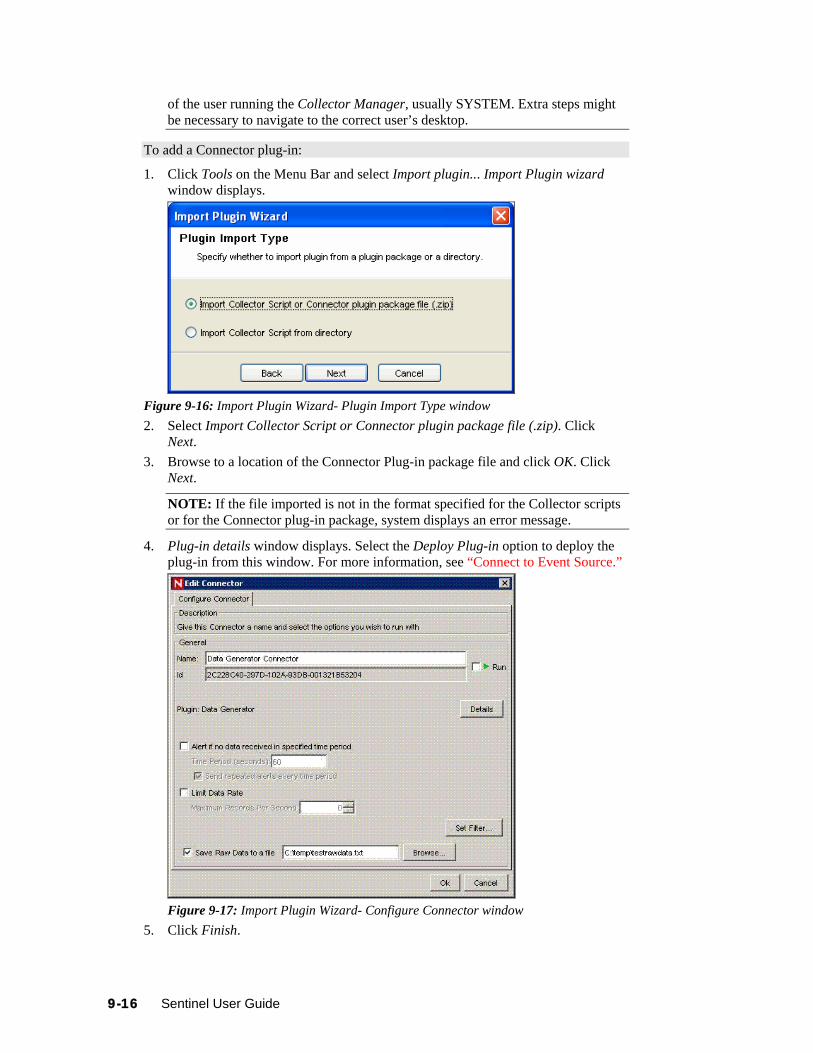
of the user running the Collector Manager, usually SYSTEM. Extra steps might be necessary to navigate to the correct user’s desktop.
To add a Connector plug-in:
1. Click Tools on the Menu Bar and select Import plugin... Import Plugin wizard window displays.
Figure 9-16: Import Plugin Wizard- Plugin Import Type window 2. Select Import Collector Script or Connector plugin package file (.zip). Click
Next. 3. Browse to a location of the Connector Plug-in package file and click OK. Click
Next.
NOTE: If the file imported is not in the format specified for the Collector scripts or for the Connector plug-in package, system displays an error message.
4. Plug-in details window displays. Select the Deploy Plug-in option to deploy the plug-in from this window. For more information, see “Connect to Event Source.”
Figure 9-17: Import Plugin Wizard- Configure Connector window
5. Click Finish.
9-16 Sentinel User Guide

NOTE: When you add a plug-in into Sentinel, it is placed in the Plug-in Repository, which enables Sentinel components on other machines to start using the plug-in without having to add the plug-in separately.
To add a Collector plug-in:
1. Click Tools on the Menu Bar and select Import plugin. Import Plugin Wizard window displays.
Figure 9-18: Import Plugin Wizard- Plugin Import Type window
2. You can select from the two options available in this window. Click Next. 3. If you chose first option, browse to a location of the Collector Script file and click
OK. Click Next. If you chose second option, you are directed to the Collector workspace. Select a Collector Script directory and click Next.
4. Collector Script Detail window displays. a. Click the button next to id field to generate UUID. b. The name and author details are displayed. Edit the details as per your
requirement. Specify Version number. c. Browse and attach the help file.
NOTE: If the help file is not in the plug-in directory, the system prompts to copy the help file to the plug-in directory before import. Click Yes.
d. Provide description and click Next. Supported Devices window displays.
NOTE: You must specify at least one device.
Click Add. The Supported Devices window displays. Provide vendor, name, version, description and click OK. Click Next.
NOTE: Use Edit button to edit the details of a device or use Delete button to delete a device from the list.
5. Plug-in details window displays. Check the Deploy Plug-in option to deploy the plug-in from this window. For more information on deployment procedure, see “Connect to Event Source.”
6. Click Finish.
Updating Connector/Collector Plugins If a new version of a Connector or Collector is released, you can update the Sentinel system and any deployed instances of the Connector or Collector.
Event Source Management 9-17

NOTE: When you use the Sentinel Control Center to browse to locate a file on the Desktop of the Collector Manager, clicking Desktop takes you to the Desktop of the user running the Collector Manager, usually SYSTEM. Extra steps might be necessary to navigate to the correct user’s desktop.
To update a Connector or Collector plug-in:
1. Click Tools on the Menu Bar and select Import plugin…Import Plugin Wizard window displays.
Figure 9-19: Import Plugin Wizard- Plugin Import Type window
2. You can select from the two options available in this window. Click Next. 3. Browse to a location of the Connector or Collector Plug-in package file and click
OK. Click Next.
NOTE: If the file imported is not in the format specified for the Collector scripts or for the Connector plug-in package, system displays an error message.
4. When updating an already-imported Connector or Collector, you are provided with the option of updating the existing plug-in, going back and selecting a different plug-in, or canceling the import. If you want to continue, click Next.
Figure 9-20: Import Plugin Wizard- Replace Existing Plugin window
9-18 Sentinel User Guide

5. Plug-in details window displays. Check the Update Deployed Plugins option to update any currently deployed plugins that use this Connector or Collector.
Figure 9-21: Import Plugin Wizard- Plugin Details window
6. Click View Deployed Plugins to view the Plugins deployed in ESM Live View. The number in parentheses represents the number of instances of this plugin that are currently deployed and configured. The Deployed Plugins window displays the Affected Connectors/Event Sources/Event Source Servers or Affected Collectors. These are the components whose configuration is affected because of adding already existing Connectors/Collectors in ESM. Affected Event Sources/Connectors/Event Source Servers
Figure 9-22: Import Plugin Wizard- Deployed Plugins window
Event Source Management 9-19

Affected Collectors
Figure 9-23: Import Plugin Wizard- Deployed Plugins window Click Finish.
NOTE: When you add a plug-in into Sentinel, it is placed in the Plug-in Repository, which enables Sentinel components on other machines to start using the plug-in without having to add the plug-in separately.
Deploying a Collector To add a Collector:
1. In the main ESM display, locate the Collector Manager to which the new Collector will be associated.
2. Right-click the Collector Manager and select the Add Collector menu item. 3. Follow the prompts in the Add Collector wizard. 4. Click Finish.
NOTE: Collector Script enables the ESM panel to prompt you for parameter values as well as enable ESM to automatically select supported connection methods that work well with the Collector Script.
Deploying a Connector To add a Connector:
1. In the main ESM display, locate the Collector to which the new Connector will be associated.
2. Right-click the Collector and select the Add Connector menu item. 3. Follow the prompts in the Add Connector wizard. 4. Click Finish.
Deploying an Event Source To add an Event Source:
1. In the main ESM display, locate the Connector to which the new Event Source will be associated.
2. Right-click the Connector and select the Add Event Source menu item. 3. Follow the prompts in the Add Event Source wizard. 4. Click Finish.
9-20 Sentinel User Guide

Deploying Event Source Servers Certain Event Source Connectors (such as the Syslog Connector) require a process to collect data from the actual data source. These processes are called “Event Source Servers”. They collect data from the data source and then “serve” it to the Event Source Connector. Event Source Servers must be added and associated to any Event Source Connectors that require a server.
To add an Event Source Server:
1. In the Live View, right-click the Collector Manager and select Add Event Source Server. Select Connector window displays.
Figure 9-24: Add Event Source Sever – Select Connector window
NOTE: To start the Add Event Source Server wizard, locate the Collector Manager on which the Event Source Server process will run.
2. Select a Connector that will support your device and click Next. If you do not have any connectors in the list that will support your device, click Install More Connectors. For more information on installing Connector, see “Add Plug-in”.
3. Configure the various parameters for the server with reference to the Connector selected (For example, Syslog Connector, NAudit Connector, HTTPS Connector and so on.). The configurable parameters are different for the different Connector types. Click Next.
4. Provide a Name for the Event Source Server. If you want this server to be running, select the Run checkbox.
5. Click Finish. In the Health Monitor Display frame, the Event Source Server added here displays with a dashed blue line showing the Collector Manager to which it is associated to.
NOTE: This Add Event Source Server wizard can also be initiated from within the Add Connector wizard if a compatible Event Source Server has not yet been added.
Event Source Management 9-21

Connect to Event Source There are several methods to configure an event source. Event sources can be deployed by right-clicking on an existing Collector Manager, Collector, or Connectors.
To deploy an event source, you need the following components:
Collector Script: Collector scripts can be downloaded from Novell Web site (http://support.novell.com/products/sentinel/collectors.html), copied from a previous Sentinel implementation (4.x or 5.x), or built using Collector Builder
Connector: Connector can be downloaded from Novell Web site (http://support.novell.com/products/sentinel/collectors.html)
Configuration information for the event source
Collector Scripts and Connectors built by Novell can be found on the Novell Web site (http://support.novell.com/products/sentinel/collectors.html).
To connect to the Event Sources:
1. Click Tools on the Menu Bar and select Connect to Event Source. Alternatively, click the Connect to Event Source button on the Tool Bar. Connect to Event Source window displays.
Figure 9-25: Connect To Event Source– Select Event Source window
NOTE: Event Source types for which you currently have compatible Collector parsing scripts are listed here.
2. Select an Event Source from the list to which you want to connect to and collect data from. You can click Add More to import an Event Source. Click Next. Select Collector Script window displays.
9-22 Sentinel User Guide

NOTE: You can open Select Collector Script window by double clicking or dragging a selected event source from the Event Source Palette window.
Figure 9-26: Connect To Event Source– Select Collector Script window
3. Select a Collector script from the list. You can also install additional Collector scripts (click Install More Scripts) that support your Event source, if it is not listed here (For more information on installing a Collector script, see “Add Plug-in”. Click Next. Select Connection Method window displays.
Figure 9-27: Connect To Event Source– Select Connection Method window
Event Source Management 9-23

4. Select a connection method from the list. You can also install additional connectors by clicking on the Install More Connectors button. For more information, see “Add Plug-in” to install connectors. Click Next. Event Source Management window displays.
Figure 9-28: Connect To Event Source–Event Source Management window
5. You can create a new Collector and Connector or you can use an existing Collector or Connector. Select an option and click Next.
NOTE: Based on the existing Collectors and Connectors in your system that is compatible with your new Event Source, one or more of these options might be unavailable.
Create a new Collector and Connector: Select this option to create a new Collector and Connector to manage the Event Source connection. a. After you select this option and click Next, Select Collector Manager
window displays. b. Select the Collector Manager you want to use and click Next. Configure
Collector Property window displays.
9-24 Sentinel User Guide

Figure 9-29: Connect To Event Source– Configure Collector Property window
c. Configure the parameters available and click Next. Configure Collector window displays.
d. Provide the name of the Collector and configure the options.
Figure 9-30: Connect To Event Source– Configure Collector window Check the Run checkbox if you want to run your Collector automatically. Click Details button to see plug-in details. You can set alerts (with repeated option) if no data is received in a specific
period. You can limit the data rate as maximum number of records per second. You can set filter through Set Filter button. You can check Trust Event Source Time to display the Device Time (time when
the event occurred) instead of Event Source Time (time when the event was reported to console).
Event Source Management 9-25

NOTE: If Trust Event Source Time option is selected, then all data flowing through the Collector will have there Event Source Time trusted even if the Event Sources do not have this option selected.
Click Next. The Configure Connector window displays.
Figure 9-31: Connect To Event Source– Configure Connector window
e. Provide the name of the Connector and configure the options. Check the Run checkbox if you want to run your Connector automatically. Click Details button to see plug-in details. You can set alerts (with repeated option) if no data is received in a specific
period. You can limit the data rate as maximum number of records per second. You can set filter through Set Filter button.
Click Next. The Event Source Configuration window displays. Use an existing Collector: Select this option to use an existing Collector and
to create a new Connector to manage the Event Source connection. a. After you select this option and click Next, the Select Collector window
displays. b. Select the Collector you want to use and click Next. The Configure
Connector window displays. c. Provide the name of the Connector and configure the options
Check the Run checkbox if you want to run your Connector automatically. Click Details button to see plug-in details. You can set alerts (with repeated option) if no data is received in a specific
period. You can limit the data rate as maximum number of records per second. You can set filter through Set Filter button.
Click Next. The Event Source Configuration window displays. Use an Existing Connector: Select this option to use an existing Collector
and an existing Connector to manage the Event Source connection. a. After you select this option and click Next, the Select Connector window
displays.
9-26 Sentinel User Guide

Figure 9-32: Connect To Event Source– Select Connector window
b. Select the Connector you want to use and click Next. 6. The Records Per Second window displays. 7. Set the number of records to be transferred per second and click Next. The
General window displays.
Figure 9-33: Connect To Event Source– General window Provide Name of the Event Source. Check the Run checkbox if you want to run your Event Source automatically. Click Details button to see plug-in details.
Event Source Management 9-27

You can set alerts (with repeated option) if no data is received in a specified time interval.
You can limit the data rate as maximum number of records per second. You can check Trust Event Source Time to display the Device Time (time
when the event occurred) instead of Event Source Time (time when the event was reported to console).
You can set filter through Set Filter button. In the Filter window, add/edit the filters and click OK.
8. Click Next. The Summary window displays. Click Test Connection to test the event source. Test Event Source window
displays with Data and Error tabs. The Error tab displays the error message if there is any error in the configuration of event source.
After a few seconds, a sampling of raw data should be received from the Event Source and displayed in the Data tab.
Use the Start and Stop buttons to start or stop the test. Use the “Maximum Rows” component to control the max number of raw data
records to obtain at once.
Figure 9-34: Test Event Source: Data Generator Event Source window You can test the event source in the Test Event Source window. It displays the data in the Data tab and errors in the Errors tab. You can select maximum rows to be displayed and can start and stop the test.
9. Click Finish.
NOTE: The Collector parsing script are executed on the same system as the Collector Manager that you select here.
9-28 Sentinel User Guide

Debugging Collectors In the Debugging Collector window, the left column on the debugger displays the commands for the current script state. The highlighted command is being executed.
The right column on the debugger displays the script’s variables and their current value. The variable list expands as all the script’s variables are used. The variables are color coded to show new variables in blue, changed variables in red, and variables whose value has not changed since the last “Step” as black.
Figure 9-35: Debug Collector window
The Events tab displays the events generated using this Collector and the Upload/Download tab allows you to upload/download another Collector Script file to make modifications.
The debugger has the following four controls:
Run Run the script until the next breakpoint is encountered.
Step Into Step one instruction at a time.
Pause Pause the running script.
Stop Stop the script. Table 9-6: Debugger Icons
Event Source Management 9-29
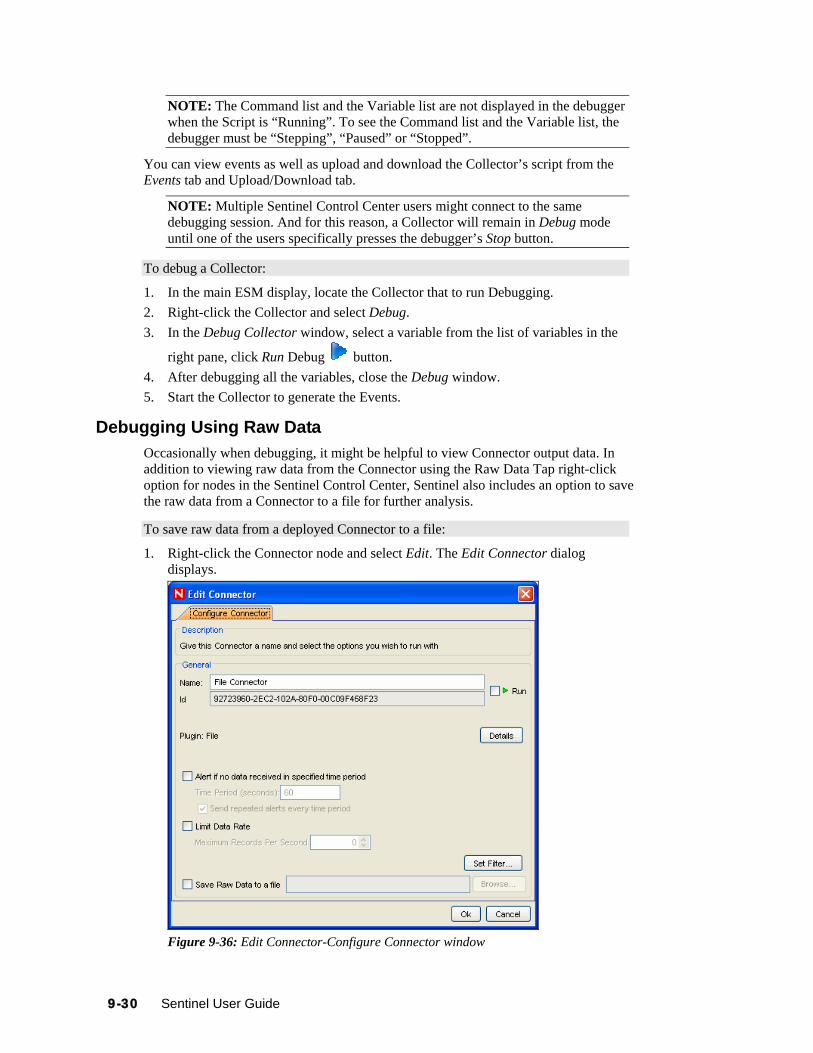
NOTE: The Command list and the Variable list are not displayed in the debugger when the Script is “Running”. To see the Command list and the Variable list, the debugger must be “Stepping”, “Paused” or “Stopped”.
You can view events as well as upload and download the Collector’s script from the Events tab and Upload/Download tab.
NOTE: Multiple Sentinel Control Center users might connect to the same debugging session. And for this reason, a Collector will remain in Debug mode until one of the users specifically presses the debugger’s Stop button.
To debug a Collector:
1. In the main ESM display, locate the Collector that to run Debugging. 2. Right-click the Collector and select Debug. 3. In the Debug Collector window, select a variable from the list of variables in the
right pane, click Run Debug button. 4. After debugging all the variables, close the Debug window. 5. Start the Collector to generate the Events.
Debugging Using Raw Data Occasionally when debugging, it might be helpful to view Connector output data. In addition to viewing raw data from the Connector using the Raw Data Tap right-click option for nodes in the Sentinel Control Center, Sentinel also includes an option to save the raw data from a Connector to a file for further analysis.
To save raw data from a deployed Connector to a file:
1. Right-click the Connector node and select Edit. The Edit Connector dialog displays.
Figure 9-36: Edit Connector-Configure Connector window
9-30 Sentinel User Guide

2. Check Save Raw Data to a file. 3. Specify (or browse to) a path on the Collector Manager machine where the raw
data is saved.
IMPORTANT:
The account running the Sentinel service on the Collector Manager machine must have permissions to write to the file location.
Export Configuration Export configuration helps you export the configuration of ESM objects along with their Collector script and the Connector plugins.
NOTE: You can export any object in the ESM panel. Depending on the object selected, all its children and parent should be displayed in the Select Data window of Export Configuration wizard.
To export your configurations:
1. Go to Menu Bar and click File > Export Configuration or right click an object in the ESM panel and select Export Configuration. Export Configuration window displays.
Figure 9-37: Export Configuration-Select Data window
2. Check the data to export and click Next. Select Collector Scripts window displays.
Event Source Management 9-31

Figure 9-38: Export Configuration-Select Collector Script window
3. Select the Collector scripts from the list to export. You can select or deselect all. Click Next. Select Connectors Plug-in window displays.
Figure 9-39: Export Configuration-Select Connector Plugins window
4. Select the Connector Plug-ins from the list to export. You can select or deselect all. Click Next. Specify Export File window displays.
9-32 Sentinel User Guide
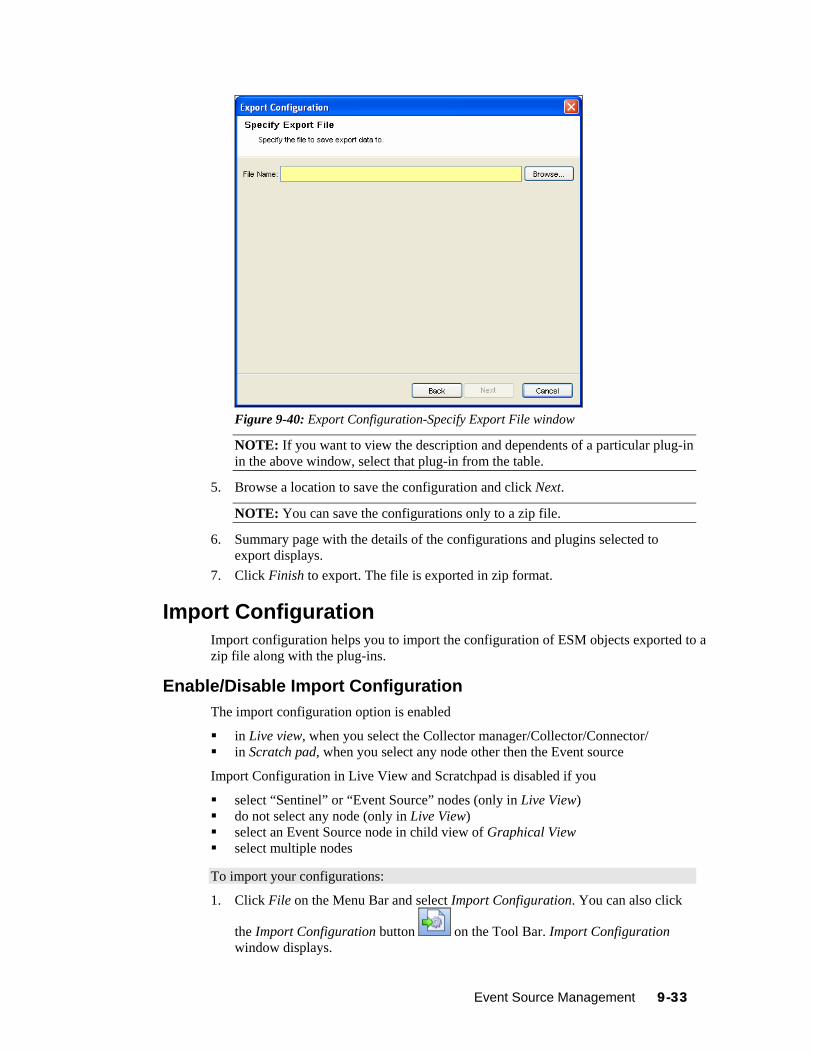
Figure 9-40: Export Configuration-Specify Export File window
NOTE: If you want to view the description and dependents of a particular plug-in in the above window, select that plug-in from the table.
5. Browse a location to save the configuration and click Next.
NOTE: You can save the configurations only to a zip file.
6. Summary page with the details of the configurations and plugins selected to export displays.
7. Click Finish to export. The file is exported in zip format.
Import Configuration Import configuration helps you to import the configuration of ESM objects exported to a zip file along with the plug-ins.
Enable/Disable Import Configuration The import configuration option is enabled
in Live view, when you select the Collector manager/Collector/Connector/ in Scratch pad, when you select any node other then the Event source
Import Configuration in Live View and Scratchpad is disabled if you
select “Sentinel” or “Event Source” nodes (only in Live View) do not select any node (only in Live View) select an Event Source node in child view of Graphical View select multiple nodes
To import your configurations:
1. Click File on the Menu Bar and select Import Configuration. You can also click
the Import Configuration button on the Tool Bar. Import Configuration window displays.
Event Source Management 9-33

NOTE: You can also import configuration by right clicking on the object in the ESM panel. Depending on the object you have selected in the ESM panel, the node along with its child nodes are displayed in the Select Data window of Import Configuration wizard.
2. Browse and select the configurations file and click Next. Select Data window displays.
Figure 9-41: Import Configuration-Select Nodes window
NOTE: Configurations must be saved to a zip file to import.
3. Check the data to import and click Next. Select Collector Script window displays.
Figure 9-42: Import Configuration-Select Collector Script window
4. Select the Collector script from the list to import.
NOTE: Color indicator is displayed in Select Collector Scripts and Select Connector Plugins window to indicate whether the plug-in is already present in the repository or not. If the plug-in does not present in the repository, then the
9-34 Sentinel User Guide

color is displayed as red and if same version of plug-in exists then the color is green else it is orange.
5. Click Next. Select Connector Plugins window displays.
Figure 9-43: Import Configuration-Select Connector Plugins window
6. Select the Connector plugins from the list to import.
NOTE: To view the description and dependents of a particular plugin in the above window, select that plug-in from the table. If there are any Collectors or connectors in the ESM panel which gets affected on importing the plug-in then Affected Collectors or Affected Connectors window is displayed.
7. Click Next. Summary page with the details of the configurations and plug-in selected to import displays.
8. Click Finish.
Save Preferences To save your preferences for next login:
1. Click File on the Menu Bar and select Save Preferences.
Close To close ESM:
1. Click File on the Menu Bar and select Close.
Reset Layout To reset to default settings:
1. Click View on the Menu Bar and select Reset Layout. Alternatively, click the Reset button on the Tool Bar.
Event Source Management 9-35

Undo Layout To undo layout changes:
1. Click View on the Menu Bar and select Undo Layout. Alternatively, click the Undo Layout button on the Tool Bar.
Redo Layout To redo layout changes:
1. Click View on the Menu Bar and select Redo Layout. Alternatively, click the Redo Layout button on the Tool Bar.
Event Source Management Scratchpad Scratchpad is the “Design Mode of the Health Monitor”. Through Scratchpad you can design and configure:
Collector Managers Collectors Event Sources Connectors Event Source Servers
You can right-click the Sentinel icon and add the components. For more information, see “Adding components to Event Source Hierarchy”.
NOTE: You cannot view the status of any object in the design mode as they are not connected to an instance of a real Collector Manager.
Comparison between Sentinel 5.x and Sentinel 6.0 The following Sentinel 5 components have been rolled up into ESM. Along with the Sentinel 5 component name, there is a hint at where to find the related functionality in ESM.
Components Sentinel 5.x Sentinel 6.0 Build / Edit Collector
Building, Modifying or editing a Collector was possible in Collector Builder in 5.x
Building, Modifying or editing a Collector is possible in Collector Builder in 6.0
Import Collector Importing a Collector is not applicable in 5.x
You can import a Collector from Sentinel Control Center in 6.0
Deploy Collector Deploy Collector was possible in Collector Builder in 5.x
Deploy Collector is possible in Sentinel Control Center in 6.0
Debug Collector A debugging interface that enabled a user to step through the parsing logic in a Collector. This interface was available in Collector Builder in Sentinel 5.x
In ESM, this is now done through the ESM panel in Sentinel Control Center. To debug a Collector in ESM, right click the Collector node you want to debug and select the Debug option.
9-36 Sentinel User Guide
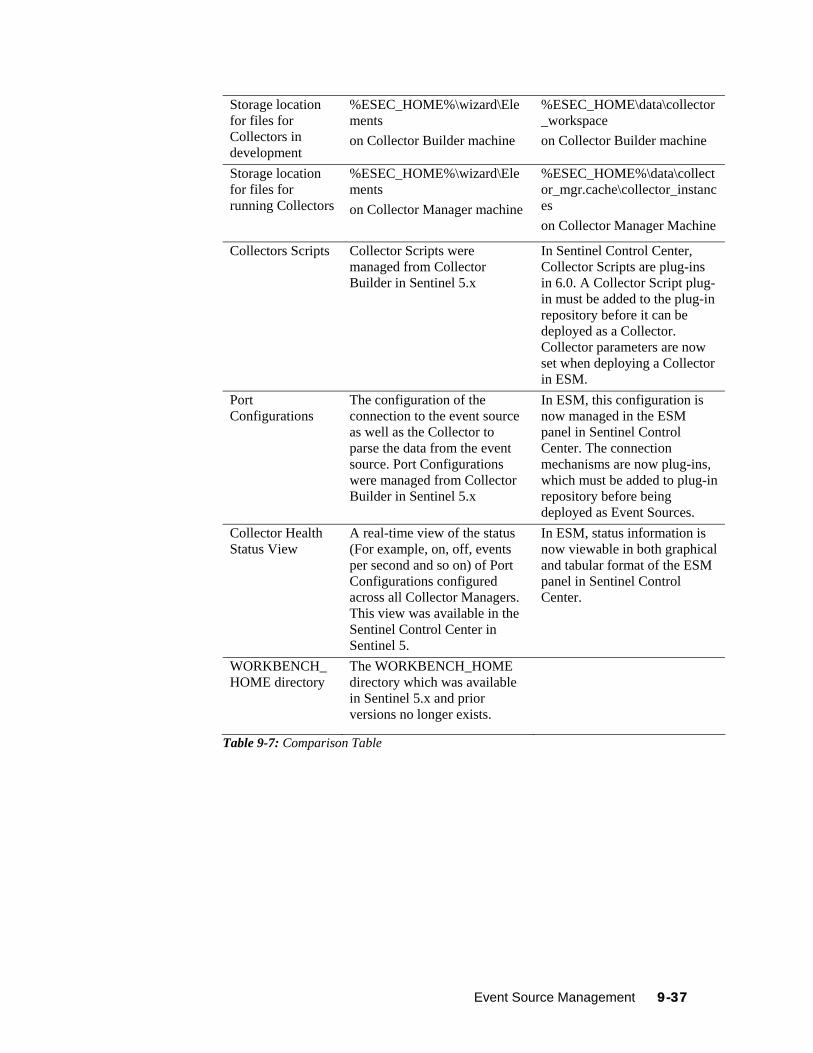
Event Source Management 9-37
Storage location for files for Collectors in development
%ESEC_HOME%\wizard\Elements on Collector Builder machine
%ESEC_HOME\data\collector_workspace on Collector Builder machine
Storage location for files for running Collectors
%ESEC_HOME%\wizard\Elements on Collector Manager machine
%ESEC_HOME%\data\collector_mgr.cache\collector_instances on Collector Manager Machine
Collectors Scripts Collector Scripts were managed from Collector Builder in Sentinel 5.x
In Sentinel Control Center, Collector Scripts are plug-ins in 6.0. A Collector Script plug-in must be added to the plug-in repository before it can be deployed as a Collector. Collector parameters are now set when deploying a Collector in ESM.
Port Configurations
The configuration of the connection to the event source as well as the Collector to parse the data from the event source. Port Configurations were managed from Collector Builder in Sentinel 5.x
In ESM, this configuration is now managed in the ESM panel in Sentinel Control Center. The connection mechanisms are now plug-ins, which must be added to plug-in repository before being deployed as Event Sources.
Collector Health Status View
A real-time view of the status (For example, on, off, events per second and so on) of Port Configurations configured across all Collector Managers. This view was available in the Sentinel Control Center in Sentinel 5.
In ESM, status information is now viewable in both graphical and tabular format of the ESM panel in Sentinel Control Center.
WORKBENCH_HOME directory
The WORKBENCH_HOME directory which was available in Sentinel 5.x and prior versions no longer exists.
Table 9-7: Comparison Table

10 Administration
Topic Page
Understanding Admin Tab 10-1Introduction to User Interface 10-2Archive Configuration Tab 10-2Reporting Configuration Options for Analysis and Advisor Reports 10-4Server Views 10-5Filters 10-7Configure Menu Options 10-12DAS Statistics 10-17Color Filter Configuration 10-19Mapping 10-21Event Configuration 10-31Reporting Data 10-36User Configurations 10-41Solution Pack 10-45
Understanding Admin Tab In Admin tab you can configure filters and reports. In User Manager you can create users and you can assign rights to the users.
The Admin tab allows you to access:
“Archive” “Reports” “Views” “Filters” “Menu Options” “DAS Statistics” “Color Filter” “Mapping” “Events” “Reporting Data” “Users” “Solution Packs”
NOTE: You need to have appropriate permissions to access this tab. Only an Administrator has controls to enable/disable access to the features of Admin for a user.
Administration 10-1
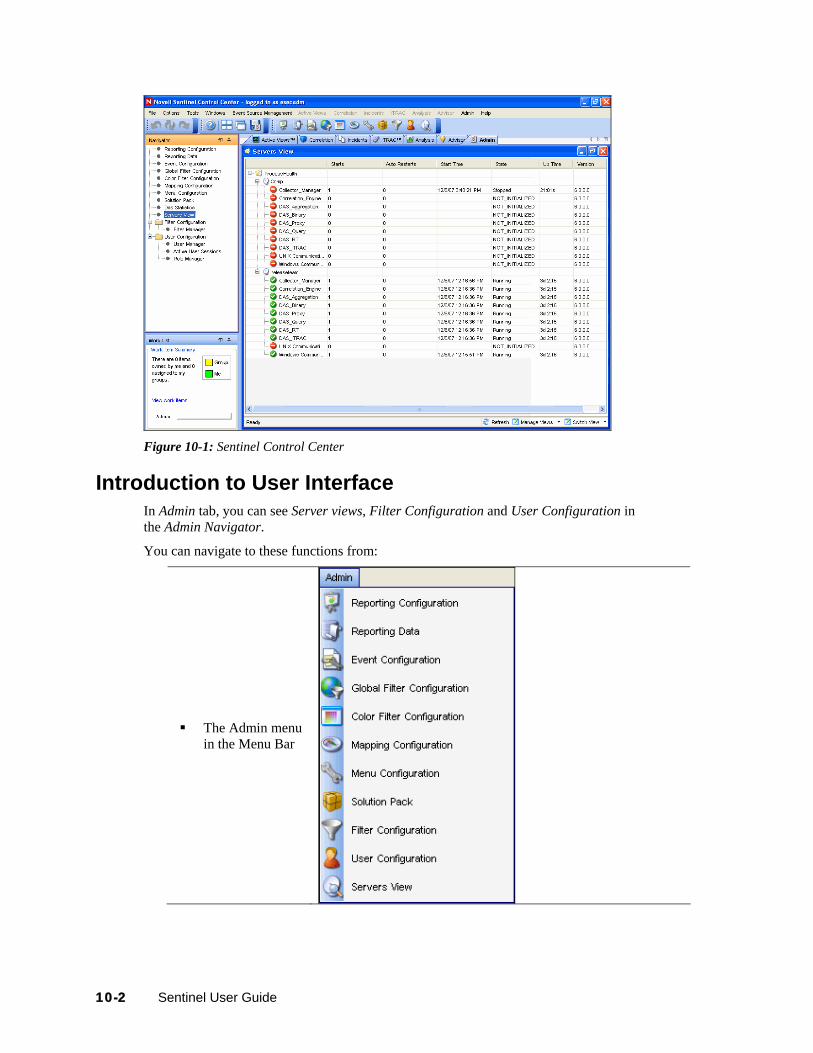
Figure 10-1: Sentinel Control Center
Introduction to User Interface In Admin tab, you can see Server views, Filter Configuration and User Configuration in the Admin Navigator.
You can navigate to these functions from:
The Admin menu in the Menu Bar
10-2 Sentinel User Guide

The Navigation Tree in the Navigation Pane
The Toolbar Buttons
Table 10-1: Admin Tab- User Interface
Archive Configuration Tab Archive Configuration tab allows you to specify directory path for archiving of the partitions.
To open Archive Configuration:
1. Click Admin on the Menu Bar and select Archive Configuration. Alternatively, click Archive Configuration button in the Tool Bar.
Figure 10-2: Archive Configuration window
Administration 10-3

NOTE: Archive Configuration can be enabled from User Manager. Only an Administrator has controls to enable/disable access to this feature.
Reporting Configuration Options for Analysis and Advisor Reports
To configure the URL for Analysis and Advisor Reports:
1. Click Admin tab. 2. In the Admin Navigator, click Reporting Configuration.
For Crystal Enterprise Server running on Windows: In the Analysis URL box, specify the URL for the Crystal Enterprise Server
and click Refresh.
http://<hostname_or_IP_of_web_server>/GetReports.asp?APS=<hostname>&user=Guest&password=&tab=Analysis
NOTE: <hostname_or_IP_of_web_server> must be replaced with the IP address or hostname of the Crystal Enterprise Server.
NOTE: The URL above will not work properly if the APS is set to the IP Address. It must be the host name.
In the Advisor URL box, specify the URL for the Crystal Enterprise Server and click Refresh.
http://<hostname_or_IP_of_web_server>/GetReports.asp?APS=<hostname>&user=Guest&password=&tab=Advisor
NOTE: <hostname_or_IP_of_web_server> must be replaced with the IP address or hostname of the Crystal Enterprise Server.
NOTE: The URL above will not work properly if the APS is set to the IP Address. It must be the host name.
NOTE: For more information, see Crystal Reports for Windows in Sentinel Installation Guide.
For Crystal Enterprise Server running on Linux (SUSE and Red Hat): In the Analysis URL box, specify the URL for the Crystal Enterprise Server
and click Refresh.
http://<hostname_or_IP_of_web_server>:<web_server_port_default_8080>/esec-script/GetReports.jsp?APS=<hostname>&user=Guest&password=&tab=Analysis
NOTE: <hostname_or_IP_of_web_server> must be replaced with the IP address or hostname of the Crystal Enterprise Server.
NOTE: The URL above will not work properly if the APS is set to the IP Address. It must be the host name.
NOTE: <web_server_port_default_8080> must be replaced with the port of the Crystal Web server is listening on.
10-4 Sentinel User Guide
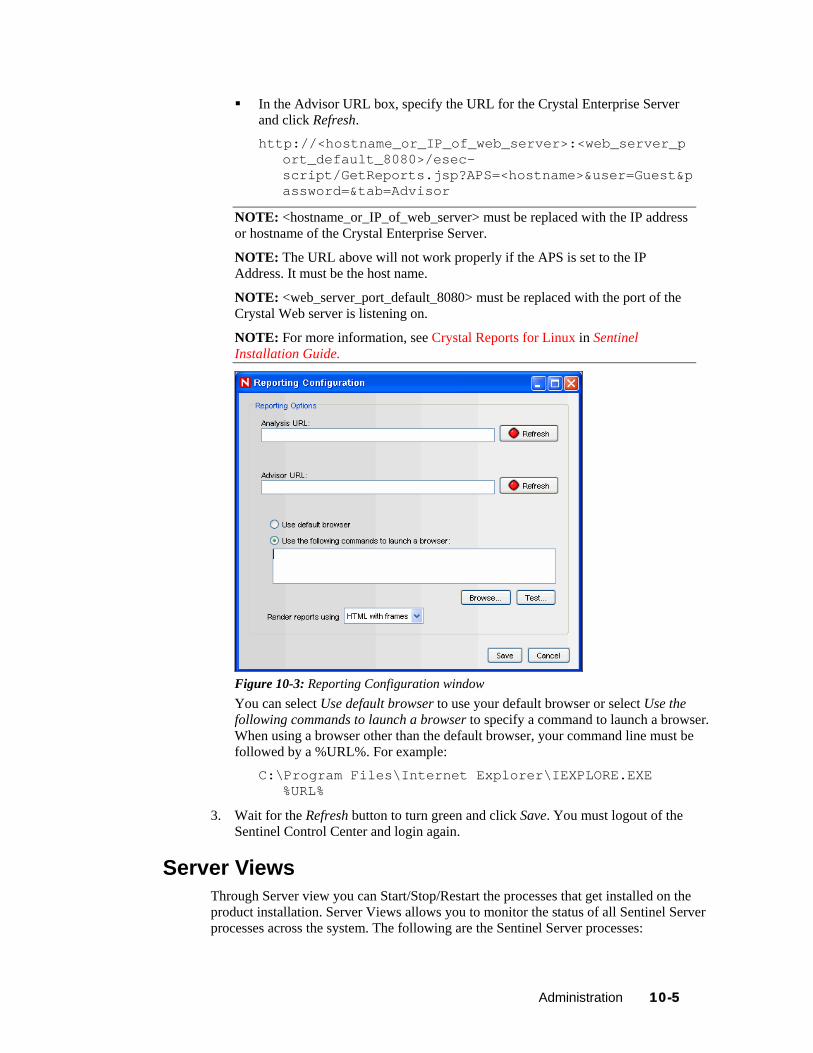
In the Advisor URL box, specify the URL for the Crystal Enterprise Server and click Refresh.
http://<hostname_or_IP_of_web_server>:<web_server_port_default_8080>/esec-script/GetReports.jsp?APS=<hostname>&user=Guest&password=&tab=Advisor
NOTE: <hostname_or_IP_of_web_server> must be replaced with the IP address or hostname of the Crystal Enterprise Server.
NOTE: The URL above will not work properly if the APS is set to the IP Address. It must be the host name.
NOTE: <web_server_port_default_8080> must be replaced with the port of the Crystal Web server is listening on.
NOTE: For more information, see Crystal Reports for Linux in Sentinel Installation Guide.
Figure 10-3: Reporting Configuration window You can select Use default browser to use your default browser or select Use the following commands to launch a browser to specify a command to launch a browser. When using a browser other than the default browser, your command line must be followed by a %URL%. For example:
C:\Program Files\Internet Explorer\IEXPLORE.EXE %URL%
3. Wait for the Refresh button to turn green and click Save. You must logout of the Sentinel Control Center and login again.
Server Views Through Server view you can Start/Stop/Restart the processes that get installed on the product installation. Server Views allows you to monitor the status of all Sentinel Server processes across the system. The following are the Sentinel Server processes:
Administration 10-5

Collector_Manager Correlation_Engine DAS_Aggregation DAS_Binary DAS_Proxy DAS_Query DAS_RT DAS_iTRAC Unix Communication Server Windows Communication Server
NOTE: Windows Communication Server and Unix Communication Server will run for their respective platform.
Figure 10-4: Server View window Start, stop or restart processes: These actions can be taken on a process by right
clicking on the process entry.
NOTE: The options in the right click actions on the Windows Communication Server and Unix Communication Server are not enabled because stopping these Communication Server will result in losing contact with all of the processes.
The terms Starts and AutoRestarts, in the context of the Server View, are defined as follows:
Starts: The number of times the process was started, for whatever reason. This includes starts initiated by the user through the GUI or done automatically.
AutoRestarts: The number of times the process was automatically restarted. Because this only applies to purely automatic restart scenarios, it does not apply to restarts initiated by a user. This field is helpful for determining if the process exited (For example, because of an error) and was automatically restarted by Sentinel Watchdog.
Monitoring a Process To Monitor a Process:
1. Click the Admin tab. Click Servers View. Alternatively, in Navigator click Servers View > Servers View. You can also click Servers View icon.
2. Expand the server view. All the processes will list as shown in the above figure.
10-6 Sentinel User Guide

Creating a Servers View To Create a Servers View:
1. Click the Admin tab. Click Servers View. Alternatively, in Navigator click Servers View > Servers View. You can also click Server View icon.
2. To create a new view, on the bottom right corner click Manage View drop down
arrow. Click Add View. Specify your Option Name To arrange which fields you want to be shown, click Fields To group different attributes, click GroupBy To sort by different attributes, click Sort To filter, click Filter To change the display values of the processes shown in the servers view,
click Leaf Attribute 3. Click Save.
Starting, Stopping and Restarting Processes To Start, Stop and Restart Processes:
1. Click the Admin tab. Click Servers View. Alternatively, in Navigator click Servers View > Servers View. You can also click Servers View icon.
2. Expand the servers view. All the processes will list as shown in the above figure.
Select a process, right-click > Actions > select a function (Start, Restart or Stop).
Figure 10-5: Action selection
NOTE: You cannot stop the Windows Communication Server and Unix Communication Server using this feature.
Filters Filters allow you to process data based on specific criteria for events in real-time and for users of the system. Filters enable you to manage data seen in the Sentinel Control Center. The Filter Engine drives the Real Time Event windows by maintaining the data structure for each security filter. Filters prevent users from viewing unauthorized events and drop events that users don’t want to see. Filters are created in the Admin tab of the Sentinel Control Center.
Administration 10-7

NOTE: The following are invalid filter name characters: $ # . * & : < >.
There are three types of filters:
“Public Filters” “Private Filters” “Global Filters”
Public Filters Public filters are system-owned. Public filters can be used as security filters or display filters. Security filters are based on user permissions. Display filters determine which events are depicted in the real time event tables, charts and graphs.
Figure 10-6: Filter Manager window
Private Filters Private filters are user-owned. Private filters are display filters and are shareable if you have the View Private Filters permission.
Global Filters Global filters are classified as Public Filters. Global filters are processed at the Collector Manager sequentially for each event until a match is found. Global filter evaluation stops for that event and the matched global filter action is taken for that event. The order of evaluation of global filters is top to bottom, as shown in the Console. They can be enabled or disabled as needed.
Global filters do the following:
Enable a global action on events, such dropping events, routing events to the database only or routing events to the database and the Sentinel Control Center or Routing events only to GUI or Sentinel Control Center
Are processed by Collector Manager Are configured in the Admin tab under the Global Filter Configuration option where
they can be enabled and disabled Drop events Can route events to the database only Can route events to the database and to the Sentinel Control Center
10-8 Sentinel User Guide

Can route events only to Sentinel Control Center
Through the Global Configuration window, you can:
“Create Global Filter” “Rearrange a Global Filter” “Delete a Global Filter”
Figure 10-7: Global Filter Configuration
Creating a Global Filter
To Create a Global Filter:
1. Click the Admin tab. 2. Click Admin > Global Filter Configuration or select Global Filter Configuration
in the navigation tree. 3. In the Global Configuration window, click Add. 4. In the new blank row, click Filter Name column. 5. Select a filter and click Select or Add (if you need to create a filter). 6. In the Active column, click Active box. 7. In the Action column, select the action that the global filter will have on events
that pass this global filter. If an event does not meet any of the active global filters, then the default action determines how the event is handled. You can set the Default Action box to one of the following: drop: Events will not go to the Sentinel Control Center or the Sentinel Server
database database: Events will be sent directly to the database, bypassing the Sentinel
Control Center database and gui: Events will be sent to the Sentinel Control Center and
Sentinel Server database gui only: Events will be sent to the Sentinel Control Center.
8. Continue adding filters until you have completed adding all the required filters.
Administration 10-9
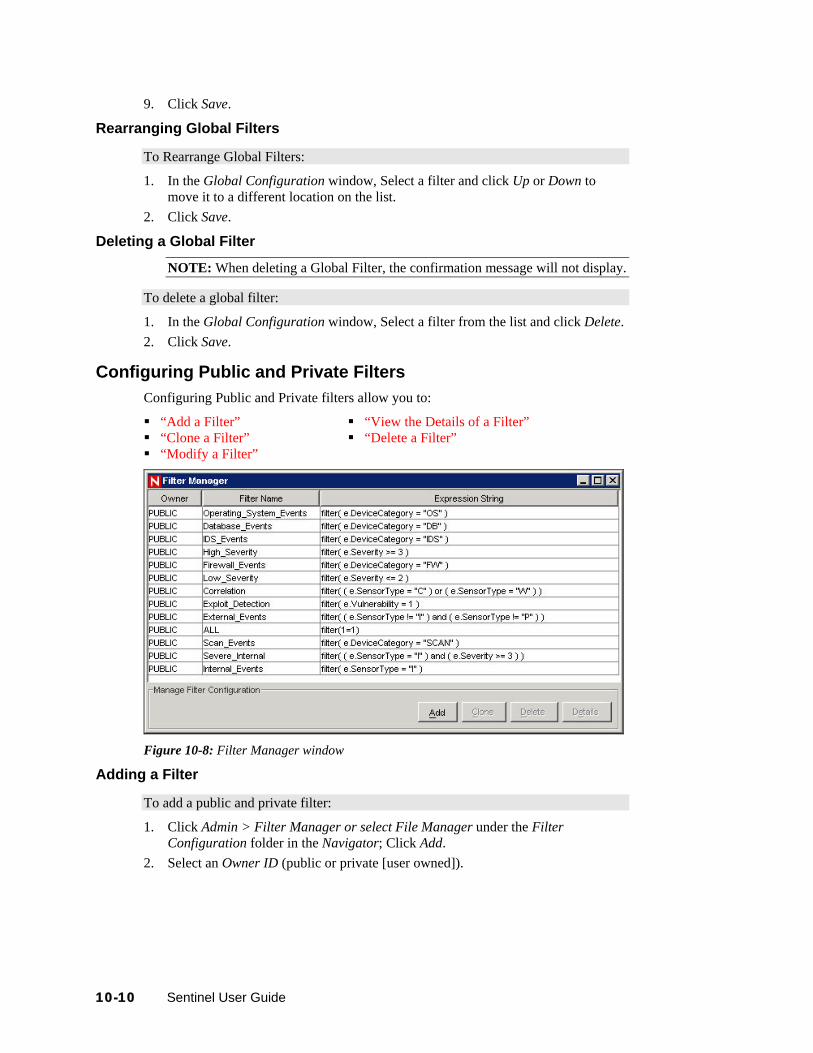
9. Click Save.
Rearranging Global Filters
To Rearrange Global Filters:
1. In the Global Configuration window, Select a filter and click Up or Down to move it to a different location on the list.
2. Click Save.
Deleting a Global Filter
NOTE: When deleting a Global Filter, the confirmation message will not display.
To delete a global filter:
1. In the Global Configuration window, Select a filter from the list and click Delete. 2. Click Save.
Configuring Public and Private Filters Configuring Public and Private filters allow you to:
“Add a Filter” “View the Details of a Filter” “Clone a Filter” “Delete a Filter” “Modify a Filter”
Figure 10-8: Filter Manager window
Adding a Filter
To add a public and private filter:
1. Click Admin > Filter Manager or select File Manager under the Filter Configuration folder in the Navigator; Click Add.
2. Select an Owner ID (public or private [user owned]).
10-10 Sentinel User Guide

Figure 10-9: Filter Details window
3. Specify a Filter Name. 4. The table editor is the default selection for editing the contents.
NOTE: Optionally, you can click Use free form editor to display a free form editor. The free form editor allows you to create complex expressions not possible with the table editor. However, after the expression is modified with the free form editor, the table editor cannot be used with the expression.
5. Select the criteria for the following columns: Property Operator Value columns.
Your choices displays in the Expression string box. 6. In the Match if box, click either:
All conditions are met (and) One or more conditions are met (or)
7. To create another filter expression, click Create a New Filter Expression (+) to add another row to the filter expression table.
8. To remove a filter expression, select a filter expression from the table and click Remove the Selected Expression (-).
9. Click Save.
To Clone a Public and Private filter Cloning is a convenient way to duplicate a filter to assure consistency of criteria among a group of filters or users.
Administration 10-11

To clone a public and private filter:
1. Open the Filter Manager window. 2. Click Clone. 3. Provide a new filter name. 4. Change any the original filter’s criteria. 5. Click Save.
Modifying a Public and Private Filter
To modify a Public and Private filter:
1. Open the Filter Manager window. 2. Select a filter and click Details. 3. Change any of the criteria as desired. You will not be able to change the Owner
ID and the Filter Name. 4. Click Save.
Viewing the Details of a Public and Private Filter
To view a public or private filter:
1. Open the Filter Manager window. 2. Select a filter and click Details.
Deleting a Public and Private Filter
To delete a Public and Private filter:
1. Open the Filter Manager window. 2. Select a filter and click Delete. 3. A confirmation window displays. Click Yes in delete confirmation dialog.
Configure Menu Options NOTE: To use this feature, you must have the user permission Menu Configuration.
Use the Menu Configuration window to create the menu items that appear on the Event menu, which is available by right-click when a single event is selected in any table displaying an event (for example, an Active View window, Snapshot window, Incidents Events window, or Offline Query window). Sentinel has the following default Menu Configuration items that you can clone, activate or deactivate:
10-12 Sentinel User Guide

Figure 10-10: Menu Configuration Ping: Ping the destination IP of the selected event nslookup: Perform an nslookup on the Source IP of the selected event traceroute (tracert on Microsoft SQL 2005): Perform a traceroute from the Source
IP of the selected event to the Sentinel Server Whois?: Perform an ARIN Whois? lookup on the Source IP of the selected event
To view the configuration details for any of these options, select the item and click Details. The following is the nslookup configuration.
Figure 10-11: Menu Item
In addition, new options can be customized to execute a command or open a Web browser.
NOTE: The scripts, commands, or applications must be available in $ESEC_HOME/config/exec (on UNIX) or %ESEC_HOME%\config\exec (on Windows). Symbolic links are not supported on UNIX.
Menu Configuration allows you to:
“Adding an Option to the Menu Configuration Menu” “Cloning a Menu Configuration Option” “Modifying a Menu Configuration Option” “Viewing a Menu Configuration Option’s Parameters” “Activating or Deactivating a Menu Configuration Option” “Rearranging Event Menu Options” “Deleting a Menu Configuration Option” “Editing Your Menu Configuration Browser Setting”
Administration 10-13

Adding an Option to the Menu Configuration Menu To execute a command from the right-click menu:
1. Click Admin tab. 2. In the Admin Navigator, click Admin > Menu Configuration. 3. Click Add. 4. In the Menu Configuration dialog box, specify:
Name: Provide a name for the command. To place the command in a folder, provide [foldername]/[commandname].
Description Action: Execute Command Use browser: Select this option to open the output of your command using
the default browser.
NOTE: This option is only available if your menu configuration browser settings are set to Use Default Browser. For more information, see “Editing Your Menu Configuration Browser Settings.”
File Type: If you selected the Action Execute Command, your Browser settings are setup to Use Default Browser, and you selected the option Use the following commands to launch a browser, you have the option of setting the File Type for the output of this command.
Command /URL For UNIX, the script/application must be located in the
$ESEC_HOME/config/exec directory. For any script or application only specify the command. Any path specified will be ignored.
NOTE: For Windows (Correlation), the script/application must be located in one of the directories listed in your Windows Environmental Variables. Any path specified will be ignored.
NOTE: For Windows (non-Correlation), specifying a path is optional. Specifying a command without a path will default to %ESEC_HOME%\ bin and all other paths specified in your environmental variables.
Parameters: Parameter must be enclosed by percent signs (for example, %EventName%).
NOTE: For a list of available tags you can use when specifying parameters, click Help on the Menu Configuration dialog box or see Sentinel Meta-tags in Sentinel User Reference Guide. However, if you have renamed a tag, such as renaming CustomerVar24 to PolicyName, you must use the new name when setting parameters.
5. Click OK. The new option is added to the list of menu items in the Menu Configuration window.
To open a Web page from the right-click menu:
1. Click Admin tab. 2. In the Admin Navigator, click Admin > Menu Configuration. 3. Click Add. 4. In the Menu Configuration dialog box, specify:
10-14 Sentinel User Guide

Name: Specify a name for the command. To place the command in a folder, provide [foldername]/[commandname].
Description Action: Launch Web Browser. Command / URL: Provide the URL for the Web site. Parameters: Parameter must be enclosed by percent signs (for example,
%EventName%)
NOTE: For a list of available tags you can use when specifying parameters, click Help on the Menu Configuration dialog box or see Sentinel Meta-tags in Sentinel User Reference Guide. However, if you have renamed a tag, such as renaming CustomerVar24 to PolicyName, you must use the new name when setting parameters.
5. Click OK. The new option is added to the list of menu items in the Menu Configuration window.
Cloning a Menu Configuration Option To clone a Menu Configuration option:
1. Open the Menu Configuration window. 2. Select a menu item from the table and click Clone. 3. In the Menu Configuration dialog box, edit:
Name Description Action To use a browser or not. For information, see “Add a browser feature to your
Menu Configuration Option”. Command/URL Parameters Select an action:
Execute Command Launch Web Browser.
NOTE: For a list of available tags you can use when specifying parameters, click Help on the Menu Configuration dialog box or see Sentinel Meta-tags in Sentinel User Reference Guide.
4. Click OK. The new option is added to the list of menu items in the Menu Configuration window.
Modifying a Menu Configuration Option To modify a Menu Configuration option:
1. Open the Menu Configuration window. 2. Double-click a menu option. 3. Type your desired changes and click OK.
Administration 10-15
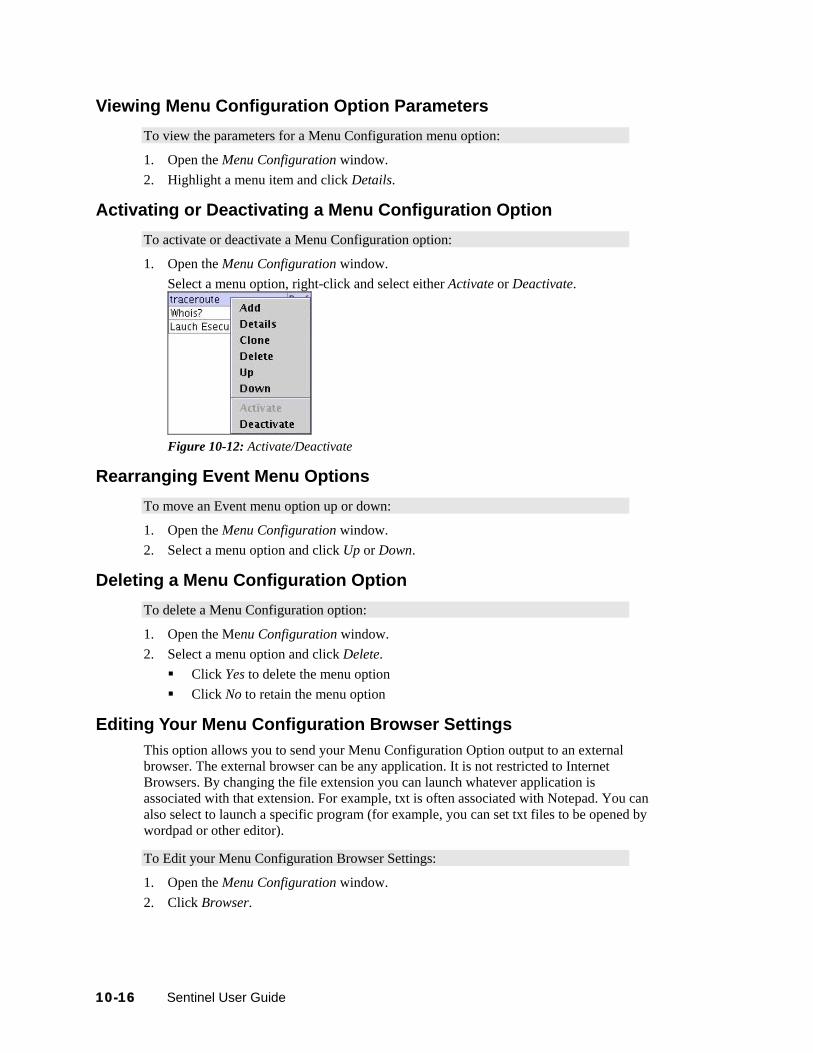
Viewing Menu Configuration Option Parameters To view the parameters for a Menu Configuration menu option:
1. Open the Menu Configuration window. 2. Highlight a menu item and click Details.
Activating or Deactivating a Menu Configuration Option To activate or deactivate a Menu Configuration option:
1. Open the Menu Configuration window. Select a menu option, right-click and select either Activate or Deactivate.
Figure 10-12: Activate/Deactivate
Rearranging Event Menu Options To move an Event menu option up or down:
1. Open the Menu Configuration window. 2. Select a menu option and click Up or Down.
Deleting a Menu Configuration Option To delete a Menu Configuration option:
1. Open the Menu Configuration window. 2. Select a menu option and click Delete.
Click Yes to delete the menu option Click No to retain the menu option
Editing Your Menu Configuration Browser Settings This option allows you to send your Menu Configuration Option output to an external browser. The external browser can be any application. It is not restricted to Internet Browsers. By changing the file extension you can launch whatever application is associated with that extension. For example, txt is often associated with Notepad. You can also select to launch a specific program (for example, you can set txt files to be opened by wordpad or other editor).
To Edit your Menu Configuration Browser Settings:
1. Open the Menu Configuration window. 2. Click Browser.
10-16 Sentinel User Guide

Figure 10-13: Menu Configuration-Use default browser You can select from the following two options: Use default browser: Uses the default browser set in that particular machine.
For example, in windows, “Internet Explorer”. Use the following commands to launch a browser: Allows you to specify a
specific application to launch. When using a browser other than the default browser, your command line must be followed by a %URL%. For example:
C:\Program Files\Internet Explorer\IEXPLORE.EXE %URL%
The following is an example where the output of the Menu Option launches into Internet Explorer.
Figure 10-14: Menu Configuration-Use the commands to launch a browser
3. After you set your configuration, click OK.
DAS Statistics This feature is for internal monitoring of your system. It is not intended for the average user. DAS Statistics monitors the following:
DAS_Binary DAS_Query DAS_rt Collector_ Manager Correlation _Engine DAS_iTRAC
Statistics are broken down as follows:
Administration 10-17

Service: Name of service such as DAS_Query Time: Time since the last update num: Number of requests processed for this entry WaitTime: Average wait time in seconds for a request before its processing starts Runtime: Average time to process a request (in seconds) #wait: Average size of the wait queue #run: Average size of the run queue
The information is divided into 3 sections:
Requests Services ThreadPools
Under Requests it keeps all the requests by channel (such as services.CorrelationService). Under services it does the same by service. Sometimes it provides a breakdown by appending “<category>” under the name, such as Services.CorrelationService or Services.RemoteObjectService.EMap.getMapPK.
Under Services, all the remote method calls from user defined services (your XML services) are all under services.RemoteObjectService. Under that it puts the name of the service (EMap) in the above example and if asked, the name of the method (getMapPK in the above).
When a request is received by a server, such as DAS Query, a task is created and scheduled. The task is then assigned to a thread pool for execution. There can be more than one thread pool and a thread pool can service multiple services. For that reason, a request needs to wait for an available thread even if the service is not heavily used. If the statistics indicate that the wait time for a request is large and the number of requests for that service is low, check the information about the thread pools.
The numbers next to an entry are the sum for all its children. So requests 15 means that there are 15 requests for all requests method calls. Under that, requests.configurations 1 means that 1 of the 15 are to configurations, requests.esecurity.correlation.config 2 means that 2 of the 15 are to esecurity.correlation.config and so on.
Figure 10-15: Das Statistics window
The information can be useful because it shows what is going on. The number of requests is especially useful, you can see where they are all going or concentrated. The #waiting is useful because it shows how busy the server is. That number should be small. If it is large, new requests (even for simple tasks) will need to wait for potentially slow ones. This is
10-18 Sentinel User Guide
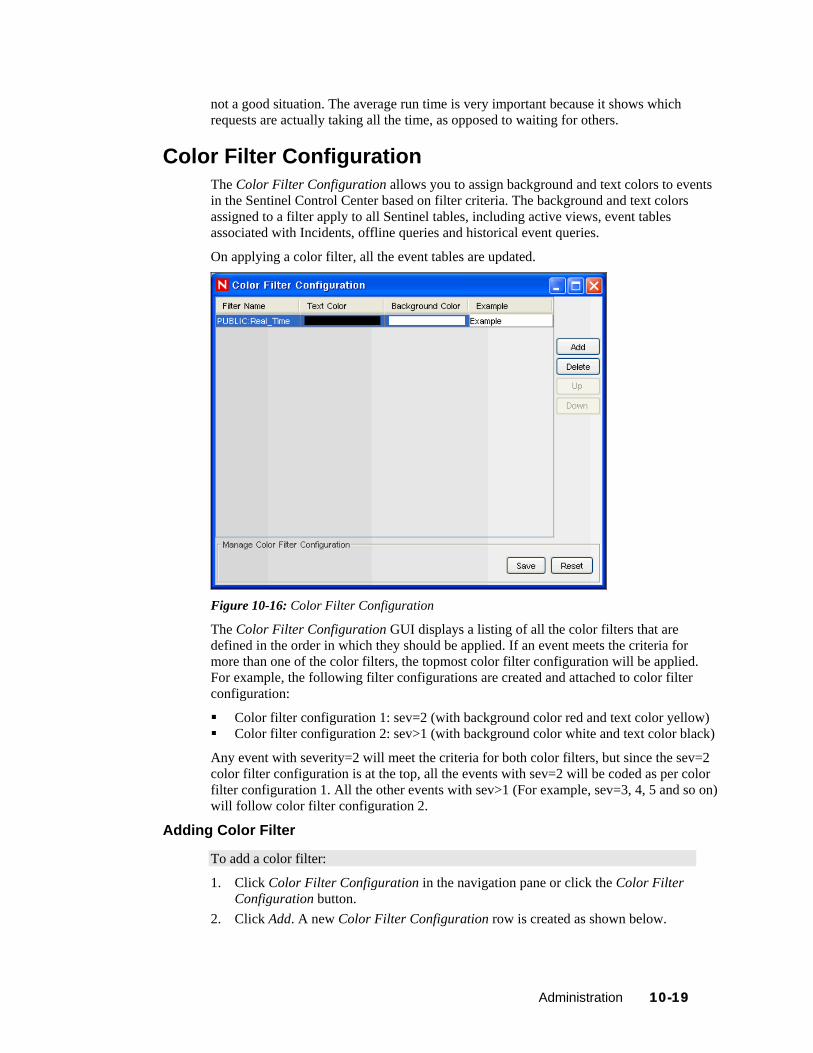
not a good situation. The average run time is very important because it shows which requests are actually taking all the time, as opposed to waiting for others.
Color Filter Configuration The Color Filter Configuration allows you to assign background and text colors to events in the Sentinel Control Center based on filter criteria. The background and text colors assigned to a filter apply to all Sentinel tables, including active views, event tables associated with Incidents, offline queries and historical event queries.
On applying a color filter, all the event tables are updated.
Figure 10-16: Color Filter Configuration
The Color Filter Configuration GUI displays a listing of all the color filters that are defined in the order in which they should be applied. If an event meets the criteria for more than one of the color filters, the topmost color filter configuration will be applied. For example, the following filter configurations are created and attached to color filter configuration:
Color filter configuration 1: sev=2 (with background color red and text color yellow) Color filter configuration 2: sev>1 (with background color white and text color black)
Any event with severity=2 will meet the criteria for both color filters, but since the sev=2 color filter configuration is at the top, all the events with sev=2 will be coded as per color filter configuration 1. All the other events with sev>1 (For example, sev=3, 4, 5 and so on) will follow color filter configuration 2.
Adding Color Filter
To add a color filter:
1. Click Color Filter Configuration in the navigation pane or click the Color Filter Configuration button.
2. Click Add. A new Color Filter Configuration row is created as shown below.
Administration 10-19

Figure 10-17: Color Filter Configuration row
3. Click Filter Name drop down list. The Filter Selection window displays. 4. From the list, select a filter to which you want to apply the color filter
configuration and click Select or click Add to create a new filter. For more information on configuring filters, see “Configuring Public and Private Filters”.
Figure 10-18: Filter Selection window
5. In the Color Filter Configuration window click Text Color. The Pick a Color window displays. Select a color from the Swatches tab. Alternatively, click HSB or RGB tab and specify the HSB or RGB color value in the respective tab. Click OK.
Figure 10-19: Color Selection window
10-20 Sentinel User Guide

6. In the Color Filter Configuration window, click Background Color. The Pick a Color window displays. Select a color from the Swatches tab. Alternatively, click HSB or RGB tab and specify HSB or RGB color value in the respective tab. Click OK.
7. Click Save.
NOTE: The order of the color filter configuration row in the Color Filter Configuration window matters. In the case where more than one color filter definition applies to an event, the formatting for the topmost color filter takes precedence.
Deleting Color Filter
To delete a color filter:
1. Click Color Filter Configuration in the navigation pane. 2. Select a Color Filter Configuration row and click Delete.
Setting Color Filter Priorities
To set priority for a color filter:
1. Click Color Filter Configuration in the navigation pane or click the Color Filter Configuration button.
2. Select a Color Filter Configuration row. 3. Click Up or Down button to set the priority.
NOTE: The Up and Down button will be active only when there is more than one color filter configuration row available in the Color Filter Configuration window.
Mapping A map is a collection of values and keys defined in a CSV or text file. You can enrich your data by using maps. With the help of maps you can add additional information to the incoming events from your source device. This additional information which was not present can be used for correlation and reporting.
You can create your custom maps in addition to the default maps available. You can use event mapping which allows you to add additional data to an event by using data already present in the event and by referencing and pulling data from an outside source. For more information, see “Event Configuration” and “Event Mapping”.
NOTE: In order to do Mapping, your configuration.xml file must be pointing to a Communication Server that has DAS_Binary and DAS_Query connected to it. This will normally be the case, by default, as long as the Communication Server and DAS processes are running.
The Mapping tab allows you to:
Add new map definitions Edit map definitions Delete map definitions Update map data
Mapping works together with the Referenced from Map Data Source option under Event Configuration. You can map by using a string or number range. The following are the default maps available:
Administration 10-21

Asset: Contains the data from the map data source file asset.csv. The asset.csv is automatically generated from asset data from Sentinel Database when an asset Collector is run. This file could be populated manually instead, if desired.
AssetToRegulation: Contains the data from the map data source file AssetToRegulation.csv. This file must be populated manually.
AttackSignatureNormalization: Contains the data from the map data source file attackNormalization.csv (IDS signatures). The attackNormalization.csv file is automatically generated from Advisor data from Sentinel Database when an Advisor feed is completed.
IpToCountry: Contains the data from the map data source file IpToCountry.csv. This file must be populated manually.
IsExploitWatchlist: Contains the data from the map data source file exploitDetection.csv (vulnerabilities and threats). The exploitDetection.csv file is automatically generated from Advisor and Vulnerability data from Sentinel Database when either an Advisor feed is completed or a vulnerability Collector is run.
To view maps in the GUI:
1. Navigate to Admin tab and select Mapping Configuration from the Navigation
pane or click Mapping Configuration button .
Figure 10-20: Mapping Configuration window
The main Mapping GUI displays a listing of all of the maps that have been defined for the system.
NOTE: Maps under UNMANAGED ITEMS folder cannot be edited or deleted.
Adding Map Definitions To add a map definition:
1. Navigate to Admin tab and select Mapping Configuration from the navigation pane or click Mapping Configuration button.
2. Click Add.
10-22 Sentinel User Guide

3. If you are creating a new map folder, click New Dir. Specify a folder name.
NOTE: If this is your first map definition, it is recommended that you create a new map definition folder. Creating a map definition under the UNMANAGED ITEMS folder will not allow you to edit or delete your map definition.
4. Ensure that the folder you want to provide your map definition into is selected. (that is, the folder indicates that it is open).
5. Specify your Map Name. 6. Click Next.
NOTE: The Map Type field box is disabled.
7. Select either Local File or Remote File. Local File: Allows you to browse for your file on your local file system (on
the machine where SDM was launched from). Remote File: Allows you to select from existing map source data files on the
server where DAS is running. Seven files that might already exist on the server (if Advisor is installed and Vulnerability data was uploaded) are Asset, AssetToRegulation.csv, IpToCountry.csv, taxonomy.csv, CustomerToHierarchy.csv, attackNormalization.csv and exploitDetection.csv. Remote file points to %ESEC_HOME%\data\map_data (Windows) or $ESEC_HOME/data/map_data (UNIX)
Figure 10-21: New Map Definition window-Source Data File Select your map definition file. Click Next.
NOTE: For map files that contain more than 500 lines, you will not see all the lines in the SDM.
8. In the New Map Definition window, set the following: Delimiter: (pipe, comma, semicolon and so on) of data in rows of the map
data source file
Administration 10-23
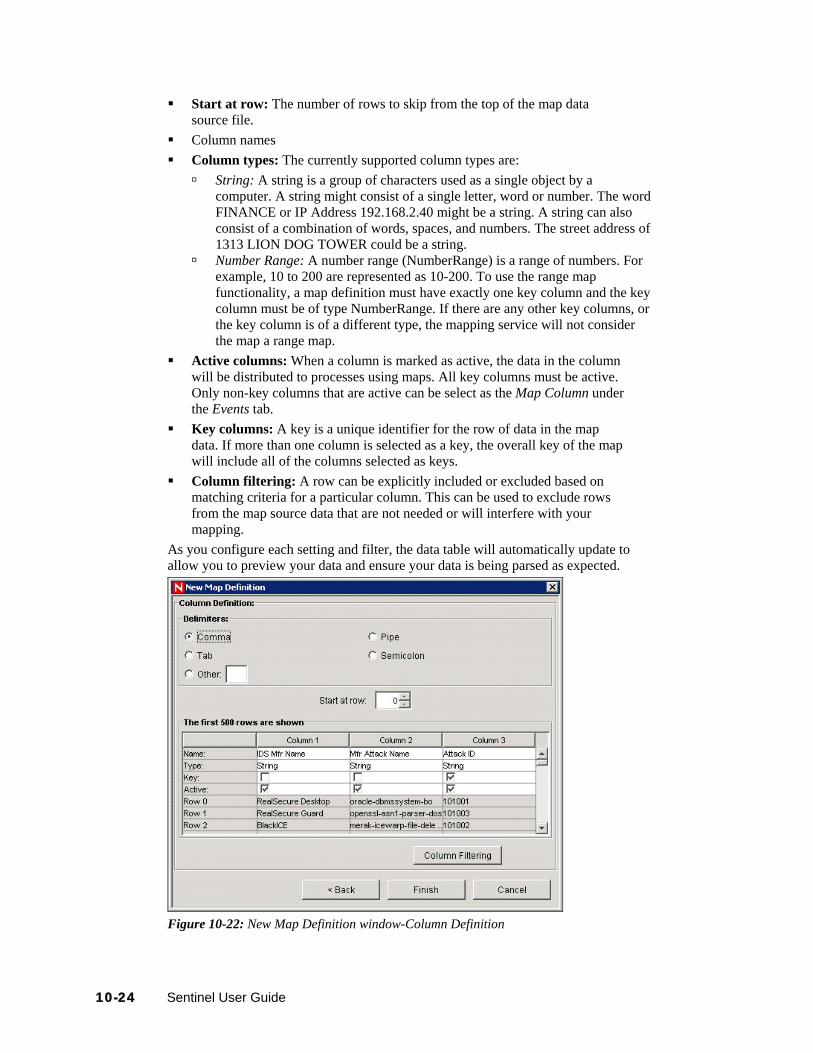
Start at row: The number of rows to skip from the top of the map data source file.
Column names Column types: The currently supported column types are:
String: A string is a group of characters used as a single object by a computer. A string might consist of a single letter, word or number. The word FINANCE or IP Address 192.168.2.40 might be a string. A string can also consist of a combination of words, spaces, and numbers. The street address of 1313 LION DOG TOWER could be a string.
Number Range: A number range (NumberRange) is a range of numbers. For example, 10 to 200 are represented as 10-200. To use the range map functionality, a map definition must have exactly one key column and the key column must be of type NumberRange. If there are any other key columns, or the key column is of a different type, the mapping service will not consider the map a range map.
Active columns: When a column is marked as active, the data in the column will be distributed to processes using maps. All key columns must be active. Only non-key columns that are active can be select as the Map Column under the Events tab.
Key columns: A key is a unique identifier for the row of data in the map data. If more than one column is selected as a key, the overall key of the map will include all of the columns selected as keys.
Column filtering: A row can be explicitly included or excluded based on matching criteria for a particular column. This can be used to exclude rows from the map source data that are not needed or will interfere with your mapping.
As you configure each setting and filter, the data table will automatically update to allow you to preview your data and ensure your data is being parsed as expected.
Figure 10-22: New Map Definition window-Column Definition
10-24 Sentinel User Guide

9. After you finish configuring all parameters and filters for the definition, click Finish.
10. If you selected Local File in step 7 above, you will be prompted to upload your file to the Remote Files virtual folder located: %ESEC_HOME%\data\map_data. Specify a file name and click OK.
Adding a Number Range Map Definition To use the range map functionality, a map definition must have exactly one key column and the key column must be of type NumberRange. If there are any other key columns, or the key column is of a different type, the mapping service will not consider the map a range map.
To create a range map, select a single column to be the key of the map and select NumberRange as the type of the column. The format of the data in a column of type NumberRange must be “m-n”, where m is the minimum number in the range and n is the maximum number in the range (that is, 10-200). The maximum number in the range is not included in the range (that is, [m,n)). This means a range of 10-200 will only key off numbers equal to 10 to 199. An example set of data is with the first column as the key:
1-2,AA 2-4,AA 4-12,BB 10-20,BB 30-31,BB 100-200,AA 110-120,CC
Figure 10-23: Number Range Map Definition
The example table gets transformed to:
Figure 10-24: Table Transformation
Administration 10-25
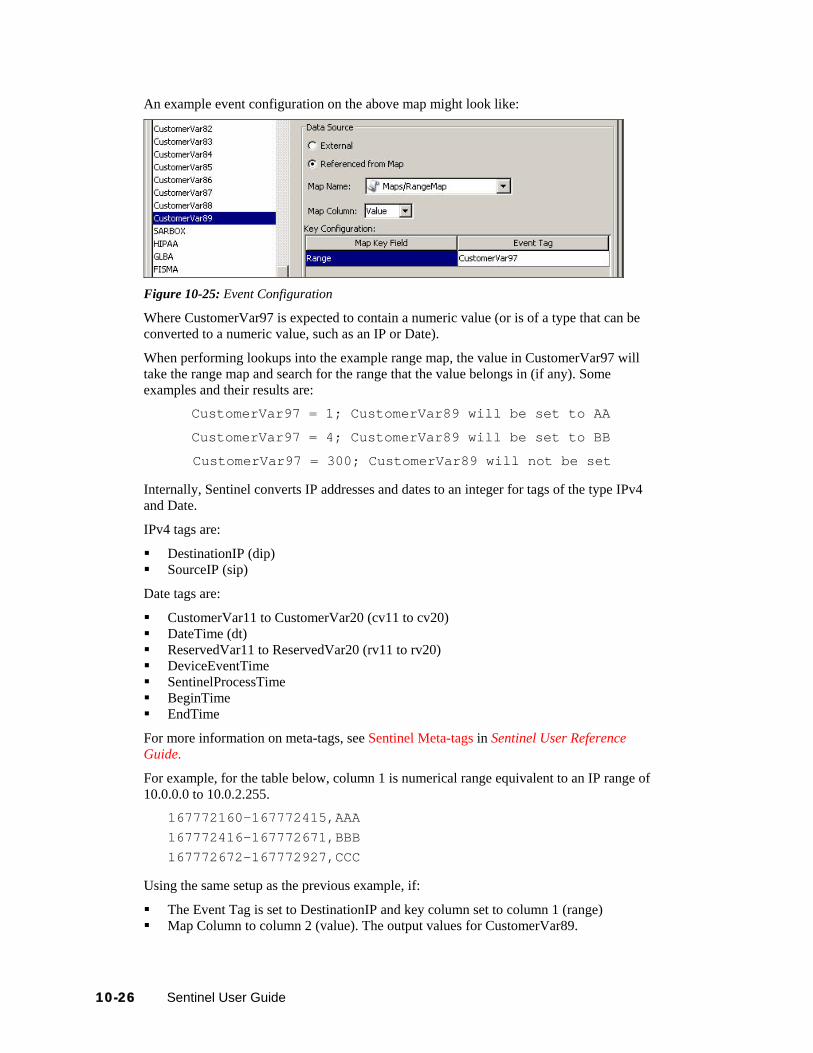
An example event configuration on the above map might look like:
Figure 10-25: Event Configuration
Where CustomerVar97 is expected to contain a numeric value (or is of a type that can be converted to a numeric value, such as an IP or Date).
When performing lookups into the example range map, the value in CustomerVar97 will take the range map and search for the range that the value belongs in (if any). Some examples and their results are:
CustomerVar97 = 1; CustomerVar89 will be set to AA
CustomerVar97 = 4; CustomerVar89 will be set to BB
CustomerVar97 = 300; CustomerVar89 will not be set
Internally, Sentinel converts IP addresses and dates to an integer for tags of the type IPv4 and Date.
IPv4 tags are:
DestinationIP (dip) SourceIP (sip)
Date tags are:
CustomerVar11 to CustomerVar20 (cv11 to cv20) DateTime (dt) ReservedVar11 to ReservedVar20 (rv11 to rv20) DeviceEventTime SentinelProcessTime BeginTime EndTime
For more information on meta-tags, see Sentinel Meta-tags in Sentinel User Reference Guide.
For example, for the table below, column 1 is numerical range equivalent to an IP range of 10.0.0.0 to 10.0.2.255.
167772160-167772415,AAA 167772416-167772671,BBB 167772672-167772927,CCC
Using the same setup as the previous example, if:
The Event Tag is set to DestinationIP and key column set to column 1 (range) Map Column to column 2 (value). The output values for CustomerVar89.
10-26 Sentinel User Guide

Figure 10-26: Number Range Map Definition
Figure 10-27: Event Configuration
If an event contains a destination IP of 10.0.1.14 (equivalent to numerical value of 167772430), the output for column CustomerVar89 within the event will be BBB.
Sentinel supports the following number ranges:
Range from negative number to negative number (for example, “-234—34”) Range from negative number to positive number (for example, “-234-34”) Range from positive number to positive number (for example, “234-236”) Single number range (negative) (for example, “-234”). In this case, the min and the
max will both be -234. Single number range (positive) (for example, “234”). In this case, the min and the
max will both be 234. Range from negative number to max number (for example, “-234-”). In this case, the
min will be -234 and the max will be (2^63 - 1). Range from positive number to max number (for example, “234-”). In this case, the
min will be 234 and the max will be (2^63 - 1).
NOTE: In all cases, the min must be less than or equal to the max (for example, “-234—235” is NOT valid).
Editing Map Definitions To edit a map definition:
1. Navigate to Admin tab and select Mapping Configuration from the navigation pane or click Mapping Configuration button.
2. Expand the folder of interest. 3. Highlight a map definition and click Edit.
Administration 10-27

NOTE: The editing function is disabled for map definitions that are under the UNMANAGED ITEMS folder.
Figure 10-28: Edit Map Definition window The edit function allows you to: set your delimiters set which row to start your map rename your columns
activate or deactivate a column set your column keys column filter
4. After making your changes, Click OK.
Deleting Map Definitions To delete a map definition:
1. Navigate to Admin tab and select Mapping Configuration from the navigation pane or click Mapping Configuration button.
2. Expand the folder of interest. 3. Highlight the map definition to be deleted. 4. Click Delete.
NOTE: Map definitions under the UNMANAGED ITEMS folder cannot be deleted.
10-28 Sentinel User Guide

Updating Map Data Updating allows you to replace the map source data file of a map on the server running DAS with another file. Your new map source data file must have the same delimiter, number of columns, and overall structure as the existing map data source file in order for the map to function properly after the update. The new map source data file should only differ from the existing file by the values that appear in the columns. If the new map source data file has a different structure than the existing file, use the “Edit” feature to update the map definition.
Map updates can be performed on demand from the Sentinel Control Center. To set up an automated process to update map data, it is possible to run an equivalent process from the command line.
To update map data from the Sentinel Control Center:
1. If you haven’t already, create a file containing the new map source data. This file can be generated (for example, from a data dump script), created manually from scratch, or be an edited version of the existing map data source file. If needed, you can obtain the existing map data source file from the location: For Windows:
%ESEC_HOME%\data\map_data
For UNIX:
$ESEC_HOME/data/map_data
2. Navigate to Admin tab and select Mapping Configuration from the navigation pane or click Mapping Configuration button.
3. Expand the folder of interest. Highlight the mapping to be updated. Click Update.
Figure 10-29: Map Data Update window
4. Select the new map data source file by clicking Browse and selecting the file with the new map data. After selecting the file, the data from the new map data source
Administration 10-29

file displays under the New tab. The map data you are replacing will be under the Current tab.
5. Uncheck or leave the default setting for Backup Existing Data On Server. Enabling this option results in a backup of the existing map data source file being put in the %ESEC_HOME%\bin\map_data (Windows) or $ESEC_HOME/data/map_data (UNIX) folder. The prefix of the name of the backup map data source file will be the name of the existing map data source file. The end of the filename will contain a set of random numbers followed by the .bak suffix. For example: vuln_attacks10197.bak.
6. Click OK. 7. The data from the new map data source file will be uploaded to the server,
replacing the contents of the existing map data source file. After the source data is completely uploaded, the map data will be regenerated and distributed to map clients (For example, Collector Manager).
To update map data using the command line:
1. If you haven’t already, create a file containing the new map source data. This file can be generated (for example, from a data dump script), created manually from scratch, or be an edited version of the existing map data source file. If needed, you can obtain the existing map data source file from the location: For Windows:
%ESEC_HOME%\data\map_data
For UNIX:
$ESEC_HOME/data/map_data
2. Log into the Sentinel database. 3. Find UUID for the map in the MD_CONFIG table (refer to the CONFIG_ID
column for the appropriate map listed in the VALUE column). 4. On the Sentinel Server machine, log in as esecadm. 5. Run the following command:
On Windows: map_updater.bat <uuid> <source path> [nobackup]
On UNIX: map_updater.sh <uuid> <source path> [nobackup]
NOTE: On Windows, if the map data is in a directory including a space (For example, Program Files), it might be necessary to place double quotes around the new data file path.
6. The data from the new map data source file will be uploaded to the server, replacing the contents of the existing map data source file. After the source data is completely uploaded, the map data will be regenerated and distributed to map clients (for example, Collector Manager).
Unless the optional -nobackup argument is added, the previous map data will be saved in a backup file on the server. Enabling this option results in a backup of the existing map data source file being put in the %ESEC_HOME%\bin\map_data (Windows) or $ESEC_HOME/data/map_data (UNIX) folder. The prefix of the name of the backup map data source file will be the name of the existing map data source file. The end of the
10-30 Sentinel User Guide

filename will contain a set of random numbers followed by the .bak suffix. For example: vuln_attacks10197.bak.
Event Configuration NOTE: In order to use the Event Configuration, your configuration.xml file must be pointing to a Communication Server that also has DAS_Binary and DAS_Query connected to it. This will normally be the case, by default, as long as your Communication Server and DAS processes are running.
Event Mapping Event Mapping is a mechanism that allows you to add data to an event by using data already in the event to reference and pull in data from an outside source. The outside data source is a map, which is defined using the “Mapping tab”. The data already in the event that should be used as the reference into the map and the data to be pulled from the map into the event are specified using the Events tab.
Because virtually any data set can be made into a map, Event Mapping is useful for incorporating into the event stream data from elsewhere in your organization. Some opportunities Event Mapping provides are:
Regulatory Compliance monitoring Policy compliance Response prioritization Enable security data to be analyzed related to business operations Enhance accountability
When an Event Mapping is defined, it is applied system-wide to all events from all Collectors. Additionally, Sentinel will automatically distribute map data to all processes that perform event mappings as well as keep the map data in these processes up-to-date. For these reasons, Event Mapping provides significant capabilities to support enterprise deployments.
Event Mapping comprises of four main parts:
Controller: Stores all map information Distributor: Automatically redistributes modified maps to those processes that
registered for the map Monitor: A monitor to detect changes in map source data Generator: Generates maps from source data
One application of Event Mapping is Sentinel's Asset Data functionality. For example, asset information is collected and stored in the Sentinel Database asset schema and is represented by a Physical Asset Entry. Soft assets, such as services and applications, are represented by an entry that is linked to a Physical Asset. The primary automated update mechanism for asset data is through an asset Collector reading data from a scanner such as Nmap. The asset Collector automates the retrieval of asset information by reading asset data from the scanner and populating the asset schema tables with this data. For Event Mapping, asset information is mapped from the destination IP and source IP.
There are two types of data sources:
External: A Collector populates that value in the event tag. Referenced from Map: Data is retrieved from a map to populate the tag.
Administration 10-31
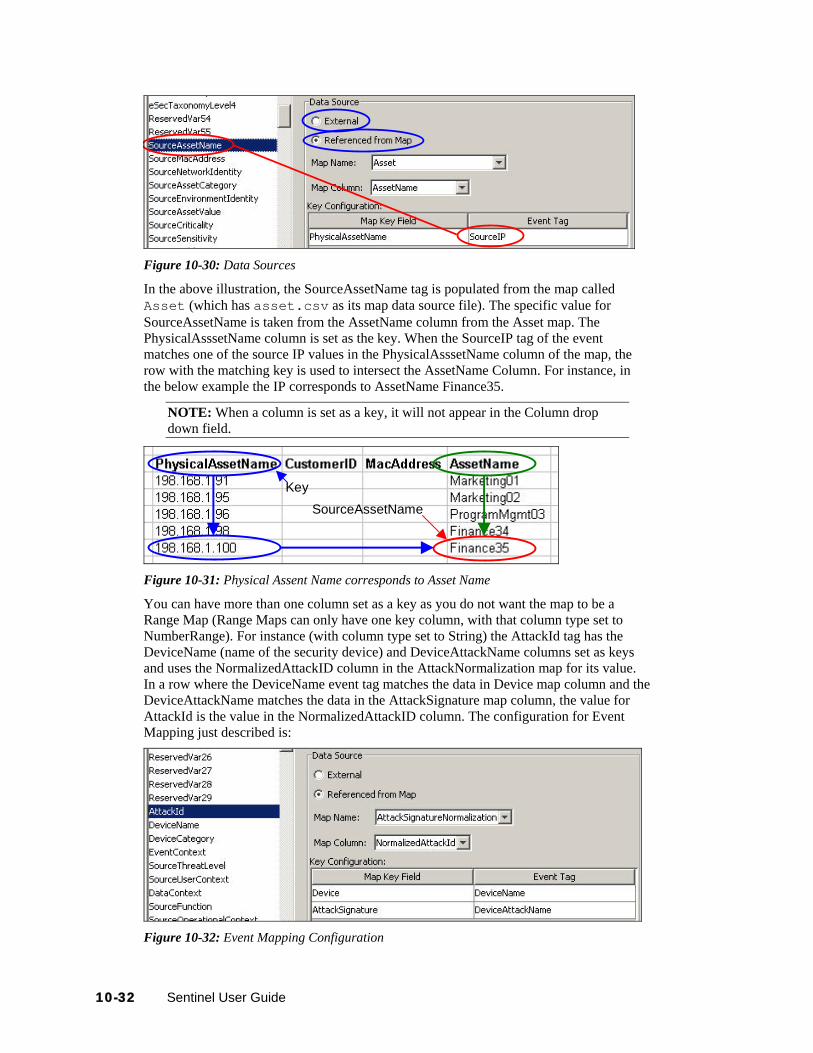
Figure 10-30: Data Sources
In the above illustration, the SourceAssetName tag is populated from the map called Asset (which has asset.csv as its map data source file). The specific value for SourceAssetName is taken from the AssetName column from the Asset map. The PhysicalAsssetName column is set as the key. When the SourceIP tag of the event matches one of the source IP values in the PhysicalAsssetName column of the map, the row with the matching key is used to intersect the AssetName Column. For instance, in the below example the IP corresponds to AssetName Finance35.
NOTE: When a column is set as a key, it will not appear in the Column drop down field.
SourceAssetName SourceAssetName
SourceAssetName
Key
Figure 10-31: Physical Assent Name corresponds to Asset Name
You can have more than one column set as a key as you do not want the map to be a Range Map (Range Maps can only have one key column, with that column type set to NumberRange). For instance (with column type set to String) the AttackId tag has the DeviceName (name of the security device) and DeviceAttackName columns set as keys and uses the NormalizedAttackID column in the AttackNormalization map for its value. In a row where the DeviceName event tag matches the data in Device map column and the DeviceAttackName matches the data in the AttackSignature map column, the value for AttackId is the value in the NormalizedAttackID column. The configuration for Event Mapping just described is:
Figure 10-32: Event Mapping Configuration
10-32 Sentinel User Guide

Key Key AttackId entry
Figure 10-33: Device and Attack Signature corresponds to Asset Name
To Configure Event tags (columns) to use Mapping:
1. Navigate to Admin tab and click Event Configuration in the navigation pane or click Event Configuration button.
2. Highlight an event tag entry from the Event Columns list.
NOTE: The original Event Tag name displays above the Label field. In addition, the description of the event column is provided.
Figure 10-34: Event Column List
3. Click Referenced from Map to configure the event tag to be populated with data from a map. Click External to keep whatever value the Collector put in the event tag (if any).
4. Click the Map Name field down arrow.
Figure 10-35: Data Source Select one of the available default maps or a map you have created.
5. Click the Map Column field down arrow and select a Map Column name. Depending on your Map Name choice in the previous step, these values will vary.
Administration 10-33

Figure 10-36: Value Selection _EXIST_ : This is a special Map Column that exists in every map. If this
Map Column is selected, a “1” will be put in the event tag if the key is in the map data. If the key is not in the map data, a “0” will be put in the event tag.
All other choices: Names of active columns within the map definition that are not set as a key (for example, CustomerId column in Asset or NormalizedAttackId column in AttackNormalization)
6. In the Key Configuration, for each row in the table select the event tag in the Event Tag column that will be matched against the map key column specified in the corresponding Map Key Field column. The rows in the Key Configuration table will depend on the Map Name selected.
NOTE: A key is a unique identifier for the row of data in the map data.
Figure 10-37: Key Configuration
7. Click Apply.
NOTE: Clicking Apply saves the changes you made for the currently selected event column in a temporary buffer. If you don't click Apply, when you select a different event column the changes you made to the previously selected event column are lost. Changes won’t be saved to the server until you click Save.
8. If you want to edit the Event Mapping of another Event column, repeat the steps above. Remember to click Apply after editing the Event Mapping of each Event column.
9. Click Save.
10-34 Sentinel User Guide

NOTE: Clicking Save will save your changes to the server. The save function saves all changes stored in the temporary buffer (when you clicked Apply).
Renaming Tags The Event Configuration window also allows you to assign names to existing event tag labels. For example, you can rename the label for event tag Ct2 to City. Doing this will result in the event tag that formally appeared in Sentinel Control Center as “Ct2” to now appear as “City”. Some places where event tags appear in Sentinel Control Center are filters, correlation rules, and Active Views.
Renaming Tags does not change the name of the variable in Collector scripts, however. Therefore, even if the event tag labeled Ct2 is renamed to City, the variable that must be used in a Collector script to reference this meta-tag will still be s_CT2.
Below is a before and after illustration of this feature in an Active View.
Figure 10-38: Active View window-Before illustration
Figure 10-39: Active View window-After illustration
To rename an event column:
1. Click Event Configuration in the navigation pane or click the Event Configuration button.
NOTE: The original Event Column name displays above the Label field. In addition, the description of the event column is provided.
2. Highlight an event column entry. 3. Specify a new value for your Event Column in the Label field.
Figure 10-40: Sentinel Database Manager window
4. Click Apply.
Administration 10-35

NOTE: Clicking on Apply saves the changes you made for the currently selected event tag in a temporary buffer. If you don't click Apply, when you select a different event tag, the changes you made to the previously selected event tag are lost. Changes won’t be saved to the server until you click Save.
5. Click Save.
NOTE: Clicking Save will save your changes to the server. The save function saves all changes stored in the temporary buffer (when you clicked Apply).
6. In order for changes to be visible in Sentinel Control Center, running Sentinel Control Centers must be closed and reopened.
Reporting Data NOTE: In order to use Reporting Data, your configuration.xml file must be pointing to a Communication Server that has DAS_Binary and DAS_Query connected to it. This will normally be the case, by default, as long as the Communication Server and DAS processes are running.
The Reporting Data tab is a Summary Management Interface for Sentinel. This tab allows you to enable and disable Summaries. Enabling a summary allows aggregation to start computing the counts for that particular summary.
A summary is a defined set of attributes that make up the key for which to compute the number of unique occurrences (event count) by each hour time period (event time). In the case of the EventSevDestPortSummary, when active, it saves the count of events for each unique combination of destination port and severity for an hour time frame. These saved computations of the event data allow for quicker summary reporting and querying. These reports are used by Crystal Reports. For more information, see Crystal Reports for Windows and Crystal Reports for Linux in the Sentinel Installation Guide. Certain summaries will need to be active in order for the summary reports to be accurate.
Aggregation is the process of calculating the running count for all active summaries as events flow through the system. These running counts are saved to the database in the respective summary tables.
Summaries Benefits:
Greatly reduced event data set Conformed dimensions that allow the ability to drill-down, roll-up and drill-across on
event data Summary reports run much faster with pre-computed summaries
Aggregation Benefits:
Only processes active summaries Does not affect event insertion into the real time database.
Reporting Data tab allows you to:
enable/disable any predefined summaries view attributes of each summary see the validity of a summary for a timeframe query which eventfiles need to be run so that the summary is complete
The following are all summaries already defined in the system. It lists the summary name, database table name and it’s attributes in a brief description about the summary.
10-36 Sentinel User Guide

Summary Name Table/Description EventSrcSummary EVT_SRC_SMRY_1
This summary sums the event count by source ip, source asset information, source port, source user, taxonomy, event_name, resource, Collector, protocol, severity and event time by hour
EventDestSummary EVT_DEST_SMRY_1 This summary sums the event count by
destination ip, destination asset information, destination port, destination user, taxonomy, event_name, resource, Collector, protocol, severity and event time by hour.
EventSevDestTxnmySummary EVT_ DEST_TXNMY_SMRY_1 This summary sums the event count by
destination ip, destination asset information, taxonomy, severity and event time by hour.
EventSevDestEvtSummary EVT_DEST_EVT_NAME_SMRY_1 This summary sums the event count by
destination ip, destination event asset, taxonomy, event name, severity and event time by hour.
EventSevDestPortSummary EVT_PORT_SMRY_1 This summary sums the event count by
destination port, severity and event time by hour.
EventSevSummary EVT_SEV_SMRY_1 This summary sums the event count by severity
and event time by hour. Table 10-2: Summary Name description
To disable/enable Summary:
1. Click Reporting Data in the navigation pane or click Reporting Data button. 2. To disable a summary, click Active in the Status column until it changes to say
InActive. 3. To enable a summary, click InActive in the Status column until it changes to say
Active.
Figure 10-41: Status Column To enable Aggregation for Top 10 reports for Crystal Reports: Enable the following three summaries: EventDestSummary EventSevSummary
Administration 10-37

EventSrcSummary Enable EventFileRedirectService in the das_binary.xml located: For UNIX:
$ESEC_HOME/config/das_binary.xml
For Windows:
%ESEC_HOME%\config\das_binary.xml
NOTE: To enable the summary you must set the property “Status” to ON for EventFileRedirect in das_binary.xml
To view information for a Summary:
1. Click Reporting Data in the navigation pane or click the Reporting Data button. 2. Click the … button in the Attributes column to see the attributes that makes up a
summary.
Figure 10-42: Summary Attributes
To check the Validity of a summary:
1. Click Reporting Data in the navigation pane or click the Reporting Data button. 2. Select Status. 3. Select the summary or summaries you want to query.
10-38 Sentinel User Guide
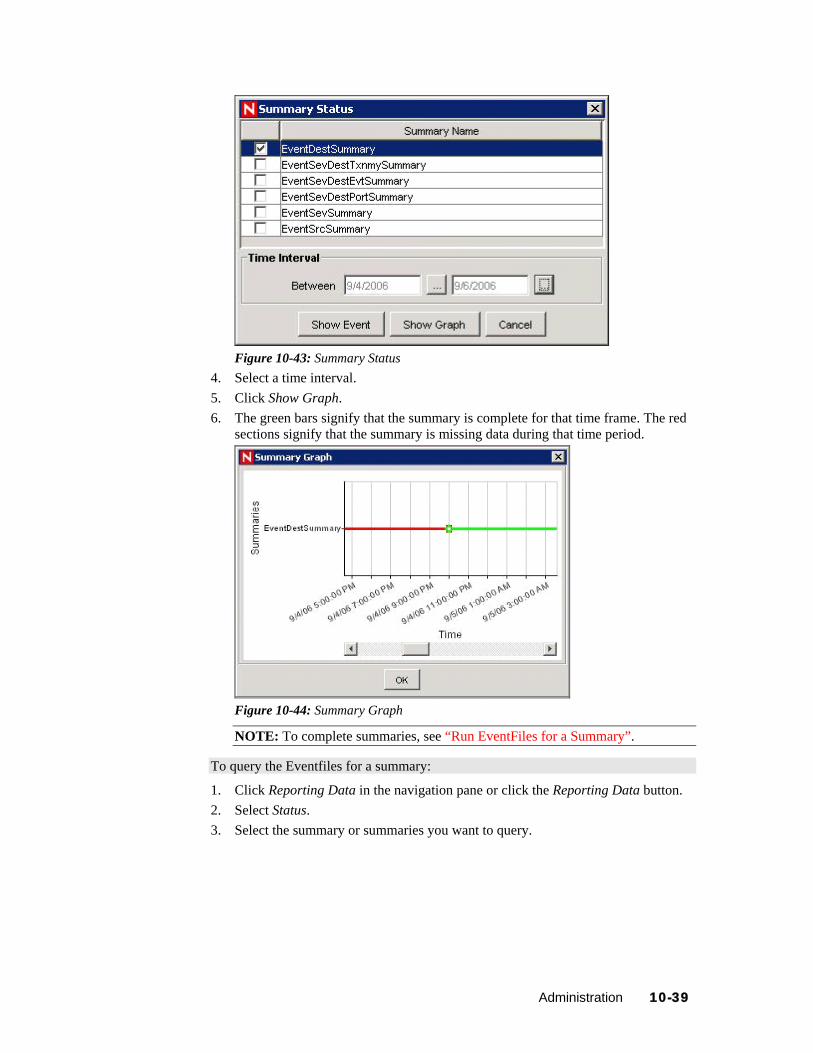
Figure 10-43: Summary Status
4. Select a time interval. 5. Click Show Graph. 6. The green bars signify that the summary is complete for that time frame. The red
sections signify that the summary is missing data during that time period.
Figure 10-44: Summary Graph
NOTE: To complete summaries, see “Run EventFiles for a Summary”.
To query the Eventfiles for a summary:
1. Click Reporting Data in the navigation pane or click the Reporting Data button. 2. Select Status. 3. Select the summary or summaries you want to query.
Administration 10-39
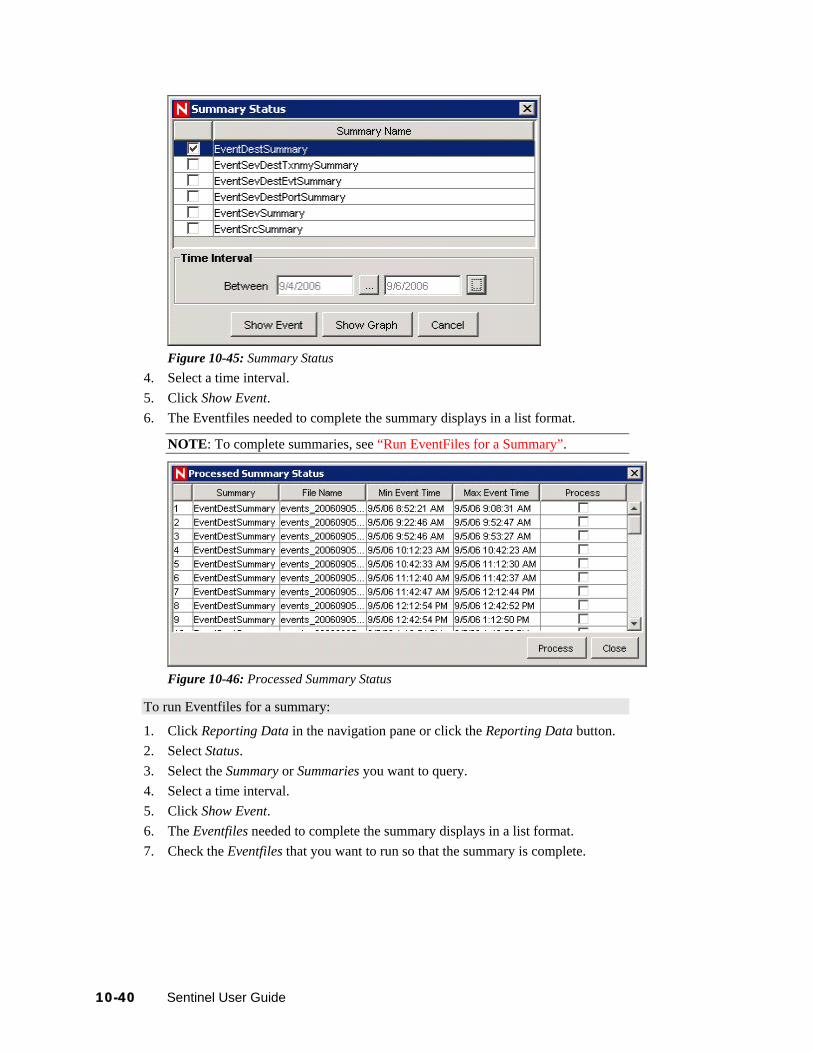
Figure 10-45: Summary Status
4. Select a time interval. 5. Click Show Event. 6. The Eventfiles needed to complete the summary displays in a list format.
NOTE: To complete summaries, see “Run EventFiles for a Summary”.
Figure 10-46: Processed Summary Status
To run Eventfiles for a summary:
1. Click Reporting Data in the navigation pane or click the Reporting Data button. 2. Select Status. 3. Select the Summary or Summaries you want to query. 4. Select a time interval. 5. Click Show Event. 6. The Eventfiles needed to complete the summary displays in a list format. 7. Check the Eventfiles that you want to run so that the summary is complete.
10-40 Sentinel User Guide

Figure 10-47: Eventfiles selection
8. Click Process.
User Configurations You must have the user permission in order to work in the User Configuration window.
User configuration allows you to:
“Create a User Account” “Modify a User Account” “View Details of a User Account” “Clone a User Account” “Delete a User Account”
“Terminating an Active Session” “Add a iTRAC Role” “Delete iTRAC Role” “Viewing details of an iTRAC Role”
The installer will create the following default users on the Sentinel Server:
Oracle and Microsoft SQL 2005 Authentication: esecdba: Schema owner (configurable at install time). esecadm: Sentinel administrator user (configurable at install time).
NOTE: For UNIX, the Installer also creates the operating system user with the same user name and password.
esecrpt: Sentinel Reporter User, password as the admin user. ESEC_CORR: Sentinel Correlation Engine users, used to create incidents. esecapp: Sentinel application username for connecting to the database.
Windows Authentication: Sentinel DB Administrator: Schema owner (configurable at install time). Sentinel Administrator: Sentinel administrator user (configurable at install time). Sentinel Report User: Sentinel Reporter user, password as the admin user. Sentinel Application DB User: Sentinel application username for connecting to the
database
Opening the User Manager Window To open the User Manager window:
1. Click the Admin tab. 2. Click Admin > User Configuration.
Creating a User Account NOTE: In order to meet stringent security configurations required by Common Criteria Certification, Sentinel requires a strong password with the following characteristics:
Administration 10-41

Select passwords of at least 8 with characters in length that includes at least one UPPER CASE, one lower case, one special symbol (!@#$%^&*()_+), and one numeric (0-9).
Your password might not contain your e-mail name or any part of your full name.
Your password should not be a “common” word (for example, it should not be a word in the dictionary or slang in common use).
Your password should not contain words from any language, because numerous password-cracking programs exist that can run through millions of possible word combinations in seconds.
You should select a password you can remember and yet is complex. For example, Msi5!YOld (My Son is 5 years old) OR IhliCf5#yN (I have lived in California for 5 years now).
To use this feature, you must have the user permission User Management. User permissions are fairly detailed. For more information, see Sentinel Database Users, Roles and Access Permissions in Sentinel User Reference Guide.
NOTE: The Sentinel Database Administrator, Sentinel Administrator, Sentinel Application User, and Sentinel Report User are created during installation. For more information about these users, see Sentinel User Accounts in Sentinel User Reference Guide.
To create a user account using local authentication:
1. Go to the Admin tab. 2. Open the User Configuration folder. 3. Open the User Manager window. 4. Click Add a new User,
Figure 10-48: Add a new User or highlight any user, right-click and select Add User.
Figure 10-49: User Manager window
5. Under Authorization: Select Local for Authentication. Specify User Name.
10-42 Sentinel User Guide

Specify Password. Confirm Password.
6. For Security Filter, click the down arrow. The Filter Selection window displays and shows all public filters.
7. Select a filter and click Select or click Add to create and then select a new filter.
NOTE: After assigning a security filter to a user, you cannot delete that filter.
(Optional) Under Details, specify: First Name Last Name Department Phone Email
8. Click the Permissions tab and assign user permissions. 9. Click the Roles tab and select an iTRAC workflow role for the user. 10. Click OK.
NOTE: Oracle does not allow the creation of users named the same as one of the Oracle Reserved words. Also, Sentinel does not allow you to use these names.
To create a user account using domain authentication:
1. Go to the Admin tab. 2. Open the User Configuration folder. 3. Open the User Manager window. 4. Click Add a new User,
Figure 10-50: Add a new User or highlight any user, right-click and select Add User.
Figure 10-51: User Manager window
5. Under Authorization: Select Domain authentication. Specify an existing User Name in the form Domain\Username.
Administration 10-43

6. For Security Filter, click the down arrow. The Filter Selection window displays and shows all public filters.
7. Select a filter and click Select or click Add to create and then select a new filter.
NOTE: After assigning a security filter to a user, you cannot delete that filter.
(Optional) Under Details, specify: First Name Last Name Department Phone Email
8. Click the Permissions tab and assign user permissions. 9. Click the Roles tab and select an iTRAC workflow role for the user. 10. Click OK.
NOTE: Oracle does not allow the creation of users named the same as one of the Oracle Reserved words. Also, Sentinel does not allow you to use these names.
Modifying a User Account To use this feature, you must have the User Management permission.
NOTE: The Sentinel Database Administrator, Sentinel Administrator, Sentinel Application User, and Sentinel Report User are created during installation. For more information about changing passwords for these users, see Sentinel User Accounts in Sentinel User Reference Guide.
To modify a user account:
1. Open the User Manager window. 2. Double-click a user account or right-click > User Details. 3. Modify the account. 4. Click OK.
Viewing Details of a User Account To use this feature, you must have the User Management permission.
To view user account details:
1. Open the User Manager window. 2. Double-click a user account or right-click > User Details. 3. Review the details of the user account and close the window.
Cloning a User Account To clone a user account:
1. Open the User Manager window. 2. Select a user account ID, right-click > Clone User. 3. Change the user information and the user permissions. 4. Click Save.
10-44 Sentinel User Guide

Administration 10-45
Deleting a User Account To use this feature, you must have the User Management permission.
To delete a user account:
1. Open the User Manager window. 2. Select a user account ID, right-click > Delete User. 3. A Delete box displays. Click Yes to Delete the User.
Terminating an Active Session To terminate an active session:
1. Open the Active User Sessions window. 2. Highlight an active session you want to terminate. 3. Right click > Kill Session. 4. You will be prompted for a termination message. This option is provided so that
you can inform the user why you are killing the session.
Adding an iTRAC Role To add an iTRAC Role:
1. Open the Role Manager window. 2. Click Add a new Role,
Figure 10-52: Add a new Role or right-click > Add New Role.
Deleting an iTRAC Role To delete an iTRAC Role:
1. Open the Role Manager window. 2. Select a role, right-click > Delete Role.
Viewing Details of a Role To view role details:
1. Open the Role Manager window. 2. Select a role, right-click > Role Details.
Solution Pack Using Solution Pack you can import and install different content types (Correlation Rules, Dynamic List, Reports and so on) in Sentinel. You can import solution pack available in zip file from other system or server. These zip Solution Packs are created using Solution Designer. For more information on Solution Designer, see “Solution Pack” section.

11 Sentinel Data Manager
Topic Page
Understanding Sentinel Data Manager 11-1Starting the SDM GUI 11-1SDM Command Line 11-9
Understanding Sentinel Data Manager The Sentinel Data Manager (SDM) is a tool by which users can manage the Sentinel Database. The SDM allows users to perform the following operations:
Monitor Database Space Utilization View and Manage Database Partitions Configure Auto-Archives Configure Auto-Addition of Partitions
Monitor Database Space Utilization, View and Manage Database Partitions and Configure Auto-Archives operations can be accessed using the Sentinel Data Manager GUI or using a command line interface to SDM.
NOTE: Event Mapping, Summary Data and Reporting data are SDM functionalities which are moved from SDM to Sentinel Control Center in Sentinel 6.x.
Starting the SDM GUI There are several prerequisites to run the SDM GUI on a machine:
If using an Oracle database, the Oracle JDBC driver must be downloaded and placed in the $ESEC_HOME/lib (UNIX) or %ESEC_HOME%\lib (Windows) directory. As of the print date of this document, this file could be found at the following URL: http://otn.oracle.com/software/tech/java/sqlj_jdbc/index.html. This file, typically called ojdbc14.jar, will be installed by default on the machine that hosts the Sentinel DAS component.
The user must know the following information: Name and password for the Sentinel Database User (esecdba by default) Database host server Database (instance) name Port used for database communications (1521 by default for Oracle and 1433
by default for SQL Server)
To start SDM GUI on UNIX:
1. Login to the UNIX box as a member of the esec group (for example: esecadm). 2. Go to $ESEC_HOME/sdm 3. Provide the following command line:
Sentinel Data Manager 11-1
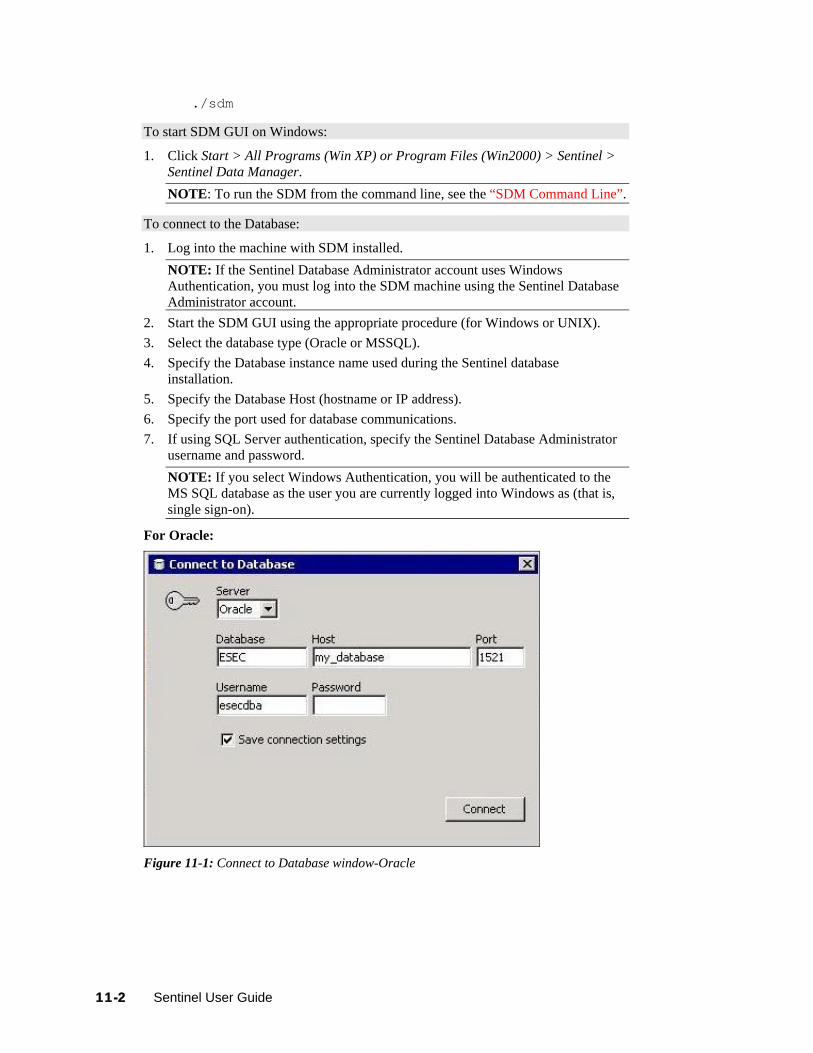
./sdm
To start SDM GUI on Windows:
1. Click Start > All Programs (Win XP) or Program Files (Win2000) > Sentinel > Sentinel Data Manager. NOTE: To run the SDM from the command line, see the “SDM Command Line”.
To connect to the Database:
1. Log into the machine with SDM installed. NOTE: If the Sentinel Database Administrator account uses Windows Authentication, you must log into the SDM machine using the Sentinel Database Administrator account.
2. Start the SDM GUI using the appropriate procedure (for Windows or UNIX). 3. Select the database type (Oracle or MSSQL). 4. Specify the Database instance name used during the Sentinel database
installation. 5. Specify the Database Host (hostname or IP address). 6. Specify the port used for database communications. 7. If using SQL Server authentication, specify the Sentinel Database Administrator
username and password. NOTE: If you select Windows Authentication, you will be authenticated to the MS SQL database as the user you are currently logged into Windows as (that is, single sign-on).
For Oracle:
Figure 11-1: Connect to Database window-Oracle
11-2 Sentinel User Guide

For Windows:
Figure 11-2: Connect to Database window-MS-SQL
NOTE: If you select to save your connection settings, the settings are saved to the local sdm.connect file. By default the sdm.connect file is located in $ESEC_HOME/bin directory or %ESEC_HOME%\bin folder. Next time you start the GUI, the connection settings will be re-populated from the sdm.connect file. This file can be used when running SDM from the command line.
8. Click Connect. The SDM is now ready for use.
Partitions Tab The Sentinel database is partitioned by time to simplify maintenance and improve the performance of the database. The Partitions tab in the SDM allows users to view and manage database partitions for the tables that hold event data, correlated event data, and summary data.
To view partitions in the GUI:
1. Click the Partitions tab. 2. Select the table in the dropdown list you want to see.
SDM displays the partitions of the currently selected Database Table.
Each row in the Segments table displays the related Database Table, Time Range, Status and Name of the partition.
The Status of each of the partitions shown in the Segments table will have one of the following states:
Sentinel Data Manager 11-3

Online Partition with data that is available for access Online Current Partition to which events are currently getting inserted Online Archived Partition with data that has been archived but is still
accessible because the partition has not been dropped Offline Archived Partition with data that has been archived and then
dropped from the database Online Archived Imported
Partition with data that has been archived, dropped from the database, and then re-imported into the database
Table 11-1: Partition States
NOTE: If you delete a partition without archiving it, it is deleted from the partition list in the GUI.
Figure 11-3: Sentinel Database Manager-Partitions
At the bottom of the Partitions tab, there are several smaller tabs that allow the user to perform the following operations:
Add empty partitions to the database Delete partitions from the database Archive data from partitions to flat files in a specified, pre-existing directory Import Partitions Drop Partitions
Many of these operations can be executed automatically in the database using stored procedures, but this tab allows the administrator to perform these tasks manually.
To manage partitions:
1. Click the Partitions tab. 2. Select the table in the dropdown list.
11-4 Sentinel User Guide
NOTE: Sentinel partitioned tables are organized into 2 groups. One is the EVENTS table group, which includes EVENTS and CORRELATED_EVENTS; the other is the summary table group, which includes all summary, or aggregate, tables. If any one of the tables in the group is selected then the changes will apply to all the tables in the group.
3. Select the tab in the bottom of the window that relates to the operation that you want to perform – Add, Delete, Archive, Import or Release.
To add partitions:
1. Select the Add partitions tab. 2. Specify the number of days over which to add the partitions.
NOTE: You can specify the number of partitions in Partition Configuration in SDM GUI.
3. Click Add.
To delete partitions:
1. Select the Delete partitions tab. 2. Specify the number of days for which older partitions will be deleted. 3. Click Delete.
To import partitions:
1. Select the Import partitions tab. 2. Select the partition in the Segment table into which the data will be imported.
NOTE: You can specify the input directory in the “Archive Destination” field in Partition configuration tab in SDM GUI.
3. Click Import.
To release imported partitions:
1. Select the Release partitions tab. 2. Select the partition in the Segment table that will be released. 3. Click Release.
Archiving Events, correlated events, and aggregation (or summary) tables can all be archived using SDM. There are several requirements for archiving:
The directory to which the partitions are archived must already exist on the database server (not the machine running SDM); SDM does not create the directory.
On UNIX systems, archiving cannot be to the /root directory. On UNIX systems, the oracle user must have permissions to write to the archive
directory. On Windows systems, owner of the SQL Server Agent service must have permissions
to write to the archive directory.
To archive partitions:
1. Select the Archive partitions tab. 2. Specify the number of days for which older partitions will be archived.
Sentinel Data Manager 11-5

NOTE: You can specify the archive directory in the Archive Destination field in Partition configuration tab in SDM GUI.
3. Click Archive.
Oracle Archive Partitions tab:
Figure 11-4: Oracle Archive Partition Tab
Microsoft SQL Archive Partitions tab:
Figure 11-5: Microsoft SQL Archive Partition Tab
Tablespaces Tab The Tablespaces tab in the SDM allows users to view the current database space utilization, including:
Total space allocated for each tablespace Space used by each tablespace Space available (free) for each tablespace.
NOTE: All the tablespaces are set to Autogrow.
11-6 Sentinel User Guide

Figure 11-6: Sentinel Database Manager-Tablespaces
Color coded bar graphs help to visualize the total space allocated for each tablespace and the percent used of each tablespace.
NOTE: On Microsoft SQL Server, “tablespace” usage represents “filegroup” usage.
Partition Configuration The Partition Configuration tab in the SDM allows you to set parameters to auto-archive partitions. It also allows you to auto-add partitions.
To configure auto-archive parameters:
1. Click the Partition Configuration tab. The Partition Configuration window displays.
Sentinel Data Manager 11-7

Figure 11-7: Sentinel Database Manager-Partition Configuration
2. Select the table group from the drop-down list. 3. Specify the following partition configuration information:
Partition Interval: Specify the number of partitions that should be created per day or per hour.
Days Online: Number of days of data to keep online in the database. Archive destination: Specify the destination to store the automatically
archived data and the manually archived data. Offline operation: Select archive and/or drop the data.
NOTE: Data that is dropped without archiving cannot be retrieved using SDM. You should almost always select the archive option.
4. Specify the Job Schedule parameters: Check Jobs Enabled checkbox if its not selected. By default the Jobs Enabled
checkbox will be checked if you have selected this feature during installation. Schedule adding partitions and offline operation parameters. Click Save. Click History to view the Job History.
5. Specify the Job Properties: Add Min: Minimum number of days of partitions for future data that should
exist in the database at any time Add Max: Maximum number of days of partitions for future data that should
exist in the database at any time Archive Chunk: Minimum number of days of partitions that will account to
total number of days of partitions for Archive. NOTE: If the fewer than Add Min days partitions exist in the database, partitions are added until there are enough partitions for Add Max days. Archiving also is
11-8 Sentinel User Guide

done in chunks of days so that these database operations are not necessary every day.
6. Click Save.
SDM Command Line The SDM command line functions can be used instead of the GUI. The command line can be used to create a batch file or cron job for SDM operations, but Novell recommends using auto-archiving instead. Auto-archiving can be configured on the Partition Configuration tab of the SDM GUI.
The first step to using the SDM command line is to create a file that stores the connection properties for the database.
“General Syntax” “Start SDM GUI” “Save Connection Properties” “Add Partitions” “Drop Partitions” “View Partitions” “Archive Data” “Delete Data” “Listing Files to Import” “Import Data” “Delete Import Data” “Viewing Sentinel Database Space Usage” “Update Map Data”
General Syntax of the SDM command [path to SDM] –action [actionname] [action-specific
flags] [path to database connection file]
The specific flags for each action are described below.
Starting SDM GUI startGui (DEFAULT)
-action startGui [-connectFile <filePath>]
Saving Connection Properties for Sentinel Data Manager The saveConnection command saves the database connection details to a specified file. These connection details are necessary for all other SDM command line operations.
If you have run the SDM GUI with “Save connection settings” selected, the saveConnection command is not necessary. You can use the sdm.connect file located in %ESEC_HOME%\sdm for Windows or $ESEC_HOME/sdm for UNIX.
The saveConnection command uses the following flags:
Sentinel Data Manager 11-9

-action saveConnection -server <oracle or mssql2005> -host <database host IP Address or host name to connect to> -port <database port number to connect to [Oracle default: 1521/SQL
Server default: 1433]> -database <database name/SID> -driverProps <Properties File> -dbuser <database username> -password <database password> -winAuth Used for Windows authentication. When using this option, -user
and –password are not needed. -connectFile <filenameToSaveConnection>
Table 11-2: saveConnection command flags
The application saves all the above connection details along with the encrypted password to the sdm.connect file. All other SDM command line commands will refer to the specified file. This step should be completed first time you use the SDM command line on a machine and every time you want to change the connection details the application uses.
To run saveConnection:
1. Execute the command as follows:
-action saveConnection -server <oracle/mssql2005> -host <hostIpaddress/hostName> -port <portnum> -database <databaseName/SID> [-driverProps <propertiesFile] {-user <dbUser> -password <dbPass> | -winAuth} -connectFile <filenameToSaveConnection>
The following example will save connections for a host with an IP address of 10.0.0.1 at port 1521 (default for Oracle, for SQL Server, default is 1433). Oracle Example:
./sdm -action saveConnection -server oracle -host 10.0.0.1 -port 1521 -database esec -user esecdba -password XXXXXX -connectFile sdm.connect
SQL Server Example (using SQL Server Authentication):
sdm -action saveConnection -server mssql -host 10.0.0.2 -port 1433 -database esec -user esecdba -password XXXXXX -connectFile sdm.connect
SQL Server Example (Windows Authentication):
sdm -action saveConnection -server mssql -host 10.0.0.2 -port 1433 -database esec –winAuth -connectFile sdm.connect
This will save the connection details to the sdm.connect file. All the rest of the commands will take this filename as input to connect to the designated database and to perform their actions.
Adding Partitions This action (addPartitions) adds the required number of partitions in the following tables according to the partition configuration settings:
Oracle: EVENTS
11-10 Sentinel User Guide

CORRELATED_EVENTS EVT_DEST_EVT_NAME_SMRY_1 EVT_DEST_SMRY_1 EVT_DEST_TXNMY_SMRY_1 EVT_PORT_SMRY_1 EVT_SEV_SMRY_1 EVT_SRC_SMRY_1
SQL Server EVENTS CORRELATED_EVENTS EVT_DEST_EVT_NAME_SMRY_1 EVT_DEST_SMRY_1 EVT_DEST_TXNMY_SMRY_1 EVT_PORT_SMRY_1 EVT_SEV_SMRY_1 EVT_SRC_SMRY_1
NOTE: Partitions are added in database both for Events and Correlated events if you select any one of these two. Partitions will be added for all the summary tables if you select any one of them.
If you are configured to have 10 days worth of partitions, every time you run addPartitions it checks to see if you have 10 days of partitions ahead. If you have enough partitions for next 10 days it will not do anything. If not, it will add the required number of partitions for 10 days.
This action uses the following flags:
-action addPartitions -connectFile <filePath> -tableName <table name> -keepDays <days to add>
Table 11-3: Adding Partition flags
To run addPartitions:
1. Execute this command as follows:
-action addPartitions -connectFile <filePath> -tableName <table name> -keepDays <days to add>
Oracle Example:
./sdm -action addPartitions -connectFile sdm.connect -tableName EVENTS -keepDays 10
SQL Server Example:
sdm -action addPartitions -connectFile sdm.connect -tableName EVENTS -keepDays 10
Dropping Partitions This action (dropPartition) drops all the partitions older than the flag keepDays from the following tables:
Oracle: EVENTS CORRELATED_EVENTS EVT_DEST_EVT_NAME_SMRY_1
Sentinel Data Manager 11-11

EVT_DEST_SMRY_1 EVT_DEST_TXNMY_SMRY_1 EVT_PORT_SMRY_1 EVT_SEV_SMRY_1 EVT_SRC_SMRY_1
SQL Server EVENTS CORRELATED_EVENTS EVT_DEST_EVT_NAME_SMRY_1 EVT_DEST_SMRY_1 EVT_DEST_TXNMY_SMRY_1 EVT_PORT_SMRY_1 EVT_SEV_SMRY_1 EVT_SRC_SMRY_1
To prevent unintentional loss of data, this action does not drop any partitions that are not archived. If you want to delete unarchived partitions, use the forceDelete flag.
WARNING: If - forceDelete is used, the deleted data cannot be recovered, so use this option with caution.
This action uses the following flags:
-action dropPartitions -keepDays <number of days to keep> -forceDelete (optional)
<either “true” or “false”> This defaults to false if not specified, meaning that only the partitions that are older than keepDays and are already archived will be dropped. If set to true, all partitions older than keepDays will be dropped, even if they have not been archived.
-connectFile <filePath> -tableName <table name>
Table 11-4: Dropping Partition flags
NOTE: Sentinel partitioned tables are organized into 2 groups. One is the EVENTS table group, which includes EVENTS and CORRELATED_EVENTS; the other is the summary table group, which includes all summary, or aggregate, tables. If any one of the tables in the group is specified by the –tableName parameter, the dropPartition operation is applied to all tables in that group.
To run dropPartition:
Execute this command as follows:
-action dropPartitions -keepDays <numberofDaysToKeep> -tableName <table name> [-forceDelete <true/false>] -connectFile <filePath>
The following examples drops all the partitions older than 30 days making sure all the partitions are archived. All partitions that were skipped (not removed) because they have not been archived are listed when the operation completes. Oracle Example:
11-12 Sentinel User Guide

./sdm –action dropPartitions –keepDays 30 –tableName CORRELATED_EVENTS –forceDelete false –connectFile sdm.connect
SQL Example:
sdm –action dropPartitions –keepDays 30 –tableName CORRELATED_EVENTS –forceDelete false –connectFile sdm.connect
Viewing Partition Summaries This action (ViewPartitions) displays the partition summary of the following supported tables:
Oracle: EVENTS CORRELATED_EVENTS EVT_DEST_EVT_NAME_SMRY_1 EVT_DEST_SMRY_1 EVT_DEST_TXNMY_SMRY_1 EVT_PORT_SMRY_1 EVT_SEV_SMRY_1 EVT_SRC_SMRY_1
SQL Server EVENTS CORRELATED_EVENTS EVT_DEST_EVT_NAME_SMRY_1 EVT_DEST_SMRY_1 EVT_DEST_TXNMY_SMRY_1 EVT_PORT_SMRY_1 EVT_SEV_SMRY_1 EVT_SRC_SMRY_1
NOTE: You need to have SDM installed in order to view the partition summary.
This command uses the following flags:
-action viewPartitions -tableName <table name> -connectFile <filePath>
Table 11-5: Viewing Partition Summaries flags
To View Partition Summaries:
Execute this command as follows:
-action viewPartitions -tableName <table name> -connectFile <filePath>
The following example, displays the list of partitions of the EVENTS table and status of each partition. Oracle Example:
./sdm –action viewPartitions –tableName EVENTS –connectFile sdm.connect
SQL Server Example:
Sentinel Data Manager 11-13

sdm –action viewPartitions –tableName EVENTS –connectFile sdm.connect
Archiving Data Run this action (archiveData) after you set your archive configuration (this can be configured in Partition Configuration tab in SDM GUI). This action archives the data from the given table name according to the archive configuration. It archives data from:
Oracle: EVENTS CORRELATED_EVENTS
SQL Server EVENTS CORRELATED_EVENTS
NOTE: Sentinel partitioned tables are organized into 2 groups. One is the EVENTS table group, which includes EVENTS and CORRELATED_EVENTS; the other is the summary table group, which includes all summary, or aggregate, tables. If any one of the table in the group is specified by the –tableName parameter, the archiveData operation is applied to all tables in that table group.
This command uses the following flags:
-action archiveData -connectFile <filePath> -tableName <table name> -keepDays <numberOfDaysToKeep>
Table 11-6: Archiving Data flags
To run archiveData:
1. Execute this command as follows:
-action archiveData -connectFile <filePath> -tableName <table name> -keepDays <numberOfDaysToKeep>
The following examples archive events and correlated events from the EVENTS and CORRELATED_EVENTS tables according to the value set during archive configuration (using the archiveConfig command). Oracle Example:
./sdm -action archiveData -connectFile sdm.connect –tableName EVENTS –keepDays 30
SQL Server Example:
sdm -action archiveData -connectFile sdm.connect –tableName EVENTS –keepDays 30
Deleting Data This action (deleteData) deletes the data older than a specified number of days from the given table name. It deletes data from:
Oracle: EVENTS CORRELATED_EVENTS EVT_DEST_EVT_NAME_SMRY_1 EVT_DEST_SMRY_1
11-14 Sentinel User Guide

EVT_DEST_TXNMY_SMRY_1 EVT_PORT_SMRY_1 EVT_SEV_SMRY_1 EVT_SRC_SMRY_1
SQL Server
EVENTS CORRELATED_EVENTS EVT_DEST_EVT_NAME_SMRY_1 EVT_DEST_SMRY_1 EVT_DEST_TXNMY_SMRY_1 EVT_PORT_SMRY_1 EVT_SEV_SMRY_1 EVT_SRC_SMRY_1
NOTE: This action does not drop any partitions that are not archived. If you want to delete unarchived partitions, the optional flag forceDelete has to be specified with a value of true.
If forceDelete is used:
false or not specified drops only the partitions older than keepDays and those that are archived
true drops all the partitions older than keepDays including unarchived partitions
Table 11-7: forceDelete options
This command uses the following flags:
-action deleteData -keepDays <number of days to keep> [-forceDelete] <either true or false> -connectFile <filePath> -tableName <table name>
Table 11-8: Deleting Data flags
To run deleteData:
1. Execute this command as follows:
-action deleteData -keepDays <numberofDaysToKeep> [-forceDelete <true/false>] -connectFile <filePath> -tableName <table name>
Oracle Example: The following example drops partitions from all tables older than 13 days making sure all dropped partitions are archived. In the end, a list is generated of any partitions that were not deleted if they have not been archived.
./sdm -action deleteData -keepDays 13 -forceDelete false -connectFile sdm.connect –tableName EVENTS
SQL Server Example: The following example drops the partitions from all tables older than 13 days making sure all dropped partitions are archived. In the end, it lists any partitions that were not deleted if they have not been archived.
Sentinel Data Manager 11-15

sdm -action deleteData -keepDays 13 -forceDelete false -connectFile sdm.connect –tableName EVENTS
Listing Files to Import This action (filesToImport) is used to list the files needed to import the data between the given dates into the following supported tables:
SQL Server HIST_EVENTS HIST_CORRELATED_EVENTS
NOTE: The tables are imported in Oracle with the same name they are archived with.
If these files have been moved to another location because of the original archiving operation (F, moved to tape), they must be restored to a directory accessible from the database server with their original file names.
This command uses the following flags:
-action filesToImport -tableName <table name> -startDate <mm/dd/yyyy hh24:mi:ss> -endDate <mm/dd/yyyy hh24:mi:ss> -connectFile <filePath>
Table 11-9: Listing files to Import flags
NOTE: hh24 is hours represented in 24 hour format. For example, 1:15:00 p.m. is 13:15:00 and 3:00:00 a.m. is 03:00:00.
To run filesToImport:
1. Execute this command as follows:
-action filesToImport -tableName <table name> -startDate <mm/dd/yyyy hh24:mi:ss> -endDate <mm/dd/yyyy hh24:mi:ss> -connectFile <filePath>
The following example lists all files containing data between dates “09/25/2007 00:00:00” (Sep 25th midnight) and “09/26/2007 00:00:00” (Sep 26th midnight) that have been previously archived. Oracle Example:
./sdm –action filesToImport -tableName Events –startDate 09/25/2007 00:00:00 –endDate 09/26/2007 00:00:00 –connectFile sdm.connect
SQL Server Example:
sdm –action filesToImport -tableName Events –startDate 09/25/200\7 00:00:00 –endDate 09/26/2007 00:00:00 –connectFile sdm.connect
The following example lists all the files containing the data between dates “09/25/2007 16:00:00” (Sep 25th 4 PM) and “09/26/2007 18:00:00” (SEP 26, 6 PM) that has been archived earlier and can be imported back. Oracle Example:
11-16 Sentinel User Guide
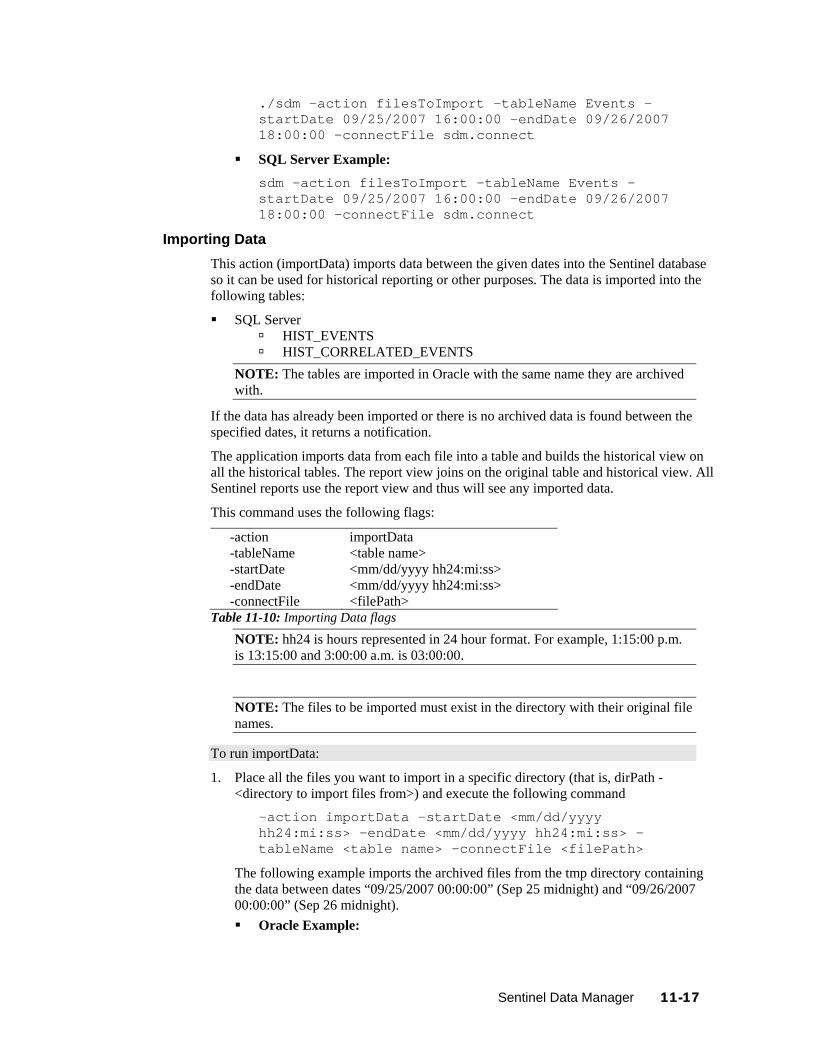
./sdm –action filesToImport -tableName Events –startDate 09/25/2007 16:00:00 –endDate 09/26/2007 18:00:00 –connectFile sdm.connect
SQL Server Example:
sdm –action filesToImport -tableName Events –startDate 09/25/2007 16:00:00 –endDate 09/26/2007 18:00:00 –connectFile sdm.connect
Importing Data This action (importData) imports data between the given dates into the Sentinel database so it can be used for historical reporting or other purposes. The data is imported into the following tables:
SQL Server HIST_EVENTS HIST_CORRELATED_EVENTS
NOTE: The tables are imported in Oracle with the same name they are archived with.
If the data has already been imported or there is no archived data is found between the specified dates, it returns a notification.
The application imports data from each file into a table and builds the historical view on all the historical tables. The report view joins on the original table and historical view. All Sentinel reports use the report view and thus will see any imported data.
This command uses the following flags:
-action importData -tableName <table name> -startDate <mm/dd/yyyy hh24:mi:ss> -endDate <mm/dd/yyyy hh24:mi:ss> -connectFile <filePath>
Table 11-10: Importing Data flags
NOTE: hh24 is hours represented in 24 hour format. For example, 1:15:00 p.m. is 13:15:00 and 3:00:00 a.m. is 03:00:00.
NOTE: The files to be imported must exist in the directory with their original file names.
To run importData:
1. Place all the files you want to import in a specific directory (that is, dirPath - <directory to import files from>) and execute the following command
-action importData -startDate <mm/dd/yyyy hh24:mi:ss> -endDate <mm/dd/yyyy hh24:mi:ss> -tableName <table name> -connectFile <filePath>
The following example imports the archived files from the tmp directory containing the data between dates “09/25/2007 00:00:00” (Sep 25 midnight) and “09/26/2007 00:00:00” (Sep 26 midnight). Oracle Example:
Sentinel Data Manager 11-17
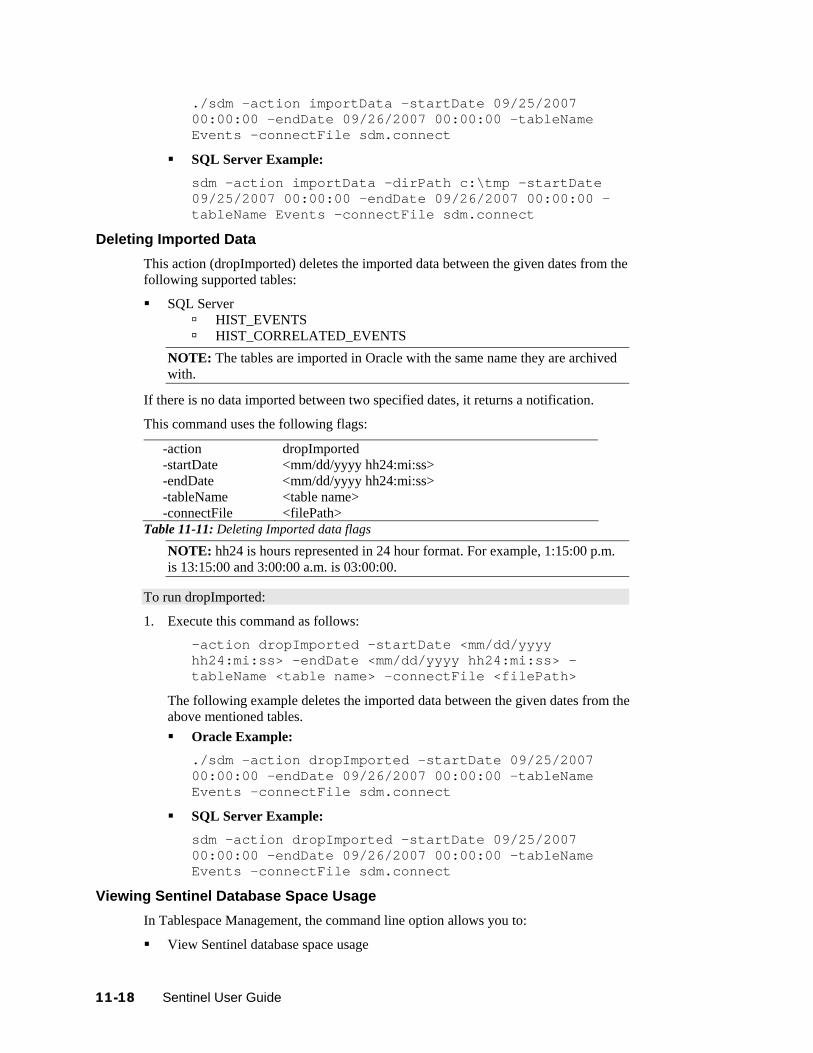
./sdm –action importData –startDate 09/25/2007 00:00:00 –endDate 09/26/2007 00:00:00 -tableName Events –connectFile sdm.connect
SQL Server Example:
sdm –action importData –dirPath c:\tmp –startDate 09/25/2007 00:00:00 –endDate 09/26/2007 00:00:00 -tableName Events –connectFile sdm.connect
Deleting Imported Data This action (dropImported) deletes the imported data between the given dates from the following supported tables:
SQL Server HIST_EVENTS HIST_CORRELATED_EVENTS
NOTE: The tables are imported in Oracle with the same name they are archived with.
If there is no data imported between two specified dates, it returns a notification.
This command uses the following flags:
-action dropImported -startDate <mm/dd/yyyy hh24:mi:ss> -endDate <mm/dd/yyyy hh24:mi:ss> -tableName <table name> -connectFile <filePath>
Table 11-11: Deleting Imported data flags
NOTE: hh24 is hours represented in 24 hour format. For example, 1:15:00 p.m. is 13:15:00 and 3:00:00 a.m. is 03:00:00.
To run dropImported:
1. Execute this command as follows:
-action dropImported -startDate <mm/dd/yyyy hh24:mi:ss> -endDate <mm/dd/yyyy hh24:mi:ss> -tableName <table name> -connectFile <filePath>
The following example deletes the imported data between the given dates from the above mentioned tables. Oracle Example:
./sdm –action dropImported –startDate 09/25/2007 00:00:00 –endDate 09/26/2007 00:00:00 -tableName Events –connectFile sdm.connect
SQL Server Example:
sdm –action dropImported –startDate 09/25/2007 00:00:00 –endDate 09/26/2007 00:00:00 -tableName Events –connectFile sdm.connect
Viewing Sentinel Database Space Usage In Tablespace Management, the command line option allows you to:
View Sentinel database space usage
11-18 Sentinel User Guide

Sentinel Data Manager 11-19
This action (dbstats) displays the Sentinel database usage for all Sentinel tablespaces in Oracle and Sentinel filegroups in MS SQL.
This command uses the following flags:
-action dbstats -connectFile <filePath>
Table 11-12: Viewing Sentinel Database Space Usage flags
To view Sentinel Database Space Usage (Command Line):
1. Execute the following command:
-action dbStats -connectFile <filePath>
The following example displays the tablespaces of Sentinel database with their total space, used space and free space available. Oracle Example:
./sdm –action dbStats –connectFile sdm.connect
SQL Server Example:
Sdm –action dbStats –connectFile sdm.connect
Update Map Data This action allows you to replace the map source data file of a map on the server running DAS with another file. Your new map source data file must have the same delimiter, number of columns, and overall structure as the existing map data source file in order for the map to function properly after the update. The new map source data file should only differ from the existing file by the values that appear in the columns. If the new map source data file has a different structure than the existing file, use the Edit feature to update the map definition.
This command uses the following flags:
-action updateMapData -map <mapName> -file <fileName> -backup (Optional) <true/false> -connectFile <filePath>
Table 11-13: Update Map Data flags
To run updateMapData:
Execute this command as follows: -action updateMapData -map <mapName> -file <fileName> [-backup <true/false> (DEFAULT: true)] -connectFile <filePath>
Oracle Example:
./sdm -action updateMapData -map Maps/rMap -file D:\EDLocal_Updated.csv -connectFile D:\sdm.connect
SQL Server Example:
sdm -action updateMapData -map Maps/rMap -file D:\EDLocal_Updated.csv -connectFile D:\sdm.connect

12 Utilities
Topic Page
Introduction to Sentinel Utilities 12-1Starting and Stopping Sentinel Server 12-1Sentinel Scripts 12-2Version Information 12-7Configuring Sentinel E-mail 12-9Updating Your License Key 12-11
Introduction to Sentinel Utilities This section allows you to understand the utilities provided by Sentinel. You can use these utilities for the following purposes:
For starting or stopping certain Sentinel services. For modifying Sentinel configuration. To determine the version of a Sentinel library. For troubleshooting activities. For configuring Sentinel email.
Starting and Stopping Sentinel Server A Sentinel Server is made up of the following components:
Communication Server Correlation Engine DAS Collector Manager
Any combination of the above components can be installed in a particular Sentinel Server.
In a distributed installation of Sentinel, it is likely that there will be more than one machine with a Sentinel Server running on it. In this case, all of the Sentinel Servers work together to provide the complete Sentinel functionality.
NOTE: At most one Communication Server and DAS component can be installed across all Sentinel Servers in a distributed Sentinel installation. On the other hand, multiple instances of Correlation Engine and Collector Managers are allowed.
When a Sentinel Server is started or stopped, all components installed in that Sentinel Server are also started or stopped. To start or stop a particular component on a Sentinel Server, use the Servers View under the Admin tab in Sentinel Control Center.
You need to start or stop a Sentinel Server because of the following routine maintenance:
Upgrades Patches
Utilities 12-1

Hotfixes
Starting a Sentinel Server To start the UNIX Sentinel Server:
1. Log into the machine where the Sentinel Server you want to start is installed as the Sentinel Administrator operating system user (by default esecadm)
2. Go to the $ESEC_HOME/bin directory. 3. Run the following command:
./sentinel.sh start
To start the Windows Sentinel Server:
1. Click Start > Settings > Control Panel. 2. Double-click Administrative Tools. 3. Double-click Services. 4. In the Services window, highlight Sentinel. 5. Right-click >Start or click Start in the tool bar.
Stopping a Sentinel Server To stop the UNIX Sentinel Server:
1. Log into the machine where the Sentinel Server you want to stop is installed as the Sentinel Administrator operating system user (by default esecadm)
2. Go to the $ESEC_HOME/bin directory. 3. Run the following command:
./sentinel.sh stop
To stop the Windows Sentinel Server:
1. Click Start > Settings > Control Panel. 2. Double-click Administrative Tools. 3. Double-click Services. 4. In the Services window, highlight Sentinel. 5. Right-click >Stop or click Stop in the tool bar.
Sentinel Scripts Depending upon which components are installed, the $ESEC_HOME/bin (on UNIX) or %ESEC_HOME%\bin (on Windows) directory might contain some or all of the scripts below. The operational scripts are appropriate for use during normal operations of Sentinel. The troubleshooting scripts should only be used when troubleshooting an issue.
For most scripts that require arguments, running the scripts without arguments provides details about the arguments and usage of the script.
Operational Scripts The scripts below can be used during the normal operation of Sentinel.
12-2 Sentinel User Guide

Script File: Description: adv_change_passwd.bat adv_change_passwd.sh
Resets the encrypted Advisor password stored in the Advisor configuration files. For more information, see section Resetting Advisor password (Direct Download Only) of Advisor Configuration in Sentinel Installation Guide.
advisor.bat advisor.sh
Starts the Internet download and processing of Advisor feed data. This script is scheduled to run automatically when Advisor is installed.
AnalyzePartitions.sh Runs the analyze partitions action on the Sentinel Database. This script is only available for Sentinel Database running on Oracle. For more information, see section Analyze Partitions in Supported Platforms and Best Practices in Sentinel Installation Guide.
BackupIncidentData.bat BackupIncidentData.sh
Used to backup Incident related data before running the delete incident utilities. For more information, contact Novell Technical Support (http://support.novell.com/phone.html?sourceidint=suplnav4_phonesup).
control_center.bat control_center.sh
Launches the Sentinel Control Center graphical user interface.
dbconfig.bat dbconfig
Configures the database connection settings stored in the DAS container xml files. For more information, see section Reconfiguring Database Connection Properties of Sentinel Data Access Service in Sentinel Installation Guide.
dbHealthCheck.sh Displays Sentinel Database health information. This script is only available for Sentinel Database running on Oracle. For more information, see section Database Health Check for Oracle in Supported Platforms and Best Practices in Sentinel Installation Guide.
esm_manager.bat esm_manager.sh
Starts, stops, or restarts any of the Event Source Management nodes. Available in Sentinel 6.0 SP1 and above.
extconfig.bat extconfig
Resets any of the encrypted 3rd Party Integration passwords stored in the das_query.xml file. For more information, see either the section Resetting the Remedy Password in the Remedy Help Desk Operations or section Resetting the HP OpenView Passwords in HP OpenView Service Desk Integration, both of them are in the 3rd Party Integration Guide.
keymgr.bat keymgr.sh
Generates a random encryption key to be used to encrypt messages in transport over the iSCALE message bus. For more information, see the section Changing the Communication Encryption Key of Communication Layer (iSCALE) in Sentinel Installation Guide.
Utilities 12-3
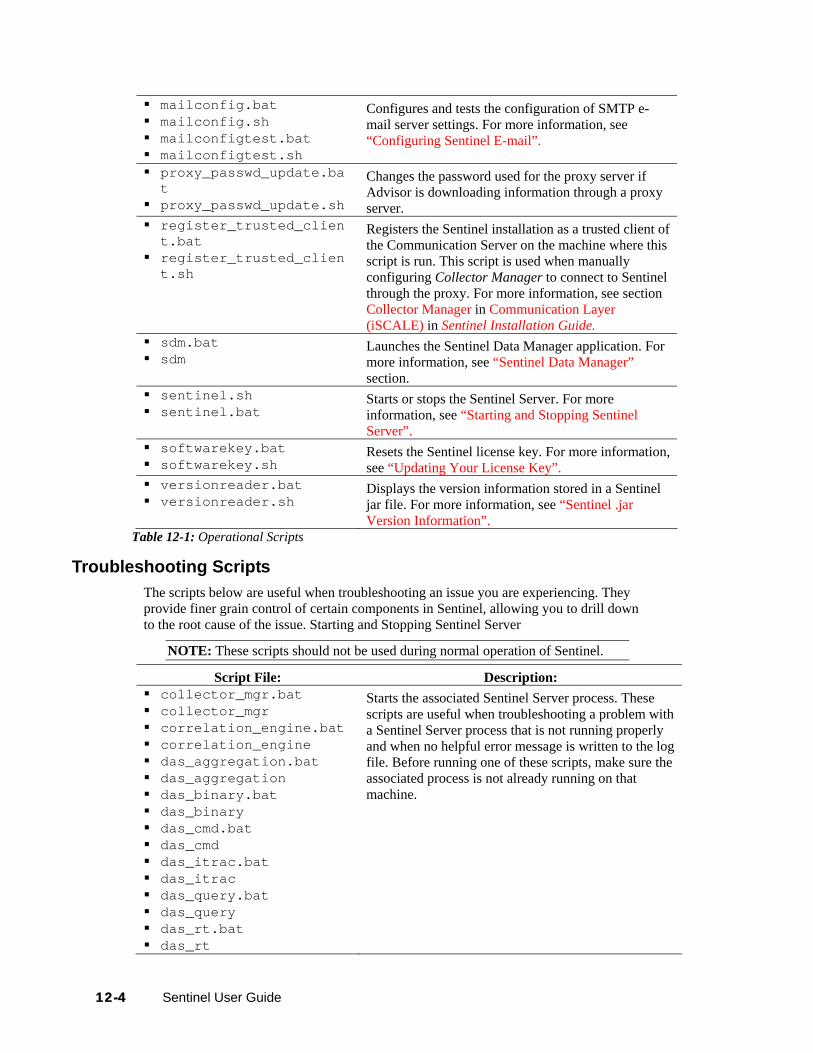
mailconfig.bat mailconfig.sh mailconfigtest.bat mailconfigtest.sh
Configures and tests the configuration of SMTP e-mail server settings. For more information, see “Configuring Sentinel E-mail”.
proxy_passwd_update.bat
proxy_passwd_update.sh
Changes the password used for the proxy server if Advisor is downloading information through a proxy server.
register_trusted_client.bat
register_trusted_client.sh
Registers the Sentinel installation as a trusted client of the Communication Server on the machine where this script is run. This script is used when manually configuring Collector Manager to connect to Sentinel through the proxy. For more information, see section Collector Manager in Communication Layer (iSCALE) in Sentinel Installation Guide.
sdm.bat sdm
Launches the Sentinel Data Manager application. For more information, see “Sentinel Data Manager” section.
sentinel.sh sentinel.bat
Starts or stops the Sentinel Server. For more information, see “Starting and Stopping Sentinel Server”.
softwarekey.bat softwarekey.sh
Resets the Sentinel license key. For more information, see “Updating Your License Key”.
versionreader.bat versionreader.sh
Displays the version information stored in a Sentinel jar file. For more information, see “Sentinel .jar Version Information”.
Table 12-1: Operational Scripts
Troubleshooting Scripts The scripts below are useful when troubleshooting an issue you are experiencing. They provide finer grain control of certain components in Sentinel, allowing you to drill down to the root cause of the issue. Starting and Stopping Sentinel Server
NOTE: These scripts should not be used during normal operation of Sentinel.
Script File: Description: collector_mgr.bat collector_mgr correlation_engine.bat correlation_engine das_aggregation.bat das_aggregation das_binary.bat das_binary das_cmd.bat das_cmd das_itrac.bat das_itrac das_query.bat das_query das_rt.bat das_rt
Starts the associated Sentinel Server process. These scripts are useful when troubleshooting a problem with a Sentinel Server process that is not running properly and when no helpful error message is written to the log file. Before running one of these scripts, make sure the associated process is not already running on that machine.
12-4 Sentinel User Guide

event_file_info.bat event_file_info
Displays information about an event file that will be processed by DAS Aggregation.
list_broker_connections.bat
list_broker_connections
Displays all of the active connections to the iSCALE message bus.
runalert.bat runalert.sh runattack.bat runattack.sh
Starts the Internet download and processing of either the alert or attack Advisor feed data. The advisor.bat/.sh script will run both of these scripts during normal operation.
setadvenv.bat setadvenv.sh
Used by the Advisor scripts to set some local environment variables.
setenv.sh Used by many of the Sentinel script to set some local environment variables.
start_broker.bat start_broker.sh
Starts the message bus component of the Communication Server. This script is useful if you are having problems starting the message bus (Sonic). For more information, see “Starting the Communication Server in Console Mode”.
StartSQLAgent.bat Starts the SQL Server Agent Service and configures it to run automatically. This script is run automatically by the installer.
stop_broker.bat stop_broker.sh
Stops the message bus component of the Communication Server. For more information, see “Stopping the Communication Server in Console Mode”.
stop_container.bat stop_container.sh
Stops a particular Sentinel Server process. This is useful when you need to restart a particular Sentinel Server process without stopping the entire Sentinel Server. Please note that the Sentinel Server watchdog will automatically restart the process after it is stopped. For more information, see “Restarting Sentinel Containers”.
uninstallAt.bat uninstallcron.sh
Removes the Advisor feed download and processing scheduled jobs. This script is run automatically by the uninstaller.
Table 12-2: Troubleshooting Scripts
Starting the Communication Server in Console Mode These scripts start the Communication Server on the command line in console mode. These scripts are useful for debugging the Communication Server without requiring you to run the rest of Sentinel Server.
NOTE: During normal operations, you should not use these scripts. Instead, follow the procedures in the section “Starting a Sentinel Server”. If you use these scripts on Windows, for example, the service will only run as long as the Command Prompt window remains open.
To start the Communication Server (Windows):
1. Either go or navigate through Windows Explorer to:
Utilities 12-5
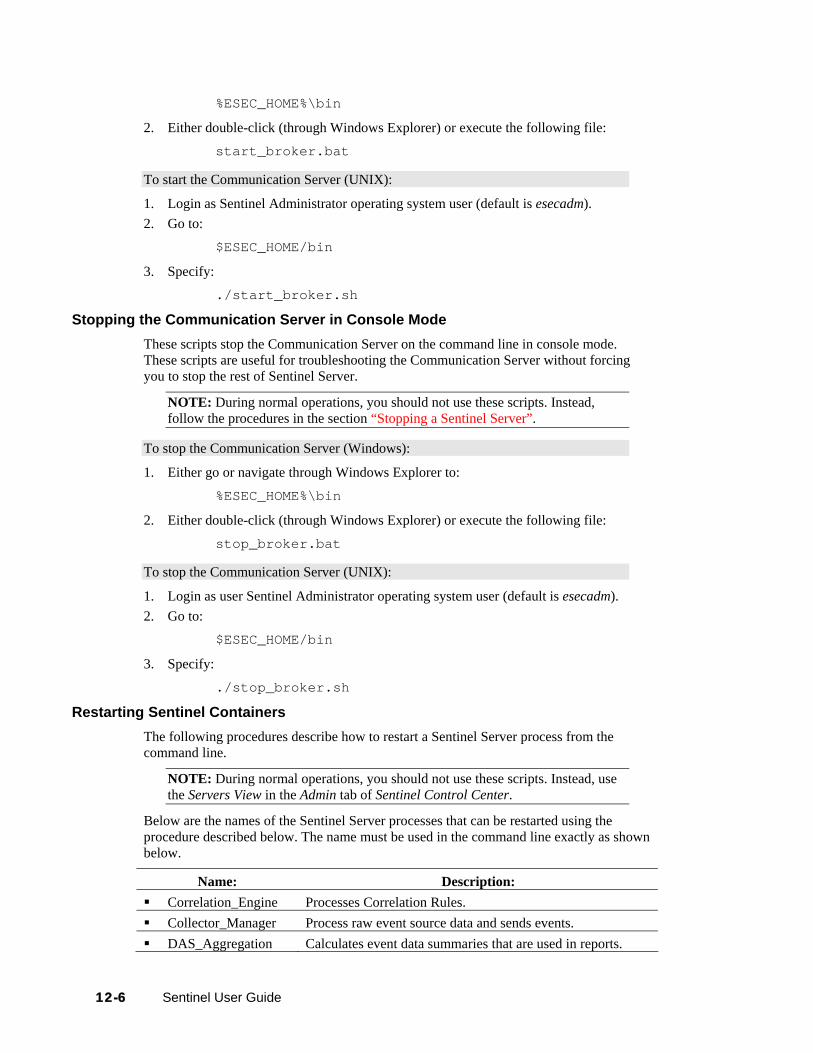
%ESEC_HOME%\bin
2. Either double-click (through Windows Explorer) or execute the following file:
start_broker.bat
To start the Communication Server (UNIX):
1. Login as Sentinel Administrator operating system user (default is esecadm). 2. Go to:
$ESEC_HOME/bin
3. Specify:
./start_broker.sh
Stopping the Communication Server in Console Mode These scripts stop the Communication Server on the command line in console mode. These scripts are useful for troubleshooting the Communication Server without forcing you to stop the rest of Sentinel Server.
NOTE: During normal operations, you should not use these scripts. Instead, follow the procedures in the section “Stopping a Sentinel Server”.
To stop the Communication Server (Windows):
1. Either go or navigate through Windows Explorer to:
%ESEC_HOME%\bin
2. Either double-click (through Windows Explorer) or execute the following file:
stop_broker.bat
To stop the Communication Server (UNIX):
1. Login as user Sentinel Administrator operating system user (default is esecadm). 2. Go to:
$ESEC_HOME/bin
3. Specify:
./stop_broker.sh
Restarting Sentinel Containers The following procedures describe how to restart a Sentinel Server process from the command line.
NOTE: During normal operations, you should not use these scripts. Instead, use the Servers View in the Admin tab of Sentinel Control Center.
Below are the names of the Sentinel Server processes that can be restarted using the procedure described below. The name must be used in the command line exactly as shown below.
Name: Description: Correlation_Engine Processes Correlation Rules. Collector_Manager Process raw event source data and sends events. DAS_Aggregation Calculates event data summaries that are used in reports.
12-6 Sentinel User Guide

DAS_Binary Performs event database insertion. DAS_iTRAC Provides the server-side functionality for the Sentinel iTRAC
functionality. DAS_Proxy Provides the server-side of the SSL proxy connection to
Sentinel Server DAS_Query Performs general Sentinel Service operations including Login
and Historical Query. DAS_RT Provides the server-side functionality for Active Views.
Table 12-3: Sentinel Server process names
To restart a Sentinel Server process (Windows):
1. Go to:
%ESEC_HOME%\bin
2. Specify:
.\stop_container.bat <host machine> <process name>
For example:
.\stop_container.bat localhost DAS_RT
To restart a Sentinel Container (UNIX):
1. Login as user Sentinel Administrator operating system user (default is esecadm). 2. Go to:
$ESEC_HOME/bin
3. Specify:
./stop_container.sh <host machine> <process name>
For example:
./stop_container.sh localhost DAS_RT
Version Information Executable Version Information
Sentinel has a command line option to display the version information of the following executable:
agentengine
To display Sentinel executable version information (UNIX):
1. Go to:
$ESEC_HOME/bin
2. Specify:
./<process> -version
For example:
./agentengine –version
Utilities 12-7

To display Sentinel executable version information (Windows):
1. Go to:
%ESEC_HOME%\bin
2. Specify:
.\<process> -version
For example:
.\agentengine –version
Sentinel .dll and .exe File Version Information The following procedure describes how to gather the version information of Sentinel .dll and .exe files:
To obtain Sentinel .dll and .exe file version information:
1. Go to %ESEC_HOME%. 2. Within the bin and lib directory, right-click either a .dll or .exe file and select
Properties. 3. Click the Version tab. 4. In the Item Name pane, select Product Version. The version number of the file
appears in the Value pane.
Sentinel .jar Version Information The following procedure describes how to gather the version information of Sentinel .jar files:
To obtain Sentinel .jar file version information:
1. Log into the machine where Sentinel is installed as the Sentinel Administrator operating system user (default is esecadm) on UNIX or as an Administrator on Windows.
2. Go to: For UNIX:
$ESEC_HOME/bin
For Windows:
%ESEC_HOME%\bin
3. At the command line, Specify: For UNIX:
./versionreader.sh <path/jar file name>
For Windows:
.\versionreader.bat <path/jar file name>
12-8 Sentinel User Guide
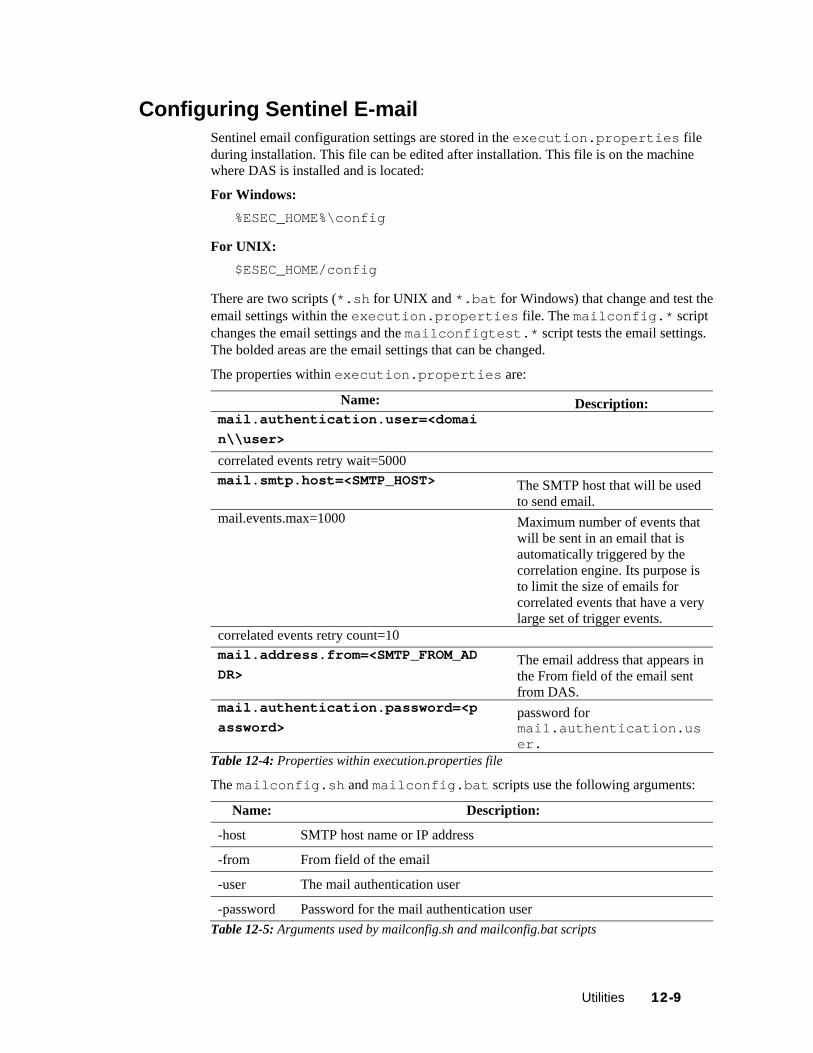
Configuring Sentinel E-mail Sentinel email configuration settings are stored in the execution.properties file during installation. This file can be edited after installation. This file is on the machine where DAS is installed and is located:
For Windows: %ESEC_HOME%\config
For UNIX: $ESEC_HOME/config
There are two scripts (*.sh for UNIX and *.bat for Windows) that change and test the email settings within the execution.properties file. The mailconfig.* script changes the email settings and the mailconfigtest.* script tests the email settings. The bolded areas are the email settings that can be changed.
The properties within execution.properties are:
Name: Description: mail.authentication.user=<domain\\user>
correlated events retry wait=5000 mail.smtp.host=<SMTP_HOST> The SMTP host that will be used
to send email. mail.events.max=1000 Maximum number of events that
will be sent in an email that is automatically triggered by the correlation engine. Its purpose is to limit the size of emails for correlated events that have a very large set of trigger events.
correlated events retry count=10 mail.address.from=<SMTP_FROM_ADDR>
The email address that appears in the From field of the email sent from DAS.
mail.authentication.password=<password>
password for mail.authentication.user.
Table 12-4: Properties within execution.properties file
The mailconfig.sh and mailconfig.bat scripts use the following arguments:
Name: Description:
-host SMTP host name or IP address
-from From field of the email
-user The mail authentication user
-password Password for the mail authentication user Table 12-5: Arguments used by mailconfig.sh and mailconfig.bat scripts
Utilities 12-9

NOTE: Do not provide your password after the –password argument. You are prompted for a new password after you specify the command. The console output will be masked by asterisks (*).
The mailconfigtest.sh and mailconfig.bat file use the following arguments:
Name: Description:
-to Destination email address Table 12-6: Argument used by mailconfigtest.sh and mailconfig.bat file
To set email properties in the execution.properties file:
1. On the machine where you have DAS installed, go to: For UNIX:
$ESEC_HOME/bin
For Windows:
%ESEC_HOME%\bin
2. Execute mailconfig as follows: For UNIX:
./mailconfig.sh -host <SMTP Server> -from <source email address> -user <mail authentication user> –password
For Windows:
mailconfig.bat -host <SMTP Server> -from <source email address> -user <mail authentication user> -password
UNIX example:
./mailconfig.sh -host 10.0.1.14 -from [email protected] -user my_user_name –password
Windows example:
mailconfig.bat -host 10.0.1.14 -from [email protected] -user my_user_name –password
After providing this command you are prompted for a new password.
Provide your password:*********
Confirm your password:*********
NOTE: When using the password option, it must be the last argument.
To test your email settings in the execution.properties file:
1. On the machine where you have DAS installed, go to: For UNIX:
$ESEC_HOME/bin
For Windows:
%ESEC_HOME%\bin
12-10 Sentinel User Guide

Utilities 12-11
2. Execute mailconfigtest as follows: For UNIX:
./mailconfigtest.sh -to <destination email address>
For Windows:
mailconfigtest.bat -to <destination email address>
After your mail is sent, you will get the following on screen as output and e-mail received at the destination address.
Email has been sent successfully!
Check the destination e-mail mailbox to confirm receipt of email. The subject line and content should be:
Subject: Testing e-security mail property
This is a test for e-security mail property set up. If you see this message, your e-security mail property has been configured correctly to send emails
Updating Your License Key If your Sentinel license key has expired and Novell has issued you a new one, run the software key program to update your license key.
To update your license key (UNIX):
1. Log into the machine where the DAS component is installed as the Sentinel Administrator operating system user (default is esecadm).
2. Go to $ESEC_HOME/bin 3. Specify the following command:
./softwarekey.sh
4. Specify the number 1 to set your primary key. Press enter.
To update your license key (Windows):
1. Log into the machine where the DAS component is installed as a user with administrative rights.
2. Go to %ESEC_HOME%\bin 3. Specify the following command:
.\softwarekey.bat
4. Specify the number 1 to set your primary key. Press enter.
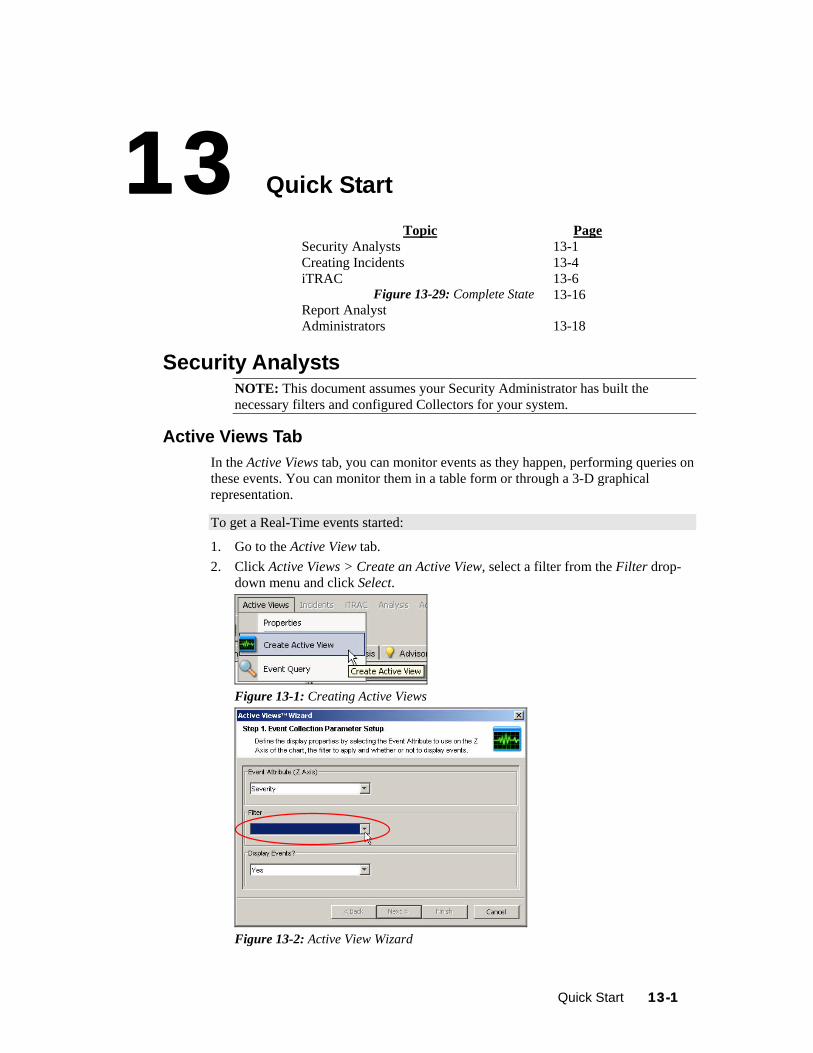
13 Quick Start
Topic Page
ure 13-29: Complete State
Administrators 13-18
has built the
Security Analysts 13-1Creating Incidents 13-4iTRAC 13-6
FigReport Analyst
13-16
Security Analysts NOTE: This document assumes your Security Administratornecessary filters and configured Collectors for your system.
Active Views Tab In the Active Views tab, you can monitor events as they happen, performing quethese events. You c
ries on an monitor them in a table form or through a 3-D graphical
representation.
To get a Real-Time events started:
n Active View, select a filter from the Filter drop-down menu and click Select.
1. Go to the Active View tab. 2. Click Active Views > Create a
Figure 13-1: Creating Active Views
Figure 13-2: Active View Wizard
Quick Start 13-1

Figure 13-3: Selecting Filter
3. Click Finish. If you have an active network, you might see something similar to:
Figure 13-4: Active View
NOTE: To display a 3-D graph without real time events, click the Display Events down arrow and select No.
Exploit Detection To view any events indicating a possible exploitation, you must have the following:
Advisor Feed Intrusion detection Vulnerability scanning
Figure 13-5: Severity, Vulnerability and AttackId column
Within an event, the values in the Vulnerability field convey the following:
When the Vulnerability field equals 1, the asset or destination device is possibly exploited.
When the Vulnerability field equals 0, the asset or destination device is indicated as not being exploited.
When the Vulnerability field is blank, the exploit detection feature of Sentinel is not enabled.
13-2 Sentinel User Guide

To view events that indicate a possible exploitation, create an Active View with a filter where Vulnerability equals 1. For example, if you have Nmap and have run the Nmap Collector, you can view asset information on the exploited asset or any asset.
For more information on how exploit detection works and which Intrusion Detection Systems and Vulnerability Scanners are supported, see “Sentinel Control Center” section.
Asset Data To view Asset information for any event, right-click an event or events > Analysis > Asset Data, a window similar to the one below displays:
Figure 13-6: Asset Report
Event Query Example Scenario – Telnet Event: During monitoring, you see numerous telnet attempts from source IP 10.0.0.1 Telnet attempts could be an attack. Telnet potentially allows an attacker to remotely connect to a remote computer as if they were locally connected. This can lead to unauthorized configuration changes, installation of programs, viruses, and so on.
You can Event Query to determine how often this possible attacker has attempted a telnet; you can setup a filter to query for this particular attacker. For example, you know the following:
Quick Start 13-3

Source IP: 10.0.0.1 Destination IP: 10.0.0.2 Severity: 5
Event Name: Attempted_telnet Sensor Type: H (Host Intrusion Detection)
To Perform an Event Query:
1. In the Sentinel Control Center, click Event Query (Magnifying Glass icon) and click the Filter drop-down menu.
2. A window with a list of filters displays. Click Add; specify a filter name of telnet SIP 10.0.0.1. In the field below the Filter, specify: SourceIP = 10.0.0.3 EventName = Attempted_telnet Severity = 5
SensorType = H DestinationIP = 10.0.0.4 Match if, select All conditions are met (and)
3. Click Save. Highlight your filter and click Select. 4. Provide your time period of interest; click Search (Magnifying Glass icon). The
result of your query displays. If your Event Query makes a match, you will get a result similar to the following illustration.
Figure 13-7: Event Query result If you want to see how often in general this user is attempting a telnet, remove DestinationIP, SensorType and Severity from your filter or create a new filter. The results will show all the destinationIPs this user is attempting to telnet to. If any of your events are correlated events, you can right-click > View Trigger Events to find what events triggered that correlated event. NOTE: Correlated events will have the SensorType column populated with a C.
More Information about Attacks Another event of interest could be excessive FTP events. This can also be a remote connection, allowing for transferring, copying and deleting of files.
Below is a short list of attacks of interest. Types of attacks are an extensive list. For more information about network/host attacks, there are many resources available (that is, books and the internet) that explain different types of attacks in detail.
SYN Flood ICMP and UDP Flood
Packet Sniffing Denial of Service
Smurf and Fraggle Dictionary Attack
Creating Incidents NOTE: To perform this function you must have user permission to create Incidents.
13-4 Sentinel User Guide

This is useful in grouping a set of events together as a whole representing something of interest (group of similar events or set of different events that indicate a pattern of interest such as an attack).
NOTE: If events are not initially displayed in a newly created Incident, it is most likely because of a lag in the time between display in the Real Time Events window and insertion into the database. If this occurs, it might take a few minutes for the original events to finally be inserted into the database and display in the incident.
To create an Incident:
NOTE: It is possible to create an incident that does not contain any events. Events can always be added to Incidents.
1. In a Real Time Event Table of the Visual Navigator or a Snapshot Real Time Event Table, select an event or a group of events and right-click and select Create Incident.
Figure 13-8: Creating Incident
2. In the Incident Window are the following tabs: Events: Shows which events make up the incident Assets: Show affected assets Vulnerability: Show related asset vulnerabilities Advisor: Asset attack and alert information iTRAC: Under this tab, you can assign an iTRAC Process History: Incident history Attachments: You can attach any document or text file with pertinent
information to this incident Notes: You can specify any general notes you want to refer regarding this
incident. 3. In the Create Incident dialog box, provide:
Title State Severity Priority
Category Responsible Description Resolution
4. Click Create. The incident is added under the Incidents tab of the Sentinel Control Center.
Quick Start 13-5

iTRAC Instantiating a Process
An iTRAC process can be instantiated in the iTRAC server by associating an iTRAC process to an incident the following methods:
Associate an iTRAC process to the incident at the time of incident creation Associate an iTRAC process to incident after an incident has been created Associate an iTRAC process to an incident as an action when deploying a correlation
rule
For more information on association a process to an incident, see “Correlation Tab” and “Incidents Tab”.
Example Scenario – Creating a Simple Two Tiered iTRAC Process for a Possible Network Attack
NOTE: To perform all of the scenarios in the iTRAC section, iTRAC scenario sections must be followed in the order presented.
This discusses how to make a simple two tiered iTRAC Process. The process is flow of steps that can be taken in the event there is a possible attack on your system.
The example process is:
Asks the question (in the first step – a manual step [Decide if Hacked]), from a preliminary look has the network been attacked? This leads to a Decision Step. NOTE: All Decision Steps provide different execution paths depending on the value of the variable defined in the previous step.
If there has been an attack, go collect necessary data to determine if there has been an attack. If there is no attack, send an email out to the supervisor that there is not an attack.
The Collect Data step is to review the data to make a better determination if there has been an attack.
If there has been an attack, take measures to prevent another attack and send an email out to the supervisor that proper measures have been taken. If there is no attack, send an email out to the supervisor that there is not an attack.
Figure 13-9: iTRAC Process
To Create an iTRAC Process:
1. Click the iTRAC tab. 2. In the navigation pane, click iTRAC Administration > Template Manager. 3. In the Template Manager window, click Add. 4. The iTRAC Process Builder displays with a Process Details window. Provide the
name iTRAC Tutorial. Optionally, add a description.
13-6 Sentinel User Guide

Figure 13-10: Process Details window
5. From the Step Palette pane, drag and drop three Manual Steps, two Mail Steps, and two Decision Steps. Rename and the attributes to the steps as follows by right-clicking and selecting Edit Step. Manual Step-0 to Decide If Hacked
set Role to Analyst click Associate click Add provide Hacked in the Name field
Figure 13-11: Decide If Hacked-Manual Step
in the Process Variables window select the Variable Type as String provide Default Value as yes
Quick Start 13-7

Figure 13-12: Process Variables
under the Description tab, (optional) specify Initial evaluation of event(s) to determine if there has been an attack
click OK highlight the newly created association, continue to click OK until the
step is renamed Manual Step-1 to Collect Data
set Role to Analyst click Associate highlight Hacked, click OK under the Description tab, (optional) specify To further evaluate after
collecting of events to determine if there has been an attack. click OK, the step should be renamed
Manual Step-2 to Prevent Future Attacks set Role to Analyst under the Description tab, (optional) specify Take measures to stop the
attack (firewall, router or other intrusion protection method). Also, if possible, determine how the attacked was done.
click OK, the step should be renamed Mail Step-3 to Not Hacked
in the To field, (because this is for tutorial) provide your email address. When this step completes it will send you an email
in the From field, provide a made up address such as [email protected] in the Subject field, specify We have not been hacked.
13-8 Sentinel User Guide

Figure 13-13: Not Hacked-General tab Under the Body tab, (optional) specify This email is generated from a
tutorial (simulation) iTRAC process.
Figure 13-14: Not Hacked-Body tab click OK
Mail Step-4 to Prevent Future Attacks in the To field, specify your email address in the From field, specify a made up email address in the Subject field, specify Proper Attack Measures Taken Under the Body tab, (optional) specify This email is generated from a
tutorial (simulation) iTRAC process. Decision Step-5 to Hacked? (optional) Under the Description tab, (optional)
provide a description such as Preliminary decision as to if there has been an attack or not.
Quick Start 13-9

Figure 13-15: Not Hacked-General tab Decision Step-6 to Hacked or Not. (optional) Under the Description tab, you
might provide a description such as Decision as to if there has been an attack or not.
Figure 13-16: Not Hacked-Description tab
6. Right-click Start and select Add Start Transition. Select destination to step Decide If Hacked.
7. Right-click Decide If Hacked and select Add Transition. Select and specify the following: Name, provide Decision Type, select Unconditional Destination: Hacked?
13-10 Sentinel User Guide
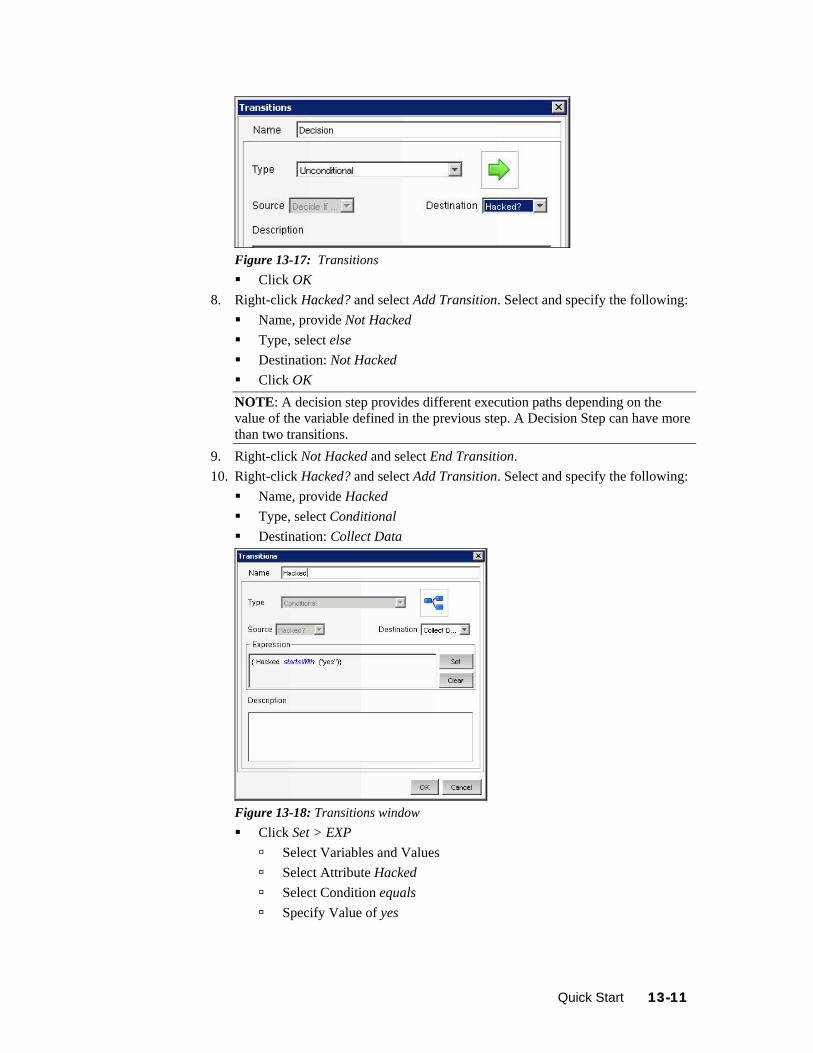
Figure 13-17: Transitions Click OK
8. Right-click Hacked? and select Add Transition. Select and specify the following: Name, provide Not Hacked Type, select else Destination: Not Hacked Click OK
NOTE: A decision step provides different execution paths depending on the value of the variable defined in the previous step. A Decision Step can have more than two transitions.
9. Right-click Not Hacked and select End Transition. 10. Right-click Hacked? and select Add Transition. Select and specify the following:
Name, provide Hacked Type, select Conditional Destination: Collect Data
Figure 13-18: Transitions window Click Set > EXP
Select Variables and Values Select Attribute Hacked Select Condition equals Specify Value of yes
Quick Start 13-11

Figure 13-19: Setting Expressions Click OK until the transition is complete
11. Right-click Collect Data and select Add Transition. Select and specify the following: Name, Hacked or Not? Type, Unconditional Destination, Hacked or Not
12. Right-click Hacked or Not and select Add Transition. Select and specify the following: Name, Not Hacked Type, Else Destination, Not Hacked
13. Right-click Hacked or Not and select Add Transition. Select and specify the following: Name, Hack Happened Type, Conditional Destination, Prevent Future Attacks Click Set > EXP
Select Variables and Values Select Attribute Hacked Select Condition equals Specify Value of yes
Click OK until the transition is complete 14. Right-click Prevent Future Attacks and select Add Transition. Select and specify
the following: Name, Proper Measures Taken Type, Unconditional Destination, Measures Taken
15. Right-click Measures Taken and select Add End Transition.
13-12 Sentinel User Guide

Figure 13-20: iTRAC Process
16. Click Save. Your new process should appear in the Template Manager.
Example Scenario – Running an iTRAC Process for a Possible Network Attack The following example assumes the following:
A process named iTRAC Process Tutorial has been assigned to your role (analyst) NOTE: This is a process created in Section. Example Scenario – Creating a Simple Two Tiered iTRAC Process for a Possible Network Attack.
All steps within the process belong to the Analyst group NOTE: By assigning steps to other roles, will mean having to log out and then log in as a user assigned to that role and accept the process. For simplicity, the following example is assigned to one role.
To run this process, this process must first be assigned to an incident.
To Start or Terminate a Process:
1. Click the Incident tab. 2. Click Incidents > Create Incidents. 3. Specify the following:
Title: iTRAC Tutorial Category: Other Responsible: assign this Incident to yourself
4. Click the iTRAC tab, select iTRAC Process Tutorial. 5. Click Create.
NOTE: Because this is a tutorial Incident and not a true Incident, it can be deleted without negatively affecting your Sentinel setup.
6. From anywhere in the Sentinel GUI, click the Analyst group (yellow bar) under View work items.
Figure 13-21: View work items panel
NOTE: Your bar might already be partially green indicating that you have accepted (acquired) an iTRAC Process.
7. All of the processes assigned to the Analyst role displays.
Quick Start 13-13

Figure 13-22: Work Items window
8. To accept a Work Item, highlight iTRAC Tutorial and click Acquire.
Figure 13-23: Work Items window-Acquire If the View Work Item list bar was yellow as illustrated above, it changes with an addition of a green bar.
Figure 13-24: View work items panel
9. Click the green bar under View work items. In the Work Items window, click View Details.
Figure 13-25: Work Items window-View Details
13-14 Sentinel User Guide
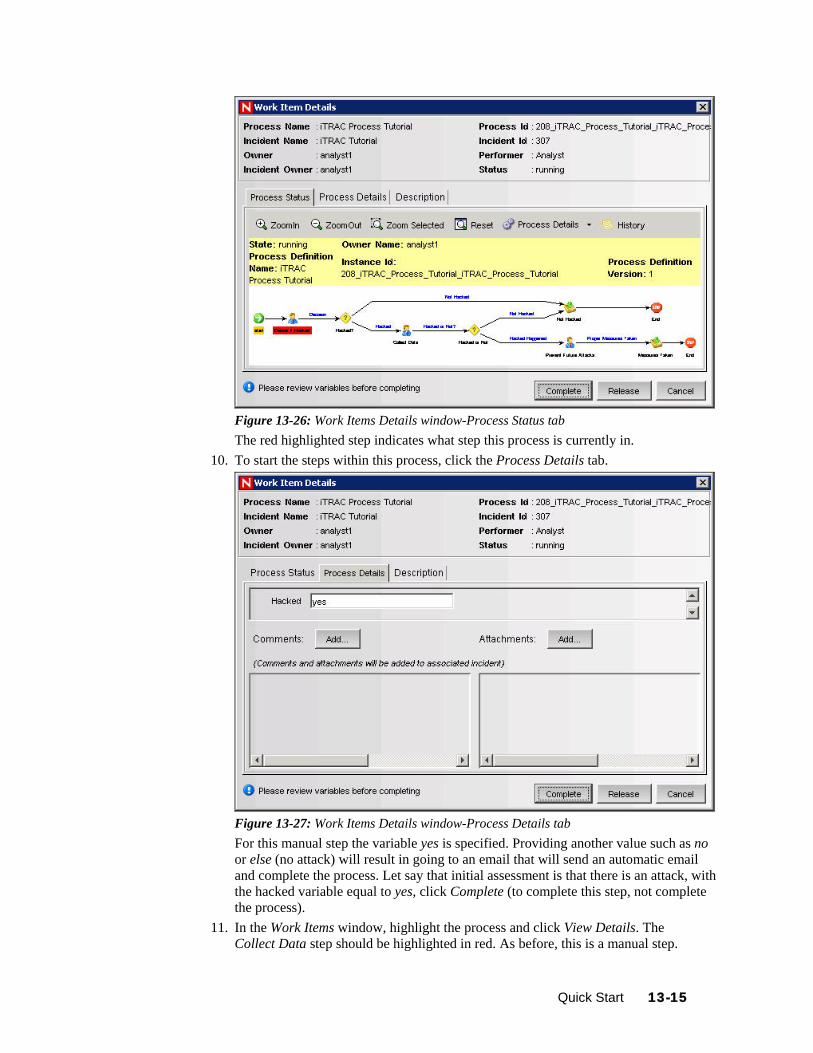
Figure 13-26: Work Items Details window-Process Status tab The red highlighted step indicates what step this process is currently in.
10. To start the steps within this process, click the Process Details tab.
Figure 13-27: Work Items Details window-Process Details tab For this manual step the variable yes is specified. Providing another value such as no or else (no attack) will result in going to an email that will send an automatic email and complete the process. Let say that initial assessment is that there is an attack, with the hacked variable equal to yes, click Complete (to complete this step, not complete the process).
11. In the Work Items window, highlight the process and click View Details. The Collect Data step should be highlighted in red. As before, this is a manual step.
Quick Start 13-15
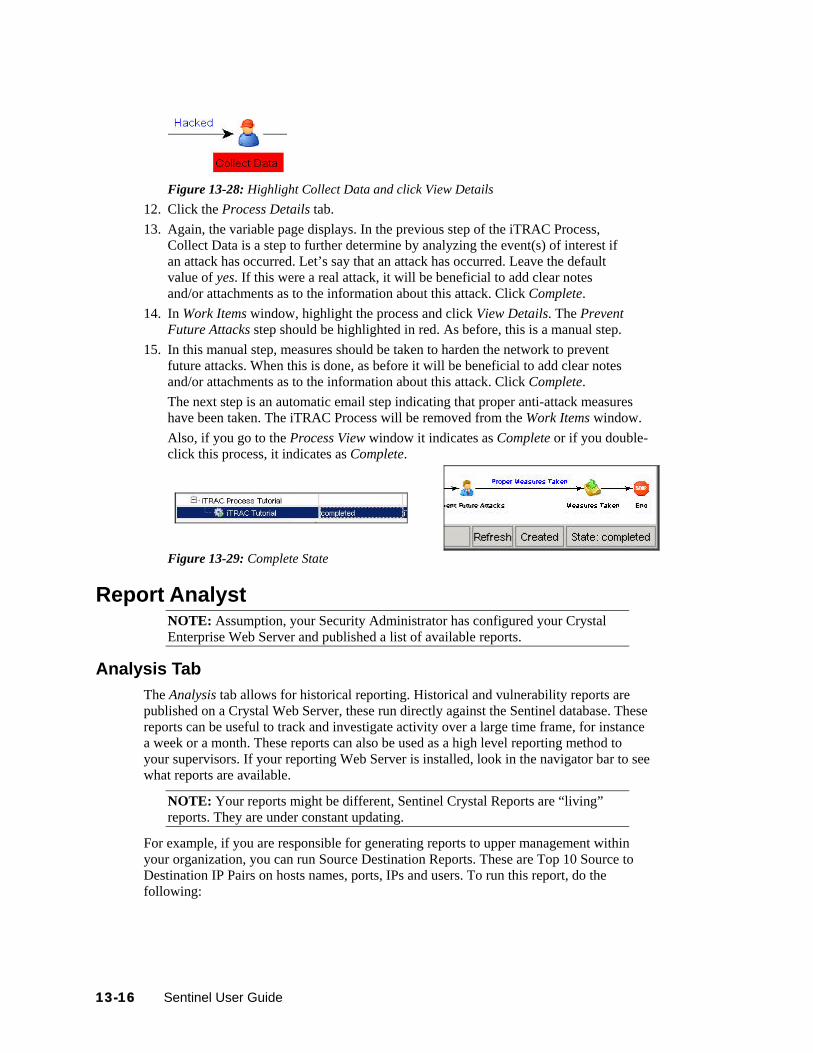
Figure 13-28: Highlight Collect Data and click View Details
12. Click the Process Details tab. 13. Again, the variable page displays. In the previous step of the iTRAC Process,
Collect Data is a step to further determine by analyzing the event(s) of interest if an attack has occurred. Let’s say that an attack has occurred. Leave the default value of yes. If this were a real attack, it will be beneficial to add clear notes and/or attachments as to the information about this attack. Click Complete.
14. In Work Items window, highlight the process and click View Details. The Prevent Future Attacks step should be highlighted in red. As before, this is a manual step.
15. In this manual step, measures should be taken to harden the network to prevent future attacks. When this is done, as before it will be beneficial to add clear notes and/or attachments as to the information about this attack. Click Complete. The next step is an automatic email step indicating that proper anti-attack measures have been taken. The iTRAC Process will be removed from the Work Items window. Also, if you go to the Process View window it indicates as Complete or if you double-click this process, it indicates as Complete.
Figure 13-29: Complete State
Report Analyst NOTE: Assumption, your Security Administrator has configured your Crystal Enterprise Web Server and published a list of available reports.
Analysis Tab The Analysis tab allows for historical reporting. Historical and vulnerability reports are published on a Crystal Web Server, these run directly against the Sentinel database. These reports can be useful to track and investigate activity over a large time frame, for instance a week or a month. These reports can also be used as a high level reporting method to your supervisors. If your reporting Web Server is installed, look in the navigator bar to see what reports are available.
NOTE: Your reports might be different, Sentinel Crystal Reports are “living” reports. They are under constant updating.
For example, if you are responsible for generating reports to upper management within your organization, you can run Source Destination Reports. These are Top 10 Source to Destination IP Pairs on hosts names, ports, IPs and users. To run this report, do the following:
13-16 Sentinel User Guide

To run a Crystal Report:
1. Expand Top 10 and highlight Top 10 Source to Destination IP Pairs and click Create Reports (magnifying glass).
2. Specify Sentinel Report User (for SQL authentication and Oracle) as the username or your Windows Authentication username and specify your password.
3. Under Report Type, select one of the following: Specific Date Range Prior Day Daily Report Weekly Report Monthly Report
NOTE: Other reports might have additional parameters such as resource name and severity range.
4. Click OK. The following is a sample monthly report.
Figure 13-30: Monthly Report
5. You can export this file as a doc, pdf, rtf, xls or as a Crystal Report by clicking Export (envelope).
Quick Start 13-17
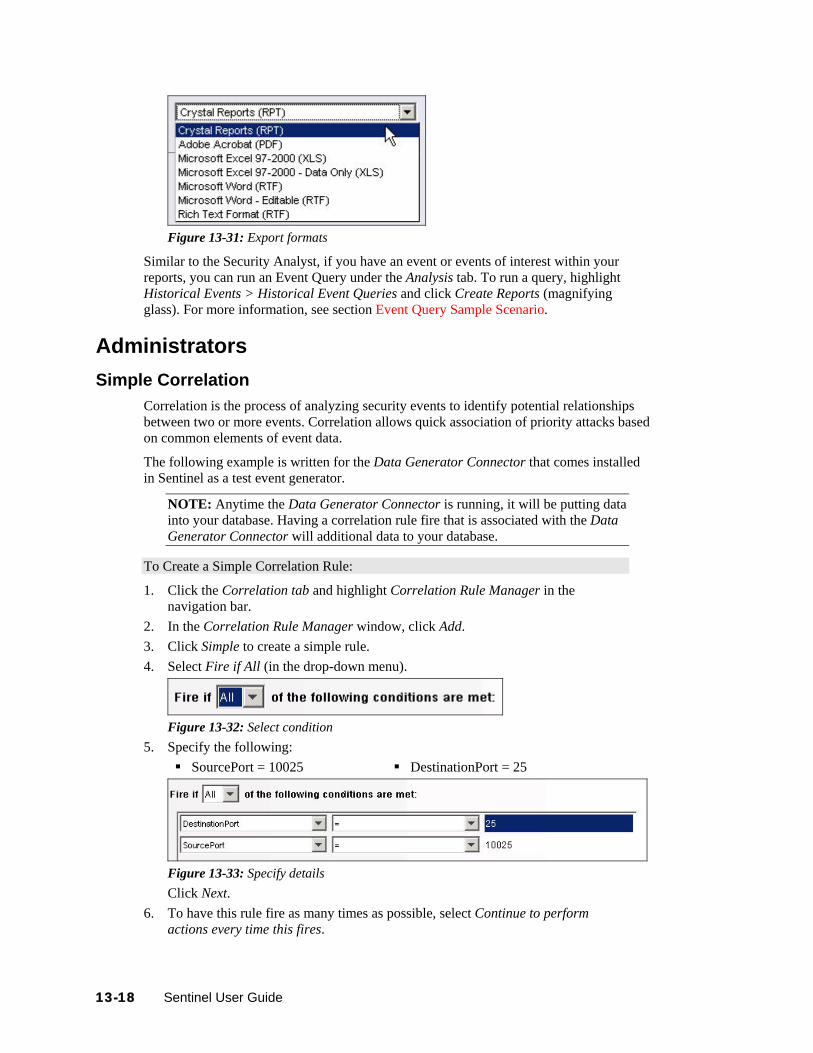
Figure 13-31: Export formats
Similar to the Security Analyst, if you have an event or events of interest within your reports, you can run an Event Query under the Analysis tab. To run a query, highlight Historical Events > Historical Event Queries and click Create Reports (magnifying glass). For more information, see section Event Query Sample Scenario.
Administrators Simple Correlation
Correlation is the process of analyzing security events to identify potential relationships between two or more events. Correlation allows quick association of priority attacks based on common elements of event data.
The following example is written for the Data Generator Connector that comes installed in Sentinel as a test event generator.
NOTE: Anytime the Data Generator Connector is running, it will be putting data into your database. Having a correlation rule fire that is associated with the Data Generator Connector will additional data to your database.
To Create a Simple Correlation Rule:
1. Click the Correlation tab and highlight Correlation Rule Manager in the navigation bar.
2. In the Correlation Rule Manager window, click Add. 3. Click Simple to create a simple rule. 4. Select Fire if All (in the drop-down menu).
Figure 13-32: Select condition
5. Specify the following: SourcePort = 10025 DestinationPort = 25
Figure 13-33: Specify details Click Next.
6. To have this rule fire as many times as possible, select Continue to perform actions every time this fires.
13-18 Sentinel User Guide

Figure 13-34: Select from After rule fires options Click Next.
7. In the General Description window, specify a name. Recommend a name and description that indicates that this is tutorial rule and cannot be germane to the network.
Figure 13-35: General Description window Click Next.
8. Select not to create another rule, click Next.
To Deploy the Simple Correlation Rule:
1. Click the Correlation tab and highlight Correlation Rule Manager in the navigation bar.
2. Click Tutorial_SourcePort_DestinationPort (this is the name of the rule from the previous example) > Deploy Rule.
Figure 13-36: Correlation Rule Manager window
3. (optional) In the Deploy Rule window, you can add an action. This allows you to: Configure Correlated Event Add to Dynamic List Remove from Dynamic List
Execute a Command Send Email Create Incident
Figure 13-37: Select action in Deploy Rule window Click Next. The rule indicates deployed by the color green.
Quick Start 13-19

13-20 Sentinel User Guide
Figure 13-38: Deployed Rule
To view what events triggered your correlated event
1. Right-click the correlated event and select View Trigger Events to see how many events (could be more than 1) triggered this correlation rule.
Figure 13-39: Selecting View Trigger Events
Figure 13-40: Correlated Events display

14 Solution Packs
Topic Page
Solution Packs 14-1Solution Manager 14-4Managing Solution Packs 14-6Solution Designer 14-22Deploying an Edited Solution Pack 14-31
Solution Packs Solution Packs allow Novell, partners, and customers to create and easily manage solutions to specific business problems. They provide a framework within which sets of content can be packaged into controls, each of which is designed to enforce a specific business or technical policy. The control can use any of the detection, filtering, alerting, and response features of Sentinel, as well as provide documentation on control status and enforcement. By managing the set of content as a unit within the control, the Solution Pack solves dependency problems and simplifies implementation.
Controls within a Solution Pack can include the following types of content:
Correlation Rule Deployments, including deployment status and associated Correlation Rules, Correlation Actions, and Dynamic Lists
Reports iTRAC Workflows, including associated Roles Event enrichment, including map definitions and event metatag configuration Other associated files added when the Solution Pack is created, such as
documentation, example report PDFs, or sample map files.
Although Solution Packs have many uses, one is to package content related to governance and regulatory compliance into a comprehensible and easily enforceable framework that is easy to deploy. Novell and its partners will offer and extend Solution Packs around such regulations or other customer needs.
Solution Packs are created with Solution Designer application. Using this tool, a user creates the Solution Pack, associated controls and documentation (including implementation and testing steps), and then associates Sentinel content with each control. The entire package is then exported as a ZIP file.
The ZIP file containing the Solution Pack is imported and deployed into an existing Sentinel system using the Solution Manager in the Sentinel Control Center. The Solution Manager displays implementation and testing steps in the Solution Pack and tracks the status of each control. At any time, users can generate a detailed document with implementation status for each control.
Solution Packs 14-1
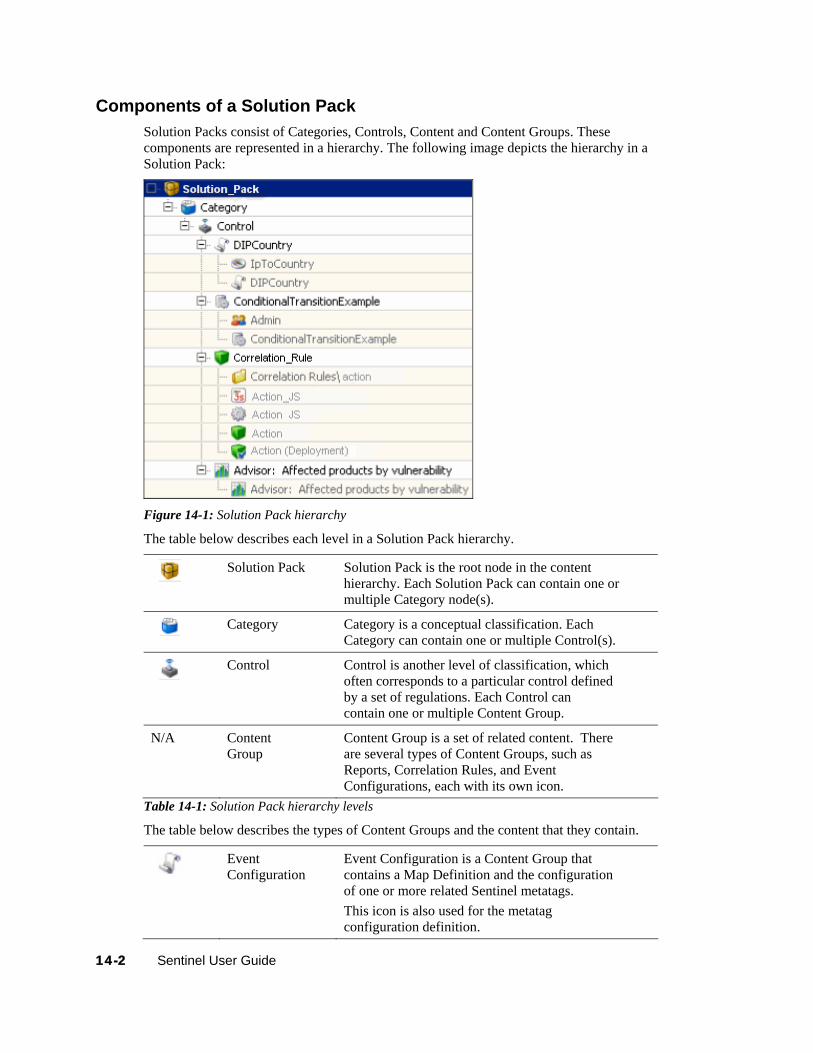
Components of a Solution Pack Solution Packs consist of Categories, Controls, Content and Content Groups. These components are represented in a hierarchy. The following image depicts the hierarchy in a Solution Pack:
Figure 14-1: Solution Pack hierarchy
The table below describes each level in a Solution Pack hierarchy.
Solution Pack Solution Pack is the root node in the content
hierarchy. Each Solution Pack can contain one or multiple Category node(s).
Category Category is a conceptual classification. Each Category can contain one or multiple Control(s).
Control Control is another level of classification, which
often corresponds to a particular control defined by a set of regulations. Each Control can contain one or multiple Content Group.
N/A Content Group
Content Group is a set of related content. There are several types of Content Groups, such as Reports, Correlation Rules, and Event Configurations, each with its own icon.
Table 14-1: Solution Pack hierarchy levels
The table below describes the types of Content Groups and the content that they contain.
Event Configuration
Event Configuration is a Content Group that contains a Map Definition and the configuration of one or more related Sentinel metatags. This icon is also used for the metatag configuration definition.
14-2 Sentinel User Guide

Map Indicates the Map Definition Instance.
Workflow Workflow is a Content Group that contains an
iTRAC Workflow template and any associated Roles. This icon is also used for the iTRAC workflow template itself.
Role Indicates a Role used in a Workflow.
Correlation Rule
Correlation Rule is a Content Group that contains a correlation rule, the namespace in which it is stored, and any associated correlation actions or dynamic lists. This icon is also used for the correlation rule definition.
Namespace Indicates Namespace Instance in which the
correlation rule is stored
JavaScript Indicates JavaScript file used in correlation action.
Action Indicates Action Configuration for a correlation
action.
Correlation Rule Deployment
Indicates the Correlation Rule deployment.
Report Report is a Content Group that contains a Crystal
report. This icon is also used for the .rpt report file.
Dynamic List Indicates Dynamic List. Table 14-2: Types of Content Group
Permissions for Using Solution Packs To use the Solution Manager or Solution Designer, a user must be assigned the necessary permissions in the User Manager.
To grant permissions for the Solution Pack:
1. Log into the Sentinel Control Center as a user with permissions to use the User Manager.
2. Go to the Admin tab. 3. Open the User Configuration folder. 4. Open the User Manager window. 5. Click the Permissions tab. 6. Select Solution Designer, Solution Manager, or Solution Pack (which will
automatically select both child permissions). The new permissions will be applied the next time the user logs in.
Solution Packs 14-3

Figure 14-2: User Details window
Solution Manager After a Solution Pack is imported, the Solution Manager in the Sentinel Control Center is used to install, implement and test each Control.
Installing a Control installs the child content for the Control into the Sentinel system. When the content is initially installed, its status is Not Implemented.
Implementing a Control is the process to configure event source systems and Sentinel to use the content associated with the Control. Novell Solution Packs include detailed documentation describing implementation steps. The user should change the status of the Control to Implemented after following all of these steps.
Testing a Control is the process to verify the content associated with the Control. Novell Solution Packs include detailed documentation describing testing steps. The user should change the status of the Control to Tested after following all of these steps.
To use the Solution Manager, a user must be assigned Solution Manager permissions under Solution Pack.
Solution Manager Interface The Solution Manager window is divided into two frames: Content and Documentation.
Content Frame
Content Frame provides Solution Pack zip extracted information. The Content frame displays a hierarchical view of the Category, Control, Content Group, and various types of content. All parent nodes reflect the overall state of the controls they contain. This means that parent nodes have an inherited status based on their child content.
14-4 Sentinel User Guide

The Content frame consists of the following columns:
Name: Displays the name of the node. Installed: Indicates whether the content is installed in the target Sentinel system. If
not, this column will be blank. State: This column is available for the control node. This column contain a drop-
down box with the following values: Not Implemented: This is the default state when the control is first deployed. Implemented: This state indicates that the content is fully implemented using the
associated documentation. Tested: This state indicate that you have fully tested the content for this control
using the associated documentation.
NOTE: Because of the regulatory significance of implementing controls, status changes for each control are tracked for auditing purposes.
Figure 14-3: Content Frame
Documentation Frame The Documentation frame provides description of selected node Descriptive information provided when creating the Solution Pack using Solution Designer is displayed here. For more information on Solution Designer, see “Solution Designer.”
The following informational tabs, populated and edited using the Solution Designer, are available in Documentation frame:
Description: This tab displays the description of selected node. An additional panel is attached to this tab called Attachment. You can view attachments and their description in the Description tab. The user can add text to the External ID field to refer to specific regulations or corporate IDs.
Implementation: This tab, associated with the control nodes, displays the instructions for implementing the selected control.
Testing: This tab, associated with the control nodes, displays the instructions for testing the selected control.
Solution Packs 14-5

Notes: The Notes tab, associated with the control nodes, is editable. This can be used for any notes related to the control, including user comments on the testing or implementation process.
Figure 14-4: Documentation Frame
Managing Solution Packs Importing Solution Packs
Solution Packs are be available from several sources. They can be downloaded from http://support.novell.com/products/sentinel6 (an additional license might be needed). They can be provided by one of Novell’s partners, or they can be created from content in your own Sentinel system.
The first step in using a Solution Pack is to import the .zip file into the system using the Import Plugin Wizard When a Solution Pack is imported, the .zip file is copied to the server where the DAS (Data Access Service) components are installed. The actual contents of the Solution Pack are not available in the target Sentinel system until the Controls are installed using the Solution Manager.
If you import an updated version of a Solution Pack, you are prompted to replace the existing plugin.
To import Solution Packs:
1. Click Admin on the menu bar and select Solution Packs. Alternatively, select Solution Packs from Navigator or click Solution Pack on the tool bar. The Solution Packs window displays.
Figure 14-5: Solution Pack window
14-6 Sentinel User Guide

2. Click Import icon in the Solution Packs window. The Import Plugin Type window displays.
Figure 14-6: Import Plugin Wizard-Plugin Import Type window Select Import Solution package plugin file (.zip). Click Next. The Choose Plugin Package File window displays.
3. Use the Browse button to the locate Solution Pack to import to the plugin repository. Select a zip file and Click Open.
Figure 14-7: Import Plugin Wizard-Choose Plugin Package File window If you have selected a solution pack which already exists then the Replace Existing Plugin window displays. Click Next if you want to replace the existing plugins.
Solution Packs 14-7
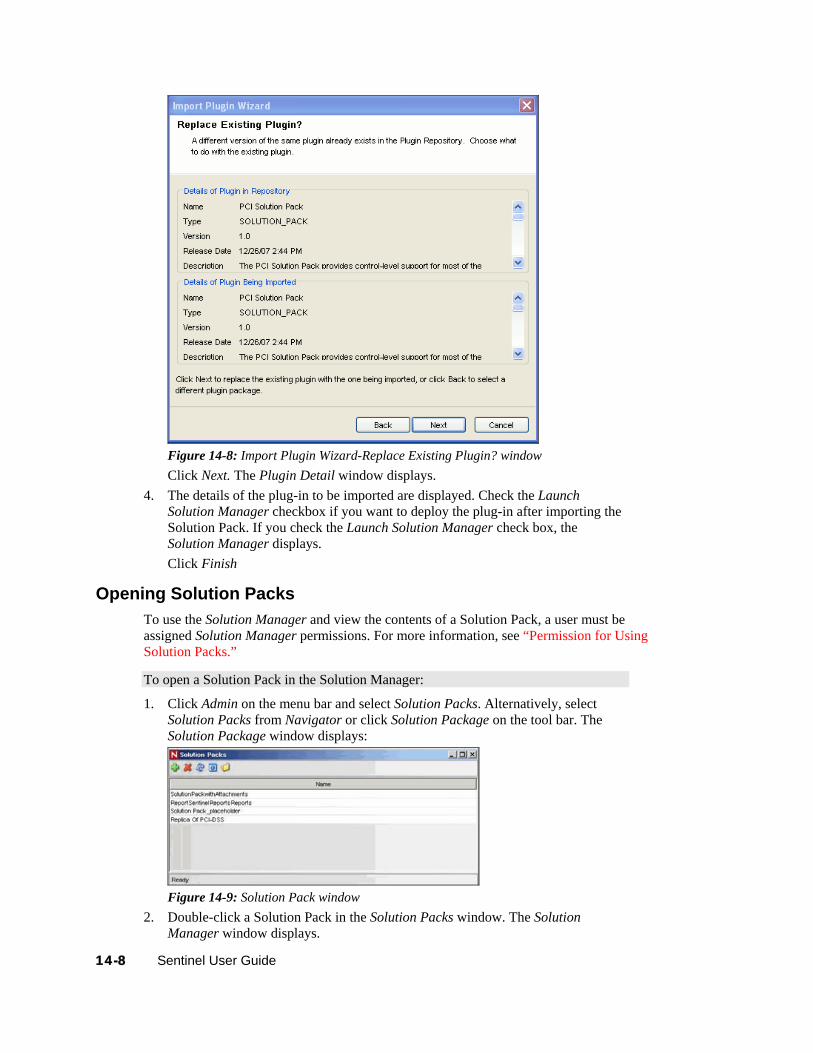
Figure 14-8: Import Plugin Wizard-Replace Existing Plugin? window Click Next. The Plugin Detail window displays.
4. The details of the plug-in to be imported are displayed. Check the Launch Solution Manager checkbox if you want to deploy the plug-in after importing the Solution Pack. If you check the Launch Solution Manager check box, the Solution Manager displays. Click Finish
Opening Solution Packs To use the Solution Manager and view the contents of a Solution Pack, a user must be assigned Solution Manager permissions. For more information, see “Permission for Using Solution Packs.”
To open a Solution Pack in the Solution Manager:
1. Click Admin on the menu bar and select Solution Packs. Alternatively, select Solution Packs from Navigator or click Solution Package on the tool bar. The Solution Package window displays:
Figure 14-9: Solution Pack window
2. Double-click a Solution Pack in the Solution Packs window. The Solution Manager window displays.
14-8 Sentinel User Guide
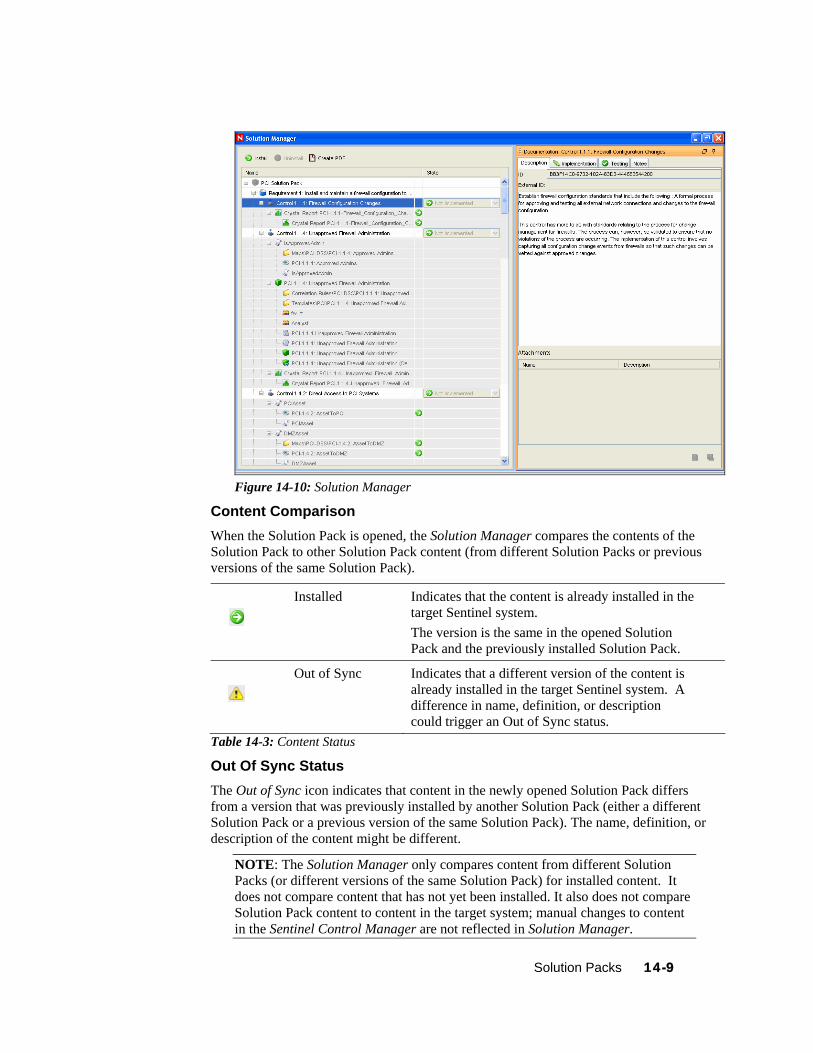
Figure 14-10: Solution Manager
Content Comparison When the Solution Pack is opened, the Solution Manager compares the contents of the Solution Pack to other Solution Pack content (from different Solution Packs or previous versions of the same Solution Pack).
Installed Indicates that the content is already installed in the target Sentinel system. The version is the same in the opened Solution Pack and the previously installed Solution Pack.
Out of Sync Indicates that a different version of the content is already installed in the target Sentinel system. A difference in name, definition, or description could trigger an Out of Sync status.
Table 14-3: Content Status
Out Of Sync Status The Out of Sync icon indicates that content in the newly opened Solution Pack differs from a version that was previously installed by another Solution Pack (either a different Solution Pack or a previous version of the same Solution Pack). The name, definition, or description of the content might be different.
NOTE: The Solution Manager only compares content from different Solution Packs (or different versions of the same Solution Pack) for installed content. It does not compare content that has not yet been installed. It also does not compare Solution Pack content to content in the target system; manual changes to content in the Sentinel Control Manager are not reflected in Solution Manager.
Solution Packs 14-9

When you right-click a Solution Pack, you can select Expand Only Out of Sync Nodes. This option expands all Controls that are out of sync and collapses all Controls that are either uninstalled or in sync. This makes it easy to find the out of sync content in a large Solution Pack.
To resolve out of sync content:
1. Select the out of sync content (not the Control or Category) in the Solution Manager.
2. Right-click and select Out of sync content details. A message displays with information about which Solution Pack is the source of the out of sync content.
3. Compare the description of content item in the two Solution Packs to determine which version you want to keep.
4. Uninstall the out of sync Control from all Solution Packs. (Ideally you should resolve the out of sync issue before installing the new Solution Pack.)
5. Reinstall the Control with the content you want to keep. 6. Implement and test as required.
Installing Content from Solution Packs To use the content of a Solution Pack in the Sentinel Control Center, you must install the Solution Pack or selected Controls in a Sentinel System (also known as the “target” Sentinel system).
When you install either a Solution Pack or an individual Control, all of the child nodes are installed.
To install the contents of a Solution Pack:
1. Go to Admin Tab > Solution Packs. 2. Double-click a Solution Pack to open Solution Manager. Alternatively you can
click Open with Solution Manager icon. The Solution Manager window displays. 3. Select a Solution Pack or a Control which you want to install. Click Install.
Alternatively, right-click on a Solution Pack or Control and select Install. The Install Control Wizard displays. If you select a Solution Pack, all the controls in that Solution Pack displays. If you select a individual Control then that control is displayed in the Install Control Wizard window.
Figure 14-11: Install Control Wizard-Controls To Install
14-10 Sentinel User Guide
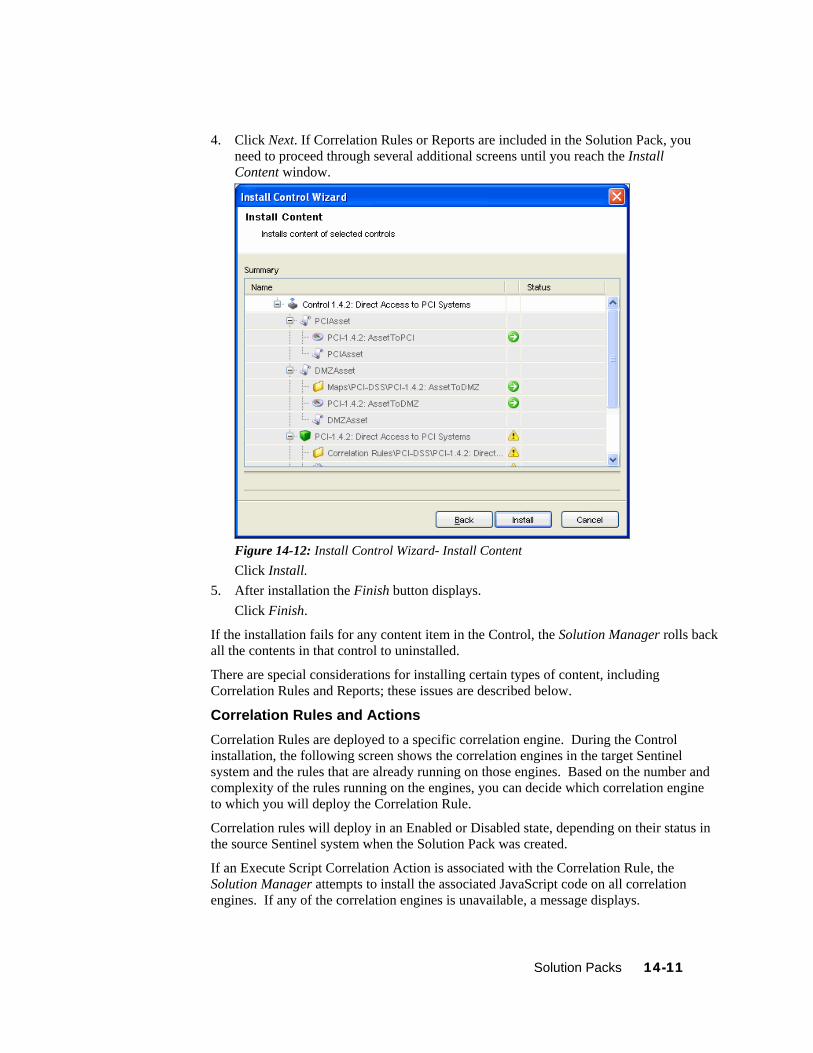
4. Click Next. If Correlation Rules or Reports are included in the Solution Pack, you need to proceed through several additional screens until you reach the Install Content window.
Figure 14-12: Install Control Wizard- Install Content Click Install.
5. After installation the Finish button displays. Click Finish.
If the installation fails for any content item in the Control, the Solution Manager rolls back all the contents in that control to uninstalled.
There are special considerations for installing certain types of content, including Correlation Rules and Reports; these issues are described below.
Correlation Rules and Actions Correlation Rules are deployed to a specific correlation engine. During the Control installation, the following screen shows the correlation engines in the target Sentinel system and the rules that are already running on those engines. Based on the number and complexity of the rules running on the engines, you can decide which correlation engine to which you will deploy the Correlation Rule.
Correlation rules will deploy in an Enabled or Disabled state, depending on their status in the source Sentinel system when the Solution Pack was created.
If an Execute Script Correlation Action is associated with the Correlation Rule, the Solution Manager attempts to install the associated JavaScript code on all correlation engines. If any of the correlation engines is unavailable, a message displays.
Solution Packs 14-11
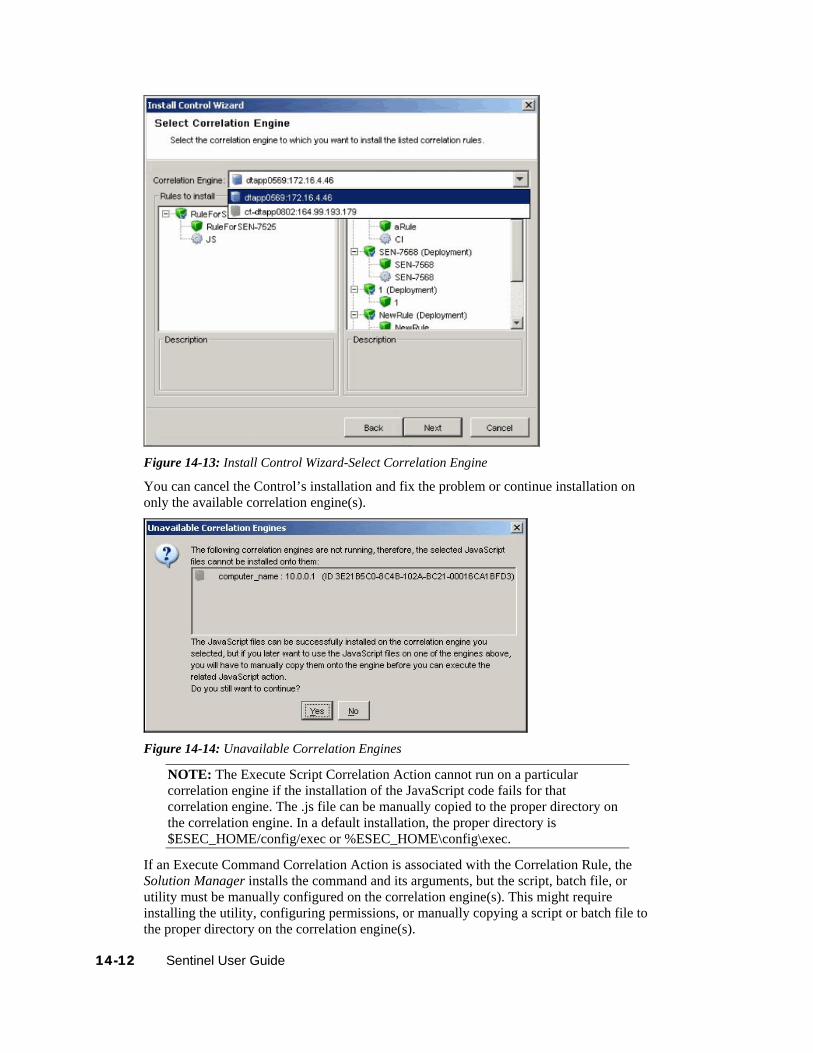
Figure 14-13: Install Control Wizard-Select Correlation Engine
You can cancel the Control’s installation and fix the problem or continue installation on only the available correlation engine(s).
Figure 14-14: Unavailable Correlation Engines
NOTE: The Execute Script Correlation Action cannot run on a particular correlation engine if the installation of the JavaScript code fails for that correlation engine. The .js file can be manually copied to the proper directory on the correlation engine. In a default installation, the proper directory is $ESEC_HOME/config/exec or %ESEC_HOME\config\exec.
If an Execute Command Correlation Action is associated with the Correlation Rule, the Solution Manager installs the command and its arguments, but the script, batch file, or utility must be manually configured on the correlation engine(s). This might require installing the utility, configuring permissions, or manually copying a script or batch file to the proper directory on the correlation engine(s).
14-12 Sentinel User Guide
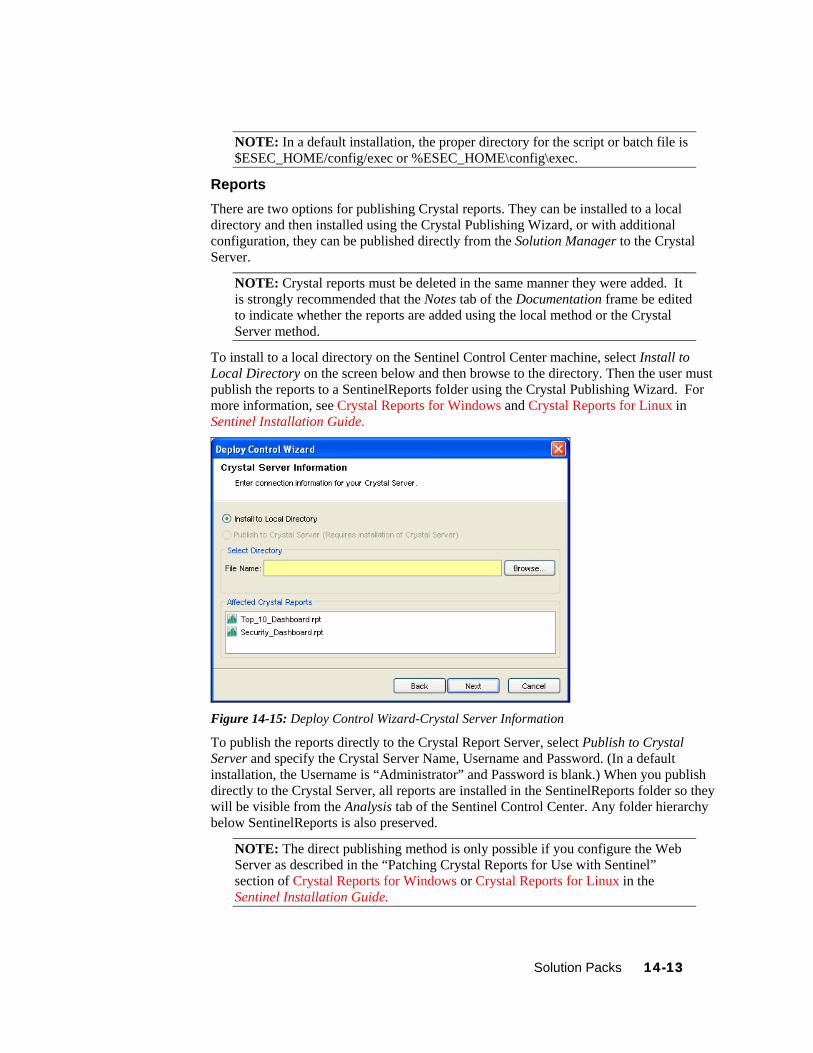
NOTE: In a default installation, the proper directory for the script or batch file is $ESEC_HOME/config/exec or %ESEC_HOME\config\exec.
Reports There are two options for publishing Crystal reports. They can be installed to a local directory and then installed using the Crystal Publishing Wizard, or with additional configuration, they can be published directly from the Solution Manager to the Crystal Server.
NOTE: Crystal reports must be deleted in the same manner they were added. It is strongly recommended that the Notes tab of the Documentation frame be edited to indicate whether the reports are added using the local method or the Crystal Server method.
To install to a local directory on the Sentinel Control Center machine, select Install to Local Directory on the screen below and then browse to the directory. Then the user must publish the reports to a SentinelReports folder using the Crystal Publishing Wizard. For more information, see Crystal Reports for Windows and Crystal Reports for Linux in Sentinel Installation Guide.
Figure 14-15: Deploy Control Wizard-Crystal Server Information
To publish the reports directly to the Crystal Report Server, select Publish to Crystal Server and specify the Crystal Server Name, Username and Password. (In a default installation, the Username is “Administrator” and Password is blank.) When you publish directly to the Crystal Server, all reports are installed in the SentinelReports folder so they will be visible from the Analysis tab of the Sentinel Control Center. Any folder hierarchy below SentinelReports is also preserved.
NOTE: The direct publishing method is only possible if you configure the Web Server as described in the “Patching Crystal Reports for Use with Sentinel” section of Crystal Reports for Windows or Crystal Reports for Linux in the Sentinel Installation Guide.
Solution Packs 14-13

Figure 14-16: Deploy Control Wizard-Crystal Server Information
You can customize the URL’s that the Solution Manager will attempt when installing reports. The following procedure allows you to customize the URL’s:
To customize the URL:
1. Based on the operating system: For Windows: Copy publish_report.jsp and
delete_report.jsp files from <build unzipped directory>\reports_patch\IIS to \BusinessObjects Enterprise 11.5\Web Content\Enterprise115\WebTools\Sentinel
For Linux: Copy publish_report.asp and delete_report.asp files from <build unzipped directory>/reports_patch/Tomcat to /opt/crystal_xi/bobje/tomcat/webapps/esec-script/Sentinel
Note: You must create the Sentinel directory if it’s not available.
2. Browse to %ESEC_HOME%/conf/ folder. 3. Open SentinelPreferences.properties file using Notepad for
editing. Add the following two new properties to supply customized URL’s for publishing and deleting reports:
com.eSecurity.Sentinel.crystal.publishURLs=http://##HOST##/businessobjects/Enterprise115/WebTools/Sentinel/publish_report.aspx http://##HOST##:8080/esec-script/publish_report.jsp
com.eSecurity.Sentinel.crystal.deleteURLs=http://##HOST##/businessobjects/Enterprise115/WebTools/Sentinel/delete_report.aspx
14-14 Sentinel User Guide

http://##HOST##:8080/esec-script/delete_report.jsp
Each of these properties contains two URL’s separated with single whitespace.
Note: Report generation will fail if the proper port is not specified for the URL’s above (For example, 8080 default port for Tomcat).
The string “##HOST##” is automatically substituted with the server name specified during deployment in Deploy Control Wizard, Crystal Server Installation window of Solution Manager. You can modify these properties or append them with additional URL’s.
Content Placeholders Only fully defined Controls can be installed. For Controls that contain placeholders, the Install option is disabled:
Figure 14-17: Controls with Placeholders
The following warning displays in the Description frame:
Figure 14-18: Documentation Control
Duplicate Content within Solution Pack If two separate Controls contain identical content and one Control is deployed successfully, the status of the duplicate content in the other Control is changed to Installed. The remaining child nodes in the second Control stay uninstalled.
Each content item is only installed once. If the same content item (for example, an iTRAC workflow or a correlation rule) is included in more than one Control, it is only installed once. Therefore, if you install one of those Controls, the content displays with an installed status in the other Control. In this scenario, the Solution Manager might show that the content for the second Control is only partially installed. See Control 1.4.2 in the example below:
Solution Packs 14-15
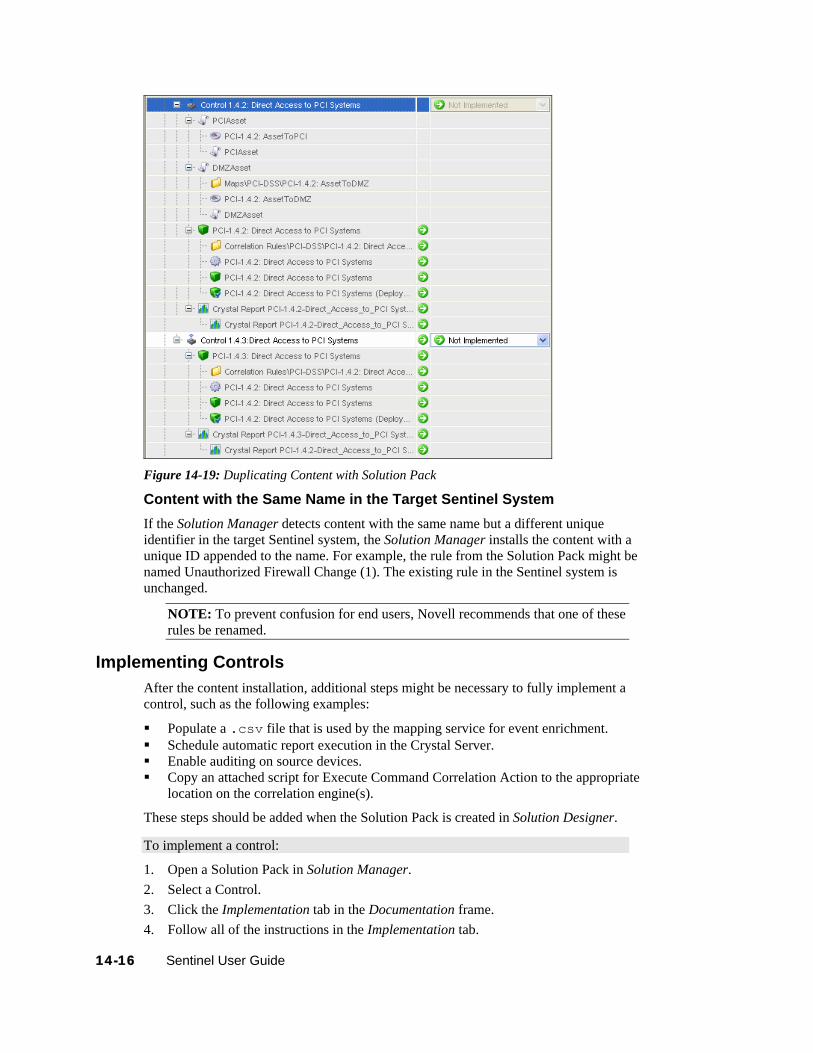
Figure 14-19: Duplicating Content with Solution Pack
Content with the Same Name in the Target Sentinel System If the Solution Manager detects content with the same name but a different unique identifier in the target Sentinel system, the Solution Manager installs the content with a unique ID appended to the name. For example, the rule from the Solution Pack might be named Unauthorized Firewall Change (1). The existing rule in the Sentinel system is unchanged.
NOTE: To prevent confusion for end users, Novell recommends that one of these rules be renamed.
Implementing Controls After the content installation, additional steps might be necessary to fully implement a control, such as the following examples:
Populate a .csv file that is used by the mapping service for event enrichment. Schedule automatic report execution in the Crystal Server. Enable auditing on source devices. Copy an attached script for Execute Command Correlation Action to the appropriate
location on the correlation engine(s).
These steps should be added when the Solution Pack is created in Solution Designer.
To implement a control:
1. Open a Solution Pack in Solution Manager. 2. Select a Control. 3. Click the Implementation tab in the Documentation frame. 4. Follow all of the instructions in the Implementation tab.
14-16 Sentinel User Guide
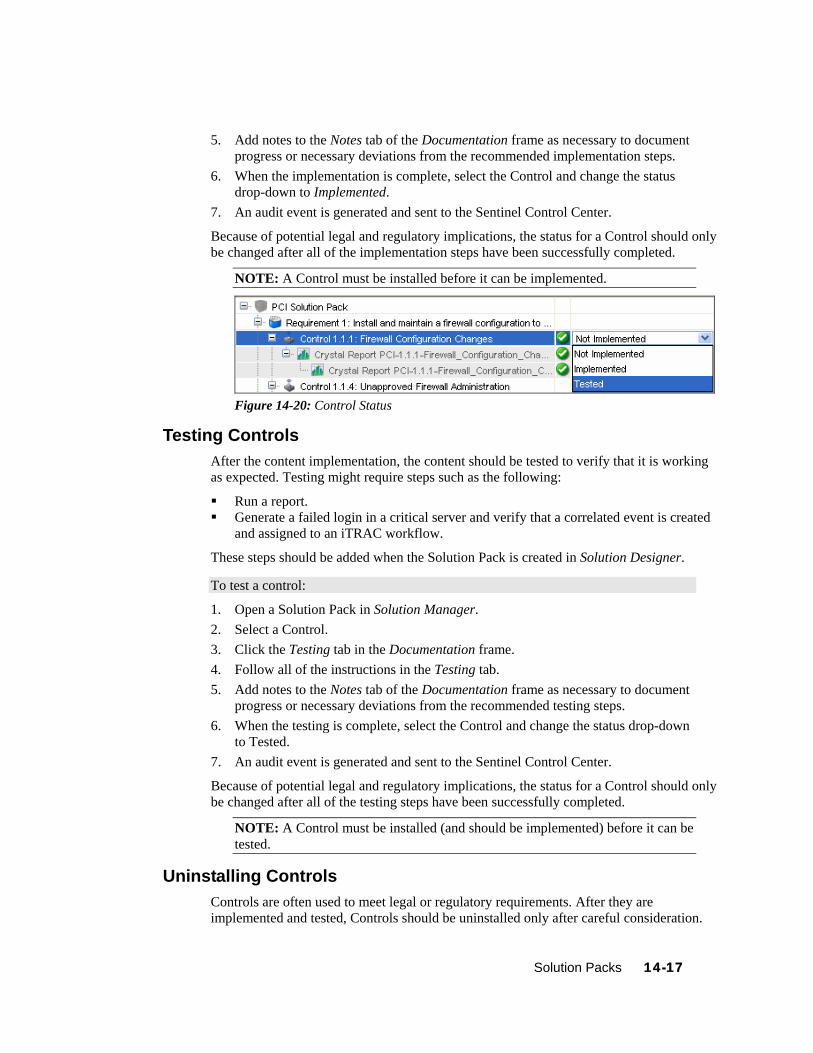
5. Add notes to the Notes tab of the Documentation frame as necessary to document progress or necessary deviations from the recommended implementation steps.
6. When the implementation is complete, select the Control and change the status drop-down to Implemented.
7. An audit event is generated and sent to the Sentinel Control Center.
Because of potential legal and regulatory implications, the status for a Control should only be changed after all of the implementation steps have been successfully completed.
NOTE: A Control must be installed before it can be implemented.
Figure 14-20: Control Status
Testing Controls After the content implementation, the content should be tested to verify that it is working as expected. Testing might require steps such as the following:
Run a report. Generate a failed login in a critical server and verify that a correlated event is created
and assigned to an iTRAC workflow.
These steps should be added when the Solution Pack is created in Solution Designer.
To test a control:
1. Open a Solution Pack in Solution Manager. 2. Select a Control. 3. Click the Testing tab in the Documentation frame. 4. Follow all of the instructions in the Testing tab. 5. Add notes to the Notes tab of the Documentation frame as necessary to document
progress or necessary deviations from the recommended testing steps. 6. When the testing is complete, select the Control and change the status drop-down
to Tested. 7. An audit event is generated and sent to the Sentinel Control Center.
Because of potential legal and regulatory implications, the status for a Control should only be changed after all of the testing steps have been successfully completed.
NOTE: A Control must be installed (and should be implemented) before it can be tested.
Uninstalling Controls Controls are often used to meet legal or regulatory requirements. After they are implemented and tested, Controls should be uninstalled only after careful consideration.
Solution Packs 14-17

When a Control is uninstalled, the status for the Control reverts to Not Implemented and child content is deleted from the Sentinel system. There are a few exceptions and special cases:
Dependencies are checked to ensure that no content that is still in use is deleted. Some examples of this include a dynamic list that is used by a correlation rule created in the target Sentinel system, a report that is used in a Control that is still installed, an iTRAC workflow template that is used in a Solution Pack that is still installed, or a folder that still contains other content.
Reports (.rpt files) copied to a local system cannot be removed if the uninstall is performed from a Sentinel Control Center on a different machine.
JavaScript files associated with Execute Script Correlation Actions remain on the correlation engine(s).
Maps (.csv files) and the data they contain are not deleted. Roles associated with workflows are not deleted. iTRAC workflow processes that are already in progress complete even if the iTRAC
workflow is uninstalled.
To uninstall a Control:
1. Right click the Control you want to uninstall and select Uninstall. Alternatively, you can click Uninstall icon. The Controls To Uninstall window displays
Figure 14-21: Uninstall Control Wizard-Controls To Uninstall Click Next.
2. If the Control you are uninstalling includes one or more reports, you are prompted whether to uninstall the reports from the local server or the Crystal Server. Ideally, this information was recorded on the Notes tab when the reports were installed. Click Next. The Uninstall Content window displays.
14-18 Sentinel User Guide

Figure 14-22: Uninstall Control Wizard-Uninstall Content
3. Click Uninstall. The selected contents are uninstalled.
NOTE: Local reports cannot be uninstalled from a different Sentinel Control Center machine than they were installed or if the files were copied to a new location after installation. If the Solution Manager cannot find the .rpt files in the expected location, a message is logged in the Sentinel Control Center log file.
4. Click Finish.
Viewing Solution Pack Status There are several sources of information about the status of a Solution Pack.
Viewing Status in Solution Manager You can view the status of Solution Pack contents in the Solution Manager:
None/Blank: No status indicator for a Control indicates that the associated content has not been installed yet.
Not Implemented: When none or some of the contents of a control are installed, the control is in the Not Implemented state. If the same content is installed by another Control, a Control might be Not Implemented even if some of its child content is Installed.
Implemented: This status indicates that a user has completed all of the implementation steps and manually set the Control status to Implemented.
Tested: This status indicates that a user has completed all of the testing steps and manually set the Control status to Tested.
Out of Sync: This status indicates that a different version of the content in the Solution Pack is deployed in the Sentinel target system by another Solution Pack (or a previous version of the same Solution Pack.
Solution Packs 14-19
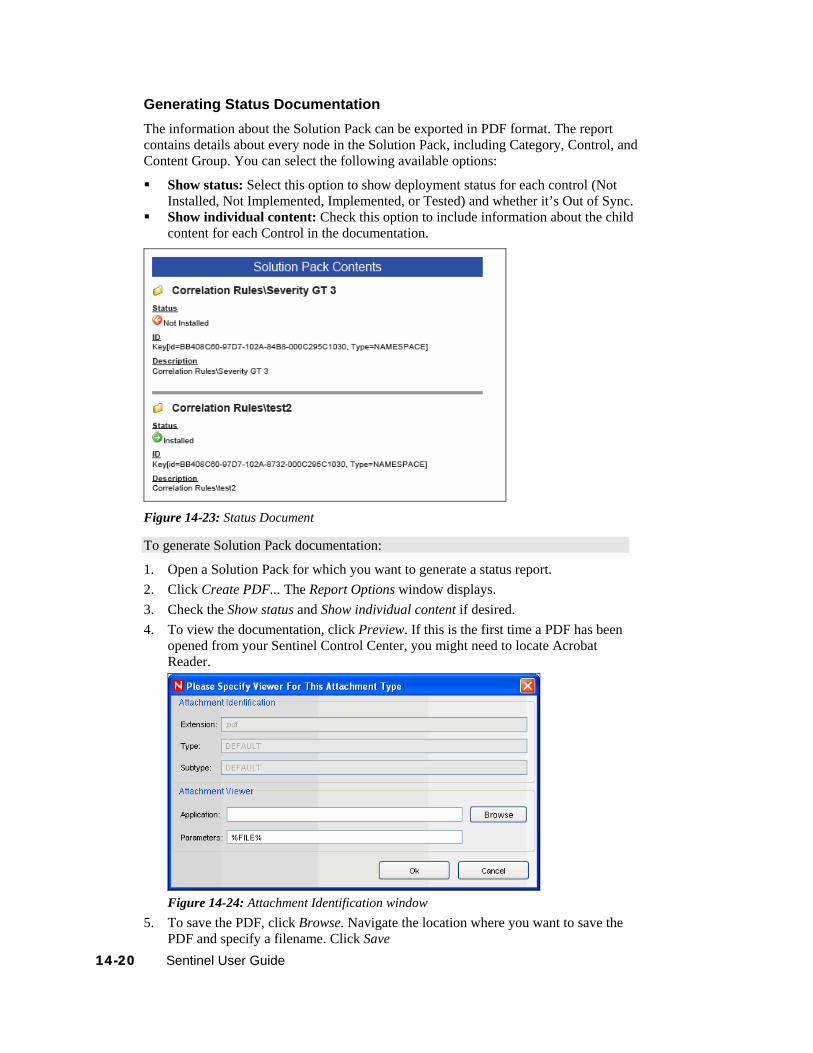
Generating Status Documentation The information about the Solution Pack can be exported in PDF format. The report contains details about every node in the Solution Pack, including Category, Control, and Content Group. You can select the following available options:
Show status: Select this option to show deployment status for each control (Not Installed, Not Implemented, Implemented, or Tested) and whether it’s Out of Sync.
Show individual content: Check this option to include information about the child content for each Control in the documentation.
Figure 14-23: Status Document
To generate Solution Pack documentation:
1. Open a Solution Pack for which you want to generate a status report. 2. Click Create PDF... The Report Options window displays. 3. Check the Show status and Show individual content if desired. 4. To view the documentation, click Preview. If this is the first time a PDF has been
opened from your Sentinel Control Center, you might need to locate Acrobat Reader.
Figure 14-24: Attachment Identification window
5. To save the PDF, click Browse. Navigate the location where you want to save the PDF and specify a filename. Click Save
14-20 Sentinel User Guide

Figure 14-25: Report Options
Audit Events in the Sentinel Control Center All major actions related to Solution Packs and Controls are audited by the Sentinel system, with information about which user performed the action. The following events are visible in the Sentinel Control Center and are stored in the Sentinel database:
Solution Pack is imported. Control is installed. Control status is changed to Implemented. Control status is changed to Tested. Control status is changed to Not Implemented. Control is uninstalled. Notes are modified for a Control Solution Pack is deleted.
Deleting Solution Packs Solution Packs are often used to meet legal or regulatory requirements. After they are implemented and tested, Solution Packs should be deleted only after careful consideration.
All deletions are audited by the Sentinel system and sent to both the Sentinel Control Center and the Sentinel database.
To delete a Solution Pack:
1. Click Admin on the menu bar and select Solution Packs. Alternatively, select Solution Packs from Navigator or click Solution Pack on the tool bar. The Solution Packs window displays.
2. Select the Solution Pack you want to delete and click the Open icon on the tool bar.
3. Select the Solution Pack node and click Uninstall. All Controls are uninstalled. 4. Close the Solution Manager 5. With the same Solution Pack selected, click Remove plugin. You are prompted
for deleting the Solution Pack. Click Yes to delete.
NOTE: If you attempt to delete a Solution Pack without uninstalling the content first, you are notified that content is still deployed. You have the option to open the Solution Pack in Solution Manager and uninstall the content.
Solution Packs 14-21

Solution Designer You can use the Solution Designer to package and export different contents for example, Correlation Rule with associated Actions and Dynamic lists and Crystal Reports. These contents can be selected and packaged with their respective configuration to a zip file. You can then view or select the content of the zip file using Solution Manager. For more information on Solution Manager, see “Solution Manager.”
To use the Solution Designer, a user must be assigned Solution Designer permissions under Solution Pack.
Solution Designer Interface The Solution Designer is divided into several frames: Content Palette, Content Description, Solution Pack, and Documentation. The Content Palette includes several sections that can be expanded, including Correlation Deployment, Event Enrichment, Workflow Templates and Reports. The displayed contents are populated from the Sentinel Server and can be exported into a Solution Pack.
Content Palette
14-22 Sentinel User Guide

Content Description
Solution Pack
Documentation
Table 14-4: Solution Designer - User Interface
Connection Modes Solution Packs can be created or edited in Solution Designer in connected or offline modes.
In offline mode, there is no connection to an active Sentinel Server or its content (such as iTRAC workflows, event enrichment, or correlation rules). However, you can perform the following actions:
Define the structure of the Solution Pack (including Categories, Controls, and content placeholders).
Write implementation documentation.
Solution Packs 14-23

Write testing documentation. Add reports (.rpt files) available in your local system or published on a connected
Crystal server. Add attachments to any node of the Solution Pack.
In connected mode, all content in the Sentinel system is available. In addition to all of the actions that are available in offline mode, you can also perform the following actions:
Add Sentinel content (such as Correlation Rules, Maps, iTRAC workflows). Replace placeholders with Sentinel content.
To open Sentinel Designer in offline mode:
1. In Windows, use the Sentinel Solution Designer shortcut on the desktop, or start Solution Designer by executing one of the following commands:
solution_designer.bat (in %ESEC_HOME%\bin on Windows)
solution_designer.sh (in $ESEC_HOME/bin on Solaris/Linux)
The Sentinel Solution Designer login window displays. 2. Provide your login credentials. Check Work Offline checkbox if desired, then
click Login. The Solution Designer displays.
Figure 14-26: Solution Designer window
3. Open or create a Solution Pack.
Creating a Solution Pack Using Solution Designer, you can create a Solution Pack using existing content objects (for example, Correlation Rules, Dynamic Lists, or iTRAC workflow templates) from Sentinel. The Solution Designer will analyze the dependencies for a content object and include all necessary components in the Solution Pack. For example, a correlation rule deployment includes a correlation rule definition and can also include one or more actions and the ability to create an incident using a workflow. The Solution Designer will include the correlation rule, the associated correlation actions, the iTRAC template, and the roles associated with the iTRAC template in the Solution Pack.
14-24 Sentinel User Guide

NOTE: To add a content object to a Solution Pack, it must already exist in Sentinel. Content objects cannot be created using Solution Designer.
To create a new Solution Pack:
1. Open the Solution Designer in either connected or offline mode. 2. Click File > New. An empty Solution Pack displays in the Solution Pack frame. 3. Add Categories, Controls, Content Groups, and content placeholders using the
proper procedures for each. 4. Add file attachments to the hierarchy nodes as desired. 5. Select File > Save. The Save window displays. Provide a name and click Save.
The Solution Pack is saved in a .zip format.
NOTE: Although you can save a Solution Pack with empty placeholders, you cannot install Controls in Solution Manager unless all placeholders have been filled with content.
Managing Content Hierarchy Nodes All content in a Solution Pack is hierarchically organized into Categories, Controls, and Content Groups in those groups. These nodes in the hierarchy can be added, deleted, renamed, or reordered.
Function Description Create Add a node to the existing control.
Select an existing node. Right-click and select Create, or click Create in the Solution Pack frame. Specify the details and click Create.
Rename Rename an existing node. Select an existing node. Right-click and select Rename, or click Rename in the Solution Pack frame. Provide the new name and click OK.
Delete Delete a Category, Control or Content Group object. Select an existing node. Right-click and select Delete, or click Delete option in the Solution Pack frame. The Delete Selected Objects? message displays. Click OK.
View or Edit Properties
View or edit the properties of a Solution Pack, such as the creator. Select File > Properties from the menu bar or right-click the Solution Pack node and select Properties.
Expand or Collapse Nodes
Expand or collapse all child nodes. Select the Solution Pack or any Category, Control or Content Group level. Right-click a node and select Expand All or Collapse All.
Move Nodes Category, Control, and Content Group nodes can be created in any order and then reordered or moved to a different parent in the hierarchy. To move a node to another branch in the hierarchy. Drag and drop a node to its new parent node. A Control can be moved to a new Category. A Content Group can be moved to a new Control. To reorder a node, drag and drop it on top of the node it should appear after in the Solution Pack.
Table 14-5: Adding, Deleting, Renaming and Reordering Content hierarchy
Solution Packs 14-25

14-26 Sentinel User Guide
Adding Content to a Solution Pack A vital part of creating a Solution Pack is adding content to the controls. Each control can have one or more types of content associated with it.
Sentinel Content The same general procedure is used to add all types of Sentinel content to a Solution Pack. The Sentinel content options include the following:
Correlation Rule Deployments, including their deployment status (enabled or disabled) and associated Correlation Rules, Correlation Actions, and Dynamic Lists
Reports iTRAC Workflows, including associated Roles Event enrichment, including map definitions and event metatag configuration Other associated files added when the Solution Pack is created, such as
documentation, example report PDFs, or sample map files.
The general steps for Sentinel content are described below. The steps for reports, which are Crystal content, are slightly different. For more information, see “Crystal Reports.”
NOTE: Because dynamic list elements and map data are often highly dependent on the system environment, this data is not included as part of the dynamic list or map definition in the Solution Pack. However, this data can be attached to the Solution Pack as a .csv file.
To add Sentinel content to a control:
1. Log into Solution Designer in connected mode. 2. Open or create a Solution Pack. 3. Click the appropriate panel to display the available Reports from the Content
Palette-Solution Pack, Category, Control, Control Group and Contents. 4. Select the specific Content Group you want to add. 5. Select the appropriate Control or placeholder and click Add Selected Content.
Alternatively, drag and drop the selected Content Group to the appropriate Control or placeholder in the Solution Pack frame.
Crystal Reports You can add a Crystal Report (.rpt file) from the SentinelReports folder on a Crystal Report Server or from a local file system. Adding a Crystal report is similar to adding other types of content, but it requires an extra step to log into the Crystal server.
Crystal reports must be deleted in the same way they were added. It is strongly recommended that the Description be edited to indicate whether the report was added to the local file system or to the Crystal Server.
To add a report from a Crystal Server:
1. Log into Solution Designer in connected mode or offline mode and open or create a Solution Pack.
2. Click Report panel in the Content Palette. The Report Panel will expand.

Figure 14-27: Reports Panel
3. Click Connect. The Login to Crystal Server window displays. Specify the Server Name, User Name and Password in their respective fields.
NOTE: In a default Crystal installation, the User Name is “Administrator” and the password is blank.
Click Login 4. All the report folders will be available as a dropdown. Select the folder to view all
corresponding reports.
Figure 14-28: Sentinel Reports
5. Select a report, drag and drop the report in the Solution Pack frame. The report can now be exported using the Save option in the File menu.
NOTE: Only reports from the SentinelReports folder and its subfolders are available. The folder hierarchy is preserved when the reports are added to a target Sentinel system. (Reports must be in the SentinelReports folder to be viewed on the Analysis tab of the Sentinel Control Center.
To add a report from the local file system:
1. Log into Solution Designer (in connected or offline mode) on the machine where the .rpt files reside.
2. Open or create a Solution Pack. 3. Click Report panel in the Content Palette. The Report Panel will expand.
Solution Packs 14-27

Figure 14-29: Reports Panel
4. Select a control in the Content tree. Select a Local Report File… in Content Palette and click Add Selected Content button on the top left corner.
5. The Add From Local Report File window displays. Browse to the location on your local drive where the report is located.
Figure 14-30: Add From Local Report File window
6. Select the file and click Open. The file description is displayed. 7. Click OK.
Placeholders If the user is working in offline mode or is not ready to associate content with a control, an empty placeholder can be used instead.
To add a placeholder:
1. Click a button in the Content Palette to open the panel for the type of placeholder you want to add: Correlation, Event Enrichment, iTRAC workflow or Report.
2. Drag and drop the placeholder to the appropriate Control in the Solution Pack frame.
3. Rename if desired.
To replace a placeholder with content:
1. Click a button in the Content Palette to open the panel for the type of placeholder you want to replace: Correlation, Event Enrichment, iTRAC workflow or Report.
2. Drag and drop the appropriate Content Group from the Content Palette to the placeholder in the Solution Pack frame.
File Attachments You can attach a file or files to any node in the hierarchy, and they will be included in the Solution Pack. These files can include anything useful for a user who must deploy the Solution Kit, such as a PDF view of a report, sample map data for event enrichment, or a
14-28 Sentinel User Guide

script for an Execute Command Correlation Action. These files can be added, deleted, viewed, renamed, or saved to the local machine.
Add File
Add an attachment to a node. The system prompts for another file if you attempt to add one that is already attached. Select a node. Click Add a new attachment icon in the Attachments panel. Locate the file, provide a description, and save.
View View an attachment. Select a node and then select the attachment in the Attachment panel. Right-click and select View File. The file displays in the associated application.
N/A Rename Rename an attachment. Select a node and then select the attachment in the Attachment panel. Right-click and select Rename. Specify the new name and click OK.
Delete Delete an attachment. Select a node and then select the attachment in the Attachment panel. Right-click and select Delete. Click OK to delete.
Save Save a copy of the attachment to the local system. Select a node and then select the attachment in the Attachment panel. Right-click and select Save As. Select a file location and click Save.
Table 14-6: File Attachment
Documenting a Solution Pack Implementation Steps Add the steps required to implement the content in the target Sentinel system to the Implementation tab of the Documentation frame. The steps might include instructions for the following types of implementation actions:
Populating a .csv file that is used by the mapping service for event enrichment. Scheduling automatic report execution in the Crystal Server. Enabling auditing on source devices. Copying an attached script for an Execute Command Correlation Action to the
appropriate location on the correlation engine(s).
After the content implementation, the content should be tested to verify that it is working as expected. Testing might require steps such as the following:
Testing Steps Add the steps required to test the content in the target Sentinel system to the Testing tab of the Documentation frame. The steps can include instructions for the following types of testing activities:
Solution Packs 14-29

Run a report and verify that data is returned. Generate a failed login in a critical server and verify that a correlated event is created
and assigned to an iTRAC workflow.
Editing a Solution Pack A saved Solution Pack can be edited using Solution Designer. For information about deploying the changes into an existing system, see “Deploying an Edited Solution Pack.”
When an existing Solution Pack is saved, the user has several options:
Save: Saves an updated version of the original Solution Pack. If the Solution Pack is re-imported into a Sentinel system, it replaces the old version.
Save As: Saves a renamed version of the original Solution Pack. If the Solution Pack is re-imported into a Sentinel system, it replaces the old version.
Save As New: Saves a Solution Pack with a new unique identifier. If the Solution Pack is imported into a Sentinel system, it does not impact any previously imported Solution Packs.
To edit a Solution Pack:
1. In Windows, use the Sentinel Solution Designer shortcut on the desktop, or start Solution Designer by executing one of the following commands:
solution_designer.bat (in %ESEC_HOME%\bin on Windows)
solution_designer.sh (in $ESEC_HOME/bin on Solaris/Linux)
The Sentinel Solution Designer login window displays. 2. Provide your login credentials. Check Work Offline checkbox if desired, then
click Login. The Solution Designer displays.
Figure 14-31: Solution Designer window
3. To edit a Solution Pack, click File > Open. Browse and select the existing Solution Pack zip file. Click Open.
14-30 Sentinel User Guide

Solution Packs 14-31
4. To update the Solution Pack with modified content from the source Sentinel system, drag and drop the content from the Content Palette to the appropriate Control.
5. Add or delete Controls as necessary. 6. Click File > Save, Save As, or Save As New. 7. If you selected Save or Save As and some of the content is out of sync, you will be
prompted to synchronize.
Out of Sync Content If the content in the source system is modified, the content in the source system and the content in the original Solution Pack can be out of sync.
You can drag and drop the content from the Content Palette onto the control. For simple content with no dependencies, the modified content is immediately
updated. For example, a report has no dependencies. For content with dependencies, the dependencies are checked and updates are made
when you click Sync All Content or when you save the Solution Pack.
Deploying an Edited Solution Pack When a Solution Pack is modified and saved using the Save or Save As options in Solution Designer, it is considered a new version of the original Solution Pack. When it is imported, it replaces any older versions of the original Solution Pack. There is no immediate impact on any installed content in the target Sentinel system.
After the Solution Pack is installed, its behavior varies depending on the status of the original Solution Pack’s content.
If the content from the original Solution Pack was not installed yet, the content is simply replaced. When a user installs content, the new content is installed to the target Sentinel system.
If the content from the original Solution Pack was installed (Not Implemented), Implemented, or Tested, the original content is compared to the new content.
If the content version is the same, the original content is still valid and no action is necessary.
If the content version is different, the content status is set to Out of Sync. The user must decide how to resolve the synchronization issue. For more information, see “Out of Sync.”
If the content didn’t exist in the original Solution Pack, it is displayed in Solution Manager as not installed. You can install, implement, and test the new content.
If the content existed in the original Solution Pack but has been deleted from the modified Solution Pack, it does not appear in the Solution Manager.
NOTE: The Solution Manager only handles differences in the contents of Solution Packs. It does not recognize manual content changes that are performed after content is installed.

A Sentinel Architecture
Sentinel is a security information and event management (SIEM) solution that automates the collection, analysis and reporting of system network, application and security logs to help organizations manage IT risk.
This section provides you the functional and technical architecture of Sentinel.
Sentinel Features Sentinel allows you to monitor and manage a variety of functions. Some of the main functions include:
Real time views of large streams of events Reporting capabilities based on real time and historical events Managing users and what they are able to see and do by permission assignment Managing access to events to different users Organizing events into incidents for efficient response management and tracking Detecting patterns in events and streams of events An intuitive and flexible rule-based language for correlation Rules compiled for high performance Scalable, multi-threaded, distributable and extensible architecture
Sentinel processes communicate with each other through a Message-Oriented Middleware (MOM).
Functional Architecture Sentinel is composed of three component subsystems, which form the core of the functional architecture:
“iSCALE Platform”: An event-driven scalable framework “Event Source Management”: An extensible framework built to manage and monitor
connections between Sentinel and third-party event sources using Sentinel Connectors and Sentinel Collectors.
“Application Integration”: An extensible application framework
Sentinel treats both “services” and “applications” as abstract service end-points that can readily respond to asynchronous events. Services are “objects” that do not need to understand protocols or how messages get routed to the peer services.
Architecture Overview The Sentinel system is responsible for receiving events from the Collector Manager. The events are then displayed in real-time and logged into a database for historical analysis.
At a high level, the Sentinel system uses a relational database and is comprised of Sentinel processes and a reporting engine. The system accepts events from the Collector manager as its input. The Collector manager interfaces with third-party products and normalizes the
Sentinel Architecture A-1
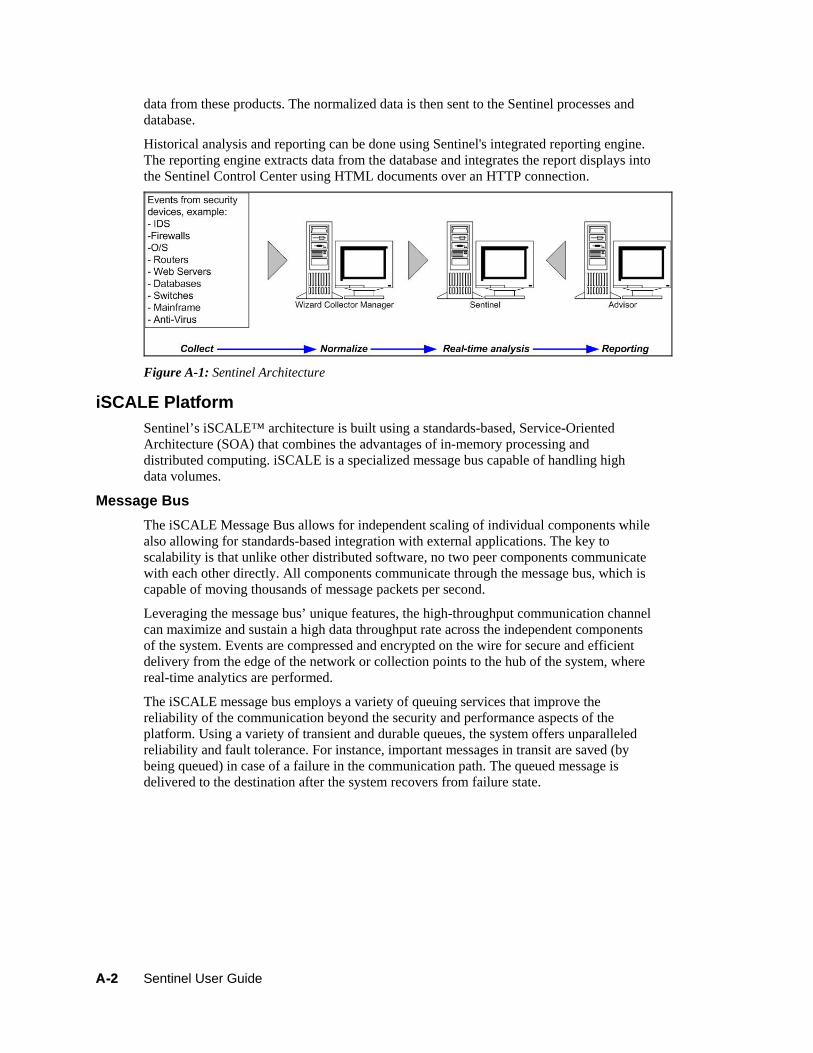
data from these products. The normalized data is then sent to the Sentinel processes and database.
Historical analysis and reporting can be done using Sentinel's integrated reporting engine. The reporting engine extracts data from the database and integrates the report displays into the Sentinel Control Center using HTML documents over an HTTP connection.
Figure A-1: Sentinel Architecture
iSCALE Platform Sentinel’s iSCALE™ architecture is built using a standards-based, Service-Oriented Architecture (SOA) that combines the advantages of in-memory processing and distributed computing. iSCALE is a specialized message bus capable of handling high data volumes.
Message Bus The iSCALE Message Bus allows for independent scaling of individual components while also allowing for standards-based integration with external applications. The key to scalability is that unlike other distributed software, no two peer components communicate with each other directly. All components communicate through the message bus, which is capable of moving thousands of message packets per second.
Leveraging the message bus’ unique features, the high-throughput communication channel can maximize and sustain a high data throughput rate across the independent components of the system. Events are compressed and encrypted on the wire for secure and efficient delivery from the edge of the network or collection points to the hub of the system, where real-time analytics are performed.
The iSCALE message bus employs a variety of queuing services that improve the reliability of the communication beyond the security and performance aspects of the platform. Using a variety of transient and durable queues, the system offers unparalleled reliability and fault tolerance. For instance, important messages in transit are saved (by being queued) in case of a failure in the communication path. The queued message is delivered to the destination after the system recovers from failure state.
A-2 Sentinel User Guide

Figure A-2: iSCALE Message Bus
Channels The iSCALE platform employs a data-driven or event-driven model that allows independent scaling of components for the entire system based on the workload. This provides a flexible deployment model because each customer’s environment varies: one site can have a large number of devices with low event volumes; another site can have fewer devices with very high event volumes. The event densities (that is, the event aggregation and event multiplexing pattern on the wire from the collection points) are different in these cases and the message bus allows for consistent scaling of disparate workloads.
iSCALE takes advantage of an independent, multi-channel environment, which virtually eliminates contention and promotes parallel processing of events. These channels and sub-channels work not only for event data transport but also offer fine-grain process control for scaling and load balancing the system under varying load conditions. Using independent service channels such as control channels and status channels, in addition to the main event channel, allows sophisticated and cost-effective scaling of event-driven architecture.
Sentinel Event Sentinel receives information from devices, normalizes this information into a structure called a Sentinel Event, or Event for short and sends the event for processing. Events are processed by the real time display, correlation engine and the backend server.
An event comprises of more than 200 tags. Tags are of different types and of different purposes. There are some predefined tags such as severity, criticality, destination IP and destination port. There are two sets of configurable tags: Reserved Tags are for Novell internal use to allow future expansion and Customer Tags are for customer extensions.
Sentinel Architecture A-3

Tags can be repurposed by renaming them. The source for a tag can either be external, which means that it is set explicitly by the device or the corresponding Collector or referential. The value of a referential tag is computed as a function of one or more other tags using the mapping service. For example, a tag can be defined to be the building code for the building containing the asset mentioned as the destination IP of an event. For example, a tag can be computed by the mapping service using a customer defined map using the destination IP from the event.
Mapping Service Map Service allows a sophisticated mechanism to propagate business relevance data throughout the system. This facility aids scalability and provides an extensibility advantage by enabling intelligent data transfer between different nodes of the distributed system.
Map Service is a data propagation facility that gives the ability to cross-reference Vulnerability Scanner data with Intrusion Detection System signatures and more (for example, asset data, business-relevant data). This allows immediate notification when an attack is attempting to exploit a vulnerable system. Three separate components provide this functionality:
Collection of real time events from an intrusion detection source; Comparing those signatures to the latest vulnerability scans; and Cross referencing an attack feed through Sentinel Advisor (an optional product
module, which cross-references between real-time IDS attack signatures and the user’s vulnerability scanner data).
Map Service dynamically propagates information throughput the system without impacting system load on the system. When important data sets (that is, “maps” such as asset information or patch update information) are updated in the system, the Map Service propagates the updates across the system, which can often get to be hundreds of megabytes in size.
iSCALE’s Map Service algorithms handle large referential data sets across a production system processing large real-time data volumes. These algorithms are “update-aware” and selectively push only the changes or “delta data sets” from the repository to the edge or system perimeter.
Streaming Maps Map Service employs a dynamic update model and streams the maps from one point to another, avoiding the build up of large static maps in dynamic memory. The value of this streaming capability is particularly relevant in a mission-critical real-time system such as Sentinel where there needs to be a steady, predictive and agile movement of data independent of any transient load on the system.
Exploit Detection (Mapping Service) Sentinel provides the ability to cross-reference event data signatures with Vulnerability Scanner data. Users are notified automatically and immediately when an attack is attempting to exploit a vulnerable system. This is accomplished through:
Advisor Feed Intrusion detection Vulnerability scanning Firewalls
Advisor provides a cross-reference between event data signatures and vulnerability scanner data. Advisor feed has an alert and attack feed. The alert feed contains
A-4 Sentinel User Guide
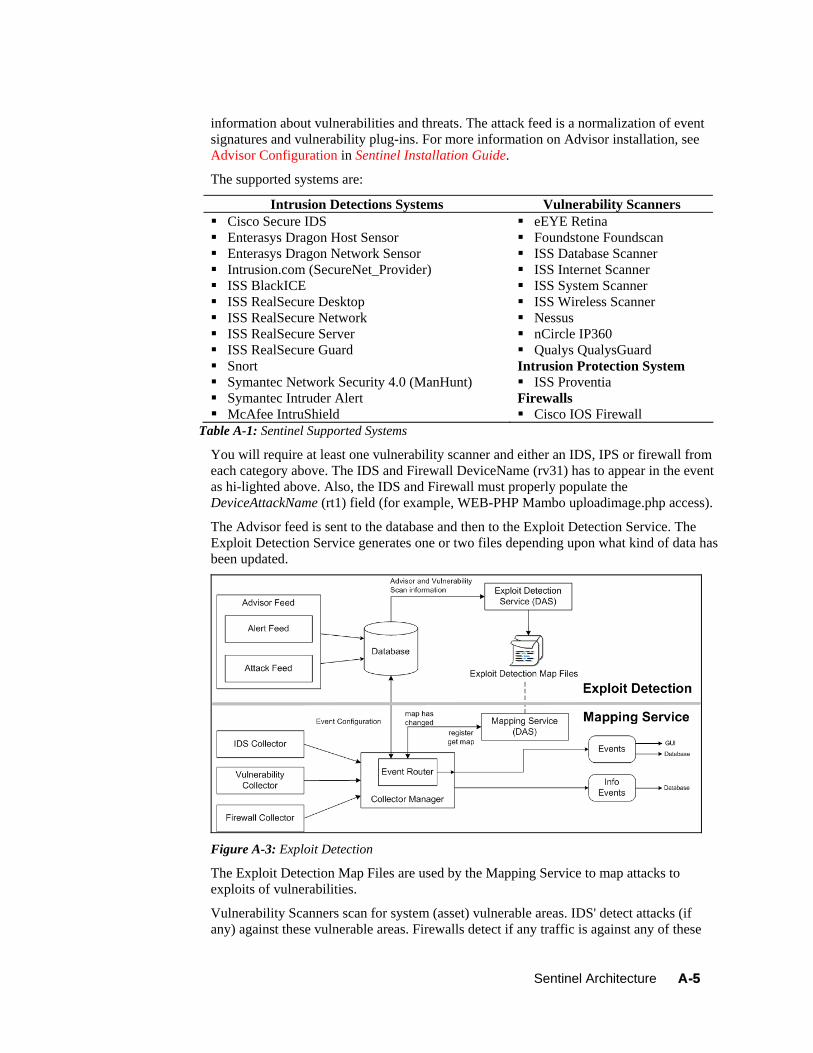
information about vulnerabilities and threats. The attack feed is a normalization of event signatures and vulnerability plug-ins. For more information on Advisor installation, see Advisor Configuration in Sentinel Installation Guide.
The supported systems are:
Intrusion Detections Systems Vulnerability Scanners Cisco Secure IDS Enterasys Dragon Host Sensor Enterasys Dragon Network Sensor Intrusion.com (SecureNet_Provider) ISS BlackICE ISS RealSecure Desktop ISS RealSecure Network ISS RealSecure Server ISS RealSecure Guard Snort Symantec Network Security 4.0 (ManHunt) Symantec Intruder Alert McAfee IntruShield
eEYE Retina Foundstone Foundscan ISS Database Scanner ISS Internet Scanner ISS System Scanner ISS Wireless Scanner Nessus nCircle IP360 Qualys QualysGuard
Intrusion Protection System ISS Proventia
Firewalls Cisco IOS Firewall
Table A-1: Sentinel Supported Systems
You will require at least one vulnerability scanner and either an IDS, IPS or firewall from each category above. The IDS and Firewall DeviceName (rv31) has to appear in the event as hi-lighted above. Also, the IDS and Firewall must properly populate the DeviceAttackName (rt1) field (for example, WEB-PHP Mambo uploadimage.php access).
The Advisor feed is sent to the database and then to the Exploit Detection Service. The Exploit Detection Service generates one or two files depending upon what kind of data has been updated.
Figure A-3: Exploit Detection
The Exploit Detection Map Files are used by the Mapping Service to map attacks to exploits of vulnerabilities.
Vulnerability Scanners scan for system (asset) vulnerable areas. IDS' detect attacks (if any) against these vulnerable areas. Firewalls detect if any traffic is against any of these
Sentinel Architecture A-5
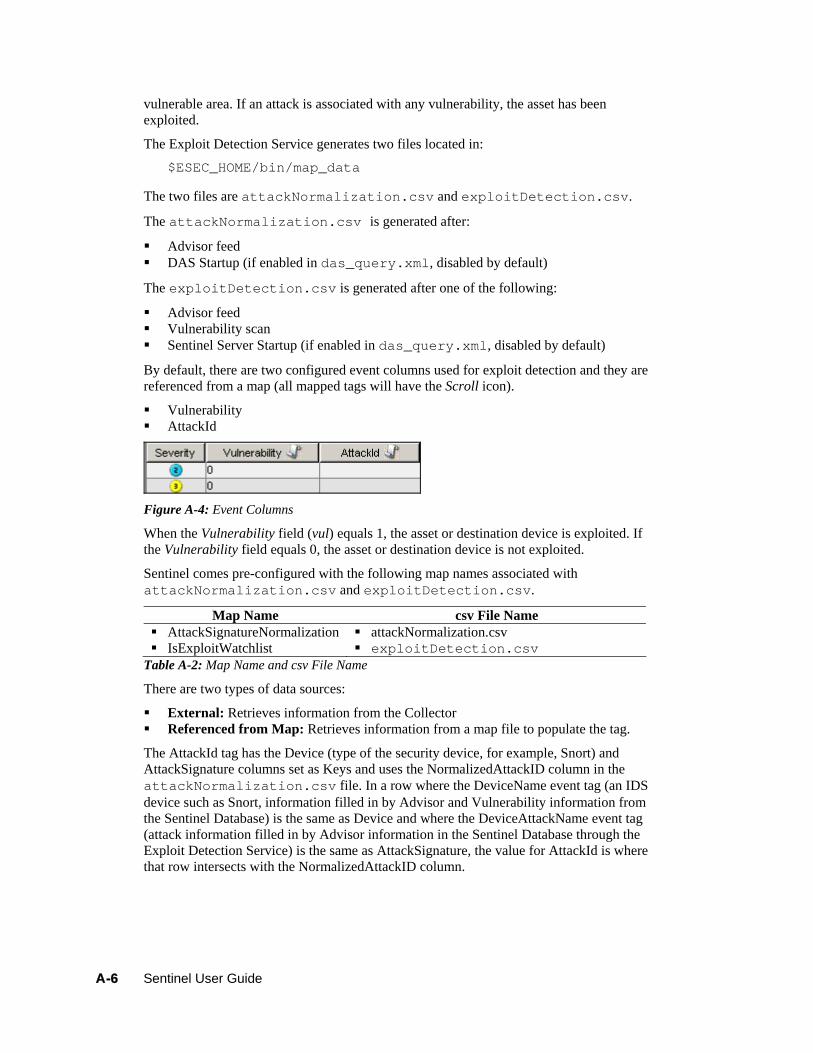
vulnerable area. If an attack is associated with any vulnerability, the asset has been exploited.
The Exploit Detection Service generates two files located in:
$ESEC_HOME/bin/map_data
The two files are attackNormalization.csv and exploitDetection.csv.
The attackNormalization.csv is generated after:
Advisor feed DAS Startup (if enabled in das_query.xml, disabled by default)
The exploitDetection.csv is generated after one of the following:
Advisor feed Vulnerability scan Sentinel Server Startup (if enabled in das_query.xml, disabled by default)
By default, there are two configured event columns used for exploit detection and they are referenced from a map (all mapped tags will have the Scroll icon).
Vulnerability AttackId
Figure A-4: Event Columns
When the Vulnerability field (vul) equals 1, the asset or destination device is exploited. If the Vulnerability field equals 0, the asset or destination device is not exploited.
Sentinel comes pre-configured with the following map names associated with attackNormalization.csv and exploitDetection.csv.
Map Name csv File Name AttackSignatureNormalization attackNormalization.csv IsExploitWatchlist exploitDetection.csv
Table A-2: Map Name and csv File Name
There are two types of data sources:
External: Retrieves information from the Collector Referenced from Map: Retrieves information from a map file to populate the tag.
The AttackId tag has the Device (type of the security device, for example, Snort) and AttackSignature columns set as Keys and uses the NormalizedAttackID column in the attackNormalization.csv file. In a row where the DeviceName event tag (an IDS device such as Snort, information filled in by Advisor and Vulnerability information from the Sentinel Database) is the same as Device and where the DeviceAttackName event tag (attack information filled in by Advisor information in the Sentinel Database through the Exploit Detection Service) is the same as AttackSignature, the value for AttackId is where that row intersects with the NormalizedAttackID column.
A-6 Sentinel User Guide

Figure A-5: AttackId and Data Source information
Key Key AttackId entry
Figure A-6: attackNormalization.csv sample
The Vulnerability tag has a column entry “_EXIST_”, which means that map result value will be 1 if the key is in IsExploitWatchlist (exploitDetection.csv file) or 0 if it is not. The key columns for the vulnerability tag are IP and NormalizedAttackId. When an incoming event with a DestinationIP event tag that matches the IP column entry and an AttackId event tag that matches the NormalizedAttackId column entry in the same row, the result is one (1). If no match is found in a common row, the result is zero (0).
Figure A-7: Vulnerability and Data Source
Sentinel Architecture A-7

Event Source Management Sentinel 6 delivers a centralized event source management framework to facilitate data source integration. This framework enables all aspects of configuring, deploying, managing and monitoring data Collectors for a broad set of systems, which include databases, operating systems, directories, firewalls, intrusion detection/prevention systems, antivirus applications, mainframes, Web and application servers, and many more.
Using adaptable and flexible technology is central to Sentinel’s event source management strategy, which is achieved through interpretive Collectors that parse, normalize, filter and enrich the events in the data stream.
These Collectors can be modified as needed and are not tied to a specific environment. An integrated development environment allows for interactive creation of Collectors using a “drag and drop” paradigm from a graphical user interface. Non-programmers can create Collectors, ensuring both current and future requirements are met in an ever-changing IT environment. The command and control operation of Collectors (for example, start, stop and so on) is performed centrally from the Sentinel Control Center. The event source management framework takes the data from the source system, performs the transformations and presents the events for later analysis, visualization and reporting purposes. The framework delivers the following components and benefits:
Collectors: Parse and normalize events from various systems Connectors: Connect to the data source to get raw data Taxonomy: Allows data from disparate sources to be categorized consistently Filtering: Eliminates irrelevant data at the point of collection, saving bandwidth and
disk space. Business relevance: Offers a way to enrich event data with valuable information Collector builder: An Integrated Development Environment (IDE) for building
custom Collectors to collect from unique or proprietary systems Live view: User interface for managing live event sources. Scratch pad: User interface for offline design of event source configuration.
Application Integration External application integration through standard APIs is central to Sentinel. For example, when dealing with a third party trouble-ticketing system, Sentinel 6 can open an initial ticket in its own iTRAC workflow remediation system. Sentinel then uses bi-directional API to communicate with the other trouble ticketing systems—for example, Remedy® and HP OpenView’s ServiceDesk® -allowing straightforward integration with external systems.
The API is Web Services-based and therefore allows any external systems that are SOAP-aware to take advantage of pervasive integration with the Sentinel system.
Time The time of an event is very critical to its processing. It is important for reporting and auditing purposes as well as for real time processing. The correlation engine processes time ordered streams of events and detects patterns within events as well as temporal patterns in the stream. However, the device generating the event might not know the real time when the event is generated. In order to accommodate this Sentinel allows two options in processing alerts from security devices: trust the time the device reports and use that as the time of the event, or, do not trust the device time and instead stamp the event at the time it is first processed by Sentinel (by the Collector).
A-8 Sentinel User Guide

Sentinel is a distributed system and comprises several processes that can be in different parts of the network. In addition, there can be some delay introduced by the device. In order to accommodate this, the Sentinel processes reorder the events into a time ordered stream before processing.
The following illustration explains the concept of Sentinel Time.
Figure A-8: Sentinel Time 1. By default, Event Time is set to Collector Manager time. Ideal time will be device
time. Therefore it will be best to set Event Time to Device Time if Device Time is available, accurate and properly parsed by the Collector.
2. A configurable time buffer that reorders events and updates real time displays. Default time is 30 seconds before and after server time.
3. Correlation Re-order buffer, if event time is more than 30 seconds older than Server time, correlation engine will not process the events.
4. If event time is older than 5 minutes from Collector Manager Time (correct time), events will be directly routed to the database.
System Events System Events is a means to report on the status and status change of the system. There are three types of events generated by the internal system, they are:
Internal Events Performance Events Audit Events
Sentinel Architecture A-9

Internal Events Internal Events are informational and describe a single state or change of state in the system. They report when a user logs in or fails to authenticate, when a process is started or a correlation rule is activated.
Performance Events Performance Events are generated on a periodic basis and describe average resources used by different parts of the system.
Audit Events Audit Events are generated internally. Each time an audited method is called or an audited data object is modified, audit framework generates audit events. There are two types of Audit Events. One which monitors user actions for example, user login/out, add/delete user and another which monitors system actions/health, for example, process start/stop.
Some of these events used to be called Internal Events (mainly for system actions/health monitoring). So the functionality of Audit Events is similar to Internal Events. Audit Events can be logged into log files, saved into database, and sent out as Audit Event at the same time. (Internal Events are only sent out as events.).
All System Events populate the following attributes:
ST (Sensor Type) field: For internal events it is set to “I” and for performance events it is set to “P”
Event ID: A unique UUID for the event Event Time: The time the event was generated Source: The UUID of the process that generated the event Sensor Name: The name of the process that generated the event (for example,
DAS_Binary) RV32 (Device Category): Set to “ESEC” Collector: “Performance” for performance events and “Internal” for internal events
In addition to the common attributes, every system event also sets the resource, sub resource, the severity, the event name and the message tags. For internal events, the event name specific enough to identify the exact meaning of the event (for example, UserAuthenticationFailed). The message tags add some specific detail; in the above example the message tag will contain the name of the user, the OS name if available and the machine name). For performance events the event name is generic describing the type of statistical data and the data itself is in the message tag.
Performance events are sent directly to the database. To view them, do a quick query.
For more information, see “Appendix B, System Events for Sentinel”.
Processes The following processes and Windows service communicate with each other through iSCALE - the message-oriented middleware (MOM).
Sentinel Service (Watchdog) Data Access Service (DAS)
DAS Query: Performs general Sentinel Service operations including Login and Historical Query.
DAS Binary: Performs event database insertion.
A-10 Sentinel User Guide

DAS RT: Provides the server-side functionality for Active Views. DAS Aggregation: Calculates event data summaries that are used in reports. DAS iTRAC: Provides the server-side functionality for the Sentinel iTRAC
functionality. DAS Proxy: Provides the server-side of the SSL proxy connection to
Sentinel Server. Correlation Engine (correlation_engine) Collector Manager iSCALE
The following is the architecture for Sentinel Server.
Figure A-9: Sentinel Server Architecture
Sentinel Service (Watchdog) Watchdog is a Sentinel Process that manages other Sentinel Processes. If a process other than Watchdog stops, Watchdog will report this and will then restart that process.
If this service is stopped, it will stop all Sentinel processes on that machine. It executes and reports health of other Sentinel processes. This process is launched by the “Sentinel” Windows Service or the “sentinel” UNIX service.
Sentinel Architecture A-11

Data Access Service (DAS) Process The Data Access Service (DAS) process is Sentinel Server's persistence service and provides an interface to the database. It provides data driven access to the database backend.
DAS is a container, composed of five different processes. Each process is responsible for different types of database operations. These processes are controlled by the following configuration files:
das_binary.xml: Used for event and correlated event insertion operations das_query.xml: All other database operations activity_container.xml: Used for executing and configuring activity service workflow_container.xml: Used for configuring the workflow (iTRAC)
service das_rt.xml: Used for configuring the Active Views function within the Sentinel
Control Console
DAS receives requests from the different Sentinel processes, converts them to a query against the database, processes the result from the database and converts it that back to a reply. It supports requests to retrieve events for Quick Query and Event Drill Down, to retrieve vulnerability information and advisor information and to manipulate configuration information. DAS also handles logging of all events being received from the Collector Manager and requests to retrieve and store configuration information.
Correlation Engine Process (correlation_engine) The Correlation Engine (correlation_engine) process receives events from the Collector Manager and publishes correlated events based on user-defined correlation rules.
Collector Manager Collector Manager services, processes and sends events.
iSCALE It is a message-oriented middleware (MOM) that provides the communication platform for all other Sentinel processes.
Logical Architecture Sentinel is composed of three logical layers:
“Collection and enrichment layer” “Business logic layer” “Presentation layer”
The collection/enrichment layer aggregates the events from external data sources, transforms the device-specific formats into Sentinel format, enriches the native events source with business-relevant data and dispatches the event packets to the message bus. The key component orchestrating this function is the Collector, aided by a taxonomy mapping and global filter service.
The business logic layer contains a set of distributable components. The base component is a Remoting service that adds messaging capabilities to the data objects and services to enable transparent data access across the entire network and Data Access service that is an object management service to allow users to define objects using metadata. Additional services include Correlation, Query Manager, Workflow, Event Visualization, Incident Response, Health, Advisor, Reporting and Administration.
A-12 Sentinel User Guide

Figure A-10: Sentinel Logical Layers
The presentation layer renders the application interface to the end user. A comprehensive dashboard called the Sentinel Control Center offers an integrated user workbench consisting of an array of seven different applications accessible through a single common framework. This cross-platform framework is built on Java™ 1.4 standards and provides a unified view into independent business logic components – real-time interactive graphs, actionable incident response, automated enforceable incident workflow, reporting, incident remediation against known exploits and more.
Each of the layers are illustrated in the figure above and subsequently discussed in detail in the following sections.
Collection and Enrichment Layer Event Source Management (ESM) provides tools to manage and monitor connections between Sentinel and third-party event sources. Events are aggregated using a set of flexible and configurable Collectors, which collect data from a myriad of sensors and other devices and sources. User can use pre-built Collectors, modify existing Collectors or build their own Collectors to ensure the system meets all requirements.
Data aggregated by the Collectors in the form of events is subsequently normalized and transformed into XML format, enriched with a series of metadata (that is, data about data) using a set of business relevance services and propagated to the server-side for further computational analysis using message bus platform. The Collection and Enrichment layer consists of the following components:
Connectors and Collector Collector Manager and Engine Collector Builder
Connectors and Collectors A Connector is a concentrator or multiplexed adapter that connects the Collector Engine to the actual monitored devices.
Sentinel Architecture A-13

Collectors are the component-level aggregator of event data from a specific source. Sentinel primarily supports remote “Collector-less” connections to sources; however, Collectors can be deployed on specific devices where a remote approach is less efficient.
Collectors are controlled from the Sentinel Control Center, which orchestrates the communication between the Collectors and the Sentinel platform for real time analysis, correlation computation and incident response.
Collector Manager and Engine Collector Manager manages the Collectors, monitors system status messages and performs event filtering as needed. Main functions of the Collector Manager include transforming events, adding business relevance to events through taxonomy, performing global filtering on events, routing events and sending health messages to the Sentinel server.
A Collector Engine is the interpreter component that parses the Collector code.
Collector Builder Collector Builder is a standalone application that is used to build, configure and debug Collectors. This application serves as an integrated development environment (or IDE) that allows the user to create new Collectors to parse data from source devices using a special-purpose interpretive language designed to handle the nature of network and security events.
ESM introduces a new hierarchy of deployment objects that allow users to group multiple connections into sets. The hierarchy is as follows:
Figure A-11: ESM Hierarchy
The Event Source, Event Source Server, Collector, and Connector are configuration related objects and can be added through the ESM user interface.
A-14 Sentinel User Guide

Event Source: This node represents a connection to a specific source of data, such as
a specific file, firewall or Syslog relay, and contains the configuration information necessary to establish the connection. The health of this node represents the health of the connection to the data source. This node will send raw data to its parent Connector node.
Event Source Server: This node represents a deployed instance of a server-type Connector plug-in. Some protocols, such as Syslog UDP/TCP, NAudit and others, push their data from the source to a server that is listening to accept the data. The Event Source Server node represents this server and can be configured to accept data from protocols that are supported by the selected Connector plug-in. This node will redirect the raw data it receives to an Event Source node that is configured to receive data from it.
Collector: This node represents a deployed instance of a Collector Script. It specifies which Collector Script to use as well as the parameter values with which the Collector should run. This node will send Sentinel events to its parent Collector Manager node.
Connector: This node represents a deployed instance of a Connector plug-in. It includes the specification of which Connector plug-in to use as well as some configuration information, such as “auto-discovery.” This node will send raw data to its parent Collector node.
Common Services All of the above-described components in this Collection and Enrichment layer are driven by a set of common services. These utility services form the fabric of the data collection and data enrichment and assist in filtering the noise from the information (through global filters), applying user-defined tags to enrich the events information (through business relevance and taxonomy mapping services) and governing the data Collectors’ functions (through command and control services).
Taxonomy:
Nearly all security products produce events in different formats and with varying content. For example, Windows and Solaris report a failed login differently.
Sentinel’s taxonomy automatically translates heterogeneous product data into meaningful terms, which allows for a real-time homogeneous view of the entire network security. Sentinel Taxonomy formats and filters raw security events before adding event context to the data stream. This process formats all the security data in the most optimal structure for processing by the Sentinel Correlation engine, as you can see in the following diagram.
Figure A-12: Sentinel Taxonomy
Sentinel Architecture A-15

Business Relevance:
Sentinel injects business-relevant contextual data directly into the event stream. It includes up to 135 customizable fields where users can add in asset specific information such as business unit, owner, asset value, geography. After this information is added into the system, all other components can take advantage of the additional context.
Figure A-13: Injecting Business Relevance
Exploit Detection: Exploit Detection enables immediate, actionable notification of attacks on vulnerable systems. It provides a real-time link between IDS signatures and vulnerability scan results, notifying users automatically and immediately when an attack attempt to exploit a vulnerable system. This dramatically improves the efficiency and effectiveness of incident response.
Exploit Detection provides users with updates of mappings between IDS and vulnerability scanner product signatures. The mappings include a comprehensive list of IDS and vulnerability scanners, Users simply upload vulnerability scan results into Sentinel. Exploit Detection automatically parses them and updates the appropriate IDS Collectors. It uses the embedded knowledge of vulnerability status to efficiently and effectively prioritize responses to security threats in real time.
When an attack is launched against a vulnerable asset, Exploit Detection alerts users with the corresponding severity level of the exploited vulnerability. Users can then take immediate action on high-priority events. This takes the guesswork out of alert monitoring and increases incident response efficiency by focusing reaction on known attacks against vulnerable assets.
Exploit Detection also enables users to map or “un-map” signatures and vulnerabilities to tune out false positives and negatives and to leverage custom signatures or vulnerability scans.
Business Logic Layer The kernel of the Sentinel platform consists of a set of loosely-coupled services that can run in a standalone configuration or in a distributed topology. This service-oriented architecture (SOA) is called iSCALE. Specifically, Sentinel’s SOA comprises a set of engines, services and APIs working together for linear scaling of the solution against increasing data load and/or processing workload.
Sentinel services run in specialized containers and allow unparalleled processing and scaling because they are optimized for message-based transport and computation. The key services that make up the Sentinel Server include:
“Remoting Service” “Data Access Service” “Query Manager Service”
“Incident Response” “Reporting” “Advisor”
A-16 Sentinel User Guide

“Correlation Service” “Workflow Service” “Event Visualization”
“Health” “Administration”
Remoting Service Sentinel’s Remoting Service provides the mechanism by which the server and client programs communicate. This mechanism is typically referred to as distributed object application.
Remoting Service provides the following capabilities:
Locate remote objects: This is achieved through metadata that describes the object name or registration token, although the actual location is not required, because the iSCALE message bus allows for location transparency.
Communicate with remote objects: Details of communication between remote objects are handled by the iSCALE message bus.
Object streaming and chunking: When large amounts of data need to pass back and forth from the client to the server, these objects are optimized to load the data on demand.
Callbacks: Another pattern and layer of abstraction built into the Remoting Service that allows for PTP remote object communication.
Service monitoring and statistics: This provides performance and load statistics for usage of these remote services.
Data Access Service Data Access Service (DAS) is an object management service, which allows users to define objects using metadata. DAS manages the object and access to objects and automates transmission and persistence. DAS also serves as a facade for accessing data from any persistent data store such as databases, directory services or files. The operations of DAS include uniform data access through JDBC and optionally high-performance event insert strategies using native connectors (that is, OCI for Oracle 9i and ADO for Microsoft SQL Server).
Query Manager Service The Query Manager Service orchestrates drill-down and event history requests from the Sentinel Control Center. This service is an integral component for implementing the paging algorithm used in the Event History browsing capability. It converts user-defined filters into valid criteria and appends security criteria to it before events are retrieved. This service also ensures that the criteria do not change during a paged event history transaction.
Correlation Service Sentinel’s correlation algorithm computes correlated events by analyzing the data stream in real time. It publishes the correlated events based on user-defined rules before the events reach the database. Rules in the correlation engine can detect a pattern in a single event of a running window of events. When a match is detected, the correlation engine generates a correlated event describing the found pattern and can create an incident or trigger a remediation workflow through iTRAC. The correlation engine works with a rules checker component which computes the correlation rule expressions and validates syntax of filters. In addition to providing a comprehensive set of correlation rules, Sentinel’s correlation engine provides specific advantages over database-centric correlation engines.
Sentinel Architecture A-17

By relying on in-memory processing rather than database inserts and reads, the correlation engine performs during high steady-state volumes as well as during event spikes when under attack, the time when correlation performance is most critical.
Correlation volume does not slow down other system components, so the user interface remains responsive, especially with high event volumes.
Distributed correlation: Organizations can deploy multiple correlation engines, each on its own server, without the need to replicate configurations or add databases. Independent scaling of components provides cost-effective scalability and performance.
The correlation engine can add events to incidents after an incident has been determined.
Users are encouraged to measure a metric called Event Rules per Second (ERPS). ERPS is the measure of the number of events that can be examined by a correlation rule per second. This measure is a good performance indicator as it estimates the impact on performance when two factors intersect: events per second and number of rules in use.
Dynamic Lists: Dynamic lists are distributed list structures that can be used for storing elements and performing fast lookups on those elements. These lists can store a set of strings such as IP addresses, server names or usernames. Examples of dynamic lists include: Terminated user list Suspicious user watch list Privileged user watch list Authorized ports and services list Authorized server list
In all cases, correlation rules might reference named dynamic lists to perform lookups on list members. For example, a rule can be written to identify a file access event from a user who is not a member of the Authorized Users list. Additionally, correlation actions integrate with the dynamic list module to add or remove elements from a list. The combination of lookups and automated actions on the same list provides a powerful feedback mechanism used to identify complex situations.
Workflow Service (iTRAC) The Workflow Service receives triggers on incident creation and initiates workflow processes based on pre-defined workflow templates. It manages the lifecycle of these processes by generating work items or executing activities. This service also maintains a history of completed processes that can be used for auditing incident responses.
Event Visualization Active Views™, the interactive graphical user interface for event visualization, provides an integrated, security management dashboard with a comprehensive set of real-time visualization and analytical tools to facilitate threat detection and analysis. Users can monitor events in real time and perform instant drill-downs from seconds to hours in the past. A wide array of visualization charts and aids allow monitoring of information through 3D bar, 2D stacked, line and ribbon chart representation and others. Additional valuable information can be viewed from the Active Views dashboard, including notification of asset exploits (exploit detection), viewing asset information and graphical associations between pertinent source IPs and destination IPs.
Because Active Views uses the iSCALE architecture, analysts can quickly drill down for further analysis because Active Views provides direct access to the real-time memory-resident event data, which easily handles thousands of events per second without any
A-18 Sentinel User Guide

performance degradation. Data is kept in memory and written to the database as needed (Active Views can store up to 8 hours of data in memory with typical event loads). This uninterrupted, performance-oriented real-time view is essential when under attack or in steady-state.
Figure A-14: Active View
Figure A-15: Network
Incident response through iTRAC Sentinel iTRAC transforms traditional security information management from a passive “alerting and viewing” role to an “actionable incident response” role by enabling organizations to define and document incident resolution processes and then guide, enforce and track resolution processes after an incident or violation has been detected.
Sentinel Architecture A-19

Sentinel comes with “out-of-the-box” process templates that use the SANS Institute’s guidelines for incident handling. Users can start with these pre-defined processes and configure specific activities to reflect their organization’s best practices. iTRAC processes can be automatically triggered from incident creation or correlation rules or manually engaged by an authorized security or audit professional. iTRAC keeps an audit trail of all actions to support compliance reporting and historical analysis.
Worklist Handler
Process Monitor
Figure A-16: Process Template
A worklist provides the user with all tasks that have been assigned to the user and a process monitor provides real-time visibility into process status during a resolution process lifecycle.
iTRAC’s activity framework enables users to customize automated or manual tasks for specific incident-resolution processes. The iTRAC process templates can be configured using the activity framework to match the template with an organization’s best practices. Activities are executed directly from the Sentinel Control Center.
iTRAC’s automation framework works using two key components:
Activity container
It automates the activities execution for the specified set of steps based on input rules
Workflow container
It automates the workflow execution based on activities through a work-list.
The input rules are based on the XPDL (XML Processing Description Language) standard and provide a formal model for expressing executable processes in a business enterprise. This standards-based approach to the implementation of business-specific rules and rule sets ensures future-proofing of process definitions for customers.
The iTRAC system uses three Sentinel 6 objects that can be defined outside the iTRAC framework:
A-20 Sentinel User Guide

Incident: Incidents within Sentinel 6 are groups of events that represent an actionable
security incident, associated state and meta-information. Incidents are created manually or through correlation rules, and can be associated with a workflow process. They can be viewed on the Incidents tab.
Activity: An Activity is a pre-defined automatic unit of work, with defined inputs, command-driven activity and outputs, such as automatic attachment of asset data to the incident or generation of an e-mail. Activities can be used within workflow templates, triggered by a correlation rule, or executed by a right-click when viewing events.
Role: Users can be assigned to one or more Roles for example, Analyst, Admin and so on. Manual steps in the workflow processes can be assigned to a Role.
Sentinel 6 workflows have four major components that are unique to iTRAC:
Step: A Step is an individual unit of work within a workflow; there are manual steps, decision steps, command steps, mail steps, and activity-based steps. Each step displays as an icon within a given workflow template.
Transition: A Transition defines how the workflow will move from one state (Activity) to another and can be determined by an analyst action, by the value of a variable or by the amount of time elapsed.
Templates: A Template is a design for a workflow that controls the execution of a process in Sentinel iTRAC. The template consists of a network of manual and automated steps, activities and criteria for transition between them. Workflow templates define how to respond to an incident when a process based on that template is instantiated. A template can be associated with many incidents.
Processes: A process is a specific instance of a workflow template that is actively being tracked by the workflow system. It includes all the relevant information relating to the instance, including the current step in the workflow, the associated incident, and the results of the steps, attachments and notes. Each workflow process is associated with one and only one incident.
Figure A-17: iTRAC Workflow
Reporting Service The Reporting service allows for reporting, including historical and vulnerability reports. Sentinel comes with out-of-the-box reports and enables users to configure their own reports using Crystal Reports. Some examples of reports included with Sentinel are:
Trend analysis Security status of lines of business or critical assets Attack types Targeted assets Response times and resolution Policy compliance violations
Sentinel Architecture A-21

Figure A-18: Sentinel Top 10 Reports
Advisor Sentinel Advisor, an optional module, cross-references Sentinel’s real-time alert data with known vulnerabilities and remediation information, bridging the gap between incident detection and response. With Advisor, organizations can determine if events exploit specific vulnerabilities and how these attacks impact their assets. Advisor also contains detailed information on the vulnerabilities that attacks intend to exploit, the potential effects of the attacks if successful and necessary steps for remediation. Recommended remediation steps are enforced and tracked using iTRAC incident response processes.
Health The Health service enables users to get a comprehensive view of the distributed Sentinel platform. It aggregates health information from various processes that are typically distributed on various servers. The health information is periodically displayed on the Sentinel Control Center for the end user.
A-22 Sentinel User Guide

Administration
The Administration facility allows for user management and settings setup facilities typically needed by application administrators of Sentinel.
Common Services All of the above described components in this business logic layer of the architecture are driven by a set of common services. These utility services assist in fine-grain filtering (through Filter Engine) of events to users, continuous monitoring of system health statistics (through Health Monitor) and dynamic updates of system wide data (through Map Service). Together, these utility services form the fabric of the loosely-coupled services that allow for unparalleled processing and scaling over the message bus-based transport for real-time analytics and computation.
Presentation Layer The presentation layer renders the application interface to the end user. The Sentinel Control Center is a comprehensive dashboard that presents information to the user.
The presentation of event is possible through Active Views which displays the events in a tabular form or by using different types of charts. Table Format displays the variables of the events as columns in a table. Sorting of information is possible in the grid by clicking on the column name.
Figure A-19: Active Views-Tabular format
Graphical Format displays events as graphs. Stacked Bar 2D, Bar, 3D, Line and Ribbon graphs are available for proper representation of information in graphical format.
Figure A-20: Active Views-Graphical format-Stacked Bar 2D Graph
Sentinel Architecture A-23

Figure A-21: Active Views-Graphical format-Bar Graph
Figure A-22: Active Views-Graphical format-Line Graph
Figure A-23: Active Views-Graphical format-Ribbon Graph
Active Browser Active Browser facility helps in viewing the selected events. In Active Browser, the events are grouped according to the metatags. In these metatags various sub-categories are defined. The numbers in the parentheses against these sub-categories display the total number of event counts corresponding to the value of the metatag.
A-24 Sentinel User Guide

Sentinel Architecture
Figure A-24: Active Browser
In Active Browser, the query manager service retrieves a list of events taken from any part of the system and performs a statistical analysis of these events to break them down into ranges of values for each desired attribute of the event. Using single clicks through a Web browser interface, you can select ranges to quickly drill down on a large set of events. Then individual event details can be viewed or exported to an html or csv file. Additional event attributes for analysis can be added dynamically at any time, and the interface provides an interactive way to drill down on events in a given time range.
A-25

B System Events for Sentinel
In the description tables below, words in italics surrounded by <…> are replaced by relevant values in the real messages.
Authentication Events Authentication
When a user is authentic, the following event is generated.
Tag Value Severity Event Name Authentication Resource UserAuthentication SubResource Authenticate Message User <name> has passed Authentication to
Sentinel/Wizard
Creating Entry For External User When creating an external user, the following event is generated.
Tag Value Severity Event Name CreatingEntryForExternalUser Resource UserAuthentication SubResource Authentication Message No existing local user entry with name <name>
found, creating one
Duplicate User Objects When there is an unexpected second active user object, this should not happen, the following event is generated. This is an internal error.
Tag Value Severity 4 Event Name TooManyActiveUsers Resource UserAuthentication SubResource Authenticate Message Error in user table : Multiple users with the
name <name> found
Failed Authentication When a user authentication fails, the following event is generated.
Tag Value Severity 4
System Events for Sentinel B-1

Event Name AuthenticationFailed Resource UserAuthentication SubResource Authenticate Message Authentication of user <name> with OS name
<domUser> from <IP> failed
Locked Account When a locked user account is attempting to login, the following event is generated.
Tag Value Severity 4 Event Name LockedUser Resource UserAuthentication SubResource Authentication Message Attempt to login using locked account <acct>
Locked User
Tag Value Severity Event Name Resource SubResource Message
No Such User Event When a user attempts to login into the application and authentication succeeds but the user is not an Sentinel user, the following event is generated.
Tag Value Severity 4 Event Name NoSuchUser Resource UserAuthentication SubResource Authenticate Message No existing user with name <name> found
Too Many Active Users
Tag Value Severity Event Name Resource SubResource Message
User Discovered If the server restarts, it loses the session information. It will then reconstruct the session when it receives messages from active users. When it discovers a connected user, the following internal event is generated.
B-2 Sentinel User Guide

Tag Value Severity 1 Event Name UserLoggedIn Resource UserSessionManager SubResource User Message Discovered active user <user> with OS name
<osName> at <IP> logged in; currently <number> active users
User Logged In When a user logs in, the following internal event is generated.
Tag Value Severity 1 Event Name UserLoggedIn Resource UserSessionManager SubResource User Message User <user> with OS name <osName> at
<IP> logged in; currently <number> active users
User Logged Out When a user logs out, the following internal event is generated.
Tag Value Severity 1 Event Name UserLoggedOut Resource UserSessionManager SubResource User Message Closing session for <user> OS name
<osName> from <IP> was on since <date>; currently <number> active users
User Management Add Users To Role
Tag Value Severity Event Name createRole Resource WorkflowServices SubResource WorkflowAdminService Message Adding users <name> to role <role>
Create Role Tag Value
Severity Event Name createRole Resource WorkflowServices SubResource WorkflowAdminService Message Creating role with name <name> and
description <description>
System Events for Sentinel B-3

Create User Tag Value
Severity Event Name createUser Resource WorkflowServices SubResource WorkflowAdminService Message Creating user {0} Name {1} {2} belonging to
roles <roles>
Creating User Account Tag Value
Severity Event Name createUser Resource Config SubResource UserManagementService Message Creating User Account: {0} with Last Name:
<lastName>, First Name: <firstName>, State: <state>
Delete Role Tag Value
Severity Event Name deleteRole Resource WorkflowServices SubResource WorkflowAdminService Message Deleting role with name <name>
Deleting User Account Tag Value
Severity Event Name deleteUser Resource Config SubResource UserManagementService Message Deleting User Account: {0}
Locking User Account Tag Value
Severity Event Name lockUser Resource Config SubResource UserManagementService Message Locking User Account: {0}
Remove Users From Role Tag Value
Severity Event Name removeUsersFromRole Resource WorkflowServices SubResource WorkflowAdminService Message Removing users <name> from role <role>
B-4 Sentinel User Guide

Resetting Password Tag Value
Severity Event Name setPassword Resource Config SubResource UserManagementService Message Resetting password for User Account {0}
Unlocking User Account Tag Value
Severity Event Name unlockUser Resource Config SubResource UserManagementService Message Unlocking User Account: {0}
Updating User Tag Value
Severity Event Name updateUser Resource Config SubResource UserManagementService Message Updating user: {0} Last Name:<lastName>,
First Name: <firstName>, State: <state>
Database Event Management Database Space Reached Specified Percent Threshold
When event insertion is resumed after being blocked, the following event is sent.
Tag Value Severity 0 Event Name DbSpaceReachedPercentThrshld Resource Database SubResource Database Message Tablespace <string> has current size of
<number> MB with a max size of <number> MB and has reached the percentage threshold of <number> %
Database Space Reached Specified Time Threshold When event insertion is resumed after being blocked, the following event is sent.
Tag Value Severity 0 Event Name DbSpaceReachedTimeThrshld Resource Database SubResource Database
System Events for Sentinel B-5

Tag Value Message Tablespace <string> has <number> MB left
and growing <number> bytes per second and will run out space within the time threshold specified <number> seconds
Database Space Very Low When event insertion is resumed after being blocked, the following event is sent.
Tag Value Severity 5 Event Name DbSpaceVeryLow Resource Database SubResource Database Message Tablespace <string> has current size of
<number> MB and has reached the physical threshold of <number> MB
Database Stat
Tag Value Severity Event Name DbSpaceStat Resource SubResource Message
Error inserting events When inserting events into the database fails the following internal event is generated.
Tag Value Severity 5 Event Name InsertEventsFailed Resource EventSubsystem SubResource Events Message Error inserting events into the Database—the
events might be permanently lost. Please check the Database and backend server logs <Exception>
Error Moving Completed File When an event file is completed it is moved to the output directory. If that move fails the following internal event is generated.
Tag Value Severity 3 Event Name MoveArchiveFileFailed Resource <DAS name> SubResource ArchiveFile
B-6 Sentinel User Guide
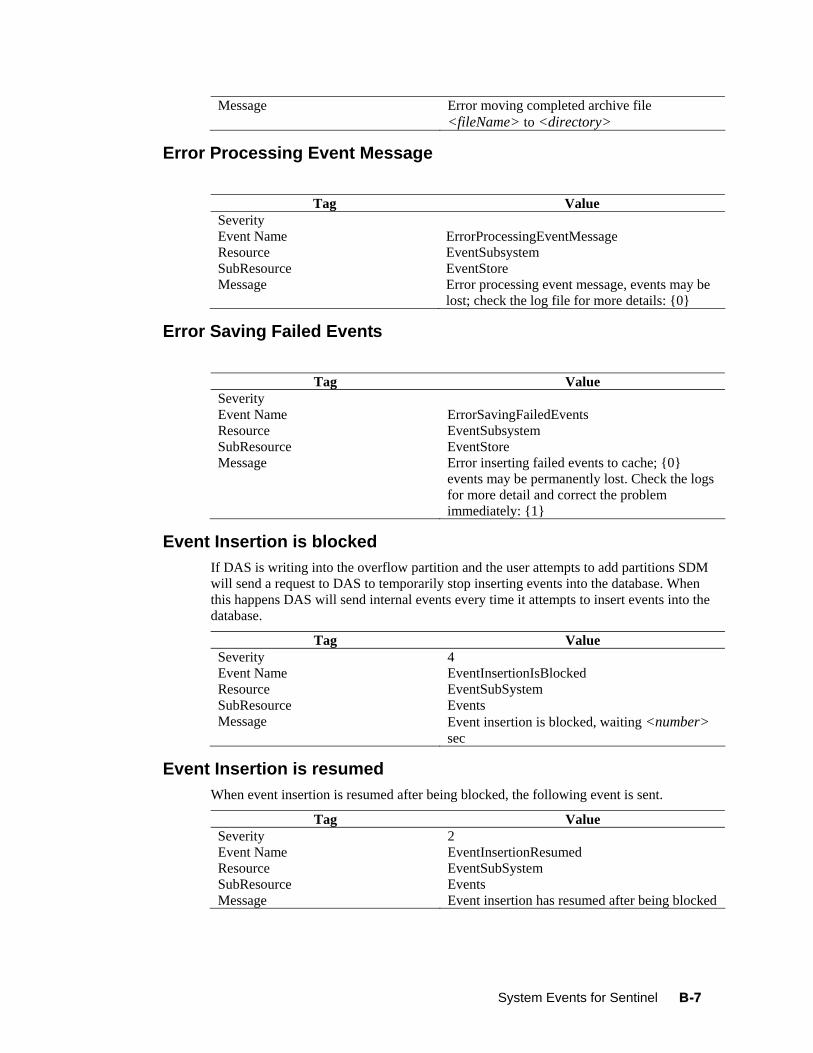
Message Error moving completed archive file <fileName> to <directory>
Error Processing Event Message
Tag Value Severity Event Name ErrorProcessingEventMessage Resource EventSubsystem SubResource EventStore Message Error processing event message, events may be
lost; check the log file for more details: {0}
Error Saving Failed Events
Tag Value Severity Event Name ErrorSavingFailedEvents Resource EventSubsystem SubResource EventStore Message Error inserting failed events to cache; {0}
events may be permanently lost. Check the logs for more detail and correct the problem immediately: {1}
Event Insertion is blocked If DAS is writing into the overflow partition and the user attempts to add partitions SDM will send a request to DAS to temporarily stop inserting events into the database. When this happens DAS will send internal events every time it attempts to insert events into the database.
Tag Value Severity 4 Event Name EventInsertionIsBlocked Resource EventSubSystem SubResource Events Message Event insertion is blocked, waiting <number>
sec
Event Insertion is resumed When event insertion is resumed after being blocked, the following event is sent.
Tag Value Severity 2 Event Name EventInsertionResumed Resource EventSubSystem SubResource Events Message Event insertion has resumed after being blocked
System Events for Sentinel B-7

Event Message Queue Overflow
Tag Value Severity Event Name EventMessageQueueOverflow Resource EventSubsystem SubResource EventStore Message In the previous {0}ms, failed to execute event
store task for {1} events because task queue is full--Events were stored to file for later insertion. Check the log files and the database " "for more information. The error occurred {2} times in this time range: {3}";
Event Processing Failed
Tag Value Severity Event Name EventProcessingFailed Resource EventSubsystem SubResource EventStore Message In the previous {0}ms, failed to process {1}
events--Events were stored for later insertion. Check the log files and the database for more information. The error occurred {2} times in this time range: {3}, cause {4}";
Low Space In The Database
Tag Value Severity Event Name DbSpaceLow Resource SubResource Message
No Space In The Database
Tag Value Severity Event Name DbNoSpace Resource DBSpace SubResource tableSpace Message
Opening Archive File failed When opening an archive file for storing the events for aggregation fails, the following internal event is generated.
B-8 Sentinel User Guide

Tag Value Severity 3 Event Name OpenArchiveFileFailed Resource <Das name> SubResource ArchiveFile Message Error opening archive file <fileName> in
<directory>
Partition Configuration
Tag Value Severity Event Name New/Update/Remove Resource SubResource PartitionConfig Message ableName=<name> PartTimeUnit={1}
PartTimeFactor={2} NumberOfUnits={3}
Writing to Archive File failed When opening an archive file for storing the events for aggregation fails, the following internal event is generated.
Tag Value Severity 3 Event Name WriteArchiveFileFailed Resource <Das name> SubResource ArchiveFile Message Error writing newly received events to
aggregation archive file <fileName>
Writing to the overflow partition (P_MAX) An event is sent approximately every 5 minutes notifying the user when events are being written to the overflow partition (P_MAX). When this occurs, the administrator needs to use SDM and add more partitions otherwise performance will start degrading.
Tag Value Severity 5 Event Name InsertIntoOverflowPartition Resource EventSubSystem SubResource Events Message Error: currently inserting into the overflow
partitions (P_MAX), add more partitions
Database Aggregation Creating Summary
Tag Value Severity Event Name createSummary Resource SubResource
System Events for Sentinel B-9

Tag Value Message Creating summary: <summaryDescription>
Deleting Summary Tag Value
Severity Event Name deleteSummary Resource SubResource Message Deleting summary: <summaryDescription>
Disabling Summary Tag Value
Severity Event Name disableSummary Resource SubResource Message Disabling summary: <summaryDescription>
Enabling Summary Tag Value
Severity Event Name enableSummary Resource SubResource EventAggregationAdminService Message Enabling summary: <summaryDescription>
Error inserting summary data into the database If an error is encountered while writing aggregation data into the database, the following internal event is generated.
Tag Value Severity 4 Event Name SummaryUpdateFailure Resource Aggregation SubResource Summary Message Error saving summary batch to the database for
summary <summaryName>
Saving Summary Tag Value
Severity Event Name saveSummary Resource SubResource Message Saving summary: <summaryDescription>
B-10 Sentinel User Guide
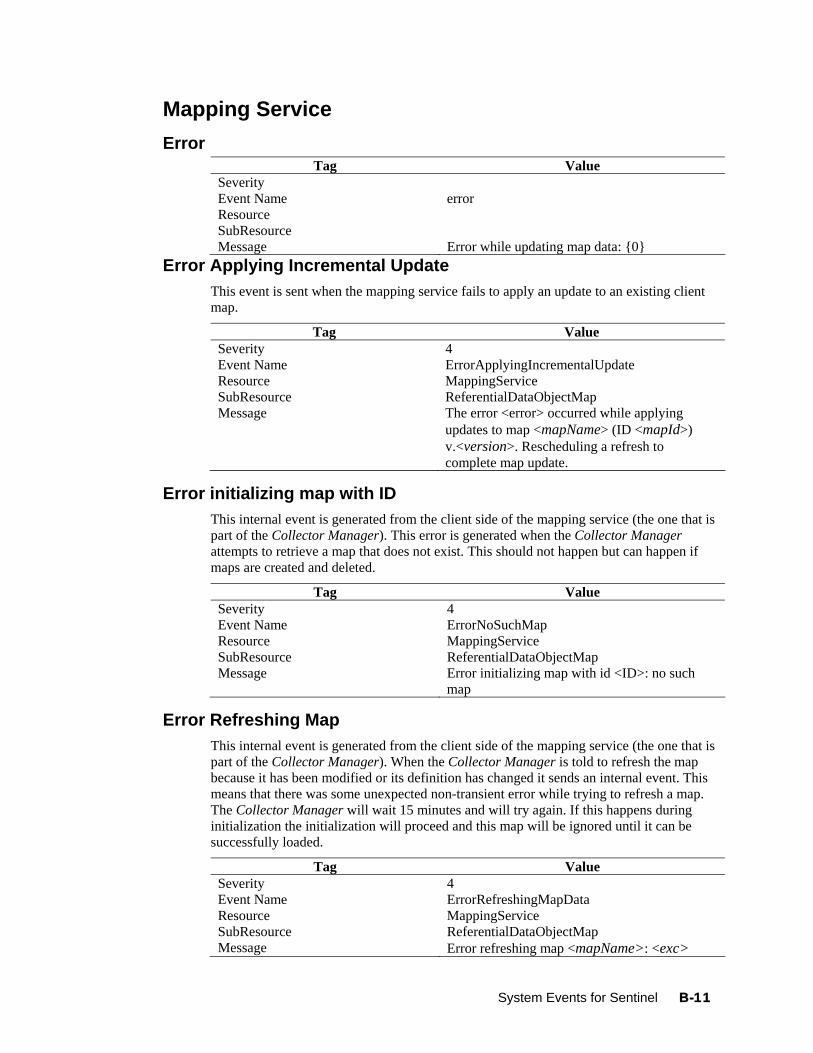
Mapping Service Error
Tag Value Severity Event Name error Resource SubResource Message Error while updating map data: {0}
Error Applying Incremental Update This event is sent when the mapping service fails to apply an update to an existing client map.
Tag Value Severity 4 Event Name ErrorApplyingIncrementalUpdate Resource MappingService SubResource ReferentialDataObjectMap Message The error <error> occurred while applying
updates to map <mapName> (ID <mapId>) v.<version>. Rescheduling a refresh to complete map update.
Error initializing map with ID This internal event is generated from the client side of the mapping service (the one that is part of the Collector Manager). This error is generated when the Collector Manager attempts to retrieve a map that does not exist. This should not happen but can happen if maps are created and deleted.
Tag Value Severity 4 Event Name ErrorNoSuchMap Resource MappingService SubResource ReferentialDataObjectMap Message Error initializing map with id <ID>: no such
map
Error Refreshing Map This internal event is generated from the client side of the mapping service (the one that is part of the Collector Manager). When the Collector Manager is told to refresh the map because it has been modified or its definition has changed it sends an internal event. This means that there was some unexpected non-transient error while trying to refresh a map. The Collector Manager will wait 15 minutes and will try again. If this happens during initialization the initialization will proceed and this map will be ignored until it can be successfully loaded.
Tag Value Severity 4 Event Name ErrorRefreshingMapData Resource MappingService SubResource ReferentialDataObjectMap Message Error refreshing map <mapName>: <exc>
System Events for Sentinel B-11
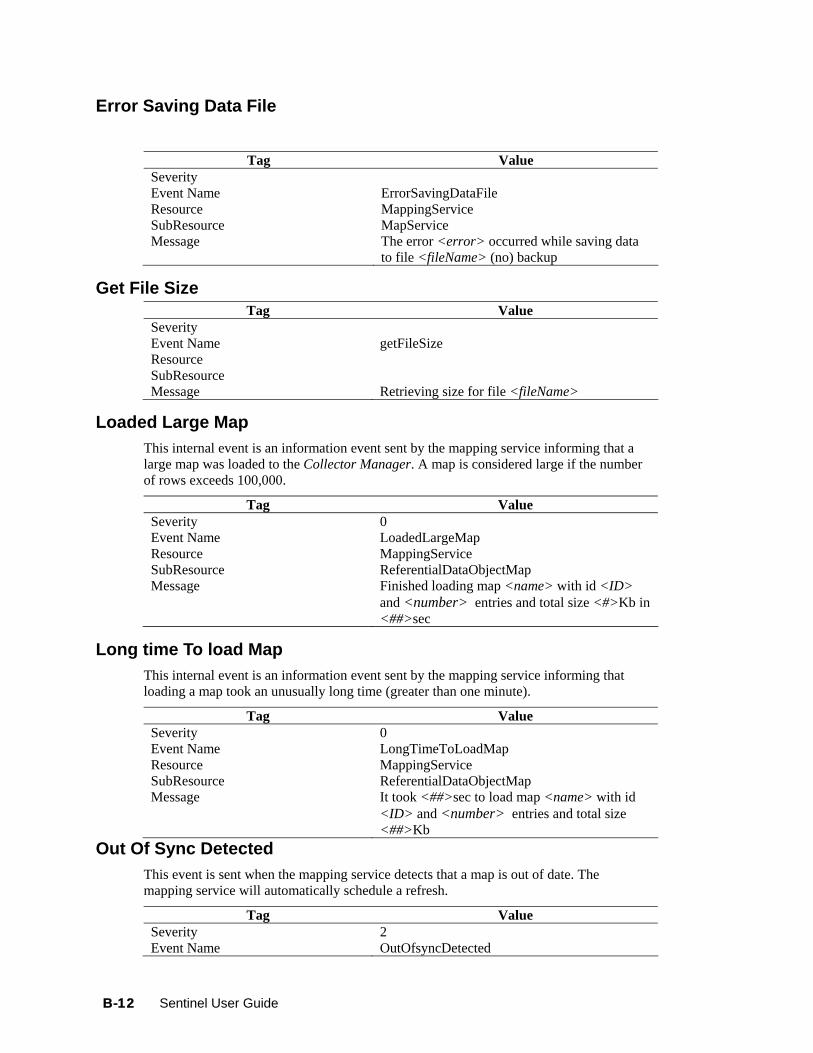
Error Saving Data File
Tag Value Severity Event Name ErrorSavingDataFile Resource MappingService SubResource MapService Message The error <error> occurred while saving data
to file <fileName> (no) backup
Get File Size Tag Value
Severity Event Name getFileSize Resource SubResource Message Retrieving size for file <fileName>
Loaded Large Map This internal event is an information event sent by the mapping service informing that a large map was loaded to the Collector Manager. A map is considered large if the number of rows exceeds 100,000.
Tag Value Severity 0 Event Name LoadedLargeMap Resource MappingService SubResource ReferentialDataObjectMap Message Finished loading map <name> with id <ID>
and <number> entries and total size <#>Kb in <##>sec
Long time To load Map This internal event is an information event sent by the mapping service informing that loading a map took an unusually long time (greater than one minute).
Tag Value Severity 0 Event Name LongTimeToLoadMap Resource MappingService SubResource ReferentialDataObjectMap Message It took <##>sec to load map <name> with id
<ID> and <number> entries and total size <##>Kb
Out Of Sync Detected This event is sent when the mapping service detects that a map is out of date. The mapping service will automatically schedule a refresh.
Tag Value Severity 2 Event Name OutOfsyncDetected
B-12 Sentinel User Guide

Resource MappingService SubResource ReferentialDataObjectMap Message Map <mapName> detected the map data is out-
of-sync, probably because of a missed update notification--scheduling a refresh
Refreshing Map from Cache This internal event is generated from the client side of the mapping service (the one that is part of the Collector Manager). When the Collector Manager is told to refresh the map because it has been modified or its definition has changed it sends an internal event. This means that its cache is up to date and is refreshing the map from cache.
Tag Value Severity 1 Event Name LoadingMapFromCache Resource MappingService SubResource ReferentialDataObjectMap Message Loading from cache v<version> of map
<mapName> (ID <id>)
Refreshing Map from Server This internal event is generated from the client side of the mapping service (the one that is part of the Collector Manager). When the Collector Manager is told to refresh the map because it has been modified or its definition has changed it sends an internal event. This means that the map was either not in the cache or the version in the cache was not up to date and the Collector Manager is retrieving the map from the server.
Tag Value Severity 1 Event Name RefreshingMapFromServer Resource MappingService SubResource ReferentialDataObjectMap Message Refreshing from server map <name> with id
<ID>
Save Data File Tag Value
Severity Event Name saveDataFile Resource SubResource MapService Message Saving data file {0}, backup? {1}
Saved Data File Tag Value
Severity Event Name SavedDataFile Resource MappingService SubResource MapService Message Saved "+fileSize+" bytes to file <fileName>
with original backed up to "+backupFile:"no backup of original
System Events for Sentinel B-13
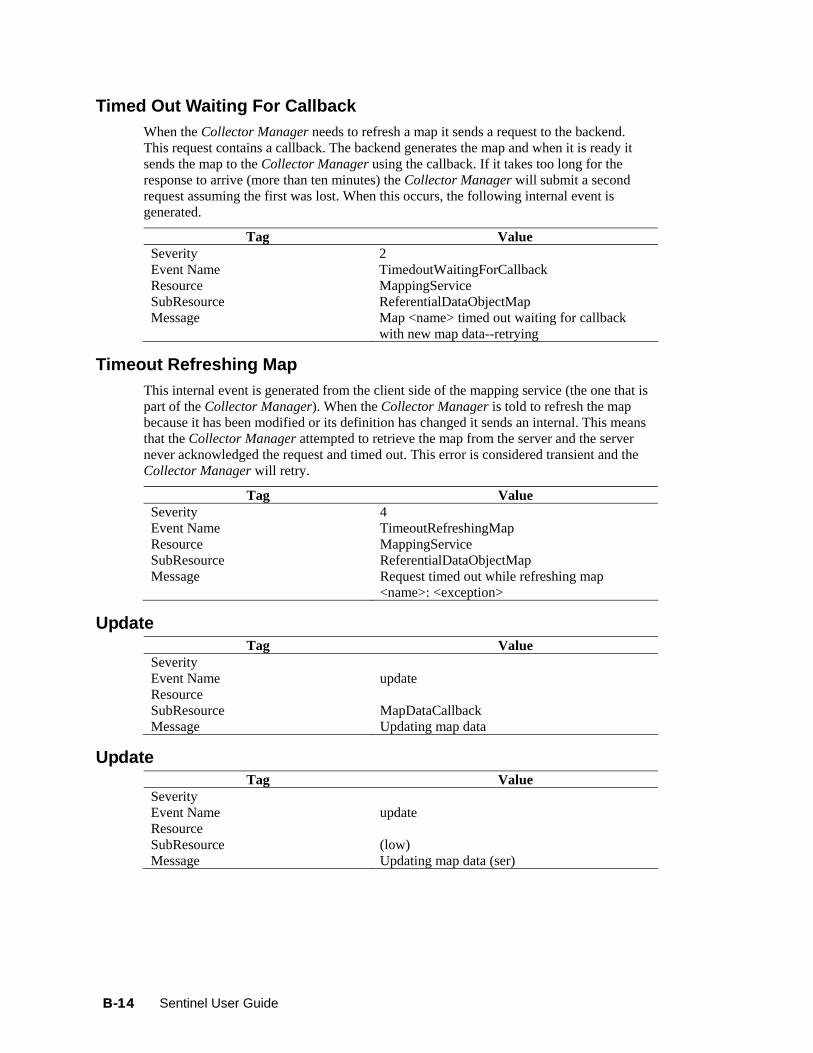
Timed Out Waiting For Callback When the Collector Manager needs to refresh a map it sends a request to the backend. This request contains a callback. The backend generates the map and when it is ready it sends the map to the Collector Manager using the callback. If it takes too long for the response to arrive (more than ten minutes) the Collector Manager will submit a second request assuming the first was lost. When this occurs, the following internal event is generated.
Tag Value Severity 2 Event Name TimedoutWaitingForCallback Resource MappingService SubResource ReferentialDataObjectMap Message Map <name> timed out waiting for callback
with new map data--retrying
Timeout Refreshing Map This internal event is generated from the client side of the mapping service (the one that is part of the Collector Manager). When the Collector Manager is told to refresh the map because it has been modified or its definition has changed it sends an internal. This means that the Collector Manager attempted to retrieve the map from the server and the server never acknowledged the request and timed out. This error is considered transient and the Collector Manager will retry.
Tag Value Severity 4 Event Name TimeoutRefreshingMap Resource MappingService SubResource ReferentialDataObjectMap Message Request timed out while refreshing map
<name>: <exception>
Update Tag Value
Severity Event Name update Resource SubResource MapDataCallback Message Updating map data
Update Tag Value
Severity Event Name update Resource SubResource (low) Message Updating map data (ser)
B-14 Sentinel User Guide
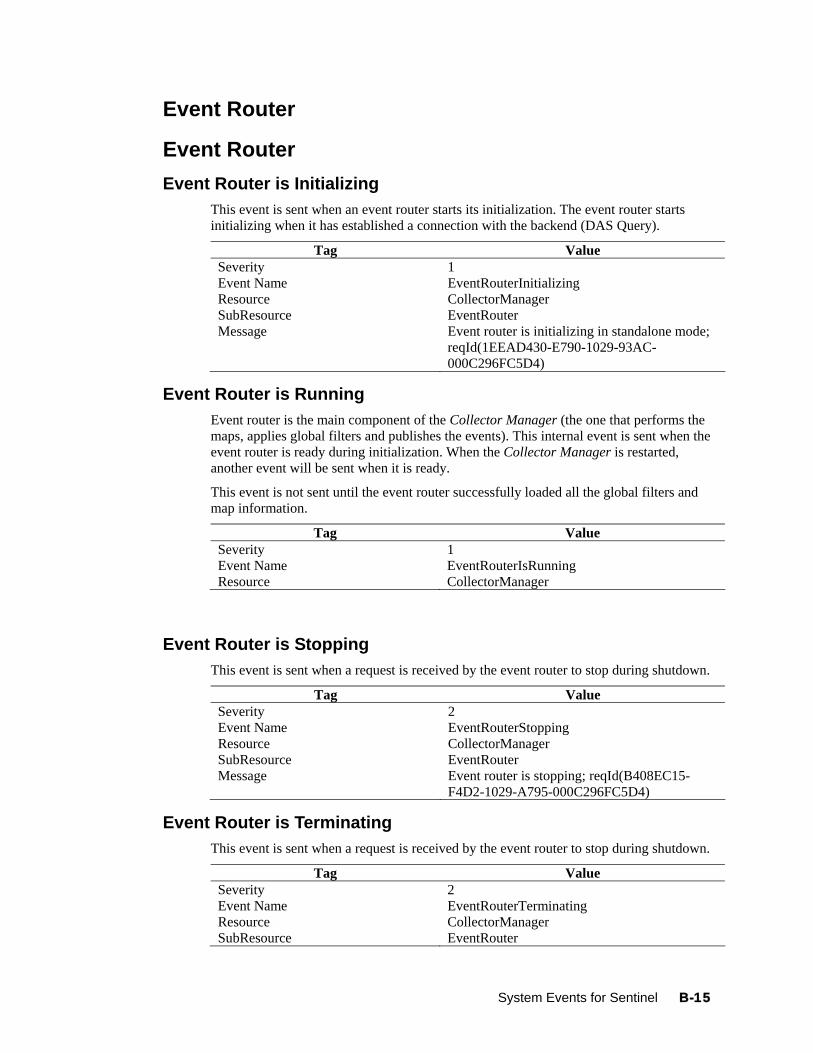
Event Router
Event Router Event Router is Initializing
This event is sent when an event router starts its initialization. The event router starts initializing when it has established a connection with the backend (DAS Query).
Tag Value Severity 1 Event Name EventRouterInitializing Resource CollectorManager SubResource EventRouter Message Event router is initializing in standalone mode;
reqId(1EEAD430-E790-1029-93AC-000C296FC5D4)
Event Router is Running Event router is the main component of the Collector Manager (the one that performs the maps, applies global filters and publishes the events). This internal event is sent when the event router is ready during initialization. When the Collector Manager is restarted, another event will be sent when it is ready.
This event is not sent until the event router successfully loaded all the global filters and map information.
Tag Value Severity 1 Event Name EventRouterIsRunning Resource CollectorManager
Event Router is Stopping This event is sent when a request is received by the event router to stop during shutdown.
Tag Value Severity 2 Event Name EventRouterStopping Resource CollectorManager SubResource EventRouter Message Event router is stopping; reqId(B408EC15-
F4D2-1029-A795-000C296FC5D4)
Event Router is Terminating This event is sent when a request is received by the event router to stop during shutdown.
Tag Value Severity 2 Event Name EventRouterTerminating Resource CollectorManager SubResource EventRouter
System Events for Sentinel B-15
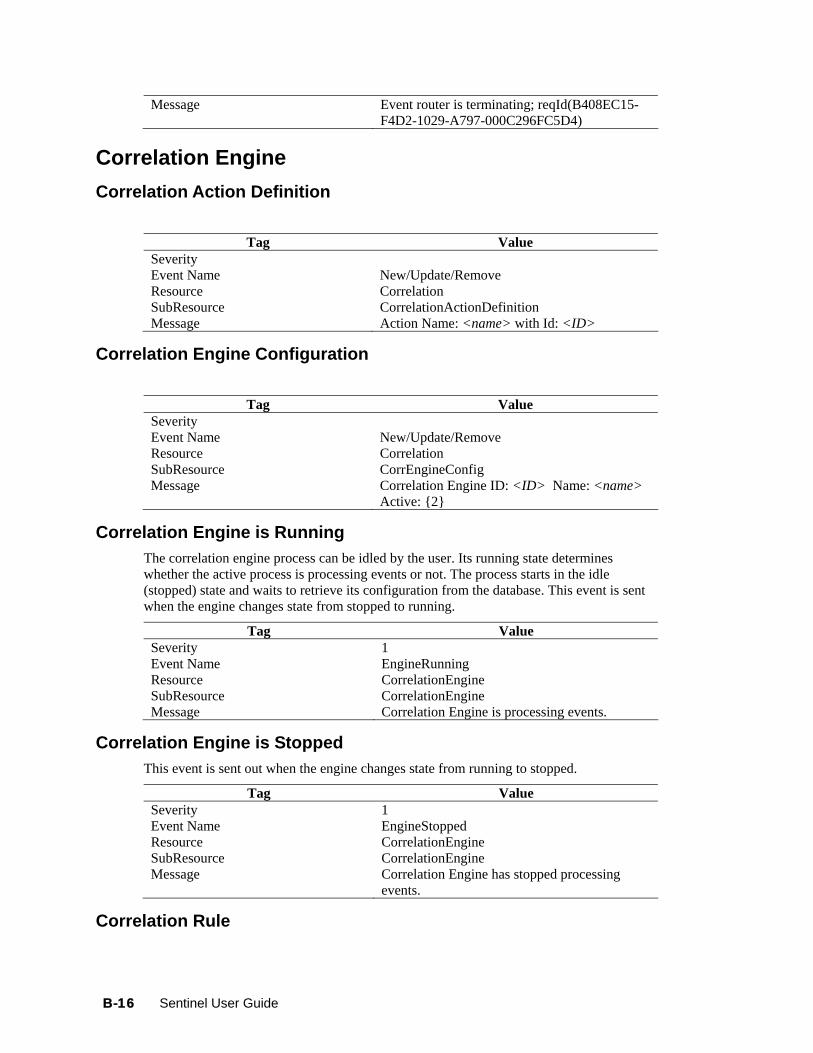
Message Event router is terminating; reqId(B408EC15-F4D2-1029-A797-000C296FC5D4)
Correlation Engine Correlation Action Definition
Tag Value Severity Event Name New/Update/Remove Resource Correlation SubResource CorrelationActionDefinition Message Action Name: <name> with Id: <ID>
Correlation Engine Configuration
Tag Value Severity Event Name New/Update/Remove Resource Correlation SubResource CorrEngineConfig Message Correlation Engine ID: <ID> Name: <name>
Active: {2}
Correlation Engine is Running The correlation engine process can be idled by the user. Its running state determines whether the active process is processing events or not. The process starts in the idle (stopped) state and waits to retrieve its configuration from the database. This event is sent when the engine changes state from stopped to running.
Tag Value Severity 1 Event Name EngineRunning Resource CorrelationEngine SubResource CorrelationEngine Message Correlation Engine is processing events.
Correlation Engine is Stopped This event is sent out when the engine changes state from running to stopped.
Tag Value Severity 1 Event Name EngineStopped Resource CorrelationEngine SubResource CorrelationEngine Message Correlation Engine has stopped processing
events.
Correlation Rule
B-16 Sentinel User Guide

Tag Value Severity Event Name New/Update/Remove Resource Correlation SubResource CorrRule Message Rule Name: <name> Type: <type> Rule Id:
<ID>
Correlation Rule Configuration
Tag Value Severity Event Name New/Update/Remove Resource Correlation SubResource CorrRuleConfig Message Correlation Rule Config ID: <ID> Rule
Definition ID: {1} Name: <name> Active: {3}
Deploy Rules With Actions To Engine Tag Value
Severity Event Name deployRulesWithActionsToEngine Resource CorrelationManagementService SubResource CorrelationManagementService Message Deploy Rules With Actions To Engine
<enginId>: Rules: <ruleID> Actions: <actionID>
Disabling Rule Tag Value
Severity Event Name disableRule Resource CorrelationManagementService SubResource CorrelationManagementService Message Disable Rule: {ruleCfgId}
Enabling Rule Tag Value
Severity Event Name enableRule Resource CorrelationManagementService SubResource CorrelationManagementService Message Enable Rule: {ruleCfgId}
Rename Correlation Engine Tag Value
Severity Event Name renameCorrEngine Resource CorrelationManagementService SubResource CorrelationManagementService
System Events for Sentinel B-17

Tag Value Message Rename Engine to: <name> with EngineId:
<ID>
Rule Deployment is Modified This event is sent out when an engine successfully reloads a rule deployment. This message is sent out regardless of the engine running state.
Tag Value Severity 1 Event Name DeploymentModified Resource CorrelationEngine SubResource Deployment Message Deployment <name> modified
Rule Deployment is Started This event is sent out when an engine successfully loads a rule deployment. This message is sent out regardless of the engine running state.
Tag Value Severity 1 Event Name DeploymentStarted Resource CorrelationEngine SubResource Deployment Message deployment <name> started
Rule Deployment is Stopped This event is sent out when an engine successfully unloads a rule deployment. This message is sent out regardless of the engine running state.
Tag Value Severity 1 Event Name DeploymentStopped Resource CorrelationEngine SubResource Deployment Message deployment <name> stopped
Starting Engine Tag Value
Severity Event Name startEngine Resource CorrelationManagementService SubResource CorrelationManagementService Message Start engine: <engineID>
Stopping Engine Tag Value
Severity Event Name stopEngine Resource CorrelationManagementService SubResource CorrelationManagementService Message Stop engine: <engineID>
B-18 Sentinel User Guide

UnDeploy All Rules From Engine Tag Value
Severity Event Name undeployAllRulesFromEngine Resource CorrelationManagementService SubResource CorrelationManagementService Message Undeploy all rules from Engine:
UnDeploy Rule Tag Value
Severity Event Name undeployRule Resource CorrelationManagementService SubResource CorrelationManagementService Message Undeploy Rule: {ruleCfgId}
Update Correlation Rule Actions Tag Value
Severity Event Name updateCorrRuleActions Resource CorrelationManagementService SubResource CorrelationManagementService Message Update Rule Config {0} by deleting Actions:
<actionID> and adding Actions: <actionID>
Event Source Management-General Collector Manager Initialized
Tag Value Severity Event Name CollectorManagerInitialized Resource CollectorManager SubResource Internal Message Initialized Collector Manager…
Collector Manager Is Down
Tag Value Severity Event Name CollectorManagerDown Resource HealthManager SubResource CollectorManagerHealth Message Collector manager <name> UUID {1} is down
for {2} days {3} hrs {4} min
Collector Manager Started Tag Value
Severity Event Name CollectorManagerStarted
System Events for Sentinel B-19

Tag Value Resource CollectorManager SubResource Internal Message Started Collector Manager...
Collector Manager Stopped Tag Value
Severity Event Name CollectorManagerStopped Resource CollectorManager SubResource Internal Message Stopped Collector Manager...
Collector Service Callback
Tag Value Severity Event Name restart Resource SubResource CollectorServiceCallback Message Restart Collector with Id: <ID>
Cyclical Dependency Event Service sends this event when it detects a cycle in the Event Definition (in dependencies among tags because of referential map assignments). Check the event configuration in SDM and resolve the dependency.
Tag Value Severity 5 Event Name CyclicalDependency Resource EventService SubResource ObjectAttrInfos Message Cyclical dependency detected in event
transformations. Check event configuration.
Event Source Manager Callback
Tag Value Severity Event Name restart Resource SubResource EventSourceManagerCallback Message Restart node with Id: <ID>
Initializing Collector Manager Tag Value
Severity Event Name CollectorManagerInitializing Resource CollectorManager SubResource Internal
B-20 Sentinel User Guide

Tag Value Message Initializing Collector Manager…
Lost Contact With Collector Manager
Tag Value Severity Event Name LostContactWithCollectorManager Resource HealthManager SubResource CollectorManagerHealth Message Lost contact with collector manager <name>
UUID {1}--down for {2} days {3} hrs {4} min
No Data Alert
Tag Value Severity Event Name NoDataAlert Resource CollectorManager SubResource objectName Message No data received for {7} {0} (ID {1}) for last
{2} days {3} hrs {4} min {5} sec (threshold {6} ms)
Persistent Process Died Collector Engine sends this event when the persistent process connector detects its controlled process has died.
Tag Value Severity 5 Event Name PersistentProcessDied Resource AgentManager SubResource AgentManager Message Persistent Process on port <port ID> has died.
Persistent Process Restarted Collector Engine sends this event when the persistent process connector is able to restart the controlled process that had died.
Tag Value Severity 1 Event Name PersistentProcessRestarted Resource AgentManager SubResource AgentManager Message Persistent Process on port <port ID> has
restarted.
Port Start Collector Manager sends this event when a port is started.
Tag Value
System Events for Sentinel B-21

Severity 1 Event Name PortStart Resource AgentManager SubResource AgentManager Message Processing started for port_<port ID>
Port Stop Collector Manager sends this event when a port is stopped.
Tag Value Severity 1 Event Name PortStop Resource AgentManager SubResource AgentManager Message Processing stopped for port_<port ID>
Reestablished Contact With Collector Manager
Tag Value Severity Event Name ReestablishedContactWithCollectorManager Resource HealthManager SubResource CollectorManagerHealth Message Reestablished contact with collector manager
{0} UUID {1} after {2} days {3} hrs {4} min
Restart Plugin Deployments Tag Value
Severity Event Name restartPluginDeployments Resource EventSourceManagement SubResource EventSourceManagerService Message Restart deployments of plugin: {0}
Restarting Collector Manager (Cold Restart) Tag Value
Severity Event Name CollectorManagerRestart Resource CollectorManager SubResource Internal Message Restarting Collector Manager (Cold restart)
Restarting Collector Manager (Warm Restart) Tag Value
Severity Event Name CollectorManagerRestart Resource CollectorManager SubResource Internal Message Restarting Collector Manager (Warm restart)
B-22 Sentinel User Guide

Start Event Source Group Tag Value
Severity Event Name startEventSourceGroup Resource EventSourceManagement SubResource EventSourceManagerService Message Start Connector: {0}
Start Event Source Manager Tag Value
Severity Event Name startEventSourceManager Resource EventSourceManagement SubResource EventSourceManagerService Message Start Collector Manager:
<eventSourceManagerID>
Starting Collector Manager Tag Value
Severity Event Name CollectorManagerStarting Resource CollectorManager SubResource Internal Message Starting Collector Manager…
Stop Event Source Group Tag Value
Severity Event Name stopEventSourceGroup Resource EventSourceManagement SubResource EventSourceManagerService Message Stop Connector: {0}
Stop Event Source Manager Tag Value
Severity Event Name StopEventSourceManager Resource EventSourceManagement SubResource EventSourceManagerService Message Stop Collector Manager:
<eventSourceManagerID>
Stopping Collector Manager Tag Value
Severity Event Name CollectorManagerStopping Resource CollectorManager SubResource Internal Message Stopping Collector Manager...
System Events for Sentinel B-23
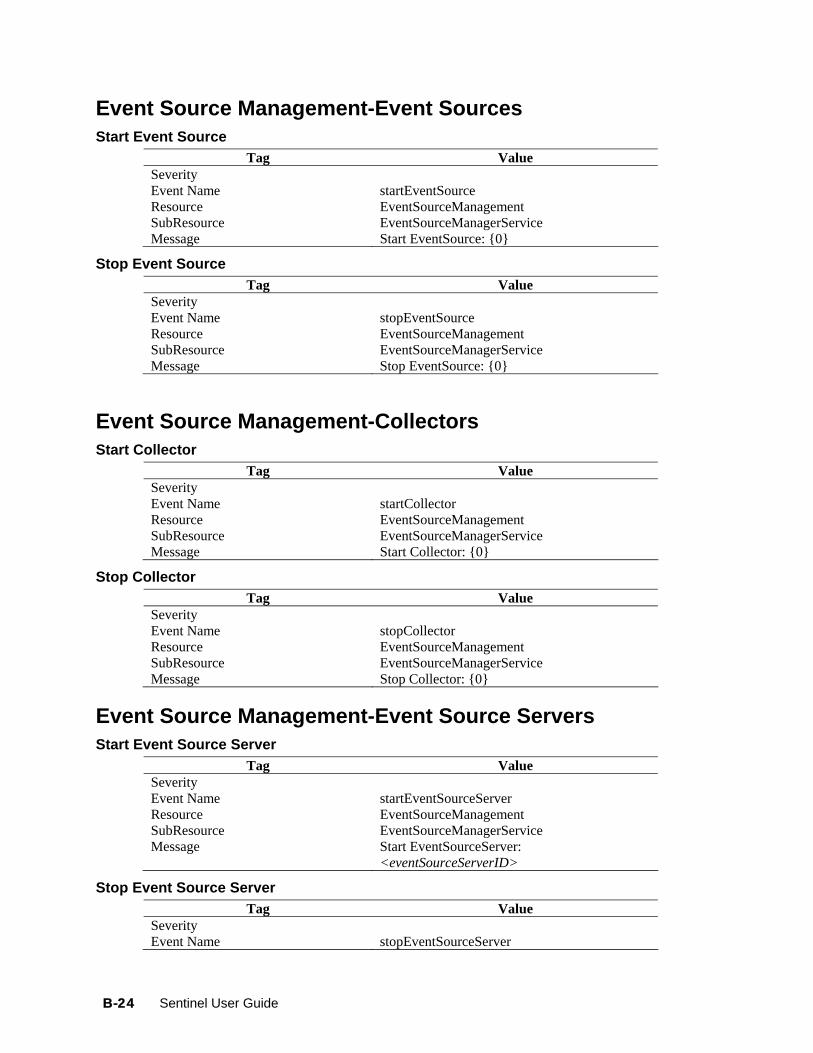
Event Source Management-Event Sources Start Event Source
Tag Value Severity Event Name startEventSource Resource EventSourceManagement SubResource EventSourceManagerService Message Start EventSource: {0}
Stop Event Source Tag Value
Severity Event Name stopEventSource Resource EventSourceManagement SubResource EventSourceManagerService Message Stop EventSource: {0}
Event Source Management-Collectors Start Collector
Tag Value Severity Event Name startCollector Resource EventSourceManagement SubResource EventSourceManagerService Message Start Collector: {0}
Stop Collector Tag Value
Severity Event Name stopCollector Resource EventSourceManagement SubResource EventSourceManagerService Message Stop Collector: {0}
Event Source Management-Event Source Servers Start Event Source Server
Tag Value Severity Event Name startEventSourceServer Resource EventSourceManagement SubResource EventSourceManagerService Message Start EventSourceServer:
<eventSourceServerID>
Stop Event Source Server Tag Value
Severity Event Name stopEventSourceServer
B-24 Sentinel User Guide

Tag Value Resource EventSourceManagement SubResource EventSourceManagerService Message Stop EventSourceServer:
<eventSourceServerID>
Stop Event Source Server Tag Value
Severity Event Name stopEventSourceServer Resource EventSourceManagement SubResource EventSourceManagerService Message Stop EventSourceServer:
<eventSourceServerID>
Event Source Management-Connectors Data Received After Timeout
When the File Connector is configured with a DataTimeout greater than 0 in the package.xml file and the DataTimeout period without reading any data and then new data is read from the file, the following internal event is generated.
Tag Value Severity 4 Event Name FileUpdatedAfterTimeout Resource FileConnector SubResource FileConnector Message After Event source <File Event Source ID>
reached time out of <Timeout Period>, file <File Location> received new data.
Data Timeout When the File Connector is configured with a DataTimeout greater than 0 in the package.xml file and no data is read from the file in the DataTimeout period, the following internal event is generated.
Tag Value Severity 4 Event Name FileTimeout Resource FileConnector SubResource FileConnector Message Event source <File Event Source ID> reached
time out of <Timeout Period> when processing file <File Location>.
File Rotation When the File Connector is configured to use file rotation and the Connector changes from one file to the next, the following internal event is generated.
Tag Value Severity 4 Event Name RotatingFile
System Events for Sentinel B-25
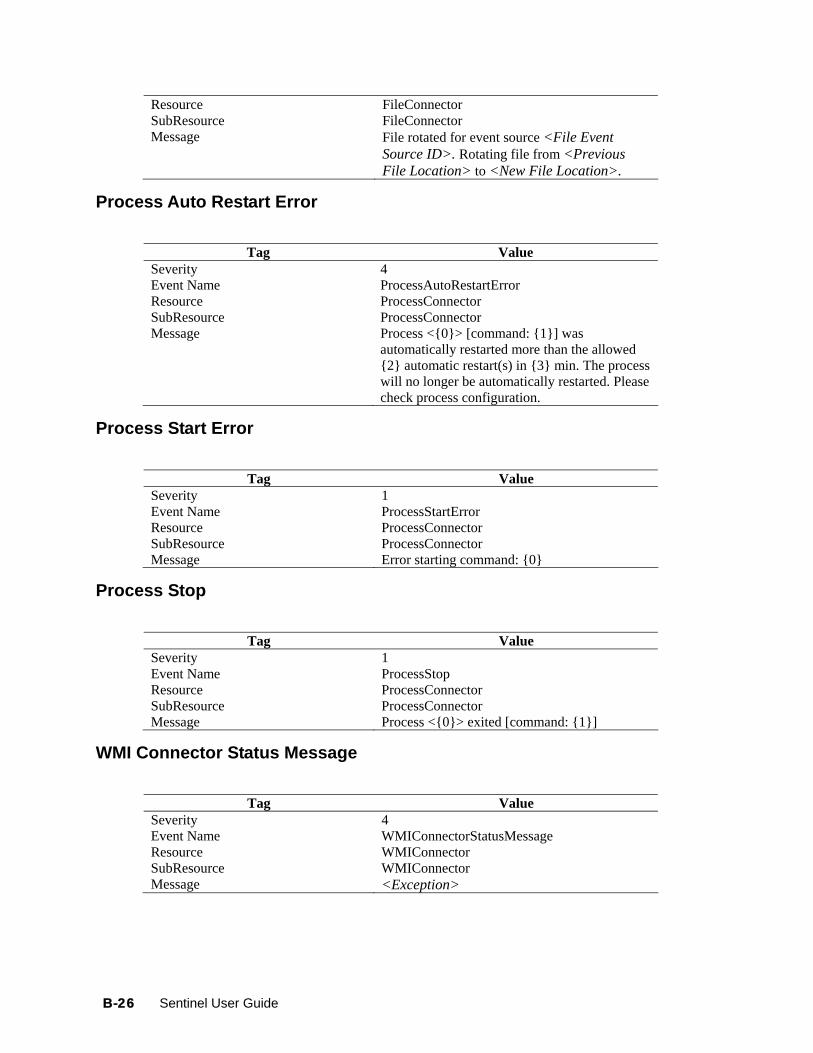
Resource FileConnector SubResource FileConnector Message File rotated for event source <File Event
Source ID>. Rotating file from <Previous File Location> to <New File Location>.
Process Auto Restart Error
Tag Value Severity 4 Event Name ProcessAutoRestartError Resource ProcessConnector SubResource ProcessConnector Message Process <{0}> [command: {1}] was
automatically restarted more than the allowed {2} automatic restart(s) in {3} min. The process will no longer be automatically restarted. Please check process configuration.
Process Start Error
Tag Value Severity 1 Event Name ProcessStartError Resource ProcessConnector SubResource ProcessConnector Message Error starting command: {0}
Process Stop
Tag Value Severity 1 Event Name ProcessStop Resource ProcessConnector SubResource ProcessConnector Message Process <{0}> exited [command: {1}]
WMI Connector Status Message
Tag Value Severity 4 Event Name WMIConnectorStatusMessage Resource WMIConnector SubResource WMIConnector Message <Exception>
B-26 Sentinel User Guide

Active Views Active View Created
DAS_Binary sends this event when an Active View is created.
Tag Value Severity 1 Event Name RtChartCreated Resource RealTimeSummaryService SubResource ChartManager Message Creating new Active View with filter <filter>
and attribute <attribute> for users with security filter <security filter>. Currently <n> Active View(s) Collecting.
Active View Joined DAS_Binary sends this event when a user connects to an existing Active View.
Tag Value Severity 1 Event Name RtChartJoiningExistingData Resource RealTimeSummaryService SubResource ChartManager Message Joining existing Active View with filter
<filter> and attribute <attribute> for users with security filter <security filter>. Currently <n> Active View(s) Collecting.
Active View No Longer Permanent DAS_Binary sends this event when it detects a formerly permanent Active View that is no longer permanent. This check happens periodically, so it can be several minutes after an Active View is removed from preferences before this event is generated.
Tag Value Severity 1 Event Name RtChartNotPermanent Resource RealTimeSummaryService SubResource ChartManager Message Active View with filter <filter> and attribute
<attribute> for users with security filter <security filter> is no longer permanent.
Active View Now Permanent DAS_Binary sends this event when it detects an Active View as newly permanent. This check happens periodically, so it can be several minutes after an Active View is saved to preferences before this event is generated.
Tag Value Severity 1 Event Name RtChartIsNowPermanent Resource RealTimeSummaryService SubResource ChartManager
System Events for Sentinel B-27
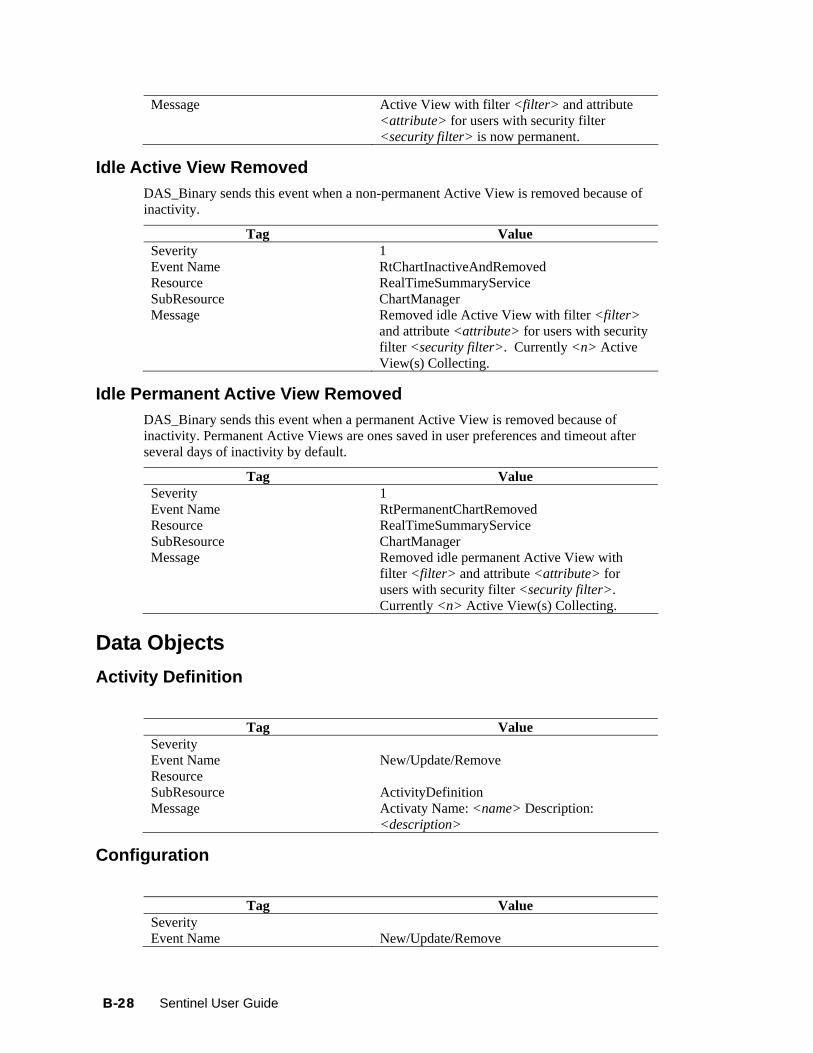
Message Active View with filter <filter> and attribute <attribute> for users with security filter <security filter> is now permanent.
Idle Active View Removed DAS_Binary sends this event when a non-permanent Active View is removed because of inactivity.
Tag Value Severity 1 Event Name RtChartInactiveAndRemoved Resource RealTimeSummaryService SubResource ChartManager Message Removed idle Active View with filter <filter>
and attribute <attribute> for users with security filter <security filter>. Currently <n> Active View(s) Collecting.
Idle Permanent Active View Removed DAS_Binary sends this event when a permanent Active View is removed because of inactivity. Permanent Active Views are ones saved in user preferences and timeout after several days of inactivity by default.
Tag Value Severity 1 Event Name RtPermanentChartRemoved Resource RealTimeSummaryService SubResource ChartManager Message Removed idle permanent Active View with
filter <filter> and attribute <attribute> for users with security filter <security filter>. Currently <n> Active View(s) Collecting.
Data Objects Activity Definition
Tag Value Severity Event Name New/Update/Remove Resource SubResource ActivityDefinition Message Activaty Name: <name> Description:
<description>
Configuration
Tag Value Severity Event Name New/Update/Remove
B-28 Sentinel User Guide

Tag Value Resource Core SubResource FilterConfig, GlobalFilterConfig, MenuConfig,
OptionsConfig, IncidentActionConfig, AnalyzeDefaultConfig, AnalyzeReportConfig, AdvisorDefaultConfig and AdvisorReportConfig
Message Updating Config Object: <name> by User: _SYSTEM
Viewing Configuration Store
Tag Value Severity Event Name New/Update/Remove Resource SubResource ViewConfigurationStore Message name <name> type <type> description
<description>
Write Data
Tag Value Severity Event Name WriteData Resource ListService SubResource ListUpdater Message Could not write data for list
Activities Creating an Activity
Tag Value Severity Event Name createActivity Resource SubResource ActivityNamespace Message Creating iTRAC Activity <name>
Deleting an Activity Tag Value
Severity Event Name deleteActivity Resource SubResource ActivityNamespace Message Deleting iTRAC Activity <name>
Saving an Activity Tag Value
System Events for Sentinel B-29

Tag Value Severity Event Name saveActivity Resource SubResource ActivityNamespace Message Saving changes for iTRAC Activity <name>
Incidents and Workflows Add Events To Incident
Tag Value Severity Event Name addEventsToIncident Resource IncidentService SubResource IncidentService Message User: <name> adding <number> events to
incident with ID: <ID>
Adding Process Definition Tag Value
Severity Event Name addProcessDefinition Resource WorkflowServices SubResource WorkflowObjectMgrService Message reading iTRAC Template <name>
Create Incident Tag Value
Severity Event Name createIncident Resource IncidentService SubResource IncidentService Message User: <name> created incident with name:
<incidentName>, state: <state>, severity: <severity>, resolution: <resolution>
Creating Group Tag Value
Severity Event Name createGroup Resource WorkflowServices SubResource WorkflowObjectMgrService Message Creating iTRAC Role {0} : description :
<description>
Creating User Tag Value
Severity Event Name createUser Resource WorkflowServices SubResource WorkflowObjectMgrService Message Creating User in WorkFlow: {0} with
firstname: <firstName> lastname : <lastName>
B-30 Sentinel User Guide

Delete Incident Tag Value
Severity Event Name deleteIncident Resource IncidentService SubResource IncidentService Message Delete incident with ID: <ID>
Deleting Group Tag Value
Severity Event Name deleteGroup Resource WorkflowServices SubResource WorkflowObjectMgrService Message Deleting iTRAC Role {0} : description :
<description>
Deleting Process Definition Tag Value
Severity Event Name deleteProcessDefinition Resource WorkflowServices SubResource WorkflowObjectMgrService Message Deleting iTRAC Template <ID>
Deleting User Tag Value
Severity Event Name deleteUser Resource WorkflowServices SubResource WorkflowObjectMgrService Message Deleting User in WorkFlow: {0} with
firstname: <firstName> lastname : <lastName>
E-mail Incident Tag Value
Severity Event Name emailIncident Resource IncidentService SubResource IncidentService Message User: <name> emailed incident with name:
<incidentName>, state: <state>, severity: <severity>{2}, resolution: <resolution> to email address: <e-mailID>
Get Incident Tag Value Severity Event Name getIncident Resource IncidentService SubResource IncidentService Message Get incident with ID: <ID>
System Events for Sentinel B-31

Save Incident Tag Value
Severity Event Name saveIncident Resource IncidentService SubResource IncidentService Message Save incident with name: <name>, state:
<state>, severity: <severity>, resolution: <resolution>
Saving Group Tag Value
Severity Event Name saveGroup Resource WorkflowServices SubResource WorkflowObjectMgrService Message Saving iTRAC Role {0} : description :
<description>
Saving Process Definition Tag Value
Severity Event Name saveProcessDefinition Resource WorkflowServices SubResource WorkflowObjectMgrService Message Saving iTRAC Template <name>
Send Incident To Hp Service Desk Tag Value
Severity Event Name sendIncidentToHpServiceDesk Resource IncidentService SubResource IncidentService Message User: <name> sent incident with name:
<incidentName>, state: <state>, severity: <severity>, resolution: <resolution> to HP Service Desk
Send Incident To HpOVO Tag Value
Severity Event Name sendIncidentToHpOVO Resource IncidentService SubResource IncidentService Message User: <name> sent incident with name:
<incidentName>, state: <state>, severity: <severity>, resolution: <resolution> to HP Open View
Viewing Process Definition Tag Value
Severity Event Name getProcessDefinition
B-32 Sentinel User Guide

Tag Value Resource WorkflowServices SubResource WorkflowObjectMgrService Message Viewing iTRAC Template <ID>
General Configuration Service
Tag Value Severity Event Name saveConfig Resource SubResource ConfigService Message Saving configuration, unit {0} app {1} userId
{2}
Controlled Process is started Watchdog is run as a service. Its main purpose is to keep Sentinel processes running. If a process dies, Watchdog will automatically restart that process. This event is sent out when a process is started.
Tag Value Severity 1 Event Name ProcessStart Resource Sentinel SubResource Process Message Process <ProgramName> spawned (command
<pID>)
Controlled Process is stopped This event is sent out when a process is stopped. The severity is set to 5 if the process was set to respawn (that is, it is not expected to die). The severity is set to 1 if the process was set to run once.
Tag Value Severity 1/5 Event Name ProcessStop Resource Sentinel SubResource Process Message Process <ProgramName> exited (command
<exit_code>)
Importing Auxiliary Tag Value
Severity Event Name importAuxiliary Resource SubResource PluginRepositoryService (Medium) Message Import auxiliary file <auxiliaryJarName> into
plugin <pluginID>.
System Events for Sentinel B-33

Importing Plugin Tag Value
Severity Event Name importPlugin Resource SubResource PluginRepositoryService Message Import plugin <name> (ID <ID>) of type
<type>.
Load Esec Taxonomy To XML Tag Value
Severity Event Name loadEsecTaxonomyToXML Resource SubResource EsecTaxonomyNodeService Message Loading Esecurity taxonomy Info to an xml
format:
Process Auto Restart Error This event is sent out when a process is stopped. The severity is set to 5 if the process was set to respawn (that is, it is not expected to die). The severity is set to 1 if the process was set to run once.
Tag Value Severity 1/5 Event Name ProcessAutoRestartError Resource Sentinel SubResource Process Message Process <{0}> [command: {1}] was
automatically restarted more than the allowed {2} automatic restart(s) in {3} min. The process will no longer be automatically restarted. Please check process configuration.
Process Restarts
Tag Value Severity Event Name ProcessRestart Resource Sentinel SubResource Process Message Process <ProgramName> spawned (command
<pID>)
Proxy Client Registration Service (medium)
Tag Value Severity
B-34 Sentinel User Guide

Tag Value Event Name registerClient Resource SubResource ProxyClientRegistrationService (medium) Message Registering new client
Restarting Process Tag Value
Severity Event Name restartProcess Resource SentinelHealth SubResource SentinelHealthService Message Restarting process <name> on Sentinel server
<name> UUID {2}
Restarting Processes Tag Value
Severity Event Name restartProcesses Resource SentinelHealth SubResource SentinelHealthService Message Restarting <number> processes: <number>
name <name> server <name> server ID <ID>;
Starting Process Tag Value
Severity Event Name startProcess Resource SentinelHealth SubResource SentinelHealthService Message Starting process <name> on Sentinel server
<name> UUID {2}
Starting Processes Tag Value
Severity Event Name startProcesses Resource SentinelHealth SubResource SentinelHealthService Message Starting <number> processes: <number> name
<name> server <name> server ID <ID>;
Stopping Process Tag Value
Severity Event Name stopProcess Resource SentinelHealth SubResource SentinelHealthService Message Stopping process <name> on Sentinel server
<name> UUID {2}
System Events for Sentinel B-35

B-36 Sentinel User Guide
Stopping Processes Tag Value
Severity Event Name stopProcesses Resource SentinelHealth SubResource SentinelHealthService Message Stopping <number> processes: <number>
name <name> server <name> server ID <ID>;
Store Esec Taxonomy From XML Tag Value
Severity Event Name storeEsecTaxonomyFromXML Resource SubResource EsecTaxonomyNodeService Message Storing Esecurity taxonomy Info :
Watchdog Process is started As the Watchdog process starts, the following internal event is generated.
Tag Value Severity 1 Event Name ProcessStart Resource WatchDog SubResource WatchDog Message WatchDog Service Starting
Watchdog Process is stopped When the Watchdog service is stopped, the following internal event is generated.
Tag Value Severity 5 Event Name ProcessStop Resource WatchDog SubResource WatchDog Message WatchDog Service Ended
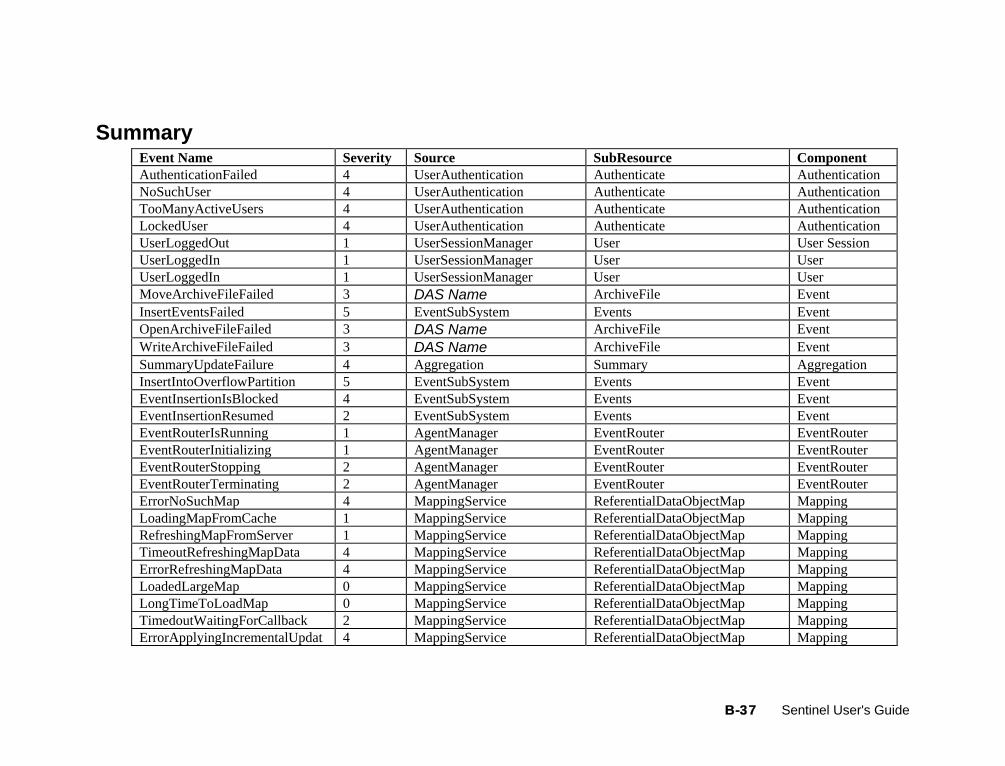
Summary Event Name Severity Source SubResource Component AuthenticationFailed 4 UserAuthentication Authenticate Authentication NoSuchUser 4 UserAuthentication Authenticate Authentication TooManyActiveUsers 4 UserAuthentication Authenticate Authentication LockedUser 4 UserAuthentication Authenticate Authentication UserLoggedOut 1 UserSessionManager User User Session UserLoggedIn 1 UserSessionManager User User UserLoggedIn 1 UserSessionManager User User MoveArchiveFileFailed 3 DAS Name ArchiveFile Event InsertEventsFailed 5 EventSubSystem Events Event OpenArchiveFileFailed 3 DAS Name ArchiveFile Event WriteArchiveFileFailed 3 DAS Name ArchiveFile Event SummaryUpdateFailure 4 Aggregation Summary Aggregation InsertIntoOverflowPartition 5 EventSubSystem Events Event EventInsertionIsBlocked 4 EventSubSystem Events Event EventInsertionResumed 2 EventSubSystem Events Event EventRouterIsRunning 1 AgentManager EventRouter EventRouter EventRouterInitializing 1 AgentManager EventRouter EventRouter EventRouterStopping 2 AgentManager EventRouter EventRouter EventRouterTerminating 2 AgentManager EventRouter EventRouter ErrorNoSuchMap 4 MappingService ReferentialDataObjectMap Mapping LoadingMapFromCache 1 MappingService ReferentialDataObjectMap Mapping RefreshingMapFromServer 1 MappingService ReferentialDataObjectMap Mapping TimeoutRefreshingMapData 4 MappingService ReferentialDataObjectMap Mapping ErrorRefreshingMapData 4 MappingService ReferentialDataObjectMap Mapping LoadedLargeMap 0 MappingService ReferentialDataObjectMap Mapping LongTimeToLoadMap 0 MappingService ReferentialDataObjectMap Mapping TimedoutWaitingForCallback 2 MappingService ReferentialDataObjectMap Mapping ErrorApplyingIncrementalUpdat 4 MappingService ReferentialDataObjectMap Mapping
B-37 Sentinel User's Guide

B-38 Sentinel User Guide
Event Name Severity Source SubResource Component e OutOfSyncDetected 2 MappingService ReferentialDataObjectMap Mapping EngineRunning 1 CorrelationEngine CorrelationEngine EngineStopped 1 CorrelationEngine CorrelationEngine DeploymentStarted 1 CorrelationEngine Deployment DeploymentStopped 1 CorrelationEngine Deployment DeploymentModified 1 CorrelationEngine Deployment ProcessStart 1 WatchDog Process ProcessStop 1/5 WatchDog Process ProcessStart 1 WatchDog WatchDog ProcessStop 5 WatchDog WatchDog PortStart AgentManager AgentManager PortStop AgentManager AgentManager PersistentProcessDied 5 AgentManager AgentManager PersistentProcessRestarted 1 AgentManager AgentManager SortDependencies 5 EventService ObjectAttrInfo EventService DbSpaceReachedTimeThrshld 0 Database Database Event DbSpaceReachedPercentThrshld 0 Database Database Event DbSpaceVeryLow 5 Database Database Event RtChartCreated 1 RealTimeSummaryService ChartManager Active Views RtChartJoiningExistingData 1 RealTimeSummaryService ChartManager Active Views RtChartInactiveAndRemoved 1 RealTimeSummaryService ChartManager Active Views RtChartPermanentAndRemoved 1 RealTimeSummaryService ChartManager Active Views RtChartIsNowPermanent 1 RealTimeSummaryService ChartManager Active Views RtChartNotPermanent 1 RealTimeSummaryService ChartManager Active Views
Related Documents