Brain (1999), 122, 1651–1665 Sensory processing in Parkinson’s and Huntington’s disease Investigations with 3D H 2 15 O-PET H. Boecker, 1 A. Ceballos-Baumann, 1 P. Bartenstein, 2 A. Weindl, 1 H. R. Siebner, 1 T. Fassbender, 1 F. Munz, 2 M. Schwaiger 2 and B. Conrad 1 Departments of 1 Neurology and 2 Nuclear Medicine, Correspondence to: Henning Boecker, MD, Neurologische Technical University of Munich, Klinikum rechts der Isar, Klinik, TU Mu ¨nchen, Klinikum rechts der Isar, Munich, Germany Mo ¨hlstrasse 28, D–81675 Mu ¨nchen, Germany E-mail: boecker@neuro.med.tu-muenchen.de Summary There is conjoining experimental and clinical evidence supporting a fundamental role of the basal ganglia as a sensory analyser engaged in central somatosensory control. This study was aimed at investigating the functional anatomy of sensory processing in two clinical conditions characterized by basal ganglia dysfunction, i.e. Parkinson’s and Huntington’s disease. Based on previously recorded data of somatosensory evoked potentials, we expected deficient sensory-evoked activation in cortical areas that receive modulatory somatosensory input via the basal ganglia. Eight Parkinson’s disease patients, eight Huntington’s disease patients and eight healthy controls underwent repetitive H 2 15 O-PET activation scans during two experimental conditions in random order: (i) continuous unilateral high-frequency vibratory stimulation applied to the immobilized metacarpal joint of the index finger and (ii) rest (no vibratory stimulus). In the control cohort, the activation pattern was lateralized to the side opposite to stimulus presentation, including cortical [primary sensory cortex (S1); secondary sensory cortex (S2)] and subcortical (globus pallidus, ventrolateral thalamus) regional cerebral blood flow (rCBF) increases (P < 0.001). Between-group comparisons (P < 0.01) of vibration-induced rCBF changes Keywords: PET; activation; rCBF; sensory processing; movement disorders; Parkinson’s disease; Huntington’s disease Abbreviations: AIMS 5 Abnormal Involuntary Movement Scale; BA 5 Brodmann area; FDG 5 [ 18 F]fluorodeoxyglucose; HD-ADL 5 Huntington’s Disease Activities of Daily Living; M1 5 primary motor cortex; MPTP 5 1-methyl-4-phenyl- 1,2,3,6-tetrahydropyridine; MWT-B 5 Multiple Choice Word Test—B; SMA 5 supplementary motor area; SSEP 5 somatosensory evoked potential; S1 5 primary sensory cortex; S2 5 secondary sensory cortex; UHDRS 5 Unified Huntington’s Disease Rating Scale; UPDRS 5 Unified Parkinson’s Disease Rating Scale Introduction Parkinson’s disease and Huntington’s disease are both disorders with established basal ganglia pathology. In addition to characteristic motor signs, both entities are associated with © Oxford University Press 1999 between patients and controls revealed differences in central sensory processing: (i) in Parkinson’s disease, decreased activation of contralateral sensorimotor (S1/ M1) and lateral premotor cortex, contralateral S2, contralateral posterior cingulate, bilateral prefrontal cortex (Brodmann area 10) and contralateral basal ganglia; (ii) in Huntington’s disease, decreased activation of contralateral S2, parietal areas 39 and 40, and lingual gyrus, bilateral prefrontal cortex (Brodmann areas 8, 9, 10 and 44), S1 (trend only) and contralateral basal ganglia; (iii) in both clinical conditions relative enhanced activation of ipsilateral sensory cortical areas, notably caudal S1, S2 and insular cortex. Our data show that Parkinson’s disease and Huntington’s disease, beyond well-established deficits in central motor control, are characterized by abnormal cortical and subcortical activation on passive sensory stimulation. Furthermore, the finding that activation increases in ipsilateral sensory cortical areas may be interpreted as an indication of either altered central focusing and gating of sensory impulses, or enhanced compensatory recruitment of associative sensory areas in the presence of basal ganglia dysfunction. Altered sensory processing is thought to contribute to pertinent motor deficits in both conditions. variable degrees of sensory dysfunction. This is thought to be due, at least to some extent, to processing deficits at basal ganglia level and hence disturbed interaction within

Welcome message from author
This document is posted to help you gain knowledge. Please leave a comment to let me know what you think about it! Share it to your friends and learn new things together.
Transcript
Brain (1999),122,1651–1665
Sensory processing in Parkinson’s andHuntington’s diseaseInvestigations with 3D H215O-PET
H. Boecker,1 A. Ceballos-Baumann,1 P. Bartenstein,2 A. Weindl,1 H. R. Siebner,1 T. Fassbender,1
F. Munz,2 M. Schwaiger2 and B. Conrad1
Departments of1Neurology and2Nuclear Medicine, Correspondence to: Henning Boecker, MD, NeurologischeTechnical University of Munich, Klinikum rechts der Isar, Klinik, TU Mu¨nchen, Klinikum rechts der Isar,Munich, Germany Mo¨hlstrasse 28, D–81675 Mu¨nchen, Germany
E-mail: [email protected]
SummaryThere is conjoining experimental and clinical evidencesupporting a fundamental role of the basal ganglia as asensory analyser engaged in central somatosensorycontrol. This study was aimed at investigating thefunctional anatomy of sensory processing in two clinicalconditions characterized by basal ganglia dysfunction, i.e.Parkinson’s and Huntington’s disease. Based onpreviously recorded data of somatosensory evokedpotentials, we expected deficient sensory-evoked activationin cortical areas that receive modulatory somatosensoryinput via the basal ganglia. Eight Parkinson’s diseasepatients, eight Huntington’s disease patients and eighthealthy controls underwent repetitive H2
15O-PETactivation scans during two experimental conditions inrandom order: (i) continuous unilateral high-frequencyvibratory stimulation applied to the immobilizedmetacarpal joint of the index finger and (ii) rest (novibratory stimulus). In the control cohort, the activationpattern was lateralized to the side opposite to stimuluspresentation, including cortical [primary sensory cortex(S1); secondary sensory cortex (S2)] and subcortical(globus pallidus, ventrolateral thalamus) regional cerebralblood flow (rCBF) increases (P < 0.001). Between-groupcomparisons (P< 0.01) of vibration-induced rCBF changes
Keywords: PET; activation; rCBF; sensory processing; movement disorders; Parkinson’s disease; Huntington’s disease
Abbreviations: AIMS 5 Abnormal Involuntary Movement Scale; BA5 Brodmann area; FDG5 [18F]fluorodeoxyglucose;HD-ADL 5 Huntington’s Disease Activities of Daily Living; M15 primary motor cortex; MPTP5 1-methyl-4-phenyl-1,2,3,6-tetrahydropyridine; MWT-B5 Multiple Choice Word Test—B; SMA5 supplementary motor area; SSEP5somatosensory evoked potential; S15 primary sensory cortex; S25 secondary sensory cortex; UHDRS5 UnifiedHuntington’s Disease Rating Scale; UPDRS5 Unified Parkinson’s Disease Rating Scale
IntroductionParkinson’s disease and Huntington’s disease are bothdisorders with established basal ganglia pathology. In additionto characteristic motor signs, both entities are associated with
© Oxford University Press 1999
between patients and controls revealed differences incentral sensory processing: (i) in Parkinson’s disease,decreased activation of contralateral sensorimotor (S1/M1) and lateral premotor cortex, contralateral S2,contralateral posterior cingulate, bilateral prefrontalcortex (Brodmann area 10) and contralateral basalganglia; (ii) in Huntington’s disease, decreased activationof contralateral S2, parietal areas 39 and 40, and lingualgyrus, bilateral prefrontal cortex (Brodmann areas 8, 9,10 and 44), S1 (trend only) and contralateral basal ganglia;(iii) in both clinical conditions relative enhanced activationof ipsilateral sensory cortical areas, notably caudal S1,S2 and insular cortex. Our data show that Parkinson’sdisease and Huntington’s disease, beyond well-establisheddeficits in central motor control, are characterized byabnormal cortical and subcortical activation on passivesensory stimulation. Furthermore, the finding thatactivation increases in ipsilateral sensory cortical areasmay be interpreted as an indication of either alteredcentral focusing and gating of sensory impulses, orenhanced compensatory recruitment of associativesensory areas in the presence of basal ganglia dysfunction.Altered sensory processing is thought to contribute topertinent motor deficits in both conditions.
variable degrees of sensory dysfunction. This is thought tobe due, at least to some extent, to processing deficits atbasal ganglia level and hence disturbed interaction within
1652 H. Boeckeret al.
subcorticocortical networks, as is supported by conjoiningclinical, animal model and electrophysiological evidence.
In Parkinson’s disease, besides descriptions of subjectivesensory symptoms including numbness, coldness, burningor painful limb sensations (Koller, 1984), a number ofsomatosensory deficits have been described on objectiveclinical testing. These include inadequate kinaesthesis(Klockgetheret al., 1995; Demirciet al., 1997; Jobstet al.,1997), tracking and targeting movements on the basis ofsensory feedback (Schneideret al., 1986, 1987; Klockgetheret al., 1995), two-point discrimination (Schneideret al.,1986, 1987), roughness discrimination (Sathianet al., 1997),tactile stimulus location (Schneideret al., 1986),proprioception (Schneideret al., 1986; 1987; Jobstet al.,1997) and higher order proprioceptive integration, i.e.abnormal reflex and/or voluntary motor responses toproprioceptive signals (Rickards and Cody, 1997). Moreover,despite some controversy in the literature (Nakashimaet al.,1992; Huttunen and Teravainen, 1993; Droryet al., 1998)there have been documentations (Rossiniet al., 1989, 1993;de Mari et al., 1995; Traversaet al., 1995) of decreasedparietal N20 and frontal N30 components of somatosensoryevoked potentials (SSEP) that reverse after apomorphinechallenge (Rossiniet al., 1993; de Mariet al., 1995; Traversaet al., 1995) and chronicL-dopa therapy (Traversaet al.,1995). Analogous findings have been reported (Onofrjet al.,1990) in primates rendered parkinsonian with the neurotoxin1-methyl-4-phenyl-1,2,3,6-tetrahydropyridine (MPTP).
In contrast, clinical descriptions of sensory phenomena inHuntington’s disease are less consistent. There have beenreports on painful somatosensory limb phenomena (Albinand Young, 1988) along with other signs of perceptualsensory impairment, for instance, visual discriminationdeficits (Brouwerset al., 1984). On experimental testing,Huntington’s disease patients show response delays whenloadings are applied unexpectedly to objects held in precisiongrip, a finding that has been interpreted as an indication of‘a reduction in somatosensory input to cortex caused bydisruption of basal ganglia structures’ (Fellowset al., 1997).Even more consistently than in Parkinson’s disease, parietaland frontal SSEP amplitudes have been reported to bediminished or even absent in Huntington’s disease patients(Abbruzzeseet al., 1990; Yamadaet al., 1991; Topperet al.,1993) and analogous observations have been made in thequinolinic acid animal Huntington’s disease model (Schwarzet al., 1992). Interestingly, SSEP abnormalities inHuntington’s disease are evident even in at-risk subjects andpatients with early stages of disease and no clinical signs ofchorea (Nothet al., 1984). These observations at early stagesof disease, when cortical involvement is less pronounced,lend indirect support to the theory that cortical sensoryprocessing is affected by basal ganglia dysfunction.
Based on these converging findings, the aim of this studywas twofold: (i) to reinvestigate participation of the basalganglia during a robust vibratory stimulation paradigm inhealthy controls using 3D PET measurements, and (ii) to
determine differences in sensory evoked central activationpatterns in Parkinson’s disease and Huntington’s disease.As indicated by previous evoked potential recordings, weexpected to identify impaired activation in frontal andparietal areas.
Subjects and methodsSubjectsEight Parkinson’s disease patients (mean age 59.86 6.3years, five male, three female), eight Huntington’s diseasepatients (mean age 49.96 9.1 years, six male, two female)and eight healthy volunteers (mean age 51.86 9.0 years,five male, three female) were included in the study. Vibratorystimulation was applied to the dominant (right) side in eachcontrol subject. In order to enhance sensitivity for detectingdifferences between patients and controls, sensory stimulationin the patient groups was applied to the clinically mostaffected side. A priori, patients with major hyperkineticmotor signs were excluded from the study in order to ensureequal stimulus presentation in patients and controls. Allselected patients had been investigated prior to PET whileplaced in a comfortable lying position to exclude exacerbationof clinical signs in this position. During PET, on-line videowas used to monitor head and arm movements, andconsequently one Huntington’s disease patient had to beexcluded from subsequent analyses due to large amplitudehead movements towards the end of the PET session. Onecontrol subject withdrew because of claustrophobicsensations.
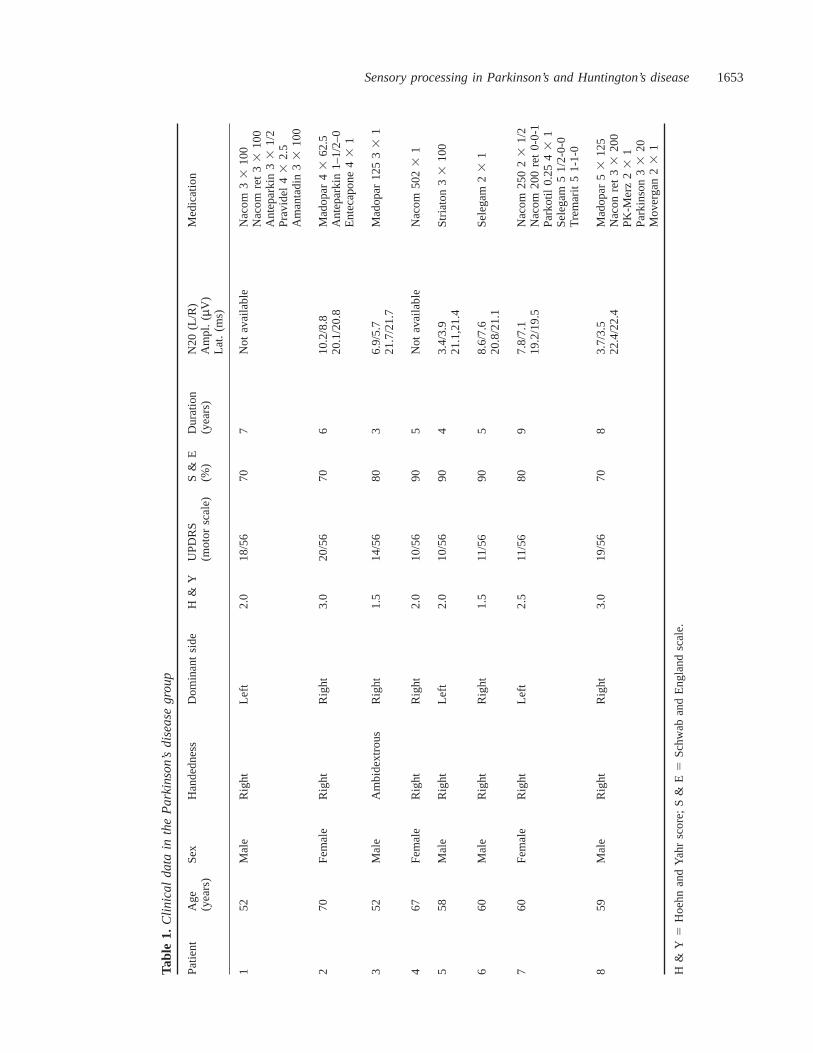
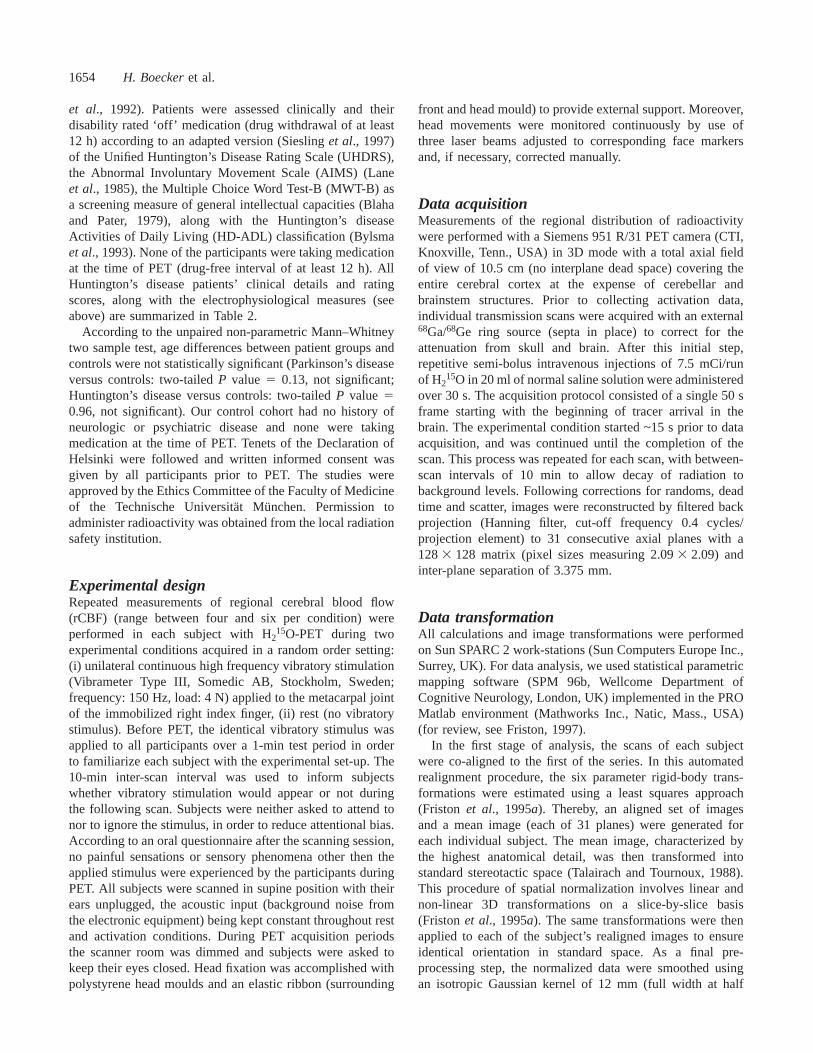
All Parkinson’s disease patients had experienced unilateraldisease onset and those patients under anti-parkinsonianmedication (n 5 7) wereL-dopa-sensitive. One patient (no. 6)had early, mild Parkinson’s disease, but characteristic right-dominant clinical signs had not been treated withL-dopa until the time of PET. Disability ‘off’ medication(drug withdrawal of at least 12 h) was rated according to theUnified Parkinson’s Disease Rating Scale, i.e. UPDRS motorscale (Fahnet al., 1987), the Hoehn and Yahr score (Fahnet al., 1987) and the Schwab and England scale (Fahnet al.,1987). Furthermore, bilateral latencies and amplitudes of theN20 component of median nerve SSEPs were recorded. Infour of the eight Parkinson’s disease patients, additional N30SEP components were recorded and three of these showedrelatively decreased amplitudes of the frontal N30 componentwhen stimulated on their dominant side. None of theParkinson’s disease patients were taking anti-parkinsonianmedication at the time of PET (drug-free interval of at least12 h). The Parkinson’s disease patients’ clinical details andrating scores are summarized in Table 1.
All Huntington’s disease patients had a positive familyhistory and their diagnosis was confirmed genetically bydetermination of CAG trinucleotide repeat lengthsù37(Duyao et al., 1993). In six of the eight patients, bicaudateindices were determined either on CT or MRI scans (Harris
Sensory processing in Parkinson’s and Huntington’s disease1653
Tabl
e1.
Clin
ica
ld
ata
inth
eP
ark
inso
n’s
dis
ea
seg
rou
p
Pat
ient
Age
Sex
Han
dedn
ess
Dom
inan
tsi
deH
&Y
UP
DR
SS
&E
Dur
atio
nN
20(L
/R)
Med
icat
ion
(yea
rs)
(mot
orsc
ale)
(%)
(yea
rs)
Am
pl.
(µV
)La
t.(m
s)
152
Mal
eR
ight
Left
2.0
18/5
670
7N
otav
aila
ble
Nac
om3
310
0N
acom
ret
3310
0A
ntep
arki
n33
1/2
Pra
vide
l43
2.5
Am
anta
din
3310
0
270
Fem
ale
Rig
htR
ight
3.0
20/5
670
610
.2/8
.8M
adop
ar4
362
.520
.1/2
0.8
Ant
epar
kin
1–1/
2–0
Ent
ecap
one
431
352
Mal
eA
mbi
dext
rous
Rig
ht1.
514
/56
803
6.9/
5.7
Mad
opar
125
33
121
.7/2
1.7
467
Fem
ale
Rig
htR
ight
2.0
10/5
690
5N
otav
aila
ble
Nac
om50
23
1
558
Mal
eR
ight
Left
2.0
10/5
690
43.
4/3.
9S
tria
ton
33
100
21.1
,21.
4
660
Mal
eR
ight
Rig
ht1.
511
/56
905
8.6/
7.6
Sel
egam
23
120
.8/2
1.1
760
Fem
ale
Rig
htLe
ft2.
511
/56
809
7.8/
7.1
Nac
om25
02
31/
219
.2/1
9.5
Nac
om20
0re
t0-
0-1
Par
kotil
0.25
431
Sel
egam
51/
2-0-
0T
rem
arit
51-
1-0
859
Mal
eR
ight
Rig
ht3.
019
/56
708
3.7/
3.5
Mad
opar
53
125
22.4
/22.
4N
acon
ret
3320
0P
K-M
erz
23
1P
arki
nson
3320
Mov
erga
n23
1
H&
Y5
Hoe
hnan
dY
ahr
scor
e;S
&E
5S
chw
aban
dE
ngla
ndsc
ale.
1654 H. Boeckeret al.
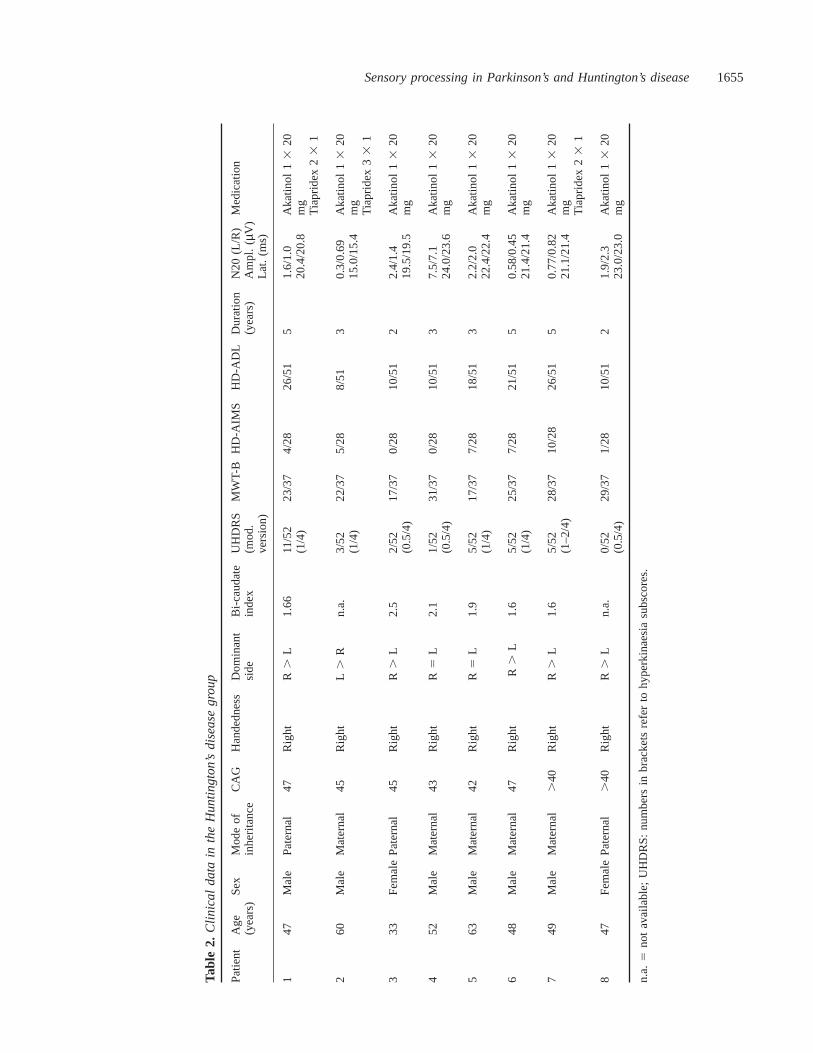
et al., 1992). Patients were assessed clinically and theirdisability rated ‘off’ medication (drug withdrawal of at least12 h) according to an adapted version (Sieslinget al., 1997)of the Unified Huntington’s Disease Rating Scale (UHDRS),the Abnormal Involuntary Movement Scale (AIMS) (Laneet al., 1985), the Multiple Choice Word Test-B (MWT-B) asa screening measure of general intellectual capacities (Blahaand Pater, 1979), along with the Huntington’s diseaseActivities of Daily Living (HD-ADL) classification (Bylsmaet al., 1993). None of the participants were taking medicationat the time of PET (drug-free interval of at least 12 h). AllHuntington’s disease patients’ clinical details and ratingscores, along with the electrophysiological measures (seeabove) are summarized in Table 2.
According to the unpaired non-parametric Mann–Whitneytwo sample test, age differences between patient groups andcontrols were not statistically significant (Parkinson’s diseaseversus controls: two-tailedP value 5 0.13, not significant;Huntington’s disease versus controls: two-tailedP value 50.96, not significant). Our control cohort had no history ofneurologic or psychiatric disease and none were takingmedication at the time of PET. Tenets of the Declaration ofHelsinki were followed and written informed consent wasgiven by all participants prior to PET. The studies wereapproved by the Ethics Committee of the Faculty of Medicineof the Technische Universita¨t Munchen. Permission toadminister radioactivity was obtained from the local radiationsafety institution.
Experimental designRepeated measurements of regional cerebral blood flow(rCBF) (range between four and six per condition) wereperformed in each subject with H2
15O-PET during twoexperimental conditions acquired in a random order setting:(i) unilateral continuous high frequency vibratory stimulation(Vibrameter Type III, Somedic AB, Stockholm, Sweden;frequency: 150 Hz, load: 4 N) applied to the metacarpal jointof the immobilized right index finger, (ii) rest (no vibratorystimulus). Before PET, the identical vibratory stimulus wasapplied to all participants over a 1-min test period in orderto familiarize each subject with the experimental set-up. The10-min inter-scan interval was used to inform subjectswhether vibratory stimulation would appear or not duringthe following scan. Subjects were neither asked to attend tonor to ignore the stimulus, in order to reduce attentional bias.According to an oral questionnaire after the scanning session,no painful sensations or sensory phenomena other then theapplied stimulus were experienced by the participants duringPET. All subjects were scanned in supine position with theirears unplugged, the acoustic input (background noise fromthe electronic equipment) being kept constant throughout restand activation conditions. During PET acquisition periodsthe scanner room was dimmed and subjects were asked tokeep their eyes closed. Head fixation was accomplished withpolystyrene head moulds and an elastic ribbon (surrounding
front and head mould) to provide external support. Moreover,head movements were monitored continuously by use ofthree laser beams adjusted to corresponding face markersand, if necessary, corrected manually.
Data acquisitionMeasurements of the regional distribution of radioactivitywere performed with a Siemens 951 R/31 PET camera (CTI,Knoxville, Tenn., USA) in 3D mode with a total axial fieldof view of 10.5 cm (no interplane dead space) covering theentire cerebral cortex at the expense of cerebellar andbrainstem structures. Prior to collecting activation data,individual transmission scans were acquired with an external68Ga/68Ge ring source (septa in place) to correct for theattenuation from skull and brain. After this initial step,repetitive semi-bolus intravenous injections of 7.5 mCi/runof H2
15O in 20 ml of normal saline solution were administeredover 30 s. The acquisition protocol consisted of a single 50 sframe starting with the beginning of tracer arrival in thebrain. The experimental condition started ~15 s prior to dataacquisition, and was continued until the completion of thescan. This process was repeated for each scan, with between-scan intervals of 10 min to allow decay of radiation tobackground levels. Following corrections for randoms, deadtime and scatter, images were reconstructed by filtered backprojection (Hanning filter, cut-off frequency 0.4 cycles/projection element) to 31 consecutive axial planes with a1283 128 matrix (pixel sizes measuring 2.093 2.09) andinter-plane separation of 3.375 mm.
Data transformationAll calculations and image transformations were performedon Sun SPARC 2 work-stations (Sun Computers Europe Inc.,Surrey, UK). For data analysis, we used statistical parametricmapping software (SPM 96b, Wellcome Department ofCognitive Neurology, London, UK) implemented in the PROMatlab environment (Mathworks Inc., Natic, Mass., USA)(for review, see Friston, 1997).
In the first stage of analysis, the scans of each subjectwere co-aligned to the first of the series. In this automatedrealignment procedure, the six parameter rigid-body trans-formations were estimated using a least squares approach(Friston et al., 1995a). Thereby, an aligned set of imagesand a mean image (each of 31 planes) were generated foreach individual subject. The mean image, characterized bythe highest anatomical detail, was then transformed intostandard stereotactic space (Talairach and Tournoux, 1988).This procedure of spatial normalization involves linear andnon-linear 3D transformations on a slice-by-slice basis(Fristonet al., 1995a). The same transformations were thenapplied to each of the subject’s realigned images to ensureidentical orientation in standard space. As a final pre-processing step, the normalized data were smoothed usingan isotropic Gaussian kernel of 12 mm (full width at half
Sensory processing in Parkinson’s and Huntington’s disease1655
Tabl
e2.
Clin
ica
ld
ata
inth
eH
un
ting
ton
’sd
ise
ase
gro
up
Pat
ient
Age
Sex
Mod
eof
CA
GH
ande
dnes
sD
omin
ant
Bi-c
auda
teU
HD
RS
MW
T-B
HD
-AIM
SH
D-A
DL
Dur
atio
nN
20(L
/R)
Med
icat
ion
(yea
rs)
inhe
ritan
cesi
dein
dex
(mod
.(y
ears
)A
mpl
.(
µV)
vers
ion)
Lat.
(ms)
147
Mal
eP
ater
nal
47R
ight
R.L
1.66
11/5
223
/37
4/28
26/5
15
1.6/
1.0
Aka
tinol
13
20(1
/4)
20.4
/20.
8m
gT
iapr
idex
23
1
260
Mal
eM
ater
nal
45R
ight
L.R
n.a.
3/52
22/3
75/
288/
513
0.3/
0.69
Aka
tinol
13
20(1
/4)
15.0
/15.
4m
gT
iapr
idex
33
1
333
Fem
ale
Pat
erna
l45
Rig
htR.
L2.
52/
5217
/37
0/28
10/5
12
2.4/
1.4
Aka
tinol
1320
(0.5
/4)
19.5
/19.
5m
g
452
Mal
eM
ater
nal
43R
ight
R5L
2.1
1/52
31/3
70/
2810
/51
37.
5/7.
1A
katin
ol13
20(0
.5/4
)24
.0/2
3.6
mg
563
Mal
eM
ater
nal
42R
ight
R5L
1.9
5/52
17/3
77/
2818
/51
32.
2/2.
0A
katin
ol13
20(1
/4)
22.4
/22.
4m
g
648
Mal
eM
ater
nal
47R
ight
R.L
1.6
5/52
25/3
77/
2821
/51
50.
58/0
.45
Aka
tinol
13
20(1
/4)
21.4
/21.
4m
g
749
Mal
eM
ater
nal
.40
Rig
htR
.L
1.6
5/52
28/3
710
/28
26/5
15
0.77
/0.8
2A
katin
ol1
320
(1–2
/4)
21.1
/21.
4m
gT
iapr
idex
23
1
847
Fem
ale
Pat
erna
l.
40R
ight
R.
Ln.
a.0/
5229
/37
1/28
10/5
12
1.9/
2.3
Aka
tinol
13
20(0
.5/4
)23
.0/2
3.0
mg
n.a.
5no
tav
aila
ble;
UH
DR
S:
num
bers
inbr
acke
tsre
fer
tohy
perk
inae
sia
subs
core
s.
1656 H. Boeckeret al.
maximum) to increase signal to noise ratio and to reducevariance due to individual differences in gyral anatomy(Fristonet al., 1995a). The resulting normalized and smoothedimages contained 26 planes with pixel sizes of 23 2 mmand inter-plane distances of 4 mm. In patients with left-sided stimulation, data were flipped prior to group statisticalanalyses.
Statistical analysisTo remove the effect of variations in global flow acrosssubjects and scans, an analysis of covariance (ANCOVA)was applied with global flow as the confounding variable.(Fristonet al., 1990, 1995b). Subsequently, mean rCBF wasscaled to an arbitrary level of 50 ml/100 ml/min and theseadjusted rCBF voxel values were used for further statisticalanalyses. To test our hypothesis about condition specificregional effects, appropriately weighted formal categoricalcomparisons between resting and activation conditions wereperformed in each of the three individual groups (i.e. withingroup subtraction analyses). Each resulting set of voxel valuesconstitutes an SPM{t} map which was then transformed intonormally distributedZ statistics (Fristonet al., 1995b; Friston,1997) The significance of each SPM{Z} contrast wasestimated by comparison of the observed and expectedt statistic under the null hypothesis (Friston, 1997).
Since the pattern of rCBF changes induced by theexperimental condition (i.e. unilateral high-frequencyvibration) has been established in healthy control subjectswith previous functional neuroimaging (for review, seePaulesuet al., 1997), an anatomically constrained hypothesiswas used and only activation foci within this network[i.e. including primary sensory cortex (S1), adjoining parietalcortical areas, secondary sensory cortex (S2), insular cortex,supplementary motor area (SMA), thalamus and basalganglia; this latter area was predicted on the basis ofelectrophysiological recordings, as referred to in thediscussion] that were significant at a height threshold ofP , 0.001 (uncorrected) or better were reported in theindividual groups. This hypothesis-based approach was alsoapplied to both patient groups, based on previous vibratoryactivation studies in other movement disorder conditions(Tempel and Perlmutter, 1990, 1993; Catalanet al., 1998)that revealed either local magnitude changes of vibratory-induced rCBF increases or local activation shifts withincomponents of pre-established cortical sensory areas. Similarhypothesis-driven approaches have been applied in severalother PET imaging studies for their potential of reducingfalse-negative findings; this is of particular relevance whenless activating, i.e. passive stimulation, designs are employed,as in this study. A statistical threshold ofP , 0.001(uncorrected) was applied for activation decreases, based onpreviously reported activation decreases in superior parietalcortex bilaterally, in paralimbic association areas, left globuspallidus (Seitzet al., 1992) and in ipsilateral S1 (for review,see Paulesuet al., 1997).
To assess specific differences in vibration-inducedactivation changes between the patient groups and the controlcohort, between-group subtraction analyses were performedand thresholded atP , 0.01 (uncorrected).
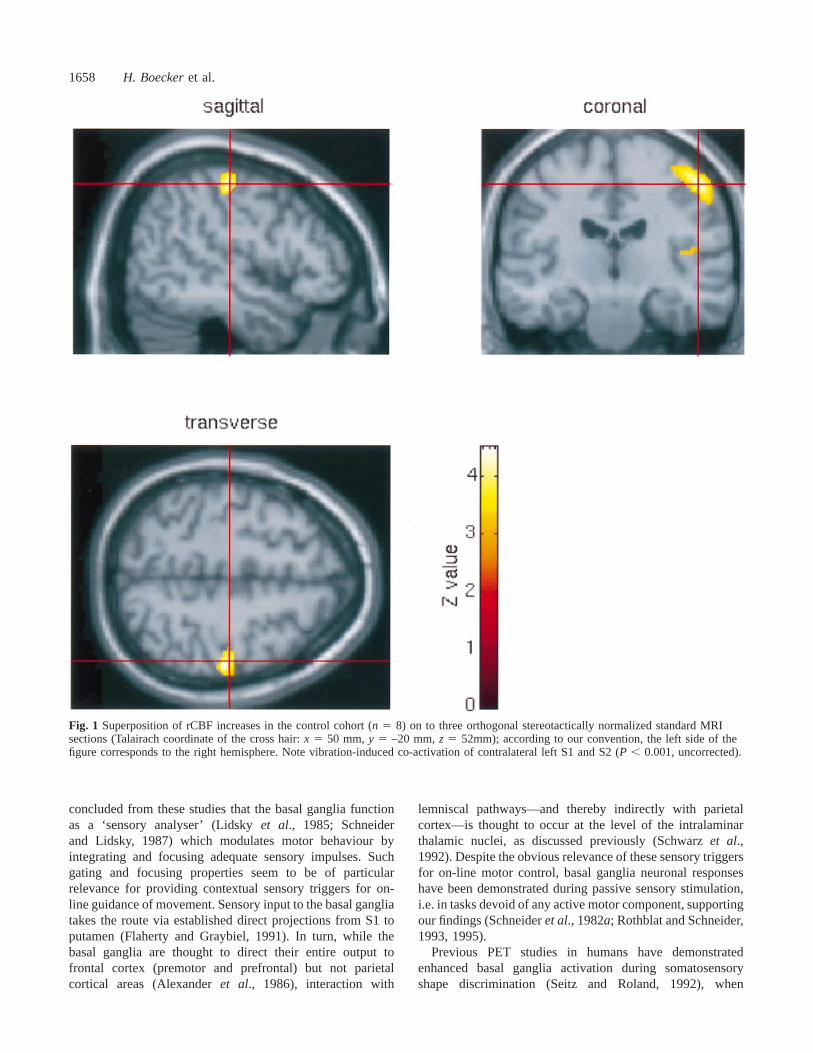
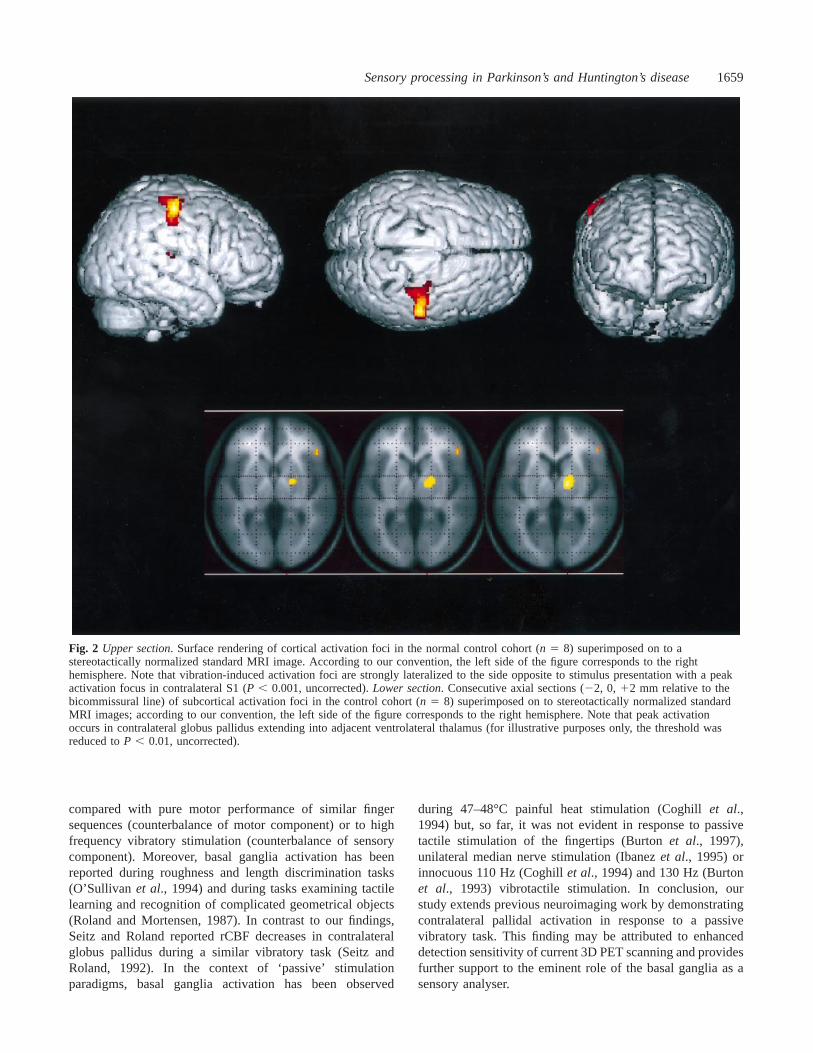
ResultsControl group (within-group subtractionanalyses)In the control cohort, the pattern of activation was stronglylateralized to the side opposite to vibratory stimuluspresentation. Significant cortical activation foci includedcontralateral S1 and S2. Other cortical areas within thehypothesized sensory network were below the set level ofsignificance, for instance, caudal SMA (P 5 0.008, trendonly). No unpredicted activation foci outside the hypothesizednetwork were observed. Subcortical peak activation was seenin contralateral globus pallidus, the cluster extending intoadjacent left ventrolateral thalamus. Detection and separationof individual peaks, however, within this subcortical clusterwas not possible. No significant rCBF decreases induced byvibration were observed in the control group, only a trendtowards decreased rCBF in ipsilateral S1 (P , 0.002, trendonly). All results, includingZ scores,P values, pixels valuesper cluster andx, y, z coordinates of respective rCBF changesare summarized in Table 3. For visualization purposes,cortical activation changes are superimposed on to threeorthogonal standard MRI sections (Fig. 1) and projected ona single volume rendered MRI (Fig. 2, upper section);subcortical (basal ganglia, thalamus) rCBF increases aresuperimposed on to three consecutive normalized MRI slices(Fig. 2, lower section); Fig. 3A demonstrates the entire SPMset by comparison with the patient group data (Fig. 3B andC) as maximum intensity projections.
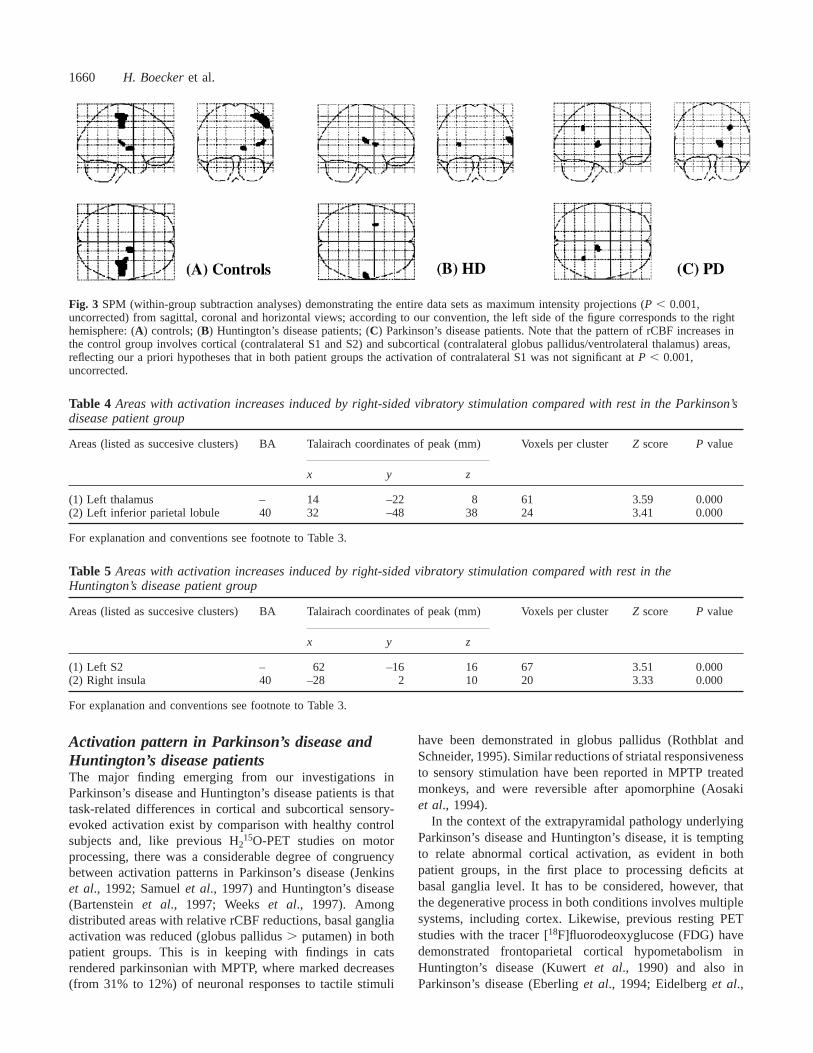
Patient groups (within-group subtractionanalyses)While significant rCBF increases were observed withincortical and subcortical components of the hypothesizedsensory network, contralateral S1 did not reach thesignificance level ofP , 0.001 in either of the two patientgroups (Tables 4 and 5). Moreover, the pattern of vibration-induced rCBF increases in both groups was characterized bya tendency of enhanced recruitment of ipsilateral (right)insular cortex in Huntington’s disease (P , 0.001,Z 5 3.33)and in Parkinson’s disease (P , 0.002, Z 5 2.92, trendonly). Activation of basal ganglia structures was observedneither in Parkinson’s disease nor in Huntington’s disease.All results are summarized in Table 4 (Parkinson’s disease)and Table 5 (Huntington’s disease), and as correspondingSPM maps (maximum intensity projections of the entirewithin-group SPM set) displayed in Fig. 3B (Huntington’sdisease) and Fig. 3C (Parkinson’s disease).
Sensory processing in Parkinson’s and Huntington’s disease1657
Table 3 Areas with activation increases induced by right-sided vibratory stimulation compared with rest in the controlgroup
Areas (listed as successive clusters) BA Talairach coordinates of peak (mm) Voxels per clusterZ score P value
x y z
(1) Left S1 3 50 –20 52 482 4.51 0.0003 38 –26 62 – 3.61 0.000
(2) Left GP/VL-thalalmus – 14 –8 2 68 3.64 0.000(3) Left S2 – 44 –20 12 42 3.43 0.000
P , 0.001, uncorrected, is considered significant if belonging to the predetermined sensory network; see Subjects and methods. Clustersof activation including regional peaks in the categorical comparison are listed in consecutive order. Cerebellar peaks are not includedsince this region was not covered by the field of view of the PET camera. The coordinatesx, y, z express the position of activation fociin millimetres relative to the anterior commissure (AC) in the stereotactic space (Talairach and Tournoux, 1988);x, according to ourconvention, corresponds to the lateral distance from the midline (1 5 left; 2 5 right), y to the anteroposterior distance from the AC(1 5 anterior, –5 posterior) andz to the height relative to the AC line (1 5 above, –5 below).
Patient groups versus controls (between-groupsubtraction analyses)There were significant relative differences in vibration-evokedrCBF between patients and controls that can be summarizedas follows: (i) in Huntington’s disease, relatively decreasedactivation of contralateral S2 (P , 0.001), S1 (P ø 0.012,trend only), parietal areas 39 and 40 (P , 0.001), and lingualgyrus (P , 0.001), bilateral prefrontal cortical areas 8, 9, 10and 44 (P ø 0.002), along with decreased activation ofcontralateral basal ganglia (putamen and globus pallidus,P ø 0.003); (ii) in Parkinson’s disease, relatively decreasedactivation of contralateral sensorimotor cortex (S1/M1)(P , 0.001), lateral premotor cortex (P ø 0.003), S2(P ø 0.005), contralateral posterior cingulate (P ø 0.001),bilateral prefrontal cortex [Brodman area (BA) 10;P ø 0.007] and contralateral basal ganglia (globus pallidus:P ø 0.008; putamen:P ø 0.019, trend only); (iii) in bothentities, relatively enhanced activation of ipsilateral sensorycortical areas, notably caudal S1 (P ø 0.001), S2 (P ø 0.002)and insular cortex (P ø 0.002). The data are summarized inTable 6 (relative activation differences between Parkinson’sdisease patients and controls) and Table 7 (relative activationdifferences between Huntington’s disease patients andcontrols).
DiscussionActivation pattern in control subjectsThe pattern of brain activation induced by unilateral high-frequency passive vibratory stimulation in our control cohortis in keeping with previous PET data on elementarysomatosensory function, as reviewed recently by Paulesu andcolleagues (Paulesuet al., 1997). Our study confirms thatthis rather crude sensory stimulus produces strong activationin cortical areas S1 and S2. The pattern of normalized grouprCBF increases in our study was markedly lateralized tothe contralateral hemisphere, similar to previous reports(Seitz and Roland, 1992). Transcallosal connections have,
nevertheless, been demonstrated in posterior S1 (BA 2)(Iwamura et al., 1994), adjoining parietal cortex andsecondary sensory cortical areas (S2, insular cortex) and,likewise, previous PET (Burtonet al., 1993) and functionalMRI (Boecker et al., 1995) experiments have providedevidence for bilateral sensory cortical processing in humans.However, it remains an issue of further inquiry with highertemporal resolution imaging modalities, how ipsilateralsensory area recruitment is affected by habituation and/orother task-related issues. For instance, evoked potentialrecordings in cats indicate that habituation occurs morerapidly in S2 compared with S1 areas (Chernigovskiiet al.,1979).
Medial premotor cortex activation, in this study, was onlydetectable as a trend in caudal SMA territory. While this isin line with monkey recording data showing that SMAneurons respond nearly exclusively to sensory cues that arerelevant for motor control (Romoet al., 1993), moresignificant SMA activation has been observed previously onpassive high frequency vibratory tasks (Seitz and Roland,1992). Seitz and Roland attributed the co-activation ofprimary motor cortex (M1) and SMA to reflectory graspingof the stimulated hand (Seitz and Roland, 1992). No spilloverof activation to M1 cortex was observed in our study and,therefore, task-related issues, for instance, the immobilizationimposed on the stimulated hand, are to be considered wheninterpreting differences between these studies.
A new aspect of the ‘physiological’ activation patternseen in healthy control subjects was the participation ofcontralateral globus pallidus. That the basal ganglia, beyondwell established motor-related functions, are actively involvedin sensory processing is evident from neuronal recordings(from striatum and globus pallidus) in different non-humanspecies, including rats (Schneideret al., 1982a), cats(Sedgwick and Williams, 1967; Schneider and Lidsky, 1981;Schneideret al., 1982b; Lidsky et al., 1985; Rothblat andSchneider, 1993) and monkeys (Romoet al., 1995) (forreview, see Rothblat and Schneider, 1995). It has been
1658 H. Boeckeret al.
Fig. 1 Superposition of rCBF increases in the control cohort (n 5 8) on to three orthogonal stereotactically normalized standard MRIsections (Talairach coordinate of the cross hair:x 5 50 mm,y 5 –20 mm,z 5 52mm); according to our convention, the left side of thefigure corresponds to the right hemisphere. Note vibration-induced co-activation of contralateral left S1 and S2 (P , 0.001, uncorrected).
concluded from these studies that the basal ganglia functionas a ‘sensory analyser’ (Lidskyet al., 1985; Schneiderand Lidsky, 1987) which modulates motor behaviour byintegrating and focusing adequate sensory impulses. Suchgating and focusing properties seem to be of particularrelevance for providing contextual sensory triggers for on-line guidance of movement. Sensory input to the basal gangliatakes the route via established direct projections from S1 toputamen (Flaherty and Graybiel, 1991). In turn, while thebasal ganglia are thought to direct their entire output tofrontal cortex (premotor and prefrontal) but not parietalcortical areas (Alexanderet al., 1986), interaction with
lemniscal pathways—and thereby indirectly with parietalcortex—is thought to occur at the level of the intralaminarthalamic nuclei, as discussed previously (Schwarzet al.,1992). Despite the obvious relevance of these sensory triggersfor on-line motor control, basal ganglia neuronal responseshave been demonstrated during passive sensory stimulation,i.e. in tasks devoid of any active motor component, supportingour findings (Schneideret al., 1982a; Rothblat and Schneider,1993, 1995).
Previous PET studies in humans have demonstratedenhanced basal ganglia activation during somatosensoryshape discrimination (Seitz and Roland, 1992), when
Sensory processing in Parkinson’s and Huntington’s disease1659
Fig. 2 Upper section. Surface rendering of cortical activation foci in the normal control cohort (n 5 8) superimposed on to astereotactically normalized standard MRI image. According to our convention, the left side of the figure corresponds to the righthemisphere. Note that vibration-induced activation foci are strongly lateralized to the side opposite to stimulus presentation with a peakactivation focus in contralateral S1 (P , 0.001, uncorrected).Lower section. Consecutive axial sections (22, 0, 12 mm relative to thebicommissural line) of subcortical activation foci in the control cohort (n 5 8) superimposed on to stereotactically normalized standardMRI images; according to our convention, the left side of the figure corresponds to the right hemisphere. Note that peak activationoccurs in contralateral globus pallidus extending into adjacent ventrolateral thalamus (for illustrative purposes only, the threshold wasreduced toP , 0.01, uncorrected).
compared with pure motor performance of similar fingersequences (counterbalance of motor component) or to highfrequency vibratory stimulation (counterbalance of sensorycomponent). Moreover, basal ganglia activation has beenreported during roughness and length discrimination tasks(O’Sullivan et al., 1994) and during tasks examining tactilelearning and recognition of complicated geometrical objects(Roland and Mortensen, 1987). In contrast to our findings,Seitz and Roland reported rCBF decreases in contralateralglobus pallidus during a similar vibratory task (Seitz andRoland, 1992). In the context of ‘passive’ stimulationparadigms, basal ganglia activation has been observed
during 47–48°C painful heat stimulation (Coghillet al.,1994) but, so far, it was not evident in response to passivetactile stimulation of the fingertips (Burtonet al., 1997),unilateral median nerve stimulation (Ibanezet al., 1995) orinnocuous 110 Hz (Coghillet al., 1994) and 130 Hz (Burtonet al., 1993) vibrotactile stimulation. In conclusion, ourstudy extends previous neuroimaging work by demonstratingcontralateral pallidal activation in response to a passivevibratory task. This finding may be attributed to enhanceddetection sensitivity of current 3D PET scanning and providesfurther support to the eminent role of the basal ganglia as asensory analyser.
1660 H. Boeckeret al.
Fig. 3 SPM (within-group subtraction analyses) demonstrating the entire data sets as maximum intensity projections (P , 0.001,uncorrected) from sagittal, coronal and horizontal views; according to our convention, the left side of the figure corresponds to the righthemisphere: (A) controls; (B) Huntington’s disease patients; (C) Parkinson’s disease patients. Note that the pattern of rCBF increases inthe control group involves cortical (contralateral S1 and S2) and subcortical (contralateral globus pallidus/ventrolateral thalamus) areas,reflecting our a priori hypotheses that in both patient groups the activation of contralateral S1 was not significant atP , 0.001,uncorrected.
Table 4 Areas with activation increases induced by right-sided vibratory stimulation compared with rest in the Parkinson’sdisease patient group
Areas (listed as succesive clusters) BA Talairach coordinates of peak (mm) Voxels per clusterZ score P value
x y z
(1) Left thalamus – 14 –22 8 61 3.59 0.000(2) Left inferior parietal lobule 40 32 –48 38 24 3.41 0.000
For explanation and conventions see footnote to Table 3.
Table 5 Areas with activation increases induced by right-sided vibratory stimulation compared with rest in theHuntington’s disease patient group
Areas (listed as succesive clusters) BA Talairach coordinates of peak (mm) Voxels per clusterZ score P value
x y z
(1) Left S2 – 62 –16 16 67 3.51 0.000(2) Right insula 40 –28 2 10 20 3.33 0.000
For explanation and conventions see footnote to Table 3.
Activation pattern in Parkinson’s disease andHuntington’s disease patientsThe major finding emerging from our investigations inParkinson’s disease and Huntington’s disease patients is thattask-related differences in cortical and subcortical sensory-evoked activation exist by comparison with healthy controlsubjects and, like previous H2
15O-PET studies on motorprocessing, there was a considerable degree of congruencybetween activation patterns in Parkinson’s disease (Jenkinset al., 1992; Samuelet al., 1997) and Huntington’s disease(Bartenstein et al., 1997; Weekset al., 1997). Amongdistributed areas with relative rCBF reductions, basal gangliaactivation was reduced (globus pallidus. putamen) in bothpatient groups. This is in keeping with findings in catsrendered parkinsonian with MPTP, where marked decreases(from 31% to 12%) of neuronal responses to tactile stimuli
have been demonstrated in globus pallidus (Rothblat andSchneider, 1995). Similar reductions of striatal responsivenessto sensory stimulation have been reported in MPTP treatedmonkeys, and were reversible after apomorphine (Aosakiet al., 1994).
In the context of the extrapyramidal pathology underlyingParkinson’s disease and Huntington’s disease, it is temptingto relate abnormal cortical activation, as evident in bothpatient groups, in the first place to processing deficits atbasal ganglia level. It has to be considered, however, thatthe degenerative process in both conditions involves multiplesystems, including cortex. Likewise, previous resting PETstudies with the tracer [18F]fluorodeoxyglucose (FDG) havedemonstrated frontoparietal cortical hypometabolism inHuntington’s disease (Kuwertet al., 1990) and also inParkinson’s disease (Eberlinget al., 1994; Eidelberget al.,
Sensory processing in Parkinson’s and Huntington’s disease1661
Table 6 Areas with relative differences in vibratory-induced activation between Parkinson’s disease patients and controls
Areas (listed as succesive clusters) BA Talairach coordinates of peak (mm) Voxels per clusterZ score P value
x y z
Areas with relatively enhanced activation in controls compared with Parkinson’s disease(1) Left M1/S1 4, 3 60 –10 46 114 3.45 0.000
Left premotor cortex 6 62 –8 38 – 2.71 0.003Left S1 1, 2 56 –20 48 – 2.59 0.005
(2) Left posterior cingulate 31 6 –42 34 132 3.28 0.001(3) Left medial frontal gyrus 10 28 60 20 89 3.12 0.001
10 28 50 20 – 2.99 0.001(4) Left S2 – 52 –24 16 24 2.58 0.005(5) Right superior frontal gyrus 10 –22 64 14 9 2.46 0.007(6) Left globus pallidus – 12 –8 4 3 2.42 0.008
Areas with relatively enhanced activation in Parkinson’s disease compared with controls(1) Right M1/S1 4, 3 –54 –6 26 48 3.15 0.001(2) Right S1 2 –36 –20 40 44 2.88 0.002(3) Right S2 – –48 –22 12 14 2.88 0.002(4) Right M1 4 –32 –8 52 31 2.61 0.004
P , 0.01, uncorrected, is considered significant; see Subjects and methods. For explanation and conventions see footnote to Table 3.
Table 7 Areas with relative differences in vibratory-induced activation between Huntington’s disease patients and controls
Areas (listed as succesive clusters) BA Talairach coordinates of peak (mm) Voxels per clusterZ score P value
x y z
Areas with relatively enhanced activation in controls compared with Parkinson’s disease(1) Left S2, insula – 42 –18 8 142 3.56 0.000(2) Left inferior parietal lobule 39,40 62 –54 26 40 3.52 0.000(3) Left lingual gyrus 19 16 –44 –2 165 3.52 0.000(4) Right superior frontal gyrus 9 –4 58 36 248 3.43 0.000
8 –12 52 40 – 3.17 0.00110 –8 62 26 – 2.83 0.002
(5) Left superior frontal gyrus 10 28 62 12 206 3.38 0.000Left medial frontal gyrus 10,44 40 46 0 – 3.28 0.001
(6) Left globus pallidus – 14 –6 2 66 2.86 0.002Left putamen/pallidus – 22 –4 –2 – 2.76 0.003
(7) Left inferior parietal lobe 39 52 –66 34 25 2.63 0.004
Areas with relatively enhanced activation in Parkinson’s disease compared with controls(1) Right caudal S1 1,3 –56 –12 24 64 3.17 0.001(2) Right posterior insula – –30 0 10 34 2.83 0.002(3) Right postcentral gyrus 40 64 –16 18 20 2.69 0.004(4) Right occipital gyrus 19 –30 –80 26 – 2.52 0.006
P , 0.01, uncorrected, is considered significant; see Subjects and methods. For explanation and conventions see footnote to Table 3.
1994), which implies that cortical pathology may havecontributed to our findings as well. Nevertheless, as has beendiscussed in the context of Huntington’s disease previously,several independent arguments support the specific relevanceof basal ganglia dysfunction for alterations of cortical sensoryprocessing: (i) the characteristic frontal and parietal SSEPchanges that have been observed in Huntington’s diseasepatients with manifest disease were also evident in at-risksubjects (Nothet al., 1984; Yamadaet al., 1991), at a stagewhere cortical involvement is less prominent; (ii) pertinentSSEP findings correlate significantly with reductions ofcaudate and lentiform glucose metabolism measured with
FDG PET (Kuwert et al., 1993); (iii) data from theexperimental Huntington’s disease model in rats withexcitotoxic striatal damage demonstrate that basal gangliadysfunction alone is sufficient to induce equivalent alterationsof evoked potentials (Schwarzet al., 1992). In this respect,it is of considerable interest that reductions of parietaland frontal SSEP components have also been observed inParkinson’s disease patients (Rossiniet al., 1989, 1993; deMari et al., 1995; Traversaet al., 1995) and in primatesrendered parkinsonian with MPTP (Onofrjet al., 1990).
Parkinson’s disease and Huntington’s disease patients bothshowed significant, mainly contralateral, decreases of
1662 H. Boeckeret al.
vibratory-evoked activation in parietal and frontal corticalareas. At parietal sites, decreased activation includedcontralateral S1 and S2, and in the Huntington’s diseasepatient group there were additional relative activationdecreases in contralateral parietal areas 39 and 40. Processingof complex multidimensional sensory stimuli, as studied here,is neither spatially nor functionally restricted to S1, but ratherinvolves adjoining parietal cortex, where furthersomatosensory processing and integration occurs (for review,see Paulesuet al., 1997). Therefore, when considering thespatial extension of rCBF decreases, parietal cortex, involvingmultiple areas, appeared to be more extensively affected inthe Huntington’s disease group.
According to our a priori hypothesis, impaired premotorcortex activation was predicted in both patient groups,considering frontal amplitude decreases observed on evokedpotential recordings in Huntington’s disease (Abbruzzeseet al., 1990; Yamadaet al., 1991; Topperet al., 1993) andParkinson’s disease (Rossiniet al., 1989; de Mariet al.,1995). In fact, it has been argued that the frontal P20–N30–P40 complex is generated, ‘at least in part, with a cortico-subcortico-cortical re-entry loop involving the supplementarymotor area, the basal ganglia, the primary motor cortex, andthe ventrolateral thalamic nuclei’ (Rossiniet al., 1993).Abnormal frontostriatal function ‘could impact on thedecision process that operates on incoming sensory input todeliver an externally recognisable response’ (Sathianet al.,1997). However, in our study no relative reductions ofsensory-evoked rCBF were detectable in SMA territory.While lateral premotor cortex showed relative hypoactivityin the Parkinson’s disease patient group, this was not thecase in the Huntington’s disease group. Clearly, futureimaging studies with more elaborate paradigms are required todetermine the precise role of premotor cortex for sensorimotorintegration processes and the influence of subcorticalpathology on pertinent functions. Significant frontal activationdecreases were observed at prefrontal sites. While currentevidence suggests that the basal ganglia direct their outputvia at least five segregated loops to different portions of thefrontal lobe (Alexander and Crutcher, 1990), we cannot ruleout the possibility that prefrontal activation changes haveoccurred as a consequence of frontal cortical dysfunction(Kuwert et al., 1990; Eberlinget al., 1994; Eidelberget al.,1994) and/or cognitive aspects of task processing.
Another remarkable observation on between-groupanalyses is that of relative enhanced activation of ipsilateralcortical sensory areas, notably of caudal S1, S2 and insularcortex in both patient groups. These ipsilateral activationincreases result from differing hemispheric activation patternsbetween patients and controls. In fact, within group analysesrevealed a more bilaterally distributed pattern of rCBFincreases in both patient groups, compared with a verylateralized activation pattern in the control group. Moreover,there was a tendency towards ipsilateral S1 rCBF decreasesin the control cohort—a phenomenon observed by otherinvestigators as well (for review, see Paulesuet al., 1997)—
which together are thought to account for our ipsilateralfindings. We can only carefully speculate about the meaningof these observations, but, considering focusing and gatingfunctions of basal ganglia (outlined before), they may beinterpreted as an indication of either altered central focusingand/or enhanced compensatory recruitment of associativesensory areas, in the presence of basal ganglia dysfunction.Similar rCBF findings indicating enhanced associative arearecruitment in the presence of basal ganglia disorders havebeen reported recently on motor tasks (Bartensteinet al.,1997; Samuelet al., 1997; Weekset al., 1997); of particularinterest, relative insular overactivity of nearly identicaldistribution has been shown in Huntington’s disease patientsperforming a free-selection joystick task (Weekset al., 1997).While relative insular overactivity has also been demonstratedon motor tasks in patients with motor neuron disease (Kewet al., 1993) following striatocapsular stroke (Weilleret al.,1992), idiopathic dystonia (Ceballos-Baumannet al., 1995b)and acquired hemidystonia (Ceballos-Baumannet al., 1995a),it is an interesting finding that similar relative activationincreases occur on pure sensory processing tasks, as shownin our study. It is tempting to interpret relative insularoveractivity as a form of polymodal functional adaptationoccurring also in the presence of structural or functionallesions at the level of the basal ganglia, but future studieson sensory processing in other basal ganglia disorders willhave to examine this issue more closely.
Methodological considerationsWe can only speculate on enhanced activation at basal ganglialevel in tasks demanding appropriate integration or gating ofsensory impulses to ongoing motor plans, which was notstudied here, but appears to be an important element of basalganglia function (Lidskyet al., 1985; Schneider and Lidsky,1987). Studies on sensorimotor function have, in fact, morein common with physiological behaviour where on-lineintegration of sensory and motor modalities is required.The advantage, however, of a passive sensory stimulationapproach, as applied here, is the absence of any confoundingmotor component; this conduct provides a reasonable basisfor between-group comparisons with patients, in particularwhen these are characterized by abnormal movement. Thismay be, however, at the expense of detection sensitivity,considering the proposed role of the basal ganglia as asensorimotor integrator.
ConclusionsThis is the first functional neuroimaging study that specificallyaddresses the issue of sensory processing in Parkinson’sdisease and Huntington’s disease, by comparison with healthycontrols. Our data show that sensory-evoked brain activationin both movement disorders is reduced in cortical (parietaland frontal) and subcortical (basal ganglia) areas. Our study,therefore, indicates that Parkinson’s disease and Huntington’s
Sensory processing in Parkinson’s and Huntington’s disease1663
disease, beyond known deficits in central motor control, arecharacterized by abnormal sensory processing even on tasksdevoid of any motor component.
AcknowledgementsWe wish to thank our radiochemistry group and cyclotron stafffor the radiotracer supply, S. Dieckmann for methodologicalassistance and S. Fu¨rst, C. Kolligs and C. Kruschke for theirtechnical assistance at the PET camera. This study wassupported by the Deutsche Forschungsgemeinschaft (SFB462, Sensomotorik).
ReferencesAbbruzzese G, Dall’Agata D, Morena M, Reni L, Favale E.Abnormalities of parietal and prerolandic somatosensory evokedpotentials in Huntington’s disease. Electroencephalogr ClinNeurophysiol 1990; 77: 340–6.
Albin RL, Young AB. Somatosensory phenomena in Huntington’sdisease. Mov Disord 1988; 3: 343–6.
Alexander GE, Crutcher MD. Functional architecture of basalganglia circuits: neural substrates of parallel processing [seecomments]. [Review]. Trends Neurosci 1990; 13: 266–71. Commentin: Trends Neurosci 1991; 14: 55–9.
Alexander GE, DeLong MR, Strick PL. Parallel organization offunctionally segregated circuits linking basal ganglia and cortex.[Review]. Annu Rev Neurosci 1986; 9: 357–81.
Aosaki T, Graybiel AM, Kimura M. Effect of the nigrostriataldopamine system on acquired neural responses in the striatum ofbehaving monkeys. Science 1994; 265: 412–5.
Bartenstein P, Weindl A, Spiegel S, Boecker H, Wenzel R, Ceballos-Baumann AO, et al. Central motor processing in Huntington’sdisease. A PET study. Brain 1997; 120: 1553–67.
Blaha L, Pater W. Stability and reliability of a brief-intelligencetest (MWT-b) to long-stay psychiatric patients (author’s transl).[German]. Nervenarzt 1979; 50: 196–8.
Boecker H, Khorram-Sefat D, Kleinschmidt A, Merboldt KD,Hanicke W, Requardt M, et al. High-resolution functional magneticresonance imaging of cortical activation during tactile exploration.Hum Brain Mapp 1995; 3: 236–44.
Brouwers P, Cox C, Martin A, Chase T, Fedio P. Differentialperceptual-spatial impairment in Huntington’s and Alzheimer’sdementias. Arch Neurol 1984; 41: 1073–6.
Burton H, Videen TO, Raichle ME. Tactile-vibration-activatedfoci in insular and parietal-opercular cortex studied with positronemission tomography: mapping the second somatosensory area inhumans. Somatosens Mot Res 1993; 10: 297–308.
Burton H, MacLeod AM, Videen TO, Raichle ME. Multiple fociin parietal and frontal cortex activated by rubbing embossed gratingpatterns across fingerpads: a positron emission tomography studyin humans. Cereb Cortex 1997; 7: 3–17.
Bylsma FW, Rothlind J, Hall MR, Folstein SE, Brandt J. Assessmentof adaptive functioning in Huntington’s disease. Mov Disord 1993;8: 183–90.
Catalan MJ, Ishii K, Bara-Jiminez W, Honda M, Karp B, HallettM. Plastic reorganization of the human somatosensory cortex (S1)in hand dystonia. A PET study [abstract]. Mov Disord 1988; 13(Suppl 2): 32.
Ceballos-Baumann AO, Passingham RE, Marsden CD, Brooks DJ.Motor reorganization in acquired hemidystonia. Ann Neurol 1995a;37: 746–57.
Ceballos-Baumann AO, Passingham RE, Warner T, Playford ED,Marsden CD, Brooks DJ. Overactive prefrontal and underactivemotor cortical areas in idiopathic dystonia. Ann Neurol 1995b; 37:363–72.
Chernigovskii VN, Musyashchikova SS, Mokrushin AA. Dynamicsof habituation in different cortical regions of the cat brain. BiolBull Acad Sci USSR 1979; 6: 1–7.
Coghill RC, Talbot JD, Evans AC, Meyer E, Gjedde A, BushnellMC, et al. Distributed processing of pain and vibration by thehuman brain. J Neurosci 1994; 14: 4095–108.
de Mari M, Margari L, Lamberti P, Iliceto G, Ferrari E. Changesin the amplitude of the N30 frontal component of SEPs duringapomorphine test in parkinsonian patients. J Neural Transm Suppl1995; 45: 171–6.
Demirci M, Grill S, McShane L, Hallett M. A mismatch betweenkinesthetic and visual perception in Parkinson’s disease. Ann Neurol1997; 41: 781–8.
Drory VE, Inzelberg R, Groozman GB, Korczyn AD. N30somatosensory evoked potentials in patients with unilateralParkinson’s disease. Acta Neurol Scand 1998; 97: 73–6.
Duyao M, Ambrose C, Myers R, Novelletto A, Persichetti F, FrontaliM, et al. Trinucleotide repeat length instability and age of onset inHuntington’s disease [see comments]. Nat Genet 1993; 4: 387–92.Comment in: Nat Genet 1993; 4: 329–30.
Eberling JL, Richardson BC, Reed BR, Wolfe N, Jagust WJ. Corticalglucose metabolism in Parkinson’s disease without dementia.Neurobiol Aging 1994; 15: 329–35.
Eidelberg D, Moeller JR, Dhawan V, Spetsieris P, Takikawa S,Ishikawa T, et al. The metabolic topography of parkinsonism. JCereb Blood Flow Metab 1994; 14: 783–801.
Fahn S, Elton RL, Committee and Members of the UPDRSDevelopment Committee. Unified Parkinson’s disease rating scale.In: Fahn S, Marsden CD, Goldstein M, Calne DB, editors. Recentdevelopments in Parkinson’s Disease. Florham Park, NJ: Macmillan;1987. p. 153–63; 293–304.
Fellows S, Schwarz M, Schaffrath C, Domges F, Noth J.Disturbances of precision grip in Huntington’s disease. NeurosciLett 1997; 226: 103–6.
Flaherty AW, Graybiel AM. Corticostriatal transformations in theprimate somatosensory system. Projections from physiologicallymapped body-part representations. J Neurophysiol 1991; 66:1249–63.
1664 H. Boeckeret al.
Friston KJ. Analysing brain images: principles and overview. In:Frackowiak RSJ, Friston KJ, Frith CD, Dolan RJ, Mazziotta JC,editors. Human brain function. San Diego (CA): Academic Press;1997. p. 25–41.
Friston KJ, Frith CD, Liddle PF, Dolan RJ, Lammertsma AA,Frackowiak RSJ. The relationship between global and local changesin PET scans [see comments]. J Cereb Blood Flow Metab 1990;10: 458–66. Comment in: J Cereb Blood Flow Metab 1993; 13:1038–40.
Friston KJ, Ashburner J, Frith CD, Poline J-B, Heather JD,Frackowiak RSJ. Spatial registration and normalization of images.Hum Brain Mapp 1995a; 3: 165–89.
Friston KJ, Holmes AP, Worsley KJ, Poline J-B, Frith CD,Frackowiak RSJ. Statistical parametric maps in functional imaging:a general linear approach. Hum Brain Mapp 1995b; 2: 189–210.
Harris GJ, Pearlson GD, Peyser CE, Aylward EH, Roberts J, BartaPE, et al. Putamen volume reduction on magnetic resonance imagingexceeds caudate changes in mild Huntington’s disease. Ann Neurol1992; 31: 69–75.
Huttunen J, Teravainen H. Pre- and postcentral corticalsomatosensory evoked potentials in hemiparkinsonism. Mov Disord1993; 8: 430–6.
Ibanez V, Deiber MP, Sadato N, Toro C, Grissom J, Woods RP,et al. Effects of stimulus rate on regional cerebral blood flow aftermedian nerve stimulation. Brain 1995; 118: 1339–51.
Iwamura Y, Iriki A, Tanaka M. Bilateral hand representation in thepostcentral somatosensory cortex. Nature 1994; 369: 554–6.
Jenkins IH, Fernandez W, Playford ED, Lees AJ, Frackowiak RS,Passingham RE, et al. Impaired activation of the supplementarymotor area in Parkinson’s disease is reversed when akinesia istreated with apomorphine. Ann Neurol 1992; 32: 749–57.
Jobst EE, Melnick ME, Byl NN, Dowling GA, Aminoff MJ. Sensoryperception in Parkinson disease. Arch Neurol 1997; 54: 450–4.
Kew JJ, Leigh PN, Playford ED, Passingham RE, Goldstein LH,Frackowiak RS, et al. Cortical function in amyotrophic lateralsclerosis. A positron emission tomography study. Brain 1993; 116:655–80.
Klockgether T, Borutta M, Rapp H, Spieker S, Dichgans J. A defectof kinesthesia in Parkinson’s disease. Mov Disord 1995; 10: 460–5.
Koller WC. Sensory symptoms in Parkinson’s disease. Neurology1984; 34: 957–9.
Kuwert T, Lange HW, Langen KJ, Herzog H, Aulich A, FeinendegenLE. Cortical and subcortical glucose consumption measured by PETin patients with Huntington’s disease. Brain 1990; 113: 1405–23.
Kuwert T, Noth J, Scholz D, Schwarz M, Lange HW, Topper R,et al. Comparison of somatosensory evoked potentials with striatalglucose consumption measured by positron emission tomographyin the early diagnosis of Huntington’s disease. Mov Disord 1993;8: 98–106.
Lane RD, Glazer WM, Hansen TE, Berman WH, Kramer SI.Assessment of tardive dyskinesia using the Abnormal InvoluntaryMovement Scale. J Nerv Ment Dis 1985; 173: 353–7.
Lidsky TI, Manetto C, Schneider JS. A consideration of sensory
factors involved in motor functions of the basal ganglia. [Review].Brain Res 1985; 356: 133–46.
Nakashima K, Nitta T, Takahashi K. Recovery functions ofsomatosensory evoked potentials in parkinsonian patients. J NeurolSci 1992; 108: 24–31.
Noth J, Engel L, Friedemann HH, Lange HW. Evoked potentials inpatients with Huntington’s disease and their offspring. I.Somatosensory evoked potentials. Electroencephalogr ClinNeurophysiol 1984; 59: 134–41.
Oldfield RC. The assessment and analysis of handedness: theEdinburgh inventory. Neuropsychologia 1971; 9: 97–113.
Onofrj M, Ghilardi MF, Basciani M, Martinez-Tica J, GloverA. Attenuation of the early anterior negativity of median nervesomatosensory evoked potential in the MPTP-treated monkey.Neurophysiol Clin 1990; 20: 283–93.
O’Sullivan BT, Roland PE, Kawashima R. A PET study ofsomatosensory discrimination in man. Microgeometry versusmacrogeometry. Eur J Neurosci 1994; 6: 137–48.
Paulesu E, Frackowiak RSJ, Bottini G. Maps of somatosensorysystems. In: Frackowiak RSJ, Friston KJ, Frith CD, Dolan RJ,Mazziotta JC, editors. Human brain function. San Diego (CA):Academic Press; 1997. p. 183–242.
Rickards C, Cody FW. Proprioceptive control of wrist movementsin Parkinson’s disease. Reduced muscle vibration-induced errors.Brain 1997; 120: 977–90.
Roland PE, Mortensen E. Somatosensory detection ofmicrogeometry, macrogeometry and kinesthesia in man [publishederratum appears in Brain Res 1987; 434: 241. [Review]. Brain Res1987; 434: 1–42.
Romo R, Ruiz S, Crespo P, Zainos A, Merchant H. Representation oftactile signals in primate supplementary motor area. J Neurophysiol1993; 70: 2690–4.
Romo R, Merchant H, Ruiz S, Crespo P, Zainos A. Neuronal activityof primate putamen during categorical perception of somaestheticstimuli. Neuroreport 1995; 6: 1013–7.
Rossini PM, Babiloni F, Bernardi G, Cecchi L, Johnson PB,Malentacca A, et al. Abnormalities of short-latency somatosensoryevoked potentials in parkinsonian patients. Electroencephalogr ClinNeurophysiol 1989a; 74: 277–89.
Rossini PM, Traversa R, Boccasena P, Martino G, Passarelli F,Pacifici L, et al. Parkinson’s disease and somatosensory evokedpotentials: apomorphine-induced transient potentiation of frontalcomponents. Neurology 1993; 43: 2495–500.
Rothblat DS, Schneider JS. Response of caudate neurons tostimulation of intrinsic and peripheral afferents in normal,symptomatic, and recovered MPTP-treated cats. J Neurosci 1993;13: 4372–8.
Rothblat DS, Schneider JS. Alterations in pallidal neuronal responsesto peripheral sensory and striatal stimulation in symptomatic andrecovered parkinsonian cats. Brain Res 1995; 705: 1–14.
Sensory processing in Parkinson’s and Huntington’s disease1665
Samuel M, Ceballos-Baumann AO, Blin J, Uema T, Boecker H,Passingham RE, et al. Evidence for lateral premotor and parietaloveractivity in Parkinson’s disease during sequential and bimanualmovements. A PET study. [see comments]. Brain 1997; 120: 963–76. Comment in: Brain 1998; 121: 769–72.
Sathian K, Zangaladze A, Green J, Vitek JL, DeLong MR. Tactilespatial acuity and roughness discrimination: impairments due toaging and Parkinson’s disease. Neurology 1997; 49: 168–77.
Schneider JS, Lidsky TI. Processing of somatosensory informationin striatum of behaving cats. J Neurophysiol 1981; 45: 841–51.
Schneider J, Lidsky T. Basal ganglia and behavior: sensory aspectsof motor functioning. Toronto: Hans Huber Publishers; 1987.
Schneider JS, Denaro FJ, Lidsky TI. Basal ganglia: motor influencesmediated by sensory interactions. Exp Neurol 1982a; 77: 534–43.
Schneider JS, Morse JR, Lidsky TI. Somatosensory properties ofglobus pallidus neurons in awake cats. Exp Brain Res 1982b; 46:311–4.
Schneider JS, Diamond SG, Markham CH. Deficits in orofacialsensorimotor function in Parkinson’s disease. Ann Neurol 1986; 19:275–82.
Schneider JS, Diamond SG, Markham CH. Parkinson’s disease:sensory and motor problems in arms and hands. Neurology 1987;37: 951–6.
Schwarz M, Block F, Topper R, Sontag KH, Noth J. Abnormalitiesof somatosensory evoked potentials in the quinolinic acid model ofHuntington’s disease: evidence that basal ganglia modulate sensorycortical input. Ann Neurol 1992; 32: 358–64.
Sedgwick EM, Williams TD. The response of single units in thecaudate nucleus to peripheral stimulation. J Physiol (Lond) 1967;189: 281–98.
Seitz RJ, Roland PE. Vibratory stimulation increases and decreasesthe regional cerebral blood flow and oxidative metabolism: a
positron emission tomography (PET) study. Acta Neurol Scand1992; 86: 60–7.
Siesling S, Zwinderman AH, van Vugt JP, Kieburtz K, Roos RA.A shortened version of the motor section of the Unified Huntington’sDisease Rating Scale. Mov Disord 1997; 12: 229–34.
Talairach J, Tournoux P. A co-planar stereotaxic atlas of the humanbrain. Stuttgart: Thieme; 1988.
Tempel LW, Perlmutter JS. Abnormal vibration-induced cerebralblood flow responses in idiopathic dystonia. Brain 1990; 113:691–707.
Tempel LW, Perlmutter JS. Abnormal cortical responses in patientswith writer’s cramp [published erratum appears in Neurology 1994;44: 2411]. Neurology 1993; 43: 2252–7.
Topper R, Schwarz M, Podoll K, Domges F, Noth J. Absence offrontal somatosensory evoked potentials in Huntington’s disease.Brain 1993; 116: 87–101.
Traversa R, Pierantozzi M, Semprini R, Loberti M, Cicardi MC,Bassi A, et al. N30 wave amplitude of somatosensory evokedpotentials from median nerve in Parkinson’s disease: apharmacological study. J Neural Transm Suppl 1995; 45: 177–85.
Weeks RA, Ceballos-Baumann A, Piccini P, Boecker H, HardingAE, Brooks DJ. Cortical control of movement in Huntington’sdisease. A PET activation study. Brain 1997; 120: 1569–78.
Weiller C, Chollet F, Friston KJ, Wise RJ, Frackowiak RS. Functionalreorganization of the brain in recovery from striatocapsular infarctionin man. Ann Neurol 1992; 31: 463–72.
Yamada T, Rodnitzky RL, Kameyama S, Matsuoka H, Kimura J.Alteration of SEP topography in Huntington’s patients and theirrelatives at risk. Electroencephalogr Clin Neurophysiol 1991; 80:251–61.
Received February 19, 1999. Accepted March 24, 1999
Related Documents