Innovations in Dairy D A I R Y I N D U S T R Y T E C H N O L O G Y R E V I E W October 2005 Call Our Technical Support Hotline: 1-800-248-8829 Visit Our Web Site: www.innovatewithdairy.com Sensory Evaluation of Dairy Products Note: Research on sensory evaluation of dairy products is conducted worldwide. Much of the information presented in this issue of Innovations in Dairy was extracted from research supported by Dairy Management Inc.™ (DMI), with funding from America’s dairy farmers. Executive Summary Sensory analysis techniques have developed into powerful tools for understanding how the appearance, flavor and t e x t u re attributes of dairy products drive consumer preferences. Modern sensory techniques can help dairy processors develop new products that are highly appealing to consumers. They also enable processors to optimize a product’s flavor, texture and color to attract specific target audiences as well as accurately monitor product quality. These tools can help determine variations in sensory attributes associated with processing variables, geographic region of production, production season, etc., and help resolve numerous other issues important to dairy processors and marketers. This report emphasizes the importance of descriptive analysis as a sensory tool for dairy products and presents a few examples of how sensory analysis has been applied successfully to resolving specific challenges in the dairy industry. Introduction The dairy industry has come a long way since the early 1900s, when it began developing techniques for judging dairy products to stimulate interest and education in dairy science. In the traditional methods that emerged, judging and grading dairy products normally involved one or two trained “experts” assigning quality scores on the appearance, flavor and texture of the products based on the presence or absence of predetermined defects. These traditional dairy judging methods have several shortcomings: they can’t predict consumer acceptance; their quality assessments are subjective; assigning quantitative scores is difficult; and they don’t combine analytically oriented attribute ratings with affectively oriented quality scores (Claassen and Lawless, 1992). Figure 1 shows descriptive sensory profiles of two Cheddar cheeses that received the same grade by traditional grading

Welcome message from author
This document is posted to help you gain knowledge. Please leave a comment to let me know what you think about it! Share it to your friends and learn new things together.
Transcript
I nnovations in
DairyD A I R Y I N D U S T R Y T E C H N O L O G Y R E V I E W
October 2005
Call Our Technical Support Hotline: 1-800-248-8829
Visit Our Web Site: www.innovatewithdairy.com
Sensory Evaluation of Dairy Products
Note: Research on sensory evaluation of dairy products is conducted worldwide. Much of the information presented in this issue of Innovationsin Dairy was extracted from research supported by D a i ry Management Inc.™( D M I ) , with funding from A m e r i c a ’s dairy farmers.
Executive Summary
Sensory analysis techniques have developed into powerful
tools for understanding how the appearance, flavor and
t e x t u re attributes of dairy products drive consumer
preferences. Modern sensory techniques can help dairy
processors develop new products that are highly appealing
to consumers. They also enable processors to optimize a
product’s flavor, texture and color to attract specific target
audiences as well as accurately monitor product quality.
These tools can help determine variations in sensory
attributes associated with processing variables, geographic
region of production, production season, etc., and help
resolve numerous other issues important to dairy
processors and marketers. This report emphasizes the
importance of descriptive analysis as a sensory tool for dairy
products and presents a few examples of how sensory
analysis has been applied successfully to resolving specific
challenges in the dairy industry.
I n t r o d u c t i o n
The dairy industry has come a long way since the early
1900s, when it began developing techniques for judging
dairy products to stimulate interest and education in dairy
science. In the traditional methods that emerged, judging
and grading dairy products normally involved one or
two trained “experts” assigning quality scores on the
appearance, flavor and texture of the products based on
the presence or absence of predetermined defects. These
traditional dairy judging methods have several
shortcomings: they can’t predict consumer acceptance;
their quality assessments are subjective; assigning
quantitative scores is difficult; and they don’t combine
analytically oriented attribute ratings with aff e c t i v e l y
oriented quality scores (Claassen and Lawless, 1992).
Figure 1 shows descriptive sensory profiles of two Cheddar
cheeses that received the same grade by traditional grading
DMI2-262 Sensory 05 Tech04.20 10/10/05 4:25 PM Page 2

I n n o v a t i o n s i n D a i r y{ 2 }
techniques. With seven of the 11 flavor attributes measured
as being significantly different between the two cheeses,
the flavor perception of the two samples is actually quite
different. Using traditional methods of evaluation, however,
these products with very diff e rent sensory characteristics but
no defect will obtain the same quality score.
Sensory Input
One thing in common to all sensory assessment methods is
that they use humans as the measuring instrument. There
are many kinds of sensory tests, the most widely used being
d i ff e rence tests, descriptive analysis and consumer acceptance
testing. Difference tests include the triangle test, in which
the panel attempts to detect which one of three samples is
d i ff e rent from the other two, and duo-trio tests, in which the
panel selects which one of two samples is diff e rent from a
s t a n d a rd. Diff e rence tests estimate the magnitude of sensory
d i ff e rences between samples, but one deficiency of these
tests is that the nature of the differences is not defined. I n
most cases, a combination of diff e rence tests and
descriptive sensory analysis is employed for problem-solving.
Descriptive sensory analysis refers to a collection of techniques
that seek to discriminate between a range of products based
on their sensory characteristics and to determine a quantitative
description of the sensory diff e re n c e s that can be identified,
not just the defects. Unlike traditional quality judging methods,
no judgment of “good” or “bad” is made because this is not the
purpose of the evaluation. The panel operates as a powerful
instrument to identify and quantify sensory properties.
Descriptive sensory analysis provides useful information
for dairy research, product development and marketing.
Several assessors rating samples for a number of sensory
attributes is a simple example of sensory profiling. For
example, bitterness may be rated on a five-point scale, with
a rating of one indicating no bitterness and a rating of five
meaning very bitter. E x t e rnal standards (such as solutions
of varying concentrations of quinine or caffeine for bittern e s s )
Figure 1: Descriptive Sensory Profiles of Two Cheddar Cheeses That Received the SameGrade by Traditional Dairy Judging Techniques
Note: The asterisk (*) denotes attributes that were significantly different between the two cheeses (P < 0.05). Source: M.A. Drake, 2004.
DMI2-262 Sensory 05 Tech04.20 10/10/05 4:25 PM Page 3
I n n o v a t i o n s i n D a i r y{ 3 }
may help to define attributes and standardize the scale for
each assessor. Developing and refining a vocabulary, or
sensory lexicon, is an essential part of sensory profile work
and is done in an objective manner.
Quantitative Descriptive Analysis
The first published descriptive sensory technique is the Flavor
P rofile Method (FPM) developed in the 1950s by Arthur D.
Little Inc. Refinements and variations in FPM occurred in the
1970s with the development of Quantitative Descriptive Analysis
(QDA) and the Spectrum™ method of descriptive analysis.
Today, descriptive analysis has gained wide acceptance as
one of the most important tools for studying issues related
to flavor, appearance and texture, as well as a way to
guide product development efforts. For example, it has been
used as an investigative sensory technique for studying
conventionally pasteurized milk (Phillips et al., 1995;
Quinones et al., 1998), ice cream (Ohmes et al., 1998;
Roland et al., 1999) and cheese (Ordonez et al., 1998).
With descriptive analysis, selected panelists work together
to identify key product attributes and appropriate intensity
scales specific to the product under study. The panelists are
then trained by the panel leader, a sensory professional
rather than a member of the panel, to reliably identify and
score product attributes. During training, the panel (usually
eight to 12 prescreened individuals) generates the language
(or lexicon) to describe the product. Descriptive analysis
results are subjected to statistical analysis and are then
re p resented in a variety of graphical formats for interpre t a t i o n.
One useful statistical technique is Principal Component
Analysis (PCA), a multivariate analysis method that shows
g roupings or clusters of similar sample types based on
quantitative measure m e n t s . By applying PCA to descriptive
analysis data, the set of dependent variables (i.e., attributes)
is reduced to a smaller set of underlying variables (called
factors) based on patterns of correlation among the original
variables (Lawless and Heymann, 1998). The factors (also
called principal components) are linear combinations of the
independent variables.
The resulting data can then be applied in many useful
ways. A few examples include profiling specific product
characteristics, comparing and contrasting similar products
based on attributes important to consumers, and altering
product characteristics with the goal of increasing market
share for a given set of products.
Flavor Lexicons for Dairy Products
M.A. Drake and G.V. Civille have reviewed lexicon history,
methods and applications (2002). A flavor lexicon is a set of
word descriptors that describe a product’s flavor. While the
panel generates its own list to describe the product array
under study, a lexicon provides a source of possible terms
with references and definitions for clarification.
A c c o rding to Drake and Civille, development of a
re p resentative flavor lexicon re q u i res several steps, including
appropriate product frame-of-reference collection, language
generation and designation of definitions and references,
before a final descriptor list can be determined. Once
developed, flavor lexicons can be used to record and define
product flavor, compare products and determine storage
s t a b i l i t y, as well as to study correlations of sensory data with
consumer liking/acceptability and chemical flavor data.
Good flavor lexicons should be both discriminating and
descriptive. The language should be developed from a bro a d
representative sample set that exhibits all the potential
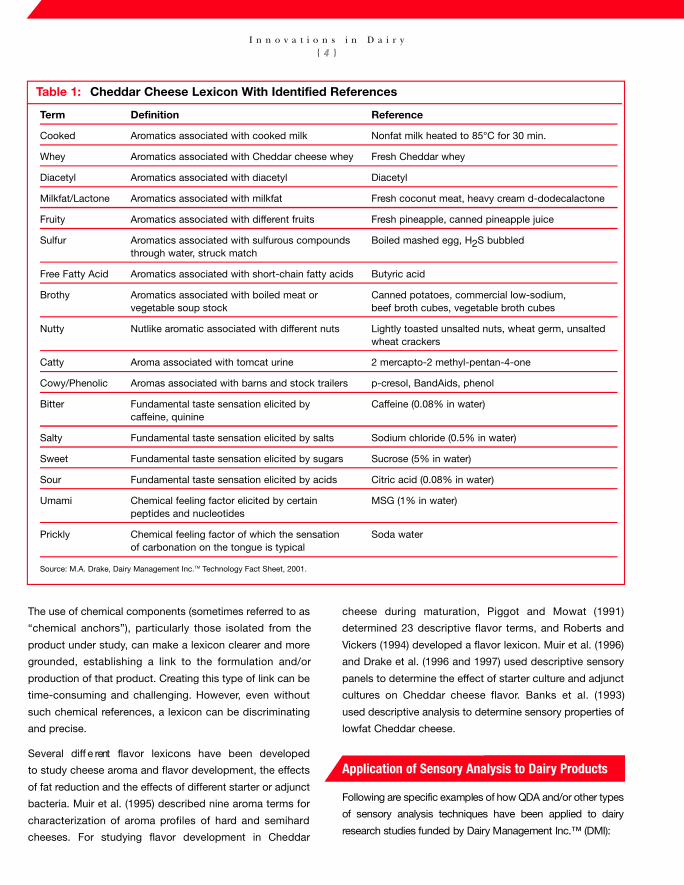
variability within the product. For example, Drake et al. (2001)
collected 220 samples of Cheddar cheese varying in age, milk
heat treatment and geographical origin to identify a descriptive
language for Cheddar cheese (see Table 1.) The sample set
was screened to 70 cheeses prior to language generation.
In creating a lexicon, the panel will frequently review the list,
merging like terms, eliminating redundancies and organizing
the list so that the attributes appear in most products being
tested. It is important that multiple terms are not used to
describe the same flavor; conversely, it is also important that
one term doesn’t represent or overlap with several other
flavors. As an example of this type of lexicon problem, Drake
et al. (2001) reported that use of the term “aged” in a
Cheddar cheese flavor lexicon was in fact a meta term that
comprised three flavors and one basic taste.
An optimized lexicon can relate consumer acceptance/
rejection and instrumental or physical measurements.
DMI2-262 Sensory 05 Tech04.20 10/10/05 4:25 PM Page 6
I n n o v a t i o n s i n D a i r y{ 4 }
The use of chemical components (sometimes referred to as
“chemical anchors”), particularly those isolated from the
product under study, can make a lexicon clearer and more
grounded, establishing a link to the formulation and/or
production of that product. Creating this type of link can be
time-consuming and challenging. However, even without
such chemical references, a lexicon can be discriminating
and precise.
Several diff e rent flavor lexicons have been developed
to study cheese aroma and flavor development, the effects
of fat reduction and the effects of different starter or adjunct
bacteria. Muir et al. (1995) described nine aroma terms for
characterization of aroma profiles of hard and semihard
cheeses. For studying flavor development in Cheddar
cheese during maturation, Piggot and Mowat (1991)
determined 23 descriptive flavor terms, and Roberts and
Vickers (1994) developed a flavor lexicon. Muir et al. (1996)
and Drake et al. (1996 and 1997) used descriptive sensory
panels to determine the effect of starter culture and adjunct
cultures on Cheddar cheese flavor. Banks et al. (1993)
used descriptive analysis to determine sensory properties of
lowfat Cheddar cheese.
Application of Sensory Analysis to Dairy Products
Following are specific examples of how QDA and/or other types
of sensory analysis techniques have been applied to dairy
re s e a rch studies funded by Dairy Management Inc.™ (DMI):
Table 1: Cheddar Cheese Lexicon With Identified References
Term Definition Reference
Cooked Aromatics associated with cooked milk Nonfat milk heated to 85°C for 30 min.
Whey Aromatics associated with Cheddar cheese whey Fresh Cheddar whey
Diacetyl Aromatics associated with diacetyl Diacetyl
Milkfat/Lactone Aromatics associated with milkfat Fresh coconut meat, heavy cream d-dodecalactone
Fruity Aromatics associated with different fruits Fresh pineapple, canned pineapple juice
Sulfur Aromatics associated with sulfurous compounds Boiled mashed egg, H2S bubbledthrough water, struck match
Free Fatty Acid Aromatics associated with short-chain fatty acids Butyric acid
Brothy Aromatics associated with boiled meat or Canned potatoes, commercial low-sodium, vegetable soup stock beef broth cubes, vegetable broth cubes
Nutty Nutlike aromatic associated with different nuts Lightly toasted unsalted nuts, wheat germ, unsaltedwheat crackers
Catty Aroma associated with tomcat urine 2 mercapto-2 methyl-pentan-4-one
Cowy/Phenolic Aromas associated with barns and stock trailers p-cresol, BandAids, phenol
Bitter Fundamental taste sensation elicited by Caffeine (0.08% in water)caffeine, quinine
Salty Fundamental taste sensation elicited by salts Sodium chloride (0.5% in water)
Sweet Fundamental taste sensation elicited by sugars Sucrose (5% in water)
Sour Fundamental taste sensation elicited by acids Citric acid (0.08% in water)
Umami Chemical feeling factor elicited by certain MSG (1% in water)peptides and nucleotides
Prickly Chemical feeling factor of which the sensation Soda waterof carbonation on the tongue is typical
Source: M.A. Drake, Dairy Management Inc.TM Technology Fact Sheet, 2001.
DMI2-262 Sensory 05 Tech04.20 10/10/05 4:25 PM Page 7
“Optimization of Cheddar cheese taste in model cheese
systems” (B. Yang and Z. Vickers, 2004). Cheddar cheese,
the most popular natural cheese in the United States, has a
very complex flavor system. While much information has
accumulated during the past century, the industry is still
seeking to fully understand Cheddar cheese flavor and has
not been able to re p licate it in model systems. The nonvolatile
sensory attributes of Cheddar cheese are important for pro v i d i n g
the character of Cheddar cheese. While much work has been
published on volatile components of Cheddar, far less is
known on how nonvolatiles impact Cheddar flavor. Yang, a
Kraft Foods researcher, and Vickers, at the Minnesota-South
Dakota Dairy Foods Research Center, used sensory analysis
to better understand the importance of nonvolatile compounds
to Cheddar flavor.
A descriptive panel was trained to evaluate real and model
cheese for a variety of taste attributes and for Cheddar-
like taste. Sodium chloride, lactic acid, citric acid and
monosodium glutamate were added to the model systems
using mixture designs and response surface methodology to
determine optimum levels of these components. The three
model systems investigated were: (1) a dairy model system
(containing milk isolate, anhydrous milkfat, water, annato
color and chymosin); (2) a nondairy model system (containing
gelatin, gum acacia, modified starch, sunflower oil, water
and annato color); and (3) a mozzarella base. While the
mozzarella base did present tastes, it was used because the
other two model systems were too unlike Cheddar cheese
(or any cheese) texture.
Less sodium chloride and fewer acids were required to
simulate the taste of mild Cheddar compared with aged
Cheddar. None of the model systems mimicked the texture
of real Cheddar. The re s e a rchers were able to match
approximately, but not exactly, the taste of aged Cheddar
using a mozzarella base. Panelists generally rated the
optimized taste in the dairy model system as more
C h e d d a r-like than the optimized tastes in the nondairy model.
Two methods were used to measure how close a sample
was to the Cheddar concept. One was by measuring the
similarity of the sample to either mild Cheddar cheese taste
or aged Cheddar cheese taste on an unstructured scale. The
left end of the line was marked with “not at all like Cheddar
taste” and the right end was marked with “exactly like mild
Cheddar taste” or “exactly like aged Cheddar taste.” The
other method was by concept matching using an R-index
m e t h o d o l o g y. For the mild group, the panel evaluated
whether the samples were “MC” (mild Cheddar taste and
s u re), “MC?” (mild Cheddar taste but not sure), “N?”
(no Cheddar taste but not sure) or “N” (no Cheddar taste and
sure). For the aged group, “MC” and “MC?” were changed
to “AC” (aged Cheddar taste and sure) and “AC?” (aged
Cheddar taste but not sure).
A model system for studying Cheddar taste should be as
bland-tasting as possible, and also have a texture and
composition similar to that of real Cheddar cheese. The
characteristic flavor of a food depends not only on the flavor
compounds present and their levels but also the rate and
extent to which they are released in real time, which in turn
are affected by the amounts of proteins, fat and other matrix
components of the sample.
By using a trained descriptive analysis panel, Yang and
Vickers were able to evaluate the flavor impact of several
nonvolatile Cheddar cheese components (i.e., salt, lactic
acid, citric acid and monosodium glutamate) in model
systems that attempted to mimic real Cheddar cheese. They
achieved the most Cheddar-like taste with the mozzarella
cheese base, and panelists found the optimal concentration
of salts and acids in the model to be nearly indistinguishable
from real Cheddar cheese.
“Cheddar cheese and powdered milk lexicons”
(M.A. Drake et al., 2001 and 2003). M.A. Drake, at the
Southeast Dairy Foods Research Center, developed and
validated a descriptive language for Cheddar cheese flavor.
For the project, 240 representative cheese samples were
collected. Fifteen individuals from industry, academia and
g o v e rnment participated in roundtable discussions to
generate descriptive flavor terms. A highly trained descriptive
panel (n=11) refined the terms and identified references.
Identification of chemical references was conducted with
the assistance of K. Cadwallader at the University of
Illinois. Instrumental analyses (gas chomatography/mass
spectrometry, or GC/MS) were conducted to identify many
flavor compounds that were responsible for specific flavors
and off-flavors in Cheddar cheese.
Twenty-four Cheddar cheeses were then presented to the
panel to validate the proposed lexicon. The panel
differentiated the 24 Cheddar cheeses as determined by
univariate and multivariate analysis of variance. Twenty-
seven terms were identified to describe Cheddar flavor.
I n n o v a t i o n s i n D a i r y{ 5 }
DMI2-262 Sensory 05 Tech04.20 10/10/05 4:25 PM Page 10

I n n o v a t i o n s i n D a i r y{ 6 }
Seventeen descriptive terms were observed in most
Cheddar cheeses. Drake’s standard sensory language for
Cheddar cheese today is facilitating training and
communication among diff e rent re s e a rch groups. The
Cheddar cheese lexicon is helping cheesemakers and
cheese users accurately and consistently characterize the
flavor of their cheese products and improve quality issues
by measuring and controlling the presence of compounds
that have been associated with flavor defects.
Following development of the Cheddar cheese lexicon, Drake
developed a similar language to help characterize another
food industry staple: dried dairy ingredients, including whey
p roteins and nonfat dry milk (Drake et al., 2003).
Global production of nonfat dry milk tops 3.3 million tons
(USDA 2000), and whey protein demand still outstrips
production, which increases annually. A sensory lexicon
describing the flavor of these ingredients helps dairy pro c e s s o r s
maximize the quality of these ingredients and allows food
technologists to identify the exact attributes or flavor notes
these ingredients contribute to formulations.
Drake said she was surprised by the number of descriptive
terms that the panel uncovered for application to the dried
dairy ingredients lexicon. The panel discovered 21 flavor
terms that could be applied to milk powders. Examples
included cooked/milky flavor, cake mix or vanillin, sweet
and sour, earth and cereal. Each of these flavors was linked
to a key aroma compound, many of which were identified
by Drake and Cadwallader with GC/MS. For example,
lactones tend to lend a sweet, coconutlike flavor, while
various free fatty acids can simulate a waxy flavor.
Many different factors contribute to flavor variability. The
source of the powder, processing/packaging methods and
materials, as well as storage time and conditions, are just a
few. The dried dairy ingredient lexicon, linking responsible
chemical factors and causal agents, provides common
ground for processors and ingredient suppliers to discuss
ingredient characteristics.
Figure 2 shows how descriptive analysis results based on
Drake’s dried dairy ingredient lexicon can be analyzed by
PCA. This two-dimensional PCA plot shows the attribute
variability among 27 low-heat skim milk powders less than
t h ree months old. Rehydrated milk powders are re p re s e n t e d
Figure 2: Flavor Variability Among Low-Heat Nonfat Dry Milks Less Than Three Months Old
Note: Rehydrated milk powder samples are represented by numbers.PC1 = Principal Component 1; PC2 = Principal Component 2Source: M.A. Drake, 2004.
DMI2-262 Sensory 05 Tech04.20 10/10/05 4:25 PM Page 11
I n n o v a t i o n s i n D a i r y{ 7 }
by numbers. PC1 = principal component 1; PC2 = principal
component 2.
Drake has continued her sensory work and has developed
a chocolate milk lexicon; work on a butter lexicon is
currently under way.
“Quantitative Descriptive Analysis and PrincipalComponent Analysis for sensory characterization
of ultrapasteurized milk” (K.W. Chapman et al., 2001a).Extending the shelf life of fluid milk products will contribute
to the competitiveness of the dairy industry in the beverage
market. Ultra-high-temperature (UHT) processing and
ultrapasteurization (UP) are two currently used approaches
for extending dairy product shelf lives beyond those obtained
by conventional pasteurization. One challenge is that these
products, which involve higher levels of heat treatment
compared with conventional high-temperature-short-time
(HTST) pasteurization, have been criticized for their
off-flavors. Since product flavor quality drives consumer
acceptance and demand, the ability to measure sensory
attributes characteristic of high-quality products is necessary
for the development and production of products that meet
consumer expectations.
Chapman et al. (2001a), at the Department of Food Science
at Cornell University, used QDA to identify and measure UP
fluid milk product attributes that are important to consumers.
The researchers studied nine UP milk products of various fat
levels, including two lactose-reduced products, from two dairy
plants. PCA identified four significant principal components
that accounted for 94.4% of the variance in the sensory
attribute data for UP milk samples. PCA scores indicated
that the location of each UP milk along each of four scales
primarily corresponded to cooked, drying/lingering, sweet
and bitter attributes. Overall product quality was modeled as
a function of the principal components using multiple least
square regression (R2=0.810). These findings demonstrate
the utility of QDA for identifying and measuring UP fluid milk
product attributes that are important to consumers.
The researchers were able to develop regression models
that could be used to estimate the overall product quality
rating based on measurement of its attributes. By plugging
in QDA attribute scores for each sample, these re g re s s i o n
equations could be used to calculate an overall quality rating
for future samples tested. In general, perception of bitter flavor
had the most dramatic effect on overall quality perc e p t i o n .
Table 2 lists the descriptors used for QDA and Table 3 shows
the Varimax rotated PC factor loadings for UP milk attributes.
Figure 3 is a sensory profile for a reduced-fat UP milk
sample stored at 6°C for two days (light gray area), 29 days
(black area) and 61 days (red area). Individual attributes
a re positioned like the spokes of a wheel around a
center (zero, or not detected) point, with the spokes
representing attribute intensity scales and higher (more
intense) values radiating outward.
“Acceptance of reduced-fat ultrapasteurized milk
by consumers, 6 to 11 years old” (K.W. Chapman andK.J. Boor, 2001b). Milk products are important dietary
sources of protein, minerals and vitamins for children. To
increase the appeal of their UP and UHT milk offerings, dairy
processors need to understand what flavor attributes affect
flavor acceptance and then devise ways to control these
critical flavor attributes.
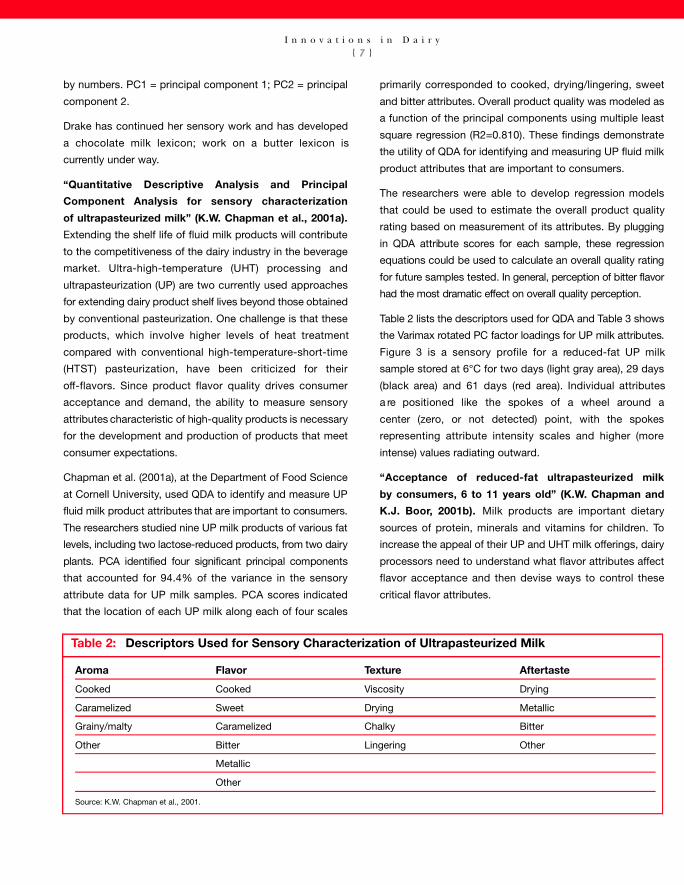
Table 2: Descriptors Used for Sensory Characterization of Ultrapasteurized Milk
Aroma Flavor Texture Aftertaste
Cooked Cooked Viscosity Drying
Caramelized Sweet Drying Metallic
Grainy/malty Caramelized Chalky Bitter
Other Bitter Lingering Other
Metallic
Other
Source: K.W. Chapman et al., 2001.
DMI2-262 Sensory 05 Tech04.20 10/10/05 4:25 PM Page 12

Chapman and Boor studied the degree of liking of UP milk
by 6- to 11-year-old children. For comparative purposes,
UP reduced-fat milks were evaluated along with
conventionally pasteurized HTST reduced-fat milks and
UHT reduced-fat m i l k s . A seven-point facial hedonic scale
with Peryam & Kroll verbal descriptors for affective testing with
c h i l d ren was used with the 6-year-olds. For the older childre n ,
a seven-point hedonic scale with Peryam & Kroll verbal
descriptors was used.
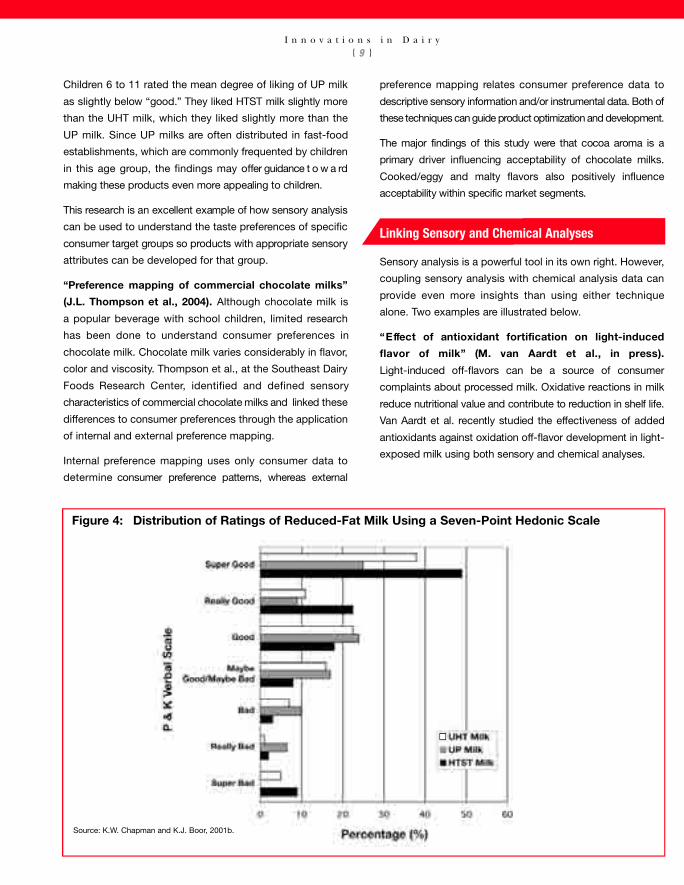
Figure 4 shows the distribution of ratings of milk, using
a seven-point hedonic scale. (The black bar represents
HTST milk, the gray bar represents UP milk and the white
bar represents UHT milk.) Although UP milks had a higher
percentage of “good” scores than either HTST or UHT milk,
the HTST and UHT milks had higher “really good” and
“super good” percentages. How children felt about milk, in
general, significantly affected how much they liked the test
milks, with all types of milks being influenced equally.
I n n o v a t i o n s i n D a i r y{ 8 }
Table 3: Varimax Rotated Principal Component Factor Loadings for Ultrapasteurized Milk Attributes
Attributes PC1 PC2 PC3 PC4
Cooked aroma 0.971* 0.013 0.034 -0.208
Caramel aroma 0.497 -0.539 -0.567* -0.252
Grainy/malty aroma 0.964* 0.021 -0.231 0.032
Cooked flavor 0.702* -0.547 0.091 -0.350
Sweet flavor 0.038 0.082 -0.969* -0.146
Bitter flavor -0.186 -0.003 0.191 0.946*
Dry texture 0.004 -0.942* -0.101 -0.092
Lingering aftertaste -0.003 -0.758* 0.389 0.413
Proportion of total variance 33.1% 25.7% 19.0% 16.6%
*Loading with an absolute value greater than 0.560; these attributes have the greatest sensory impact. Source: K.W. Chapman et al., 2001.
Source: K.W. Chapman, H.T. Lawless and K.J. Boor, J. Dairy Sci. 84:12, 2001a.
Figure 3: Sensory Profiles of Reduced-Fat, Ultrapasteurized Milk Stored at 6°C for 2 Days,29 Days and 61 Days
DMI2-262 Sensory 05 Tech04.20 10/10/05 4:25 PM Page 9
Children 6 to 11 rated the mean degree of liking of UP milk
as slightly below “good.” They liked HTST milk slightly more
than the UHT milk, which they liked slightly more than the
UP milk. Since UP milks are often distributed in fast-food
establishments, which are commonly frequented by children
in this age group, the findings may offer guidance t o w a rd
making these products even more appealing to children.
This re s e a rch is an excellent example of how sensory analysis
can be used to understand the taste preferences of specific
consumer target groups so products with appropriate sensory
attributes can be developed for that group.
“Preference mapping of commercial chocolate milks”(J.L. Thompson et al., 2004). Although chocolate milk is
a popular beverage with school children, limited research
has been done to understand consumer preferences in
chocolate milk. Chocolate milk varies considerably in flavor,
color and viscosity. Thompson et al., at the Southeast Dairy
Foods Research Center, identified and defined sensory
characteristics of commercial chocolate milks and linked these
differences to consumer preferences through the application
of internal and external preference mapping.
Internal preference mapping uses only consumer data to
determine consumer pre f e rence patterns, whereas external
preference mapping relates consumer preference data to
descriptive sensory information and/or instrumental data. Both of
these techniques can guide product optimization and development.
The major findings of this study were that cocoa aroma is a
p r i m a r y driver influencing acceptability of chocolate milks.
Cooked/eggy and malty flavors also positively influence
acceptability within specific market segments.
Linking Sensory and Chemical Analyses
Sensory analysis is a powerful tool in its own right. However,
coupling sensory analysis with chemical analysis data can
provide even more insights than using either technique
alone. Two examples are illustrated below.
“ E ffect of antioxidant fortification on light-induced flavor of milk” (M. van Aardt et al., in press).
Light-induced off-flavors can be a source of consumer
complaints about processed milk. Oxidative reactions in milk
reduce nutritional value and contribute to reduction in shelf life.
Van Aardt et al. recently studied the effectiveness of added
antioxidants against oxidation off-flavor development in light-
exposed milk using both sensory and chemical analyses.
I n n o v a t i o n s i n D a i r y{ 9 }
Figure 4: Distribution of Ratings of Reduced-Fat Milk Using a Seven-Point Hedonic Scale
Source: K.W. Chapman and K.J. Boor, 2001b.
DMI2-262 Sensory 05 Tech04.20 10/10/05 4:25 PM Page 8

I n n o v a t i o n s i n D a i r y{ 1 0 }
Sensory testing showed no perceivable diff e rence between
milk and milk with added (a) 0.05% alpha-tocopherol (TOC)
and (b) 0.025% TOC plus 0.025% ascorbic acid (AA), but did
detect a perceivable diff e rence with added (c) 0.05% AA
alone. Subsequently, sensory testing for difference showed
a significant difference in oxidation off-flavor development
between light-exposed control milk and light-exposed milk
with added TOC/AA, while milk fortified with only TOC was
not different from the control. General remarks on score
sheets from panelists who correctly identified the “odd”
samples indicated that reduced-fat, light-exposed milk
treated with a combination of TOC/AA showed more fresh
milk flavor character than light-exposed milk without added
antioxidants. This implies that the significant difference
observed between light-exposed milk and milk treated with
TOC/AA is due to a higher oxidized flavor in control milk.
R e s e a rchers also examined samples by gas chro m a t o g r a p h y -
olfactometry (GC-O), a technique involving extraction of
flavor volatiles from the sample, injection of the extract into
a heated GC injection port, separation of chemical
components as they pass through a GC column and finally
sniffing of the individual chemicals as they elute from the
column. It is interesting to note that, with light exposure, the
addition of TOC seemed to increase the intensities of the
aroma-active compounds; this could indicate a pro-oxidant
effect of the antioxidant. Although GC-O data suggested
the p resence of substantially more odorous flavor compounds
in antioxidant-treated, light-exposed milk, these compounds
could be below human detection thresholds in the sample
matrix, which might indicate why sensory results did not
indicate increased light-oxidation flavor.
The thiobarbituric acid reactive substances (TBARS) test
verified chemically the extent of oxidation in control and
antioxidant-treated milk samples. Milk that was exposed to
light for 10 hours showed a significantly higher TBARS value
(0.92±0.09 mg/kg) than milk that was protected from light
(0.59±0.18 mg/kg) or milk that was treated with TOC/AA
(0.26±0.09 mg/kg).
Both sensory and chemical analyses showed that direct
addition of a combination of 0.025% TOC (1.25% TOC per
g fat) and 0.025% AA to reduced-fat milk protected milk
flavor over 10 hours of light exposure.
“Characterization of nutty flavor in Cheddar cheese”
(Y.K. Avsar et al., 2004). Cheese flavor is one of the most
important criteria for determining consumer choice and
acceptance. Aged Cheddar flavor is characterized by sulfur,
brothy and nutty flavors. Research that elucidates the origin
of the important nutty flavor notes in cheese is scarce.
Defining the sensory term “nutty” is a difficult task, since the
aroma quality in all nuts is not exactly the same. With
Drake’s Cheddar cheese lexicon, nutty flavor is defined as
the “[nonspecific] nutlike aromatic associated with different
nuts.” Lightly toasted unsalted nuts, unsalted Wheat Thin®
crackers and roasted peanut oil extract were used as
references for nutty flavor.
Identifying specific chemical compounds associated with
particular flavors re q u i res extensive and specific instrumental
and sensory analysis. A three-step process is involved. First,
descriptive analysis is used to qualitatively and quantitatively
identify all of the sensory-perceived flavors and tastes pre s e n t
in the cheese. Second, instrumental (GC) techniques can
then be applied to identify volatile compounds that contribute
to flavor. GC-O can assist in identification of compounds
that are present in the sensory threshold range; it is often
used as a way of further screening volatile compounds that
play key roles in flavor. Finally, model systems, similar to the
actual cheese, should then be constructed to evaluate the
role of specific compounds on sensory-perceived flavor. This
last step is sometimes referred to as recombination studies.
Using this process, researchers identified the key chemical
components in cheese responsible for nutty flavor notes.
Sensory analysis of cheese models revealed that three
S t recker aldehydes–2-methylpropanal, 2-methylbutanal
and 3-methylbutanal–can contribute to nutty flavors in aged
(>9 months) Cheddar cheeses. Quantitative data suggested
that 2-methylpropanal may be more important, because it
was more prevalent in nutty cheese and present at higher
concentrations than the other Strecker aldehydes.
The formation of these aldehydes requires the presence of
certain amino acids: valine for 2-methylpropanal, isoleucine
for 2-methylbutanal and leucine for 3-methylbutanal. In ord e r
to produce Cheddar cheese with enhanced or accelerated
nutty flavor, the researchers advised one of the following
three methods: (1) the use of starter bacteria capable of
releasing these certain amino acids; (2) addition of certain
amino acids into cheese milk or cheese slurry; and (3)
accelerating the conversion rate of these amino acids into
aroma compounds (Strecker aldehydes).
DMI2-262 Sensory 05 Tech04.20 10/10/05 4:25 PM Page 5

I n n o v a t i o n s i n D a i r y{ 1 1 }
This study is an excellent example of how combining
sensory and analytical studies can be used to formulate
cheeses with specific flavor qualities for use in specific
applications or to appeal to specific market segments.
Additional Applications of Sensory Analysis
Several other applications of sensory analysis to dairy
p roducts have been completed recently or are curre n t l y
under investigation. A few examples include:
• Development of a flavor lexicon for chocolate milk
and linkage to consumer market preferences
(Thompson et al., 2004).
• Understanding sources of flavor variability in skim milk
powder, whey protein concentrates and agglomerated
dried dairy ingredients (M.A. Drake, ongoing research).
• Development of lexicons for cheese texture to enhance
understanding of rheological and functional properties
(Brown et al., 2003; Foegeding et al., 2003).
• Understanding structure/function relationships in cre a m
cheese responsible for its performance. To date, re s e a rchers
have trained a sensory panel and defined specific
descriptors for the textural attributes of cream cheese, e.g.,
firmness, stickiness, gumminess, etc. (S. Govindasamy
Lucey and J.A. Lucey, ongoing re s e a rch).
• Understanding milk aftertaste and its acceptability.
Includes understanding milk flavor perception by
teen girls (Z.M. Vickers et al., in press).
• Flavor perceptions and preferences of Hispanic
consumers (M.A. Drake, ongoing research).
These studies illustrate that sensory analysis can be used to
improve understanding of (1) how textural properties affect
sensory perception and consumer preference and (2) how
the sensory appeal of dairy products can be optimized for
specific target audiences.
Bibliography
Avsar, Y.K.; Karagul-Yuceer, Y.; Drake, M.A.; Singh, T.K.;
Yoon, Y.; and Cadwallader, K.R. Characterization of nutty flavor
in Cheddar cheese. 2004. J. Dairy Sci. 87:1999-2010.
Banks, J.M.; Hunter, E.A.; and Muir, D.D. Sensory properties
of lowfat Cheddar; effect of salt content and adjunct culture.
1993. J. Soc. Dairy Technol. 46:119-123.
Brown, J.A.; Foegeding, E.A.; Daubert, C.R.; and Drake,
M.A. Changes in rheological and sensorial properties of
young cheese as related to maturation. 2003. J. Dairy Sci.
86:3054-3067.
Chapman, K.W.; Lawless, H.T.; and Boor, K.J. Quantitative
Descriptive Analysis and Principal Component Analysis for
sensory characterization of ultrapasteurized milk. 2001a.
J. Dairy Sci. 84:12-20.
Chapman, K.W., and Boor, K.J. Acceptance of 2% ultrapasteur-
i z e d milk by consumers, 6 to 11 years old. 2001b. J. Dairy Sci.
84:951-954.
Claassen, M.R., and Lawless, H.T. A comparison of descriptive
terminology systems for the sensory analysis of flavor defects
in milk. 1992. J. Food Sci. 57:596-621.
Drake, M.A.; Boylston, T.D.; Spence, K.D.; and Swanson, B.G.
Chemical and sensory quality of reduced-fat cheese with a
Lactobacillus adjunct. 1996. Food Res. Int. 29(3/4):381-387.
Drake, M.A.; Boylston, T.D.; Spence, K.D.; and Swanson, B.G.
Improvement of sensory quality of reduced-fat Cheddar
cheese by a Lactobacillus adjunct. 1997. Food Res. Int.
30(1):35-40.
Drake, M.A.; McIngvale, S.C.; Gerard, P.D.; Cadwallader, K.R.;
and Civille, G.V. Development of a descriptive language for
Cheddar cheese. 2001. J. Food Sci. 66:14222-1427.
Drake, M.A., and Civille, G.V. Flavor lexicons. 2002.
Comprehensive Reviews in Food Science and Food Safety.
2:33-39.
Drake, M.A.; Karagul-Yuceer, Y.; Cadwallader, K.R.; Civille,
G.V.; and Tong, P.S. Determination of the sensory attributes
of dried milk powders and dairy ingredients. 2003. J. Sensory
Stud. 18:199-216.
Drake, M.A. ADSA foundation scholar award: defining dairy
flavors. 2004. J. Dairy Sci. 87:777-784.
DMI2-262 Sensory 05 Tech04.20 10/10/05 4:25 PM Page 4
I n n o v a t i o n s i n D a i r y{ 1 2 }
10255 West Higgins Road, Suite 900Rosemont, IL 60018-5616
I nnovations in
DairyD A I R Y I N D U S T R Y T E C H N O L O G Y R E V I E W
October 2005
Foegeding, E.A.; Brown, J.; Drake, M.A.; and Daubert, C.R.
Sensory and mechanical aspects of cheese texture. 2003.
Int. Dairy J. 13:585-591.
Muir, D.D.; Hunger, E.A.; Banks, J.M.; and Horne, D.S.
Sensory properties of hard cheeses: identification of key
attributes. 1995. Int. Dairy J. 5:157-177.
Muir, D.D.; Banks, J.M.; Hunter, E.A. Sensory properties of
Cheddar cheese: effect of starter type and adjunction. 1996.
Int. Dairy J. 6:407-423.
Ohmes, R.L.; Marshall, R.T.; and Heymann, H. Sensory and
physical properties of ice creams containing milkfat or fat
replacers. 1998. J. Dairy Sci. 81:1222-1228.
Ordonez, A.I.; Ibanez, F.C.; Torre, P.; Barcina, Y.; and Perez-
Elortondo, F.J. Application of multivariate analysis to sensory
characterization of ewes’ milk cheese. 1998. J. Sensory Stud.
12:45-55.
Phillips, L.G.; McGiff, M.L.; Barbano, D.M.; and Lawless,
H.T. The influence of nonfat dry milk on the sensory proper-
ties, viscosity and color of lowfat milks. 1995. J. Dairy Sci.
78:1258-1266.
Piggot, J.R., and Mowat, R.G. Sensory aspects of maturation
of Cheddar cheese by descriptive analysis. 1991. J. Sensory
Stud. 6:49-62.
Quinones, H.J.; Barbano, D.M.; and Phillips, L.G. Influence of
protein standardization by ultrafiltration on the viscosity, color
and sensory properties of 2% and 3.3% milk. 1998. J. Dairy
Sci. 81:884-894.
Roberts, A.K., and Vickers, Z.M. Cheddar cheese aging:
changes in sensory attributes and consumer acceptance.
1994. J. Food Sci. 59:328-334.
Roland, A.M.; Phillips, L.G.; and Boor, K.J. Effects of fat
replacers on the sensory properties, color, melting and
hardness of ice cream. 1999. J. Food Sci. 82:2094-2100.
Thompson, J.L.; Drake, M.A.; Lopetcharat, K.; and Yates,
M.D. 2004. Preference mapping of commercial chocolate
milks. In press. J. Food Sci. 69 (11/12):S406-S413.
Van Aardt, M.; Duncan, S.E.; Marcy, J.E.; Long, T.E.; O’Keefe,
S.F.; and Nielsen-Sims, S.R. Effect of antioxidant fortification
on light-induced flavor of milk. In press.
Vickers, Z.M., and Porubcan, A.R. Characterizing milk
aftertaste: the effects of salivation rate, PROP taster status,
or small changes in acidity, fat or sucrose on acceptability of
milk to milk dislikers. Food Quality and Preferences. In press.
Yang, B., and Vickers, Z. Optimization of Cheddar
cheese taste in model cheese systems. 2004. J. Food
Sci. 69:S229-S236.
FPO
DMI2-262 Sensory 05 Tech04.20 10/10/05 4:25 PM Page 1
Related Documents


![IS 10030 (1981): Methods for sensory evaluation of milk powder · 31/12/1981 · IS 10030 (1981): Methods for sensory evaluation of milk powder [FAD 19: Dairy Products and Equipment]](https://static.cupdf.com/doc/110x72/603bc0d909cfd61bf5257c0c/is-10030-1981-methods-for-sensory-evaluation-of-milk-powder-31121981-is.jpg)