Research report Sensory contribution to vocal emotion deficit in Parkinson's disease after subthalamic stimulation Julie P eron a,* , Sezen Cekic a , Claire Haegelen b,c , Paul Sauleau d,e , Sona Patel f , Dominique Drapier d,g , Marc V erin d,h and Didier Grandjean a a ‘Neuroscience of Emotion and Affective Dynamics' Laboratory, Department of Psychology and Swiss Centre for Affective Sciences, University of Geneva, Switzerland b MediCIS, INSERM, Faculty of Medicine, University of Rennes I, France c Neurosurgery Department, Rennes University Hospital, France d 'Behavior and Basal Ganglia' Research Unit, University of Rennes 1, Rennes University Hospital, France e Physiology Department, Rennes University Hospital, France f Department of Speech Language Pathology, Seton Hall University, South Orange, NJ, USA g Adult Psychiatry Department, Guillaume R egnier Hospital, Rennes, France h Neurology Department, Rennes University Hospital, France article info Article history: Received 16 April 2014 Reviewed 15 June 2014 Revised 20 July 2014 Accepted 23 August 2014 Action editor Sonja Kotz Published online 16 September 2014 Keywords: Basal ganglia Deep brain stimulation Parkinson's disease Emotional prosody Subthalamic nucleus abstract Subthalamic nucleus (STN) deep brain stimulation in Parkinson's disease induces modifi- cations in the recognition of emotion from voices (or emotional prosody). Nevertheless, the underlying mechanisms are still only poorly understood, and the role of acoustic features in these deficits has yet to be elucidated. Our aim was to identify the influence of acoustic features on changes in emotional prosody recognition following STN stimulation in Par- kinson's disease. To this end, we analysed the performances of patients on vocal emotion recognition in pre-versus post-operative groups, as well as of matched controls, entering the acoustic features of the stimuli into our statistical models. Analyses revealed that the post-operative biased ratings on the Fear scale when patients listened to happy stimuli were correlated with loudness, while the biased ratings on the Sadness scale when they listened to happiness were correlated with fundamental frequency (F0). Furthermore, disturbed ratings on the Happiness scale when the post-operative patients listened to sadness were found to be correlated with F0. These results suggest that inadequate use of acoustic features following subthalamic stimulation has a significant impact on emotional prosody recognition in patients with Parkinson's disease, affecting the extraction and integration of acoustic cues during emotion perception. © 2014 Elsevier Ltd. All rights reserved. Abbreviations: 18 FDG-PET, 18 Fludeoxyglucose-Positron emission tomography; BG, basal ganglia; DBS, deep brain stimulation; F0, fundamental frequency; FFA, face fusiform area; fMRI, functional magnetic resonance imaging; HC, healthy controls; IFG, inferior frontal gyrus; MADRS, Montgomery-Asberg Depression Rating Scale; OCD, obsessive-compulsive disorder; OFC, orbitofrontal cortex; STG, su- perior temporal gyrus; STN, subthalamic nucleus; STS, superior temporal sulcus; UPDRS, Unified Parkinson's Disease Rating Scale. * Corresponding author. Faculty of Psychology and Educational Sciences, 40 bd du Pont d'Arve, 1205 Geneva, Switzerland. E-mail address: [email protected] (J. P eron). Available online at www.sciencedirect.com ScienceDirect Journal homepage: www.elsevier.com/locate/cortex cortex 63 (2015) 172 e183 http://dx.doi.org/10.1016/j.cortex.2014.08.023 0010-9452/© 2014 Elsevier Ltd. All rights reserved.

Welcome message from author
This document is posted to help you gain knowledge. Please leave a comment to let me know what you think about it! Share it to your friends and learn new things together.
Transcript
www.sciencedirect.com
c o r t e x 6 3 ( 2 0 1 5 ) 1 7 2e1 8 3
Available online at
ScienceDirect
Journal homepage: www.elsevier.com/locate/cortex
Research report
Sensory contribution to vocal emotion deficit inParkinson's disease after subthalamic stimulation
Julie P�eron a,*, Sezen Cekic a, Claire Haegelen b,c, Paul Sauleau d,e,Sona Patel f, Dominique Drapier d,g, Marc V�erin d,h and Didier Grandjean a
a ‘Neuroscience of Emotion and Affective Dynamics' Laboratory, Department of Psychology and Swiss Centre for
Affective Sciences, University of Geneva, Switzerlandb MediCIS, INSERM, Faculty of Medicine, University of Rennes I, Francec Neurosurgery Department, Rennes University Hospital, Franced 'Behavior and Basal Ganglia' Research Unit, University of Rennes 1, Rennes University Hospital, Francee Physiology Department, Rennes University Hospital, Francef Department of Speech Language Pathology, Seton Hall University, South Orange, NJ, USAg Adult Psychiatry Department, Guillaume R�egnier Hospital, Rennes, Franceh Neurology Department, Rennes University Hospital, France
a r t i c l e i n f o
Article history:
Received 16 April 2014
Reviewed 15 June 2014
Revised 20 July 2014
Accepted 23 August 2014
Action editor Sonja Kotz
Published online 16 September 2014
Keywords:
Basal ganglia
Deep brain stimulation
Parkinson's disease
Emotional prosody
Subthalamic nucleus
Abbreviations: 18FDG-PET, 18Fludeoxyglucfundamental frequency; FFA, face fusiform agyrus; MADRS, Montgomery-Asberg Depressperior temporal gyrus; STN, subthalamic nu* Corresponding author. Faculty of PsychologE-mail address: [email protected] (J. P
http://dx.doi.org/10.1016/j.cortex.2014.08.0230010-9452/© 2014 Elsevier Ltd. All rights rese
a b s t r a c t
Subthalamic nucleus (STN) deep brain stimulation in Parkinson's disease induces modifi-
cations in the recognition of emotion from voices (or emotional prosody). Nevertheless, the
underlying mechanisms are still only poorly understood, and the role of acoustic features
in these deficits has yet to be elucidated. Our aim was to identify the influence of acoustic
features on changes in emotional prosody recognition following STN stimulation in Par-
kinson's disease. To this end, we analysed the performances of patients on vocal emotion
recognition in pre-versus post-operative groups, as well as of matched controls, entering
the acoustic features of the stimuli into our statistical models. Analyses revealed that the
post-operative biased ratings on the Fear scale when patients listened to happy stimuli
were correlated with loudness, while the biased ratings on the Sadness scale when they
listened to happiness were correlated with fundamental frequency (F0). Furthermore,
disturbed ratings on the Happiness scale when the post-operative patients listened to
sadness were found to be correlated with F0. These results suggest that inadequate use of
acoustic features following subthalamic stimulation has a significant impact on emotional
prosody recognition in patients with Parkinson's disease, affecting the extraction and
integration of acoustic cues during emotion perception.
© 2014 Elsevier Ltd. All rights reserved.
ose-Positron emission tomography; BG, basal ganglia; DBS, deep brain stimulation; F0,rea; fMRI, functional magnetic resonance imaging; HC, healthy controls; IFG, inferior frontalion Rating Scale; OCD, obsessive-compulsive disorder; OFC, orbitofrontal cortex; STG, su-cleus; STS, superior temporal sulcus; UPDRS, Unified Parkinson's Disease Rating Scale.y and Educational Sciences, 40 bd du Pont d'Arve, 1205 Geneva, Switzerland.�eron).
rved.
c o r t e x 6 3 ( 2 0 1 5 ) 1 7 2e1 8 3 173
1. Introduction
By demonstrating that subthalamic nucleus (STN) deep brain
stimulation (DBS) in Parkinson's disease induces modifica-
tions in emotion processing, previous research has made it
possible to infer the functional involvement of the STN in this
domain (see, P�eron, Fruhholz, V�erin, & Grandjean, 2013 for a
review). STN DBS in Parkinson's disease has been reported to
inducemodifications in all the emotional components studied
so far (subjective feeling, motor expression of emotion,
arousal, action tendencies, cognitive processes, and emotion
recognition), irrespective of stimulus valence (positive or
negative) and sensory-inputmodality. In emotion recognition,
for instance, these patients exhibit deficits or impairments
both for facial emotion (Biseul et al., 2005; Drapier et al., 2008;
Dujardin et al., 2004; Le Jeune et al., 2008; P�eron, Biseul, et al.,
2010; Schroeder et al., 2004) and for vocal emotion: so-called
emotional prosody (Bruck, Wildgruber, Kreifelts, Kruger, &
Wachter, 2011; P�eron, Grandjean, et al., 2010).
Emotional prosody refers to the suprasegmental and
segmental changes that take place in the course of a spoken
utterance, affecting physical properties such as amplitude,
timing, and fundamental frequency (F0), the last of these
being perceived as pitch (Grandjean, Banziger, & Scherer,
2006). An additional cue to emotion is voice quality, the
percept derived from the energy distribution of a speaker'sfrequency spectrum, which can be described using adjectives
such as shrill or soft, and can have an impact at both the
segmental and the suprasegmental levels (Schirmer & Kotz,
2006). Emotional prosody recognition has been shown to
correlate with perceived modulations of these different
acoustic features during an emotional episode experienced by
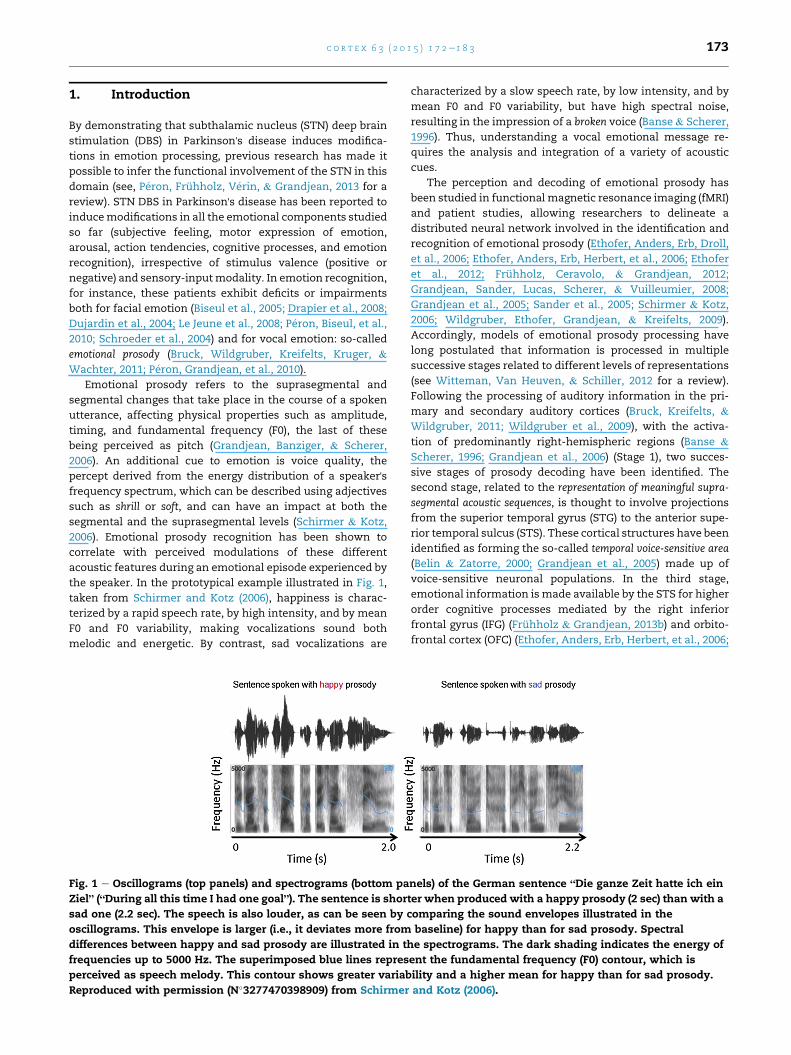
the speaker. In the prototypical example illustrated in Fig. 1,
taken from Schirmer and Kotz (2006), happiness is charac-
terized by a rapid speech rate, by high intensity, and by mean
F0 and F0 variability, making vocalizations sound both
melodic and energetic. By contrast, sad vocalizations are
Fig. 1 e Oscillograms (top panels) and spectrograms (bottom pa
Ziel” (“During all this time I had one goal”). The sentence is shor
sad one (2.2 sec). The speech is also louder, as can be seen by c
oscillograms. This envelope is larger (i.e., it deviates more from
differences between happy and sad prosody are illustrated in th
frequencies up to 5000 Hz. The superimposed blue lines repres
perceived as speech melody. This contour shows greater variab
Reproduced with permission (N�3277470398909) from Schirmer
characterized by a slow speech rate, by low intensity, and by
mean F0 and F0 variability, but have high spectral noise,
resulting in the impression of a broken voice (Banse & Scherer,
1996). Thus, understanding a vocal emotional message re-
quires the analysis and integration of a variety of acoustic
cues.
The perception and decoding of emotional prosody has
been studied in functional magnetic resonance imaging (fMRI)
and patient studies, allowing researchers to delineate a
distributed neural network involved in the identification and
recognition of emotional prosody (Ethofer, Anders, Erb, Droll,
et al., 2006; Ethofer, Anders, Erb, Herbert, et al., 2006; Ethofer
et al., 2012; Fruhholz, Ceravolo, & Grandjean, 2012;
Grandjean, Sander, Lucas, Scherer, & Vuilleumier, 2008;
Grandjean et al., 2005; Sander et al., 2005; Schirmer & Kotz,
2006; Wildgruber, Ethofer, Grandjean, & Kreifelts, 2009).
Accordingly, models of emotional prosody processing have
long postulated that information is processed in multiple
successive stages related to different levels of representations
(see Witteman, Van Heuven, & Schiller, 2012 for a review).
Following the processing of auditory information in the pri-
mary and secondary auditory cortices (Bruck, Kreifelts, &
Wildgruber, 2011; Wildgruber et al., 2009), with the activa-
tion of predominantly right-hemispheric regions (Banse &
Scherer, 1996; Grandjean et al., 2006) (Stage 1), two succes-
sive stages of prosody decoding have been identified. The
second stage, related to the representation of meaningful supra-
segmental acoustic sequences, is thought to involve projections
from the superior temporal gyrus (STG) to the anterior supe-
rior temporal sulcus (STS). These cortical structures have been
identified as forming the so-called temporal voice-sensitive area
(Belin & Zatorre, 2000; Grandjean et al., 2005) made up of
voice-sensitive neuronal populations. In the third stage,
emotional information is made available by the STS for higher
order cognitive processes mediated by the right inferior
frontal gyrus (IFG) (Fruhholz & Grandjean, 2013b) and orbito-
frontal cortex (OFC) (Ethofer, Anders, Erb, Herbert, et al., 2006;
nels) of the German sentence “Die ganze Zeit hatte ich ein
ter when produced with a happy prosody (2 sec) than with a
omparing the sound envelopes illustrated in the
baseline) for happy than for sad prosody. Spectral
e spectrograms. The dark shading indicates the energy of
ent the fundamental frequency (F0) contour, which is
ility and a higher mean for happy than for sad prosody.
and Kotz (2006).
c o r t e x 6 3 ( 2 0 1 5 ) 1 7 2e1 8 3174
Grandjean et al., 2008; Sander et al., 2005; Wildgruber et al.,
2004). This stage appears to be related to the explicit evalua-
tion of vocally expressed emotions.
In addition to this frontotemporal network, increased
activity has also been observed within the amygdaloid nuclei
in response to emotional prosody (Fruhholz et al., 2012;
Fruhholz & Grandjean, 2013a; Grandjean et al., 2005; Sander
et al., 2005). Although it was not their focus, these studies
have also reported the involvement of subcortical regions
(other than the amygdaloid nuclei) in the processing of
emotional prosody, such as the thalamus (Wildgruber et al.,
2004) and the basal ganglia (BG). The involvement of the
caudate and putamen has repeatedly been observed in fMRI,
patient, and electroencephalography studies (Bach et al.,
2008; Fruhholz et al., 2012; Grandjean et al., 2005; Kotz
et al., 2003; Morris, Scott, & Dolan, 1999; Paulmann, Pell, &
Kotz, 2008; Paulmann, Pell, & Kotz, 2009; Sidtis & Van
Lancker Sidtis, 2003). More recently, the studies exploring
the emotional effects of STN DBS in Parkinson's disease have
highlighted the potential involvement of the STN in the brain
network subtending emotional prosody processing (Bruck,
Wildgruber, et al., 2011; see also, P�eron et al., 2013 for a re-
view; P�eron, Grandjean, et al., 2010). In the study by P�eron,
Grandjean, et al. (2010), an original emotional prosody para-
digm was administered to post-operative Parkinson's pa-
tients, preoperative Parkinson's patients, and matched
controls. Results showed that, compared with the other two
groups, the post-operative group exhibited a systematic
emotional bias, with emotions being perceived more
strongly. More specifically, contrasts notably revealed that,
compared with preoperative patients and healthy matched
controls, the post-operative group rated “happiness” more
intensely when they listened to fearful stimuli, and they
rated “surprise” significantly more intensely when they
listened to angry or fearful utterances. Interestingly, a recent
high-resolution fMRI study in healthy participants reinforced
the hypothesis that the STN plays a functional role in
emotional prosody processing, reporting left STN activity
during a gender task that compared angry voices with neutral
stimuli (Fruhholz et al., 2012; P�eron et al., 2013). It is worth
noting that, while these results seem to confirm the
involvement of the BG, with further supporting evidence
coming from numerous sources (for a review, see Gray &
Tickle-Degnen, 2010; see also P�eron, Dondaine, Le Jeune,
Grandjean, & Verin, 2012), most models of emotional pros-
ody processing fail to specify the functional role of either the
BG in general or the STN in particular, although some authors
have attempted to do so.
Paulmann et al. (2009), for instance, suggested that the BG
are involved in integrating emotional information from
different sources. Among other things, they are thought to
play a functional role in matching acoustic speech charac-
teristics such as perceived pitch, duration, and loudness (i.e.,
prosodic information) with semantic emotional information.
Kotz and Schwartze (2010) elaborated on this suggestion by
underlining the functional role of the BG in decoding
emotional prosody. They postulated that these deep struc-
tures are involved in the rhythmic aspects of speech decoding.
The BG therefore seem to be involved in the early stage, and
above all, the second stage of emotional prosody processing
(see earlier for a description of the multistage models of
emotional prosody processing).
From the emotional effects of STN DBS reported in the
Parkinson's disease literature, P�eron et al. (2013) have posited
that the BG and, more specifically, the STN, coordinate neural
patterns, either synchronizing or desynchronizing the activity
of the different neuronal populations involved in specific
emotion components. They claim that the STN plays “the role
of neural rhythm organizer at the cortical and subcortical
levels in emotional processing, thus explaining why the BG
are sensitive to both the temporal and the structural organi-
zation of events” (P�eron et al., 2013). Their model incorporates
the proposal put forward by Paulmann et al. (2009) and elab-
orated on by Kotz and Schwartze (2010), but goes one step
further by suggesting that the BG and, more specifically, the
STN, are sensitive to rhythm because of their intrinsic, func-
tional role as rhythm organizer or coordinator of neural
patterns.
In this context, the exact contribution of the STN and,more
generally, the BG, to emotional prosody decoding remains to
be clarified. More specifically, the questions of the interaction
between the effects of STN DBS per se and the nature of the
auditory emotional material (e.g., its acoustic features), as
well as the impact that DBSmight have on the construction of
the acoustic object/auditory percept, has yet to be resolved.
The influence of acoustic features on emotional prosody
recognition in patients with Parkinson's disease undergoing
STN DBS has not been adequately accounted for to date, even
though this question is of crucial interest since, as explained
earlier, evidence gathered from fMRI and lesion models have
led to the hypothesis that the BG play a critical and potentially
direct role in the integration of the acoustic features of speech,
especially in rhythm perception (Kotz & Schwartze, 2010; Pell
& Leonard, 2003).
From the results of an 18fludeoxyglucose-positron emis-
sion tomography (18FDG-PET) study comparing resting-state
glucose metabolism before and after STN DBS in Parkinson'sdisease (Le Jeune et al., 2010), we postulated that acoustic
features have an impact on the emotional prosody distur-
bances observed following STN DBS. This study indeed
showed that STN DBS modifies metabolic activity across a
large and distributed network encompassing areas known to
be involved in the different stages of emotional prosody
decoding (notably the second and third stages in Schirmer and
Kotz's 2006, with clusters found in the STG and STS regions)
(Le Jeune et al., 2010).
In this context, the aim of the present study was to
pinpoint the influence of acoustic features on changes in
emotional prosody recognition following STN DBS in Parkin-
son's disease. To this end, we analysed the vocal emotion
recognition performances of 21 Parkinson's patients in a pre-
operative condition, 21 Parkinson's patients in a post-
operative condition, and 21 matched healthy controls (HC),
derived from the data published in a previous study (P�eron,
Grandjean, et al., 2010), by entering the acoustic features of
the stimuli into our statistical models as dependent variables
of interest. This validated emotional prosody recognition task
(P�eron et al., 2011; P�eron, Grandjean, Drapier, & V�erin, 2014;
P�eron, Grandjean, et al., 2010) has proven to be relevant for
studying the affective effects of STN DBS in PD patients,
c o r t e x 6 3 ( 2 0 1 5 ) 1 7 2e1 8 3 175
notably because of its sensitivity (P�eron, 2014). The use of vi-
sual (continuous) analogue scales is indeed far more sensitive
to emotional effects than are categorization and forced-choice
tasks (naming of emotional faces and emotional prosody),
chiefly because visual analogue scales do not induce catego-
rization biases (K.R. Scherer & Ekman, 2008).
2. Materials and methods
2.1. Participants and methods
The performance data from two groups of patients with Par-
kinson's disease (preoperative and post-operative groups) and
an HC group, as described in a previous study (P�eron,
Grandjean, et al., 2010), were included in the current study
(N ¼ 21 in each group). The two patient groups were compa-
rable for disease duration and cognitive functions, as well as
for dopamine replacement therapy, calculated on the basis of
correspondences adapted from Lozano et al. (1995). All three
groups were matched for sex, age, and education level. After
receiving a full description of the study, all the participants
provided their written informed consent. The study was
conducted in accordancewith the Declaration of Helsinki. The
characteristics of the two patient groups and the HC group are
presented in Table 1.
All the Parkinson's patients (preoperative and post-
operative) underwent motor (Core Assessment Program for
Intracerebral Transplantation; Langston et al., 1992), neuro-
psychological (Mattis Dementia Rating Scale, a series of tests
assessing frontal executive functions and a scale assessing
depression; Mattis, 1988), and emotional prosody assessments
(see below). All the patients were on their normal dopamine
replacement therapy (i.e., they were “on-dopa”) when they
performed the neuropsychological and emotional assess-
ments. In the post-operative condition, the patients were on-
dopa and on-stimulation. The overall neurosurgical method-
ology for the post-operative group was similar to that
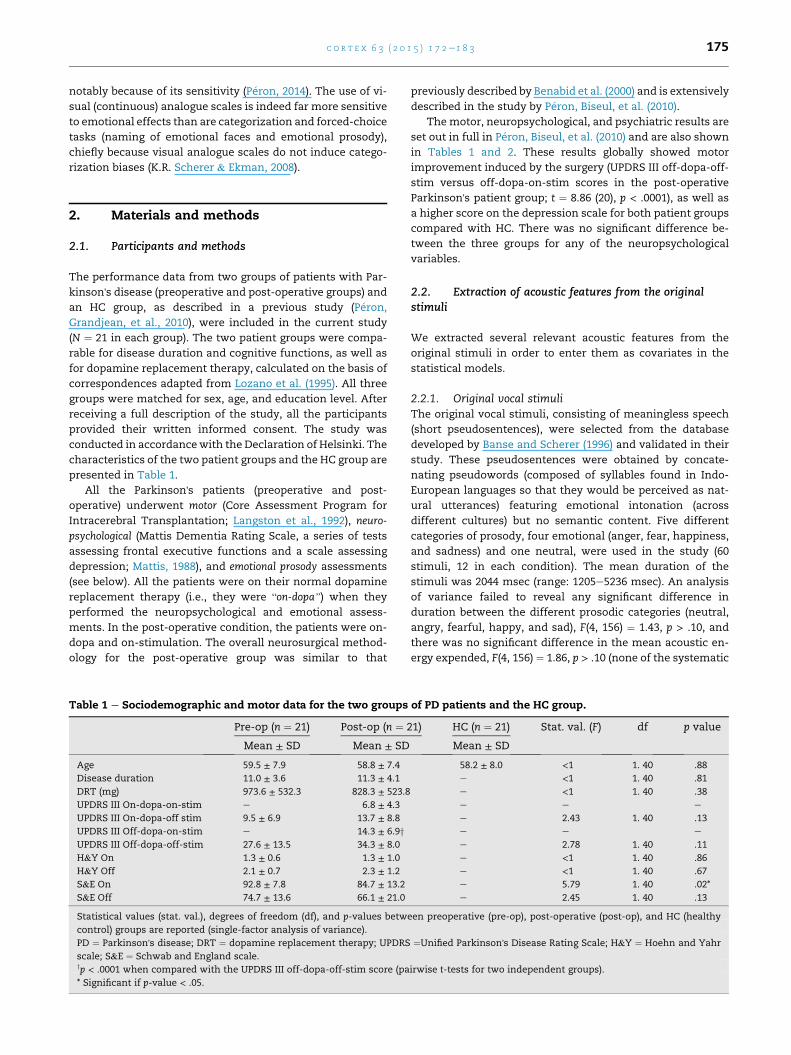
Table 1 e Sociodemographic and motor data for the two groups
Pre-op (n ¼ 21) Post-op (n ¼ 2
Mean ± SD Mean ± SD
Age 59.5 ± 7.9 58.8 ± 7.4
Disease duration 11.0 ± 3.6 11.3 ± 4.1
DRT (mg) 973.6 ± 532.3 828.3 ± 523.8
UPDRS III On-dopa-on-stim e 6.8 ± 4.3
UPDRS III On-dopa-off stim 9.5 ± 6.9 13.7 ± 8.8
UPDRS III Off-dopa-on-stim e 14.3 ± 6.9yUPDRS III Off-dopa-off-stim 27.6 ± 13.5 34.3 ± 8.0
H&Y On 1.3 ± 0.6 1.3 ± 1.0
H&Y Off 2.1 ± 0.7 2.3 ± 1.2
S&E On 92.8 ± 7.8 84.7 ± 13.2
S&E Off 74.7 ± 13.6 66.1 ± 21.0
Statistical values (stat. val.), degrees of freedom (df), and p-values betw
control) groups are reported (single-factor analysis of variance).
PD ¼ Parkinson's disease; DRT ¼ dopamine replacement therapy; UPDRS
scale; S&E ¼ Schwab and England scale.yp < .0001 when compared with the UPDRS III off-dopa-off-stim score (pa
* Significant if p-value < .05.
previously described by Benabid et al. (2000) and is extensively
described in the study by P�eron, Biseul, et al. (2010).
The motor, neuropsychological, and psychiatric results are
set out in full in P�eron, Biseul, et al. (2010) and are also shown
in Tables 1 and 2. These results globally showed motor
improvement induced by the surgery (UPDRS III off-dopa-off-
stim versus off-dopa-on-stim scores in the post-operative
Parkinson's patient group; t ¼ 8.86 (20), p < .0001), as well as
a higher score on the depression scale for both patient groups
compared with HC. There was no significant difference be-
tween the three groups for any of the neuropsychological
variables.
2.2. Extraction of acoustic features from the originalstimuli
We extracted several relevant acoustic features from the
original stimuli in order to enter them as covariates in the
statistical models.
2.2.1. Original vocal stimuliThe original vocal stimuli, consisting of meaningless speech
(short pseudosentences), were selected from the database
developed by Banse and Scherer (1996) and validated in their
study. These pseudosentences were obtained by concate-
nating pseudowords (composed of syllables found in Indo-
European languages so that they would be perceived as nat-
ural utterances) featuring emotional intonation (across
different cultures) but no semantic content. Five different
categories of prosody, four emotional (anger, fear, happiness,
and sadness) and one neutral, were used in the study (60
stimuli, 12 in each condition). The mean duration of the
stimuli was 2044 msec (range: 1205e5236 msec). An analysis
of variance failed to reveal any significant difference in
duration between the different prosodic categories (neutral,
angry, fearful, happy, and sad), F(4, 156) ¼ 1.43, p > .10, and
there was no significant difference in the mean acoustic en-
ergy expended, F(4, 156) ¼ 1.86, p > .10 (none of the systematic
of PD patients and the HC group.
1) HC (n ¼ 21) Stat. val. (F) df p value
Mean ± SD
58.2 ± 8.0 <1 1. 40 .88
e <1 1. 40 .81
e <1 1. 40 .38
e e e
e 2.43 1. 40 .13
e e e
e 2.78 1. 40 .11
e <1 1. 40 .86
e <1 1. 40 .67
e 5.79 1. 40 .02*
e 2.45 1. 40 .13
een preoperative (pre-op), post-operative (post-op), and HC (healthy
¼Unified Parkinson's Disease Rating Scale; H&Y ¼ Hoehn and Yahr
irwise t-tests for two independent groups).
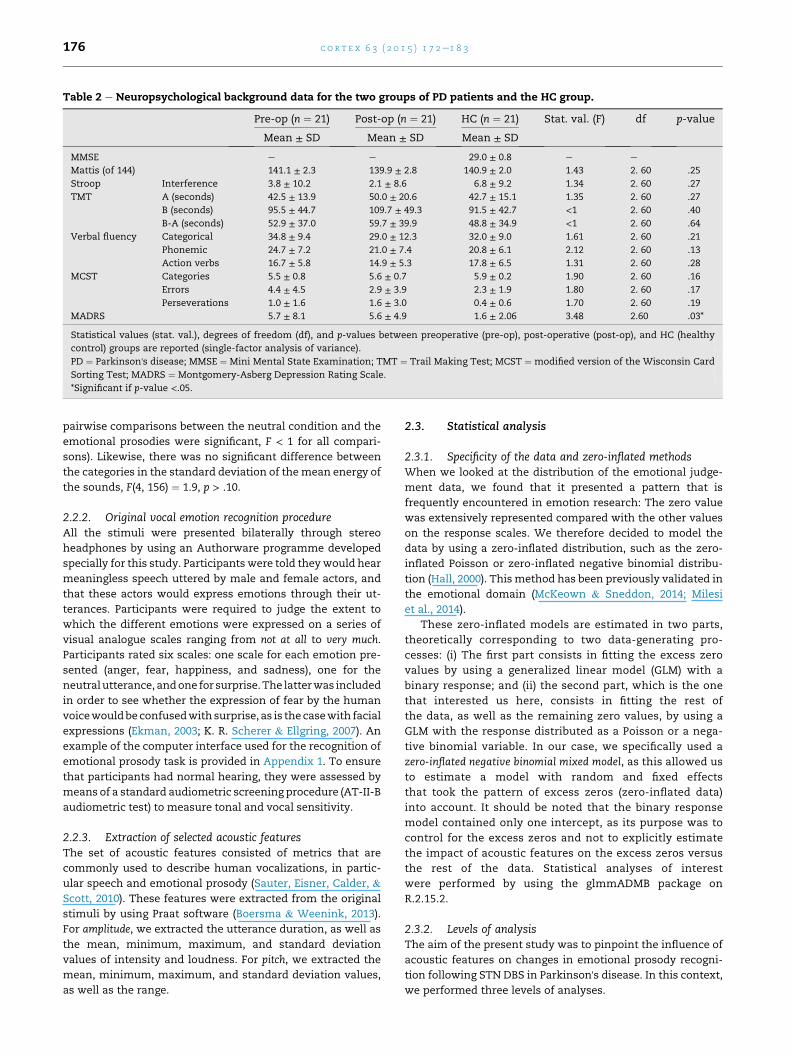
Table 2 e Neuropsychological background data for the two groups of PD patients and the HC group.
Pre-op (n ¼ 21) Post-op (n ¼ 21) HC (n ¼ 21) Stat. val. (F) df p-value
Mean ± SD Mean ± SD Mean ± SD
MMSE e e 29.0 ± 0.8 e e
Mattis (of 144) 141.1 ± 2.3 139.9 ± 2.8 140.9 ± 2.0 1.43 2. 60 .25
Stroop Interference 3.8 ± 10.2 2.1 ± 8.6 6.8 ± 9.2 1.34 2. 60 .27
TMT A (seconds) 42.5 ± 13.9 50.0 ± 20.6 42.7 ± 15.1 1.35 2. 60 .27
B (seconds) 95.5 ± 44.7 109.7 ± 49.3 91.5 ± 42.7 <1 2. 60 .40
B-A (seconds) 52.9 ± 37.0 59.7 ± 39.9 48.8 ± 34.9 <1 2. 60 .64
Verbal fluency Categorical 34.8 ± 9.4 29.0 ± 12.3 32.0 ± 9.0 1.61 2. 60 .21
Phonemic 24.7 ± 7.2 21.0 ± 7.4 20.8 ± 6.1 2.12 2. 60 .13
Action verbs 16.7 ± 5.8 14.9 ± 5.3 17.8 ± 6.5 1.31 2. 60 .28
MCST Categories 5.5 ± 0.8 5.6 ± 0.7 5.9 ± 0.2 1.90 2. 60 .16
Errors 4.4 ± 4.5 2.9 ± 3.9 2.3 ± 1.9 1.80 2. 60 .17
Perseverations 1.0 ± 1.6 1.6 ± 3.0 0.4 ± 0.6 1.70 2. 60 .19
MADRS 5.7 ± 8.1 5.6 ± 4.9 1.6 ± 2.06 3.48 2.60 .03*
Statistical values (stat. val.), degrees of freedom (df), and p-values between preoperative (pre-op), post-operative (post-op), and HC (healthy
control) groups are reported (single-factor analysis of variance).
PD ¼ Parkinson's disease; MMSE ¼ Mini Mental State Examination; TMT ¼ Trail Making Test; MCST ¼ modified version of the Wisconsin Card
Sorting Test; MADRS ¼ Montgomery-Asberg Depression Rating Scale.
*Significant if p-value <.05.
c o r t e x 6 3 ( 2 0 1 5 ) 1 7 2e1 8 3176
pairwise comparisons between the neutral condition and the
emotional prosodies were significant, F < 1 for all compari-
sons). Likewise, there was no significant difference between
the categories in the standard deviation of themean energy of
the sounds, F(4, 156) ¼ 1.9, p > .10.
2.2.2. Original vocal emotion recognition procedureAll the stimuli were presented bilaterally through stereo
headphones by using an Authorware programme developed
specially for this study. Participants were told theywould hear
meaningless speech uttered by male and female actors, and
that these actors would express emotions through their ut-
terances. Participants were required to judge the extent to
which the different emotions were expressed on a series of
visual analogue scales ranging from not at all to very much.
Participants rated six scales: one scale for each emotion pre-
sented (anger, fear, happiness, and sadness), one for the
neutralutterance, andone for surprise.The latterwas included
in order to see whether the expression of fear by the human
voicewouldbe confusedwith surprise, as is the casewith facial
expressions (Ekman, 2003; K. R. Scherer & Ellgring, 2007). An
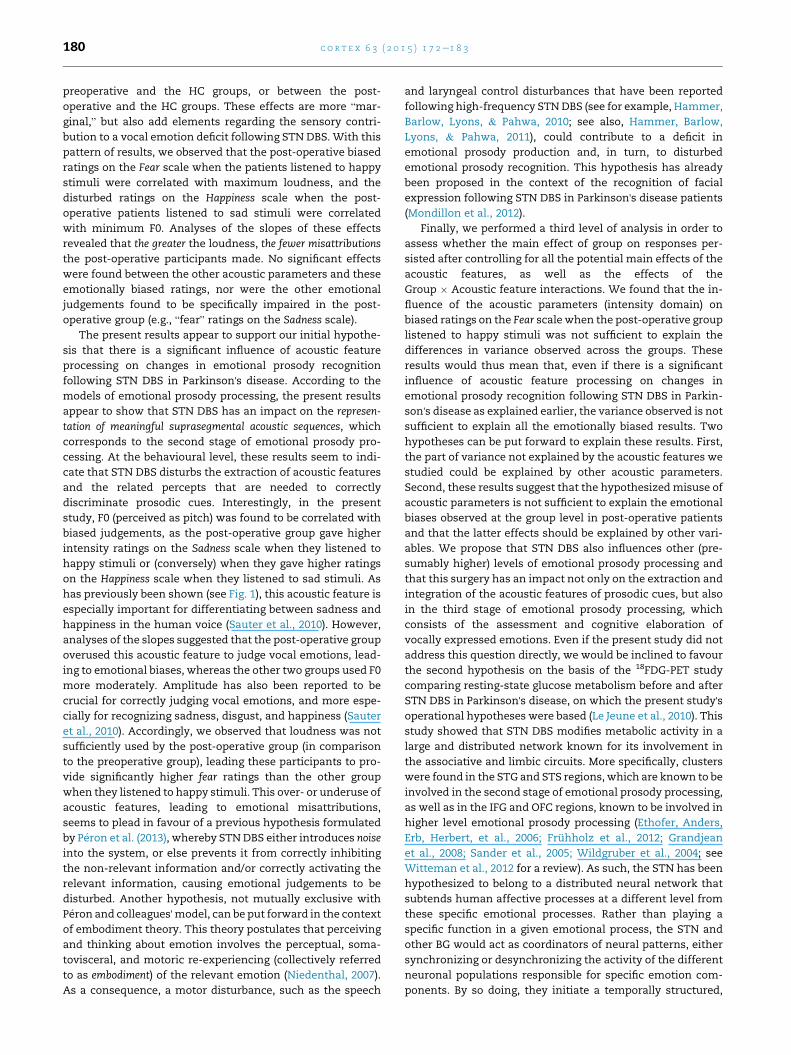
example of the computer interface used for the recognition of
emotional prosody task is provided in Appendix 1. To ensure
that participants had normal hearing, they were assessed by
means of a standard audiometric screening procedure (AT-II-B
audiometric test) to measure tonal and vocal sensitivity.
2.2.3. Extraction of selected acoustic featuresThe set of acoustic features consisted of metrics that are
commonly used to describe human vocalizations, in partic-
ular speech and emotional prosody (Sauter, Eisner, Calder, &
Scott, 2010). These features were extracted from the original
stimuli by using Praat software (Boersma & Weenink, 2013).
For amplitude, we extracted the utterance duration, as well as
the mean, minimum, maximum, and standard deviation
values of intensity and loudness. For pitch, we extracted the
mean, minimum, maximum, and standard deviation values,
as well as the range.
2.3. Statistical analysis
2.3.1. Specificity of the data and zero-inflated methodsWhen we looked at the distribution of the emotional judge-
ment data, we found that it presented a pattern that is
frequently encountered in emotion research: The zero value
was extensively represented compared with the other values
on the response scales. We therefore decided to model the
data by using a zero-inflated distribution, such as the zero-
inflated Poisson or zero-inflated negative binomial distribu-
tion (Hall, 2000). Thismethod has been previously validated in
the emotional domain (McKeown & Sneddon, 2014; Milesi
et al., 2014).
These zero-inflated models are estimated in two parts,
theoretically corresponding to two data-generating pro-
cesses: (i) The first part consists in fitting the excess zero
values by using a generalized linear model (GLM) with a
binary response; and (ii) the second part, which is the one
that interested us here, consists in fitting the rest of
the data, as well as the remaining zero values, by using a
GLM with the response distributed as a Poisson or a nega-
tive binomial variable. In our case, we specifically used a
zero-inflated negative binomial mixed model, as this allowed us
to estimate a model with random and fixed effects
that took the pattern of excess zeros (zero-inflated data)
into account. It should be noted that the binary response
model contained only one intercept, as its purpose was to
control for the excess zeros and not to explicitly estimate
the impact of acoustic features on the excess zeros versus
the rest of the data. Statistical analyses of interest
were performed by using the glmmADMB package on
R.2.15.2.
2.3.2. Levels of analysisThe aim of the present study was to pinpoint the influence of
acoustic features on changes in emotional prosody recogni-
tion following STN DBS in Parkinson's disease. In this context,
we performed three levels of analyses.
c o r t e x 6 3 ( 2 0 1 5 ) 1 7 2e1 8 3 177
The first level of analysis served to assess the effect of
group on each response scale for each prosodic category. To
this end, we tested the main effect of group for each scale and
each emotion, controlling for all the main effects on the
remaining scales and emotions.
Second, in order to assess the differential impact of
acoustic features on emotional judgements between groups
(preoperative, post-operative, HC), we examined the statisti-
cal significance of the interaction effects between group and each
acoustic feature of interest. We chose to focus on this second
level of analysis for the experimental conditions in which the
post-operative group was found to have performed signifi-
cantly differently from both the preoperative and HC groups
in the first level of analysis in order to reduce the number of
comparisons. For this second level of analysis, the acoustic
features were split into two different sets. The first set con-
tained duration, and the acoustic features related to intensity
(minimum, maximum, mean, SD) and loudness (minimum,
maximum, mean, SD), and the second set included the
acoustic features related to pitch (minimum,maximum,mean,
SD). We tested each interaction effect between group and
acoustic feature separately, controlling for the interaction
effects between groups and the remaining acoustic features.
The results therefore had to be interpreted in this classifica-
tion context. For example, if the interaction effect between
group and minimum intensity was significant, it would mean
that at least two groups responded differently from each other
as a function of the minimum intensity value, given that all
the main effects of group and of the acoustic features
belonging to the first set of parameters, as well as all the
interaction effects between these same factors (except for the
interaction of interest), were taken into account.
Third and last, in order to assesswhether themain effect of
group on responses persisted after controlling for all the
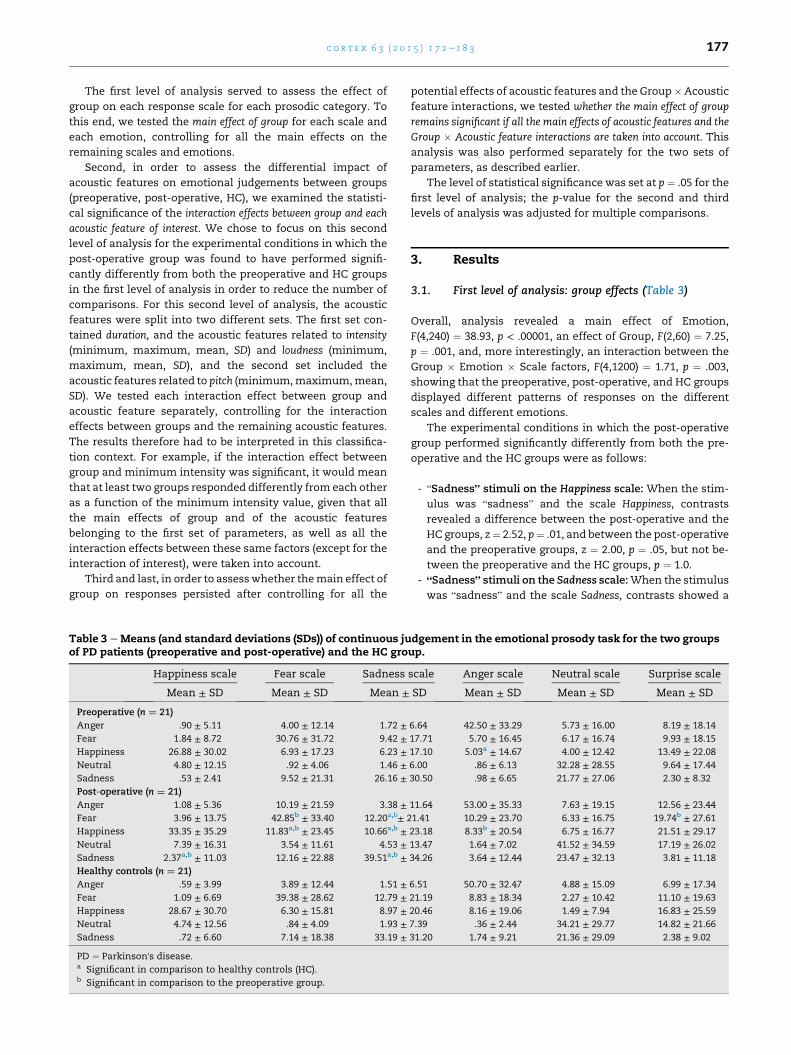
Table 3 eMeans (and standard deviations (SDs)) of continuous juof PD patients (preoperative and post-operative) and the HC gro
Happiness scale Fear scale Sadness
Mean ± SD Mean ± SD Mean ±
Preoperative (n ¼ 21)
Anger .90 ± 5.11 4.00 ± 12.14 1.72 ±Fear 1.84 ± 8.72 30.76 ± 31.72 9.42 ±Happiness 26.88 ± 30.02 6.93 ± 17.23 6.23 ±Neutral 4.80 ± 12.15 .92 ± 4.06 1.46 ±Sadness .53 ± 2.41 9.52 ± 21.31 26.16 ±Post-operative (n ¼ 21)
Anger 1.08 ± 5.36 10.19 ± 21.59 3.38 ±Fear 3.96 ± 13.75 42.85b ± 33.40 12.20a,b± 2
Happiness 33.35 ± 35.29 11.83a,b ± 23.45 10.66a,b ±Neutral 7.39 ± 16.31 3.54 ± 11.61 4.53 ±Sadness 2.37a,b ± 11.03 12.16 ± 22.88 39.51a,b ±Healthy controls (n ¼ 21)
Anger .59 ± 3.99 3.89 ± 12.44 1.51 ±Fear 1.09 ± 6.69 39.38 ± 28.62 12.79 ±Happiness 28.67 ± 30.70 6.30 ± 15.81 8.97 ±Neutral 4.74 ± 12.56 .84 ± 4.09 1.93 ±Sadness .72 ± 6.60 7.14 ± 18.38 33.19 ±
PD ¼ Parkinson's disease.a Significant in comparison to healthy controls (HC).b Significant in comparison to the preoperative group.
potential effects of acoustic features and the Group�Acoustic
feature interactions, we tested whether the main effect of group
remains significant if all the main effects of acoustic features and the
Group � Acoustic feature interactions are taken into account. This
analysis was also performed separately for the two sets of
parameters, as described earlier.
The level of statistical significance was set at p¼ .05 for the
first level of analysis; the p-value for the second and third
levels of analysis was adjusted for multiple comparisons.
3. Results
3.1. First level of analysis: group effects (Table 3)
Overall, analysis revealed a main effect of Emotion,
F(4,240) ¼ 38.93, p < .00001, an effect of Group, F(2,60) ¼ 7.25,
p ¼ .001, and, more interestingly, an interaction between the
Group � Emotion � Scale factors, F(4,1200) ¼ 1.71, p ¼ .003,
showing that the preoperative, post-operative, and HC groups
displayed different patterns of responses on the different
scales and different emotions.
The experimental conditions in which the post-operative
group performed significantly differently from both the pre-
operative and the HC groups were as follows:
- “Sadness” stimuli on the Happiness scale: When the stim-
ulus was “sadness” and the scale Happiness, contrasts
revealed a difference between the post-operative and the
HC groups, z¼ 2.52, p¼ .01, and between the post-operative
and the preoperative groups, z ¼ 2.00, p ¼ .05, but not be-
tween the preoperative and the HC groups, p ¼ 1.0.
- “Sadness” stimuli on the Sadness scale:When the stimulus
was “sadness” and the scale Sadness, contrasts showed a
dgement in the emotional prosody task for the two groupsup.
scale Anger scale Neutral scale Surprise scale
SD Mean ± SD Mean ± SD Mean ± SD
6.64 42.50 ± 33.29 5.73 ± 16.00 8.19 ± 18.14
17.71 5.70 ± 16.45 6.17 ± 16.74 9.93 ± 18.15
17.10 5.03a ± 14.67 4.00 ± 12.42 13.49 ± 22.08
6.00 .86 ± 6.13 32.28 ± 28.55 9.64 ± 17.44
30.50 .98 ± 6.65 21.77 ± 27.06 2.30 ± 8.32
11.64 53.00 ± 35.33 7.63 ± 19.15 12.56 ± 23.44
1.41 10.29 ± 23.70 6.33 ± 16.75 19.74b ± 27.61
23.18 8.33b ± 20.54 6.75 ± 16.77 21.51 ± 29.17
13.47 1.64 ± 7.02 41.52 ± 34.59 17.19 ± 26.02
34.26 3.64 ± 12.44 23.47 ± 32.13 3.81 ± 11.18
6.51 50.70 ± 32.47 4.88 ± 15.09 6.99 ± 17.34
21.19 8.83 ± 18.34 2.27 ± 10.42 11.10 ± 19.63
20.46 8.16 ± 19.06 1.49 ± 7.94 16.83 ± 25.59
7.39 .36 ± 2.44 34.21 ± 29.77 14.82 ± 21.66
31.20 1.74 ± 9.21 21.36 ± 29.09 2.38 ± 9.02
c o r t e x 6 3 ( 2 0 1 5 ) 1 7 2e1 8 3178
difference between the post-operative and the HC groups,
z ¼ 4.02, p < .001, and between the post-operative and the
preoperative groups, z ¼ 3.92, p < .001, but not between the
preoperative and the HC groups, p ¼ .9.
- “Happiness” stimuli on the Fear scale: When the stimulus
was “happiness” and the scale Fear, contrasts showed a
difference between the post-operative and the HC groups,
z ¼ 2.78, p < .001, and between the post-operative and the
preoperative groups, z ¼ 2.79, p < .001, but not between the
preoperative and the HC groups, p ¼ .8.
- “Happiness” stimuli on the Sadness scale: When the
stimulus was “happiness” and the scale Sadness, contrasts
showed a difference between the post-operative and the
HC groups, z ¼ 3.57, p < .001, and between the post-
operative and the preoperative groups, z ¼ 2.70, p < .001,
but not between the preoperative and the HC groups, p¼ .2.
- “Fear stimuli” on the Sadness scale: When the stimulus
was “fear” and the scale Sadness, contrasts showed a dif-
ference between the post-operative and the HC groups,
z ¼ 3.93, p < .001, and between the post-operative and the
preoperative groups, z ¼ 2.47, p ¼ .01, but not between the
preoperative and the HC groups, p ¼ .06.
We also observed the following results:
- “Fear” stimuli on the Fear scale: When the stimulus was
“fear” and the scale Fear, contrasts failed to reveal a sig-
nificant difference between the post-operative and the HC
groups, z¼ 1.66, p¼ .1, or between the preoperative and the
HC groups, p ¼ .3, but there was a significant difference
between the post-operative and the preoperative groups,
z ¼ 2.31, p ¼ .02.
- “Fear” stimuli on the Surprise scale: When the stimulus
was “fear” and the scale Surprise, contrasts showed no
significant difference between the post-operative and the
HC groups, z ¼ 1.75, p ¼ .08, or between the preoperative
and the HC groups, p ¼ .2, but there was a significant dif-
ference between the post-operative and the preoperative
groups, z ¼ 2.38, p ¼ .02.
- “Happiness” stimuli on theAnger scale:When the stimulus
was “happiness” and the scale Anger, contrasts did not
reveal any significant difference between the post-
operative and the HC groups, z ¼ .85, p ¼ .4, but there
Table 4 e Differential impact of acoustic features on vocal emotand HC groups, after controlling for participant effect, excess zerowell as the effects of the remaining Group £ Acoustic feature in
Post-op vs HC
Stat. value p-valu
Happiness on Fear scale e duration �2.41 .02*
Happiness on Fear scale e max. loudness 2.16 .03
Happiness on Sadness scale e max. F0 �2.58 <.01*Sadness on Happiness scale e mean F0 �2.64 <.01*Sadness on Happiness scale e min. F0 2 .04
F0 ¼ fundamental frequency; HC ¼ healthy controls; max. ¼ max
op ¼ preoperative group; Stat. value ¼ statistical value.
*Significant (corrected for multiple comparisons).
was a difference between the post-operative and the pre-
operative groups, z ¼ 2.54, p ¼ .01, and between the pre-
operative and the HC groups, z ¼ 2.10, p ¼ .04.
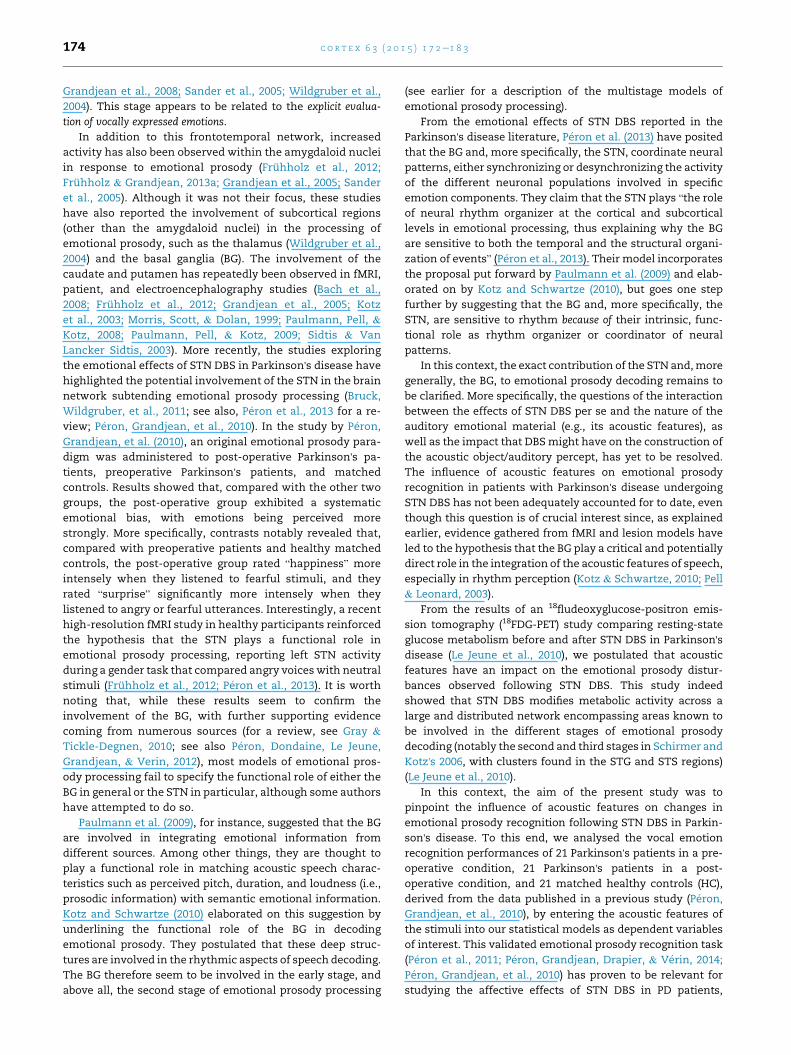
3.2. Second level of analysis: differential impact ofacoustic features on vocal emotion recognition betweenpreoperative, post-operative, and HC groups (Table 4 andFig. 2)
The results of the additional analyses, after controlling for the
participant effect as a random effect, the excess zero pattern
(see Statistical Analysis section), and themain effects of group
and acoustic feature, as well as the effects of the remaining
Group � Acoustic feature interactions, are set out in Table 4.
Selected results of interest are provided in Fig. 2 (the signifi-
cant effects are displayed in Table 4; the other effects were not
significant, p > .1).
3.3. Third level of analysis: main effect of group on vocalemotion recognition, after controlling for all the main effectsof acoustic features and the effects of the group � acousticfeature interactions
We failed to find any significant effects for the following sta-
tistical models: “happiness” stimuli on the Fear scale, pitch
domain (z ¼ 1.90, p ¼ .4); “happiness” stimuli on the Sadness
scale, pitch domain (z¼ 15.32, p¼ .1); and “sadness” stimuli on
the Happiness scale, pitch domain (z ¼ 4.43, p ¼ .1). However,
for “happiness” stimuli on the Fear scale, intensity domain
(intensityeloudnesseduration), we did find a significant main
effect (z ¼ 55.26, p < .0001). More specifically, we observed a
significant difference between the post-operative and the HC
groups (z ¼ 5.07, p < .0001), as well as between the post-
operative and the preoperative groups (z ¼ 4.90, p < .0001),
though not between the preoperative and the HC groups
(z ¼ .23, p ¼ .8).
4. Discussion
The aim of the present study was to pinpoint the influence of
acoustic features on changes in emotional prosody
ion recognition between the preoperative, post-operative,pattern, andmain effects of group and acoustic feature, as
teractions.
Post-op vs Pre-op Pre-op vs HC
e Stat. value p-value Stat. value p-value
�2.23 .02* .74 .4
3.57 <.01* .79 .4
�4.09 <.001* �.96 .3
�2.78 <.01* .48 .6
2.69 <.01* .19 .8
imum; min. ¼ minimum; Post-op ¼ post-operative group; Pre-
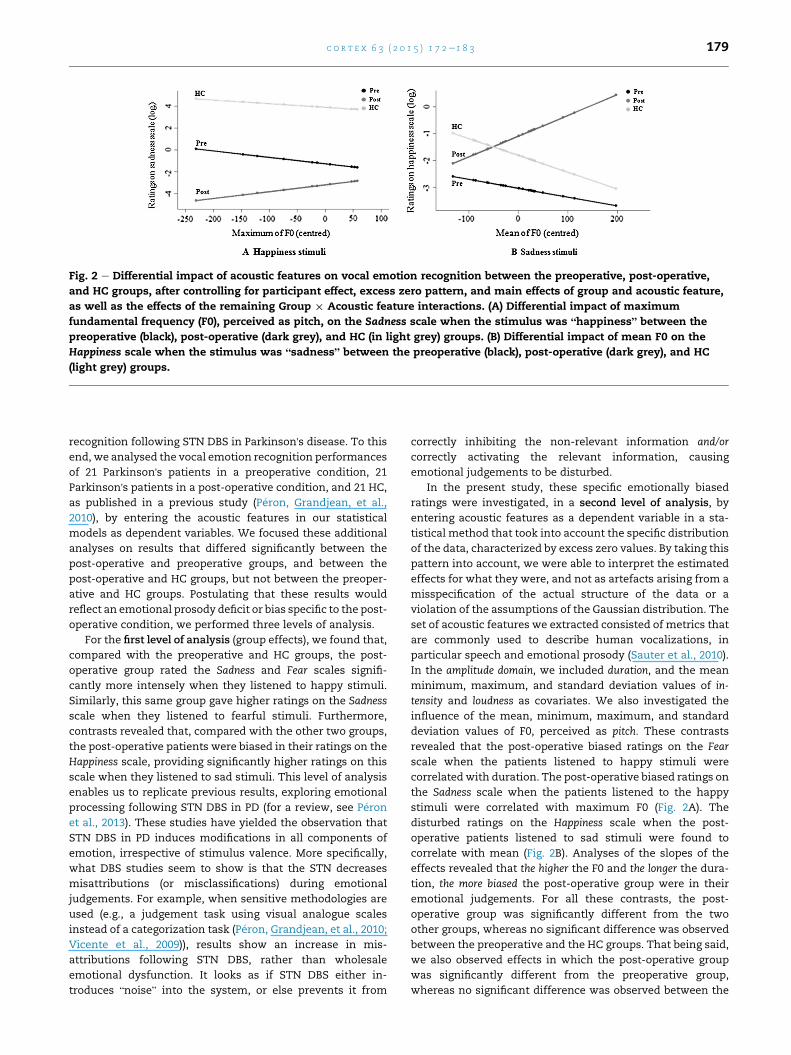
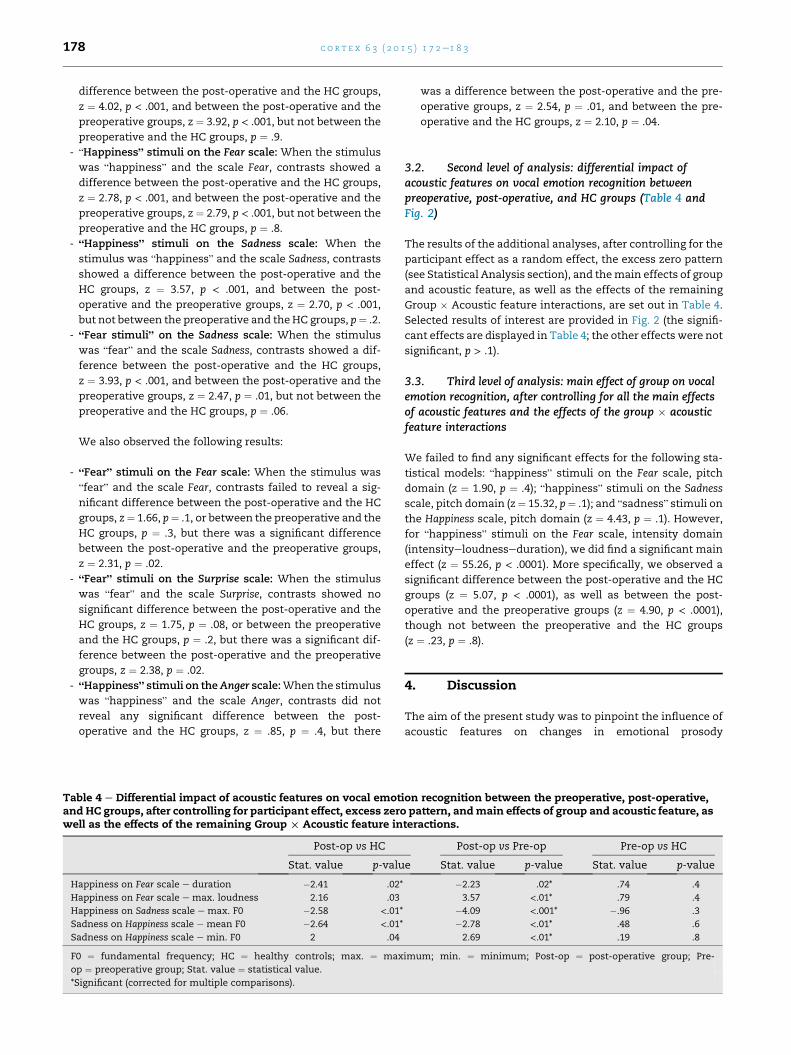
Fig. 2 e Differential impact of acoustic features on vocal emotion recognition between the preoperative, post-operative,
and HC groups, after controlling for participant effect, excess zero pattern, and main effects of group and acoustic feature,
as well as the effects of the remaining Group £ Acoustic feature interactions. (A) Differential impact of maximum
fundamental frequency (F0), perceived as pitch, on the Sadness scale when the stimulus was “happiness” between the
preoperative (black), post-operative (dark grey), and HC (in light grey) groups. (B) Differential impact of mean F0 on the
Happiness scale when the stimulus was “sadness” between the preoperative (black), post-operative (dark grey), and HC
(light grey) groups.
c o r t e x 6 3 ( 2 0 1 5 ) 1 7 2e1 8 3 179
recognition following STN DBS in Parkinson's disease. To this
end, we analysed the vocal emotion recognition performances
of 21 Parkinson's patients in a preoperative condition, 21
Parkinson's patients in a post-operative condition, and 21 HC,
as published in a previous study (P�eron, Grandjean, et al.,
2010), by entering the acoustic features in our statistical
models as dependent variables. We focused these additional
analyses on results that differed significantly between the
post-operative and preoperative groups, and between the
post-operative and HC groups, but not between the preoper-
ative and HC groups. Postulating that these results would
reflect an emotional prosody deficit or bias specific to the post-
operative condition, we performed three levels of analysis.
For the first level of analysis (group effects), we found that,
compared with the preoperative and HC groups, the post-
operative group rated the Sadness and Fear scales signifi-
cantly more intensely when they listened to happy stimuli.
Similarly, this same group gave higher ratings on the Sadness
scale when they listened to fearful stimuli. Furthermore,
contrasts revealed that, compared with the other two groups,
the post-operative patients were biased in their ratings on the
Happiness scale, providing significantly higher ratings on this
scale when they listened to sad stimuli. This level of analysis
enables us to replicate previous results, exploring emotional
processing following STN DBS in PD (for a review, see P�eron
et al., 2013). These studies have yielded the observation that
STN DBS in PD induces modifications in all components of
emotion, irrespective of stimulus valence. More specifically,
what DBS studies seem to show is that the STN decreases
misattributions (or misclassifications) during emotional
judgements. For example, when sensitive methodologies are
used (e.g., a judgement task using visual analogue scales
instead of a categorization task (P�eron, Grandjean, et al., 2010;
Vicente et al., 2009)), results show an increase in mis-
attributions following STN DBS, rather than wholesale
emotional dysfunction. It looks as if STN DBS either in-
troduces “noise” into the system, or else prevents it from
correctly inhibiting the non-relevant information and/or
correctly activating the relevant information, causing
emotional judgements to be disturbed.
In the present study, these specific emotionally biased
ratings were investigated, in a second level of analysis, by
entering acoustic features as a dependent variable in a sta-
tistical method that took into account the specific distribution
of the data, characterized by excess zero values. By taking this
pattern into account, we were able to interpret the estimated
effects for what they were, and not as artefacts arising from a
misspecification of the actual structure of the data or a
violation of the assumptions of the Gaussian distribution. The
set of acoustic features we extracted consisted of metrics that
are commonly used to describe human vocalizations, in
particular speech and emotional prosody (Sauter et al., 2010).
In the amplitude domain, we included duration, and the mean
minimum, maximum, and standard deviation values of in-
tensity and loudness as covariates. We also investigated the
influence of the mean, minimum, maximum, and standard
deviation values of F0, perceived as pitch. These contrasts
revealed that the post-operative biased ratings on the Fear
scale when the patients listened to happy stimuli were
correlated with duration. The post-operative biased ratings on
the Sadness scale when the patients listened to the happy
stimuli were correlated with maximum F0 (Fig. 2A). The
disturbed ratings on the Happiness scale when the post-
operative patients listened to sad stimuli were found to
correlate with mean (Fig. 2B). Analyses of the slopes of the
effects revealed that the higher the F0 and the longer the dura-
tion, the more biased the post-operative group were in their
emotional judgements. For all these contrasts, the post-
operative group was significantly different from the two
other groups, whereas no significant difference was observed
between the preoperative and the HC groups. That being said,
we also observed effects in which the post-operative group
was significantly different from the preoperative group,
whereas no significant difference was observed between the
c o r t e x 6 3 ( 2 0 1 5 ) 1 7 2e1 8 3180
preoperative and the HC groups, or between the post-
operative and the HC groups. These effects are more “mar-
ginal,” but also add elements regarding the sensory contri-
bution to a vocal emotion deficit following STN DBS. With this
pattern of results, we observed that the post-operative biased
ratings on the Fear scale when the patients listened to happy
stimuli were correlated with maximum loudness, and the
disturbed ratings on the Happiness scale when the post-
operative patients listened to sad stimuli were correlated
with minimum F0. Analyses of the slopes of these effects
revealed that the greater the loudness, the fewer misattributions
the post-operative participants made. No significant effects
were found between the other acoustic parameters and these
emotionally biased ratings, nor were the other emotional
judgements found to be specifically impaired in the post-
operative group (e.g., “fear” ratings on the Sadness scale).
The present results appear to support our initial hypothe-
sis that there is a significant influence of acoustic feature
processing on changes in emotional prosody recognition
following STN DBS in Parkinson's disease. According to the
models of emotional prosody processing, the present results
appear to show that STN DBS has an impact on the represen-
tation of meaningful suprasegmental acoustic sequences, which
corresponds to the second stage of emotional prosody pro-
cessing. At the behavioural level, these results seem to indi-
cate that STN DBS disturbs the extraction of acoustic features
and the related percepts that are needed to correctly
discriminate prosodic cues. Interestingly, in the present
study, F0 (perceived as pitch) was found to be correlated with
biased judgements, as the post-operative group gave higher
intensity ratings on the Sadness scale when they listened to
happy stimuli or (conversely) when they gave higher ratings
on the Happiness scale when they listened to sad stimuli. As
has previously been shown (see Fig. 1), this acoustic feature is
especially important for differentiating between sadness and
happiness in the human voice (Sauter et al., 2010). However,
analyses of the slopes suggested that the post-operative group
overused this acoustic feature to judge vocal emotions, lead-
ing to emotional biases, whereas the other two groups used F0
more moderately. Amplitude has also been reported to be
crucial for correctly judging vocal emotions, and more espe-
cially for recognizing sadness, disgust, and happiness (Sauter
et al., 2010). Accordingly, we observed that loudness was not
sufficiently used by the post-operative group (in comparison
to the preoperative group), leading these participants to pro-
vide significantly higher fear ratings than the other group
when they listened to happy stimuli. This over- or underuse of
acoustic features, leading to emotional misattributions,
seems to plead in favour of a previous hypothesis formulated
by P�eron et al. (2013), whereby STNDBS either introduces noise
into the system, or else prevents it from correctly inhibiting
the non-relevant information and/or correctly activating the
relevant information, causing emotional judgements to be
disturbed. Another hypothesis, not mutually exclusive with
P�eron and colleagues'model, can be put forward in the context
of embodiment theory. This theory postulates that perceiving
and thinking about emotion involves the perceptual, soma-
tovisceral, and motoric re-experiencing (collectively referred
to as embodiment) of the relevant emotion (Niedenthal, 2007).
As a consequence, a motor disturbance, such as the speech
and laryngeal control disturbances that have been reported
following high-frequency STNDBS (see for example, Hammer,
Barlow, Lyons, & Pahwa, 2010; see also, Hammer, Barlow,
Lyons, & Pahwa, 2011), could contribute to a deficit in
emotional prosody production and, in turn, to disturbed
emotional prosody recognition. This hypothesis has already
been proposed in the context of the recognition of facial
expression following STN DBS in Parkinson's disease patients
(Mondillon et al., 2012).
Finally, we performed a third level of analysis in order to
assess whether the main effect of group on responses per-
sisted after controlling for all the potential main effects of the
acoustic features, as well as the effects of the
Group � Acoustic feature interactions. We found that the in-
fluence of the acoustic parameters (intensity domain) on
biased ratings on the Fear scale when the post-operative group
listened to happy stimuli was not sufficient to explain the
differences in variance observed across the groups. These
results would thus mean that, even if there is a significant
influence of acoustic feature processing on changes in
emotional prosody recognition following STN DBS in Parkin-
son's disease as explained earlier, the variance observed is not
sufficient to explain all the emotionally biased results. Two
hypotheses can be put forward to explain these results. First,
the part of variance not explained by the acoustic features we
studied could be explained by other acoustic parameters.
Second, these results suggest that the hypothesized misuse of
acoustic parameters is not sufficient to explain the emotional
biases observed at the group level in post-operative patients
and that the latter effects should be explained by other vari-
ables. We propose that STN DBS also influences other (pre-
sumably higher) levels of emotional prosody processing and
that this surgery has an impact not only on the extraction and
integration of the acoustic features of prosodic cues, but also
in the third stage of emotional prosody processing, which
consists of the assessment and cognitive elaboration of
vocally expressed emotions. Even if the present study did not
address this question directly, we would be inclined to favour
the second hypothesis on the basis of the 18FDG-PET study
comparing resting-state glucose metabolism before and after
STN DBS in Parkinson's disease, on which the present study'soperational hypotheses were based (Le Jeune et al., 2010). This
study showed that STN DBS modifies metabolic activity in a
large and distributed network known for its involvement in
the associative and limbic circuits. More specifically, clusters
were found in the STG and STS regions, which are known to be
involved in the second stage of emotional prosody processing,
as well as in the IFG and OFC regions, known to be involved in
higher level emotional prosody processing (Ethofer, Anders,
Erb, Herbert, et al., 2006; Fruhholz et al., 2012; Grandjean
et al., 2008; Sander et al., 2005; Wildgruber et al., 2004; see
Witteman et al., 2012 for a review). As such, the STN has been
hypothesized to belong to a distributed neural network that
subtends human affective processes at a different level from
these specific emotional processes. Rather than playing a
specific function in a given emotional process, the STN and
other BG would act as coordinators of neural patterns, either
synchronizing or desynchronizing the activity of the different
neuronal populations responsible for specific emotion com-
ponents. By so doing, they initiate a temporally structured,
c o r t e x 6 3 ( 2 0 1 5 ) 1 7 2e1 8 3 181
over-learned pattern of neural co-activation and inhibit
competing patterns, thus allowing the central nervous system
to implement amomentarily stable pattern (P�eron et al., 2013).
In this context, and based on the present results, we can
postulate that the STN is involved in both the (de)-synchro-
nization needed for the extraction of the acoustic features of
prosodic cues and (future research will have to directly test
this second part of the assumption) in the (de)-synchroniza-
tion processes needed for higher level evaluative emotional
judgements supposedly mediated by the IFG (Fruhholz &
Grandjean, 2013b). STN DBS is thought to desynchronize the
coordinated activity of these neuronal populations (i.e., first
and/or subsequent stages of emotional prosody processing).
In summary, deficits in the recognition of emotions (in this
case expressed in vocalizations) are well documented in Par-
kinson's disease following STN DBS, although the underlying
mechanisms are still poorly understood. The results of the
present study show that several acoustic features (notably F0,
duration, and loudness) have a significant influence on
disturbed emotional prosody recognition in Parkinson's pa-
tients following STN DBS. Nevertheless, this influence does
not appear to be sufficient to explain these disturbances. Our
results suggest that at least the second stage of emotional
prosody processing (extraction of acoustic features and con-
struction of acoustic objects based on prosodic cues) is
affected by STN DBS. These results appear to be in line with
the hypothesis that the STN acts as a marker for transiently
connected neural networks subserving specific functions.
Future research should investigate the brain modifications
correlated with emotional prosody impairment following STN
DBS, as well as the extent of the involvement of the different
emotional prosody processing stages in these metabolic
modifications. At a more clinical level, deficits in the extrac-
tion of acoustic features constitute appropriate targets for
both behavioural and pharmaceutical follow-up after STN
DBS.
5. Disclosure
The authors report no conflicts of interest. The data acquisi-
tion was carried out at the Neurology Unit of Pontchaillou
Hospital (Rennes University Hospital, France; Prof. Marc
V�erin). The first author (Dr Julie P�eron) was funded by the
Swiss National Foundation (grant no. 105314_140622; Prof.
Didier Grandjean and Dr Julie P�eron), and by the NCCR Af-
fective Sciences funded by the Swiss National Foundation
(project no. 202 e UN7126; Prof. Didier Grandjean). The fun-
ders had no role in data collection, discussion of content,
preparation of the manuscript, or decision to publish.
Acknowledgements
We would like to thank the patients and healthy controls for
giving up their time to take part in this study, as well as Eliz-
abeth Wiles-Portier and Barbara Every for preparing the
manuscript, and the Ear, Nose and Throat Department of
Rennes University Hospital for conducting the hearing tests.
Appendix. Computer interface for the originalparadigm of emotional prosody recognition.
r e f e r e n c e s
Bach, D. R., Grandjean, D., Sander, D., Herdener, M., Strik, W. K., &Seifritz, E. (2008). The effect of appraisal level on processing ofemotional prosody in meaningless speech. NeuroImage, 42(2),919e927.
Banse, R., & Scherer, K. R. (1996). Acoustic profiles in vocalemotion expression. Journal of Personality and Social Psychology,70(3), 614e636.
Belin, P., & Zatorre, R. J. (2000). 'What', 'where' and 'how' inauditory cortex. Nature Neuroscience, 3(10), 965e966.
Benabid, A. L., Koudsie, A., Benazzouz, A., Fraix, V., Ashraf, A., LeBas, J. F., et al. (2000). Subthalamic stimulation for Parkinson'sdisease. Archives of Medical Research, 31(3), 282e289.
Biseul, I., Sauleau, P., Haegelen, C., Trebon, P., Drapier, D.,Raoul, S., et al. (2005). Fear recognition is impaired bysubthalamic nucleus stimulation in Parkinson's disease.Neuropsychologia, 43(7), 1054e1059.
Boersma, P., & Weenink, D. (2013). Praat: Doing phonetics bycomputer (version version 5.3.51. retrieved 2 June 2013 fromhttp://www.praat.org/.
Bruck, C., Kreifelts, B., & Wildgruber, D. (2011). Emotional voicesin context: a neurobiological model of multimodal affectiveinformation processing. Physics of Life Reviews, 8(4), 383e403.
Bruck, C., Wildgruber, D., Kreifelts, B., Kruger, R., & Wachter, T.(2011). Effects of subthalamic nucleus stimulation onemotional prosody comprehension in Parkinson's disease.PLoS One, 6(4), e19140.
Drapier, D., P�eron, J., Leray, E., Sauleau, P., Biseul, I., Drapier, S.,et al. (2008). Emotion recognition impairment and apathy aftersubthalamic nucleus stimulation in Parkinson's disease haveseparate neural substrates. Neuropsychologia, 46(11),2796e2801.
Dujardin, K., Blairy, S., Defebvre, L., Krystkowiak, P., Hess, U.,Blond, S., et al. (2004). Subthalamic nucleus stimulationinduces deficits in decoding emotional facial expressions inParkinson's disease. Journal of Neurology, Neurosurgery, andPsychiatry, 75(2), 202e208.
Ekman, P. (2003). Emotions revealed. New York: Times book.Ethofer, T., Anders, S., Erb, M., Droll, C., Royen, L., Saur, R., et al.
(2006). Impact of voice on emotional judgment of faces: anevent-related fMRI study. Human Brain Mapping, 27(9),707e714.
c o r t e x 6 3 ( 2 0 1 5 ) 1 7 2e1 8 3182
Ethofer, T., Anders, S., Erb, M., Herbert, C., Wiethoff, S., Kissler, J.,et al. (2006). Cerebral pathways in processing of affectiveprosody: a dynamic causal modeling study. NeuroImage, 30(2),580e587.
Ethofer, T., Bretscher, J., Gschwind, M., Kreifelts, B.,Wildgruber, D., & Vuilleumier, P. (2012). Emotional voice areas:anatomic location, functional properties, and structuralconnections revealed by combined fMRI/DTI. Cerebral Cortex,22(1), 191e200.
Fruhholz, S., Ceravolo, L., & Grandjean, D. (2012). Specific brainnetworks during explicit and implicit decoding of emotionalprosody. Cerebral Cortex, 22(5), 1107e1117.
Fruhholz, S., & Grandjean, D. (2013a). Amygdala subregionsdifferentially respond and rapidly adapt to threatening voices.Cortex, 49(5), 1394e1403.
Fruhholz, S., & Grandjean, D. (2013b). Processing of emotionalvocalizations in bilateral inferior frontal cortex. Neuroscience &Biobehavioral Reviews, 37(10 Pt 2), 2847e2855.
Grandjean, D., Banziger, T., & Scherer, K. R. (2006). Intonation asan interface between language and affect. Progress in BrainResearch, 156, 235e247.
Grandjean, D., Sander, D., Lucas, N., Scherer, K. R., &Vuilleumier, P. (2008). Effects of emotional prosody onauditory extinction for voices in patients with spatial neglect.Neuropsychologia, 46(2), 487e496.
Grandjean, D., Sander, D., Pourtois, G., Schwartz, S., Seghier, M. L.,Scherer, K. R., et al. (2005). The voices of wrath: brainresponses to angry prosody in meaningless speech. NatureNeuroscience, 8(2), 145e146.
Gray, H. M., & Tickle-Degnen, L. (2010). A meta-analysis ofperformance on emotion recognition tasks in Parkinson'sdisease. Neuropsychology, 24(2), 176e191.
Hall, D. B. (2000). Zero-inflated Poisson and binomial regressionwith random effects: a case study. Biometrics, 56(4), 1030e1039.
Hammer, M. J., Barlow, S. M., Lyons, K. E., & Pahwa, R. (2010).Subthalamic nucleus deep brain stimulation changes speechrespiratory and laryngeal control in Parkinson's disease.Journal of Neurology, 257(10), 1692e1702.
Hammer, M. J., Barlow, S. M., Lyons, K. E., & Pahwa, R. (2011).Subthalamic nucleus deep brain stimulation changesvelopharyngeal control in Parkinson's disease. Journal ofCommunication Disorders, 44(1), 37e48.
Kotz, S. A., Meyer, M., Alter, K., Besson, M., von Cramon, D. Y., &Friederici, A. D. (2003). On the lateralization of emotionalprosody: an event-related functional MR investigation. BrainLang, 86(3), 366e376.
Kotz, S. A., & Schwartze, M. (2010). Cortical speech processingunplugged: a timely subcortico-cortical framework. Trends inCognitive Science, 14(9), 392e399.
Langston, J. W., Widner, H., Goetz, C. G., Brooks, D., Fahn, S.,Freeman, T., et al. (1992). Core assessment program forintracerebral transplantations (CAPIT). Movement Disorders,7(1), 2e13.
Le Jeune, F., P�eron, J., Biseul, I., Fournier, S., Sauleau, P.,Drapier, S., et al. (2008). Subthalamic nucleus stimulationaffects orbitofrontal cortex in facial emotion recognition: aPET study. Brain, 131(Pt 6), 1599e1608.
Le Jeune, F., P�eron, J., Grandjean, D., Drapier, S., Haegelen, C.,Garin, E., et al. (2010). Subthalamic nucleus stimulation affectslimbic and associative circuits: a PET study. European Journal ofNuclear Medicine and Molecular Imaging, 37(8), 1512e1520.
Lozano, A. M., Lang, A. E., Galvez-Jimenez, N., Miyasaki, J., Duff, J.,Hutchinson,W.D., et al. (1995). EffectofGPipallidotomyonmotorfunction in Parkinson's disease. Lancet, 346(8987), 1383e1387.
Mattis, S. (1988). Dementia rating scale. Odessa, F.L: Ressources Inc.Psychological Assessment.
McKeown, G. J., & Sneddon, I. (2014). Modeling continuous self-report measures of perceived emotion using generalizedadditive mixed models. Psychological Methods, 19(1), 155e174.
Milesi, V., Cekic, S., P�eron, J., Fruhholz, S., Cristinzio, C., Seeck, M.,et al. (2014). Multimodal emotion perception after anteriortemporal lobectomy (ATL). Frontiers in Human Neuroscience, 8,275.
Mondillon, L., Mermillod, M., Musca, S. C., Rieu, I., Vidal, T.,Chambres, P., et al. (2012). The combined effect of subthalamicnuclei deep brain stimulation and L-dopa increases emotionrecognition in Parkinson's disease. Neuropsychologia, 50(12),2869e2879.
Morris, J. S., Scott, S. K., & Dolan, R. J. (1999). Saying it with feeling:neural responses to emotional vocalizations. Neuropsychologia,37(10), 1155e1163.
Niedenthal, P. M. (2007). Embodying emotion. Science, 316(5827),1002e1005.
Paulmann, S., Pell, M. D., & Kotz, S. A. (2008). Functionalcontributions of the basal ganglia to emotional prosody:evidence from ERPs. Brain Research, 1217, 171e178.
Paulmann, S., Pell, M. D., & Kotz, S. A. (2009). Comparativeprocessing of emotional prosody and semantics followingbasal ganglia infarcts: ERP evidence of selective impairmentsfor disgust and fear. Brain Research, 1295, 159e169.
Pell, M. D., & Leonard, C. L. (2003). Processing emotional tonefrom speech in Parkinson's disease: a role for the basalganglia. Cognitive, Affective, & Behavioral Neuroscience, 3(4),275e288.
P�eron, J. (2014). Does STN-DBS really not change emotionrecognition in Parkinson's disease? Parkinsonism & RelatedDisorders, 20(5), 562e563.
P�eron, J., Biseul, I., Leray, E., Vicente, S., Le Jeune, F., Drapier, S.,et al. (2010a). Subthalamic nucleus stimulation affects fearand sadness recognition in Parkinson's disease.Neuropsychology, 24(1), 1e8.
P�eron, J., Dondaine, T., Le Jeune, F., Grandjean, D., & Verin, M.(2012). Emotional processing in Parkinson's disease: asystematic review. Movement Disorders, 27(2), 186e199.
P�eron, J., El Tamer, S., Grandjean, D., Leray, E., Travers, D.,Drapier, D., et al. (2011). Major depressive disorder skews therecognition of emotional prosody. Progress In Neuro-Psychopharmacology & Biological Psychiatry, 35, 987e996.
P�eron, J., Fruhholz, S., V�erin, M., & Grandjean, D. (2013).Subthalamic nucleus: a key structure for emotionalcomponent synchronization in humans. Neuroscience &Biobehavioral Reviews, 37(3), 358e373.
P�eron, J., Grandjean, D., Drapier, S., & V�erin, M. (2014). Effect ofdopamine therapy on nonverbal affect burst recognition inParkinson's disease. PLoS One, 9(3), e90092.
P�eron, J., Grandjean, D., Le Jeune, F., Sauleau, P., Haegelen, C.,Drapier, D., et al. (2010b). Recognition of emotionalprosody is altered after subthalamic nucleus deep brainstimulation in Parkinson's disease. Neuropsychologia, 48(4),1053e1062.
Sander, D., Grandjean, D., Pourtois, G., Schwartz, S., Seghier, M. L.,Scherer, K. R., et al. (2005). Emotion and attention interactionsin social cognition: brain regions involved in processing angerprosody. NeuroImage, 28(4), 848e858.
Sauter, D. A., Eisner, F., Calder, A. J., & Scott, S. K. (2010).Perceptual cues in nonverbal vocal expressions of emotion.Quarterly Journal Experimental Psychology (Hove), 63(11),2251e2272.
Scherer, K. R., & Ekman, P. (2008). Methodological issues instudying nonverbal behavior. In J. Harrigan, R. Rosenthal, &K. Scherer (Eds.), The New Handbook of Methods in NonverbalBehavior Research (pp. 471e512). Oxford: Oxford UniversityPress.
c o r t e x 6 3 ( 2 0 1 5 ) 1 7 2e1 8 3 183
Scherer, K. R., & Ellgring, H. (2007). Multimodal expression ofemotion: affect programs or componential appraisal patterns?Emotion, 7(1), 158e171.
Schirmer, A., & Kotz, S. A. (2006). Beyond the right hemisphere:brain mechanisms mediating vocal emotional processing.Trends in Cognitive Science, 10(1), 24e30.
Schroeder, U., Kuehler, A., Hennenlotter, A., Haslinger, B.,Tronnier, V. M., Krause, M., et al. (2004). Facial expressionrecognition and subthalamic nucleus stimulation. Journal ofNeurology, Neurosurgery, and Psychiatry, 75(4), 648e650.
Sidtis, J. J., & Van Lancker Sidtis, D. (2003). A neurobehavioralapproach to dysprosody. Seminars in Speech and Language, 24(2),93e105.
Vicente, S., Biseul, I., P�eron, J., Philippot, P., Drapier, S.,Drapier, D., et al. (2009). Subthalamic nucleus stimulation
affects subjective emotional experience in Parkinson's diseasepatients. Neuropsychologia, 47(8e9), 1928e1937.
Wildgruber, D., Ethofer, T., Grandjean, D., & Kreifelts, B. (2009). Acerebral network model of speech prosody comprehension.International Journal of Speech-Language Pathology, 11(4),277e281.
Wildgruber, D., Hertrich, I., Riecker, A., Erb, M., Anders, S.,Grodd, W., et al. (2004). Distinct frontal regions subserveevaluation of linguistic and emotional aspects of speechintonation. Cerebral Cortex, 14(12), 1384e1389.
Witteman, J., Van Heuven, V. J., & Schiller, N. O. (2012). Hearingfeelings: a quantitative meta-analysis on the neuroimagingliterature of emotional prosody perception. Neuropsychologia,50(12), 2752e2763.
Related Documents