of June 18, 2013. This information is current as Immunogenicity TLR-7 Enhances B Lymphoma Cell Sensitization of IL-2 Signaling through Spaner E. Caitlin Hammond, Liwei He, Richard L. Miller and David Jelena Tomic, Dionne White, Yonghong Shi, Jenny Mena, http://www.jimmunol.org/content/176/6/3830 2006; 176:3830-3839; ; J Immunol References http://www.jimmunol.org/content/176/6/3830.full#ref-list-1 , 17 of which you can access for free at: cites 37 articles This article Subscriptions http://jimmunol.org/subscriptions is online at: The Journal of Immunology Information about subscribing to Permissions http://www.aai.org/ji/copyright.html Submit copyright permission requests at: Email Alerts http://jimmunol.org/cgi/alerts/etoc Receive free email-alerts when new articles cite this article. Sign up at: Print ISSN: 0022-1767 Online ISSN: 1550-6606. Immunologists All rights reserved. Copyright © 2006 by The American Association of 9650 Rockville Pike, Bethesda, MD 20814-3994. The American Association of Immunologists, Inc., is published twice each month by The Journal of Immunology by guest on June 18, 2013 http://www.jimmunol.org/ Downloaded from

Welcome message from author
This document is posted to help you gain knowledge. Please leave a comment to let me know what you think about it! Share it to your friends and learn new things together.
Transcript
of June 18, 2013.This information is current as
ImmunogenicityTLR-7 Enhances B Lymphoma Cell Sensitization of IL-2 Signaling through
SpanerE.Caitlin Hammond, Liwei He, Richard L. Miller and David
Jelena Tomic, Dionne White, Yonghong Shi, Jenny Mena,
http://www.jimmunol.org/content/176/6/38302006; 176:3830-3839; ;J Immunol
Referenceshttp://www.jimmunol.org/content/176/6/3830.full#ref-list-1
, 17 of which you can access for free at: cites 37 articlesThis article
Subscriptionshttp://jimmunol.org/subscriptions
is online at: The Journal of ImmunologyInformation about subscribing to
Permissionshttp://www.aai.org/ji/copyright.htmlSubmit copyright permission requests at:
Email Alertshttp://jimmunol.org/cgi/alerts/etocReceive free email-alerts when new articles cite this article. Sign up at:
Print ISSN: 0022-1767 Online ISSN: 1550-6606. Immunologists All rights reserved.Copyright © 2006 by The American Association of9650 Rockville Pike, Bethesda, MD 20814-3994.The American Association of Immunologists, Inc.,
is published twice each month byThe Journal of Immunology
by guest on June 18, 2013http://w
ww
.jimm
unol.org/D
ownloaded from
Sensitization of IL-2 Signaling through TLR-7 Enhances BLymphoma Cell Immunogenicity1
Jelena Tomic,*§ Dionne White,* Yonghong Shi,* Jenny Mena,* Caitlin Hammond,*§ Liwei He,¶
Richard L. Miller,� and David E. Spaner2*†‡§
The innate ability of B lymphoma cells to escape control by tumor-reactive T cells must be overcome to develop effective immu-notherapies for these diseases. Because signals from both the innate and adaptive immune systems direct the acquisition of strongimmunogenicity by professional APCs, the effects of IL-2 and the TLR-7 agonist, S28690, on the immunogenic properties ofchronic lymphocytic leukemia (CLL) B cells were studied. IL-2 with S28690 caused CLL cells to proliferate and increased theirexpression of B7-family members, production of TNF-� and IL-10, and levels of tyrosine-phosphorylated STAT-1 and STAT-3proteins. S28690 increased CD25 expression on CLL cells and sensitized them to IL-2 signaling. However, IL-2 did not changeTLR-7 expression or signaling in CLL cells. The ability to stimulate T cell proliferation required additional activation of proteinkinase C, which inhibited tumor cell proliferation, “switched off” IL-10 production, and caused essentially all CLL cells (regardlessof clinical stage) to acquire a CD83highCD80highCD86highCD54high surface phenotype marked by the activation of STAT-1 withoutSTAT-3. These findings suggest that TLR-7 “licenses” human B cells to respond to cytokines of the adaptive immune system (suchas IL-2) and provide a strategy to increase the immunogenicity of lymphoma cells for therapeutic purposes. The Journal ofImmunology, 2006, 176: 3830–3839.
C hronic lymphocytic leukemia (CLL),3 the most commonleukemia in the western world (1), is incurable with con-ventional cytotoxic chemotherapy but may be sensitive
to T cell-based immunotherapies (2). However, despite the expres-sion of high levels of MHC molecules, at least one tumor Ag (theIg Id), and sometimes even costimulatory molecules (3, 4), CLLcells are weakly immunogenic (or unable to sustain a strong type1 immune response) and escape control by natural (5) or vaccine-activated (6) tumor-reactive T cells. Consequently, the develop-ment of clinically relevant methods to increase the immunogenic-ity of CLL cells is an important goal.
Immunogenicity is a complex phenotype caused by signalingpathways that regulate the expression of costimulatory molecules,proinflammatory cytokines and chemokines, and ability to stimu-late T cell proliferation and differentiation. Costimulatory mole-cules include CD80 and CD86, which are B7-family members thatbind to CD28 on T cells and enhance their expression of anti-apoptotic and cytokine genes (7), CD54, which stabilizes T and
APC contacts (8), and CD83, a characteristic dendritic cell (DC)marker (9). ICOS-L and PDL-1 are additional B7 family membersthat regulate the behavior of activated T cells (10), and 4-1BBligand (4-1BBL) is a CD28-independent costimulatory factor, pri-marily for CD8� T cells (11).
Important transcription factors that positively regulate the im-munogenic phenotype include members of the NF-�B family (12)and the STAT family member, STAT-1 (13). Other members ofthe STAT family (particularly STAT-3) are negative regulators ofimmunogenicity, and cause production of immunosuppressive fac-tors such as IL-10 (14, 15). Previously, we showed that both IL-2(a cytokine mediator of adaptive immunity) (4) and the imidazo-quinoline, S28690 (a synthetic TLR-7 agonist which mediates in-nate immunity) (16, 17), could enhance some aspects of CLL im-munogenicity, but required additional signals (mainly fromactivators of protein kinase C (PKC) family members; Ref. 3) tomake CLL cells able to stimulate T cell proliferation.
The high-affinity IL-2R consists of the � (CD25), �, and com-mon � (�c) chains (18) and is expressed by many CLL cells (4).Although IL-2R signaling has not been well-characterized in CLLcells, IL-2 activates the MAPK pathway that involves ERK-1/2,along with STAT-1, -3, -5a, and -5b, in most IL-2 responder cells,and the p38 phosphorelay pathway in T cells (19, 20). Like otherTLRs (21), TLR-7 activates NF-�B, p38 MAPK, and the stress-activated protein kinase (SAPK) pathway that involves JNK-1 and-2 (22). Given that IL-2 and S28690 individually activate onlysome of the signaling pathways required for strong immunogenic-ity, and that highly immunogenic cells such as DCs incorporateinformation from both the innate and adaptive immune systems(23), the effects of combinations of IL-2 and S28690 on the im-munogenicity of CLL cells were studied in this paper.
Materials and MethodsBlood samples
Heparinized blood (30–40 ml) was collected from consenting CLL patients(diagnosed by a persistent monoclonal elevation of CD19�CD5�IgMlow
lymphocytes; Ref. 1). Patients were untreated at the time of analysis and their
*Division of Molecular and Cellular Biology, Research Institute, Sunnybrook andWomen’s College Health Sciences Center, Toronto, Canada; †Toronto-SunnybrookRegional Cancer Center, Toronto, Canada; ‡Department of Medicine, University ofToronto, Toronto, Canada; §Department of Medical Biophysics, University of To-ronto, Toronto, Canada; ¶Immunology Platform, Aventis Pasteur, Toronto, Canada;and �Department of Pharmacology, 3M Pharmaceuticals, St. Paul, MN 55144
Received for publication August 1, 2005. Accepted for publication December13, 2005.
The costs of publication of this article were defrayed in part by the payment of pagecharges. This article must therefore be hereby marked advertisement in accordancewith 18 U.S.C. Section 1734 solely to indicate this fact.1 This work was supported by grants from the Ontario Cancer Research Network.2 Address correspondence and reprint requests to Dr. David Spaner, Division of Molec-ular and Cellular Biology, Research Institute, S-116A, Research Building, Sunnybrookand Women’s College Health Sciences Center, 2075 Bayview Avenue, Toronto, OntarioM4N 3M5, Canada. E-mail address: [email protected] Abbreviations used in this paper: CLL, chronic lymphocytic leukemia; DC, den-dritic cell; SAPK, stress-activated protein kinase; PDB, phorbol dibutyrate; MLR,mixed lymphocyte response; 4-1BBL, 4-1BB ligand; MFI, mean fluorescence inten-sity; PKC, protein kinase C; PFA, paraformaldehyde.
The Journal of Immunology
Copyright © 2006 by The American Association of Immunologists, Inc. 0022-1767/06/$02.00
by guest on June 18, 2013http://w
ww
.jimm
unol.org/D
ownloaded from
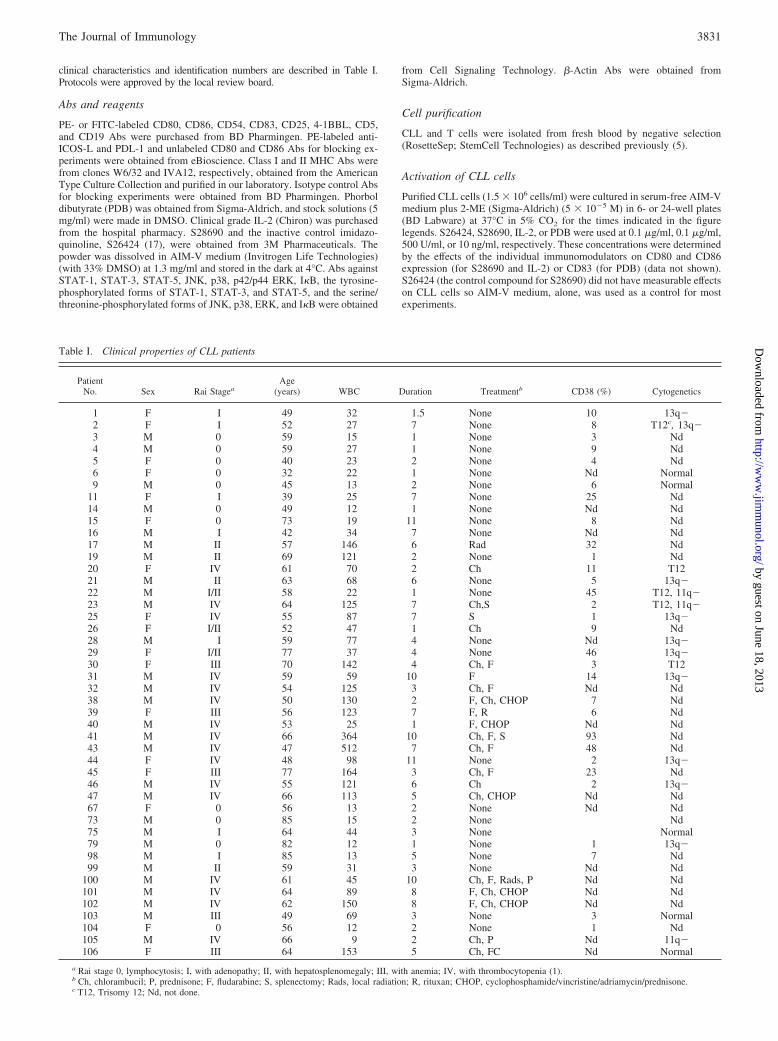
clinical characteristics and identification numbers are described in Table I.Protocols were approved by the local review board.
Abs and reagents
PE- or FITC-labeled CD80, CD86, CD54, CD83, CD25, 4-1BBL, CD5,and CD19 Abs were purchased from BD Pharmingen. PE-labeled anti-ICOS-L and PDL-1 and unlabeled CD80 and CD86 Abs for blocking ex-periments were obtained from eBioscience. Class I and II MHC Abs werefrom clones W6/32 and IVA12, respectively, obtained from the AmericanType Culture Collection and purified in our laboratory. Isotype control Absfor blocking experiments were obtained from BD Pharmingen. Phorboldibutyrate (PDB) was obtained from Sigma-Aldrich, and stock solutions (5mg/ml) were made in DMSO. Clinical grade IL-2 (Chiron) was purchasedfrom the hospital pharmacy. S28690 and the inactive control imidazo-quinoline, S26424 (17), were obtained from 3M Pharmaceuticals. Thepowder was dissolved in AIM-V medium (Invitrogen Life Technologies)(with 33% DMSO) at 1.3 mg/ml and stored in the dark at 4°C. Abs againstSTAT-1, STAT-3, STAT-5, JNK, p38, p42/p44 ERK, I�B, the tyrosine-phosphorylated forms of STAT-1, STAT-3, and STAT-5, and the serine/threonine-phosphorylated forms of JNK, p38, ERK, and I�B were obtained
from Cell Signaling Technology. �-Actin Abs were obtained fromSigma-Aldrich.
Cell purification
CLL and T cells were isolated from fresh blood by negative selection(RosetteSep; StemCell Technologies) as described previously (5).
Activation of CLL cells
Purified CLL cells (1.5 � 106 cells/ml) were cultured in serum-free AIM-Vmedium plus 2-ME (Sigma-Aldrich) (5 � 10�5 M) in 6- or 24-well plates(BD Labware) at 37°C in 5% CO2 for the times indicated in the figurelegends. S26424, S28690, IL-2, or PDB were used at 0.1 �g/ml, 0.1 �g/ml,500 U/ml, or 10 ng/ml, respectively. These concentrations were determinedby the effects of the individual immunomodulators on CD80 and CD86expression (for S28690 and IL-2) or CD83 (for PDB) (data not shown).S26424 (the control compound for S28690) did not have measurable effectson CLL cells so AIM-V medium, alone, was used as a control for mostexperiments.
Table I. Clinical properties of CLL patients
PatientNo. Sex Rai Stagea
Age(years) WBC Duration Treatmentb CD38 (%) Cytogenetics
1 F I 49 32 1.5 None 10 13q�2 F I 52 27 7 None 8 T12c, 13q�3 M 0 59 15 1 None 3 Nd4 M 0 59 27 1 None 9 Nd5 F 0 40 23 2 None 4 Nd6 F 0 32 22 1 None Nd Normal9 M 0 45 13 2 None 6 Normal
11 F I 39 25 7 None 25 Nd14 M 0 49 12 1 None Nd Nd15 F 0 73 19 11 None 8 Nd16 M I 42 34 7 None Nd Nd17 M II 57 146 6 Rad 32 Nd19 M II 69 121 2 None 1 Nd20 F IV 61 70 2 Ch 11 T1221 M II 63 68 6 None 5 13q�22 M I/II 58 22 1 None 45 T12, 11q�23 M IV 64 125 7 Ch,S 2 T12, 11q�25 F IV 55 87 7 S 1 13q�26 F I/II 52 47 1 Ch 9 Nd28 M I 59 77 4 None Nd 13q�29 F I/II 77 37 4 None 46 13q�30 F III 70 142 4 Ch, F 3 T1231 M IV 59 59 10 F 14 13q�32 M IV 54 125 3 Ch, F Nd Nd38 M IV 50 130 2 F, Ch, CHOP 7 Nd39 F III 56 123 7 F, R 6 Nd40 M IV 53 25 1 F, CHOP Nd Nd41 M IV 66 364 10 Ch, F, S 93 Nd43 M IV 47 512 7 Ch, F 48 Nd44 F IV 48 98 11 None 2 13q�45 F III 77 164 3 Ch, F 23 Nd46 M IV 55 121 6 Ch 2 13q�47 M IV 66 113 5 Ch, CHOP Nd Nd67 F 0 56 13 2 None Nd Nd73 M 0 85 15 2 None Nd75 M I 64 44 3 None Normal79 M 0 82 12 1 None 1 13q�98 M I 85 13 5 None 7 Nd99 M II 59 31 3 None Nd Nd
100 M IV 61 45 10 Ch, F, Rads, P Nd Nd101 M IV 64 89 8 F, Ch, CHOP Nd Nd102 M IV 62 150 8 F, Ch, CHOP Nd Nd103 M III 49 69 3 None 3 Normal104 F 0 56 12 2 None 1 Nd105 M IV 66 9 2 Ch, P Nd 11q�106 F III 64 153 5 Ch, FC Nd Normal
a Rai stage 0, lymphocytosis; I, with adenopathy; II, with hepatosplenomegaly; III, with anemia; IV, with thrombocytopenia (1).b Ch, chlorambucil; P, prednisone; F, fludarabine; S, splenectomy; Rads, local radiation; R, rituxan; CHOP, cyclophosphamide/vincristine/adriamycin/prednisone.c T12, Trisomy 12; Nd, not done.
3831The Journal of Immunology
by guest on June 18, 2013http://w
ww
.jimm
unol.org/D
ownloaded from
Mixed lymphocyte responses (MLRs)
T cells were isolated from CLL patients and adjusted to 5 � 105 cells/mlin AIM-V medium. Activated CLL cells were washed at least four times (toremove residual immunomodulators), irradiated (2500 cGy), and sus-pended at 5 � 105 cells/ml (or lower concentrations) in AIM-V. Respond-ers and stimulators were mixed in a 1:1 (v:v) ratio and cultured in 96-wellround-bottom plates (BD Labware) without cytokines or serum. Prolifer-ation was measured 4–6 days later in a colorimetric assay (5). In someexperiments, the activated CLL cells were lightly fixed (5 min) in 1%paraformaldehyde (and then washed extensively before suspension inAIM-V medium) before being placed in the T cell cultures. It has beenshown previously that APCs can present Ag even when fixed (24).
Flow cytometry and DNA analysis
Surface immunophenotyping was performed as described previously (5).For analysis of DNA content, CLL cells (�1 � 106) were washed and fixedin 70% ethanol at �20°C for several days at 106 cells/ml. The cells werethen washed and resuspended in 1 ml of Ca�2, Mg�2-free PBS to which0.1% Triton X-100, 0.1 mM EDTA, and 50 �g/ml RNase were added, andincubated for 1 h at 37°C (to allow the escape of low m.w. DNA throughthe permeabilized membranes). Cells were then washed, resuspended instaining buffer (0.1 mM EDTA, 0.1% Triton X-100, and 50 �g/ml pro-pidium iodide; Sigma-Aldrich) at room temperature in the dark for 4–12 h,filtered through nylon mesh, and analyzed on a FACSCalibur flow cytom-eter (BD Biosciences) using CellQuest software.
Western blots
Proteins were extracted from activated CLL cells and immunoblotting wasperformed as described previously (3), using anti-rabbit and anti-mouseIgG1 secondary Abs, as required. Blots were stripped for 15–30 min at37°C in Restore Western blot stripping buffer (Pierce), washed once atroom temperature, and then blocked with 10% milk for 1 h. Chemilumi-nescence signals were detected using Supersignal West Pico Luminal En-hancer and Stable Peroxide Solution (Pierce) and a GS-700 Imaging den-sitometer with MultiAnalyst software (Bio-Rad).
Isolation of total RNA and synthesis of cDNA
Total RNA from activated CLL cells was extracted using the RNeasy kit(Qiagen) according to the manufacturer’s instructions. To remove contam-inating genomic DNA, 10 �g of RNA were incubated with 10 U of RNase-free DNase I (Promega) for 30 min at 37°C. The RNA concentration wasdetermined in a spectrophotometer at 260 nm.
cDNA was synthesized with the Superscript First Strand Synthesis Sys-tem (Invitrogen Life Technologies) in a 20-�l reaction containing 3 �g oftotal RNA, 20 mM Tris-HCl (pH 8.4), 50 mM KCl, 2.5 mM MgCl2, 10mM DTT, 0.5 �g of oligo dT18, 0.5 mM dATP, dGTP, dCTP, and dTTP,and 200 U of Superscript II Reverse Transcriptase. The priming oligonu-cleotide was annealed to total RNA by incubating the mixture at 70°C for5 min and cooling to 4°C. Reverse transcription was conducted at 42°C for2 h and the cDNA was stored at �20°C.
Real-time PCR
The following primers were used to amplify cDNA: TLR-7 forward, 5�-CTAAAGACCCAGCTGTGACCAG-3�, TLR-7 reverse, 5�-CCAGTCCCTTTCCTCGAGACAT-3�; hypoxanthine phosphoribosyltransferase(HPRT) forward, 5�-GAGGATTTGGAAAGGGTGTT-3�, HPRT reverse,5�-ACAATAGCTCTTCAGTCTGA-3�.
PCR was performed on a DNA engine Opticon System (MJ Research)using SYBR Green I as a double-strand DNA-specific binding dye. PCRswere cycled 40 times after initial denaturation (95°C, 15 min) according tothe following parameters: denaturation at 95oC for 15 s, primer annealingat 57°C for 20 s, and extension at 72°C for 20 s. Fluorescent data wereacquired during each extension phase. After each reaction, a melting curveanalysis was performed by cooling the samples to 4°C and then heatingthem to 95°C at 0.2°C/s. Fast loss of fluorescence is uniquely observed atthe denaturing/melting temperature of the amplified DNA fragment. Stan-dard curves were generated from serial 10-fold dilutions of DNA madewith the above primers.
Cytokine measurement
Cytokine levels in culture supernatants (from CLL cells activated for 48 h)were determined by a multianalyte fluorescent bead assay with a Luminex-100 system (Luminex). Kits allowing measurement of CCL3, CCL4,CCL5, CXCL10, IL-6, GM-CSF, IFN-�, IL-10, and TNF-� were used,according to the manufacturer’s instructions (R&D Systems). Individual
cytokine concentrations were determined from standard curves using Bio-Plex 2.0 software (Bio-Rad). Assays were linear between 3 and 15,000pg/ml. TNF-� was also measured with ELISA kits from Pierce, accordingto the manufacturer’s instructions.
Statistical analysis
The Student t test was used to determine p values for differences betweensample means.
ResultsEffect of IL-2 and S28690 on proliferation and costimulatorymolecule expression by CLL cells
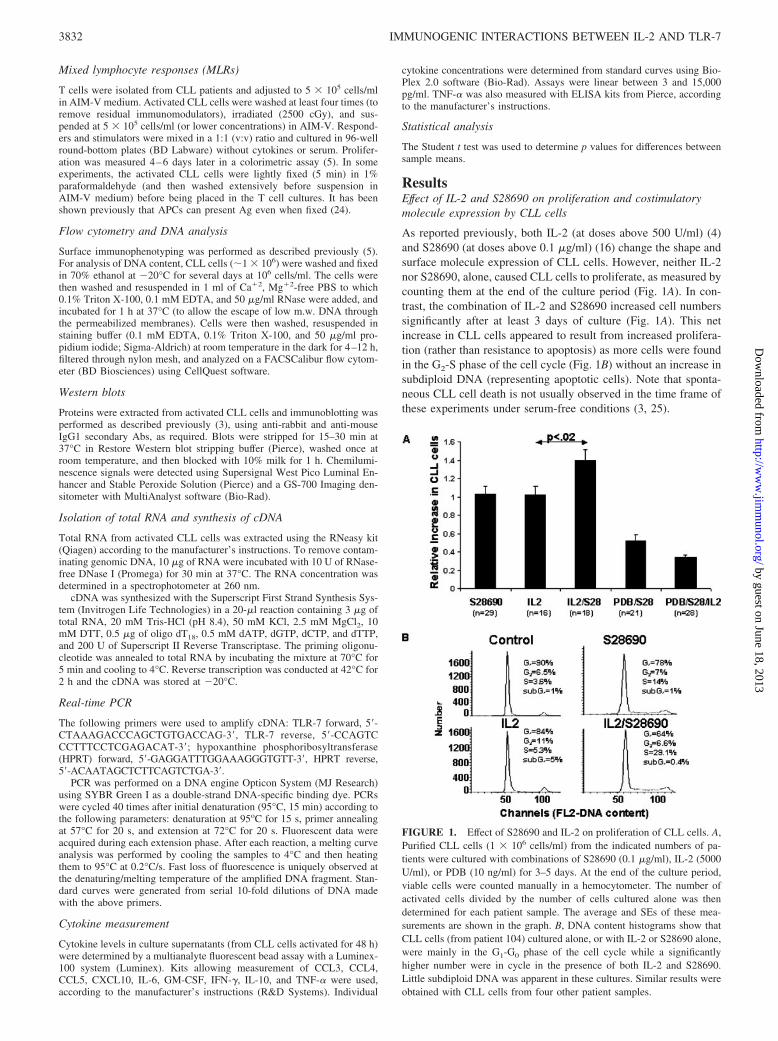
As reported previously, both IL-2 (at doses above 500 U/ml) (4)and S28690 (at doses above 0.1 �g/ml) (16) change the shape andsurface molecule expression of CLL cells. However, neither IL-2nor S28690, alone, caused CLL cells to proliferate, as measured bycounting them at the end of the culture period (Fig. 1A). In con-trast, the combination of IL-2 and S28690 increased cell numberssignificantly after at least 3 days of culture (Fig. 1A). This netincrease in CLL cells appeared to result from increased prolifera-tion (rather than resistance to apoptosis) as more cells were foundin the G2-S phase of the cell cycle (Fig. 1B) without an increase insubdiploid DNA (representing apoptotic cells). Note that sponta-neous CLL cell death is not usually observed in the time frame ofthese experiments under serum-free conditions (3, 25).
FIGURE 1. Effect of S28690 and IL-2 on proliferation of CLL cells. A,Purified CLL cells (1 � 106 cells/ml) from the indicated numbers of pa-tients were cultured with combinations of S28690 (0.1 �g/ml), IL-2 (5000U/ml), or PDB (10 ng/ml) for 3–5 days. At the end of the culture period,viable cells were counted manually in a hemocytometer. The number ofactivated cells divided by the number of cells cultured alone was thendetermined for each patient sample. The average and SEs of these mea-surements are shown in the graph. B, DNA content histograms show thatCLL cells (from patient 104) cultured alone, or with IL-2 or S28690 alone,were mainly in the G1-G0 phase of the cell cycle while a significantlyhigher number were in cycle in the presence of both IL-2 and S28690.Little subdiploid DNA was apparent in these cultures. Similar results wereobtained with CLL cells from four other patient samples.
3832 IMMUNOGENIC INTERACTIONS BETWEEN IL-2 AND TLR-7
by guest on June 18, 2013http://w
ww
.jimm
unol.org/D
ownloaded from
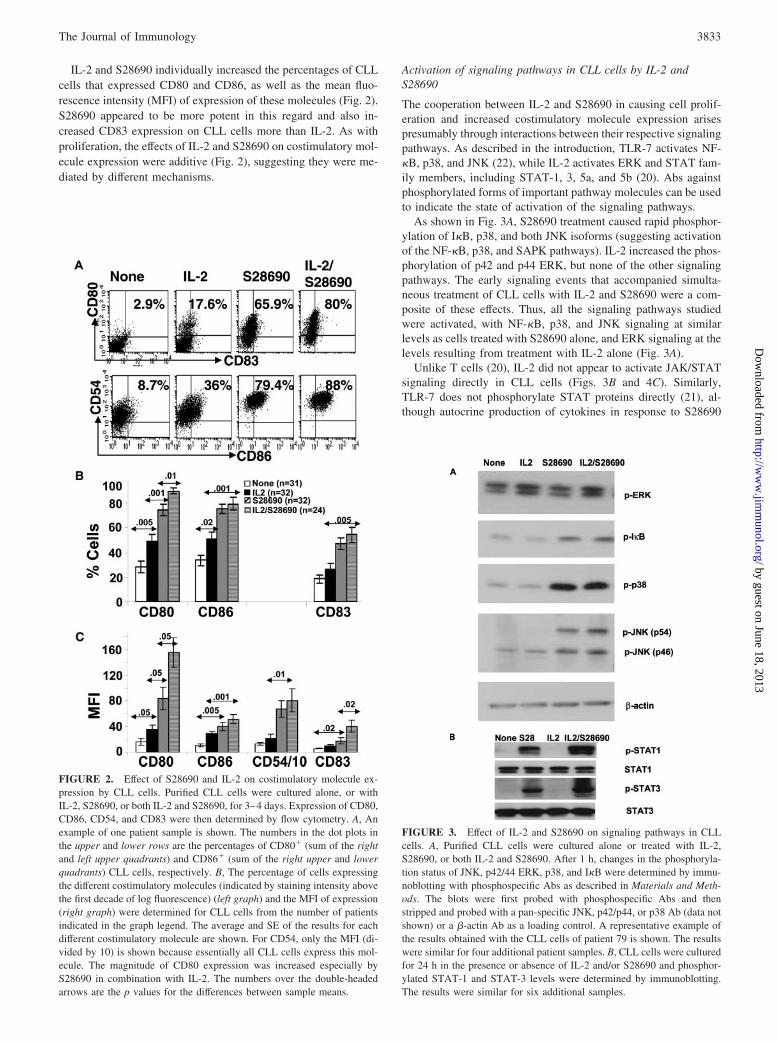
IL-2 and S28690 individually increased the percentages of CLLcells that expressed CD80 and CD86, as well as the mean fluo-rescence intensity (MFI) of expression of these molecules (Fig. 2).S28690 appeared to be more potent in this regard and also in-creased CD83 expression on CLL cells more than IL-2. As withproliferation, the effects of IL-2 and S28690 on costimulatory mol-ecule expression were additive (Fig. 2), suggesting they were me-diated by different mechanisms.
Activation of signaling pathways in CLL cells by IL-2 andS28690
The cooperation between IL-2 and S28690 in causing cell prolif-eration and increased costimulatory molecule expression arisespresumably through interactions between their respective signalingpathways. As described in the introduction, TLR-7 activates NF-�B, p38, and JNK (22), while IL-2 activates ERK and STAT fam-ily members, including STAT-1, 3, 5a, and 5b (20). Abs againstphosphorylated forms of important pathway molecules can be usedto indicate the state of activation of the signaling pathways.
As shown in Fig. 3A, S28690 treatment caused rapid phosphor-ylation of I�B, p38, and both JNK isoforms (suggesting activationof the NF-�B, p38, and SAPK pathways). IL-2 increased the phos-phorylation of p42 and p44 ERK, but none of the other signalingpathways. The early signaling events that accompanied simulta-neous treatment of CLL cells with IL-2 and S28690 were a com-posite of these effects. Thus, all the signaling pathways studiedwere activated, with NF-�B, p38, and JNK signaling at similarlevels as cells treated with S28690 alone, and ERK signaling at thelevels resulting from treatment with IL-2 alone (Fig. 3A).
Unlike T cells (20), IL-2 did not appear to activate JAK/STATsignaling directly in CLL cells (Figs. 3B and 4C). Similarly,TLR-7 does not phosphorylate STAT proteins directly (21), al-though autocrine production of cytokines in response to S28690
FIGURE 2. Effect of S28690 and IL-2 on costimulatory molecule ex-pression by CLL cells. Purified CLL cells were cultured alone, or withIL-2, S28690, or both IL-2 and S28690, for 3–4 days. Expression of CD80,CD86, CD54, and CD83 were then determined by flow cytometry. A, Anexample of one patient sample is shown. The numbers in the dot plots inthe upper and lower rows are the percentages of CD80� (sum of the rightand left upper quadrants) and CD86� (sum of the right upper and lowerquadrants) CLL cells, respectively. B, The percentage of cells expressingthe different costimulatory molecules (indicated by staining intensity abovethe first decade of log fluorescence) (left graph) and the MFI of expression(right graph) were determined for CLL cells from the number of patientsindicated in the graph legend. The average and SE of the results for eachdifferent costimulatory molecule are shown. For CD54, only the MFI (di-vided by 10) is shown because essentially all CLL cells express this mol-ecule. The magnitude of CD80 expression was increased especially byS28690 in combination with IL-2. The numbers over the double-headedarrows are the p values for the differences between sample means.
FIGURE 3. Effect of IL-2 and S28690 on signaling pathways in CLLcells. A, Purified CLL cells were cultured alone or treated with IL-2,S28690, or both IL-2 and S28690. After 1 h, changes in the phosphoryla-tion status of JNK, p42/44 ERK, p38, and I�B were determined by immu-noblotting with phosphospecific Abs as described in Materials and Meth-ods. The blots were first probed with phosphospecific Abs and thenstripped and probed with a pan-specific JNK, p42/p44, or p38 Ab (data notshown) or a �-actin Ab as a loading control. A representative example ofthe results obtained with the CLL cells of patient 79 is shown. The resultswere similar for four additional patient samples. B, CLL cells were culturedfor 24 h in the presence or absence of IL-2 and/or S28690 and phosphor-ylated STAT-1 and STAT-3 levels were determined by immunoblotting.The results were similar for six additional samples.
3833The Journal of Immunology
by guest on June 18, 2013http://w
ww
.jimm
unol.org/D
ownloaded from
results in phosphorylation of STAT-1 and STAT-3 after severalhours (16). Consistent with an absence of early interactions be-tween the signaling pathways, simultaneous treatment with IL-2and S28690 did not directly phosphorylate STAT-1 or STAT-3(data not shown). However, tyrosine-phosphorylated STAT-1 andSTAT-3 levels were increased after 24 h (Fig. 3B).
Enhancement of IL-2 signaling in CLL cells by S28690
Because IL-2 and S28690 appeared to have independent effects onearly signaling events (Fig. 3A), but increased proliferation (Fig.1), costimulatory molecule expression (Fig. 2), and phosphorylatedSTAT-1 and STAT-3 levels (Fig. 3B) after more prolonged cultureperiods, we considered that IL-2 might increase TLR-7 levels (andthe effects of S28690 in culture) or that S28690 might increaseIL-2R levels (and the effects of IL-2), or both.
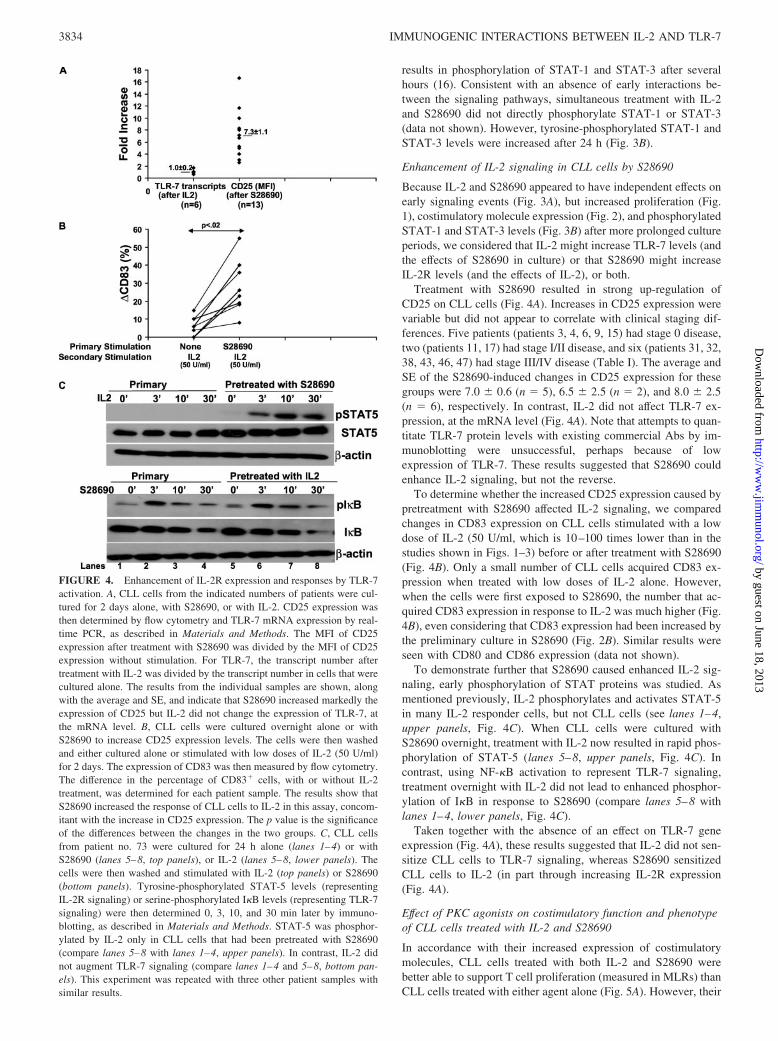
Treatment with S28690 resulted in strong up-regulation ofCD25 on CLL cells (Fig. 4A). Increases in CD25 expression werevariable but did not appear to correlate with clinical staging dif-ferences. Five patients (patients 3, 4, 6, 9, 15) had stage 0 disease,two (patients 11, 17) had stage I/II disease, and six (patients 31, 32,38, 43, 46, 47) had stage III/IV disease (Table I). The average andSE of the S28690-induced changes in CD25 expression for thesegroups were 7.0 � 0.6 (n � 5), 6.5 � 2.5 (n � 2), and 8.0 � 2.5(n � 6), respectively. In contrast, IL-2 did not affect TLR-7 ex-pression, at the mRNA level (Fig. 4A). Note that attempts to quan-titate TLR-7 protein levels with existing commercial Abs by im-munoblotting were unsuccessful, perhaps because of lowexpression of TLR-7. These results suggested that S28690 couldenhance IL-2 signaling, but not the reverse.
To determine whether the increased CD25 expression caused bypretreatment with S28690 affected IL-2 signaling, we comparedchanges in CD83 expression on CLL cells stimulated with a lowdose of IL-2 (50 U/ml, which is 10–100 times lower than in thestudies shown in Figs. 1–3) before or after treatment with S28690(Fig. 4B). Only a small number of CLL cells acquired CD83 ex-pression when treated with low doses of IL-2 alone. However,when the cells were first exposed to S28690, the number that ac-quired CD83 expression in response to IL-2 was much higher (Fig.4B), even considering that CD83 expression had been increased bythe preliminary culture in S28690 (Fig. 2B). Similar results wereseen with CD80 and CD86 expression (data not shown).
To demonstrate further that S28690 caused enhanced IL-2 sig-naling, early phosphorylation of STAT proteins was studied. Asmentioned previously, IL-2 phosphorylates and activates STAT-5in many IL-2 responder cells, but not CLL cells (see lanes 1–4,upper panels, Fig. 4C). When CLL cells were cultured withS28690 overnight, treatment with IL-2 now resulted in rapid phos-phorylation of STAT-5 (lanes 5–8, upper panels, Fig. 4C). Incontrast, using NF-�B activation to represent TLR-7 signaling,treatment overnight with IL-2 did not lead to enhanced phosphor-ylation of I�B in response to S28690 (compare lanes 5–8 withlanes 1–4, lower panels, Fig. 4C).
Taken together with the absence of an effect on TLR-7 geneexpression (Fig. 4A), these results suggested that IL-2 did not sen-sitize CLL cells to TLR-7 signaling, whereas S28690 sensitizedCLL cells to IL-2 (in part through increasing IL-2R expression(Fig. 4A).
Effect of PKC agonists on costimulatory function and phenotypeof CLL cells treated with IL-2 and S28690
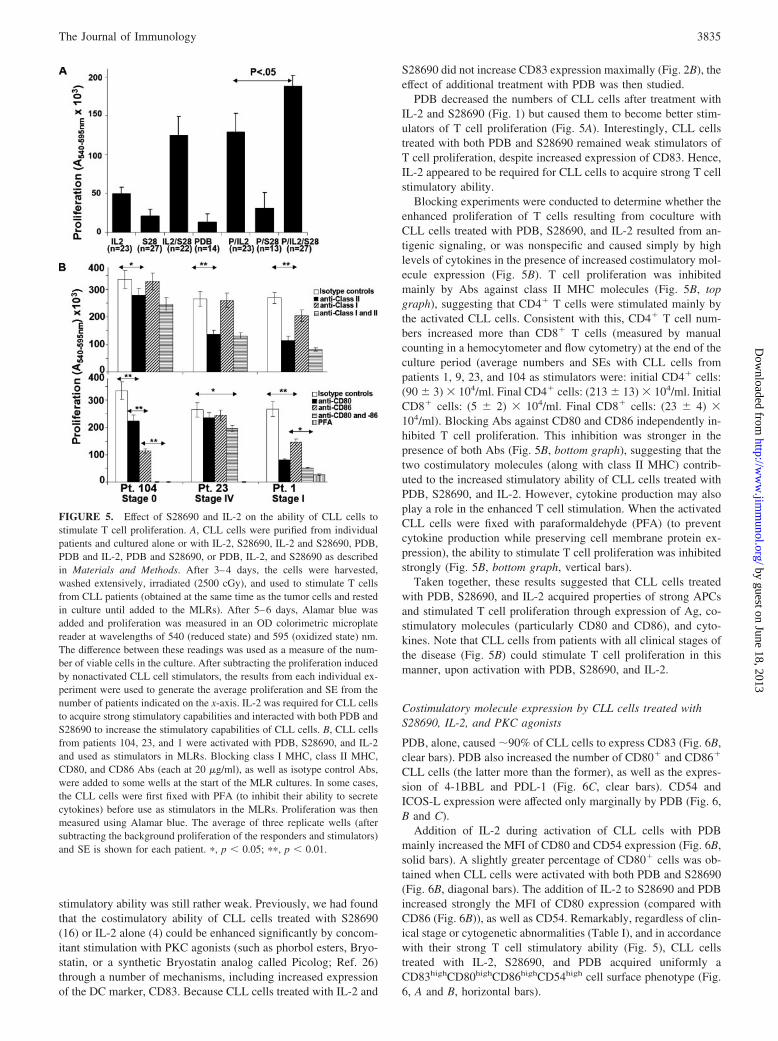
In accordance with their increased expression of costimulatorymolecules, CLL cells treated with both IL-2 and S28690 werebetter able to support T cell proliferation (measured in MLRs) thanCLL cells treated with either agent alone (Fig. 5A). However, their
FIGURE 4. Enhancement of IL-2R expression and responses by TLR-7activation. A, CLL cells from the indicated numbers of patients were cul-tured for 2 days alone, with S28690, or with IL-2. CD25 expression wasthen determined by flow cytometry and TLR-7 mRNA expression by real-time PCR, as described in Materials and Methods. The MFI of CD25expression after treatment with S28690 was divided by the MFI of CD25expression without stimulation. For TLR-7, the transcript number aftertreatment with IL-2 was divided by the transcript number in cells that werecultured alone. The results from the individual samples are shown, alongwith the average and SE, and indicate that S28690 increased markedly theexpression of CD25 but IL-2 did not change the expression of TLR-7, atthe mRNA level. B, CLL cells were cultured overnight alone or withS28690 to increase CD25 expression levels. The cells were then washedand either cultured alone or stimulated with low doses of IL-2 (50 U/ml)for 2 days. The expression of CD83 was then measured by flow cytometry.The difference in the percentage of CD83� cells, with or without IL-2treatment, was determined for each patient sample. The results show thatS28690 increased the response of CLL cells to IL-2 in this assay, concom-itant with the increase in CD25 expression. The p value is the significanceof the differences between the changes in the two groups. C, CLL cellsfrom patient no. 73 were cultured for 24 h alone (lanes 1–4) or withS28690 (lanes 5–8, top panels), or IL-2 (lanes 5–8, lower panels). Thecells were then washed and stimulated with IL-2 (top panels) or S28690(bottom panels). Tyrosine-phosphorylated STAT-5 levels (representingIL-2R signaling) or serine-phosphorylated I�B levels (representing TLR-7signaling) were then determined 0, 3, 10, and 30 min later by immuno-blotting, as described in Materials and Methods. STAT-5 was phosphor-ylated by IL-2 only in CLL cells that had been pretreated with S28690(compare lanes 5–8 with lanes 1–4, upper panels). In contrast, IL-2 didnot augment TLR-7 signaling (compare lanes 1–4 and 5–8, bottom pan-els). This experiment was repeated with three other patient samples withsimilar results.
3834 IMMUNOGENIC INTERACTIONS BETWEEN IL-2 AND TLR-7
by guest on June 18, 2013http://w
ww
.jimm
unol.org/D
ownloaded from
stimulatory ability was still rather weak. Previously, we had foundthat the costimulatory ability of CLL cells treated with S28690(16) or IL-2 alone (4) could be enhanced significantly by concom-itant stimulation with PKC agonists (such as phorbol esters, Bryo-statin, or a synthetic Bryostatin analog called Picolog; Ref. 26)through a number of mechanisms, including increased expressionof the DC marker, CD83. Because CLL cells treated with IL-2 and
S28690 did not increase CD83 expression maximally (Fig. 2B), theeffect of additional treatment with PDB was then studied.
PDB decreased the numbers of CLL cells after treatment withIL-2 and S28690 (Fig. 1) but caused them to become better stim-ulators of T cell proliferation (Fig. 5A). Interestingly, CLL cellstreated with both PDB and S28690 remained weak stimulators ofT cell proliferation, despite increased expression of CD83. Hence,IL-2 appeared to be required for CLL cells to acquire strong T cellstimulatory ability.
Blocking experiments were conducted to determine whether theenhanced proliferation of T cells resulting from coculture withCLL cells treated with PDB, S28690, and IL-2 resulted from an-tigenic signaling, or was nonspecific and caused simply by highlevels of cytokines in the presence of increased costimulatory mol-ecule expression (Fig. 5B). T cell proliferation was inhibitedmainly by Abs against class II MHC molecules (Fig. 5B, topgraph), suggesting that CD4� T cells were stimulated mainly bythe activated CLL cells. Consistent with this, CD4� T cell num-bers increased more than CD8� T cells (measured by manualcounting in a hemocytometer and flow cytometry) at the end of theculture period (average numbers and SEs with CLL cells frompatients 1, 9, 23, and 104 as stimulators were: initial CD4� cells:(90 � 3) � 104/ml. Final CD4� cells: (213 � 13) � 104/ml. InitialCD8� cells: (5 � 2) � 104/ml. Final CD8� cells: (23 � 4) �104/ml). Blocking Abs against CD80 and CD86 independently in-hibited T cell proliferation. This inhibition was stronger in thepresence of both Abs (Fig. 5B, bottom graph), suggesting that thetwo costimulatory molecules (along with class II MHC) contrib-uted to the increased stimulatory ability of CLL cells treated withPDB, S28690, and IL-2. However, cytokine production may alsoplay a role in the enhanced T cell stimulation. When the activatedCLL cells were fixed with paraformaldehyde (PFA) (to preventcytokine production while preserving cell membrane protein ex-pression), the ability to stimulate T cell proliferation was inhibitedstrongly (Fig. 5B, bottom graph, vertical bars).
Taken together, these results suggested that CLL cells treatedwith PDB, S28690, and IL-2 acquired properties of strong APCsand stimulated T cell proliferation through expression of Ag, co-stimulatory molecules (particularly CD80 and CD86), and cyto-kines. Note that CLL cells from patients with all clinical stages ofthe disease (Fig. 5B) could stimulate T cell proliferation in thismanner, upon activation with PDB, S28690, and IL-2.
Costimulatory molecule expression by CLL cells treated withS28690, IL-2, and PKC agonists
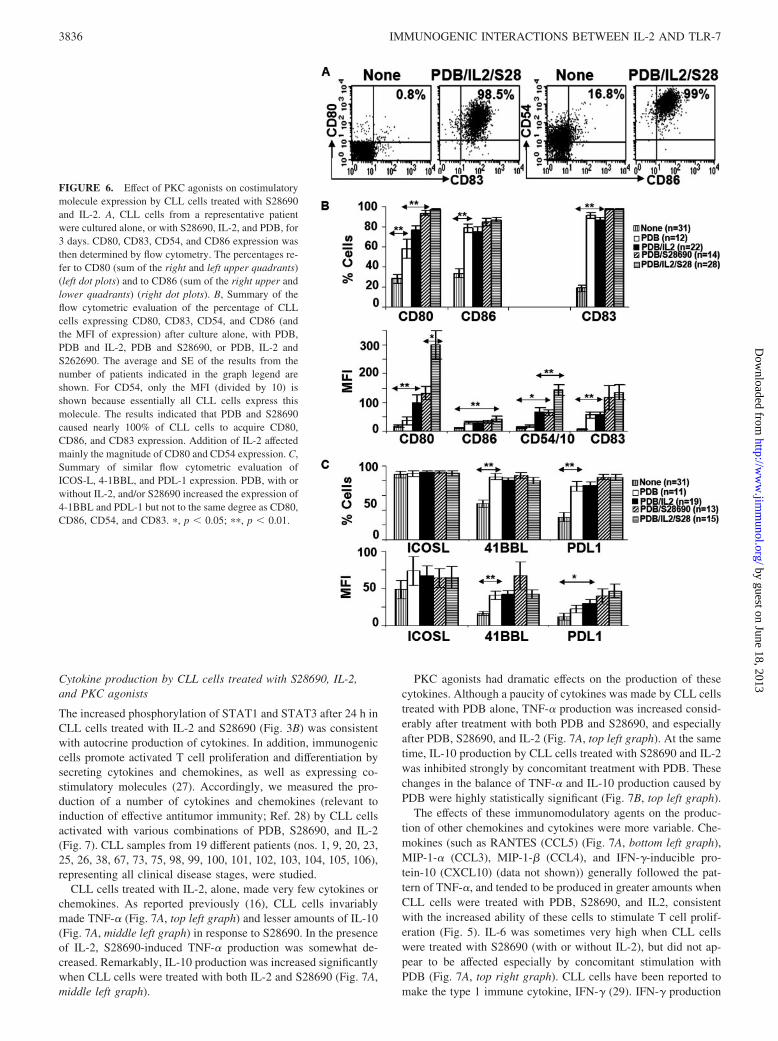
PDB, alone, caused �90% of CLL cells to express CD83 (Fig. 6B,clear bars). PDB also increased the number of CD80� and CD86�
CLL cells (the latter more than the former), as well as the expres-sion of 4-1BBL and PDL-1 (Fig. 6C, clear bars). CD54 andICOS-L expression were affected only marginally by PDB (Fig. 6,B and C).
Addition of IL-2 during activation of CLL cells with PDBmainly increased the MFI of CD80 and CD54 expression (Fig. 6B,solid bars). A slightly greater percentage of CD80� cells was ob-tained when CLL cells were activated with both PDB and S28690(Fig. 6B, diagonal bars). The addition of IL-2 to S28690 and PDBincreased strongly the MFI of CD80 expression (compared withCD86 (Fig. 6B)), as well as CD54. Remarkably, regardless of clin-ical stage or cytogenetic abnormalities (Table I), and in accordancewith their strong T cell stimulatory ability (Fig. 5), CLL cellstreated with IL-2, S28690, and PDB acquired uniformly aCD83highCD80highCD86highCD54high cell surface phenotype (Fig.6, A and B, horizontal bars).
FIGURE 5. Effect of S28690 and IL-2 on the ability of CLL cells tostimulate T cell proliferation. A, CLL cells were purified from individualpatients and cultured alone or with IL-2, S28690, IL-2 and S28690, PDB,PDB and IL-2, PDB and S28690, or PDB, IL-2, and S28690 as describedin Materials and Methods. After 3–4 days, the cells were harvested,washed extensively, irradiated (2500 cGy), and used to stimulate T cellsfrom CLL patients (obtained at the same time as the tumor cells and restedin culture until added to the MLRs). After 5–6 days, Alamar blue wasadded and proliferation was measured in an OD colorimetric microplatereader at wavelengths of 540 (reduced state) and 595 (oxidized state) nm.The difference between these readings was used as a measure of the num-ber of viable cells in the culture. After subtracting the proliferation inducedby nonactivated CLL cell stimulators, the results from each individual ex-periment were used to generate the average proliferation and SE from thenumber of patients indicated on the x-axis. IL-2 was required for CLL cellsto acquire strong stimulatory capabilities and interacted with both PDB andS28690 to increase the stimulatory capabilities of CLL cells. B, CLL cellsfrom patients 104, 23, and 1 were activated with PDB, S28690, and IL-2and used as stimulators in MLRs. Blocking class I MHC, class II MHC,CD80, and CD86 Abs (each at 20 �g/ml), as well as isotype control Abs,were added to some wells at the start of the MLR cultures. In some cases,the CLL cells were first fixed with PFA (to inhibit their ability to secretecytokines) before use as stimulators in the MLRs. Proliferation was thenmeasured using Alamar blue. The average of three replicate wells (aftersubtracting the background proliferation of the responders and stimulators)and SE is shown for each patient. �, p � 0.05; ��, p � 0.01.
3835The Journal of Immunology
by guest on June 18, 2013http://w
ww
.jimm
unol.org/D
ownloaded from
Cytokine production by CLL cells treated with S28690, IL-2,and PKC agonists
The increased phosphorylation of STAT1 and STAT3 after 24 h inCLL cells treated with IL-2 and S28690 (Fig. 3B) was consistentwith autocrine production of cytokines. In addition, immunogeniccells promote activated T cell proliferation and differentiation bysecreting cytokines and chemokines, as well as expressing co-stimulatory molecules (27). Accordingly, we measured the pro-duction of a number of cytokines and chemokines (relevant toinduction of effective antitumor immunity; Ref. 28) by CLL cellsactivated with various combinations of PDB, S28690, and IL-2(Fig. 7). CLL samples from 19 different patients (nos. 1, 9, 20, 23,25, 26, 38, 67, 73, 75, 98, 99, 100, 101, 102, 103, 104, 105, 106),representing all clinical disease stages, were studied.
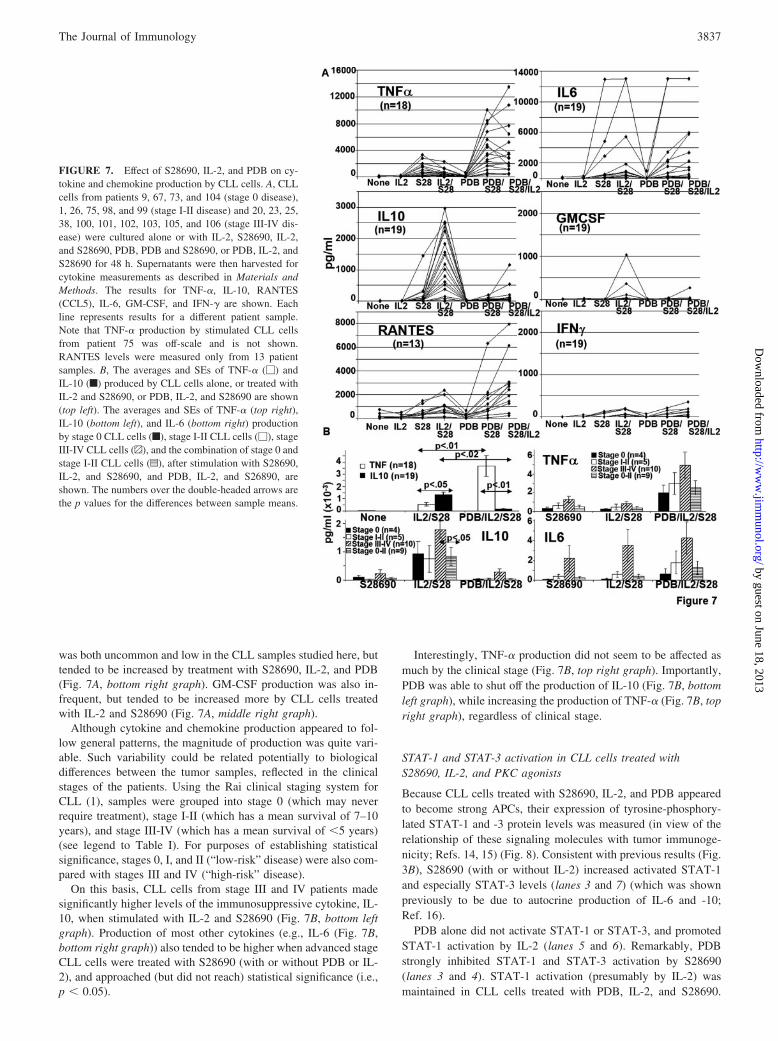
CLL cells treated with IL-2, alone, made very few cytokines orchemokines. As reported previously (16), CLL cells invariablymade TNF-� (Fig. 7A, top left graph) and lesser amounts of IL-10(Fig. 7A, middle left graph) in response to S28690. In the presenceof IL-2, S28690-induced TNF-� production was somewhat de-creased. Remarkably, IL-10 production was increased significantlywhen CLL cells were treated with both IL-2 and S28690 (Fig. 7A,middle left graph).
PKC agonists had dramatic effects on the production of thesecytokines. Although a paucity of cytokines was made by CLL cellstreated with PDB alone, TNF-� production was increased consid-erably after treatment with both PDB and S28690, and especiallyafter PDB, S28690, and IL-2 (Fig. 7A, top left graph). At the sametime, IL-10 production by CLL cells treated with S28690 and IL-2was inhibited strongly by concomitant treatment with PDB. Thesechanges in the balance of TNF-� and IL-10 production caused byPDB were highly statistically significant (Fig. 7B, top left graph).
The effects of these immunomodulatory agents on the produc-tion of other chemokines and cytokines were more variable. Che-mokines (such as RANTES (CCL5) (Fig. 7A, bottom left graph),MIP-1-� (CCL3), MIP-1-� (CCL4), and IFN-�-inducible pro-tein-10 (CXCL10) (data not shown)) generally followed the pat-tern of TNF-�, and tended to be produced in greater amounts whenCLL cells were treated with PDB, S28690, and IL2, consistentwith the increased ability of these cells to stimulate T cell prolif-eration (Fig. 5). IL-6 was sometimes very high when CLL cellswere treated with S28690 (with or without IL-2), but did not ap-pear to be affected especially by concomitant stimulation withPDB (Fig. 7A, top right graph). CLL cells have been reported tomake the type 1 immune cytokine, IFN-� (29). IFN-� production
FIGURE 6. Effect of PKC agonists on costimulatorymolecule expression by CLL cells treated with S28690and IL-2. A, CLL cells from a representative patientwere cultured alone, or with S28690, IL-2, and PDB, for3 days. CD80, CD83, CD54, and CD86 expression wasthen determined by flow cytometry. The percentages re-fer to CD80 (sum of the right and left upper quadrants)(left dot plots) and to CD86 (sum of the right upper andlower quadrants) (right dot plots). B, Summary of theflow cytometric evaluation of the percentage of CLLcells expressing CD80, CD83, CD54, and CD86 (andthe MFI of expression) after culture alone, with PDB,PDB and IL-2, PDB and S28690, or PDB, IL-2 andS262690. The average and SE of the results from thenumber of patients indicated in the graph legend areshown. For CD54, only the MFI (divided by 10) isshown because essentially all CLL cells express thismolecule. The results indicated that PDB and S28690caused nearly 100% of CLL cells to acquire CD80,CD86, and CD83 expression. Addition of IL-2 affectedmainly the magnitude of CD80 and CD54 expression. C,Summary of similar flow cytometric evaluation ofICOS-L, 4-1BBL, and PDL-1 expression. PDB, with orwithout IL-2, and/or S28690 increased the expression of4-1BBL and PDL-1 but not to the same degree as CD80,CD86, CD54, and CD83. �, p � 0.05; ��, p � 0.01.
3836 IMMUNOGENIC INTERACTIONS BETWEEN IL-2 AND TLR-7
by guest on June 18, 2013http://w
ww
.jimm
unol.org/D
ownloaded from
was both uncommon and low in the CLL samples studied here, buttended to be increased by treatment with S28690, IL-2, and PDB(Fig. 7A, bottom right graph). GM-CSF production was also in-frequent, but tended to be increased more by CLL cells treatedwith IL-2 and S28690 (Fig. 7A, middle right graph).
Although cytokine and chemokine production appeared to fol-low general patterns, the magnitude of production was quite vari-able. Such variability could be related potentially to biologicaldifferences between the tumor samples, reflected in the clinicalstages of the patients. Using the Rai clinical staging system forCLL (1), samples were grouped into stage 0 (which may neverrequire treatment), stage I-II (which has a mean survival of 7–10years), and stage III-IV (which has a mean survival of �5 years)(see legend to Table I). For purposes of establishing statisticalsignificance, stages 0, I, and II (“low-risk” disease) were also com-pared with stages III and IV (“high-risk” disease).
On this basis, CLL cells from stage III and IV patients madesignificantly higher levels of the immunosuppressive cytokine, IL-10, when stimulated with IL-2 and S28690 (Fig. 7B, bottom leftgraph). Production of most other cytokines (e.g., IL-6 (Fig. 7B,bottom right graph)) also tended to be higher when advanced stageCLL cells were treated with S28690 (with or without PDB or IL-2), and approached (but did not reach) statistical significance (i.e.,p � 0.05).
Interestingly, TNF-� production did not seem to be affected asmuch by the clinical stage (Fig. 7B, top right graph). Importantly,PDB was able to shut off the production of IL-10 (Fig. 7B, bottomleft graph), while increasing the production of TNF-� (Fig. 7B, topright graph), regardless of clinical stage.
STAT-1 and STAT-3 activation in CLL cells treated withS28690, IL-2, and PKC agonists
Because CLL cells treated with S28690, IL-2, and PDB appearedto become strong APCs, their expression of tyrosine-phosphory-lated STAT-1 and -3 protein levels was measured (in view of therelationship of these signaling molecules with tumor immunoge-nicity; Refs. 14, 15) (Fig. 8). Consistent with previous results (Fig.3B), S28690 (with or without IL-2) increased activated STAT-1and especially STAT-3 levels (lanes 3 and 7) (which was shownpreviously to be due to autocrine production of IL-6 and -10;Ref. 16).
PDB alone did not activate STAT-1 or STAT-3, and promotedSTAT-1 activation by IL-2 (lanes 5 and 6). Remarkably, PDBstrongly inhibited STAT-1 and STAT-3 activation by S28690(lanes 3 and 4). STAT-1 activation (presumably by IL-2) wasmaintained in CLL cells treated with PDB, IL-2, and S28690.
FIGURE 7. Effect of S28690, IL-2, and PDB on cy-tokine and chemokine production by CLL cells. A, CLLcells from patients 9, 67, 73, and 104 (stage 0 disease),1, 26, 75, 98, and 99 (stage I-II disease) and 20, 23, 25,38, 100, 101, 102, 103, 105, and 106 (stage III-IV dis-ease) were cultured alone or with IL-2, S28690, IL-2,and S28690, PDB, PDB and S28690, or PDB, IL-2, andS28690 for 48 h. Supernatants were then harvested forcytokine measurements as described in Materials andMethods. The results for TNF-�, IL-10, RANTES(CCL5), IL-6, GM-CSF, and IFN-� are shown. Eachline represents results for a different patient sample.Note that TNF-� production by stimulated CLL cellsfrom patient 75 was off-scale and is not shown.RANTES levels were measured only from 13 patientsamples. B, The averages and SEs of TNF-� (�) andIL-10 (f) produced by CLL cells alone, or treated withIL-2 and S28690, or PDB, IL-2, and S28690 are shown(top left). The averages and SEs of TNF-� (top right),IL-10 (bottom left), and IL-6 (bottom right) productionby stage 0 CLL cells (f), stage I-II CLL cells (�), stageIII-IV CLL cells (^), and the combination of stage 0 andstage I-II CLL cells (z), after stimulation with S28690,IL-2, and S28690, and PDB, IL-2, and S26890, areshown. The numbers over the double-headed arrows arethe p values for the differences between sample means.
3837The Journal of Immunology
by guest on June 18, 2013http://w
ww
.jimm
unol.org/D
ownloaded from
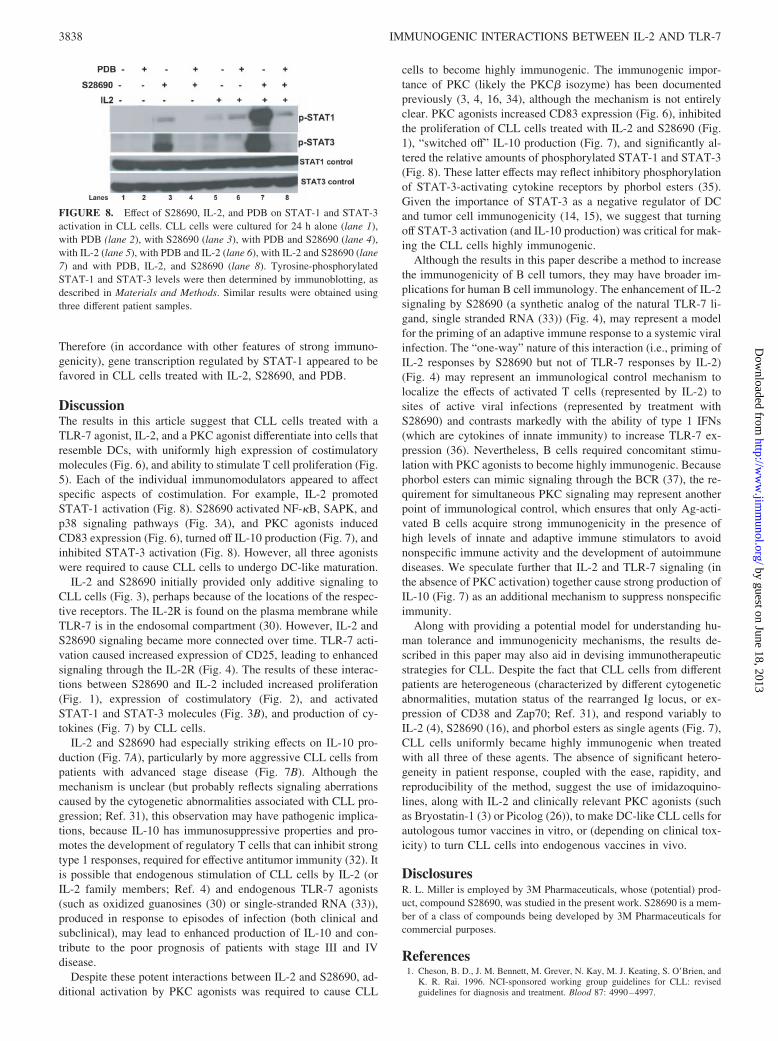
Therefore (in accordance with other features of strong immuno-genicity), gene transcription regulated by STAT-1 appeared to befavored in CLL cells treated with IL-2, S28690, and PDB.
DiscussionThe results in this article suggest that CLL cells treated with aTLR-7 agonist, IL-2, and a PKC agonist differentiate into cells thatresemble DCs, with uniformly high expression of costimulatorymolecules (Fig. 6), and ability to stimulate T cell proliferation (Fig.5). Each of the individual immunomodulators appeared to affectspecific aspects of costimulation. For example, IL-2 promotedSTAT-1 activation (Fig. 8). S28690 activated NF-�B, SAPK, andp38 signaling pathways (Fig. 3A), and PKC agonists inducedCD83 expression (Fig. 6), turned off IL-10 production (Fig. 7), andinhibited STAT-3 activation (Fig. 8). However, all three agonistswere required to cause CLL cells to undergo DC-like maturation.
IL-2 and S28690 initially provided only additive signaling toCLL cells (Fig. 3), perhaps because of the locations of the respec-tive receptors. The IL-2R is found on the plasma membrane whileTLR-7 is in the endosomal compartment (30). However, IL-2 andS28690 signaling became more connected over time. TLR-7 acti-vation caused increased expression of CD25, leading to enhancedsignaling through the IL-2R (Fig. 4). The results of these interac-tions between S28690 and IL-2 included increased proliferation(Fig. 1), expression of costimulatory (Fig. 2), and activatedSTAT-1 and STAT-3 molecules (Fig. 3B), and production of cy-tokines (Fig. 7) by CLL cells.
IL-2 and S28690 had especially striking effects on IL-10 pro-duction (Fig. 7A), particularly by more aggressive CLL cells frompatients with advanced stage disease (Fig. 7B). Although themechanism is unclear (but probably reflects signaling aberrationscaused by the cytogenetic abnormalities associated with CLL pro-gression; Ref. 31), this observation may have pathogenic implica-tions, because IL-10 has immunosuppressive properties and pro-motes the development of regulatory T cells that can inhibit strongtype 1 responses, required for effective antitumor immunity (32). Itis possible that endogenous stimulation of CLL cells by IL-2 (orIL-2 family members; Ref. 4) and endogenous TLR-7 agonists(such as oxidized guanosines (30) or single-stranded RNA (33)),produced in response to episodes of infection (both clinical andsubclinical), may lead to enhanced production of IL-10 and con-tribute to the poor prognosis of patients with stage III and IVdisease.
Despite these potent interactions between IL-2 and S28690, ad-ditional activation by PKC agonists was required to cause CLL
cells to become highly immunogenic. The immunogenic impor-tance of PKC (likely the PKC� isozyme) has been documentedpreviously (3, 4, 16, 34), although the mechanism is not entirelyclear. PKC agonists increased CD83 expression (Fig. 6), inhibitedthe proliferation of CLL cells treated with IL-2 and S28690 (Fig.1), “switched off” IL-10 production (Fig. 7), and significantly al-tered the relative amounts of phosphorylated STAT-1 and STAT-3(Fig. 8). These latter effects may reflect inhibitory phosphorylationof STAT-3-activating cytokine receptors by phorbol esters (35).Given the importance of STAT-3 as a negative regulator of DCand tumor cell immunogenicity (14, 15), we suggest that turningoff STAT-3 activation (and IL-10 production) was critical for mak-ing the CLL cells highly immunogenic.
Although the results in this paper describe a method to increasethe immunogenicity of B cell tumors, they may have broader im-plications for human B cell immunology. The enhancement of IL-2signaling by S28690 (a synthetic analog of the natural TLR-7 li-gand, single stranded RNA (33)) (Fig. 4), may represent a modelfor the priming of an adaptive immune response to a systemic viralinfection. The “one-way” nature of this interaction (i.e., priming ofIL-2 responses by S28690 but not of TLR-7 responses by IL-2)(Fig. 4) may represent an immunological control mechanism tolocalize the effects of activated T cells (represented by IL-2) tosites of active viral infections (represented by treatment withS28690) and contrasts markedly with the ability of type 1 IFNs(which are cytokines of innate immunity) to increase TLR-7 ex-pression (36). Nevertheless, B cells required concomitant stimu-lation with PKC agonists to become highly immunogenic. Becausephorbol esters can mimic signaling through the BCR (37), the re-quirement for simultaneous PKC signaling may represent anotherpoint of immunological control, which ensures that only Ag-acti-vated B cells acquire strong immunogenicity in the presence ofhigh levels of innate and adaptive immune stimulators to avoidnonspecific immune activity and the development of autoimmunediseases. We speculate further that IL-2 and TLR-7 signaling (inthe absence of PKC activation) together cause strong production ofIL-10 (Fig. 7) as an additional mechanism to suppress nonspecificimmunity.
Along with providing a potential model for understanding hu-man tolerance and immunogenicity mechanisms, the results de-scribed in this paper may also aid in devising immunotherapeuticstrategies for CLL. Despite the fact that CLL cells from differentpatients are heterogeneous (characterized by different cytogeneticabnormalities, mutation status of the rearranged Ig locus, or ex-pression of CD38 and Zap70; Ref. 31), and respond variably toIL-2 (4), S28690 (16), and phorbol esters as single agents (Fig. 7),CLL cells uniformly became highly immunogenic when treatedwith all three of these agents. The absence of significant hetero-geneity in patient response, coupled with the ease, rapidity, andreproducibility of the method, suggest the use of imidazoquino-lines, along with IL-2 and clinically relevant PKC agonists (suchas Bryostatin-1 (3) or Picolog (26)), to make DC-like CLL cells forautologous tumor vaccines in vitro, or (depending on clinical tox-icity) to turn CLL cells into endogenous vaccines in vivo.
DisclosuresR. L. Miller is employed by 3M Pharmaceuticals, whose (potential) prod-uct, compound S28690, was studied in the present work. S28690 is a mem-ber of a class of compounds being developed by 3M Pharmaceuticals forcommercial purposes.
References1. Cheson, B. D., J. M. Bennett, M. Grever, N. Kay, M. J. Keating, S. O’Brien, and
K. R. Rai. 1996. NCI-sponsored working group guidelines for CLL: revisedguidelines for diagnosis and treatment. Blood 87: 4990–4997.
FIGURE 8. Effect of S28690, IL-2, and PDB on STAT-1 and STAT-3activation in CLL cells. CLL cells were cultured for 24 h alone (lane 1),with PDB (lane 2), with S28690 (lane 3), with PDB and S28690 (lane 4),with IL-2 (lane 5), with PDB and IL-2 (lane 6), with IL-2 and S28690 (lane7) and with PDB, IL-2, and S28690 (lane 8). Tyrosine-phosphorylatedSTAT-1 and STAT-3 levels were then determined by immunoblotting, asdescribed in Materials and Methods. Similar results were obtained usingthree different patient samples.
3838 IMMUNOGENIC INTERACTIONS BETWEEN IL-2 AND TLR-7
by guest on June 18, 2013http://w
ww
.jimm
unol.org/D
ownloaded from
2. Montserrat, E. 2005. CLL therapy: progress at last. Blood 105: 2–3.3. Hammond, C., Y. Shi, J. Mena, J. Tomic, D. Cervi, L. He, A. E. Millar,
M. DeBenedette, A. C. Schuh, J. L. Baryza, et al. 2005. Effect of serum andantioxidants on the immunogenicity of protein kinase C-activated CLL cells.J. Immunother. 28: 28–39.
4. Spaner, D. E., C. Hammond, J. Mena, and Y. Shi. 2004. Effect of IL-2R �-bind-ing cytokines on costimulatory properties of CLL cells: implications for immu-notherapy. Br. J. Haematol. 127: 531–542.
5. Gitelson, E., C. Hammond, J. Mena, M. Lorenzo, R. Buckstein, N. Berinstein,K. Imrie, and D. E. Spaner. 2003. CLL-reactive T cells during tumor progressionand after oxidized autologous tumor cell vaccines. Clin. Cancer Res. 9:1656–1665.
6. Spaner, D. E., C. Hammond, J. Mena, C. Foden, and A. Deabreu. 2005. A phaseI/II trial of oxidized autologous tumor vaccines during the “watch and wait”phase of chronic lymphocytic leukemia. Cancer Immunol. Immunother. 54:635–646.
7. Greewald, R. J., G. Freeman, and A. Sharpe. 2005. The B7 family revisited.Annu. Rev. Immunol. 23: 515–548.
8. Hart, D. N. 1997. Dendritic cells: unique leukocyte populations which control theprimary immune response. Blood 90: 3245–3287.
9. Lechmann, M., S. Berchtold, J. Hauber, and A. Steinkasserer. 2002. CD83 onDCs: more than just a marker for maturation. Trends Immunol. 23: 273–275.
10. Chen, L. 2004. Co-inhibitory molecules of the B7-CD28 family in the control ofT-cell immunity. Nat. Rev. Immunol. 4: 336–347.
11. Watts, T. H. 2005. TNF/TNFR family members in costimulation of T cell re-sponses. Annu. Rev. Immunol. 23: 23–68.
12. Burkly, L., C. Hession, L. Ogata, C. Reilly, L. A. Marconi, D. Olson, R. Tizard,R. Cate, and D. Lo. 1995. Expression of relB is required for the development ofthymic medulla and dendritic cells. Nature 373: 531–536.
13. Jackson, S. H., C. R. Yu, R. M. Mahdi, S. Ebong, and C. E. Egwuagu. 2004. DCmaturation requires STAT1 and is under feedback regulation by suppressors ofcytokine signaling. J. Immunol. 172: 2307–2315.
14. Cheng, F., H. W. Wang, A. Cuenca, M. Huang, T. Ghansah, J. Brayer,W. G. Kerr, K. Takeda, S. Akira, S. P. Schoenberger, et al. 2003. A critical rolefor Stat3 signaling in immune tolerance. Immunity 19: 425–436.
15. Wang, T., G. Niu, M. Kortylewski, L. Burdelya, K. Shain, S. Zhang,R. Bhattacharya, D. Gabrilovich, R. Heller, D. Coppola, et al. 2004. Regulationof the innate and adaptive immune responses by Stat-3 signaling in tumor cells.Nat. Med. 10: 48–54.
16. Spaner, D. E., Y. Shi, D. White, J. Mena, C. Hammond, J. Tomic, L. He,M.A. Tomai, R. L. Miller, J. Booth, et al. 2006. Immunomodulatory effects ofToll-like receptor-7 activation on chronic lymphocytic leukemia cells. Leukemia20: 286–295.
17. Spaner, D, R. L. Miller, J. Mena, L. Grossman, V. Sorrenti, and Y. H. Shi. 2005.Regression of lymphomatous skin deposits in a CLL patient treated with theToll-like receptor-7/8 agonist, Imiquimod. Leuk. Lymphoma 46: 935–939.
18. Ozaki, K., and W. J. Leonard. 2002. Cytokine and cytokine receptor pleiotropyand redundancy. J. Biol. Chem. 277: 29355–29358.
19. Frank, D. A., M. J. Robertson, A. Bonni, J. Ritz, and M. E. Greenberg. 1995.Interleukin 2 signaling involves the phosphorylation of Stat proteins. Proc. Natl.Acad. Sci. USA 92: 7779–7783.
20. Lin, J. X., and W. J. Leonard. 2000. The role of Stat5a and Stat5b in signaling byIL-2 family cytokines. Oncogene 19: 2566–2576.
21. Akira, S., and K. Takeda. 2004. Toll-like receptor signalling. Nat. Rev. Immunol.4: 499–511.
22. Schoenemeyer, A., B. J. Barnes, M. E. Mancl, E. Latz, N. Goutagny, P. M. Pitha,K. A. Fitzgerald, and D. T. Golenbock. 2005. The interferon regulatory factor,IRF5, is a central mediator of TLR-7 signaling. J. Biol. Chem. 280: 17005–17012.
23. Matzinger, P. 2002. The danger model: a renewed sense of self. Science 296:301–305.
24. Germain, R. H., and D. M. Marguiles. 1993. The biochemistry and cell biologyof antigen processing and presentation. Annu. Rev. Immunol. 11: 403–450.
25. Levesque, M. C., C. W. O’Loughlin, and J. B. Weinberg. 2001. Use of serum-freemedia to minimize apoptosis of CLL cells during in vitro culture. Leukemia 15:1305–1307.
26. Baryza, J. L., S. E. Brenner, M. L. Craske, T. Meyer, and P. A. Wender. 2004.Simplified analogs of bryostatin with anticancer activity display greater potencyfor translocation of PKC�-GFP. Chem. Biol. 11: 1261–1267.
27. Pulendran, B. 2005. Variegation of the immune response with dendritic cells andpathogen recognition receptors. J. Immunol. 174: 2457–2465.
28. Szabo, S. J., B. M. Sullivan, S. L. Peng, and L. H. Glimcher. 2003. Molecularmechanisms regulating Th1 immune responses. Annu. Rev. Immunol. 21:713–758.
29. Battle, T. E., and D. A. Frank. 2003. STAT1 mediates differentiation of chroniclymphocytic leukemia cells in response to Bryostatin 1. Blood 102: 3016–3024.
30. Heil, F., P. Ahmad-Nejad, H. Hemmi, H. Hochrein, F. Ampenberger, T. Gellert,H. Dietrich, G. Lipford, K. Takeda, S. Akira, et al. 2003. The Toll-like receptor7 (TLR7)-specific stimulus loxoribine uncovers a strong relationship within theTLR7, 8 and 9 subfamily. Eur. J. Immunol. 33: 2987–2997.
31. Stevenson, F. K., and F. Caligaris-Cappio. 2004. Chronic lymphocytic leukemia:revelations from the B-cell receptor. Blood 103: 4389–4395.
32. Spaner, D. 2004. Amplifying cancer vaccine responses by modifying pathogenicgene programs in tumor cells. J. Leukocyte Biol. 76: 338–351.
33. Heil, F., H. Hemmi, H. Hochrein, F. Ampenberger, C. Kirschning, S. Akira,G. Lipford, H. Wagner, and S. Bauer. 2004. Species-specific recognition of sin-gle-stranded RNA via Toll-like receptor 7 and 8. Science 303: 1526–1529.
34. Cejas, P. J., L. M. Carlson, J. Zhang, S. Padmanabhan, D. Kolonias, I. Lindner,S. Haley, L. H. Boise, and K. P. Lee. 2005. Protein kinase C � II plays anessential role in dendritic cell differentiation and autoregulates its own expres-sion. J. Biol. Chem. 280: 28412–28423.
35. Sengupta, T. K., E. S. Talbot, P. A. Scherle, and L. B. Ivashkiv. 1998. Rapidinhibition of interleukin-6 signaling and Stat3 activation mediated by mitogen-activated protein kinases. Proc. Natl. Acad. Sci. USA 95: 11107–11112.
36. Bekeredjian-Ding, I. B., M. Wagner, V. Hornung, T. Giese, M. Schnurr,S. Endres, and G. Hartmann. 2005. Plasmacytoid dendritic cells control TLR7sensitivity of naive B cells via type I IFN. J. Immunol. 174: 4043–4050.
37. Guo, B., T. T. Su, and D. J. Rawlings. 2004. Protein kinase C family functionsin B-cell activation. Curr. Opin. Immunol. 16: 367–373.
3839The Journal of Immunology
by guest on June 18, 2013http://w
ww
.jimm
unol.org/D
ownloaded from
Related Documents