ADVANCES IN ATMOSPHERIC SCIENCES, VOL. 25, NO. 4, 2008, 529–540 Sensitivity of the Grid-point Atmospheric Model of IAP LASG (GAMIL1.1.0) Climate Simulations to Cloud Droplet Effective Radius and Liquid Water Path LI Lijuan * 1,3 (李立娟), Yuqing WANG 2 , WANG Bin 1 (王斌), and ZHOU Tianjun 1 (周天) 1 State Key Laboratory of Numerical Modeling for Atmospheric Sciences and Geophysical Fluid Dynamics, Institute of Atmospheric Physics, Chinese Academy of Sciences, Beijing 100029 2 Department of Meteorology and International Pacific Research Center, University of Hawaii at Manoa, Honolulu, HI 96822 3 Graduate University of Chinese Academy of Sciences, Beijing 100049 (Received 30 April 2007; revised 2 February 2008) ABSTRACT This paper documents a study to examine the sensitivity to cloud droplet effective radius and liquid water path and the alleviation the energy imbalance at the top of the atmosphere and at the surface in the latest version of the Grid-point Atmospheric Model of the State Key Laboratory of Numerical Modeling for Atmospheric Sciences and Geophysical Fluid Dynamics (LASG), Institute of Atmospheric Physics (IAP) (GAMIL1.1.0). Considerable negative biases in all flux components, and thus an energy imbalance, are found in GAMIL1.1.0. In order to alleviate the energy imbalance, two modifications, namely an increase in cloud droplet effective radius and a decrease in cloud liquid water path, have been made to the cloud properties used in GAMIL. With the increased cloud droplet effective radius, the single scattering albedo of clouds is reduced, and thus the reflection of solar radiation into space by clouds is reduced and the net solar radiation flux at the top of the atmosphere is increased. With the reduced cloud optical depth, the net surface shortwave radiation flux is increased, causing a net warming over the land surface. This results in an increase in both sensible and latent heat fluxes over the land regions, which is largely balanced by the increased terrestrial radiation fluxes. Consequently, the energy balance at the top of atmosphere and at the surface is achieved with energy flux components consistent with available satellite observations. Key words: GAMIL, energy budget, cloud droplet effective radius, cloud liquid water path DOI: 10.1007/s00376-008-0529-z 1. Introduction Accurate simulation of the radiation energy budget is one of the most important properties of an atmo- spheric general circulation model (AGCM) as the dis- tribution of incoming and outgoing radiative energy fluxes is the primary forcing agent for the general cir- culation of the atmosphere. The net flux of energy at the top of the atmosphere (TOA) determines the available energy for the complete climate system in- cluding underlying surfaces. The surface heat fluxes of an AGCM are important for the land, ocean and sea- ice models in a coupled modeling system. Any small biases could result in climate drifts in the climate sim- ulation of a coupled model. Therefore, as part of the model documentation and a critical component of the model development,it is important to evaluate the en- ergy balance of the model, especially for a newly de- veloped model or any updates of a model component. For examples, Kiehl and Ramanathan (1990) andKiehl et al. (1994) evaluated the earth radiation budget for the two different versions of the National Center for * Corresponding author: LI Lijuan, [email protected]

Welcome message from author
This document is posted to help you gain knowledge. Please leave a comment to let me know what you think about it! Share it to your friends and learn new things together.
Transcript
ADVANCES IN ATMOSPHERIC SCIENCES, VOL. 25, NO. 4, 2008, 529–540
Sensitivity of the Grid-point Atmospheric Model of IAP LASG
(GAMIL1.1.0) Climate Simulations to Cloud Droplet
Effective Radius and Liquid Water Path
LI Lijuan∗1,3 (李立娟), Yuqing WANG2,WANG Bin1 (王 斌), and ZHOU Tianjun1 (周天军)
1State Key Laboratory of Numerical Modeling for Atmospheric Sciences and Geophysical Fluid Dynamics,
Institute of Atmospheric Physics, Chinese Academy of Sciences, Beijing 100029
2Department of Meteorology and International Pacific Research Center,
University of Hawaii at Manoa, Honolulu, HI 96822
3Graduate University of Chinese Academy of Sciences, Beijing 100049
(Received 30 April 2007; revised 2 February 2008)
ABSTRACT
This paper documents a study to examine the sensitivity to cloud droplet effective radius and liquidwater path and the alleviation the energy imbalance at the top of the atmosphere and at the surface in thelatest version of the Grid-point Atmospheric Model of the State Key Laboratory of Numerical Modelingfor Atmospheric Sciences and Geophysical Fluid Dynamics (LASG), Institute of Atmospheric Physics (IAP)(GAMIL1.1.0). Considerable negative biases in all flux components, and thus an energy imbalance, arefound in GAMIL1.1.0. In order to alleviate the energy imbalance, two modifications, namely an increasein cloud droplet effective radius and a decrease in cloud liquid water path, have been made to the cloudproperties used in GAMIL. With the increased cloud droplet effective radius, the single scattering albedoof clouds is reduced, and thus the reflection of solar radiation into space by clouds is reduced and the netsolar radiation flux at the top of the atmosphere is increased. With the reduced cloud optical depth, thenet surface shortwave radiation flux is increased, causing a net warming over the land surface. This resultsin an increase in both sensible and latent heat fluxes over the land regions, which is largely balanced by theincreased terrestrial radiation fluxes. Consequently, the energy balance at the top of atmosphere and at thesurface is achieved with energy flux components consistent with available satellite observations.
Key words: GAMIL, energy budget, cloud droplet effective radius, cloud liquid water path
DOI: 10.1007/s00376-008-0529-z
1. Introduction
Accurate simulation of the radiation energy budgetis one of the most important properties of an atmo-spheric general circulation model (AGCM) as the dis-tribution of incoming and outgoing radiative energyfluxes is the primary forcing agent for the general cir-culation of the atmosphere. The net flux of energyat the top of the atmosphere (TOA) determines theavailable energy for the complete climate system in-cluding underlying surfaces. The surface heat fluxes of
an AGCM are important for the land, ocean and sea-ice models in a coupled modeling system. Any smallbiases could result in climate drifts in the climate sim-ulation of a coupled model. Therefore, as part of themodel documentation and a critical component of themodel development, it is important to evaluate the en-ergy balance of the model, especially for a newly de-veloped model or any updates of a model component.For examples,Kiehl and Ramanathan (1990)andKiehlet al. (1994) evaluated the earth radiation budget forthe two different versions of the National Center for
∗Corresponding author: LI Lijuan, [email protected]
530 SENSITIVITY OF GAMIL SIMULATIONS TO CDER AND LWP VOL. 25
Table 1. Globally averaged annual mean top of atmosphere (TOA) and surface energy budgets of different versions ofGAMIL and observation.
GAMIL1.0.1 GAMIL1.0.2 GAMIL1.1.0 Experiment K–T(CNTL) (EXPT)
Top of atmosphereOLR −228.147 −230.602 −225.935 −235.686 −235Solar absorbed 227.056 217.059 211.885 235.356 235Net TOA −1.091 −13.543 −14.05 −0.33 0
Surface fluxesSolar absorbed 158.638 147.414 141.571 164.171 168Net longwave −63.4504 −61.9006 −59.884 −63.1771 −66Latent heat −77.7172 −77.5829 −74.8117 −79.3893 −78Sensible heat −18.2616 −20.905 −20.3826 −21.3995 −24Net surface −0.7912 −12.9745 −13.4673 0.2051 0
Note: Fluxes are in W m−2. OLR denotes outgoing longwave radiation flux. Observational estimates (K–T) are from Kiehl and
Trenberth (1997).
Atmos-pheric Research (NCAR)’s Community Cli-mate Model (CCM), respectively. Kiehl et al. (1998)carried out a more extensive analysis of the entire en-ergy budget of the third generation CCM3 at both thetop of atmosphere and the surface.
The grid-point atmospheric model (GAMIL) is anew AGCM developed in the state Key Laboratory forNumerical Modeling of Atmospheric Sciences and Geo-physical Fluid Dynamics (LASG), Institute of Atmo-spheric Physics (IAP), Chinese Academy of Sciences(CAS). However, as a new AGCM, there has not beena detailed evaluation of the energy balance in GAMIL.Li et al. (2007) found a significant energy imbalanceof about −13 W m−2 both at the TOA and at thesurface (see Table 1) by making several modificationsto the Tiedtke (Tiedtke, 1989) convective parameter-ization scheme as tested in Wang et al. (2007). Thisdoes not result in a serious problem in modeling theshort-term climate with the atmospheric model, butit would cause trouble if the AGCM is coupled withocean and sea-ice models. Since our ultimate goal atLASG/IAP is to develop a fully coupled earth climatemodeling system including both the ocean and sea-ice components, it is thus of an urgent need to allevi-ate/eliminate the energy imbalance in the model.
It is a challenging task to reproduce the magnitudeand geographic distribution of energy budgets at theTOA and at the surface because there are many fac-tors affecting the energy budget in an AGCM. First,the cloud optical properties, such as cloud opticalthickness τ and single-scatter albedo ω, are usuallyexpressed as functions of the cloud droplet effectiveradius (re) and the cloud liquid water path (LWP)(Hack, 1998; Kiehl et al., 1998; Collins et al., 2003,Sengupta et al., 2003). The former, re, is definedas the ratio of the third moment to the second mo-
ment of the drop size distribution. The changes in re
could induce differences from 20 to 60 W m−2 in theglobal values of radiative fluxes at the surface levelfrom CCM2 (Kiehl et al., 1994). Dandin et al. (1997)also got the same results at both the top of the atmo-sphere and the surface using the French CommunityClimate model (ARPEGE-climate). The latter, LWP,is necessary in any climate model. Small LWP errorsmay lead to large nonlinear errors in surface radiationbudget, and the LWP has a larger impact than theeffective radius on surface solar fluxes (Sengupta etal., 2003). Hack (1998) found that the improvementof the liquid water scheme significantly improved thesimulations of the longwave and shortwave radiationof CCM2. Cloud amount is another primary factor.For example, an increase or decrease in global cloudcover could increase or decrease the Earth’s albedo,which would increase or decrease the amount of so-lar radiation reaching the Earth’s surface. The thirdis precipitation (Young et al., 1992), which influencesthe surface fluxes of latent and sensible heat. In ad-dition, the surface energy fluxes are directly affectedby temperature and humidity. All these interact witheach other in a very complicated, nonlinear way.
This study focuses on the evaluation of the energyimbalance and its alleviation/elimination both at theTOA and at the surface in GAMIL1.1.0. The rest ofthe paper is organized as follows. Section 2 briefly de-scribes the model and the physical parameterizationsin GAMIL1.1.0, particularly those relevant to the sim-ulated Earth radiation budget, and discusses the pos-sible causes of the imbalance and practical approachesto the alleviation of the imbalance. The sources of ob-servational data used for model validation are brieflydescribed in section 3. Section 4 presents the resultsfrom the modified version and compares them with
NO. 4 LI ET AL. 531
observations as well as the results from the originalGAMIL1.1.0. Finally, section 5 summarizes the majorresults and discusses the potential extension of thiswork.
2. Model description
GAMIL uses the dynamical core developed byWang et al. (2004) and the physics package of theNCAR’s Community Atmospheric Model Version 2(CAM2) (Collins et al., 2003). GAMIL1.1.0 utilizesa modified Tiedtke scheme and the improvements inits simulated climatology are recently documented by(Li et al., 2007). The model equations are solved ona hybrid horizontal grid with the Gaussian grid in theregion between 65.58◦S and 65.58◦N (the resolution is2.8◦ × 2.8◦) and with a weighted even area grid in thehigh latitudes and the polar regions. The model has26 vertical levels in σ (pressure normalized by surfacepressure) coordinate, with the model top at 2.194 hPa.We briefly describe the cloud optical property param-eterizations, including cloud microphysics and cloud
radiative properties, employed in GAMIL1.1.0.The cloud microphysics is based on a simple
scheme, which includes the cloud droplet effective ra-dius (re) and the cloud liquid water path (LWP). Theformer directly affects the cloud radiative properties.The GAMIL1.1.0 differentiates between the cloud dropeffective radius for clouds diagnosed over maritime andcontinental regimes (Kiehl et al., 1994; Collins et al.,2003). Over the ocean, the cloud drop effective radiusfor liquid clouds, rel, is specified to be 10. Over landmasses rel is determined using
rel =
5 −10◦C < T ,
5−5(
T +1020
)−30◦C 6 T 6 −10◦C ,
rei −30◦C > T .
(1)
An ice particle effective radius, rei, is diagnosed as inCCM3 (Kiehl et al., 1998), which amounts to a specifi-cation of ice radius as a function of normalized pressure
rei =
rei,min p/ps > 0.4 ,
rei,min − (rei,min − rei,min)×[(p/ps)− 0.4
0.4
]p/ps 6 0.4 ,
(2)
where rei,max = 30 µm, rei,min = 10 µm, p and ps de-note pressure and surface pressure. The fraction of thetotal cloud water in the form of ice particles is thendetermined empirically using
fi =
0 −10◦C < T ,
−0.05(T + 10) −30◦C 6 T 6 −10◦C ,
1 −30◦C > T .
(3)
The latter, LWP, is evaluated from a prescribedcloud liquid water density profile, ρ1(z):
LWP =∫
ρldz =∫
ρl,0e(−z/hi)dz , (4)
where the reference value ρl,0 is equal to 0.21 g m−3
and the liquid water scale height, hl, is diagnosed as afunction of vertically integrated water vapor (namely,precipitable water).
For shortwave radiation, the liquid cloud proper-ties (extinction optical depth τcld and single scattering
albedo ωcld) are defined as
τcld = LWP(
a +b
rel
)(1− fi) , (5)
ωcld = 1− c− drel , (6)
where a–d are defined for each of 24 spectral intervals(Slingo, 1989), and is the same as the ice cloud (Ebertand Curry, 1992). Therefore the cloud optical depthis inversely proportional to re, that is, given LWP, thelarger re, the smaller τcld. Similar proportion appliesto the single scattering albedo as seen from Eq. (6).
From Table 1, we can see that the energy imbal-ance at the TOA is due largely to the smaller netshortwave radiation flux in the GAMIL with Tiedtkeconvective parameterization scheme. This seems to re-sult mainly from too strong shortwave cloud radiativeforcing (CRF). Thus if we increase the cloud effec-tive radius and decrease the LWP, the single scatter-ing albedo would be reduced, limiting the reflectionof shortwave radiation into space. At the same time,both the cloud optical depth and cloud albedo wouldbe reduced, thus resulting in an increase in shortwavefluxes reaching the surface. Therefore, either changemay alleviate the energy imbalance at the TOA.
532 SENSITIVITY OF GAMIL SIMULATIONS TO CDER AND LWP VOL. 25
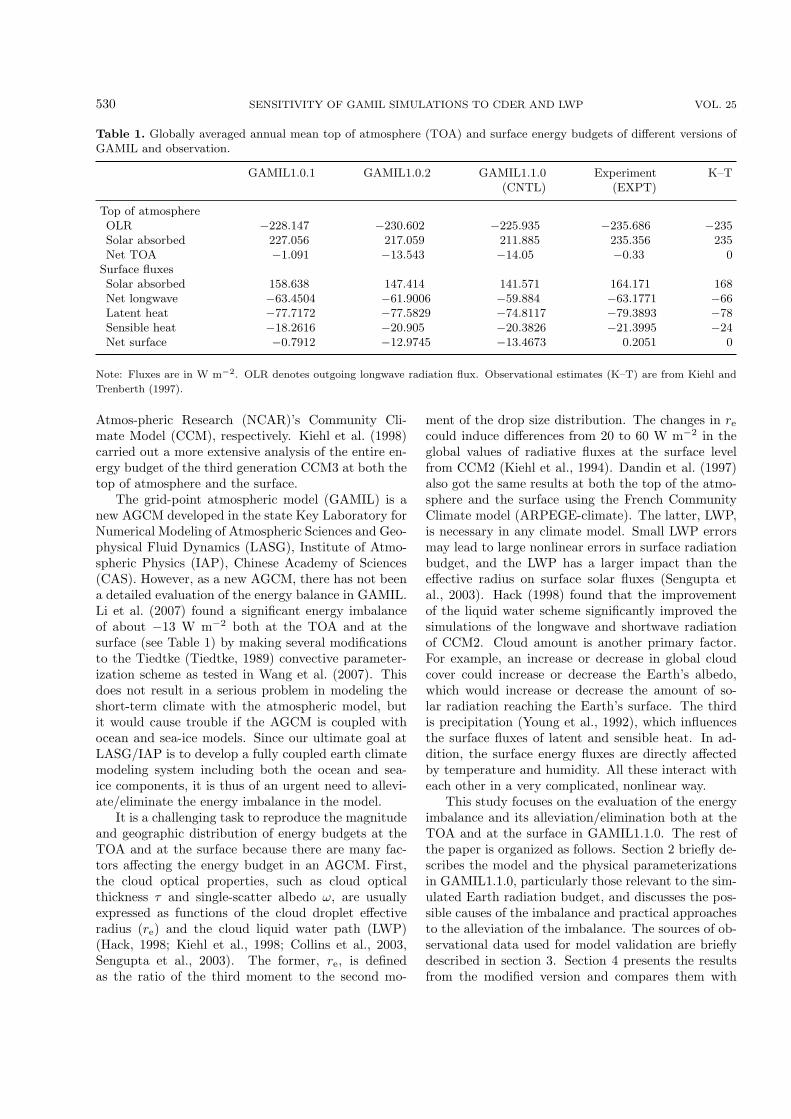
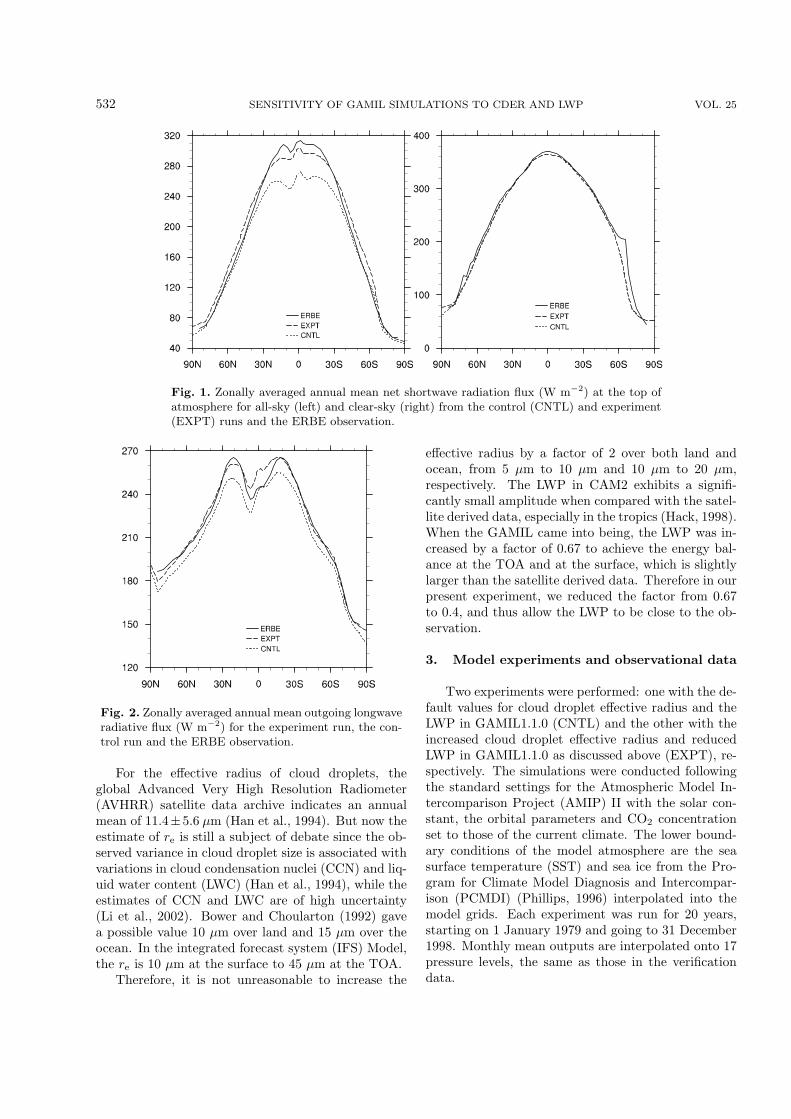
Fig. 1. Zonally averaged annual mean net shortwave radiation flux (W m−2) at the top ofatmosphere for all-sky (left) and clear-sky (right) from the control (CNTL) and experiment(EXPT) runs and the ERBE observation.
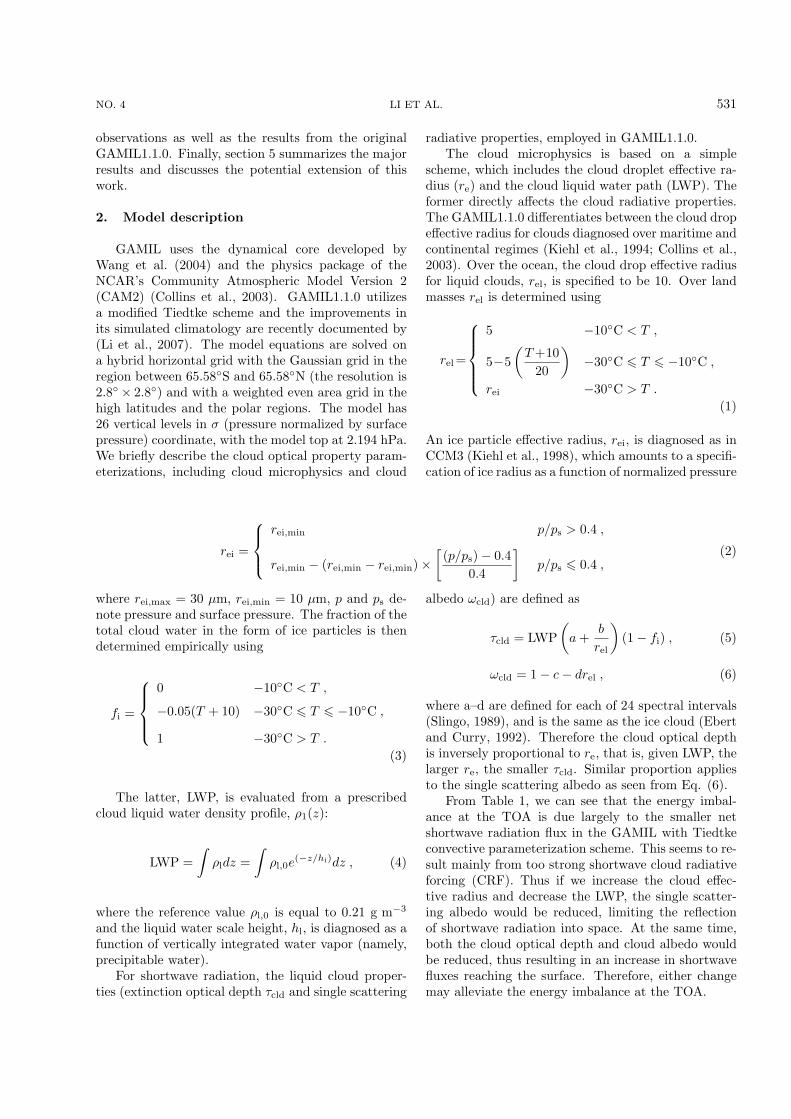
Fig. 2. Zonally averaged annual mean outgoing longwaveradiative flux (W m−2) for the experiment run, the con-trol run and the ERBE observation.
For the effective radius of cloud droplets, theglobal Advanced Very High Resolution Radiometer(AVHRR) satellite data archive indicates an annualmean of 11.4±5.6 µm (Han et al., 1994). But now theestimate of re is still a subject of debate since the ob-served variance in cloud droplet size is associated withvariations in cloud condensation nuclei (CCN) and liq-uid water content (LWC) (Han et al., 1994), while theestimates of CCN and LWC are of high uncertainty(Li et al., 2002). Bower and Choularton (1992) gavea possible value 10 µm over land and 15 µm over theocean. In the integrated forecast system (IFS) Model,the re is 10 µm at the surface to 45 µm at the TOA.
Therefore, it is not unreasonable to increase the
effective radius by a factor of 2 over both land andocean, from 5 µm to 10 µm and 10 µm to 20 µm,respectively. The LWP in CAM2 exhibits a signifi-cantly small amplitude when compared with the satel-lite derived data, especially in the tropics (Hack, 1998).When the GAMIL came into being, the LWP was in-creased by a factor of 0.67 to achieve the energy bal-ance at the TOA and at the surface, which is slightlylarger than the satellite derived data. Therefore in ourpresent experiment, we reduced the factor from 0.67to 0.4, and thus allow the LWP to be close to the ob-servation.
3. Model experiments and observational data
Two experiments were performed: one with the de-fault values for cloud droplet effective radius and theLWP in GAMIL1.1.0 (CNTL) and the other with theincreased cloud droplet effective radius and reducedLWP in GAMIL1.1.0 as discussed above (EXPT), re-spectively. The simulations were conducted followingthe standard settings for the Atmospheric Model In-tercomparison Project (AMIP) II with the solar con-stant, the orbital parameters and CO2 concentrationset to those of the current climate. The lower bound-ary conditions of the model atmosphere are the seasurface temperature (SST) and sea ice from the Pro-gram for Climate Model Diagnosis and Intercompar-ison (PCMDI) (Phillips, 1996) interpolated into themodel grids. Each experiment was run for 20 years,starting on 1 January 1979 and going to 31 December1998. Monthly mean outputs are interpolated onto 17pressure levels, the same as those in the verificationdata.
NO. 4 LI ET AL. 533
For model verification in our study, the datasetfrom the Earth Radiation Budget Experiment(ERBE), which provides monthly mean global data ona 2.5◦× 2.5◦ grid, is utilized. The values estimated byKiehl and Trenberth (1997) and climatological meansurface air temperature (Jones et al., 1999) are alsoused to verify the model results. The monthly meanprecipitation rate used in our comparison is the Cli-mate Prediction Center’s Merged Analysis of Precipi-tation (Xie and Arkin, 1997).
4. Results
4.1 Global and zonal mean comparisons
Each global annual mean flux component in theEXPT is closer to the corresponding estimates fromobservations by Kiehl and Trenberth (1997) than thesimulations from the previous versions of GAMIL. Thenet energy fluxes at the TOA and at the surface are−0.33 and 0.2 W m−2, respectively, in the EXPT (Ta-ble 1). This order of balance is required if this ver-sion of GAMIL is used as the atmospheric compo-nent in the flexible global ocean-atmosphere-land sys-tem model (FGOALS). To prevent the climate driftin a coupled system, the net TOA flux must be small(Kiehl et al., 1998). At the surface, there are largeuncertainties in any given observed energy flux. Forexample, values for the net shortwave flux range from154 to 174 W m−2. Similarly, the net longwave fluxesdiffer from 51 to 72 W m−2, and there is a 10 W m−2
spread in both sensible and latent heat fluxes (Kiehland Trenberth, 1997). But these fluxes simulated byGAMIL are in the range of the above estimates (Table1).
The zonally averaged annual mean all-sky and
clear-sky net shortwave radiation fluxes at the TOAfrom the simulations and ERBE are shown in Fig. 1.The simulated clear-sky solar radiation in both theEXPT and CNTL runs are in good agreement withthe ERBE observations. However, there is a large dif-ference in all-sky-absorbed solar radiation between theEXPT and CNTL in the tropics. In the control run,the model underestimated the observations by roughly40 W m−2 in the tropics between 20◦S and 20◦N, butonly by a few in the experiment run. The alleviation ofthe negative bias in the EXPT can be ascribed to theenlarged cloud droplet effective radius, which reducesthe cloud reflection of solar radiation into space by re-ducing the cloud albedo. In the middle-high latitudes,however, the model slightly overestimated the short-wave radiation in the EXPT, implying that the clouddroplet effective radius could be a little bit too smallfor middle-high latitude clouds. Therefore, further im-provement is required to include the dependence ofcloud properties on latitude in the model.
Different from the net shortwave radiation flux atthe TOA, the zonally averaged annual mean outgoinglongwave radiation (OLR) in the EXPT is increasedin all latitudes, closer to the ERBE observations thanthat in the CNTL (Fig. 2). In the control run, theOLR is underestimated at all latitudes with the largestunderestimation occurring in the subtropical regions.This might be due to an overestimatation of longwaveCRF associated with stratus/stratocumulus clouds inthe subtropics. In the experiment run, the negativebias is almost eliminated except that a positive bias oc-curs between 5◦N and 15◦S. The overall improvementis a result of the combination of the changes in cloudoptical properties, cloud top height, and the changes intemperature and/or moisture in the atmosphere, sincethe improvement also appears in the clear-sky OLR in
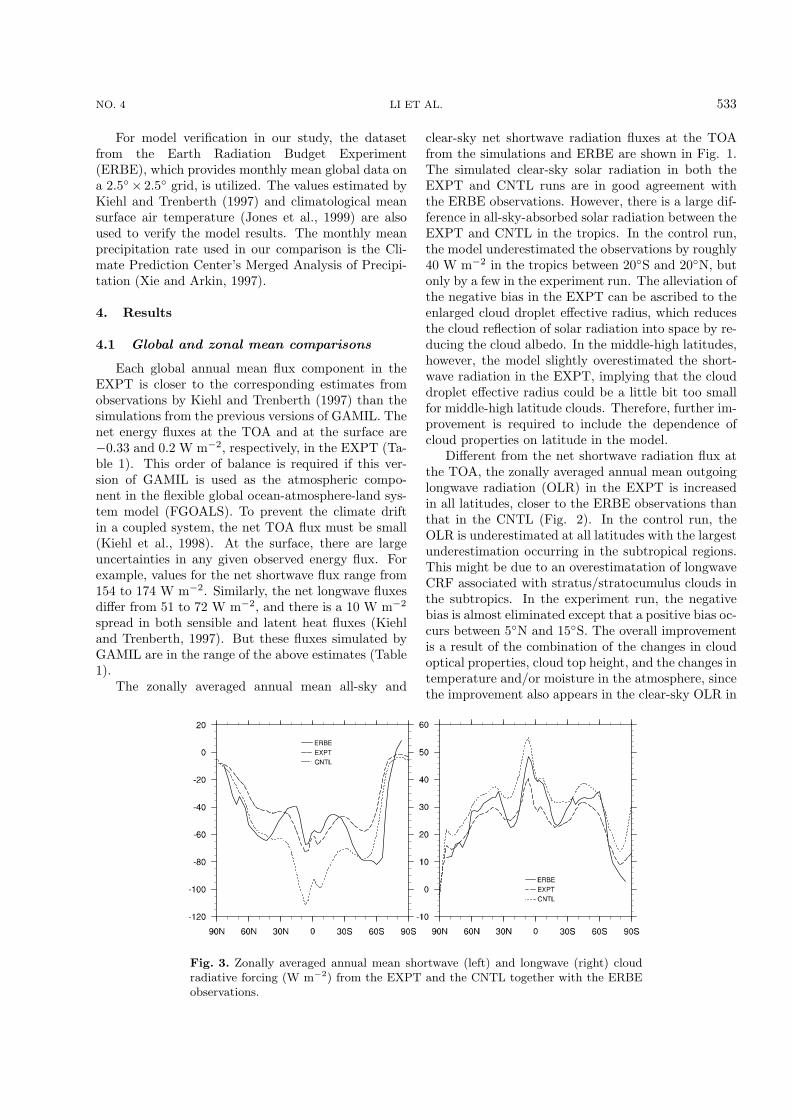
Fig. 3. Zonally averaged annual mean shortwave (left) and longwave (right) cloudradiative forcing (W m−2) from the EXPT and the CNTL together with the ERBEobservations.
534 SENSITIVITY OF GAMIL SIMULATIONS TO CDER AND LWP VOL. 25
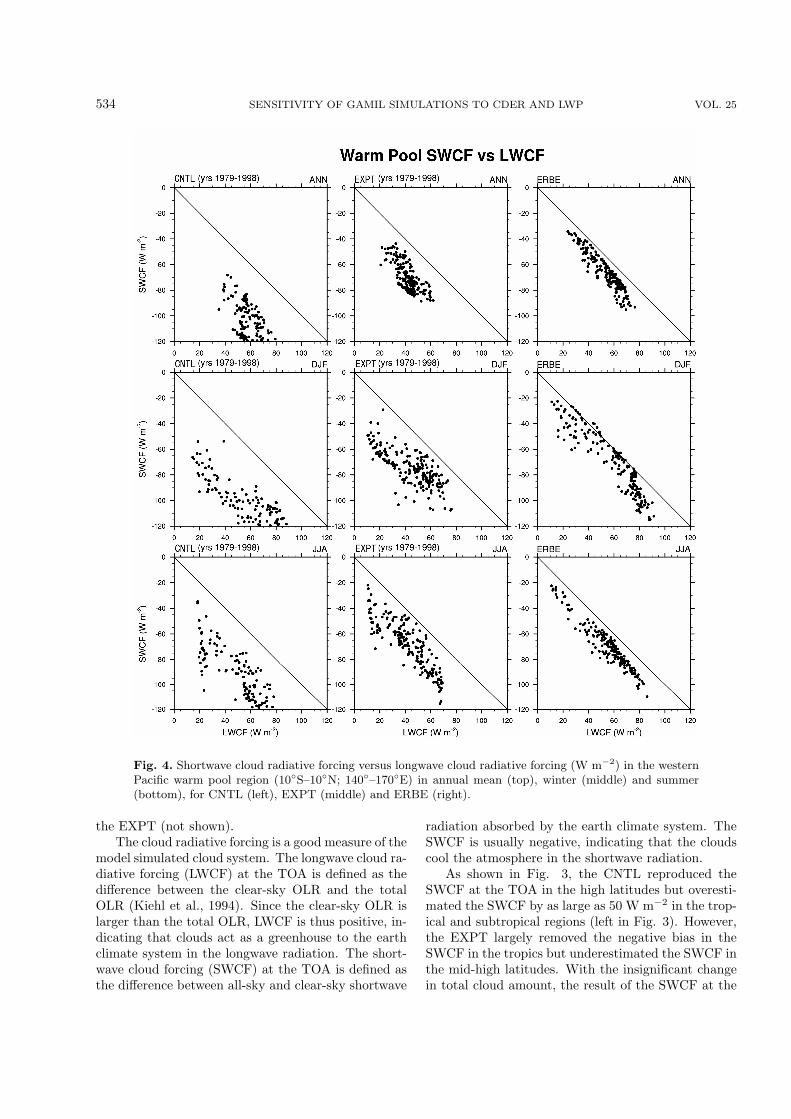
Fig. 4. Shortwave cloud radiative forcing versus longwave cloud radiative forcing (W m−2) in the westernPacific warm pool region (10◦S–10◦N; 140◦–170◦E) in annual mean (top), winter (middle) and summer(bottom), for CNTL (left), EXPT (middle) and ERBE (right).
the EXPT (not shown).The cloud radiative forcing is a good measure of the
model simulated cloud system. The longwave cloud ra-diative forcing (LWCF) at the TOA is defined as thedifference between the clear-sky OLR and the totalOLR (Kiehl et al., 1994). Since the clear-sky OLR islarger than the total OLR, LWCF is thus positive, in-dicating that clouds act as a greenhouse to the earthclimate system in the longwave radiation. The short-wave cloud forcing (SWCF) at the TOA is defined asthe difference between all-sky and clear-sky shortwave
radiation absorbed by the earth climate system. TheSWCF is usually negative, indicating that the cloudscool the atmosphere in the shortwave radiation.
As shown in Fig. 3, the CNTL reproduced theSWCF at the TOA in the high latitudes but overesti-mated the SWCF by as large as 50 W m−2 in the trop-ical and subtropical regions (left in Fig. 3). However,the EXPT largely removed the negative bias in theSWCF in the tropics but underestimated the SWCF inthe mid-high latitudes. With the insignificant changein total cloud amount, the result of the SWCF at the
NO. 4 LI ET AL. 535
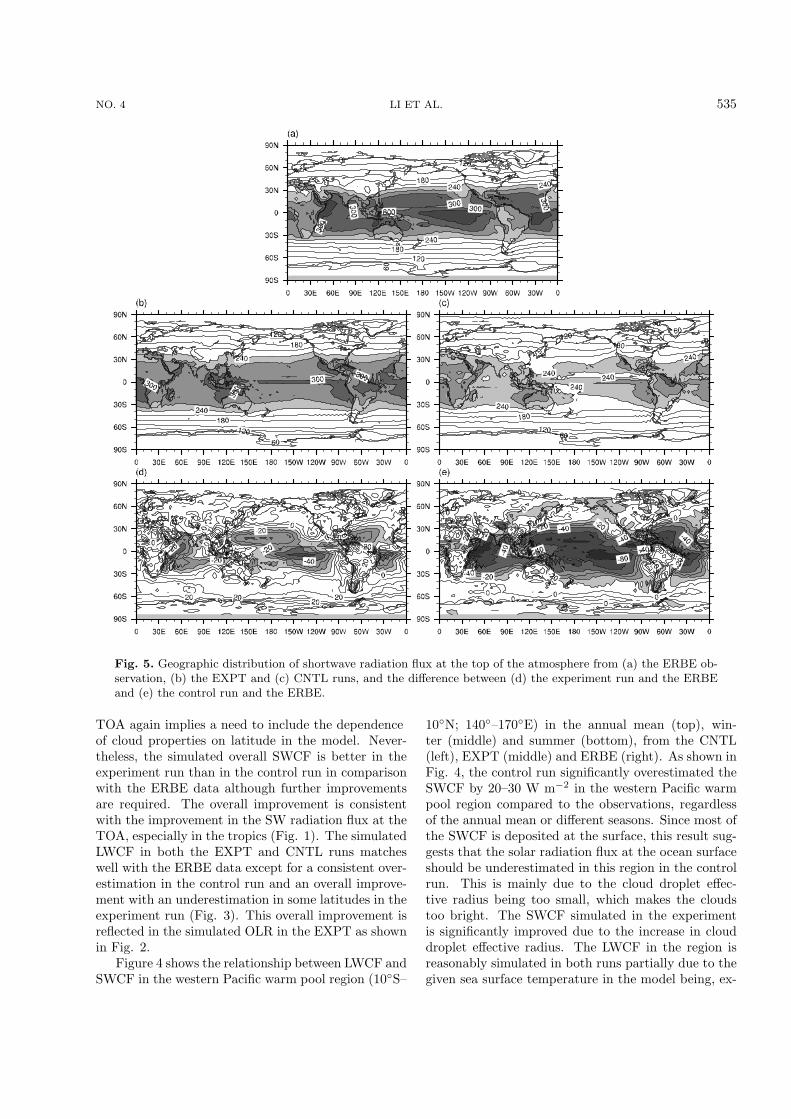
Fig. 5. Geographic distribution of shortwave radiation flux at the top of the atmosphere from (a) the ERBE ob-servation, (b) the EXPT and (c) CNTL runs, and the difference between (d) the experiment run and the ERBEand (e) the control run and the ERBE.
TOA again implies a need to include the dependenceof cloud properties on latitude in the model. Never-theless, the simulated overall SWCF is better in theexperiment run than in the control run in comparisonwith the ERBE data although further improvementsare required. The overall improvement is consistentwith the improvement in the SW radiation flux at theTOA, especially in the tropics (Fig. 1). The simulatedLWCF in both the EXPT and CNTL runs matcheswell with the ERBE data except for a consistent over-estimation in the control run and an overall improve-ment with an underestimation in some latitudes in theexperiment run (Fig. 3). This overall improvement isreflected in the simulated OLR in the EXPT as shownin Fig. 2.
Figure 4 shows the relationship between LWCF andSWCF in the western Pacific warm pool region (10◦S–
10◦N; 140◦–170◦E) in the annual mean (top), win-ter (middle) and summer (bottom), from the CNTL(left), EXPT (middle) and ERBE (right). As shown inFig. 4, the control run significantly overestimated theSWCF by 20–30 W m−2 in the western Pacific warmpool region compared to the observations, regardlessof the annual mean or different seasons. Since most ofthe SWCF is deposited at the surface, this result sug-gests that the solar radiation flux at the ocean surfaceshould be underestimated in this region in the controlrun. This is mainly due to the cloud droplet effec-tive radius being too small, which makes the cloudstoo bright. The SWCF simulated in the experimentis significantly improved due to the increase in clouddroplet effective radius. The LWCF in the region isreasonably simulated in both runs partially due to thegiven sea surface temperature in the model being, ex-
536 SENSITIVITY OF GAMIL SIMULATIONS TO CDER AND LWP VOL. 25
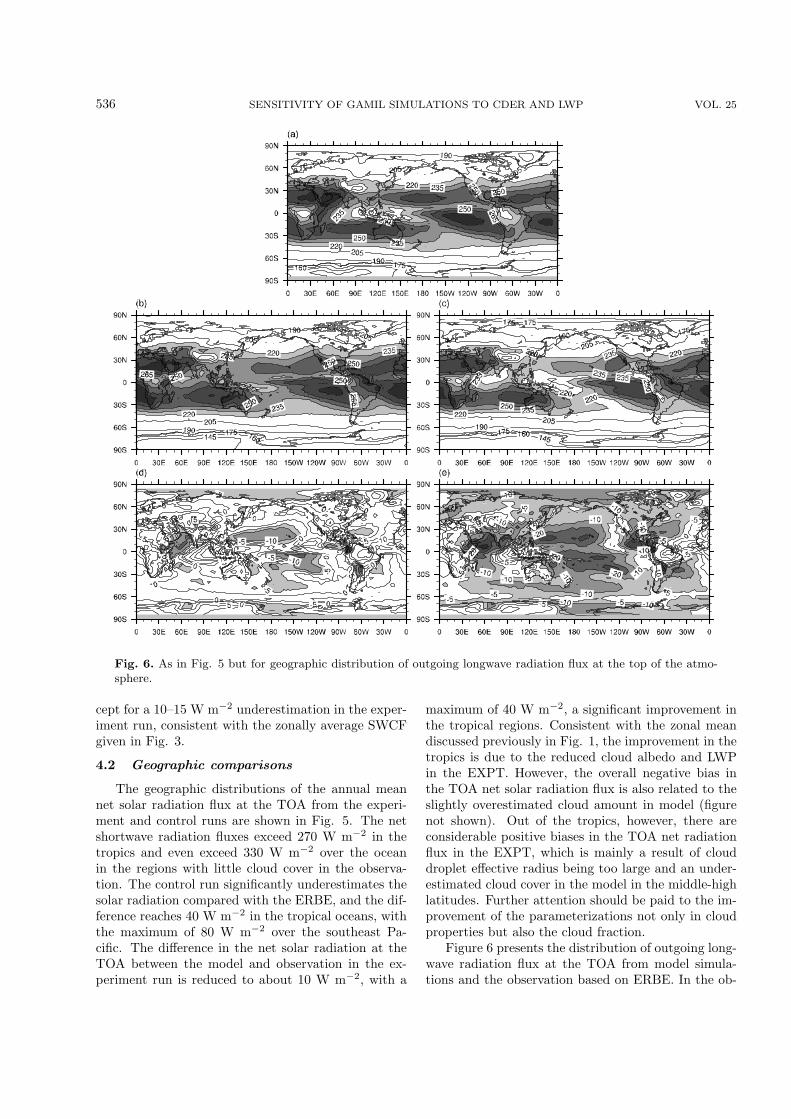
Fig. 6. As in Fig. 5 but for geographic distribution of outgoing longwave radiation flux at the top of the atmo-sphere.
cept for a 10–15 W m−2 underestimation in the exper-iment run, consistent with the zonally average SWCFgiven in Fig. 3.
4.2 Geographic comparisons
The geographic distributions of the annual meannet solar radiation flux at the TOA from the experi-ment and control runs are shown in Fig. 5. The netshortwave radiation fluxes exceed 270 W m−2 in thetropics and even exceed 330 W m−2 over the oceanin the regions with little cloud cover in the observa-tion. The control run significantly underestimates thesolar radiation compared with the ERBE, and the dif-ference reaches 40 W m−2 in the tropical oceans, withthe maximum of 80 W m−2 over the southeast Pa-cific. The difference in the net solar radiation at theTOA between the model and observation in the ex-periment run is reduced to about 10 W m−2, with a
maximum of 40 W m−2, a significant improvement inthe tropical regions. Consistent with the zonal meandiscussed previously in Fig. 1, the improvement in thetropics is due to the reduced cloud albedo and LWPin the EXPT. However, the overall negative bias inthe TOA net solar radiation flux is also related to theslightly overestimated cloud amount in model (figurenot shown). Out of the tropics, however, there areconsiderable positive biases in the TOA net radiationflux in the EXPT, which is mainly a result of clouddroplet effective radius being too large and an under-estimated cloud cover in the model in the middle-highlatitudes. Further attention should be paid to the im-provement of the parameterizations not only in cloudproperties but also the cloud fraction.
Figure 6 presents the distribution of outgoing long-wave radiation flux at the TOA from model simula-tions and the observation based on ERBE. In the ob-
NO. 4 LI ET AL. 537
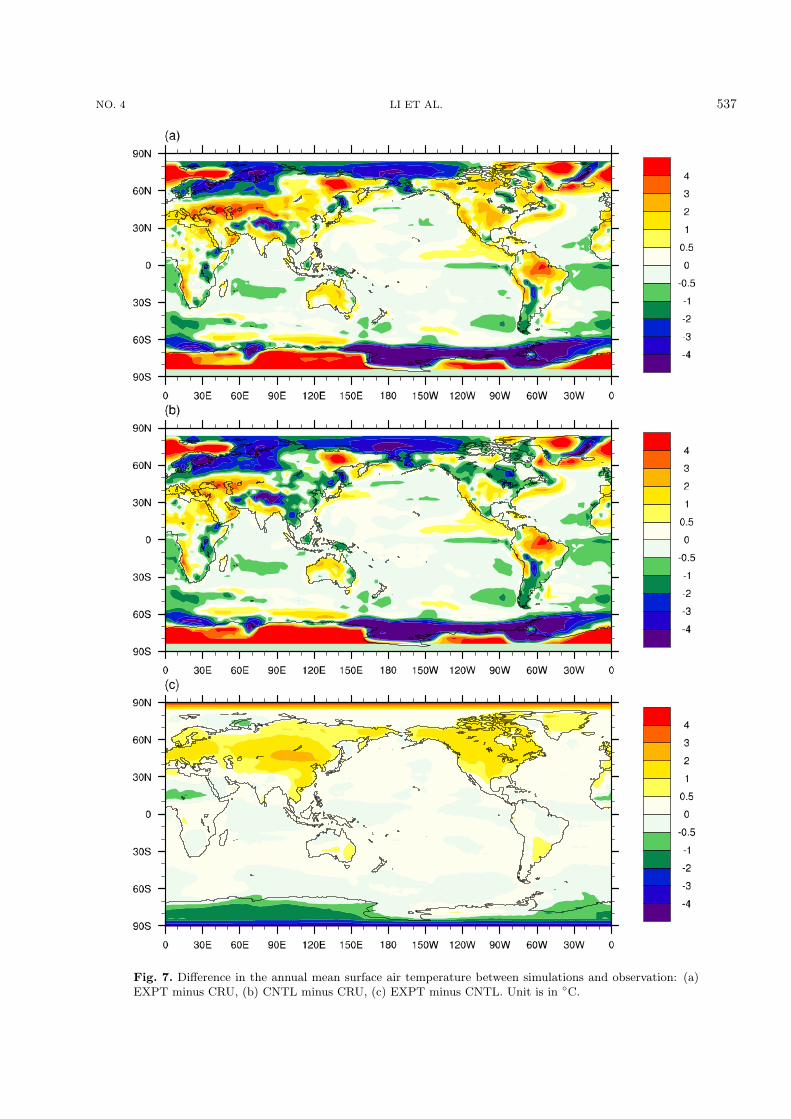
Fig. 7. Difference in the annual mean surface air temperature between simulations and observation: (a)EXPT minus CRU, (b) CNTL minus CRU, (c) EXPT minus CNTL. Unit is in ◦C.
538 SENSITIVITY OF GAMIL SIMULATIONS TO CDER AND LWP VOL. 25
servation, there are several areas with large OLR inthe subtropics, especially over the regions with a lackof deep convective clouds, and there is a rapid pole-ward decrease from the subtropical region. The modelcaptured these features reasonably well except for anoverall negative bias in the control run and some posi-tive and negative biases in several regions in the exper-iment run. Although an overall negative bias exists,especially in the tropical and subtropical regions, thereare positive biases in northern South America, westernMaritime continent region, the eastern tropical IndianOcean, and western South Africa in the control run.The negative bias is largely reduced, while the positivebias in the CNTL is enlarged in the EXPT, leavinga positive bias in the tropics in the zonally averagedOLR as seen in Fig. 2. Overall, the simulated OLR ge-ographic distribution is substantially improved in theEXPT except for several areas with the positive biasin the tropics.
With the increased net shortwave radiation flux(Table 1), the global mean surface air temperature in-creased by 0.18◦C in the EXPT compared with theCNTL (Fig. 7). The overall cold bias in the CNTLwas replaced by the overall warm bias in the EXPT.The large-scale warming around 0.5◦C to 2◦C in theexperiment run compared to the control run occursover most of Eurasia and North America. The maxi-mum warm bias exceeding 2◦C occurs over China andMongolia. The model has a large bias in high latitudes,implying a need for improving the thermodynamic sea-ice model and the land surface processes over the highland in the Antarctic. A caveat, however, may existhere because the observations may have problems aswell in those regions. Therefore, interpretation of coldand warm biases over the high latitudes needs to bedone with caution in the simulations.
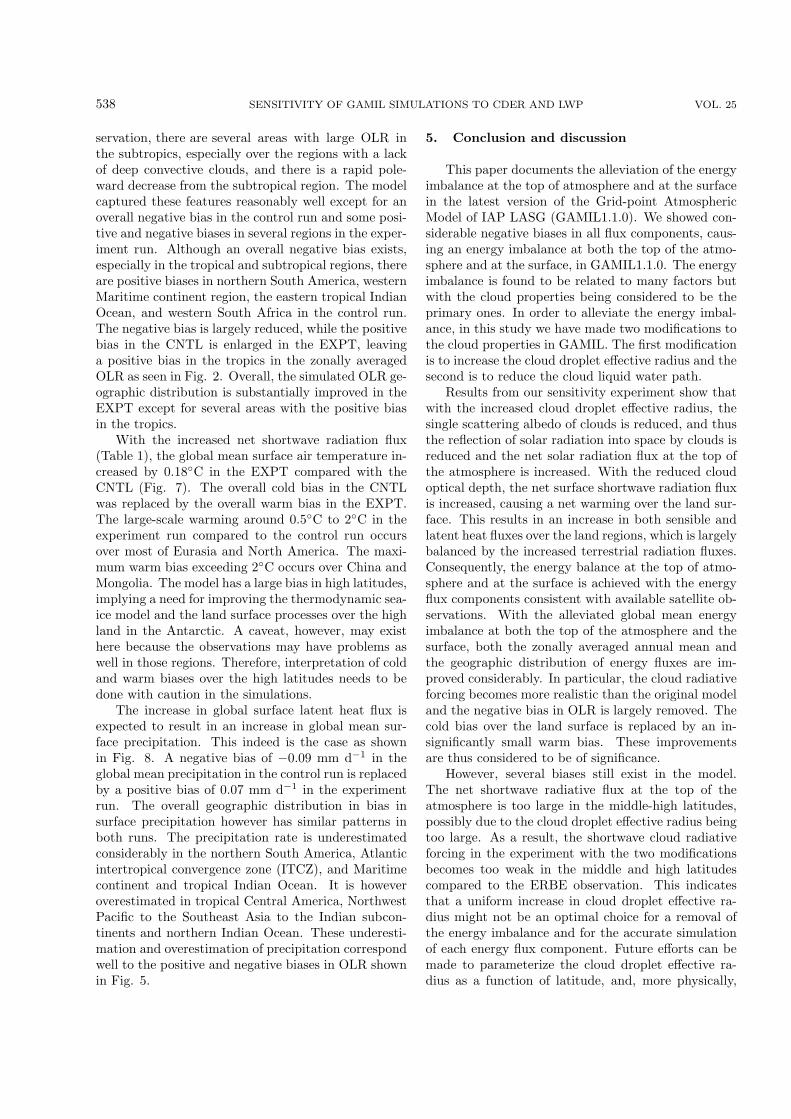
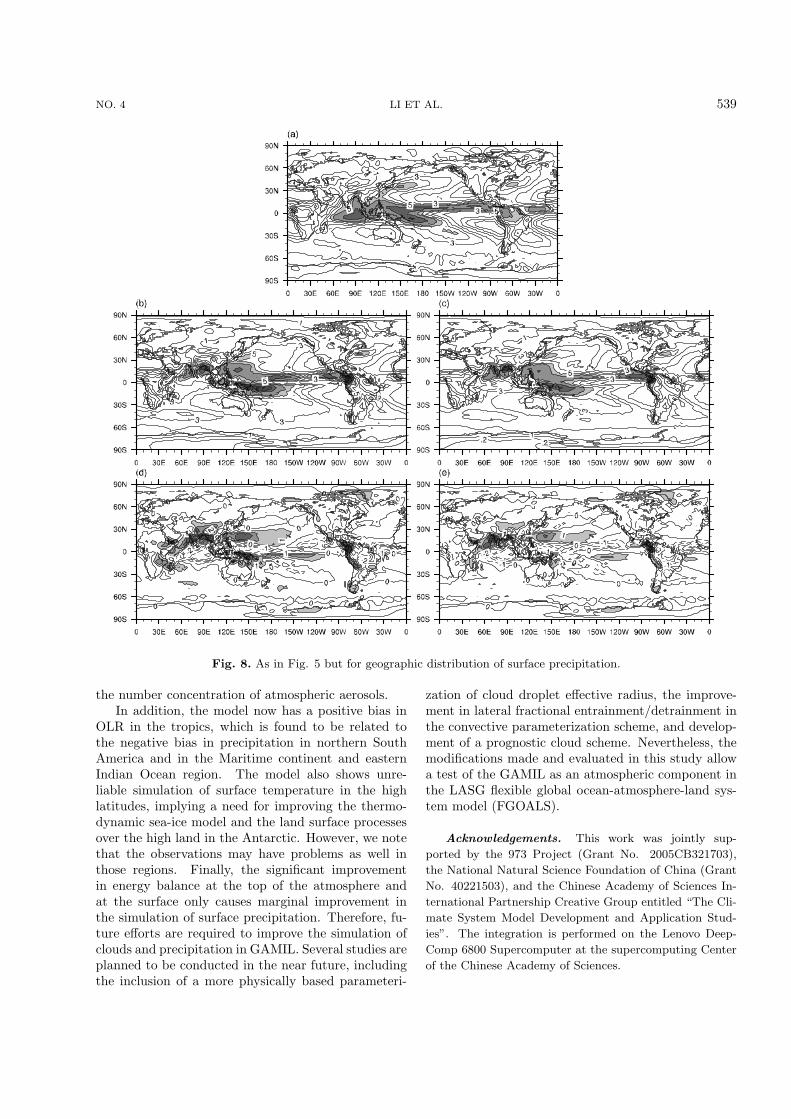
The increase in global surface latent heat flux isexpected to result in an increase in global mean sur-face precipitation. This indeed is the case as shownin Fig. 8. A negative bias of −0.09 mm d−1 in theglobal mean precipitation in the control run is replacedby a positive bias of 0.07 mm d−1 in the experimentrun. The overall geographic distribution in bias insurface precipitation however has similar patterns inboth runs. The precipitation rate is underestimatedconsiderably in the northern South America, Atlanticintertropical convergence zone (ITCZ), and Maritimecontinent and tropical Indian Ocean. It is howeveroverestimated in tropical Central America, NorthwestPacific to the Southeast Asia to the Indian subcon-tinents and northern Indian Ocean. These underesti-mation and overestimation of precipitation correspondwell to the positive and negative biases in OLR shownin Fig. 5.
5. Conclusion and discussion
This paper documents the alleviation of the energyimbalance at the top of atmosphere and at the surfacein the latest version of the Grid-point AtmosphericModel of IAP LASG (GAMIL1.1.0). We showed con-siderable negative biases in all flux components, caus-ing an energy imbalance at both the top of the atmo-sphere and at the surface, in GAMIL1.1.0. The energyimbalance is found to be related to many factors butwith the cloud properties being considered to be theprimary ones. In order to alleviate the energy imbal-ance, in this study we have made two modifications tothe cloud properties in GAMIL. The first modificationis to increase the cloud droplet effective radius and thesecond is to reduce the cloud liquid water path.
Results from our sensitivity experiment show thatwith the increased cloud droplet effective radius, thesingle scattering albedo of clouds is reduced, and thusthe reflection of solar radiation into space by clouds isreduced and the net solar radiation flux at the top ofthe atmosphere is increased. With the reduced cloudoptical depth, the net surface shortwave radiation fluxis increased, causing a net warming over the land sur-face. This results in an increase in both sensible andlatent heat fluxes over the land regions, which is largelybalanced by the increased terrestrial radiation fluxes.Consequently, the energy balance at the top of atmo-sphere and at the surface is achieved with the energyflux components consistent with available satellite ob-servations. With the alleviated global mean energyimbalance at both the top of the atmosphere and thesurface, both the zonally averaged annual mean andthe geographic distribution of energy fluxes are im-proved considerably. In particular, the cloud radiativeforcing becomes more realistic than the original modeland the negative bias in OLR is largely removed. Thecold bias over the land surface is replaced by an in-significantly small warm bias. These improvementsare thus considered to be of significance.
However, several biases still exist in the model.The net shortwave radiative flux at the top of theatmosphere is too large in the middle-high latitudes,possibly due to the cloud droplet effective radius beingtoo large. As a result, the shortwave cloud radiativeforcing in the experiment with the two modificationsbecomes too weak in the middle and high latitudescompared to the ERBE observation. This indicatesthat a uniform increase in cloud droplet effective ra-dius might not be an optimal choice for a removal ofthe energy imbalance and for the accurate simulationof each energy flux component. Future efforts can bemade to parameterize the cloud droplet effective ra-dius as a function of latitude, and, more physically,
NO. 4 LI ET AL. 539
Fig. 8. As in Fig. 5 but for geographic distribution of surface precipitation.
the number concentration of atmospheric aerosols.In addition, the model now has a positive bias in
OLR in the tropics, which is found to be related tothe negative bias in precipitation in northern SouthAmerica and in the Maritime continent and easternIndian Ocean region. The model also shows unre-liable simulation of surface temperature in the highlatitudes, implying a need for improving the thermo-dynamic sea-ice model and the land surface processesover the high land in the Antarctic. However, we notethat the observations may have problems as well inthose regions. Finally, the significant improvementin energy balance at the top of the atmosphere andat the surface only causes marginal improvement inthe simulation of surface precipitation. Therefore, fu-ture efforts are required to improve the simulation ofclouds and precipitation in GAMIL. Several studies areplanned to be conducted in the near future, includingthe inclusion of a more physically based parameteri-
zation of cloud droplet effective radius, the improve-ment in lateral fractional entrainment/detrainment inthe convective parameterization scheme, and develop-ment of a prognostic cloud scheme. Nevertheless, themodifications made and evaluated in this study allowa test of the GAMIL as an atmospheric component inthe LASG flexible global ocean-atmosphere-land sys-tem model (FGOALS).
Acknowledgements. This work was jointly sup-
ported by the 973 Project (Grant No. 2005CB321703),
the National Natural Science Foundation of China (Grant
No. 40221503), and the Chinese Academy of Sciences In-
ternational Partnership Creative Group entitled “The Cli-
mate System Model Development and Application Stud-
ies”. The integration is performed on the Lenovo Deep-
Comp 6800 Supercomputer at the supercomputing Center
of the Chinese Academy of Sciences.
540 SENSITIVITY OF GAMIL SIMULATIONS TO CDER AND LWP VOL. 25
REFERENCES
Bower, K. N., and T. W. Choularton, 1992: A parame-terization of the effective radius of ice free clouds foruse in global climate models. Atmospheric Research,27, 305–339.
Collins, W. D., and Coauthors, 2003:Description of theNCAR Community Atmosphere Model (CAM2). Na-tional Center for Atmospheric Research, Boulder,CO., 171pp.
Dandin, P., C. Pontikis, and E. Hicks, 1997: Sensitivityof a GCM to changes in the droplet effective radiusparameterization. Geophys. Res. Lett., 24, 437–440.
Ebert, E. E., and J. A. Curry, 1992: A parameterizationof ice cloud optical properties for climate models. J.Geophys. Res., 97, 3831–3836.
Hack, J. J., 1998: Sensitivity of the simulated climateto a diagnostic formulation for cloud liquid water. J.Climate, 11, 1497–1515.
Han, Q. Y., W. B. Rossow, and A. A. Lacis, 1994: Near-global survey of effective droplet radii in liquid waterclouds using ISCCP data. J. Climate, 7, 465–497.
Jones, P. D., M. New, D. E. Parker, S. Martin, and I.G. Rigor, 1999: Surface air temperature and its vari-ations over the last 150 years. Rev. Geophys., 37,173–199
Kiehl, J. T., 1994: Sensitivity of a GCM climate simu-lation to differences in continental versus maritimecloud drop size. J. Geophys. Res., 99, 23107–23115.
Kiehl, J. T., and V. Ramanathan, 1990: Comparison ofcloud forcing derived from the earth radiation budgetexperiment with that simulated by the NCAR com-munity climate model. J. Geophys. Res., 95, 11679–11698.
Kiehl, J. T., and K. E. Trenberth, 1997: Earth’s an-nual global mean energy budget. Bull. Amer. Meteor.Soc., 78, 197–208.
Kiehl, J. T., J. J. Hack, and B. P. Briegleb, 1994:The simulated earth radiation budget of the NCARCCM2 and comparisons with the Earth RadiationBudget Experiment (ERBE). J. Geophys. Res., 99,20815–20827.
Kiehl, J. T., J. J. Hack, and J. W. Hurrell, 1998: Theenergy budget of the NCAR Community Climate
Model: CCM3. J. Climate, 11, 1151–1178.Li, L. J., B. Wang,, Y. Q. Wang, and H. Wan, 2007:
Improvements in climate simulation with modifica-tions to the Tiedtke Convective Parameterization inthe Grid-point Atmospheric Model of IAP LASG(GAMIL). Adv. Atmos. Sci., 24(2), 323–335, doi:10.1007/s00376-007-0323-3.
Li, J. L. F., M. Kohler, J. D. Farrara, and C. R. Me-choso, 2002: The impact of stratocumulus cloud ra-diative properties on surface heat fluxes simulatedwith a general circulation model. Mon. Wea. Rev.,130, 1433–1441.
Phillips, T. J., 1996: Documentation of the AMIP modelson the World Wide Web. Bull. Amer. Meteor. Soc.,77, 1191–1196.
Sengupta, M., E. E. Clothiaux, T. P. Ackerman, S. Kato,and Q. Min, 2003: Importance of accurate liquid.water path for estimation of solar radiation in warmboundary layer clouds: An observational study. J.Climate, 16, 2997–3009.
Slingo, A., 1989: A GCM parameterization for the short-wave radiative properties of water clouds. J. Atmos.Sci., 46, 1419–1427.
Slingo, A., 1990: Sensitivity of the earth’s radiation bud-get to changes in low clouds. Nature, 343, 49–51.
Tiedtke, M., 1989: A comprehensive mass flux schemefor cumulus parameterization in large-scale models.Mon. Wea. Rev., 117, 779–1800.
Xie, P., and P. A. Arkin, 1997: Global precipitation: A17-year monthly analysis based on gauge observa-tion, satellite estimates, and numerical model out-puts. Bull. Amer. Meteor. Soc., 78, 2539–2558.
Young, G. S., D. V. Ledvina, and C. W. Fairall, 1992: In-fluence of precipitating convection on the surface en-ergy budget observed during a tropical ocean globalatmosphere pilot cruise in the Tropical Western Pa-cific Ocean. J. Geophys. Res., 97(C6), 9595–9603.
Wang, B., and Coauthors,2004: Design of a new dy-namical core for global atmospheric models based onsome efficient numerical methods. Science in China(A), 47, 4–21.
Wang, Y., L. Zhou, and K. P. Hamilton, 2007: Effect ofconvective entrainment/detrainment on simulationof tropical precipitation diurnal cycle. Mon. Wea.Rev., 135, 367–385.
Related Documents