JOURNAL OF GEOPHYSICAL RESEARCH, VOL. 101, NO. D3, PAGES 7393-7408, MARCH 20, 1996 Sensitivity of a general circulation model to global changes in leaf area index Thomas N. Chase and Roger A. Pielke Department of Atmospheric Science, Colorado State University, Fort Collins Timothy G. F. Kittel Climate System Modeling Program, University Corporation for Atmospheric Research, Boulder, Colorado Ramakrishna Nemanj and Steven W. Running School of Forestry, University of Montana, Missoula Abstract. Methods have recently become available for estimating the amount of leaf area at the surface of the Earth using satellite data. Also available are modeled estimates of what global leaf area patterns would look like should the vegetation be in equilibrium with current local climatic and soil conditions. The differences between the actual vegetation distribution and the potential vegetation distribution may reflect the impact of human activity on the Earth’s surface. To examine model sensitivity to changes in leaf area index (LAI), global distributions of maximum LAI were used as surface boundary conditions in the National Center for Atmospheric Research community climate model (NCAR CCM2) coupled with the biosphere atmosphere transfer scheme (BATS). Results from 10-year ensemble averages for the months of January and July indicate that the largest effects of the decreased LAd in the actual LAd simulation occur in the northern hemisphere winter at high latitudes despite the fact that direct LAI forcing is negligible in these regions at this time of year. This is possibly a result of LAI forcing in the tropics which has long- ranging effects in the winter of both hemispheres. An assessment of the Asian monsoon region for the month of July shows decreased latent heat flux from the surface, increased surface temperature, and decreased precipitation with the actual LAI distribution. While the statistical significance of the results has not been unambiguously established in these simulations, we suspect that an effect on modeled general circulation dynamics has occurred due to changes of maximum LAI suggesting that further attention needs to be paid to the accurate designation of vegetation parameters. The incorporation of concomitant changes in albedo, vegetation fractional coverage, and roughness length is suggested for further research. 1. Introduction It is generally agreed that the extent and type of vegetation covering the earth has changed dramatically in the past due to natural causes [e.g., Street-Perrort et at., 1990; Overpeck, 1993]. That thousands of years of human activity has had an impact on the surface character of the Earth is also undeniable [Ot terman, 1977]. However, the extent and magnitude of these changes and their relation to changing climate is much more uncertain. While it is obvious that human intervention and changes in past climates have had impacts on vegetation [e.g., Houghton, 1994; Street-Perrort et at., 1990; Gornitz, 1987], there is also observational evidence that vegetation can have an impact on climate [e.g., Pielou, 1991]. Meher-Homji [1991], in a review of the impacts of deforestation on local precipitation. found that surface temperature fluctuates more in nonforested regions as opposed to forested areas. He also found evidence that de creased precipitation accompanies decreased forest cover. Copyright 1996 by the American Geophysical Union. Paper number 95JD02417. o 148-0227/96/95JDO2417$Q5O0 However, the broader impact of vegetation on the atmosphere is inherently difficult to observe due to the time and space scales involved and the lack of adequate analogs for compar ison. This leaves the topic in a state of contention and opens the door for experiments with numerical models. Modelers of climate have become increasingly aware of the importance of the specification of the lower boundary to model simulations. Reviews of these experiments [e.g., Mintz, 1984; Garratt, 1992; Rowntree, 1988] demonstrate that surface desig nation in a numerical model can have quite large and signifi cant impacts on modeled climate. In numerical models the complicated physical mechanisms of vegetation and its interaction with the atmosphere must be simplified to a few parameters. Many experiments designed to test the impact of vegetation change on climate have described these impacts simply as a change in surface albedo [e.g., Char ney, 1975; Sagan et at.. 1979; Potter et at., 1981; Henderson- Sellers and Gomirz, 1984] implicitly assuming that the largest impact found in vegetation would be its effect on reflectivity. Similar experiments have been performed to ascertain the ef fect of a change in roughness length due to deforestation [e.g., Sud and Smith, 1985; Sud et at., 1988]. More complicated land surface models are now common 7393

Welcome message from author
This document is posted to help you gain knowledge. Please leave a comment to let me know what you think about it! Share it to your friends and learn new things together.
Transcript

JOURNAL OF GEOPHYSICAL RESEARCH, VOL. 101, NO. D3, PAGES 7393-7408, MARCH 20, 1996
Sensitivity of a general circulation model to global changesin leaf area index
Thomas N. Chase and Roger A. PielkeDepartment of Atmospheric Science, Colorado State University, Fort Collins
Timothy G. F. KittelClimate System Modeling Program, University Corporation for Atmospheric Research, Boulder, Colorado
Ramakrishna Nemanj and Steven W. RunningSchool of Forestry, University of Montana, Missoula
Abstract. Methods have recently become available for estimating the amount of leaf areaat the surface of the Earth using satellite data. Also available are modeled estimates ofwhat global leaf area patterns would look like should the vegetation be in equilibrium withcurrent local climatic and soil conditions. The differences between the actual vegetationdistribution and the potential vegetation distribution may reflect the impact of humanactivity on the Earth’s surface. To examine model sensitivity to changes in leaf area index(LAI), global distributions of maximum LAI were used as surface boundary conditions inthe National Center for Atmospheric Research community climate model (NCAR CCM2)coupled with the biosphere atmosphere transfer scheme (BATS). Results from 10-yearensemble averages for the months of January and July indicate that the largest effects ofthe decreased LAd in the actual LAd simulation occur in the northern hemisphere winterat high latitudes despite the fact that direct LAI forcing is negligible in these regions atthis time of year. This is possibly a result of LAI forcing in the tropics which has long-ranging effects in the winter of both hemispheres. An assessment of the Asian monsoonregion for the month of July shows decreased latent heat flux from the surface, increasedsurface temperature, and decreased precipitation with the actual LAI distribution. Whilethe statistical significance of the results has not been unambiguously established in thesesimulations, we suspect that an effect on modeled general circulation dynamics hasoccurred due to changes of maximum LAI suggesting that further attention needs to bepaid to the accurate designation of vegetation parameters. The incorporation ofconcomitant changes in albedo, vegetation fractional coverage, and roughness length issuggested for further research.
1. Introduction
It is generally agreed that the extent and type of vegetationcovering the earth has changed dramatically in the past due tonatural causes [e.g., Street-Perrort et at., 1990; Overpeck, 1993].That thousands of years of human activity has had an impacton the surface character of the Earth is also undeniable [Otterman, 1977]. However, the extent and magnitude of thesechanges and their relation to changing climate is much moreuncertain.
While it is obvious that human intervention and changes inpast climates have had impacts on vegetation [e.g., Houghton,1994; Street-Perrort et at., 1990; Gornitz, 1987], there is alsoobservational evidence that vegetation can have an impact onclimate [e.g., Pielou, 1991]. Meher-Homji [1991], in a review ofthe impacts of deforestation on local precipitation. found thatsurface temperature fluctuates more in nonforested regions asopposed to forested areas. He also found evidence that decreased precipitation accompanies decreased forest cover.
Copyright 1996 by the American Geophysical Union.
Paper number 95JD02417.o 148-0227/96/95JDO2417$Q5O0
However, the broader impact of vegetation on the atmosphereis inherently difficult to observe due to the time and spacescales involved and the lack of adequate analogs for comparison. This leaves the topic in a state of contention and opensthe door for experiments with numerical models.
Modelers of climate have become increasingly aware of theimportance of the specification of the lower boundary to modelsimulations. Reviews of these experiments [e.g., Mintz, 1984;Garratt, 1992; Rowntree, 1988] demonstrate that surface designation in a numerical model can have quite large and significant impacts on modeled climate.
In numerical models the complicated physical mechanismsof vegetation and its interaction with the atmosphere must besimplified to a few parameters. Many experiments designed totest the impact of vegetation change on climate have describedthese impacts simply as a change in surface albedo [e.g., Charney, 1975; Sagan et at.. 1979; Potter et at., 1981; Henderson-Sellers and Gomirz, 1984] implicitly assuming that the largestimpact found in vegetation would be its effect on reflectivity.Similar experiments have been performed to ascertain the effect of a change in roughness length due to deforestation [e.g.,Sud and Smith, 1985; Sud et at., 1988].
More complicated land surface models are now common
7393
7394 CHASE ET AL: GCM SENSITIVITY TO GLOBAL CHANGES IN LAI
with the land surface and vegetation changes described according to a greater number of more interactive parameters inrecognition that the role of vegetation is not limited to theeffect on albedo or roughness of the surface. Attempts to allowvegetation to interact with the atmosphere, to model the effectsof transpiration modulation by the canopy and effects on thesurface water balance, mean that a measure of the amount ofactive biomass in a region must be accounted for. This has ledto the inclusion of a widely used variable, leaf area index(LAI), in the description of the planetary surface. Defined asthe ratio of leaf area to land surface area in a vertical column,LAI is a representation of the density of vegetation at thesurface. The primary role of LAI in these models is in regulating the amount of transpiration from the surface andthereby controlling the partition of surface heat fluxes. Thelarger the leaf area in the column, the more transpiration thatcan occur. LA! also regulates light extinction in the canopy SOthat a larger value implies less light reaching the soil surface.Because stomatal conductance is also a function of light [Denmead and Miller, 1976], LAI directly affects the stomatal conductance of individual leaves as well as the integrated conductance of the canopy.
Studies have been performed in an attempt to unravel theproperties of vegetation and combinations of properties whichare most important in a given situation. For example, in arecent study of statistical-dynamical models of the Earth’s surface, Collins and Avissar [19941, using Fourier amplitude sensitivity testing, found that the distribution of surface heat fluxescould be explained mostly by variations in stomatal conductance and roughness length. LA] was found to be significant tothe sensible heat flux only under circumstances where thesurface is partially vegetated. Using a stand-alone biospheremodel, Henderson-Sellers [1993] found the model to be highlysensitive to roughness length and relatively insensitive to LA!designation.
However, Li andAvissar [1994] found that LA! was the mostimportant variable contributing to errors due to neglectingsubgrid scale land surface variability. Zhang [1994] found thata dense vegetation cover effectively made surface heat fluxesindependent of ground surface conditions, particularly soilmoisture. This was based on a vegetation fraction designation,but presumably high values of IAI should have a similar effect.Bonan et al. [1993], using a fairly complex land surface parameterization, found that subgrid heterogeneity in the LA! fieldwas the primary cause of surface flux calculation errors forboth wet and dry soils. A strong nonlinear relationship between LA! designation and these fluxes was also apparent.Also noted in this experiment were that many of the effects ofincreasing leaf area asymptote relatively quickly. For example,most of the influence of increasing leaf area on light extinctionoccurs at relatively small values of LA! limiting stomatal conductance. However, the area available for energy exchange andwater interception increase linearly with leaf area. Clearly, therole of vegetation density and its proxy, LA], is complex andsomewhat ambiguous in parameterizations of surface processes.
Large-scale vegetation changes, modeled comprehensively,have been shown to have large impacts on modeled climate. Inan experiment of global scale, Bonan et al. [1992], using arelatively complex surface parameterization and an interactiveocean, found that completely removing the high latitude, boreal forests had large effects on the simulated climate. Thesesimulations included changes in other parameters besides LA!,
such as vegetation fraction, and so included direct radiativeforcing due to changes in surface albedo. McGuffie eta!. [19951studied tropical deforestation with a version of the communitclimate model coupled with BATSIE and a slab ocean modelBecause tropical forests were changed to scrub grasslands irthis experiment, albedo and roughness length changes wereincluded in the description of deforestation. Results from thiexperiment showed locally decreased precipitation as a resulof tropical deforestation as well as remote effects in middle anchigh latitudes. Finally, in a study which advances the complexity of the description of surface characteristics to include vegetation structure which interacts dynamically with climateHenderson-Sellers and McGuffie [1995] find evidence thachanges in vegetation due to altered climate feed back into thaclimate and so must be accounted for.
2. Experiment Description V
The experiment described below is fundamentally a continuation of past deforestation and land use change numericaexperiments. In this case we used the NCAR CCM2 generacirculation model coupled with the biosphere atmosphen.transfer scheme (BATS) land surface parameterization. Wcdescribed a change in vegetation globally solely in terms 01
annual maximum leaf area index (LA!) to ascertain mode•sensitivity to this parameter. The control simulation used adistribution of observed maximum LAI derived from remotel’.sensed data as a bottom boundary condition. A second runused a distribution of LA! representing the potential maximunLAI sustainable at a site. We discuss the derivation of thescIAI distributions in more detail in section 4.
The two cases were run for a total of 12 years with the resultfrom years 3 to 12 used for 10-year January and July ensembkaverages. The first two years were ignored as spin-up timeThough the total soil moisture field had not quite equilibratecby the third year, the differences were small and it was felt tcbe more important to have two 10-year samples to compareWe present results from 10-year averaged Januarys and Ju1yas well as regional results from southern Asia in July.
3. Model Description, CCM2 and BATSThe NCAR CCM2 is a primitive equation general circula
tion model in which variables are solved for using the spectra.method. The spectral truncation is triangular allowing 42 wave-numbers in both horizontal dimensions (T42). This corresponds to a grid increment of approximately 2.8° longitude b2.8° latitude (128 by 64 points in the horizontal). There are 18vertical levels in a hybrid sigma coordinate system where sigmalevels are used near the surface and blend into a pressurccoordinate above. The model uses climatological sea surfactemperature data.
The CCM2 includes a diurnal as well as an annual radiatiorcycle [Briegleb, 1992]. Shortwave radiation calculations use adelta Eddington approximation. Clouds interact with radiation. Clouds can form in all tropospheric levels above the first.and cloud fraction is calculated as a function of relative humidity, vertical motion, static stability, and convective precipitation rate.
The parameterization of the planetary boundary layer (PBLin CCM2 accounts for dry convection by adjusting for nonlocaltransport in the boundary layer [Hoitsiag and Boville, 1993].The parameterization calculates the PBL height, diffusion pro-
CHASE ET AL.: GCM SENSITIVITY TO GLOBAL CHANGES IN LAI 7395
files, and turbulent transport. A mass flux moist convectivescheme is included in the model [Hack, 1994]. A detailedoverview of CCM2 can be found in the work of Hack et a!.[1993].
The biosphere atmosphere transfer scheme as coupled tothe NCAR CCM2 (BATS1E) [Dickinson et at., 1993] was usedin these experiments. BATS is a simple land surface parameterization which includes a single vegetation canopy layer andthree soil layers. The BATS parameterization computes heatflux partitioning from vegetation and bare soil surfaces alongwith water budget values and feeds them into the atmosphericportion of the model.
In BATS the Earth’s surface is divided among 18 surfacetypes, and representative values of 18 parameters describingproperties of vegetation such as maximum and minimum stomatal resistance, maximum and minimum leaf area index, andsoil properties are assigned. BATS divides each grid cell into avegetated and nonvegetated fraction. Vegetation fraction varies regularly with season as a function of subsurface soil temperature only. There is no provision for the effect of soil water(or lack thereof) on vegetation cover. The fluxes of heat andmoisture are proportional to the gradient of temperature andvapor pressure between the surface and the first atmosphericlevel. Vegetation fraction is reduced in the presence of snow.
The leaf area index (LA!) calculation is simple and seasonally varying. For each vegetation category a maximum and aminimum value of single-sided LAI is assigned. The actualvalue of LAI used in the model is computed in a mannersimilar to that for vegetation fraction. The value of LAI variesbetween the maximum and minimum LA! designated in a gridcell as a function only of the subsurface soil temperature. Noprovision is made for the effect of soil water availability on thedistribution of LA! effectively limiting seasonal vegetationchanges in the tropics or variations in regions experiencinganomalous precipitation.
In nature, leaf density is related to other vegetation characteristics. For example, larger values of leaf density correspondgenerally with decreased albedo and higher values of roughness length. In the BATS parameterization, altering the valuesof maximum LA! by itself does not affect either surface albedoor roughness length of the vegetation because they are independently specified. However, stomatal resistance is directlyaffected by the designation of LAd. Stomatal resistance is afunction of light in the canopy [e.g., Li and Avissar, 1994] andthe extinction of light through the canopy is a function of LAl.Greater extinction values create an increased resistance totranspiration. Canopy air temperature and vegetation temperature are also functions of LA! in the BATS parameterization.
4. Actual Versus Potential Vegetationand its Representation
A control simulation was performed using a maximum LA!distribution developed by Nemani et at. [this issue] based onnormalized difference vegetation index (NDVI) data retrievedfrom satellite observations. NDVI is the difference betweeninfrared and visible reflectances normalized by their sum. Thisindex has been used to estimate the amount of photosynthetically active material in the canopy [e.g., Sellers et at., 1985;Goward et at., 1986]. It has been found [e.g., Nemani andRunning, 1989] that a relationship exists between NDVI dataand leaf area of the canopy. Nemani et at. [this issue] used 7years of NDVI data to reduce the effects of cloud contamina
tion and annual variability. Separate relationships betweenNDVI and IA1 were used for grasses, needle-leaf trees, andbroadleaf trees. This is an estimate of the maximum vegetationdensity as it actually appears today (Plate la). The experimentwith this LA! distribution is titled actual LA! or actLAI.
In a second simulation a distribution of maximum LAl entitled potential LAI or potLAl was used as a comparison case.Nemani and Running [1989] presented a technique of using asimple ecosystem model to arrive at equilibrium values of leafarea based on inputs from a climatological atmosphere and soiltype. Maximum sustainable transpiration at a site is calculatedthrough an iterative technique where transpiration, soil waterholding capacity, and precipitation must come into balance.When this balance is achieved, maximum transpiration isreached. Because total leaf area regulates transpiration, maximum LA! is directly related to this total transpiration. Theyran the ecosystem model using climatological information on a0.50 latitude/longitude grid to obtain an estimated global distribution of maximum sustainable LA! which represents thepotential leaf density a site could support assuming equilibrium with current climate (Plate lb). This estimate of potentialLAI does not account for effects of nutrient limitation andnatural disturbances (such as forest fires) on vegetation density. While these assumptions can lead to LAl errors in someenvironments, this method provides a good first-order estimateof potential LA! distribution under current climate. Nemani etat. [this issue] discuss the derivation of these maximum LA!distributions in more detail.
The difference between actual and potential LA] distributions can be taken as a direct estimate of one aspect of humanimpact on vegetation. It should be noted that the observationof surface characteristics from satellites is imprecise [e.g., Ga-mon et at., 1995]. Imperfect knowledge of soil type, soil moisture, and vegetation type globally can introduce errors intoLAJ data sets. Modeled distributions of potential LAd such asused in this study are subject to the assumptions inherent in themodel used and data sets obtained by varying methods canyield contradictory results (see, for example, the discussion byNeilson [1993]). Some differences between these data setscould be due to differences in method used in deriving them.One is satellite observed (actual LAI) and the other is calculated (potential L.A1) through a water balance model. We lookat our experiment as a plausible perturbation in global leafarea in magnitude and distribution designed to test the sensitivity of the model to this parameter.
These maximum LA! distributions were averaged to theCCM2 grid using a five nearest-neighbor aggregation (a 2.5°square area, Plate 1). Because model values of LAI vary withground temperature between minimum and maximum values,LA! values were generally not at their maximum valuesthroughout the simulation. Differences between the two distributions varied seasonally and tended toward zero in the winterhemisphere. Maps of the differences between the two distributions averaged over the 10 years for January and July areshown in Plate 2. Global land averages in January showed anaverage LA! of 1.5 for the potLAl case decreasing about 7% to1.4 in the actLAI case. In July, averaged LAI decreased 16%from 1.9 to 1.6 between the two cases.
While these are fairly small LAI differences when averagedglobally, actual differences were concentrated in certain areas.In January, LA! differences were concentrated below 20°Nwith the largest differences in Malaysia, southern Asia, southeastern Africa, and northern South America (Plate 2a). In July,

7396 CHASE ET AL: GCM SENSITIVITY TO GLOBAL CHANGES IN LA!
Plate 2. Global 10-year averaged distributions of LA! differences (actLAI-potLAJ) for (a) January and (b)July. Negative values indicate a decreased LA! in the actual LAI case.
DoDi R2•4•6e
-
‘-I.II... ._.
F
OoI!12s4I56
Plate 1. Maps of single-sided leaf area index (LA!), (a) actual LA!, and (b) potential LA!. LA! values runfrom 0 to 6.

CHASE ET AL.: GCM SENSITIVITY TO GLOBAL CHANGES IN Lz\I 7397
differences are noticeable in the eastern United States, westernEurope, Japan, Malaysia, southwestern Africa, and northernSouth America (Figure 2b). Most of these were strongly negative (actLAI-potLAI), indicating a decrease in leaf density inthese regions from the potential to actual distributions.
It is expected that the maximum direct forcing due to achange in LA! will be in the summer hemisphere and, in anannually averaged sense, in the tropics. In the tropics, LA!differences between the two simulations remained relativelyhigh and constant throughout the year because of a lack of soilmoisture dependency in the LA! calculations. Much of theatmospheric heating in the tropics is associated with land-masses in Africa, South America, and Indonesia [e.g., Ramage,1968] and is where direct vegetation forcing would be expectedto have the largest influence. The magnitude and distributionof heating in this region is a powerful mechanism in generatingtropical circulations both in a symmetric sense and for thegeneration of synoptic-scale waves [e.g., Gill, 1980; Webster,1983; Meehl, 1993; Hoskins and Karoly, 1981]. Both averagedheating and changes longitudinally in the distribution of tropical heating are associated with large changes in the extratropical latitudes. Rasmussen and Mo [1993j emphasize the regionalcharacter of anomalies due to the 1986—1989 El Niño/Southern Oscillation event and show that the strongest differences in this event were not in alterations in the zonally averaged circulations but in longitudinal deviations from theaverage which again affected regions well displaced from thetropics. As previously mentioned, McGuffie et al. [1995] foundevidence of middle- and high-latitude effects due to tropicaldeforestation. It may be possible that LA! distribution changesalone have a similar effect.
Because LA! is the only forcing variable in the experimentdescribed in our paper, the partitioning between latent andsensible heat fluxes from the surface due to LA! changes is theprimary issue. The question arises as to whether the change inLA! distribution is capable of forcing large enough differencesin latent versus sensible heating to fundamentally affect circulations in the summer hemisphere directly, the winter hemisphere indirectly, and the tropics either in magnitude or indistribution.
5. Global AveragesThe change in LA! distribution from the actLAI case to the
potLA! case had little effect in the global average surfaceclimate. In the actual LA! case there was a small planetarysurface air temperature warming of less than 0.1 K in bothseasons relative to the potLAl run. Skin temperatures andtemperatures 1.5 m above ground level increased by approximately 0.2 K over land in July in the actLAI case.
6. Large-Scale Regional DifferencesThe largest differences between actual and potential LA!
cases in January averages were in the high northern hemisphere despite the fact that LA! differences were nonexistentin these regions at this time of year. Skin temperatures and airtemperatures up to the midtroposphere show large differencesabove 20°N. The January 1.5-rn air temperatures (Figure 1)increased over all of the continental United States in the act-LA! case relative to the potLAf case. with a maximum warming of more than 5 K. A cooling of similar magnitude occurredin most of eastern Canada. A warming of more than 6 K
occurred in the high northern latitudes of Europe and Asia.accompanied by a cooling of several degrees below approximately 55°N. The southern hemisphere was relatively unaffected in the near-surface temperature field in January; however, smaller magnitude temperature differences between thecases are evident in high southern latitudes in July. Near-surface air temperature differences followed continental outlines presumably because of the constant sea surface temperatures used as boundary conditions in these simulations.
The pattern of January 500-mbar height differences filteredto include wavenumbers 1—6 only (Figure 2) reproduced theJanuary temperature difference field, indicating that surfacetemperature differences were due to altered Iongwave activitybetween the two cases. The similarity in pattern of 500-rnbarheight differences and 1.5-rn temperature differences also reflects that temperature differences between the two simulations were present vertically through much of the troposphere.
7. Zonal Averages!n January the area of peak zonally averaged precipitation
(Figure 3) shifted northward slightly in the actLAl case relativeto the potLA! case. The maximum value in the precipitationpeak was also smaller in the actLA! case by nearly 1.0 mm/d.There was a small decrease in precipitation along the northernhemisphere storm tracks in the actLA! case, while precipitation increased in most of the northern hemisphere subtropics.In July there were few differences between the two cases forzonally averaged total precipitation.
There was a small decrease in the magnitude of the northernhemisphere 200-mbar jet core in January of nearly 2%, whilethe southern hemisphere jet increased slightly in magnitude inthe actLA! case. The northern hemisphere jet in January alsobroadened in the actLAI case on the northern side of the jetcore. For example, the 20 m/s contour at 200 mbar is approximately 10 latitude farther north in the actLA! case as compared to the potLAl case, while the 25 rn/s contour is approximately 3° farther north. Horizontal shear associated with thejet thus decreased in the ictLAI case.
The July 200-mbar jet had a smaller magnitude in bothhemispheres in the actLAI case though the changes weresmall. Velocity contours around the northern hemisphere 200-mbar jet remain approximately 2° farther south in the actLA!case, indicating that the jet contracted from the pole. This isthe opposite of the effect seen in January in the northernhemisphere.
The zonally averaged vertical motion field (Figures 4a—4c)showed some changes between cases in the January tropics andlarger differences at higher latitudes. Peak rising motion atabout 5°S is less deep in the actLAI case than in the potLAlcase, with the 0.03 Pa/s contour reaching to approximately 300mbar in the potLA! case, while in the actLA! case, this contourreached only 400 mbar. The peak in upward motion was alsonearly 3° (1 grid interval) farther equatorward in the actLAlcase as compared to the potLA! case. This shift in verticalmotion was reflected in the northward movement in the precipitation maximum (Figure 2). The maximum vertical velocitynear 10°S is decreased by about 4% in the actLAI case. Also ofinterest is a large (18%) decrease in maximum lower tropospheric upward motion from 50° to 60°N in the actLAI case.Upward motion was also more shallow in this region reaching525 mbar in the actLA! case as opposed to 400 mbar in thepotLAl case. In July, tropical maximum vertical motion in the

7398 CHASE ET AL.: GCM SENSITIVITY TO GLOBAL CHANGES IN [Al
Figure 1. Ten-year averaged differences in 1.5-rn air(b) July. Contours by 0.5 K.
actLAI case was slightly stronger than in the potLAl case butshallower and shifted more equatorward (Figure 4f).
Zonally averaged meridional winds (not shown) showed aslightly decreased magnitude (6%) in the actLAI case for January in the Hadley cell upper branch maximum wind. Therewas also a slight (approximately 2%) increase in the maximummagnitude of the Hadley cell inflow from the northern hemisphere. However, maximum mass flux in the winter hemisphere Hadley cell was approximately 2% smaller in the actLAI case than in the potLAl case. The northern hemisphereFerrell cell maximum mass flux was larger in the actLAI casethan in the potLAl case by approximate lv 20% (45 x i09 g/s ascompared to 37 x io gls).
July maximum Hadley cell meridional winds were slightlystronger in the upper branch in the actLAI case as comparedto the potLAl case though weaker in the lower branch. Despitethis, the southern hemisphere Hadley circulation showed morethan a 2% decrease in maximum mass flux in the actLAJ case ascompared to the potLAl case indicating that the stronger windsoccur over a smaller area. The northern hemisphere Hadleycell mass flux decreased by nearly 15% in the actLAI case.
8. Meridional AveragesTo better understand mechanisms responsible for the less
vigorous Hadley circulations and zonal jets in both January and
temperature (actLAI-potL.AI) in K for (a) January and
July in the actLAI simulation, surface quantities for each season were averaged over the latitude band which correspondecto the area of mean tropical ascending motion. For Januarthis belt lies approximately from 2°N to 22°S. In July the averaging area was from 2°N to 22°N.
Table 1 summarizes mean quantities over land in the latitude bands corresponding to mean upward motion for botlJanuary and July. There was a slightly larger average decreasin LA! in the actLAI case in January than in July and differences in surface fluxes in January were more than double thLJuly values. The actLAI case showed increased sensible heaflux, decreased latent heat flux, and decreased precipitation ii’
both seasons as compared to the potLAl case. Skin temperatures in the actLAI case increased in January but not in JulyOutgoing longwave radiation (OLR) values for the actLAI castincreased on average in January but decreased in July. Howeverthe largest change in total precipitation occurred in July.
Maximum averaged differences in LA! between the tw(cases in these latitude bands were 1.8 in July as opposed to 1.5in January (the maximum value of LAI in the model is 6). InJanuary the largest differences occurred in Africa, followecclosely by the Americas, and were smallest in Asia in JanuaryNote that in January the averaging domain extends only to 2°Nso that the main landmasses of Asia are not included in thdomain. We use Asia here for convenience in referring tc’
180w 150w 120w ov aw ow 0 3CC 6CC 9CC 120f 15CC WOE

CHASE ET AL: GCM SENSITIVITY TO GLOBAL CHANGES IN LAI 7399
Figure 2. Ten-year averaged differences in 500-mbar heights zonal wavenumbers 1—6 only (act-LA!potLAl). (a) January, contour 10 m, and (b) July, contour 5 m.
Indonesia and the maritime continent. July LAI differenceswere largest in Asia and followed by the Americas and wererelatively small in magnitude and area in Africa.
In January, difference fields comparing surface latent heatflux from 2°N to 22°S showed decreased latent heat flux overland in the actLAI case with a maximum decrease of 12 W/m2occurring in the Americas. Decreases of about 8—10 W/m2covered most of Africa. A sharp increase of approximately 11W/m2 occurred in western Asia, while a decrease in latent heatflux of about 4 W/m2occurred in eastern Asia. This latter areawas a region of small changes in LAI. Differences in sensibleheating patterns occurred almost exclusively in regions affectedby a change in LA!. Areas of increased sensible heating occuffed on nearly all land areas in the averaging domain with amaximum increase of nearly 15 W/m2 in the Americas for theactLAI case.
An estimate of the vigor of convection in the tropics isoutgoing longwave radiation with OLR decreasing with deeperconvection. In January, OLR increases in the actLAI case overthe Americas reached 12 W/m2.Off the eastern coast of Africain the Indian Ocean, increases in the actLAI case were inexcess of 20 W/m2, and over eastern Asia, OLR increased SW/m2. Over the eastern Pacific the Atlantic and Africa OLRdecreased in the actLA1 case, indicating increased convectiveactivity in these regions.
In July, decreases in mean latent heat flux in the latitudesfrom 2N to 22°N for the actlA1 case were largest in Asiawhich corresponds to the region of largest decrease in LAI.The maximum decrease was nearly 30 W/m for the actLAIcase. A decrease of 25 W1m2 developed in the Americas. Forthe same case, increases in sensible heating occurred in theAmericas and Asia in direct correlation with decreases in latent heat flux. The largest increase was nearly 19 W1m2 in Asia.
OLR increases of up to 16 W/m2 occurred over the Americas in the actLAI case in July. Over Africa, OLR decreased inthis case to 8 W/m2. Over Asia and the maritime continent,OLR increased by up to 11 W1m2. It should be emphasized thatthe differences described in this section were small in the sensethat differences between cases were smaller than the year-to-year variability of the fields in the model.
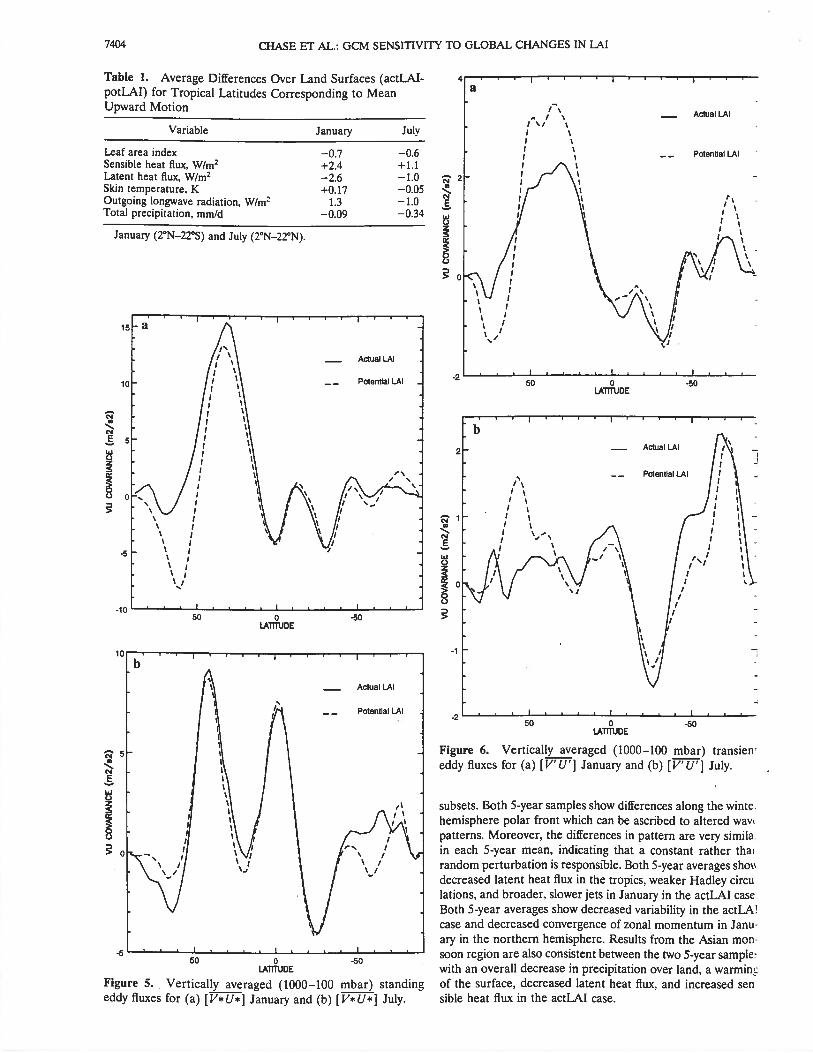
9. Horizontal Momentum FluxesFigure 5 displays comparisons of the horizontal momentum
fluxes representing deviations from the zonal mean flow averaged vertically from 1000 to 100 mbar. Northward momentumflux associated with stationary waves in January was somewhatlarger in magnitude in the actLAI case than for the potLAlcase in the northern hemisphere. There was, however, a considerable decrease in southerly momentum transport poleward
6E 90€ 120€ 150€ 180€

7400 CHASE ET AL.: GCM SENSITIVITY TO GLOBAL CHANGES IN LAI
E
z0
0
EEz0
a
of 50°N in the actLAI case creating a decrease in zonal momentum convergence and shifting the area of convergencefarther north.
In July the northern hemisphere standing wave fluxes weresimilar in the two cases though the actLAI case had slightlysmaller magnitude in far northern latitudes. Larger differencesin the flux patterns were seen in the southern hemisphere. TheactLAI case had larger magnitude zonal momentum fluxeswhich were consistently positive in the southern hemispherepoleward of 40°S, while momentum fluxes for the potLAI casein the southern hemisphere were negative until about 70°S.
Fluxes representing deviations from the time mean also dis
played interesting differences between the two experiments.Differences between the vertically averaged (1000—100 mbar),zonally averaged transient fluxes are shown in Figure 6. InJanuary, transient eddy fluxes of zonal momentum are larger inmagnitude for the actLAI case between 55°N and 70°N. Between 30°N and 55°N, transient transport of zonal momentumwas considerably smaller for the actLAI simulation. The decrease in transient flux in this region in the actLAI case wasassociated with a northern midlatitude decrease in precipitation (Figure 2). Again, there was less convergence of zonalmomentum at about 60°N for the actLAI case. This decrease inzonal momentum convergence presumably served to decreasethe magnitude of the jet, thereby increasing its stability, and sofurther reduced transport by transient eddies. In July, transientactivity was generally smaller in magnitude in the northernmidlatitudes for the actLAI case. Transient eddy momentumflux was larger in magnitude for the actLAI case in most of thesouthern hemisphere.
10. Interannual VariabilityAs an example of the differences in variability between the
two simulations, Figure 7 compares the variance of 500-mbarheights for the two experiments. In the regions poleward of thepolar front, the variance of the actLAI fields was substantiallysmaller in both seasons and for both hemispheres. The decrease in variance for the actLAI case was nearly 40% at thepeak in January. In July, the peak variance in the southernhemisphere also shifted equatorward approximately 15° in theactLAI case.
11. Asian MonsoonA closer look at southern Asia during northern summer is
interesting for several reasons. First, this region was subject torelatively large increases in LA! over a large continuous area.Also, these changes were from large values (potLAl) to smallvalues (actL.AI). If LA! differences resulted in changed atmospheric conditions, therr it should be noticeable here. Second.there is much interest in the influence of the land surface onthe strength of the Asian summer monsoon [e.g., Meehl, 1993.1994; Fennessey et al., 1994].
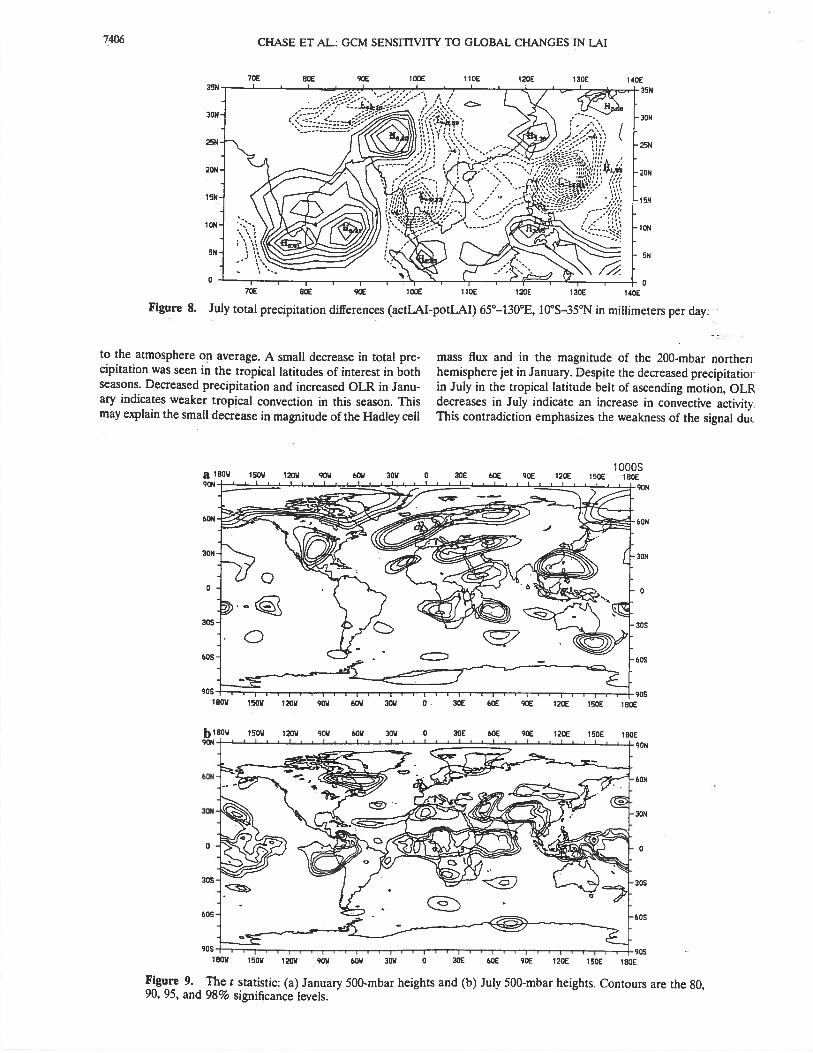
Ten years of July averages have been used to represent thesummer monsoon season. Though this is not ideal, it was feltthat this would be somewhat representative of the summermonsoon season as a whole. A summary of regionally averageddifferences over land surfaces from 10°S—35°N to 65°—130°Eare presented in Table 2. In this region the actLAI case hadmore than a 20% decrease in LA! on average compared to thepotLAl case. As a consequence, there was an decrease in latentheat flux from the surface of 133.2 to 126.8 W/m2. Sensibleheat fluxes increased from 47.6 to 53.4 W/m2. This was followed by a 0.3 K increase in 1.5-m temperatures for the actLAJcase. A 0.5 K increase in maximum daily temperature occurredin this region, while minimum daily temperature decreased 0.3K. The increased vegetation increased the diurnal temperaturerange. A decrease in total precipitation in the actLAI caseoccurred over land surfaces from 12.5 to 11.8 mm/d in thisregion. July precipitation decreases over land occurred largelyover Nepal and Tibet, southeastern Asia, and the northernPhilippines (Figure 8). Increased precipitation occurred oversouthern India.
50 0 -50LATITUDE
50 0 -50LA1TIUDE
Figure 3. Zonally averaged total precipitation in millimetersper day for (a) January and (b) July. South latitudes are negative.

CHASE ET AL: GCM SENSITIVITY TO GLOBAL CHANGES IN LAI 7401
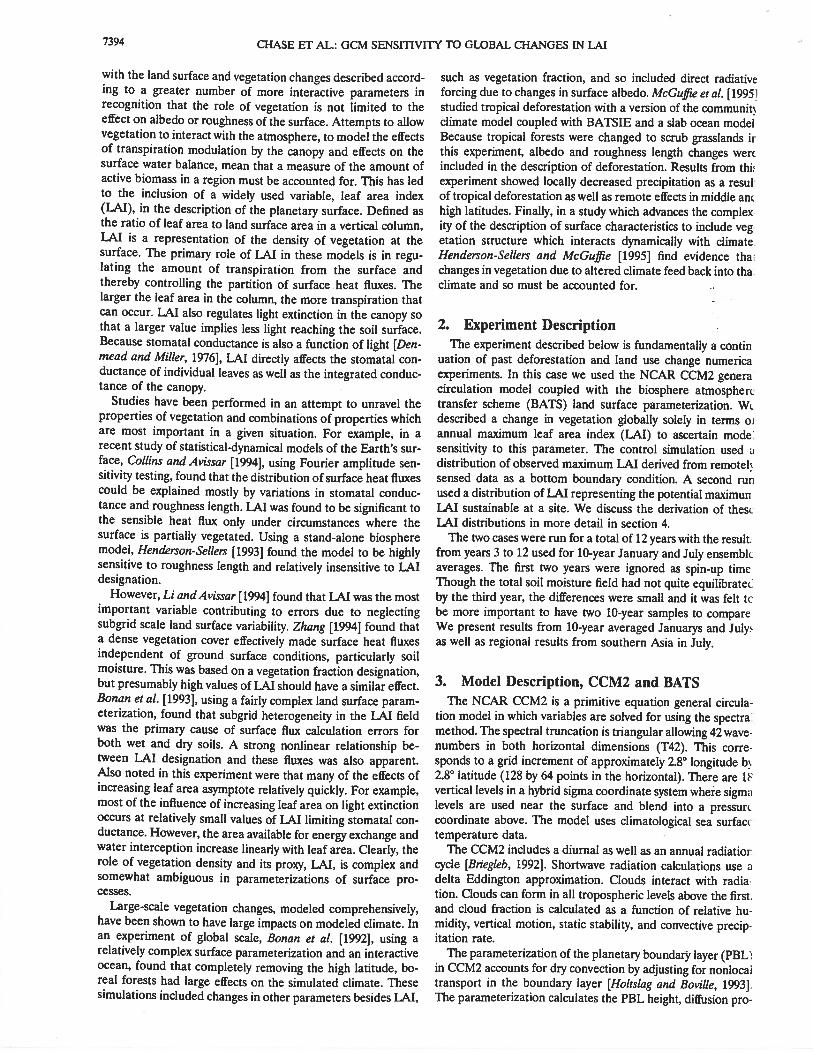
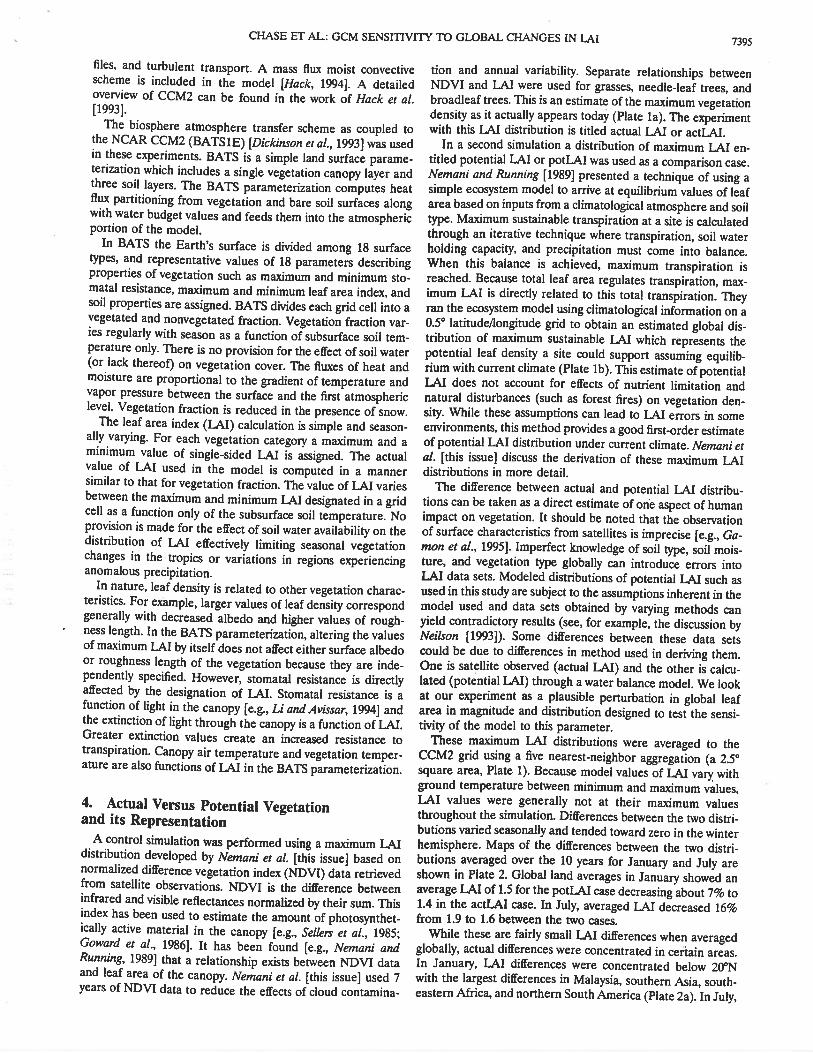
Figure 4. Zonally averaged pressure velocity in millibars per second for the region 30°N—30°S for (a)
January, actLAI; (b) January, potLAl; (c) January, difference (actLAl-potLAI); (d) July, actLAl; (e) July,
potLAl; and (f) July, difference (actLAI-potLAI). Rising motion is indicated with negative contours.
b
35. e
3. B
25.B
I5.e
7402 CHASE ET AL: GCM SENSITIVITY TO GLOBAL CHANGES IN LAI
d
12. Statistical SignificanceThe statistical significance of results from this experiment
was estimated using the methodology described by Che,vin andSchneider [1976] based on the t-test statistic. Figure 9 displayscontoured values of this statistic at the 80% (t = 1.33), 90%(1.73), 95% (2.10), and 98% (2.55) significance levels for the
500-mb height field in January and July. The areas along thestorm tracks in the northern hemisphere in January clearlyshowed regions of significant difference between the two experiments. In the zonal average the t statistic was greater thanthe 80% significance level for most of the northern hemispherenorth of 60°N. In July the region of highest significance was the
C 4.809H
35 e
25.9
29.9
15.9
10.0
5.0
Figure 4. (continued)
CHASE ET AL: GCM SENSITIVITY TO GLOBAL CHANGES IN LAI 7403
tropics where greater than 90% significance level was reachedfrom approximately 5°N to 10°S. The zonally averaged planetary circulation shows differences between experiments, butthese differences tend to be smaller than model variability.Regions of 80% or higher significance exist but are isolated so
that significant levels are smoothed out in the zonal averageand therefore are statistically unreliable. -
Because statistical tests are not conclusive, comparisons between the first 5-year and the second 5-year means have beenmade in order to test the consistency of results in separate
30.0
25.0
20.0
15.0
II.’
S .0
Figure 4. (continued)
7404 CHASE ET AL.: GCM SENSITIVITY TO GLOBAL CHANGES IN LAI
Table 1. Average Differences Over Land Surfaces (actL.AIpotLAl) for Tropical Latitudes Corresponding to MeanUpward Motion
Variable January July
Leaf area index —0.7 —0.6Sensible heat flux, W/m2 +2.4 +11Latent heat flux. W/m2 —2.6 —1.0Skin temperature, K +0.17 —0.05Outgoing longwave radiation, W/m2 1.3 —1.0Total precipitation, mm/d —0.09 —0.34
subsets. Both 5-year samples show differences along the winte.hemisphere polar front which can be ascribed to altered waypatterns. Moreover, the differences in pattern are very similain each 5-year mean, indicating that a constant rather thairandom perturbation is responsible. Both 5-year averages showdecreased latent heat flux in the tropics, weaker Hadley circulations, and broader, slower jets in January in the actLAI caseBoth 5-year averages show decreased variability in the actLA!case and decreased convergence of zonal momentum in January in the northern hemisphere. Results from the Asian monsoon region are also consistent between the two 5-year sample’with an overall decrease in precipitation over land, a warminof the surface, decreased latent heat flux, and increased sensible heat flux in the actLAI case.
January (rN—22°S) and July (2°N—22°N).
N
NE
w0
N
NE
bJC)
50 0 -50LATTThDE
Figure 6. Vertically averaged (1000—100 mbar) transieneddy fluxes for (a) {V’U’] January and (b) [V’U’j July.
so o 5OLATITUDE
Figure 5. Vertically_averaged (1000—100 mbar) standingeddy fluxes for (a) [V*U*j January and (b) [V*U*j July.

CHASE ET AL.: GCM SENSITIVITY TO GLOBAL CHANGES IN LA! 7405
13. Discussion and ConclusionsAn experiment designed to test the sensitivity of numerically
modeled climate to a change in maximum leaf area index usinga plausible perturbation was performed. This change is thedifference between a global distribution of maximum LA! observed from satellite and an estimate of the distribution ofmaximum LAI modeled to be in equilibrium with current observed climate.
Globally averaged fields in these experiments showed fewdifferences. The changing distribution and magnitude of LA!would be expected to initially alter only the partitioning between latent and sensible heat fluxes from the surface. Whiledifferences in this partitioning may possibly have large consequences regionally due to altered circulation patterns, it iS
unlikely that changes would be seen in globally averaged andtime-averaged fields. An exception to this would occur if cloudcover was altered or changes in soil moisture were induced bythe LA.! change. Both these factors affect global albedo andtherefore the planetary energy budget [e.g., Ramanathan et at.,1989; Otterman, 1977]. Because differences in both total cloudiness and soil moisture were negligible in the global average,there is no reason to expect that these will play anything but asmall role in this experiment in terms of global-mean effects.However, large-scale features in the atmosphere were affectedby the change from the potentjal LA! distribution to the actualLA! distribution in the simulations. This was seen in higherlatitudes in winter in both henispheres as well as in the tropics.
Statistically significant differences at high northern latitudesin January seen in 1.5-rn temperatures or the 500-mbar heightsare attributed to changes in the structure of waves along thepolar front. I is inferred that these differences were generedby changes in atmospheric heating patterns in the tropics initiated by decreased average latent heat flux from the surface inthe actual LA! simulation and from changes in the meridionaldistribution of heating. These changes in tropical heatingpatterns appear to have altered the meridional structure in the200-mbar jet and so the generation of waves. This was evidentin January in the region of the Americas where the jet shows a14% decrease in peak magnitude. While regional differences inlatent heat flux were larger in the July tropics, there was less ofan effect at higher latitudes in the southern hemisphere. Thiswould seem to be due to the greater role eddies have in thenorthern hemisphere because of the larger percentage of landsurface.
Differences between the actual LAI simulation and the potential LA! simulation were also found in the tropics at thelatitudes of maximum upward motion. While scattered areas ofgreater than 90% statistical significance occurred in this region, the significance of the results throughout the tropics andhigher latitudes is not fully established. However, these differences were often consistent in comparisons of two 5-year samples. This suggests that a longer integration would differentiatea similar signal as describçd here from model noise. There wasan decrease of surface latent heat flux and increased sensibleheat flux over land in both January and July due to the decreased LA! in the actLAI case. The decreased latent heat fluxsurpassed the increased sensible heat flux in absolute value inboth seasons, so that the surface was supplying less total energy
Table 2. Ten-Year July Land Averages (65°—130°E,10°S—35°N)
Variable July - % Change
Leaf area index —1.38 —20.8%Total soil moisture, mm —0.12Skin temperature, K +0.40Maximum 1.5-m temperature, K +0.54Minimum I.5-m temperature, K —0.34Average 1.5-rn temperature, K +0.29Sensible heat flux. W/m2 +5.8 + 12.1%Latent heat flux. W/m2 —6.4 —4.8%Total clouds (frac) +0.02 +2.4%Total precipitation, mm/d —0.66 —5.2%Runoff, mm/d —0.46 —6.3%Shortwave at surface, W/m2 +3.43
Summary of differences between control and perturbed (actLAIpotLAl) and the percentage change.
50 0 -50LATiTUDE
Figure 7. Zonally averaged variance of 500-mbar heights insquare meters for (a) January and (b) July.
7406 CHASE ET AL: GCM SENSITIVITY TO GLOBAL CHANGES IN LAI
1D hOE 120E h3OE 140E
to the atmosphere on average. A small decrease in total precipitation was seen in the tropical latitudes of interest in bothseasons. Decreased precipitation and increased OLR in Januaay indicates weaker tropical convection in this season. Thismay explain the small decrease in magnitude of the Hadley cell
mass flux and in the magnitude of the 200-mbar northerihemisphere jet in January. Despite the decreased precipitatiorin July in the tropical latitude belt of ascending motion, OLRdecreases in July indicate an increase in convective activityThis contradiction emphasizes the weakness of the signal du.
Figure 9. The t statistic: (a) January 500-mbar heights and (b) July 500-mbar heights. Contours are the 80,90, 95, and 98% significance levels.
70E 80€
70€ ODE gc€ 100€ flOE 120E 130E
Figure 8. July total precipitation differences (actLAI-potLAI) 65°—130°E, 10°S—35°N in millimeters per day.
180W 1508 1208 908 608 308 0 30€ 60E 90€ 120€ 150E 180E
CHASE ET AL: 0CM SENSITIVITY TO GLOBAL CHANGES IN LA! 7407
to altered LA! relative to other processes at work. The meanmeridional circulation and the winter hemisphere jet were alsoslightly weaker in this season.
The region of the Asian monsoon in July displayed a similarresponse to the decrease in LA! in the actual LAT case as thetropics as a whole. There was decreased latent heat flux overland, increased sensible heat flux, and an decrease in totalprecipitation.
The most striking differences between the two cases described here occurred in the realm of interannual variabilityand eddy fluxes. There was decreased variability in the actualLA! simulation along and poleward of the winter hemispherepolar fronts which again point to alterations in the generationof waves due to influences from the tropics.
Finally, it should be emphasized that this was a minimalchange scenario designed to test the sensitivity of the model toperturbation in LA!. Interactions among biophysical changesassociated with altered vegetation structure are needed to consider the effect of vegetation as a whole on climate: Futurework should include time-varying roughness length, vegetationalbedos, vegetation fraction, and other parameters used todescribe the vegetation cover which are compatible with theLA! distribution. Further, because neither vegetation fractionnor minimum LA! were altered along with the maximum LA!,this experiment may be considered to have evaluated minimalforcing arising from changes in LA!. Presumably, the decreased density of vegetation seen in the actual LA! distribution in most areas also covered smaller fractional areas of thesurface, and so effects due to LA! changes would be proportionally larger. Nonetheless, the designation of LA! as part ofthe bottom boundary condition in this model appears to havehad an effect on the climate generated, suggesting that furtherattention to the accurate specification of vegetation density isnecessary.
Acknowledgments. Support for this study was provided by the National Park Service and National Biological Service under contract CA1268-2-9004. COLR-R92-0204. NSF grant ATM-9306754. andUCAR’s Climate System Modeling Program which is supported by theNSF. We would like to thank NCAR for providing computer time andaccess to CCM2. NCAR is partially supported by the National ScienceFoundation. We thank Jill Baron. Dave Randall. Jeff Copeland. BryanCritchfield, Dallas McDonald. and two anonymous reviewers for theircomments and assistance in this study.
ReferencesBonan, G. B.. D. Pollard. and S. L. Thompson. Effects of boreal forest
vegetation on global climate. .Vature. 359, 716. 1992.Bonan. G. B., D. Pollard. and S. L. Thompson. Influence of sub-grid
scale heterogeneity in leaf area index. stomatal resistance, and soilmoisture on grid-scale land-atmosphere interactions. J. Clim., 6,1882—1897, 1993.
Briegleb. B. P., Delta Eddington approximation for solar radiation inthe NCAR community climate model. J. Geophys. Res., 97, 7603—7612, 1992.
Charney, J. G., Drought in the Sahara: A biogeophysical feedbackmechanism, Science, 187, 434—435. 1975.
Chervin. R. M., and S. H. Schneider. On determining the statisticalsignificance of climate experiments with general circulation models,J. Atmos. Sci., 33, 405—412. 1976.
Collins, D. C., and R. Avjssar. An evaluation with the Fourier amplitude sensitivity test of which land-surface parameters are of greatestimportance in atmospheric modeling. J. Clim.. 7, 681—703, 1994.
Denmead, 0. T., and B. D. Miller. Field studies of the conductance ofwheat leaves and transpiration. Agron. J.. 68. 307—311, 1976.
Dickinson. R. E., A. Henderson-Sellers, and P. J. Kennedy, Biosphere-
atmosphere transfer scheme (BATS) version le as coupled to theNCAR community climate model, NCAR Tech. Rep., NCARITN387+STR, 72 pp., NatI. Cent, for Atmos. Res., Boulder, Cob., 1993.
Fennessey, M. J.. et al., The simulated Indian monsoon: A 0CMsensitivity study, J. Qim., 7, 33—43, 1994.
Gamon. J. A.. G. C. Bield, M. L. Goulden, K. I. Griffin, A. E. Hartley,G. Joel. J. Penuelas, and R. Valentini, Relationships betweenNDVI, canopy structure, and photosynthesis in three Californiavegetation types. EcoL AppI., 5, 28—41, 1995.
Garratt. J. R., Sensitivity of climate simulations to land-surface andatmospheric boundary-layer treatments—A review,J. Clim., 6,419—449, 1992.
Gill. A. E., Some simple solutions for heat-induced tropical circulations, Q. J. R. Meteoroh Soc., 106, 447—462, 1980.
Gornitz. V., Climatic consequences of anthropogenic vegetationchanges, in Climate History, Periodicity and Predictability, edited byM. R. Rampino, J. E. Sanders, W. S. Newman, and L. K. Konigsson,pp. 47—70, Van Nostrand Reinhold, New York, 1987.
Goward. S. N., C. J. Tucker, and D. G. Dye, North American vegetation patterns observed with the NOAA-7 Advanced Very High Resolution Radiometer, Vegetatio, 64, 3—14, 1986.
Hack. J. J., Parameterizations of moist convection in the NationalCenter for Atmospheric Research community climate model(CCM2), J. Geophys. Res.,99, 555 1—5568, 1994.
Hack. J., B. Boville, B. Briegleb, J. Kiehl, P. Rasch, and D. Williamson,Description of the NCAR Community Climate MOdel (CCM2),NCAR Tech. Note, NCAR/TN-382+STR, 108 pp., NatI. Cent. forAtmos. Res., Boulder, Cob., 1993.
Henderson-Sellers. A., A factorial assessment of the sensitivity of theBATS land-surface parameterization scheme, J. Clim., 6, 227—247,1993.
Henderson-Sellers, A., and V. Gornitz, Possible climatic impacts ofland cover transformations with particular emphasis on tropical deforestation, Clim. Change, 6, 231—257, 1984.
Henderson-Sellers, A., and K. McGuffie, Global climate models and‘dynamicS vegetation. Global Change Biol., 1, 63—75, 1995.
Holtslag, A. A. M., and B. A. Boville, Local versus nonlocal boundarylayer diffusion in a global climate model, J. Clim., 6, 1825—1841,1993.
Hoskins. B. J., and D. J. Karoly, The steady linear response of aspherical atmosphere to thermal and orographic forcing, J. Armos.Sci., 38, 1179—1196, 1981.
Houghton. R. A., The worldwide extent of land-use change, Bioscience,44. 305—313. 1994.
Li. B.. and R. Avissar. The impact of spatial variability of land-surfacecharacteristics on land surface heat fluxes,J. CErn., 7,527—537, 1994.
McGuffie, K.. A. Henderson-Sellers, H. Zhang, T. B. Durbidge, and A.J. Pitman. Global climate sensitivity to tropical deforestation, GlobalPlanet. Change, 10. 97—128, 1995.
Meehl. G. A., Influence of the land surface in the Asian summermonsoon: External conditions versus internal feedbacks, J. Clim., 7,1033—1049, 1993.
Meehl, G. A.. Coupled land-ocean-atmosphere processes and SouthAsian monsoon variability, Science, 266, 263—267, 1994.
Meher-Homji, V. M., Probable impact of deforestation on hydrological processes. Clim Change, 19, 163—173, 1991.
Mintz. Y.. The sensitivity of dumerically simulated climates to land-surface boundary conditions, in The Global Climate, edited by J.Houghton. pp. 79—105, 1984.
Neilson. R.. Vegetation redistribution: A possible source of CO., during climate change, Water Air Soil PoIlut., 70, 659—673, 1993.
Nemani, R. R., and S. W. Running, Testing a theoretical climate-soil-leaf area hydrologic equilibrium of forests using a satellite data andecosystem simulation, Agric. For. Meteorol., 44, 245—260, 1989.
Nemani. R., S. W. Running, R. A. Pielke, and T. N. Chase, Globalvegetation cover changes from coarse resolution satellite data, J.Geophys. Res., this issue.
Otterman. J., Anthropogenic impact on the albedos of earth, Clim.Change, 1, 137—155, 1977.
Overpeck. J. T.. The role and response of continental vegetation in theglobal climate system. in Global Changes in the Perspective of thePast, edited by J. A. Eddy and H. Oeschger, John Wiley, New York,1993.
Pie lou. E. C.. After the Ice Age: The Return of Life to Glaciated NorthAmerica. 366 pp.’ University of Chicago Press. Chicago, III.. 1991.

7408 CHASE ET AL: GCM SENSITIVITY TO GLOBAL CHANGES IN LAI
Potter, G. L., H. W. Ellsaesser, M. C. MacCracken, and J. S. Ellis,Albedo change by man, Nature, 291, 47—49, 1981.
Ramage, C. S., Role of a tropical “maritime continent” in the atmospheric circulation, Mon. Weather Rev., 96. 365—370, 1968.
Ramanathan, V., R. D. Cess, E. F. Harrison. P. Minnis, B. R. Barkstrom, E. Ahmad, and D. Hartmann. Cloud-radiative forcing andclimate: Results from the earth radiation budget experiment, Science, 6, 57—63, 1989.
Rasmussen, E. M., and K. Mo, Linkages between 200-mb tropical andextratropical circulation anomalies during the 1986—1989 ENSOcycle, J. Cljm., 6, 595—616, 1993.
Rowntree, P. R., Review of GCMs as a basis for predicting the effectsof vegetation change on climate, in Forests, Climate and Hydrology-Regional Impacts, edited by E. R. C. Reynolds and F. B. Thompson,162 pp., United Nations University, New York, 1988.
Sagan, C., 0. B. Toon, and J. B. Pollack. Anthropogenic climatechanges and the Earth’s climate, Science, 206, 1363—1368, 1979.
Sellers, P. J., Canopy reflectance, photosynthesis, and transpiration,mt. J. Remote Sens., 6, 1335—1372, 1985.
Street-Perrott, F. A., J. F. B. Mitchell, and D. S. Marchand, Milankovich and albedo forcing of the tropical monsoons: A comparison ofgeological evidence and numerical simulations for 9000 y BP, TransR. Soc. Edin. Ea,zh Sd., 81, 407—427, 1990.
Sud, Y. C., and W. E. Smith, The influence of surface roughness of
deserts on th July circulation, Boundaiy Layer Meteorol., 33, 45—491985.
Sud, Y. C., J. Shukla, and Y. Mintz, Influence of land surface roughness on atmospheric circulation and precipitation: A sensitivity studwith a general circulation model, J. AppL Meteorol., 27, 1036—10541988.
Webster. P. J., Large scale structure of the tropical atmosphere, iiLarge Scale Dynamical Processes in the Atmosphere, edited by B.Hoskins and R. P. Pearce, Academic, San Diego, Calif.. 1983.
Zhang, T., Sensitivity properties of a biosphere model based on BATand a statistical-dynamical climate model,J. Clim., 7, 890—9 13, 1994
T. N. Chase and R. A. Pielke, Department of Atmospheric SciencLColorado State University, Fort Collins, CO 80523.
T. G. F. Kittel. Climate System Modeling Program, University Corporation for Atmospheric Research, P.O. Box 3000, Boulder, C(80307.
R. Nemani, School of Forestry, University of Montana. MissouhMT 59812.
(Received February 21, 1995; revised June 23, 1995;accepted July 24, 1995.)
Related Documents