Sensitivity analysis of Gassmann’s fluid substitution equations: Some implications in feasibility studies of time-lapse seismic reservoir monitoring Fredy A.V. Artola a, * , Vladimir Alvarado b,1 a Grupo de Tecnologia e Engenharia de Petro ´ leo, Pontifı ´cia Universidade Cato ´lica do Rio de Janeiro, Rua Marque ˆs de Sa ˜o Vicente, 225 - Edifı ´cio Padre Leonel Franca, 6 andar - CEP - 22453-900, Ga ´vea - Rio de Janeiro - RJ - Brazil b Interdepartmental Oil and Gas Program, Pontifı ´cia Universidade Cato ´lica do Rio de Janeiro, Rua Marque ˆs de Sa ˜o Vicente, 225 - CEP - 22453-900, Ga ´vea - Rio de Janeiro - RJ - Brazil Received 6 December 2004; accepted 20 July 2005 Abstract Here, we discuss the sensitivity of the seismic response to uncertainties in the physical parameters of the reservoir rock. For this purpose, a probabilistic sensitivity analysis of Gassmann’s fluid substitution equations using a Monte Carlo approach was carried out. We represented uncertainties related to each parameter as probability density functions to evaluate the contribution of each parameter uncertainty to the variance of the seismic response (V p ), calculated by means of the Monte Carlo approach. We show that uncertainties related to grain density (q gr ), dry shear modulus ( G d ) and dry bulk modulus (K d ) contribute more significantly on the variance of V p , if all parameters are uncorrelated. This outcome changes, when physical dependencies are represented as correlations in the Monte Carlo sampling of some of the parameters. In this sense, correlations distribute more evenly the contributions to uncertainty in V p . On the other hand, we also evaluated scenarios of fluid substitution, in which fluid 1 is replaced by fluid 2, with the corresponding variations in seismic response. In this case, V p2 is the P-wave velocity of rock saturated with a fluid 2. If V p2 were forecasted from an initial set of parameters of the rock saturated with fluid 1 (V p1 , V s1 , etc.) the uncertainties related to V p1 , V s1 and K gr would contribute more significantly to the variance of V p2 . From these three initial parameters, the most important contributions come form V p1 and V s1 . Concomitantly, we evaluated the contribution of possible variations in fluid phase density and bulk modulus and of a pore pressure perturbation (4MPa) for several scenarios of connate and injection fluids on the variance of V p . We did this for several values of initial differential pressure. Results indicate that the contribution of the elastic piezosensitivity and possible changes in the fluid phase properties depend not only on the initial differential 0926-9851/$ - see front matter D 2005 Elsevier B.V. All rights reserved. doi:10.1016/j.jappgeo.2005.07.006 * Corresponding author. Fax: +55 21 3114 1459. E-mail address: [email protected] (F.A.V. Artola). 1 Fax: +55 21 3114 1165. Journal of Applied Geophysics 59 (2006) 47 – 62 www.elsevier.com/locate/jappgeo

Welcome message from author
This document is posted to help you gain knowledge. Please leave a comment to let me know what you think about it! Share it to your friends and learn new things together.
Transcript

www.elsevier.com/locate/jappgeo
Journal of Applied Geophy
Sensitivity analysis of Gassmann’s fluid substitution equations:
Some implications in feasibility studies of time-lapse
seismic reservoir monitoring
Fredy A.V. Artola a,*, Vladimir Alvarado b,1
a Grupo de Tecnologia e Engenharia de Petroleo, Pontifıcia Universidade Catolica do Rio de Janeiro, Rua Marques de Sao Vicente,
225 - Edifıcio Padre Leonel Franca, 6 andar - CEP - 22453-900, Gavea - Rio de Janeiro - RJ - Brazilb Interdepartmental Oil and Gas Program, Pontifıcia Universidade Catolica do Rio de Janeiro, Rua Marques de Sao Vicente,
225 - CEP - 22453-900, Gavea - Rio de Janeiro - RJ - Brazil
Received 6 December 2004; accepted 20 July 2005
Abstract
Here, we discuss the sensitivity of the seismic response to uncertainties in the physical parameters of the reservoir rock.
For this purpose, a probabilistic sensitivity analysis of Gassmann’s fluid substitution equations using a Monte Carlo
approach was carried out. We represented uncertainties related to each parameter as probability density functions to
evaluate the contribution of each parameter uncertainty to the variance of the seismic response (Vp), calculated by means
of the Monte Carlo approach. We show that uncertainties related to grain density (qgr), dry shear modulus (Gd) and dry
bulk modulus (Kd) contribute more significantly on the variance of Vp, if all parameters are uncorrelated. This outcome
changes, when physical dependencies are represented as correlations in the Monte Carlo sampling of some of the
parameters. In this sense, correlations distribute more evenly the contributions to uncertainty in Vp. On the other hand,
we also evaluated scenarios of fluid substitution, in which fluid 1 is replaced by fluid 2, with the corresponding variations
in seismic response. In this case, Vp2 is the P-wave velocity of rock saturated with a fluid 2. If Vp2 were forecasted from
an initial set of parameters of the rock saturated with fluid 1 (Vp1, Vs1, etc.) the uncertainties related to Vp1, Vs1 and Kgr
would contribute more significantly to the variance of Vp2. From these three initial parameters, the most important
contributions come form Vp1 and Vs1. Concomitantly, we evaluated the contribution of possible variations in fluid phase
density and bulk modulus and of a pore pressure perturbation (4MPa) for several scenarios of connate and injection fluids
on the variance of Vp. We did this for several values of initial differential pressure. Results indicate that the contribution of
the elastic piezosensitivity and possible changes in the fluid phase properties depend not only on the initial differential
0926-9851/$ - s
doi:10.1016/j.jap
* Correspondi
E-mail addre1 Fax: +55 21
sics 59 (2006) 47–62
ee front matter D 2005 Elsevier B.V. All rights reserved.
pgeo.2005.07.006
ng author. Fax: +55 21 3114 1459.
ss: [email protected] (F.A.V. Artola).
3114 1165.

F.A.V. Artola, V. Alvarado / Journal of Applied Geophysics 59 (2006) 47–6248
pressure, but also on the type of fluids involved in substitution process. We conclude that sensitivity information, limited
in this case to Gassman’s equations, can be used as a tool to improve feasibility studies in time-lapse seismic reservoir
monitoring and as a priori qualitative knowledge. The latter can guide the inversion process or help to diminish the
uncertainties due to poorly constrained inversion schemes.
D 2005 Elsevier B.V. All rights reserved.
Keywords: Sensitivity analysis; Feasibility studies; Time-lapse; Gassmann equations
1. Introduction
The key elements of a successful 4D seismic
project consist of feasibility (Lumey et al., 1997),
acquisition, processing and interpretation (Lumey
and Behrens, 1998). According to Behrens et al.
(2002), feasibility comprises detectability and
repeatability. Detectability is the ability to detect
changes in the seismic response due to alterations
in pressure and saturation during production. An appro-
priate rock physics model is a critical to assessing
detectability (Behrens et al., 2002). On the other
hand, repeatability is a measure of the similarity of
the seismic response between two or more seismic
surveys.
In this work, we concentrate on issues of uncer-
tainty propagation for detectability in time-lapse
seismic monitoring, through the analysis of Rock
Physics equations, as part of feasibility studies.
Our results might impact mostly decisions for pur-
posely designed 4D seismic surveys, rather than
studies based on legacy seismic data. In general,
high or improved detectability, by mitigation of
uncertainties, might result relevant in a large number
of cases. We focus on quantitative uses of time-lapse
seismic. In this regard, the correct use of rock
physics models is a must. Understanding of uncer-
tainty propagation is, therefore, a matter of necessity.
Feasibility studies are tied to the particular produc-
tion scenario in a given reservoir, that is, whether
being a primary or a secondary production mechan-
ism. A myriad of different data sources at different
scales impact the result of these studies usually
represented through equations. In this context, Gass-
mann (1951) equations, whose applicability in por-
ous media is limited to homogeneous isotropic rocks
under isobaric conditions, are frequently used to link
the seismic response to changes in reservoir proper-
ties. A typical form for Gassmann equation is the
following:
Ks ¼ Kd þ1� Kd=Kgr
� �2/Kf
þ 1� /Kgr
� Kd
K2gr
ð1Þ
where Ks is the saturated-rock modulus, Kd the
frame (dry) bulk modulus, while Kgr and Kf corre-
spond to the grain and fluid bulk moduli, respec-
tively, and / is porosity.
On the other hand, Brown and Korringa (1975)
generalized equations represent an alternative for ani-
sotropic cases. These equations can consider arbitrary
symmetries (VTI, HTI, orthorhombic, monoclinic,
etc.) to carry out fluid substitution in rocks. Although
the equations are not explicit functions of thermody-
namic conditions in a reservoir, pressure and tempera-
ture effects can be accounted for through empirical
equations. Batzle and Wang (1992) expresses effects
of pressure and temperature of the fluid phase, while
an elastic piezosensitivity relationship can be used for
the dry-rock bulk modulus (MacBeth, 2004; Shapiro,
2003, etc). This latter relationship relates the rock
elastic moduli with differential pressure (confining
minus pore pressure).
In conventional time-lapse feasibility studies, syn-
thetic monitors are used to estimate likely changes in
the seismic response. These estimates are employed
to help with the decision-making process of produc-
tion strategies. Studies start with an initial estimate
of physical parameters that control the seismic
response, upon which updating of the reservoir con-
ditions follow.
Parameters for the application of Gassmann equa-
tion generally come from well and core data, plus
empirical equations. The values of Vp and Vs are, in
general, estimated from full-wave sonic logs. Satu-
F.A.V. Artola, V. Alvarado / Journal of Applied Geophysics 59 (2006) 47–62 49
rated-rock moduli can be obtained from estimated Vp
and Vs values, while reservoir density, in turn, can be
calculated from sonic logs and core measurements.
From all these parameters, the frame (dry) bulk mod-
ulus (Kd) can be computed, but knowledge of fluid
properties (saturation, fluid bulk modulus and density
at reservoir conditions), porosity and grain bulk mod-
ulus are necessary. Some of these parameters can be
estimated from well or core data, while others can be
found in tables. There is an issue with Rock Physics
measurements that Landrø (2002) associates with
repeatability, but one can certainly mention as a pro-
blem of uncertainty in rock properties. It has been
shown that attempts to restore original conditions of
samples do not yield original properties of the reser-
voir rock. On the other hand, well logs, lab experi-
ments and field seismic measurements operate at
different length scales and frequencies. In this sense,
there are uncertainties associated with the scale and
frequency transformations. Corrective actions are
usually taken to deal with sources of errors but
even with all the care taken in the estimation of
reservoir and fluid parameters, one cannot avoid sig-
nificant sources of uncertainty associated with those
parameters. In addition, if the microstructural com-
plexity of the rock is taken into consideration, that is,
the number of mineralogic constituents, grain geome-
try and arrangement, then the uncertainty associated
with the grain effective bulk modulus can be consi-
derable. In truth, only bounds, upper and lower limits,
for this modulus can be calculated by means of mix-
ing rules.
As for the fluid phases, since in a real reservoir
there are several fluid components occupying the pore
space, it is then necessary to estimate effective fluid
density and bulk modulus. However, the estimates do
not depend only on the saturation value, but also on
the way fluids are distributed within the pore space,
i.e. the saturation distribution pattern (Mavko and
Mukerji, 1998). Therefore, the value of Kf cannot be
uniquely estimated, since it is not possible to know
accurately a priori the saturation pattern. A mixing
rule can be used to calculate Kf, but its selection
depends on previous knowledge on the complexity
of the microstructural arrangement in the rock and
fluid properties, even at initial stages of production.
In consequence, the seismic response can be predicted
only within bounds.
From the above discussion, it is inevitable to face
uncertained scenarios, and hence it becomes neces-
sary to attempt to reduce uncertainties or the least to
manage them. Consequently, the use of Gassmann
equations for feasibility and inversion studies, within
the framework of time-lapse seismic, demands sen-
sitivity analyses of the seismic response with respect
to uncertainty in the input parameters. This evalua-
tion could help us to quantify the forecast variances
and compare them with the expected time-lapse
changes (free of uncertainty). Now, since variations
in the seismic response can be in some cases subtle,
or more important in other instances, it is required
that possible changes be analyzed in view of the
forecast variance due to uncertainty in the input
parameters. Seen under this light, feasibility studies
can turn into useful tools for the decision-making
process. Moreover, feasibility studies can let us
establish a hierarchy in terms of the impact of
uncertainties (in terms of their contribution) on the
forecast variance.
The importance of rock physics considerations in
the context of time-lapse seismic reservoir monitoring
can be better appreciated by looking at initiatives to
quantitatively include time-lapse seismic data into
history-matching exercises (Aanonsen et al., 2003;
Gosselin et al., 2003; Falcone et al., 2004). The
European Commission funded an industrial joint pro-
ject to value 4D seismic results for history matching
purposes. Given that elastic properties, and not seis-
mically derived saturation and pressure, were the basis
for history match in the workflow chart, the so-called
petro-elastic model (PME) or rock physics model is
key element in this type of analysis (summarized in
terms of Gassmann equations).
On the other hand, changes in the seismic response
are linked to changes in both the solid and fluid
phases. Therefore, it is important to understand how
changes in fluid and solid properties contribute to
those changes in the seismic response, for the different
stress and production scenarios. Our analysis, how-
ever, will disregard geomechanical effects such as
subsidence or compaction that can be relevant in
certain scenarios of production, but considers the
type of fluids and reservoir dynamics. However, the
importance of Geomechanics in a 4D seismic work-
flow cannot be sufficiently stressed here, although it is
not being incorporated in our analysis.

F.A.V. Artola, V. Alvarado / Journal of Applied Geophysics 59 (2006) 47–6250
One more point to consider is that of the type of
sensitivity analysis, either probabilistic or determinis-
tic. Wang (2000) performed a relatively simple deter-
ministic sensitivity calculation on some seismic
attributes, due to errors (F10%) in Gassmann equa-
tions parameters, for hypothetical sandstone. Sen-
gupta et al. (1998) carried out a sensitivity study in
forward AVO modeling to evaluate effects of the fluid
substitution in the reflectivity by means of Monte
Carlo simulation. On the other hand, Sengupta and
Mavko (1999) performed a sensitivity analysis of
fluid substitution equations in terms of differential
error that was obtained from the partial derivatives
of Vp2 related to each input parameter. In their
approach, the input parameters were considered
uncorrelated. To extent Wang and Sengupta’s find-
ings, we performed a probabilistic analysis of the
effect of uncertainties. Contributions of uncertainties
of the physical parameters (correlated and uncorre-
lated parameters) to the variance of the predicted
compressional velocity are shown by means of
Monte Carlo simulations, through evaluation of Gass-
mann equations. Two types of rock models are ana-
lyzed, a clean and a shaly sandstone, for an interval of
porosity between 10% and 30%.
For Monte Carlo simulations, we used Crystal Ball,
software from Decisioneering Risk Analysis (Evans
and Olson, 2002). Two types of sensitivity charts can
be displayed in Crystal Ball. In the first type, sensitiv-
ities are measured by rank correlation coefficients. In
the second type, used here, approximate percentage of
contributions to the variance from input variables are
produced. The method is only approximated and does
not correspond to a full variance analysis.
Fluid substitution is carried out by considering an
initial stage of a reservoir saturated with fluid 1 and
later with fluid 2. In correspondence with the initial
stage, there exist the initial compressional and shear
velocities (Vp1 and Vs1), porosity, saturated-rock bulk
density, and grain bulk modulus. Similarly, the same
parameters associated with stage 2 are calculated. In
consequence, effects of fluid substitution are evalu-
ated in terms of parameter contributions to the var-
iances in the Monte Carlo simulation.
Finally, we evaluate the contribution of bulk mod-
uli and density of the fluid phases variability, in terms
of degrees of freedom for some injection scenarios
(for several combinations of connate and injection
fluids). These contributions are compared to those
caused by pore pressure perturbation of 4 Mpa.
2. Sensitivity analysis of Gassmann Equation
The low-frequency approximation for computation
wave propagation velocity in Rocks is based on Gass-
mann (1951) equations. This approximation assumes
that the interconnected pores in the rock are saturated
with a non-viscous fluid. To compute Vp in Gassmann
equations, it is necessary to know the following para-
meters: porosity (/), frame bulk and shear moduli (Kd
and Gd, respectively), grain bulk modulus (Kgr), grain
density (qgr), fluid bulk modulus (Kfl) and the fluid
density. This way, Vp results in a function of those
parameters as:
Vp ¼ f /;Kd;Gd;Kgr; qgr;Kfl; qfl
� �: ð2Þ
It will be shown, by using Gassmann equation
(Eq. (1)), that the value of Vp is not equally affected
by the uncertainty associated with each parameter.
The sensitivity of Vp on Gassmann equation para-
meters is attained by performing Monte Carlo simula-
tions. Each parameter was modeled as a random
variable, whose probability density function (pdf)
corresponds to a Gaussian function, characterized by
a mean value l and standard deviation (r). Althoughnot shown here, other symmetrical distributions
yielded similar results, to those to be presented here.
However, to evaluate the effect of possible asymmetry
in real pdf, triangular density functions with non-zero
skewness were also used to model uncertainty
sources. The idea being, that the triangular distribu-
tion is simple, but flexible enough, to allow a control
source of uncertainty, so that results from differently
skewed sampling could be compared on the same
statistic basis.
Values for parameters used in the sensitivity ana-
lysis are not readily available, except perhaps for
porosity. To avoid unnecessary inconsistencies in the
simulation process, some empirical equations that link
Kd to / and Kgr were used. A thorough discussion on
moduli-porosity relationships can be found in Vernik
(1998), and Nolen-Hoeksema (2000).
In this work, we selected an empirical equation that
applies to clean and shaly sandstones, subjected to the
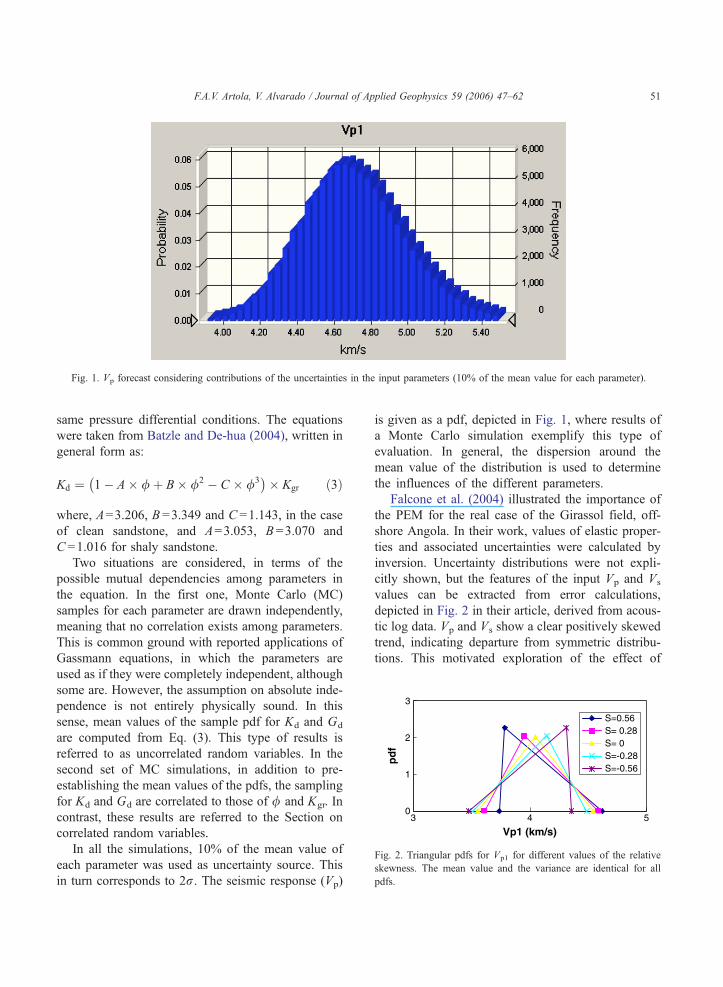
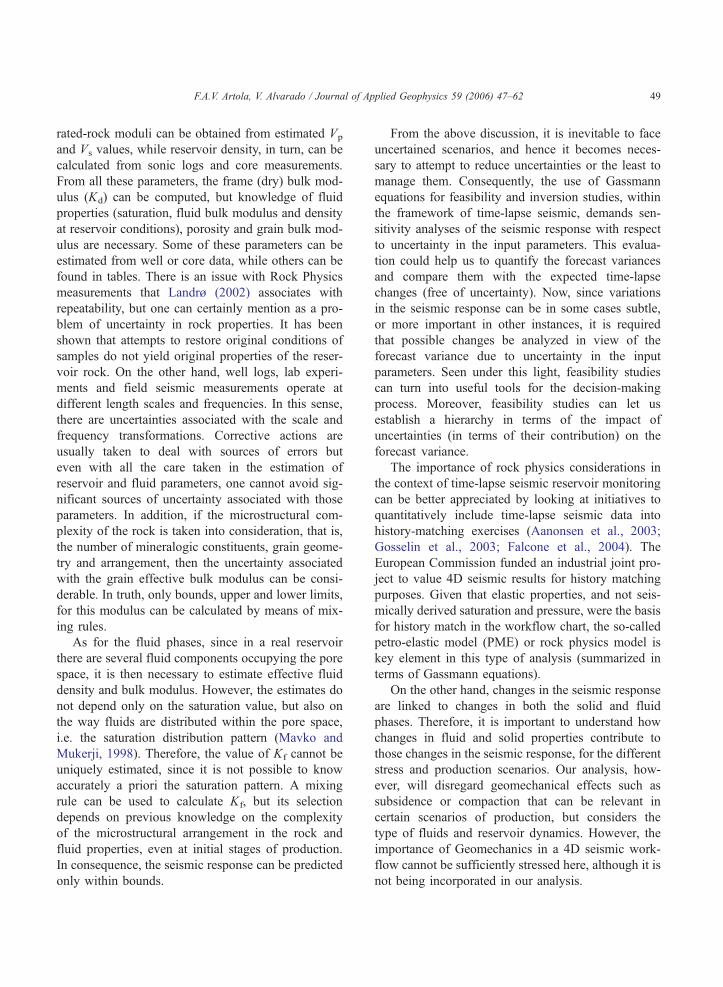
Fig. 1. Vp forecast considering contributions of the uncertainties in the input parameters (10% of the mean value for each parameter).
0
1
2
3
3 4 5
Vp1 (km/s)
pd
f
S=0.56S= 0.28S= 0S=-0.28S=-0.56
Fig. 2. Triangular pdfs for Vp1 for different values of the relative
skewness. The mean value and the variance are identical for al
pdfs.
F.A.V. Artola, V. Alvarado / Journal of Applied Geophysics 59 (2006) 47–62 51
same pressure differential conditions. The equations
were taken from Batzle and De-hua (2004), written in
general form as:
Kd ¼ 1� A� /þ B� /2 � C � /3� �
� Kgr ð3Þ
where, A=3.206, B =3.349 and C =1.143, in the case
of clean sandstone, and A=3.053, B =3.070 and
C =1.016 for shaly sandstone.
Two situations are considered, in terms of the
possible mutual dependencies among parameters in
the equation. In the first one, Monte Carlo (MC)
samples for each parameter are drawn independently,
meaning that no correlation exists among parameters.
This is common ground with reported applications of
Gassmann equations, in which the parameters are
used as if they were completely independent, although
some are. However, the assumption on absolute inde-
pendence is not entirely physically sound. In this
sense, mean values of the sample pdf for Kd and Gd
are computed from Eq. (3). This type of results is
referred to as uncorrelated random variables. In the
second set of MC simulations, in addition to pre-
establishing the mean values of the pdfs, the sampling
for Kd and Gd are correlated to those of / and Kgr. In
contrast, these results are referred to the Section on
correlated random variables.
In all the simulations, 10% of the mean value of
each parameter was used as uncertainty source. This
in turn corresponds to 2r. The seismic response (Vp)
is given as a pdf, depicted in Fig. 1, where results of
a Monte Carlo simulation exemplify this type of
evaluation. In general, the dispersion around the
mean value of the distribution is used to determine
the influences of the different parameters.
Falcone et al. (2004) illustrated the importance of
the PEM for the real case of the Girassol field, off-
shore Angola. In their work, values of elastic proper-
ties and associated uncertainties were calculated by
inversion. Uncertainty distributions were not expli-
citly shown, but the features of the input Vp and Vs
values can be extracted from error calculations,
depicted in Fig. 2 in their article, derived from acous-
tic log data. Vp and Vs show a clear positively skewed
trend, indicating departure from symmetric distribu-
tions. This motivated exploration of the effect of
l

F.A.V. Artola, V. Alvarado / Journal of Applied Geophysics 59 (2006) 47–6252
asymmetry in the probability density function on the
contribution of input parameters in Gassmann equa-
tions, through the use of triangular pdfs. Special care
was taken to avoid misleading comparisons. To con-
trol uncertainty sources, the mean value and standard
0 5 10 15 20 25 30 35 40 45
Measured by contribu
a
b
0 5 10 15 20 25 30 35 40 45
Measured by contribu
Density(gr)
Shear(dry)
Bulk(dry)
Porosity
Density(fl)
Bulk(gr)
Bulk(fl)
Density(gr)
Shear(dry)
Bulk(dry)
Porosity
density(fl)
Bulk(gr)
Bulk(fl)
Fig. 3. Contributions to the variance of Vp from uncertainties associated
sandstone.
deviation were kept constant for all triangular density
functions for each of the parameters in the Monte
Carlo simulation. The skewness, S, was varied, but
properly normalized, S*=S / (r2)3 / 2, so that the asym-
metry of the probability density function was ade-
50 55 60 65 70 75 80 85 90 95 100
tion to variance of Vp (%)
0.1
0.15
0.2
0.25
0.3
50 55 60 65 70 75 80 85 90 95 100
tion to variance of Vp (%)
0.1
0.15
0.2
0.25
0.3
with input uncorrelated parameters. (a) Clean sandstone. (b) Shaly

Contribution to variance of Vp (%)
Density(gr)
Shear(dry)
Bulk(gr)
Bulk(dry)
Porosity
Density(fl)
Bulk(fl)
0.1
0.2
0.3
Contribution to variance of Vp (%)
Density(gr)
Shear(dry)
Bulk(gr)
Bulk(dry)
Porosity
Density(fl)
Bulk(fl)
0.1
0.2
0.3
0 10 20 30 40 50 60 70 80 90 100
0 10 20 30 40 50 60 70 80 90 100
0 10 20 30 40 50 60 70 80 90 100
Contribution to variance of Vp (%)
Density(gr)
Shear(dry)
Bulk(gr)
Bulk(dry)
Porosity
Density(fl)
Bulk(fl)
0.1
0.2
0.3
a
b
c
Fig. 4. Contributions to the variance of Vp from uncertainties associated with input correlated parameters for shaly sandstone.
F.A.V. Artola, V. Alvarado / Journal of Applied Geophysics 59 (2006) 47–62 53

F.A.V. Artola, V. Alvarado / Journal of Applied Geophysics 59 (2006) 47–6254
quately controlled. Fig. 2 shows pdfs for one input
parameter for the five values of normalized skewness
tested. The relative asymmetry for all other parameters
pdfs, for the same value of S*, reproduces the same
shapes shown in Fig. 2.
3. Uncorrelated random variables
Fig. 3a and b show the parameters uncertainty
contributions to the variance of Vp, obtained in the
MC approach. The sensitivity results shown were
performed for porosity values between 0.1 and 0.3.
From the figures, it is apparent that qgr, Gd and Kd
are the dominant parameters on the variance of Vp.
Contributions from uncertainties in the remaining
parameters are practically negligible, unless a much
larger error in those parameters were introduced (not
shown). Additionally, the results corroborate that
uncertainties with respect to qgr grow inversely
with /, being more evident in the case of the clean
sandstone. On the other hand, uncertainty contribu-
tions from Gd are greater for clean sandstone, dimin-
ishing with decreasing porosity. As opposed to qgr
and Gd, uncertainty contributions arising from Kd are
significantly larger for the case of shaly systems, as
can be clearly seen in Fig. 3a and b. The trend with
respect to porosity shifts from decreasing contribu-
Fig. 5. Vp2 forecast considering contributions of the uncertainties in th
tions in clean systems to increasing contributions in
shaly sandstone. From these results, critical para-
meters that could compromise a reliable estimate of
Vp turned out to be qgr, Gd and Kd. These conclu-
sions on the impact of the different input parameters
on the uncertainty of Vp agree with results obtained
with a deterministic analysis, published by Wang
(2000).
A number of simulations with triangular pdfs were
completed, starting for a whole set of symmetrical
pdfs for all input parameters and continuing with
various combinations of skewed pdfs for the different
parameters. However, it was found that the relative
contributions to variance differ insignificantly as a
result of these choices. It might be that the shape of
the resulting pdf for the predicted seismic monitor
could change, but from the point of view of uncer-
tainty propagation, all the results fall within sampling
error.
3.1. Correlated random variables
For the results in this section, MC simulations were
carried out considering correlations among certain
parameters, such that the outcomes of / and Kgr con-
ditioned the sampling of Kd and Gd, and vice versa.
Fig. 4a–c show results for the case of the shaly
sandstone. Three correlation values were used: 0.8
e input parameters (10% of the mean value for each parameter).

F.A.V. Artola, V. Alvarado / Journal of Applied Geophysics 59 (2006) 47–62 55
(3a), 0.9 (3b) and 1.0 (3c), being negative with respect
to porosity and positive in terms of grain bulk mod-
ulus. As in the uncorrelated simulations, qgr, Gd and
Kd are still the most contributing parameters to the
variance of Vp. As opposed to uncorrelated cases,
though, the remaining parameters gain importance,
even exhibiting roughly the same order of importance,
0 5 10 15 20 25 30 35 40 45
Measured by contribut
Vp1
Vs1
Bulk(gr)
density(fl2)
density(fl1)
Bulk(fl2)
Bulk dens1
Bulk(fl1)
Porosity
0 5 10 15 20 25 30 35 40 45
Measured by contribut
Vp1
Vs1
Bulk(gr)
Porosity
density(fl1)
Bulk dens1
Bulk(fl1)
Bulk(fl2)
density(fl2)
a
b
Fig. 6. Contributions to the variance of Vp2 for a clean sandstone from un
Injection fluid: Water. (b) Connate fluid:Oil, Injection fluid:Water, (c) Con
with their contributions increasing with higher corre-
lation. This result should be expected because the
correlations included Kd and Gd, which are two of
the most relevant parameters. Similar results were
observed for clean sandstones.
We also evaluated the combined effect of asymme-
trical pdfs with correlation. However, it seems that the
50 55 60 65 70 75 80 85 90 95 100
ion to variance of Vp2 (%)
0.1
0.15
0.2
0.25
0.3
Oil/water
50 55 60 65 70 75 80 85 90 95 100
ion to variance of Vp2 (%)
0.1
0.15
0.2
0.25
0.3
Water/gas
certainties associated with input parameters. (a) Connate fluid:Gas/
nate fluid:Oil, Injection fluid:Gas.

0 5 10 15 20 25 30 35 40 45 50 55 60 65 70 75 80 85 90 95 100
Measured by contribution to variance of Vp2 (%)
Vp1
Vs1
Bulk(gr)
Porosity
density(fl1)
Bulk dens1
Bulk(fl1)
density(fl2)
Bulk(fl2)
0.1
0.15
0.2
0.25
0.3
Oil/Gas
c
Fig. 6 (continued).
F.A.V. Artola, V. Alvarado / Journal of Applied Geophysics 59 (2006) 47–6256
yield is mostly a result of correlations, exhibiting very
similar behavior as that shown in Fig. 4.
4. Fluid substitution effects
Now, let us consider a rock initially saturated with
fluid 1, whether partially or completely. For this con-
dition, there is a number of rock and fluid properties
associated that lead to an initial velocity Vp1. For the
prediction of the wave velocity (Vp2) at a synthetic
monitor, after a fluid substitution with fluid 2, a total
of nine parameters are required. These parameters
consist of Vp1, Vs1, Kgr, /, qfl1, qfl2, Kfl1, Kfl2 and
qb (initial bulk density). Upon simple manipulation of
Gassmann equations, an equation for Vp2 is obtained:
Vp2 ¼J
qb2
� �1=2
ð4Þ
where:
J ¼ K0
1� a�1þ 4
3V 2s1qb1
;
qb2¼ qb1
þ / qfl2� qfl1
� �;
and,
a ¼qb1
V 2p1 �
4
3V 2s1
� �
qb1V 2p1 �
4
3V 2s1
� �� Kgr
� Kfl1
/ Kfl1 � Kgr
� �
þ Kfl2
/ Kfl2 � Kgr
� � :
As before, provided that some of the input para-
meters in Eq. (4) are random variables, Vp2 is given by
a pdf. For instance, Fig. 5 shows a MC simulation
result for Vp2.
In the present scheme of fluid substitution, Vp1,
Vs1 and Kgr contribute the most to the variance of
Vp2, in decreasing order of importance. The result
holds for both clean and shaly sandstones (see Figs.
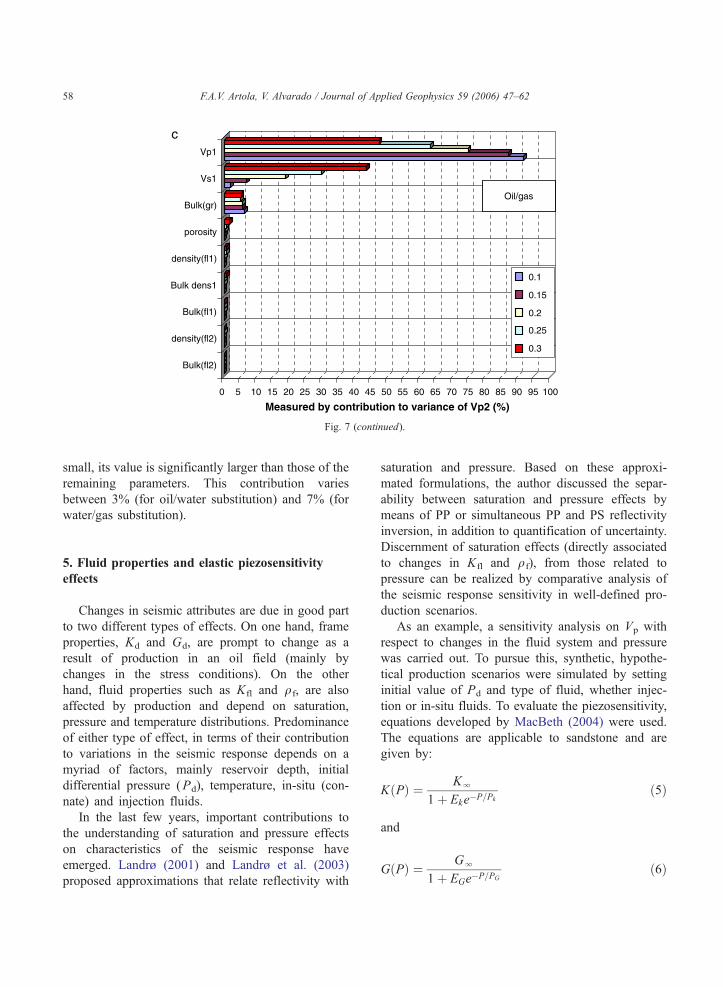
6a–c and 7a–c). It is clear that the type of substitu-
tion event (water/gas, oil/water, oil/gas) and the
mean value of porosity impact considerably the var-
iance of Vp2.
The contribution to uncertainty in Vp2 coming
from Vp1 is larger than that originated from Vs1,
except when the value of porosity is high (0.3) and
F.A.V. Artola, V. Alvarado / Journal of Applied Geophysics 59 (2006) 47–62 57
gas is substituted with water. In this latter case, Vs1
is a greater contributing source of uncertainty than
Vp1, for both clean and shaly sandstone. In general,
for all types of fluid substitution considered here,
contributions to the uncertainty of Vp2 coming from
Vp1 grow as porosity decreases. The opposite occurs
with Vs1, since its contribution positively relates to
porosity.
0 5 10 15 20 25 30 35 40 45
Measured by contribu
Vp1
Vs1
Bulk(gr)
bulk dens1
Porosity
density(fl1)
Bulk(fl2)
density(fl2)
Bulk(fl1)
0 5 10 15 20 25 30 35 40 45
Measured by contribu
Vp1
Vs1
Bulk(gr)
density(fl1)
density(fl2)
Bulk(fl2)
Porosity
Bulk(fl1)
Bulk dens1
a
b
Fig. 7. Contributions to the variance of Vp2 for shaly sandstone from un
Injection fluid:Water. (b) Connate fluid:Oil, Injection fluid:Water. (c) Con
For clean and shaly sandstones, contributions to
uncertainty of Vp2 are decreasingly important for oil/
water, oil/gas, and water/gas substitution process,
respectively, for the whole range of porosity values
tested in this work. On the other hand, the contribu-
tions from Vs1 come first for water/gas substitution,
then oil/gas case and finally oil/water. For Kgr,
although its contribution to the predicted Vp2 stays
50 55 60 65 70 75 80 85 90 95 100
tion to variance of Vp2 (%)
0.1
0.15
0.2
0.25
0.3
50 55 60 65 70 75 80 85 90 95 100
tion to variance of Vp2 (%)
0. 1
0.15
0. 2
0.25
0. 3
Water/gas
Oil/water
certainties associates with input parameters. (a) Connate fluid:Gas,
nate fluid:Oil, Injection fluid:Gas.
0 5 10 15 20 25 30 35 40 45 50 55 60 65 70 75 80 85 90 95 100
Measured by contribution to variance of Vp2 (%)
Vp1
Vs1
Bulk(gr)
porosity
density(fl1)
Bulk dens1
Bulk(fl1)
density(fl2)
Bulk(fl2)
0.1
0.15
0.2
0.25
0.3
Oil/gas
c
Fig. 7 (continued).
F.A.V. Artola, V. Alvarado / Journal of Applied Geophysics 59 (2006) 47–6258
small, its value is significantly larger than those of the
remaining parameters. This contribution varies
between 3% (for oil/water substitution) and 7% (for
water/gas substitution).
5. Fluid properties and elastic piezosensitivity
effects
Changes in seismic attributes are due in good part
to two different types of effects. On one hand, frame
properties, Kd and Gd, are prompt to change as a
result of production in an oil field (mainly by
changes in the stress conditions). On the other
hand, fluid properties such as Kfl and qf, are also
affected by production and depend on saturation,
pressure and temperature distributions. Predominance
of either type of effect, in terms of their contribution
to variations in the seismic response depends on a
myriad of factors, mainly reservoir depth, initial
differential pressure (Pd), temperature, in-situ (con-
nate) and injection fluids.
In the last few years, important contributions to
the understanding of saturation and pressure effects
on characteristics of the seismic response have
emerged. Landrø (2001) and Landrø et al. (2003)
proposed approximations that relate reflectivity with
saturation and pressure. Based on these approxi-
mated formulations, the author discussed the separ-
ability between saturation and pressure effects by
means of PP or simultaneous PP and PS reflectivity
inversion, in addition to quantification of uncertainty.
Discernment of saturation effects (directly associated
to changes in Kfl and qf), from those related to
pressure can be realized by comparative analysis of
the seismic response sensitivity in well-defined pro-
duction scenarios.
As an example, a sensitivity analysis on Vp with
respect to changes in the fluid system and pressure
was carried out. To pursue this, synthetic, hypothe-
tical production scenarios were simulated by setting
initial value of Pd and type of fluid, whether injec-
tion or in-situ fluids. To evaluate the piezosensitivity,
equations developed by MacBeth (2004) were used.
The equations are applicable to sandstone and are
given by:
K Pð Þ ¼ Kl
1þ Eke�P=Pkð5Þ
and
G Pð Þ ¼ Gl
1þ EGe�P=PGð6Þ

Table 1
Fluid properties used in modeling of seismic velocities
Fluid substitution type Bulk modulus
(Gpa)
Density (gr/cm3)
Heavy oil (API=15)/water 1.7856–2.25 0.965–1
Medium oil (API=30)/water 1.338–2.25 0.876–1
Light oil (API=45)/water 1.1106–2.25 0.80–1
Heavy oil (API=15)/gas 1.7856–0.0404 0.9665–0.126
Medium oil (API=30)/gas 1.3338–0.0404 0.876–0.126
Light Oil (API=45)/Gas 1.1106–0.0404 0.80–0.126
0 20 40 60 80 100
0 20 40 60 80 100
Measured by contribution to variance of Vp (%)
10MPa
30MPa
50MPa
70MPa
Init
ial d
iffe
ren
tial
pre
ssu
re
Measured by contribution to variance of Vp (%)
10MPa
30MPa
50MPa
70MPaInit
ial d
iffe
ren
tial
pre
ssu
re
PdBulk(fl)density(fl)
0 20 40 60 80 100
Measured by contribution to variance of Vp (%)
10MPa
30MPa
50MPa
70MPaInit
ial d
iffe
ren
tial
pre
ssu
re
a
b
c
Pd
Bulk(fl)
density(fl)
PdBulk(fl)density(fl)
Fig. 8. Contributions of the density and bulk modulus of the fluid
system variability and pore pressure disturbance. (a) Connate
fluid:Heavy Oil, Injection fluid:Water. (b) Connate fluid:Medium
oil, Injection fluid:Water. (c) Connate fluid: Light oil, Injection
fluid:Water.
F.A.V. Artola, V. Alvarado / Journal of Applied Geophysics 59 (2006) 47–62 59
where,
Ek ¼Kl � K 0ð Þ
K 0ð Þ ¼ Sk
1� Skð7Þ
EG ¼Gl � G 0ð Þ
G 0ð Þ ¼ SG
1� SG: ð8Þ
Kl and Gl represent asymptotes for high pres-
sures associated with elastic moduli; PK and PG are
the characteristic pressure constants that define the
rollover point, beyond which the rock frame
becomes relatively insensitive to pressure and SKand SG represent likely overall possible variation
in K and G. The experiment is performed using
the following parameter values: / =0.19, Kl=25.77,
Gl=14.44, SK=0.64, SG=0.59, PK =12.73 and
PG =11.0 (MacBeth, 2004). Here, we evaluate the
effect of a small perturbation (4 Mpa) in the pore
pressure on velocity for initial Pd of 10, 30, 50 and
70 Mpa, when the in-situ fluids are heavy, medium and
light oil and injection fluids are either water or gas. For
these isothermal production scenarios, we evaluate
contributions to variations of the pore pressure and
possible changes in the bulk modulus of the fluid
system and density. The evaluation is carried out for
the whole range of the parameters that characterize the
fluid system. For the simulated scenarios, the bulk
modulus and density of the system can vary within
intervals, as shown in Table 1.
For each system, the degrees of freedom for Kfl
and qfl are treated in terms of uncertainty and can be
introduced into Gassmann equation in the form of a
pdf. Similarly, a pore pressure perturbation can be
introduced as a pdf.

0 20 40 60 80 100
Measured by contribution to variance of Vp (%)
0 20 40 60 80 100
Measured by contribution to variance of Vp (%)
0 20 40 60 80 100Measured by contribution to variance of Vp (%)
10MPa
30MPa
50MPa
70MPaInit
ial d
iffe
ren
tial
pre
ssu
re
PdBulk(fl)density(fl)
10MPa
30MPa
50MPa
70MPaInit
ial d
iffe
ren
tial
pre
ssu
re
Pd
Bulk(fl)
density(fl)
10MPa
30MPa
50MPa
70MPaInit
ial d
iffe
ren
tial
pre
ssu
re
Pd
Bulk(fl)
density(fl)
a
b
c
Fig. 9. Contribution of density and bulk modulus of the fluid system
variability and pore pressure disturbance. (a) Connate fluid:Heavy
oil, Injection fluid:Gas. (b) Connate fluid:Medium oil, Injection
fluid:Gas. (c) Connate fluid:Light oil, Injection fluid:Gas.
F.A.V. Artola, V. Alvarado / Journal of Applied Geophysics 59 (2006) 47–6260
Fig. 8a–c show contributions of Kfl, qfl and Kd to
the variance of Vp for the scenario where the con-
nate fluid is heavy, medium or light oil and the
injected fluid is water. Note that the contribution
from pressure decreases not only with the initial
Pd, but also with the API gravity of the connate
fluid. The latter means that the contribution is great-
est for heavy oil, followed by a medium oil and the
least for light one. Contributions from Kfl and qfl
grow with initial Pd. For Pdb30 Mpa, the contribu-
tion from density is small when compared to the
more significant contribution from Kfl. Contributions
from qfl increase with decreasing API gravity of the
in-situ fluid.
Fig. 9a–c also depict contributions from Kfl, qfl
and Kd on the variance of Vp, but now the injection
fluid is gas. It can be seen that Pd contributions
decrease with the effective initial pressure and grow
with decreasing API gravity of the connate fluid. As
opposed to the case where water is used as the
injection fluid, for gas injection, contributions
from Kfl decrease with depth. In general, it holds
that for high Pd values, contributions to the variance
of Vp, being more predominant for gas as compared
to water injection. On the other hand, for gas
injection, qfl contributions are markedly dominant.
In general, contributions from the variability of
density can be dramatically larger on the variance
of Vp, when the injection fluid is gas as compared
to water injection.
6. Conclusions
We evaluated the effect of uncertainty of the reser-
voir rock properties on the seismic response (com-
pressional velocity) in a Monte Carlo simulation
framework. First, simulation results for Gassmann
equations showed that the variance of the compres-
sional velocity (Vp) turns out to be more sensitive to
uncertainties in grain density (qgr), shear (Gd) and
bulk (Kd) moduli, in decreasing order of contribution.
The remaining parameters contribute negligibly for
uncorrelated simulations. However, the existence of
physical correlations among some input parameters,
when represented as correlated Monte Carlo sampling,
makes more even the contributions to variance. Our
results for asymmetric triangular distributions indicate
F.A.V. Artola, V. Alvarado / Journal of Applied Geophysics 59 (2006) 47–62 61
that in terms of relative contributions to monitor vari-
ables in Gassmann equations, the effect of skewness is
negligible.
When fluid substitution is carried out, the uncer-
tainties associated with the compressional and shear
velocities and grain bulk modulus contribute the
most to the variance of Vp2. This was demonstrated
only for uncorrelated input parameters. The remain-
ing input parameters yielded insignificant contribu-
tions to variance.
On the other hand, we compared the effect of the
fluid properties variability with rock frame piezosen-
sitivity on the variance of the compressional velocity.
This comparison was performed for various initial
differential pressures and several scenarios of connate
and injection fluids. Results show that the sensitivity
of Vp depends not only on the initial differential
pressure and burial depth, but also on the type of
connate and injection fluids involved in the fluid
substitution process.
We conclude that sensitivity information can be
used as a tool to improve feasibility studies in time-
lapse seismic reservoir monitoring and as a priori
qualitative knowledge. The latter can guide the inver-
sion process or help to diminish the uncertainties due
to poorly constrained inversion schemes.
Acknowledgements
We would like to thank Prof. Sergio Fontoura,
Coordinator of the Petroleum Engineering and Tech-
nology Group (GTEP), for encouragement and sup-
port to develop this work. We are indebted to the
referee for suggestions that when incorporated,
improved the structure of the manuscript and helped
to contextualize the presented analysis. Acknowl-
edgements are due to PETROBRAS Advanced Oil
Recovery Program (PRAVAP19) and to the Brazilian
National Petroleum Agency (ANP) for financial sup-
port through the human resources program PRH-7.
References
Aanonsen, S.I., Aavatsmark, I., Barkve, T., Cominelli, A., Gonard,
R., Gosselin, O., Kolasinski, M., Reme, H., 2003. Effect of scale
dependent data correlations in an integrated history matching
loop combining production data and 4D seismic data. Paper SPE
79665, Presented at the SPE Reservoir Simulation Symposium,
Houston, Texas.
Batzle, M.L., De-hua, H., 2004. Gassmann’s equations and
fluid saturation effects on seismic velocities. Geophysics
69, 398–405.
Batzle, M.L., Wang, Z., 1992. Seismic properties of pore fluids.
Geophysics 57, 1396–1408.
Behrens, R., Condon, P., Haworth, W., Bergeron, M., Wang, W.,
Ecker, C., 2002. 4D seismic monitoring of water influx at
Bay Marchand: the practical use of 4D in an imperfect
word. SPE Reservoir Evaluation and Engineering, 410–420
October.
Brown, R.J.S., Korringa, J., 1975. On the dependence of the elastic
properties of a porous rock on compressibility of a pore fluid.
Geophysics 40, 608–616.
Evans, J.R., Olson, D.L., 2002. Introduction to Simulation and Risk
Analysis. Prentice Hall, New Jersey.
Falcone, G., Gosselin, O., Maire, F., Marrauld, J., Zhakupov,
M., 2004. Petroelastic modelling as key element of 4D
history matching: a field example. SPE 90466, Presented at
the SPE Annual Technical Conference and Exhibition, Houston,
Texas.
Gassmann, F., 1951. Uber die elastizitat poroser medien. Viertel-
jahresschrift der Naturforschenden Gesellschaft in Zurich 96,
1–23.
Gosselin, O., Aanonsen, S.I., Aavatsmark, I., Cominelli, A.,
Gonard, R., Kolasinski, M., Ferdinandi, F., Kovacic, L., Neylon,
K., 2003. History matching Using Time-lapse Seismic. Paper
SPE 84464, Presented at the SPE Annual Technical Conference
and Exhibition, Denver, Colorado.
Landrø, M., 2001. Discrimination between pressure and fluid
saturation changes from time-lapse seismic data. Geophysics
66, 836–844.
Landrø, M., 2002. Uncertainties in quantitative time-lapse seismic
analysis. Geophysical Prospecting 50, 527–538.
Landrø, M., Veire, H.H., Duffaut, K., Najjar, N., 2003. Discrimina-
tion between pressure and fluid saturation changes from marine
multicomponent time-lapse seismic data. Geophysics 68,
1592–1599.
Lumey, D.E., Behrens, R.A., 1998. Practical issues of 4D seismic
reservoir monitoring: what an engineer needs to know. SPE
Reservoir Evaluation and Engineering, 528–538 December.
Lumey, D.E., Behrens, R.A., Wang, Z., 1997. Assessing the
technical risk of a 4-D seismic project. The Leading Edge
16, 1287–1292.
MacBeth, C., 2004. A classification for the pressure-sensitivity
properties of a sandstone rock frame. Geophysics 62, 497–510.
Mavko, G., Mukerji, T., 1998. Bounds on low-frequency
seismic velocities in partially saturated rocks. Geophysics
63, 918–924.
Nolen-Hoeksema, R.C., 2000. Modulus-porosity relations, Gass-
mann’s equations, and the low-frequency elastic-wave response
to fluids. Geophysics 65, 1355–1363.
Sengupta, M., Mavko, G., 1999. Sensitivity analysis of seismic fluid
detection: expanded abstracts. 69th Ann. Int. Meeting, Soc. Exp.
Geophys, pp. 180–183.
F.A.V. Artola, V. Alvarado / Journal of Applied Geophysics 59 (2006) 47–6262
Sengupta, M., Rai, C., Sondergeld, C., 1998. Sensitivity studies in
forward AVO modeling: expanded abstracts. 68th Ann. Int.
Meeting, Soc. Exp. Geophys, pp. 204–207.
Shapiro, S.A., 2003. Elastic piezosensitivity of porous and fractures
rocks. Geophysics 68, 482–486.
Vernik, L., 1998. Acoustic velocity and porosity systematics in
siliciclastics. The Log Analyst, 27–35.
Wang, Z., 2000. The Gassmann Equation revisited: comparing
laboratory data with Gassmann’s predictions. Geophys (Reprint
series, SEG, Seismic and Acoustic velocities in reservoir rocks,
vol. 3).
Related Documents