Sensitivity analysis methods for identifying influential parameters in a problem with a large number of random variables S. Mohantyl& R, Code112 ‘Center for Nuclear Waste Regulato~ Analyses, SWH, Texas, USA 2U.S. Nuclear Regulatory Commission, Washington D. C., USA Abstract This paper compares the ranking of the ten most influential variables among a possible 330 variables for a model describing the performance of a repository for radioactive waste, using a variety of statistical and non-statistical sensitivity analysis methods. Results from the methods demonstrate substantial dissimilarities in the ranks of the most important variables. However, using a composite scoring system, several important variables appear to have been captured successfully. 1 Introduction Computer models increasingly are being used to simulate the behavior of complex systems, many of which are based on input variables with large uncertainties. Sensitivity analysis can be used to investigate the model response to these uncertain input variables. Such studies are particularly usefhl to identify the most influential variables affecting model output and to determine the variation in model output that can be explained by these variables. A sensitive variable is one that produces a relatively large change in model response for a unit change in its value. The goal of the sensitivity analyses presented in this paper is to find the variables to which model response shows the most sensitivity. There are a large variety of sensitivity analysis methods, each with its own strengths and weaknesses, and no method clearly stands out as the best. In this paper, we have picked ten different methods and have applied these methods to a high-level waste repository model, which is characterized by a large number (up to 330) of © 2002 WIT Press, Ashurst Lodge, Southampton, SO40 7AA, UK. All rights reserved. Web: www.witpress.com Email [email protected] Paper from: Risk Analysis III, CA Brebbia (Editor). ISBN 1-85312-915-1

Welcome message from author
This document is posted to help you gain knowledge. Please leave a comment to let me know what you think about it! Share it to your friends and learn new things together.
Transcript
Sensitivity analysis methods for identifyinginfluential parameters in a problem with alarge number of random variables
S. Mohantyl& R, Code112‘Center for Nuclear Waste Regulato~ Analyses, SWH, Texas, USA2U.S. Nuclear Regulatory Commission, Washington D. C., USA
Abstract
This paper compares the ranking of the ten most influential variables among apossible 330 variables for a model describing the performance of a repository forradioactive waste, using a variety of statistical and non-statistical sensitivityanalysis methods. Results from the methods demonstrate substantial dissimilaritiesin the ranks of the most important variables. However, using a composite scoring
system, several important variables appear to have been captured successfully.
1 Introduction
Computer models increasingly are being used to simulate the behavior of complexsystems, many of which are based on input variables with large uncertainties.Sensitivity analysis can be used to investigate the model response to these uncertaininput variables. Such studies are particularly usefhl to identify the most influentialvariables affecting model output and to determine the variation in model output thatcan be explained by these variables.
A sensitive variable is one that produces a relatively large change in model responsefor a unit change in its value. The goal of the sensitivity analyses presented in thispaper is to find the variables to which model response shows the most sensitivity.
There are a large variety of sensitivity analysis methods, each with its own strengthsand weaknesses, and no method clearly stands out as the best. In this paper, wehave picked ten different methods and have applied these methods to a high-levelwaste repository model, which is characterized by a large number (up to 330) of
© 2002 WIT Press, Ashurst Lodge, Southampton, SO40 7AA, UK. All rights reserved.Web: www.witpress.com Email [email protected] from: Risk Analysis III, CA Brebbia (Editor).ISBN 1-85312-915-1
364 Risk Analysis III
variables, to identify influential input variables. We have then used a compositescoring method to determine final influential variables.
2 Sensitivity analysis techniques
For the purposes of this paper, we divide sensitivity methods into two types;statistical and nonstatistical methods, Statistical techniques used herein rely onresults already generated using a Monte Carlo method. The Monte Carlo (or itsstratified equivalent, Latin Hypercube Sampling) method generates a series ofcalculations (called realizations) of the possible states for the systep choosingvalues for the input variables from their probability distributions. Nonstatisticalmethods also account for the input variable distributions, but sampling is done in
a non-random or deterministic way. In the statistical methods no new calculationsare performed using the model that relate input and output variables, whereas thenonstatistical methods need model calculation as a part of the sensitivity analysiscalculations.
The response of the system is denoted as y, which is generally a fimction ofvariables, xi; deterministic variables, dk; and model assumptions, am. The systemresponse for thejth realization is
Yj = f (xl,j Jx2,j~’’ ”)xi,j~”””~ xl,j, dk, am) (1)
where 1 is the total number of sampled variables in the model, k is the number ofdeterministic variables and m is the number of model assumptions. It is assumedthat the behavior of the system is simulated by appropriately sampling the randomvariables and then computing the system response for each realization of the
variable vector Xj = {xl,j,X2,,,,,,,xi,,,.,.,x1,,}, For the purposes of identi~ing
influential input variables and develop understanding of their relationship to theresponse, we do not consider the dependence ofy on deterministic variables andmodel assumptions.
2.1 Statistically based techniques
2.1.1 Linear regression on one variable
Single linear regression (i.e., regression with only the first power of a singleindependent variable), is usefil to understand the nature and strength ofrelationships between input and response variables of a model. The coefficient ofdetermination, R2, gives a quantitative measure of the correlation. Even when theresponse variable is linearly dependent on the input variable being studied,univariate linear regression of Monte Carlo results may fail to show unambiguouscorrelation because other sampled variables that affect the response are varying atthe same time. When R2 is small, it is not necessarily a good indicator of theimportance of the variable. A better indication of influence is to determine bymeans of a T-test whether the probability that the slope of the linear regression line
© 2002 WIT Press, Ashurst Lodge, Southampton, SO40 7AA, UK. All rights reserved.Web: www.witpress.com Email [email protected] from: Risk Analysis III, CA Brebbia (Editor).ISBN 1-85312-915-1
Risk Analysis III 365
is significantly different from zero [1].
The correlation between input and response variables can be enhanced bytransforming the variables. In general, variables are transformed in order to (i)eliminate dimensionality, (ii) reduce the role of the tails of the distributions, and(iii) properly scale the resulting sensitivities to the range of the input variable.
While transformations generally increase the goodness-of-fit, they may distort themeaning of the results. For example, transformations such as rank, logarithmic, andpower law applied to the response variable, frequently give unfair weight to smallresponse values, which do not affect the overall results as much as the largeresponse values. If the mean response is a desirable quantity, regression resultsbased on transformed variables should be used cautiously.
2.1.2 Multiple linear regression
Multiple linear regression determines the most influential input variables accordingto how much each input variable reduces the residual sum of squares (RSS) [2]. Theform of the regression equation is
y = H’zlxl+1’rz2x2+O..+lnnxn +b (2)
where y is the dependent variable, xi are independent variables (could be raw,transformed, or rank variables), mi are regression coefficients, and b is theintercept. The regression coefficient, which is the partial derivative of thedependent variable with respect to each of the independent variables, is a measureof linear sensitivity of y to input xi [3]. The stepwise algorithm calculates thereduction in RSS for the independent variables in the order that gives the greatestreduction frost, In the implementation of the procedure, a multiple linear regressionmodel is fitted to the data in an iterative fashion. The procedure starts with thevariable, xi, that explains most of the variation in the model response, y. Then itadds additional variables, one at a time in order of their influence on the response,to maximize the improvement in fit of the model.
2.1.3 The Kolmogorov-Smirnov (K-S) test
The K-S test is nonparametric, i.e., a statistical test that does not require specificassumptions about the probability distributions of the data [4]. Probabilitydistributions of a subset of each input variable corresponding to the highest outputvalues (e.g., top 10 percent) are compared to the theoretical (i.e., true) distributionof that input variable, If the two distributions are equivalent, then the response isnot sensitive to the input variable in question. Conversely, if the distributions aredifferent, then the variable in question does have an effect on response. For the
present study, there are 4,000 LHS vectors in the entire set, which is also taken asthe theoretical distribution, The subset consists of the 400 vectors with the highestresponses. The significance of the K-S test was determined at the 95-percentconfidence level.
© 2002 WIT Press, Ashurst Lodge, Southampton, SO40 7AA, UK. All rights reserved.Web: www.witpress.com Email [email protected] from: Risk Analysis III, CA Brebbia (Editor).ISBN 1-85312-915-1
Sfjfj Risk Analysis III
2.1.4 The sign test
The Sign test is also nonparametric. In the Sign test, each observation of the inputvariable is represented by either a plus sign (+) or a minus sign (–) depending onif it is greater than or less than the median value of the theoretical distribution. Theranking is applied to a subset of the input variable values corresponding to thelargest 10% of the calculated responses. The ratio of the number of pluses andminuses for each input variable is then tested for significance at the 95-percentconfidence level [5].
2.1.5 Parameter tree method
The parameter tree method evaluates sensitivity of an individual or a group of input
variables by partitioning the Monte Carlo results and the input variables [6]. A tree
structure develops by partitioning input variable space into bins, each forming a
branch of the tree based on a partitioning criterion similar to an event tree, The
simplest branching criterion is a classification based on variable magnitude that
treats sampled input values as either a + or a – , depending on whether the
sampled value is greater or less than the branching criterion value, e.g., the median.For example, realizations with all five influential input variables in a subgroup of
five influential variables sampled above the median would be placed in the same
bin. Similarly, all realizations where the first four influential variables are a + and
the last one is a – would be placed in another bin and so on.
Let the number of realizations associated with the two branches be N]+ and N1_.
Next, the response variable is examined for realization associated with each branch
of the tree. The number of realizations withy greater than a partition criterion (e.g.,
mean) is counted for both the branches. Let these numbers be Ll+ (L1+<N1+)and,LI. (,L1-SN1.). The difference between .L1, / Nl+ and L1_ / N1_ is a measure of
sensitivity of y to X1.The procedure is repeated in each of these two subsets with
the next influential variable to be considered and so on until each of the influentialvariables is considered. Note that, in this approach, the selection of the second
variable is dependent on the first and so on.
While the parameter tree method is useful for dealing with a subgroup of variables,
it is limited to determining a relatively small number of significant variables
because at each new branch of the tree, the number of realizations available for
analysis decreases on average by half.
2,2 Deterministic methods
2.2.1 Differential analysis technique
In the differential analysis technique for determining the most influential input
variables, multiple deterministic runs are made in which an input variable, xi , is
changed (one at a time) by a known amount, ~, to estimate the first derivative of
© 2002 WIT Press, Ashurst Lodge, Southampton, SO40 7AA, UK. All rights reserved.Web: www.witpress.com Email [email protected] from: Risk Analysis III, CA Brebbia (Editor).ISBN 1-85312-915-1
Risk Analysis III 367
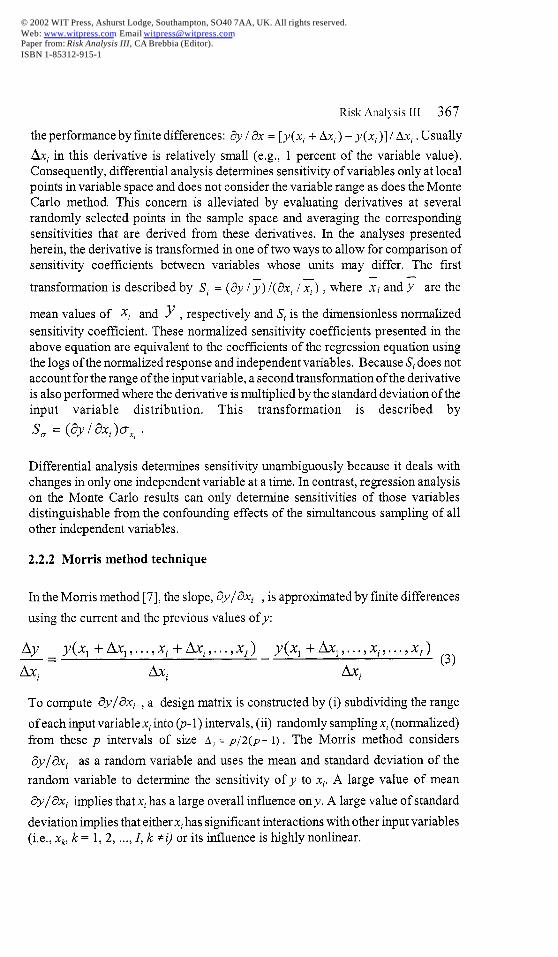
the performance by finite differences: ~y / & = [y(xi + Axi ) - y(xi )] / Axi . Usually
Axi in this derivative is relatively small (e.g., 1 percent of the variable value).Consequently, differential analysis determines sensitivity of variables only at localpoints invariable space and does not consider the variable range as does the MonteCarlo method, This concern is alleviated by evaluating derivatives at severalrandomly selected points in the sample space and averaging the correspondingsensitivities that are derived from these derivatives. In the analyses presentedherein, the derivative is transformed in one of two ways to allow for comparison ofsensitivity coefficients between variables whose units may differ. The first
transformation is described by Si = (dy / ~) /(i%i /~) , where ~i and ~ are the
mean values of ~j and ~ , respectively and Si is the dimensionless normalized
sensitivity coefficient. These normalized sensitivity coefficients presented in theabove equation are equivalent to the coefficients of the regression equation usingthe logs of the normalized response and independent variables. Because Sj does notaccount for the range of the input variable, a second transformation of the derivativeis also performed where the derivative is multiplied by the standard deviation of theinput variable distribution. This transformation is described by
so = (ay/ thi)Ox,.
Differential analysis determines sensitivity unambiguously because it deals withchanges in only one independent variable at a time. In contrast, regression analysison the Monte Carlo results can only determine sensitivities of those variablesdistinguishable from the confounding effects of the simultaneous sampling of allother independent variables.
2.2.2 Morris method technique
In the Morris method [7], the slope, O/~xi , is approximated by finite differences
using the current and the previous values of y:
Ay y(xl+A.xl,..., Xi+kti ,X1),X1) y(X1+~l,..., xi,~1),~l)—Axi = Axi Axi
(3)
To compute ~yt~xi , a design matrix is constructed by (i) subdividing the range
of each input variable xi into (’p-1) intervals, (ii) randomly sampling xi (normalized)
from these p intervals of size A, = p/w- I). The Morris method considers
@y/t?xi as a random variable and uses the mean and standard deviation of the
random variable to determine the sensitivity of y to xi. A large value of mean
t?y/~xi implies that xi has a large overall influence on y. A large value of standard
deviation implies that eitherxi has significant interactions with other input variables(i.e,, x~, k= 1,2, .... 1, k #i) or its influence is highly nonlinear.
© 2002 WIT Press, Ashurst Lodge, Southampton, SO40 7AA, UK. All rights reserved.Web: www.witpress.com Email [email protected] from: Risk Analysis III, CA Brebbia (Editor).ISBN 1-85312-915-1
sfjs Risk Analysis III
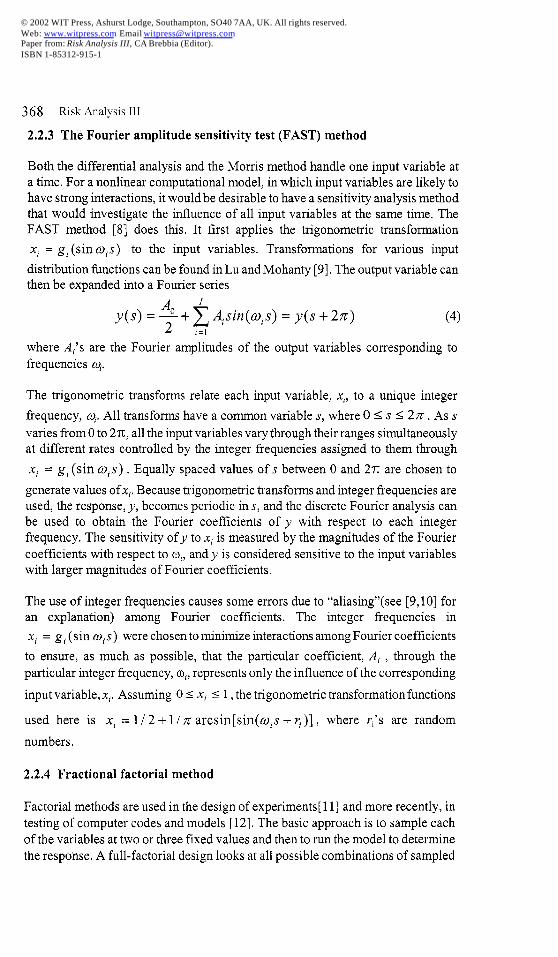
2.2,3 The Fourier amplitude sensitivity test (FAST) method
Both the differential analysis and the Morris method handle one input variable at
a time. For a nonlinear computational model, in which input variables are likely tohave strong interactions, it would be desirable to have a sensitivity analysis methodthat would investigate the influence of all input variables at the same time. TheFAST method [8] does this. It first applies the trigonometric transformation
xi = gi (sin Ois) to the input variables. Transformations for various input
distribution functions can be found in Lu and Mohanty [9]. The output variable canthen be expanded into a Fourier series
‘%y(s) = ~+ ‘f Aisin(co,,s) = y(s +27r)/=1
(4)
where Ai’s are the Fourier amplitudes of the output variables corresponding to
frequencies cq,
The trigonometric transforms relate each input variable, xi, to a unique integer
fi-equency, a+. All transforms have a common variables, where O <s < 2Z. Ass
varies from Oto 2n, all the input variables vary through their ranges simultaneouslyat different rates controlled by the integer frequencies assigned to them through
Xi= gi(sinCOiS).Equally spaced values ofs between O and 2n are chosen to
generate values ofxi, Because trigonometric transforms and integer frequencies areused, the response, y, becomes periodic ins, and the discrete Fourier analysis canbe used to obtain the Fourier coefficients of y with respect to each integerfrequency, The sensitivity of y to xi is measured by the magnitudes of the Fourier
coefficients with respect to q, and y is considered sensitive to the input variableswith larger magnitudes of Fourier coefficients.
The use of integer frequencies causes some errors due to “aliasing’’(see [9,10] foran explanation) among Fourier coefficients. The integer iiequencies in
xi = gj (sin CD(s) were chosen to minimize interactions among Fourier coefficients
to ensure, as much as possible, that the particular coefficient, Ai , through the
particular integer frequency, o+,represents only the influence of the corresponding
input variable, xi. Assuming 0s xi s 1, the trigonometric transformation functions
used here is xi = 1/ 2 + 1/ z arcsin[sin(cois + q)], where ri’s are random
numbers.
2.2.4 Fractional factorial method
Factorial methods are used in the design of experiments 11] and more recently, in
testing of computer codes and models [12]. The basic approach is to sample each
of the variables at two or three fixed values and then to run the model to determine
the response. A full-factorial design looks at all possible combinations of sampled
© 2002 WIT Press, Ashurst Lodge, Southampton, SO40 7AA, UK. All rights reserved.Web: www.witpress.com Email [email protected] from: Risk Analysis III, CA Brebbia (Editor).ISBN 1-85312-915-1
Risk halysis III 369
variables; e.g., for two values of each variable, there would have to be 2N samples,
where N is the number of variable. Since the current problem has as many as 330
sampled variables, and each run requires several minutes of computer time, a full-
factorial design is infeasible,
Fractional factorial designs require fewer than 2N runs, but at the expense of
ambiguous results. For example, a so-called “level-4” design for 330 variables
requires 2048 runs. The results from such a level-4 experimental design can yield
results for which the main effects of all variables are distinct from each other and
two-way interactions of other variables, but can be confounded by some three-way
or higher interactions of other variables. However it is possible to use other
information generated in the runs to determine in many cases if the results of the
fractional factorial design are truly measuring the response to the variable or
combinations of other variables.
In general, the fractional factorial analysis was conducted in the following steps;(1) Develop a fractional factorial design for all variables in the problem taking into
account the largest number of runs that can reasonably be handled; (2) From the
results of the preliminary screening, perform an analysis of variance (ANOVA) to
determine those variables that appear to be significant to a specified statistical
level; (3) Further screen the list of statistically significant variables on the basis of
information other than the ANOVA results; and (4) repeat the analyses with a
refined set of variables and higher-resolution designs until results are acceptably
unambiguous.
3 Test problem
The test problem is the TPA Version 4.1 Code [13] for which the most influentialinput variables are to be identified. The analyses have been conducted using thenominal case data set (i.e., includes the most likely scenario and excludes lowprobability and high consequence events), which does not include disruptive
external events. The variables sampled are the ones where a significant amount of
uncertainty remains in their value or have been shown to have potentially
significant effect on the response (output variable) in other sensitivity analyses.Out of 965 input variables, 330 input variables are sampled variables, 635 aredeterministic variables, and there are numerous model assumptions. Only a few ofthe 330 sampled variables contribute significantly to the uncertainty in response.
4 Results and analyses
This section presents the sensitivity analysis results generated using methods
described in the previous sections. The nonstatistical methods include differential
analysis, Morris method, FAST method and the fractional factorial design method.
Detailed description of the meaning of the variables and their relevance to the
performance as~essment is outside the scope of this paper.
© 2002 WIT Press, Ashurst Lodge, Southampton, SO40 7AA, UK. All rights reserved.Web: www.witpress.com Email [email protected] from: Risk Analysis III, CA Brebbia (Editor).ISBN 1-85312-915-1
3’70 Risk Analysis III
4.1 Sensitivity results from statistical methods
This section presents results from the statistical methods in two groups. The fustgroup (identified as Statistics/Regression in table 1) involves methods presented insections 2.1.1 to 2.1.4. The second group involves only the parameter tree methoddescribed in section 2.1.5.
4,1.1 Results from statistic/regression models
The sensitivity analyses conducted in this group are based on an initial screeningby statistical analysis of a 4,000-vector Monte Carlo analysis of the nominal case.The statistical tests used in the screening were (1) the K-S test; (2) the Sign tests;(3) Single-variable regression including (a) t-test on the regression of the raw dataand (b) t-test on the regression of the ranks of the data; (4) Stepwise regression of(a) raw data, (b) the ranks of the data, and (c) the logarithms of the data.
For each of the statistical tests, the resulting regression coefficients were sorted,giving the highest values the best score. Sensitivities that ranked below the 5thpercentile in terms of either a t-statistic or F-statistic, were eliminated fromconsideration. The overall score for a variable consisted of two parts; (1) thenumber of times that the variable appeared in the six tests with a finite rank (O to6), and (2) the sum of the reciprocal of the rank for the six tests. A variant of thesecond test replaced the rank with its square, but the results did not change theconclusions, The top 10 ranks from the statistical screening that combines method1 to 4 are presented in the second column of table 1.
4.1.2 Results from the parameter tree method
In the parameter tree approach, median, mean, and 90ti percentile values were
used for variable distribution for the identified influential input variables and theresponse variable. Using a median value cutoff criterion for the input and output
variables, 143 out of 4,000 realizations had all 5 of the influential variables with
values above the median. Of these 143 realizations, 128 had responses above the
median value for all 4,000 realizations. These 143 realizations accounted for 24
percent of the population mean of responses, The number of variables that can be
captured by this method is limited by the number of realizations because each new
branch of the tree cuts the number of samples by approximately half.
4.2 Sensitivity from nonstatistical methods
4.2.1 Results from differential analyses
Seven baseline values were randomly sampled for each of the 330 variables aroundwhich values were perturbed. Perturbations (+10/0 of the baseline or local value) tothe variables in these random sets were selected so that the variable values were
© 2002 WIT Press, Ashurst Lodge, Southampton, SO40 7AA, UK. All rights reserved.Web: www.witpress.com Email [email protected] from: Risk Analysis III, CA Brebbia (Editor).ISBN 1-85312-915-1
Risk Analysis III 371
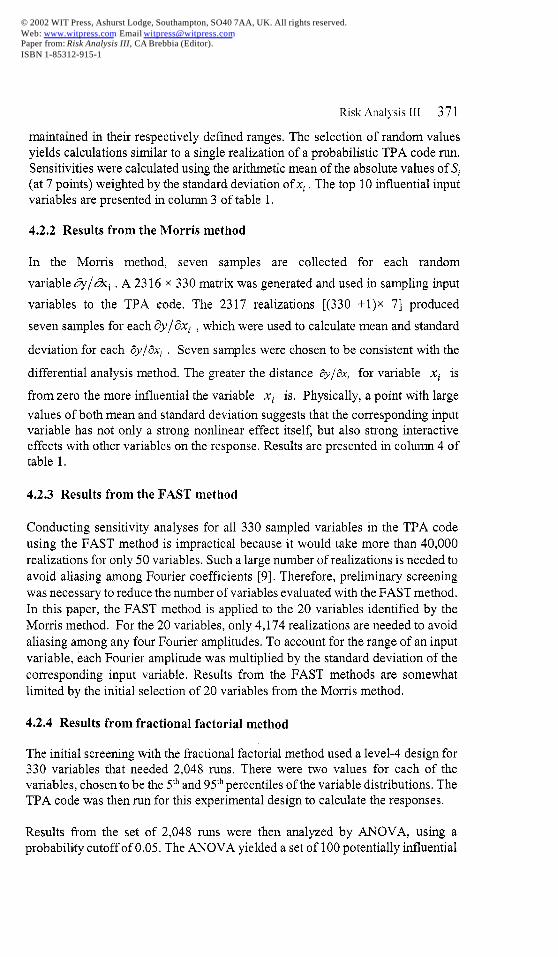
maintained in their respectively defined ranges. The selection of random valuesyields calculations similar to a single realization of a probabilistic TPA code run,Sensitivities were calculated using the arithmetic mean of the absolute values of S,(at 7 points) weighted by the standard deviation of xi. The top 10 influential inputvariables are presented in column 3 of table 1.
4.2.2 Results from the Morris method
In the Morris method, seven samples are collected for each random
variable ~/~i . A 2316 x 330 matrix was generated and used in sampling input
variables to the TPA code. The 2317 realizations [(330 +1)x 7] produced
seven samples for each dY/dxi , which were used to calculate mean and standard
deviation for each ayi~xi . Seven samples were chosen to be consistent with the
differential analysis method. The greater the distance @/aXifor variable xi is
from zero the more influential the variable xi is. Physically, a point with large
values of both mean and standard deviation suggests that the corresponding inputvariable has not only a strong nonlinear effect itself, but also strong interactiveeffects with other variables on the response. Results are presented in column 4 oftable 1.
4.2.3 Results from the FAST method
Conducting sensitivity analyses for all 330 sampled variables in the TPA code
using the FAST method is impractical because it would take more than 40,000
realizations for only 50 variables. Such a large number of realizations is needed to
avoid aliasing among Fourier coefficients [9]. Therefore, preliminary screening
was necessary to reduce the number of variables evaluated with the FAST method,
In this paper, the FAST method is applied to the 20 variables identified by the
Morris method. For the 20 variables, only 4,174 realizations are needed to avoid
aliasing among any four Fourier amplitudes. To account for the range of an input
variable, each Fourier amplitude was multiplied by the standard deviation of the
corresponding input variable. Results from the FAST methods are somewhat
limited by the initial selection of 20 variables from the Morris method.
4.2,4 Results from fractional factorial method
The initial screening with the fractional factorial method used a level-4 design for330 variables that needed 2,048 runs. There were two values for each of thevariables, chosen to be the S’hand 95thpercentiles of the variable distributions. TheTPA code was then run for this experimental design to calculate the responses.
Results from the set of 2,048 runs were then analyzed by ANOVA, using aprobability cutoff of 0.05, The ANOVA yielded a set of 100 potentially influential
© 2002 WIT Press, Ashurst Lodge, Southampton, SO40 7AA, UK. All rights reserved.Web: www.witpress.com Email [email protected] from: Risk Analysis III, CA Brebbia (Editor).ISBN 1-85312-915-1
372 Risk Analysis III
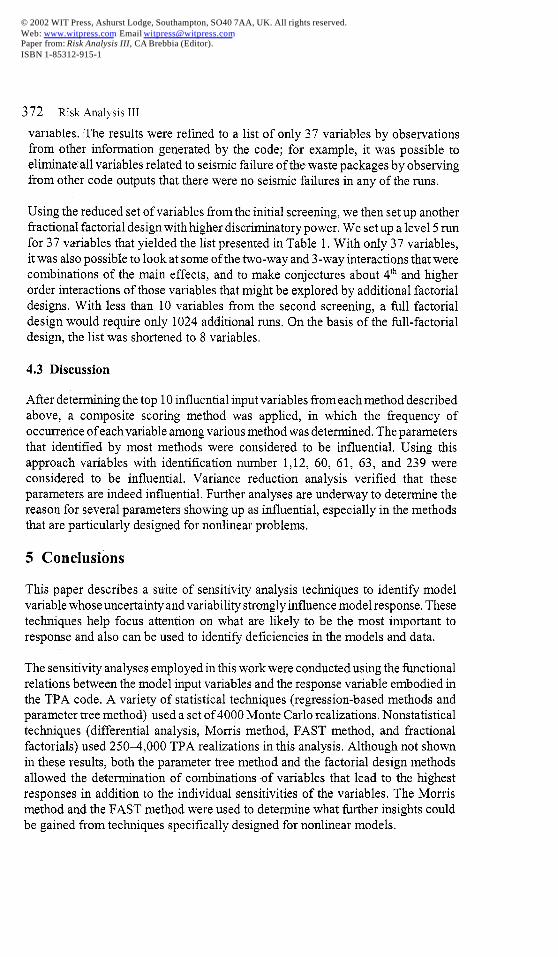
varlable$, ‘l’he results were ref-med to a list of only 37 variables by observationsfi-om other information generated by the code; for example, it was possible toeliminate all variables related to seismic failure of tha waste packages by observingfrom other code outputs that there were no seismic failures in any of the runs.
Using the reduced set of variables from the initial screening, we then setup anotherfactional factorial design with higher discriminatory power. We setup a level 5 runfor 37 variables that yielded the list presented in Table 1. With only 37 variables,it was also possible to look at some of the two-way and 3-way interactions that werecombinations of the main effects, and to make conjectures about 4th and higherorder interactions of those variables that might be explored by additional factorialdesigns. With less than 10 variables from the second screening, a fill factorialdesign would require only 1024 additional runs. On the basis of the fill-factorialdesign, the list was shortened to 8 variables.
4,3 Discussion
After deterrninin g the top 10 influential input variables from each method describedabove, a composite scoring method was applied, in which the frequency ofoccurrence of each variable among various method was determined, The parametersthat identified by most methods were considered to be influential. Using thisapproach variables with identification number 1,12, 60, 61, 63, and 239 wereconsidered to be influential. Variance reduction analysis verified that theseparameters are indeed influential. Further analyses are underway to determine thereason for several parameters showing up as influential, especially in the methodsthat are particularly designed for nonlinear problems.
5 Conclusions
This paper describes a suite of sensitivity analysis techniques to identi~ modelvariable whose uncertainty and variability strongly influence model response. Thesetechniques help focus attention on what are likely to be the most important toresponse and also can be used to identify deficiencies in the models and data.
The sensitivity analyses employed in this work were conducted using the functionalrelations between the model input variables and the response variable embodied inthe TPA code. A variety of statistical techniques (regression-based methods andparameter tree method) used a set of 4000 Monte Carlo realizations. Nonstatisticaltechniques (differential analysis, Morris method, FAST method, and fi-actionalfactorials) used 2504,000 TPA realizations in this analysis, Although not shownin these results, both the parameter tree method and the factorial design methodsallowed the determination of combinations of variables that lead to the highestresponses in addition to the individual sensitivities of the variables, The Morrismethod and the FAST method were used to determine what further insights couldbe gained from techniques specifically designed for nonlinear models.
© 2002 WIT Press, Ashurst Lodge, Southampton, SO40 7AA, UK. All rights reserved.Web: www.witpress.com Email [email protected] from: Risk Analysis III, CA Brebbia (Editor).ISBN 1-85312-915-1
Risk Analysis III 373
The analyses presented in this paper reveal major differences in results from thealternative sensitivity methods, In particular, there were large differences betweenthe FAST method and most others. Studies are underway to understand thesedifferences,
Acknowledgements
The paper was prepared to document work performed by the Center for NuclearWaste Regulatory Analyses (CNWRA) for the Nuclear Regulatory Commission(NRC) under Contract No. NRC-02-97-009, The activities reported here wereperformed on behalf of the Office of Nuclear Material Safety and Safeguards(NMSS). The paper is an independent product of the CNWRA and does notnecessarily reflect the views or regulatory position of the NRC,
References
[1]
[2]
[3]
[4]
[5]
[6]
[7]
[8]
[9]
[10]
[11]
Benjamin, J.R., and C.A. Cornell. Probability, Statistics, and Decision forCivil Engineers. New York: McGraw-Hill. 1970,Helton, J. C., J.W. Garner, R,D, McCurley, and D,K. Rudeen. Sensitivi@Analysis Techniques and Results for Performance Assessment at the WasteIsolation Pilot Plant. SAND 90-7103. Albuquerque, NM: Sandia NationalLaboratories, 1991.Draper, N. R.,and H. Smith, Jr. Applied Regression Analysis. 2ndEdition. NewYork: John Wiley and Sons, Inc. 1981.Bowen, W. M., and CA. Bennett, eds. Statistical Methods for NuclearMaterial Management. NUREG/CR-4604. Washington, DC: NuclearRegulatory Commission. 1988.Conner, W ,J., Practical Nonparameteric Statistics, John Wiley and Sons,1971.Jazemba MS, Sagar B, A Parameter Tree Approach to Estimating SystemSensitivities to Parameter Sets. Reliability Engineering and System Safety. 67,pp. 89–102. 2000.Morris, M.D. Factorial sampling plans for preliminary computationalexperiments. Technometrics 33(2): 16 1–1 74.1991,Cukier, R, I., C.M. Fortuin, K.E, Schuler, A.G. Petschek, and J.H. Schaibly.Study of the sensitivity of coupled reaction systems to uncertainties in ratecoefficients. I: Theory. Journal of Chemical Physics 59(8): 3,873–3,878,1973.Lu, Y. and S. Mohanty. Sensitivity analysis of a complex, proposed geologicwaste disposal system using the Fourier amplitude sensitivity test method.Reliability Engineering and System Safety 72(3), pp 275-291.2001.Cukier, R. I,, J,H. Schaibly, and K.E. Schuler. Study of the sensitivityof coupled reaction systems to uncertainties in rate coefficients. III: Analysisof the approximation, Journal of Chemical Physics, 63(3), pp. 1, 140–1, 149.1975,Box, G.E.P. and J.S. Hunter, “The 2k-p Fractional Factorial DesignsPart 1, 1961, republished in Technometrics, 42 (l), pp. 28-47.2000
© 2002 WIT Press, Ashurst Lodge, Southampton, SO40 7AA, UK. All rights reserved.Web: www.witpress.com Email [email protected] from: Risk Analysis III, CA Brebbia (Editor).ISBN 1-85312-915-1
374 Risk Analysis III
[12] Schmidt, S.R, and Launsby, R,G. Understanding Industrial DesignedExperiments. Colorado Springs: Air Academy Press. 1991
[13] Mohanty S, McCartin TJ (coordinators), NRC Sensitivity and UncertaintyAnalyses for a Proposed HLW Repository at Yucca Mountain, Nevada UsingTPA 3, l—Volume I: Conceptual Models and Data. NUREG–1668.Washington, DC: US Nuclear Regulatory Commission: 2001,
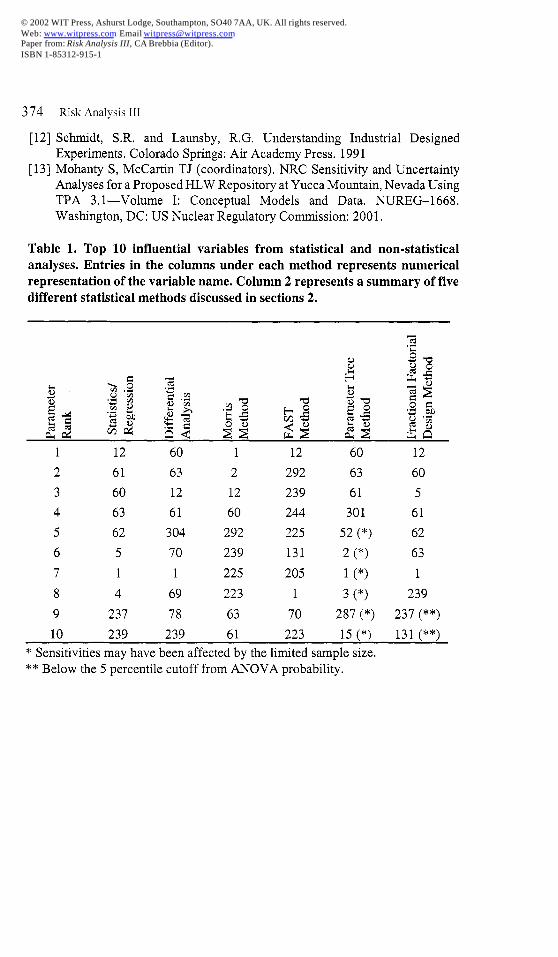
Table 1. Top 10 influential variables from statistical and non-statisticalanalyses. Entries in the columns under each method represents numericalrepresentation of the variable name. Column 2 represents a summary of five
different statistical methods discussed in sections 2.
1 12 60 1 12 60 12
2 61 63 2 292 63 60
3 60 12 12 239 61 5
4 63 61 60 244 301 61
5 62 304 292 225 52 (*) 62
6 5 70 239 131 2 (*) 63
7 1 1 225 205 1 (*) 1
8 4 69 223 1 3 (*) 239
9 237 78 63 70 287 (*) 237 (**)
10 239 239 61 223 15 (*) 131 (**)
* Sensitivities may have been affected by the limited sample size.** Below the 5 percentile cutoff from ANOVA probability,
© 2002 WIT Press, Ashurst Lodge, Southampton, SO40 7AA, UK. All rights reserved.Web: www.witpress.com Email [email protected] from: Risk Analysis III, CA Brebbia (Editor).ISBN 1-85312-915-1
Related Documents


