Gabriel Mendes Borges, IBGE * , [email protected] Sensitivity Analysis for the Brass P/F ratio method * The Brazilian Institute of Geographic and Statistics is exempt from any responsibility for the views, information, data and concepts expressed in the article, which are the sole responsibility of the authors

Welcome message from author
This document is posted to help you gain knowledge. Please leave a comment to let me know what you think about it! Share it to your friends and learn new things together.
Transcript
GabrielMendesBorges,IBGE*,[email protected]
SensitivityAnalysisfortheBrassP/Fratiomethod
*TheBrazilianInstituteofGeographicandStatisticsisexemptfromanyresponsibilityfortheviews,information,dataandconceptsexpressedinthearticle,whicharethesoleresponsibilityoftheauthors

Introduction CRVS systems are the natural data source for fertility estimation, but they suffer fromcoverageandqualityproblems,especiallyindevelopingcountries.Thismightbeduetolackofincentivestoregisterabirth,whichisaggravatedwhenthechilddiesshortlyafterbirth.Someofthebirthswouldberegisteredlate,whichcanalsoaffectfertilityestimates(Moultrie2013a).
These limitations have stimulated the development of demographicmethods for fertilityestimations,oftenbasedoncensusesandsurveys.
One of the earliest indirectmethods for fertility estimation is the own-childrenmethod,which consists of a reverse-survival technique that uses the population of children in acensustoestimatefertilityintherecentpast(GrabillandCho1965;Cho,Retherford,andChoe1986).Themainlimitationofthismethodisrelatedtotheaccuracyofthenumberofchildrenenumeratedinthecensuses,whichislikelytobeundercounted.
FertilitycanbealsoestimateddirectlythroughdatacontainingbirthhistoriescollectedinsurveyssuchastheDHS.Anotherapproach,perhapsthemostusedindevelopingcountries,combines the recent and cumulated lifetime fertility measures routinely collected incensusesandsurveys.Thesemethodsreconcileinformationfromrecentfertility,whichisoften underestimated, with the total parity by age group, which is thought to be morereliable.Thereareseveralproceduresthatusetheseidea,generallycalledP/Fratiomethods(UN1983;Moultrie2013b).ThemostcommonlyusedmethodofthiskindistheBrassP/Fratiomethod(Brass1964;UN1983;MoultrieandDorrington2008),whichwillbediscussedindetailbelow.
Demographers have estimated fertility rates by using indirect demographic techniques,primarilytheBrassP/Fratiomethod,fordecades.InBrazil,forinstance,eventhoughthelimitationsofthismethodhavebeenwidelyknown,thelackofanalternativedatasourcesand some featuresof fertility changehas led toageneral consensusthat theseestimatesreasonably describe the overall levels and trends in fertility inmany contexts (Carvalho1982;BerquóandCavenaghi2014).Morerecently,withthecontinuousdeclineoffertilitylevels and the rapid change in the age schedule, in addition to a greater availability ofalternativedatasourcesduetotheimprovementofvitalregistrationsystems,scholarshavechallengedtheresultsofthesetechniquesfortheBraziliancontext(CastanheiraandKohler2015;Carvalho,Gonçalves,andSilva2018).
Thisissueremainsunsolvedandtherehasbeensignificantdisagreementaboutthelevelsoffertility for thepast decades, particularly for subnational levels. Fertility estimates usingdifferent methods and data sources have led to different results. Indirect demographicmethods have several limitation, but CRVS systems in Brazil are also limited. Despitesubstantialimprovementsoventhelastyears,therearestillalargeproportionofbirthsthatarenotregistered,particularlyinthelessdevelopedregions,whichunderminestheirusewithoutanyadjustments.Furthermore,populationestimates require long timeseries forperiodswhenadministrativerecordswerewiselylimitedandsometimesinexistent.

PF Ratio Method As discussed above, the most commonly used indirect technique to estimate fertility incontexts of defective vital registration systems is the P/F ratio method (Moultrie andDorrington2008).ThismethodwasfirstproposedbyWilliamBrassinthe1960s,initiallyforapplicationtotheAfricanpopulations(Brass1964;BrassandCoale1968),andremainsusefulforestimatingfertilityinmanycountries.
Thebasicideaofthemethodisthat,undercertainassumptions,thenumberofchildreneverborn,orparity(𝑃"),atanexactage𝑖equalsthesumoftheperiodagespecificfertilityrates(𝐹")tothatage.Anydifferenceinthesetwomeasureswouldbeattributedtodataqualityproblems,oftenanunderreportofcurrentfertility.Theratiofortheagegroup20 − 24,forexample,givenby𝑃)*+),/𝐹)*+),,couldthenbeusedtoadjustthefertilityratesforallagesgroupsunder theassumption that current fertility isunderreportedbya constant factor(Brass1964;UN1983).
The informationused to calculate𝑃" and𝐹" comes fromquestionsasked in censusesandsurveysaboutchildreneverbornandchildrenborninthe12monthspriortothecensus.
Informationonchildreneverbornisoftencollectedbyquestionssuchas:Howmanychildrenbornalivehaveyouhad?.Thisquestionrequiresnoinformationonagesanddatessothatthere are no dating errors. On the other hand, there might be some imprecision in thenumber of children reported. It has been observed that children tend to be omitted,particularly by women aged 35 and over. Information for very young women are alsothoughttobemoresubjecttoreportingproblems(UN1983).
Currentfertilityisoftencollectedincensusesbyaskingquestionssuchas:Haveyougivenbirthtoanychildreninthepast12months?.Thisinformationisthoughttobeunderreported,presumablybecauseofamisperceptionofthereferenceperiod(BrassandCoale1968;UN1983).Thewaythisquestionisaskedhaschangedtoallowforamoreprecisemeasureofthenumberofchildrenborninthe12monthsbeforethesurveybyaskingaboutthedatethelastchildwasborn:Whatisthedateofbirthofthelastchildrenbornaliveyouhad?.Braziliancensusesimplementedthischangein1980.Infact,theestimatedadjustmentfactorforthereportedcurrentfertilitydeclinedfrom1.31to1.12between1970and1980,indicatinganimportantimprovementonthisinformation.Theadjustmentfactorsremainedsimilarforthenexttwocensuses(Carvalho,Gonçalves,andSilva2018).
Filteringthenumberofchildrenborninthelast12monthsimprovesthereportingofcurrentfertility, as this avoids the error in the reference period, but this information remainsunderreported.Onepossiblereasontothisomissionisrelatedtothesamephenomenonthatleadstoundercountofchildreninthecensuses,thatis,hardtocountareasorpopulationgroupshaveadisproportionalhighernumberofchildren.Thismayberelatedtothefindingthatnewlyformedhouseholds,whicharemorelikelytohaveyoungchildrenaremorelikelytobeomittedinthecensus.
Insummary,intheP/Fratiomethod,theagepatternofcurrentASFRobtainedfromsurveysandcensusesisacceptedandthefertilitylevelisadjustedbytheaverageparity(numberofchildreneverborn)reportedbyyoungwomen.The ideaof themethod is tocombinethe
measurements which are likely to be most reliable given the different nature of thedeficienciesinthetwosetsofinformation(Brass1964).Sincethenatureoferrorstendstobedifferent,thisproceduremayproduceplausibleestimatesevenwhenbothsetsofdataaresubjecttoerrors(BrassandCoale1968).
Themethodhasthustwomainassumptionsintermsofthequalityofthereporteddata:i)currentfertilityratesareunderreportedbyafactorthatisconstantwithage;ii)thereportednumberofchildreneverbornisreliable.
Furthermore,therearethreemainconditionsthatneedtobetrueforthemethodtobevalid:i)constantfertilityovertime;ii)fertilityofsurvivingwomanisthesameasfertilityofthosewhodied;iii)fertilityofimmigrantwomenisthesameasnon-immigrantfertility.
The𝑃/𝐹ratiosareoftencalculatedforallagegroupsbetween15and49becausethepatternoftheratiosbyagemayalsorevealdataqualityproblemsandfertilitytrends.Foradjustmentpurposes, theagegroup20 − 24 isby far themostusedand recommended,due todataquality issues for women in the extremes of the age range, in addition to attempts tominimize the effects of fertility change (Brass 1964; UN 1983;Moultrie and Dorrington2008).Thus,thispaperconcentratesontheanalysisofthe𝑃/𝐹ratiotechniqueforwomenaged20to24atthedateofthesurvey,whichwillbecalled𝑃)𝐹)1.
Toavoidconfusionwiththedefinitionofagegroups,let𝑖beaconstantrepresentingtheagetowhichthecalculationsaredoneand𝑥betheactualage.
Formally,let
𝑃"(𝑡) = 3 𝑓5"
*(𝑡 − 𝑖 + 𝑥) 𝑑𝑥
bethecumulativefertilityuptoage𝑖attime𝑡
𝐹′"(𝑡) = 3 𝑓"
*′5(𝑡) 𝑑𝑥
bethecumulativeobservedperiodfertilityuptoage𝑖attime𝑡
𝐹"(𝑡) = 3 𝑓5"
*(𝑡) 𝑑𝑥
bethecumulativetrueperiodfertilityuptoage𝑖attime𝑡
where𝑓5(𝑡)isthetrueASFRatage𝑥foryear𝑡.Inthisformulationofthemethod,theparityreportedbywomanatage𝑖incensus𝑡,𝑃"(𝑡),istakenasthesumofthetruehistoricalfertility
1Theindex2hasbeenusedtorefertothesecondagegroupofwomenatreproductiveages,thatis20 − 24(Brass1964;UN1983),butalltheresultscanbeeasilyextendedtootheragegroups.

rates for thesewoman, as the core assumption of themethod is that this information isreliable.ThecurrentASFRatage𝑥,givenbythereportedfertilityratesinthe12monthspriortothecensus𝑡,𝑓′5(𝑡),relatestothetrueASFRbyafactorPF"(𝑡)asfollows:
𝑓5(𝑡) = 𝑓′5(𝑡) × PF"(𝑡)
𝐹"(𝑡) = 𝐹′"(𝑡) × PF"(𝑡)
When𝑓′5(𝑡)isunderestimated,whichisoftenthecase,PF"(𝑡)isgreaterthanone.
For example,𝑃)=(2000) = ∫ 𝑓5)=* (1975 + 𝑥) 𝑑𝑥 is the parity, or retrospective fertility, of
women aged 25 in 2000 and𝐹′)=(2000) = ∫ 𝑓)=* ′5(2000) 𝑑𝑥 is the cumulative observed
periodfertilityuptoage25in2000.
Iftheabove-mentionedconditionsaremet,e.g.,fertilitybelowage𝑖hasbeenconstantovertime, 𝑓5(𝑡 − 𝑖 + 𝑥) = 𝑓5(𝑡). Thus,𝑃5(𝑡) = 𝐹5(𝑡) and the P/F ratio
CD(E)FD(E)
= 1. If the currentfertilityratesareomittedbyaconstantfactor,theP/Fratiowillbegreaterthan1andwillindicatetheadjustmentfactorforthecurrentfertility:
𝑃"(𝑡)𝐹′"(𝑡)
= PF"(𝑡)
Inpractice,𝑃"(𝑡)isgivenbytheaverageparityreportedinthecensusattime𝑡bywomenaged𝑖:
𝑃"(𝑡) =CEB"(𝑡)𝐾"(𝑡)
whereCEB"(𝑡)isthenumberofchildreneverborntowomenaged𝑖attime𝑡and𝐾"(𝑡)isthenumberofwomenfromtheageenumeratedinthesamecensus.
Similarly,𝐹′"(𝑡),inthediscreteformiscalculatedasasumoftheASFR,𝑓′5(𝑡),uptoage𝑖reportedinthecensusattime𝑡:
𝐹′5(𝑡) = K𝑓"
5L*
′5(𝑡)
𝑓′5(𝑡) =B5(𝑡)𝐾5(𝑡)
whereBM(𝑡) isthenumberofbirthsthe12monthsbeforethecensusattime𝑡towomenaged𝑥and𝐾5(𝑡)isthenumberofwomenaspreviouslydefined.
Whentheimplementationofthemethodisdonebyfive-yearagegroups,whichisthemostcommonapproach,andthe𝑃)𝐹) factor isused, the informationoncurrent fertilityatage20 − 24needsanadjustmenttobecompatiblewiththeaverageparityatthesameage,asCEB)*+),(𝑡)referstothecumulatedfertilityexperienceofwomenintheagegroup20 − 24attime𝑡,includingthoseinthebeginningoftheagegroup,e.g.atage20.Thus,theprocess

ofcumulatingcurrent fertilityconsidersthe fertilityof theentiregroup15 − 19andonlypartofthefertilityobservedintheagegroup20 − 24:
𝑓)*+),(𝑡) = 5𝑓N=+NO(𝑡) + 𝑘)*+),𝑓)*+),(𝑡)
where 𝑘)*+), is the multiplying factor for deriving the parity from ASFR, which alsoconsiders a half-year displacement backward in time as woman had their children, onaverage,aboutsixmonthsbeforethereportedageinthecensus.Therearemanywaystoestimate these factors. (Brass 1964)propose a model that relates the multiplying factor(𝑘)*+),)totheratiooftheASFRbetweenthefirsttwogroups:
QRSTRU(E)QVWTVX(E)
.Thebiggertheratio,theyoungerthefertilityagescheduleandthebiggertheadjustmentfactor.
Sensitivity Analysis Thissectiondevelopsananalyticalframeworktoevaluatehowresultsoftheapplicationofthemethodarebiasedwhenoneormoreconditionsofthemethodarenotmet,proposingadjustment factors to correct for these biases and to incorporate uncertainty in theestimates. Sensitivity analysis of indirect demographic methods, such as the P/F ratio,provides insightsabout the limitationsof themethodsandhowsensitive theyare to theviolationsoftheirassumptionsandassisttheestimatesofthemeasuresofuncertaintyindemographicparametersinthenextchapter.
Sensitivityanalysisisthiscontextisintendedtoevaluatehowtheresultsofacertainmethodwouldchangewhentheassumptionsarenotsatisfied.Thisprocedureisusefultoidentifythemost important assumptions required by themethods, indicating those that deservespecialattentionandthosethatarelikelytohaveonlyminorimpactinacertaincontext.
This analysis is alsouseful to propose adjustments in themethods if information on thefactorsaffectingtheresultsisavailable.Inthespecificcontextofthisdissertation,thiswillbealsousefultoallowmoreprecisepriordistributionsforthemeasuresofuncertaintyindemographicparameters.
MoultrieandDorrington(2008)conductedasensitivityanalysisof theP/Fratiomethod,evaluatingtheimpactofchangesinfertilityandmortalityontheresultingadjustmentfactorsandfertilityestimates.Theauthorsproposetheuseofsimulationstoovercometheanalyticalcomplexityofthebasicequationsofthemodel.Thesimulationswerecarriedouttomimicatypicaldemographictransitionchange,particularlyintheAfricanexperience.
TheresultsshowthattheerrorsintheP/Fratiofortheagegroup20-24arerelativelysmallinthescenariosofchangesinthefertilitylevelsandagedistributions.Formostofthetime,theerrorsareof theorderof5%orless,reachingamaximumofabout10%.Theresultsunderthesehypothesistendstooverestimatefertility.Theauthorsclaimthatinthecontextof the generally poor data in which these methods are normally applied, errors of thismagnitudearenotamajorcauseforconcern.
Simulationswerealsocarriedouttotestthesensitivityofthemethodtodifferentialfertilitybetweenbetweensurvivorsandnon-survivors.Thisisoperationalizedbytestingdifferential

fertilitybetweenHIV-infectedandHIV-uninfectedwomen,which indicates that thishasatrivialimpactonthemethods,eveninanenvironmentwithasimulatedhighlygeneralizedepidemic.Thateffectservestoattenuatetheoverestimationoftheadjustmentfactorsduetofertilitychanges,buterrorsareoftheorderofmagnitudeofonly-0.5%.
ThestudyofMoultrieandDorrington(2008)offersimportantinsightsaboutthepossiblebiasesintheP/Fratiomethods,andtheorderofmagnitudeoftheseerrors.However,sincethey are based on simulations, the results are conditioned to the specific scenariosconsideredbytheauthors.Furthermore,theyoffernopossibilitiesforadjustmentsoftheoriginalpropositionofthemethod.
Inordertoextendthisanalysistoothercontextsandallowforadjustmentsintheoriginalmethod,thissectionproposesananalyticalsensitivityframeworktakingintoconsiderationitsmainconditions.
Sections belowdevelop a sensitivity framework to the hypothesis of differential fertilitybetween survivors and non-survivors; differential fertility between migrants and non-migrants;andfertilitychange.
Mortality differential
The average parity calculated with the information of children ever born collected incensuses and surveys obviously refers to the fertility experience of the survivors of aparticularcohort.Iffemalemortalityisloworthereisnosignificantdifferenceinfertilitybetween survivors and non-survivors, then this information is a good proxy of cohortfertilityuptothatage.
Itisgenerallyassumedthattheeffectofmortalityontheaveragenumberofchildreneverbornisnegligible,mainlybecausemortalityisgenerallylowforyoungwomen(UN1983).Infact, this effect seems to be negligible even in extreme cases. As previously discussed,MoultrieandDorrington(2008)reportonlytrivialimpactofdifferentialfertilitybetweenHIV-infected and HIV-uninfected women on the method even in contexts of high HIVprevalence.
The formulationbelowofferssomeinsightsabout thereasonsmortalitymayhaveonlyaminorimpactonbiasingtheresultsofthemethod.Theresultspresentedherearesimilartothose shown by Feehan and Borges (2018) for the sensitivity framework of the siblingsurvivalmethod.
Theaverageparityofwomenatthemomentoftheinterviewobviouslyreflectsonlythosewhosurvive,andisgivenby2:
𝑃Y =CEBY
𝐾Y
2theagegroupindexisomittedinthissectionandallresultsreferstowomenaged20 −24
The same quantity can be defined for women who died, although this is unobservable,reflecting theaverageparity theywouldhavehad if theyhadsurvived to thedateof theinterview:
𝑃Z =CEBZ
𝐾Z
Now,let𝑃ZY representtheaggregateaverageparity:
𝑃ZY =CEBY + CEBZ
𝐾Y + 𝐾Z
Let
𝜋Z =CEBZ
CEBZ + CEBY
betheproportionofbirthsfromwomenwhodied
𝜋Y =CEBY
CEBZ + CEBY
betheproportionofbirthsfromwomenwhosurvived
Suppose𝑃Z and𝑃Ydifferbyafactor𝑅ZY ,for𝑅ZY > 0:
𝑅ZY =𝑃Z
𝑃Y
Based on these definitions, Feehan and Borges (2019) show that the ratio between theunobservableaverageparityofsurvivorsandnon-survivors(𝑃ZY)andtheaverageparityforthesurvivors𝑃Ycanbeexpressedas:
C^_
C_= `^_
a^b`^_(N+a^).
LetPFYbetheadjustmentfactoroftheagegroup20 − 24calculatedbytheapplicationofthe P/F ratio method and PFZY be the “true” adjustment factor that would have beenobservedifallthewomenhadsurvivedtothedateoftheinterview.SincethedenominatoroftheP/Fratioisthesame,theonlydifferencebetweenPFYandPFZY isinthenumerator(theaverageparity):𝑃Yand𝑃ZY .
Thus,theratiobetweenPFZY andPFY,whichsignalsthebiasintheP/Fratiomethodduetotheunmetconditionofequalfertilityforwomenwhodiedorsurvived,isgivenby:
cd^_
cd_= `^_
a^b`^_(N+a^).
When𝑅ZY = 1(parityofsurvivorsandnon-survivorsisequal)orwhen𝜋Z = 0(proportionofbirthsfromwomenwhodiediszero),PFZY = PFY,meaningthatthereisnobiasintheresultofthemethod.
Thisresultshowsthattwoconditionsneedtobesimultaneouslytruetotheunmetconditionofindependencebetweenfertilityandmortalityhaveanimpactontheresults:i)fertilityofwomenwhodonotsurvivetotheinterviewdifferssignificantlyfromthosewhosurvive;andii)theproportionofwomenwhodiebetweenthebeginningoftheirreproductivelivesandtheage20 − 24isconsiderable.
Sincetheseareexceptionallyrareconditionsinrealpopulations,thisissueshouldnotbeamajorcauseforconcernofresearcherswhenusingthismethod.Inanycase,researcherscaneasily use equation of sensitivity to mortality to asses the biases caused by fertilitydifferentialsinvitalstatuswiththeirowndata.
InBrazil,eveninthestatewiththehighestmortalityin1980,theprobabilityofawomandiebetween the age groups 15 − 19 and 20 − 24 was only about 1%. Even if a strongrelationshipbetweenfertilityandvitalstatusisassumed(e.g.𝑅ZY = 2),thebiaswillbeverysmall(0.5%):
cd^_
cd_= )
*.*Nb)×*.OO= 1.005.
Migration differential
Thenumberofchildreneverborncollectedinthecensuses,whichisfurthercomparedtothecurrentfertilityintheP/Fratiomethod,referstothefertilityexperienceofallpeopleenumeratedinacertaingeographicarea,includingtheimmigrants.Similarlytowhatoccurswithfertilitydifferentialsbyvitalstatus,theP/Fratiomaybebiasedifthereissignificantdifferenceinfertilitybymigrationstatus.
Toillustratethiseffect,imaginethatifimmigrantscomefromaregionwithhighadolescentfertility, theywillhave higher parity than the cumulated period fertility in the region ofdestination,andtheP/Fratiowillthenbeoverestimated.
Theaverageparityofwomenatthemomentoftheinterviewreflectsthefertilityexperienceofbothimmigrantandnon-immigrantwomen,andisgivenby:
𝑃fg =CEBfg
𝐾fg
Thesamequantifycanbedefinedfornon-immigrantandimmigrantwomenseparately:
𝑃g = hijk
lk𝑃f = hijm
lm
whereCEBrepresentsthenumberofchildreneverbornand𝐾thepopulationofwomen.The indices𝑛,𝑚and𝑚𝑛 represent thenon-immigrants, the immigrantsandbothgroupscombined,respectively.
Let
𝜋g =CEBg
CEBg + CEBf

betheproportionofbirthsfromnon-immigrantwomen.
𝜋f =CEBf
CEBf + CEBf
betheproportionofbirthsfromimmigrantwomen.
Suppose𝑃gand𝑃fdifferbyafactor𝑅fg:
𝑅fg =𝑃f
𝑃g
Followingthesameapproachusedintheprevioussection,letPFfgbetheadjustmentfactoroftheagegroup20 − 24calculatedbytheapplicationoftheBrassmethodandPFgbetheadjustment factor of the non-immigrants,whichwill bemore consistentwith the recentfertility experience of the enumerated population in a certain region. Again, since thedenominatoroftheP/Fratioisthesame,theonlydifferencebetweenPFgandPFfgisinthenumerator(theaverageparity):𝑃gand𝑃fg .
Thus,theratiobetweenPFgandPFfg ,whichindicatesthebiasintheP/Fratiomethodduetotheunmetconditionofequalfertilityaccordingtothemigrationstatus,isgivenby:
CFk
CFmk = pamb`mk(N+am)
`mk q.
When𝑅gf = 1orwhen𝜋f = 0,𝑃𝐹g = 𝑃𝐹fg,meaningthatthereisnobiasintheresultofthemethod.
Similarlytowhathappenswithmortality,thisresultshowsthattwoconditionsneedtobesimultaneouslytruetotheunmetconditionofindependencebetweenfertilityandmigrationhaveanimpactontheresults:i)fertilityofimmigrantwomendifferssignificantlyfromthenon-immigrants;andii)theproportionofbirthsfromimmigrantwomenisconsiderable.
Contrary to the mortality analysis, in which the proportion of woman who die at thebeginningofthereproductiveperiodislow,theproportionofimmigrantattheseages,whichin turn have different fertility rates, may be significant in many contexts, includingsubnationallevelsinBrazil.
ItisnotpossibletoderivefromBraziliancensusesthenumberofbirthseachwomanhadintheregionsoforiginortheregionofdestination.Inordertoapproximatethequantities𝑅fgand𝜋f,theimmigrantsaredefinedasthewomanaged20 − 24whomigratedlessthan3yearsbeforethecensusdate.Thisgroupswouldreflecttheaveragefertilityexperienceofwomanwhohadtheirchildrenoutsidetheregionofenumeration.
Some“immigrant”womancouldhavehadtheirchildrenrecentlyintheregionofdestination,aswell as the “non-immigrant” couldhave have their childrenmore than3 years ago inanother region. However, the average parity and number of births provides a goodapproximatingforillustrativepurposes.
Figure1showsthatthebiascausedbythehypothesisofmigrationishigherthanthatcausedbydifferentialfertilitybyvitalstatus,althoughitisstillrelativelylow.TheP/Fratiomethod
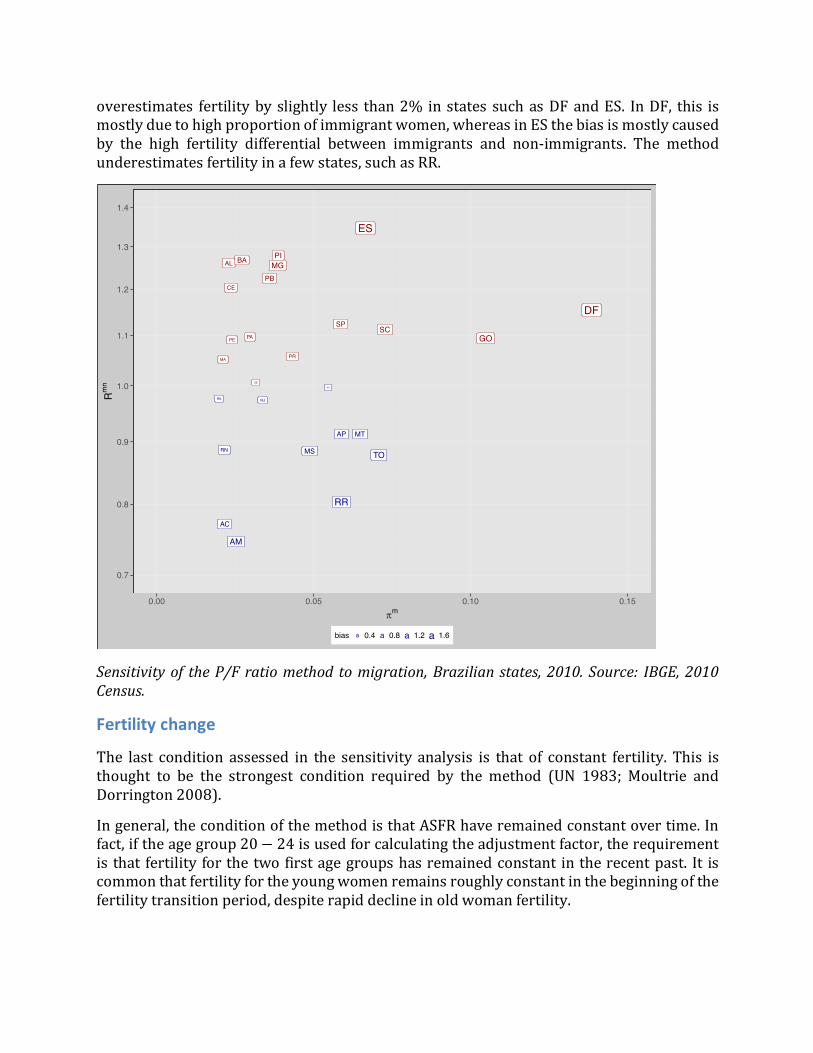
overestimates fertilityby slightly less than2% instates suchasDFandES. InDF, this ismostlyduetohighproportionofimmigrantwomen,whereasinESthebiasismostlycausedby the high fertility differential between immigrants and non-immigrants. The methodunderestimatesfertilityinafewstates,suchasRR.
Sensitivityof theP/F ratiomethod tomigration,Brazilian states, 2010. Source: IBGE,2010Census.
Fertility change
The last condition assessed in the sensitivityanalysis is that of constant fertility. This isthought to be the strongest condition required by the method (UN 1983; Moultrie andDorrington2008).
Ingeneral,theconditionofthemethodisthatASFRhaveremainedconstantovertime.Infact,iftheagegroup20 − 24isusedforcalculatingtheadjustmentfactor,therequirementis that fertility forthetwofirstagegroupshasremainedconstant in therecentpast. It iscommonthatfertilityfortheyoungwomenremainsroughlyconstantinthebeginningofthefertilitytransitionperiod,despiterapiddeclineinoldwomanfertility.
PA
MA
PI
CEPB
PE
AL
SE
BAMG
ES
SP
PR
SCGO
DF
RO
AC
AM
RR
AP
TORN
RJRS
MS
MT
0.7
0.8
0.9
1.0
1.1
1.2
1.3
1.4
0.00 0.05 0.10 0.15pm
Rmn
bias aa aa aa aa0.4 0.8 1.2 1.6

InBrazil,asshownbyFigure2,adolescentfertilityrates(15 − 19)increasedintheperiods1980-1991and1991-2000,despite therapidoverall fertilitydecline.Fertility for theagegroup20 − 24reducedinthesameperiod,butataslowerpacethantheobservedforolderages. Thus, the almost constant fertility for the two younger age groups (increase in𝐴𝑆𝐹𝑅N=+NOoffsetbyamoderatedeclinein𝐴𝑆𝐹𝑅)*+),)between1980and2000,allowedtheuseoftheP/Fratiomethodwithoutmarkedbiases(Carvalho,Gonçalves,andSilva2018).Ontheotherhand,𝐴𝑆𝐹𝑅forthesetwoagegroupsreducedmorethan30%between2000and2010,imposingastronglimitationtotheuseoftheP/Fratiomethodforthisperiod.
This issuehasbeen amatterofdebate in the pastyears. (Castanheira andKohler2015)identifiedtheproblemofthebasicassumptionviolationforBrazilin2010andrecommendthatthemethodbepossiblydiscontinued.(CavenaghiandAlves2016)alsorecognizethelimitations,butarguethatthemethodstillpresentsreasonableresults.(Carvalho,Gonçalves,andSilva2018)discussseveralalternatives.Thefinalauthor’srecommendationistheuseoftheadjustmentfactorsfortheyear2000for2010,withfertilityestimatedfortheperiodofreferenceatabout2.5yearspriortothecensus.
ASFRfortheyears1980,1991,2000and2010.Source:IBGE,Censusesof1980,1991,2000and2010
TheP/FratioestimatedbytheBrassoriginalmethod(PFt)canbedecomposed intotwofactors:i)theadjustmentfactortocorrectthereportedcurrentfertilityrates(PFu),whichiswhatthemethodistryingtoestimate;ii)afactorthatestimatestheeffectoffertilitychangein theP/F ratio resulting fromcomparing cohort andperiod fertility (PFQM). If fertility isconstantovertime,thissecondfactoris1.
0
50
100
150
200
15−19 20−24 25−29 30−34 35−39 40−44 45−49age group
unad
just
ed fe
rtilit
y ra
te
year 1980 1991 2000 2010

PFt⏟
P/FratioestimatedbyBrassoriginalmethod
= PFu⏟
underreportofcurrentfertilityeffect
× PFQM⏟
fertilitychangeeffect
Aspreviouslydiscussed,theP/Fratiomethodassumeconstantfertilityuptoage𝑖usedforthecalculationoftheadjustmentfactor,sothat𝑓5(𝑡)isconstantovertimeandtheP/Fratioisgivenby:
PF"(𝑡) =𝑃"(𝑡)𝐹′"(𝑡)
=∫ 𝑓5"* (𝑡) 𝑑𝑥
∫ 𝑓"* ′5(𝑡) 𝑑𝑥
ThesecondfactoroftheequationcalculatestheeffectoffertilitychangeintheestimateoftheP/Fratiomethodandisgivenbytheratiooftheobservedparityandthetrueperiodfertilityrates:
PF"(𝑡) =𝑃"(𝑡)𝐹"(𝑡)
=∫ 𝑓5"* (𝑡 − 𝑖 + 𝑥) 𝑑𝑥
∫ 𝑓5"* (𝑡) 𝑑𝑥
Followingasimilarapproachusedby(Schmertmannetal.2013)toproduceretrospectivefertilityestimates, let𝑓5(𝑡 − 𝑖 + 𝑥) bedefined in termsofcurrent fertility rates𝑓5(𝑡) andmultipliers𝜌5(𝑡) that relate current (period)and retrospective (cohort) fertilityrates, asfollows:
𝜌5(𝑡) =𝑓5(𝑡 − 𝑖 + 𝑥)
𝑓5(𝑡)
PF"(𝑡) =𝑃"(𝑡)𝐹′"(𝑡)
=∫ 𝜌5"* (𝑡)𝑓5(𝑡) 𝑑𝑥
∫ 𝑓5"* (𝑡) 𝑑𝑥
Thisratioistheaverageratioofpasttopresentfertilityrates,weightedbycurrentfertilityrates.Thisfactorcanbecalculatedifthepastandpresentratiosareavailable.However,thisis rarely available in contexts where this method needs to be applied. Thus, furtherapproximations are necessary to transform equation above into parameters that can beestimatedmoreeasily.
Theequationcanbeapproximatedfurtherbytheratiobetweenpasttopresentfertilityatthemeanageofchildbearinguptoage𝑖,𝜇" attime𝑡 − (𝑖 − 𝜇"),where(𝑖 − 𝜇")indicatesthenumberofyearspriortothecensustheexperienceofthecohort𝑖referto:
PF"(𝑡) = 𝜌yz(𝑡 − 𝑖 + 𝜇")
For example, assuming that (𝑖 − 𝜇") = 2.5 for the cohort aged 20 − 24 in 2000,PF)*+),(2000) = 𝜌N{+)N(2000− 2.5),meaning that it refers to the ratiobetween fertilityratesofthecohort17 − 21in1997.5.
Acalibratedsplineestimationprocedurethatinterpolatesdetailedfertilityschedulesfromage-groupdata (Schmertmann2014) isused to calculate(𝑖 − 𝜇"), theaverage timesince

previousbirths.Theratiobetweenfertilityratesofthecohort,𝜌yz(𝑡 − 𝑖 + 𝜇"),isestimatedbasedonthegrowthrateofthereportedfertilityratesbetweenthecensusunderanalysisandtheprecedingcensus.
SectionsbelowshowtheresultsoftheapplicationofthisadjustmenttoBraziliandatafrom1991to2010.
Omission of fertility among women under age 15
Finally, the application of the P/F ratiomethod often uses the traditional age groups ofwomanatreproductiveages,from15to49.However,iffertilitybelowage15isrelativelyhigh,thismaybiastheresults.
Thefertilityofwomenbelowage15arereportedinthecumulatedparity𝑃",butthiswillnotbetakenintoaccountifthisgroupisnotincludedinthecalculationsforthecurrentfertility𝐹".Thus,theadjustmentfactorwillbeoverestimated.
Forexample,thefertilityratesbelowage15reportedinthe2010CensusinBrazilinafewstates represents around 2% of the fertility rates up to age 24. This means that the𝑃)*+),/𝐹)*+),factorwouldbeoverestimatedby2%.
Fertility estimates for Brazil and states from 1980 to 2010 using the P/F ratio method Assectionsaboveindicate,theonlyconditionthatcanleadtoimportantbiasesintheP/FratiomethodintheBraziliancontextisthatoffertilitychange.Thus,thecompletesensitivityframeworkderivedinthissectioncanbeusedinothercontextsfortoadjustmentthefinalresultsofthemethods.Inthisstudy,however,adjustmentsaremadeconsideringonlythiscondition.
Figure3showsthecomparisonbetweenadjustedanunadjustedTFRestimatebyusingtheP/Fratiomethod.ThefigureshowsthattheonlyyearwhentheadjustedTFRestimatedbythemethoddescribedabovediffersignificantlyfromtheoriginalpropositionis2010.Theadjusted rate consistently reduces fertility estimates for 2010. Is a fewother cases, thisoccursforotheryearsaswell,suchasRRin2000.For1980,sincethereisnoinformationonpastfertilityrates,bothestimatesareequal.

ComparisonbetweenadjustedanunadjustedTFR,Brazilianstates,1980,1991,2000and2010.Source:IBGE,Censusesof1980,1991,2000and2010
Figure4showstheTFRbystate,fortheyears1980,1991,2000and2010calculatedbytheP/Fratiomethod,usingtheadjustmentratiofortheagegroup20 − 24(P2/F2).
Themapindicatesthatfertilityhasdeclinedsteadilyfrom1980to2010.TheTFRforBrazil,calculatedbytheP/Fratiomethoddeclinedfrom4.36in1980,2.88in1991,2.35in2000and1.71in2010.Theregionaldifferentialsremain,despitethegeneralizedfertilitydeclineinallstates.
MapoftheTFRbystate,fortheyears1980,1991,2000and2010.Source:IBGE,Censusesof1980,1991,2000and2010
RO
ACAM
RRPA
APMA
PI
CE
RN
PB
PE
AL
SEBA
MGES
RJ
SP
PR
SC
RS
MS
MT
GO
DFRO
AC
AM
RR
PA
AP
TO
MA
PICE
RN
PB
PE
AL
SEBA
MGES
RJ
SP
PR
SC
RS
MSMT
GODFRO
ACAM
RR
PA
AP
TO
MA
PI
CE
RNPBPE
AL
SEBA
MGESRJ
SP
PR
SCRS
MSMT
GO
DFRO
ACAM
RRPA
AP
TOMA
PICERNPB
PE
AL
SEBA
MGES
RJSP
PR
SCRS
MSMT
GO
DF1.5
2.0
2.5
3.0
3.5
4.0
4.5
5.0
5.5
6.06.57.07.5
1.5 2.0 2.5 3.0 3.5 4.0 4.5 5.0 5.5 6.0 6.5 7.0 7.5P2F2
adju
sted
P2F
2
year a a a a1980 1991 2000 2010
1980 1991 2000 2010
2 3 4 5 6
TFR

Conclusion Indirectdemographictechniquesremainrelevantformanypurposes.First,thisisessentiallythe onlyway to estimate fertility for periodswhen CRVSwere still incomplete. Second,despite improvements,administrativedatastillhaveproblems in lessdeveloped regions,even for recent periods. Third, indirect demographic techniques, such as the P/F ratiomethod,have theadvantageofusing information from the samedata source toestimatefertility.TheuseofCRVSalsorequiresanestimatedpopulationofwomenatreproductiveages,whichnormallycomefromcensuses.Ifthecompletenessofthecensusisdifferentfromthecompletenessofregisteredbirths,thenfertilityestimatewillbebiased.Finally,thefactthatthesequestionsareincensusesandsurveys,whichtendtohaverichquestionnaires,fertilityfordifferentpopulationgroups,e.g.education,income,migrationandmaritalstatus,canbeestimated.
Thispaperprovidesanovelsensitivityframeworktothehypothesisofdifferentialfertilitybetween survivors and non-survivors; differential fertility between migrants and non-migrants;andfertilitychange.Italsoproposesanadjustmentforestimatingfertilityinthecontextofadolescentfertilitydecline.
References
Berquó,ElzaS.,andSuzanaM.Cavenaghi.2014.“Notassobreosdiferenciaiseducacionaiseeconômicosda fecundidadenoBrasil.”RevistaBrasileiradeEstudosdePopulação 31 (2):471–82.
Brass,William.1964.“UsesofCensusorSurveyDatafortheEstimationofVitalRates.”InUN.ECAAfricanSeminaronVitalStatistics.AddisAbaba,Ethiopia:UnitedNations.EconomicandSocialCounci.
Brass, William, and Ansley Coale. 1968. “Methods of Analysis and Estimation.” InDemographyofTropicalAfrica,88–150.PrincetonUniversityPress.
Carvalho,JoséAlbertoMagnode.1982.“AplicabilidadeDaTécnicadeFecundidadedeBrassQuando a Fecundidade Está Declinando Ou Quando a População Não é Fechada.” In IIIEncontroNacionaldeEstudosPopulacionais.
Carvalho,JoséAlbertoMagnode,G.Q.Gonçalves,andL.Silva.2018.“ApplicationofP/FBrassRatioMethodintheContextofFast-PacedAdolescentFertilityDecline.”RevistaBrasileiradeEstudos de População 35 (1): 1–26. https://doi.org/http://dx.doi.org/10.20947/S102-3098a0052.
Castanheira,Helena,andHans-PeterKohler.2015.“ItIsLowerThanYouThinkItIs:RecentTotalFertilityRates inBrazilandPossiblyOtherLatinAmericanCountries.”PSCWorkingPaperSeries,WPS15-5,March.
Cavenaghi, SuzanaM., and JoséEustáquioDinizAlves.2016. “QualidadeDas InformaçõesSobre Fecundidade No Censo Demográfico de 2010.” Revista Brasileira de Estudos dePopulação33(1):189–205.https://doi.org/10.20947/S0102-309820160010.
Cho,LeeJay,RobertD.Retherford,andMKChoe.1986.TheOwn-ChildrenMethodofFertilityEstimation.Honolulu,Hawaii:TheEast-WestCenter.
Feehan,DennisM,andGabrielMBorges.2019.“EstimatingAdultDeathRatesfromSiblingHistories:ANetworkApproach.”arXivPreprintarXiv:1906.12000.
Grabill,WilsonR., andLee JayCho.1965. “Methodology for theMeasurementofCurrentFertility from Population Data on Young Children.” Demography 2 (1): 50–73.https://doi.org/10.2307/2060106.
Moultrie, Tom A. 2013a. “Introduction to Fertility Analysis.” In Tools for DemographicEstimation.Paris:InternationalUnionfortheScientificStudyofPopulation.
———.2013b.“OverviewofFertilityEstimationMethodsBasedontheP/FRatio.”InToolsforDemographicEstimation.Paris:InternationalUnionfortheScientificStudyofPopulation.

Moultrie, Tom A., and Rob Dorrington. 2008. “Sources of Error and Bias in Methods ofFertilityEstimationContingentontheP/FRatioinaTimeofDecliningFertilityandRisingMortality.”DemographicResearch;Rostock19:1635–62.
Schmertmann, Carl P. 2014. “Calibrated Spline EstimationofDetailed Fertility Schedulesfrom Abridged DataN.” Revista Brasileira de Estudos de População 31 (2): 291–307.https://doi.org/10.1590/S0102-30982014000200004.
Schmertmann,CarlP.,SuzanaM.Cavenaghi,RenatoM.Assunção,andJosephE.Potter.2013.“BayesPlusBrass:EstimatingTotalFertilityforManySmallAreasfromSparseCensusData.”PopulationStudies67(3):255–73.https://doi.org/10.1080/00324728.2013.795602.
UN. 1983.Manual X: Indirect Techniques for Demographic Estimation. ST/ESA/SER.A/81.PopulationStudies81.NewYork:UnitedNations.
Related Documents