This content has been downloaded from IOPscience. Please scroll down to see the full text. Download details: IP Address: 138.100.4.44 This content was downloaded on 05/01/2015 at 14:22 Please note that terms and conditions apply. Sensing of protein molecules through nanopores: a molecular dynamics study View the table of contents for this issue, or go to the journal homepage for more 2014 Nanotechnology 25 155502 (http://iopscience.iop.org/0957-4484/25/15/155502) Home Search Collections Journals About Contact us My IOPscience

Welcome message from author
This document is posted to help you gain knowledge. Please leave a comment to let me know what you think about it! Share it to your friends and learn new things together.
Transcript

This content has been downloaded from IOPscience. Please scroll down to see the full text.
Download details:
IP Address: 138.100.4.44
This content was downloaded on 05/01/2015 at 14:22
Please note that terms and conditions apply.
Sensing of protein molecules through nanopores: a molecular dynamics study
View the table of contents for this issue, or go to the journal homepage for more
2014 Nanotechnology 25 155502
(http://iopscience.iop.org/0957-4484/25/15/155502)
Home Search Collections Journals About Contact us My IOPscience

Nanotechnology
Nanotechnology 25 (2014) 155502 (7pp) doi:10.1088/0957-4484/25/15/155502
Sensing of protein molecules throughnanopores: a molecular dynamics studySridhar Kumar Kannam1, Sung Cheol Kim1, Priscilla R Rogers1,Natalie Gunn1, John Wagner2, Stefan Harrer1 and Matthew T Downton2
1 IBM Research Australia, 204 Lygon Street, 3053 Carlton, Victoria, Australia2 IBM Research Collaboratory for Life Sciences—Melbourne, Victorian Life Sciences ComputationInitiative, The University of Melbourne, Victoria, 3010, Australia
E-mail: [email protected]
Received 1 December 2013, revised 28 January 2014Accepted for publication 13 February 2014Published 20 March 2014
AbstractSolid-state nanopores have been shown to be suitable for single molecule detection. Whilenumerous modeling investigations exist for DNA within nanopores, there are few simulationsof protein translocations. In this paper, we use atomistic molecular dynamics to investigate thetranslocation of proteins through a silicon nitride nanopore. The nanopore dimensions andprofile are representative of experimental systems. We are able to calculate the change inblockade current and friction coefficient for different positions of the protein within the pore.The change in ionic current is found to be negligible until the protein is fully within the poreand the current is lowest when the protein is in the pore center. Using a simple theory thatgives good quantitative agreement with the simulation results we are able to show that thevariation in current with position is a function of the pore shape. In simulations that guide theprotein through the nanopore we identify the effect that confinement has on the frictioncoefficient of the protein. This integrated view of translocation at the nanoscale providesuseful insights that can be used to guide the design of future devices.
Keywords: nanopores, protein sensing, biomolecular detection, biosensors
(Some figures may appear in colour only in the online journal)
1. Introduction
Over the past decade, DNA sequencing using nanopore tech-nology has received great interest due to its ability to probe themolecular details of single strands of DNA. Research in thisarea is still vigorous due to the obvious potential for creatinga new generation of sequencing technologies that are rapid,cheap and ubiquitous. However, there is also great scope forgenerating new biosensors that do not rely on precise controland electronic sensing of molecules, but have much simplerdesigns based around surface functionalization and the longestablished technique of resistive pulse sensing.
The principle on which these devices work is straightfor-ward. A pore with size in the range 5–50 nm is drilled througha thin membrane and then submerged within an electrolyte.An external voltage applied across the membrane drives anionic current through the pore that can be detected using a
patch-clamp apparatus. Analytes, such as proteins, which areof similar size as the pore can then be placed in the solutionand will be detected if they pass through the pore by a transientdrop in the measured ionic current. Translocation events aretypically characterized by the magnitude of the change in thecurrent and its duration. Specificity for a particular moleculecan be conferred by functionalizing the surface of the porewith an appropriate, assay specific coating, though there arealternatives. Niedzwiecki et al used highly specific RNAaptamers that bind to a target protein to detect its presence [1].The combined aptamer and protein complex is too large topass through the nanopore in their experiments leading to achange in the rate of translocation events.
Silicon nitride (SiN) nanopores are frequently used inbiomolecular detection due to their manufacturability androbustness. Han et al demonstrated the detection of BSAproteins [2], while Fologea and coworkers estimated the
0957-4484/14/155502+07$33.00 1 c© 2014 IOP Publishing Ltd Printed in the UK

Nanotechnology 25 (2014) 155502 S K Kannam et al
change in the effective charge of BSA with variation inthe pH of the solution [3]. Using the same pore, they alsofound a larger current drop was associated with the largerfibrinogen molecule. Plesa et al found anomalous translocationrates for small proteins due to their shorter translocationtimes and lower signal to noise ratio [4]. New designs havebeen developed which utilize functionalization of the poreor electrostatic trapping [5–8]. Several other studies havebeen carried out to study protein structure, conformation andfolding using nanopores [9–11]. Reviews of sensing proteinsand single molecules can be found in [12–17].
Simulation studies of biomolecular translocation throughnanopores have focused attention on nucleic acids. Luan et alhave investigated the control of single-stranded DNA in solid-state nanopores using electrostatic traps, pore coating andsolvent viscosity [18–20]. Using coarse-grained modeling andLangevin dynamics, Kong and Muthukumar studied proteinsensing in the α-hemolysin nanopore [21]. They investigatedthe effect of length and anchoring position of polyethyleneglycol which is used to functionalize the pore. Gumbart andSchulten characterized the SecYEβ translocon by translocat-ing alanine and leucine helices using MD simulations, demon-strating the flexibility of SecYEβ as a channel to conductmolecules [22]. Coarse-grained models have also been used toinvestigate the translocation and diffusion of small proteins innanopores [23, 24]. The scope and breadth of previous workhas to a certain extent been limited by the scale of simulationsthat can be attempted.
In the following work, we use atomistic molecular dynam-ics simulations to investigate the translocation of a test pro-tein through a solid-state nanopore that has a non-cylindricalprofile. We measure the ionic current for several differentsituations in which one or more proteins are held at staticpositions within the pore. From this we extract the geometricdependence of the pore conductance on protein position. Thisis interpreted in terms of a commonly used framework forcalculating the pore conductance adapted to a non-cylindricalpore. We then investigate the translocation of proteins throughthe pore. Since experimental translocation timescales are notcurrently accessible to atomistic molecular dynamics simula-tion we use the steered molecular dynamics (SMD) techniqueto guide proteins through the pore at an accelerated rate. Afterestablishing a range of steering velocities that leave the proteinconformationally stable, we examine the position dependentfriction coefficient and the reorientation of the protein withinthe pore. Combining static and dynamic simulation protocolsin this way allows us to create a picture of both the responseof the pore ionic current to the presence of a protein and thechange in the dynamics of the protein during its confinementwithin the pore.
2. Simulation details
The simulated pore consists of a SiN membrane of length20 nm with the hourglass profile shown in figure 1(a). Thepore diameter is 10 nm at its thinnest point and 12.5 nmat the pore entrance and exit. The origin of our coordinatesystem is placed at the center of the pore and its long axis is
Figure 1. Schematic representations of the systems studied. (a) TheSiN nanopore (gray) and protein (red, white, blue, green) aredepicted in space-filling representations. The pore length is 20 nm,and has the hourglass profile shown with minimum and maximumdiameters of 10 and 12.5 nm. The surface of the water box is shownin space-filling representation and potassium and chlorine atoms areshown as yellow and blue spheres (for clarity only 10% of the ionsare shown). (b) The secondary and quaternary structure ofstreptavidin; the four monomers are represented in different colors.(c) Representations of the different systems studied where we havevaried the position of the proteins and the number of proteins insidethe pore. Only the SiN nanopore and the proteins are shown.(i) open pore, (ii)–(vii) one protein in the system, (ix)–(xi) twoproteins inside the pore, and (xii) three proteins inside the pore.
aligned with the z-axis. For a test protein we use streptavidin(pdb access code: 1sws), a 52.8 kDa tetrameric molecule thathas a radius of gyration of 2.2 nm. A secondary structurerepresentation of the protein that shows its fold is shown infigure 1(b) with the four monomers given different colors. Thepore and protein were solvated in 1 M aqueous potassiumchloride solution and a hexagonal prism shaped periodic boxwas used with fluid reservoirs of 10 nm thickness on eitherside of the pore. Approximately 4700 atoms of each ion typewere added to match the desired electrolyte density and ensurezero net charge for the entire system.
Atomistic simulations that considered the interactionsbetween all of the atoms in the simulation were performedusing the NAMD molecular dynamics package [25] with theCHARMM force field [26] and the TIP3P water model; VMDwas used for visualization and analysis [27]; a cut-off of1.2 nm was used for non-bonded short-ranged interactions;and simulations were performed at a temperature of 295 Kusing a Langevin thermostat. In all cases, configurations were
2

Nanotechnology 25 (2014) 155502 S K Kannam et al
Figure 2. Results from static protein simulations. (a) Typical ionic current traces for open and protein occupied pores at voltage 5 V. Thedotted lines represent the average current during the final 0.5 ns of simulation time. (b) Current as a function of voltage for open and proteinoccupied pores. The conductance of the pore measured from the plot is indicated on the plot; the inset shows the change in current betweenthe two states as a function of voltage. (c) Variation in the conductance with the position of the protein. The shaded region from −10 to10 nm represents the hourglass shape of the pore. The dotted line represents the open pore conductance when no protein is present in thesystem. The conductance drop predicted from equation (2) is shown as the blue solid line. (d) The drop in pore conductance for differentnumbers of proteins inside the pore. With one protein inside the pore, the current is averaged over the three configurations shown in figures1(c) (ii), (iii) and (vi). Similarly for two proteins inside the pore, the current is averaged over the three configurations shown in figures 1(c)(ix), (x) and (xi). The system with three proteins inside the pore is shown in figure 1(c) (xii).
first equilibrated in the NPT ensemble at atmospheric pressurewith zero applied field before production runs at constanttemperature. For the latter simulations, the thermostat wasonly applied to the SiN atoms and not the protein or solvent.
As explained in the introduction, we used two differentsimulation methods to characterize the electrical response ofthe protein and pore system. In the first set of simulations,the protein or proteins were held at fixed positions within thepore, as shown in figure 1(c). In this case, the center of mass ofthe α-carbon atoms on the protein backbone was constrainedusing a harmonic spring of force constant 5 kcal mol−1 Å−2.As the constraint was only applied to the center of mass itdid not disturb the internal dynamics of the protein. Followingthis, we used the nonequilibrium SMD technique to pull themolecule through the pore at fixed velocity, vp along the z-axis.Pulling velocities in the range 2–128 nm ns−1 were used.
To measure the instantaneous ionic current, I (t), thedisplacement of ions was monitored from snapshots of thesystem taken at fixed intervals. The current was then calculatedas
I (t)=11t L
∑i∈pore
qi [zi (t +1t)− zi (t)], (1)
where L is the thickness of the membrane; qi and zi arethe charge and z coordinate of the i th ion; and 1t is thetime interval (5 ps for these simulations). For the simulationparameters described above, we performed bulk simulationsof the electrolyte with an external field to measure its conduc-tivity, finding a value 9.2 S m−1. This can be compared with areference value of 10.5 S m−1 [28].
3. Results and discussion
3.1. Protein at fixed positions within the pore
In this section we consider different configurations of theprotein within the pore and the response of the ionic current tothe applied external voltage. For a given steady state ioniccurrent, I , and external voltage, V , the conductance canbe calculated from Ohm’s law: G = I/V . The conductancecaptures information about the configuration of the proteinin relation to the pore that we can use to characterize thetranslocation process. For instance, it should be possible torelate the magnitude of the drop in G to the size and shape ofthe translocating object.
Following equilibration, we performed simulations ofduration 1 ns. At the start of these simulations, the externalelectric field was applied causing the ionic current to flow. Infigure 2(a), I (t) is shown for an applied voltage of 5 V for bothopen and occupied pores corresponding to states (i) and (ii) infigure 1(c). In both cases I (t) relaxes within 0.2 ns to a steadystate value indicated by the dashed lines. Partially blocking thepore with the protein leads to a clearly discernible difference inthe steady state value, I , as measured by averaging I (t) overthe final 0.5 ns of the simulation trajectory. The magnitudeof the peak-to-peak noise will depend on the duration ofthe sampling window during which current is averaged. Forour simulations, this duration is 5 ps, but in experiment itwill typically be of order microseconds. The thermal noiseobserved experimentally will therefore be less noticeable thanseen in these simulations.
3
Nanotechnology 25 (2014) 155502 S K Kannam et al
Independent simulations for voltages in the range −5 Vto +5 V are combined in figure 2(b) again correspondingto states (i) and (ii). Although this voltage range is consid-erably larger than that typically employed in experimentswe find that I (V ) is linear across the range of voltagesstudied, and we are able to use linear regression to calcu-late the conductance for both states, finding the open poreconductance to be G(i) = 31.8 ± 0.2 nS and the conduc-tance for a pore with the protein at its center to be G(ii) =
26.4 ± 0.3 nS. The difference between the two values ofI (V ) is shown in the figure inset. Differences in conductanceof the order of 5.4 nS have been measured experimentally[2, 3].
For voltages of 1 and 2 V, the average current wasmeasured with the protein held at various positions along thepore axis (states (ii) to (vii) in figure 1(c)). The values of G fromthese simulations are compiled in figure 2(c) and comparedwith open pore conductance indicated by the dashed line. Forpositions outside the pore and up to the pore entrance, G isunchanged by the presence of the protein, only falling once thecenter of the protein is actually inside the pore. The minimumvalue of G is found at the center of the pore where the ratioof the pore and protein cross-sectional areas is lowest. Goodagreement in the profile of G is found for both of the appliedvoltages.
For very high concentrations of protein in the externalreservoir, multiple translocation events can occur simultane-ously. We can perform virtual experiments to test the additivityof the conductance change in this situation and simulatedcombinations of one, two and three proteins held at z =0,±6.5 nm as illustrated in configurations (ii), (iii), (vi) and(ix)–(xii) in figure 1(c). The resulting change in conductancefrom the open pore situation is shown in figure 2(d). As canbe seen, the conductance drop is proportional to the number ofproteins inside the pore, but is non-additive: the conductancedrop increases by roughly a factor of 2 when the number ofproteins is increased from one to three.
The results of figure 2 can be interpreted in terms ofa framework that, while simple, gives estimates of the poreconductivity that are of the same order of magnitude asthose seen experimentally [29]. The effective resistance ofan arbitrarily shaped pore can be estimated from
R =1G=
1σ
∫ L/2
−L/2
dzA(z)− A′(z)
+ Racc, (2)
where σ is the bulk conductivity of the electrolyte, Racc isthe access resistance of the pore, and A(z) and A′(z) are thecross-sectional areas of the hourglass shape pore and analyte atposition z. The above expression does not take into account thevariation in electric field and inhomogeneities in ion densitythat can affect the resistance. It also does not include the effectsof surface charge, though expressions do exist to take this intoaccount [30]. For an hourglass shape nanopore, the open poreresistance derived from equation (2) is
Rhg =4Lσπd2
1α
arctan(α)+1σD
, (3)
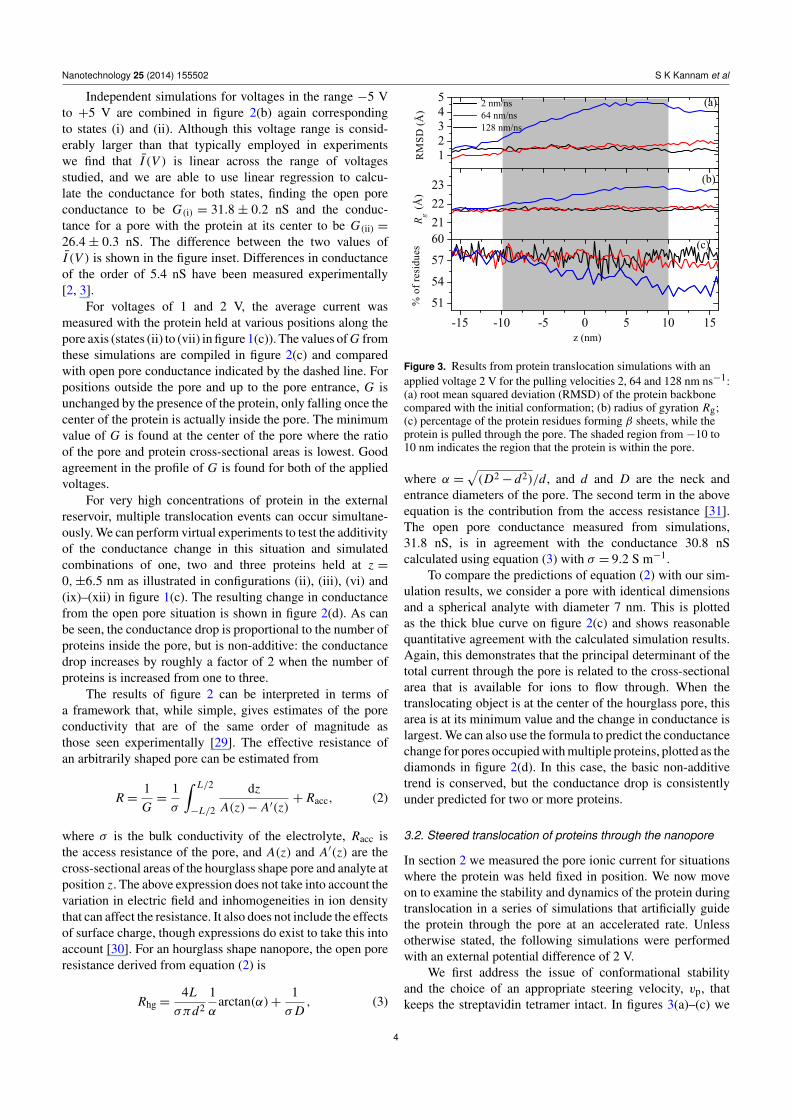
Figure 3. Results from protein translocation simulations with anapplied voltage 2 V for the pulling velocities 2, 64 and 128 nm ns−1:(a) root mean squared deviation (RMSD) of the protein backbonecompared with the initial conformation; (b) radius of gyration Rg;(c) percentage of the protein residues forming β sheets, while theprotein is pulled through the pore. The shaded region from −10 to10 nm indicates the region that the protein is within the pore.
where α =√(D2− d2)/d, and d and D are the neck and
entrance diameters of the pore. The second term in the aboveequation is the contribution from the access resistance [31].The open pore conductance measured from simulations,31.8 nS, is in agreement with the conductance 30.8 nScalculated using equation (3) with σ = 9.2 S m−1.
To compare the predictions of equation (2) with our sim-ulation results, we consider a pore with identical dimensionsand a spherical analyte with diameter 7 nm. This is plottedas the thick blue curve on figure 2(c) and shows reasonablequantitative agreement with the calculated simulation results.Again, this demonstrates that the principal determinant of thetotal current through the pore is related to the cross-sectionalarea that is available for ions to flow through. When thetranslocating object is at the center of the hourglass pore, thisarea is at its minimum value and the change in conductance islargest. We can also use the formula to predict the conductancechange for pores occupied with multiple proteins, plotted as thediamonds in figure 2(d). In this case, the basic non-additivetrend is conserved, but the conductance drop is consistentlyunder predicted for two or more proteins.
3.2. Steered translocation of proteins through the nanopore
In section 2 we measured the pore ionic current for situationswhere the protein was held fixed in position. We now moveon to examine the stability and dynamics of the protein duringtranslocation in a series of simulations that artificially guidethe protein through the pore at an accelerated rate. Unlessotherwise stated, the following simulations were performedwith an external potential difference of 2 V.
We first address the issue of conformational stabilityand the choice of an appropriate steering velocity, vp, thatkeeps the streptavidin tetramer intact. In figures 3(a)–(c) we
4

Nanotechnology 25 (2014) 155502 S K Kannam et al
Figure 4. Results from protein translocation simulations with an applied voltage of 2 V. (a) Force on the protein along the axial direction.(b) Force divided by vp. (c) Angle between the protein principal axis and the z-axis for two repetitions of steering simulations with vp = 2and 4 nm ns−1. (d) Ionic current through the pore. The red and black dotted lines indicate the open and protein occupied currents for avoltage of 2 V from figure 2(b); the black points indicate the data from figure 2(c). In all figures, the shaded region represents the position ofthe pore.
plot for representative steering simulations: the root meansquared deviation (RMSD); the radius of gyration, Rg; andthe proportion of residues that are in β-sheet structures. TheRMSD measures the deviation in the conformation of theprotein at time t from a reference structure, and is calculatedthrough:
RMSD(t)=
√√√√ 1N
N∑i=1
(r′i (t)− r(ref)
i
)2, (4)
where the sum runs over a subset of the atoms in the protein;we choose the α-carbon atoms on the protein backbone. Thecoordinates r(ref)
i and r′i (t) are the position of the i th atom in thereference structure and a copy of the simulation structure fromtime t that has been aligned against r(ref)
i respectively. Alongwith Rg, the RMSD remained relatively constant for all butthe highest velocity with which we steered the protein throughthe pore. For vp = 128 nm ns−1, shown by the blue curvein the figure, Rg and the RMSD increase steadily throughoutthe simulation. The change in the secondary structure contentindicates that this is at least partly due to internal changesin the conformation of each monomer from the streptavidintetramer. A change in the quaternary structure of the moleculecould also be a contributing factor.
For this system we can conclude that steering velocitiesbelow 64 nm ns−1 will not lead to unnatural deformation of theprotein during translocation. However, a further constraint thatwe have in performing simulations that accelerate the systemdynamics is a requirement not to introduce any unnatural flowswithin the fluid. Typical experimental translocation times are
of the order of microseconds, several orders of magnitudelonger than the forced translocations that we simulate here. Wecan estimate the extent to which we introduce inertial flowswithin the fluid through the Reynolds number, Re, which weestimate to be 0.05 for vp = 2 nm ns−1. While this is reasonablylow, it will certainly be the case that significantly higher pullingvelocities will change the nature of fluid flow within the pore.
From the steering simulations, we are able to retrieve theforce, f(z), applied to the protein at each position along thetranslocation path. This is plotted in figure 4(a) for velocities inthe range 2–64 nm ns−1. The overall force increases for largerpulling velocities and some fine structure can be seen in eachcurve: the force increases as the protein approaches the poreentrance; gradually decreases while the protein translocatesthrough the pore; and finally returns to the bulk value after theprotein exits. If we assume an overdamped equation of motionfor the protein center of mass of the form vz = fz/γ (z)+0(t),where 0(t) is a thermal noise term, then we can calculate theposition dependent friction, γ (z), plotted in figure 4(b). Forintermediate values of vp there is reasonable collapse of thedata onto a single curve. However, at lower pulling velocitiesthe effects of thermal noise tend to dominate and the agreementis less clear.
The gradual decrease in γ (z) while the protein passesthrough the pore is perhaps difficult to explain. In figure 4(c) weplot the angle between the protein principal axis and the z-axisfor two repetitions of steering simulations at 2 and 4 nm ns−1.We define this axis from the smallest eigenvector of the proteinmoment of inertia. In all simulations, the protein is started in aset orientation based on original x-ray crystal structure. During
5

Nanotechnology 25 (2014) 155502 S K Kannam et al
translocation, we find that the protein reorients so that the longaxis is aligned with the pore axis, reducing the translationaldrag coefficient.
Finally, in figure 4(d), the ionic current through thenanopore is shown for different steering simulations andcompared with the results from section 3.1. We find that I (z)has a similar profile for both the static and steered simulations,though the current calculated in the steering simulations tendsto underestimate the magnitude of the change in current.Agreement is best for lower values of vp where the perturbationon the electrolyte surrounding the protein will be lower.
4. Conclusion
We have investigated a computational model for sensing pro-tein translocations through nanopores. Using this model, wehave studied the interaction and translocation of streptavidinthrough a SiN nanopore. While the system was relativelysmall, the pore diameter and length are representative ofpossible experimental systems. We have applied two simu-lation strategies—examining proteins at fixed positions andprotein translocations using SMD—to characterize the poreconductance and protein motion inside the pore.
In the static protein simulations we found a linear depen-dence of the ionic current through the pore with variationin the external applied voltage. By changing the position ofthe protein within the pore, we were able to identify thenon-cylindrical profile of the pore through the changing ioniccurrent: for a protein at the pore entrance, the change in currentwas negligible; in the center of the pore, the protein takes upa larger fraction of the cross-sectional area of the pore and thechange is maximized. Good quantitative agreement was foundin comparing the results of simulations with a simple theoryof ionic pore conductance. We also considered situations inwhich multiple proteins occupied the pore simultaneously. Inthis case, the change in current was not an integer multiple ofthe pore occupancy. This observation may hamper the ability tocleanly interpret ionic current traces in experimental systemsfor high concentrations of proteins in the reservoir.
Since the typical translocation time is several ordersof magnitude slower than timescales that are accessible inatomistic molecular dynamics simulations, we used SMD toguide proteins through the pore on a timescale of up to 10 ns.For lower translocation velocities we found that the protein wasconformationally stable and were able to monitor the changesin the force required to pull the protein at a constant velocity.We interpret these changes in terms of the friction coefficient ofthe protein due to its confinement within the pore. Combiningtogether the position dependence of the friction coefficientand current drop allows us to build a model of the current traceof a typical device: arrival of proteins at the pore entrancecan be modeled as a Poisson process dependent only on theconcentration of proteins in the reservoir and their diffusioncoefficient; the actual translocation can then be modeled as asimple one-dimensional Langevin process.
Studies such as this yield valuable information on theoverall device properties of nanopore devices used for biosen-sor applications. It is of great interest to broaden the scope
of this work to consider biomolecule specific surface func-tionalization, the effects of protein conformational changes, orchanges in device shape and fabrication techniques.
Acknowledgments
This research was supported by a Victorian Life SciencesComputation Initiative (VLSCI) grant number VR0224 on itsPeak Computing Facility at the University of Melbourne, aninitiative of the Victorian Government, Australia.
References
[1] Niedzwiecki D J, Iyer R, Borer P N and Movileanu L 2013Sampling a biomarker of the human immunodeficiencyvirus across a synthetic nanopore ACS Nano 7 3341–50
[2] Han A, Schurmann G, Mondin G, Bitterli R A,Hegelbach N G, de Rooij N F and Staufer U 2006 Sensingprotein molecules using nanofabricated pores Appl. Phys.Lett. 88 093901
[3] Fologea D, Ledden B, McNabb D S and Li J 2007 Electricalcharacterization of protein molecules by a solid-statenanopore Appl. Phys. Lett. 91 539011
[4] Plesa C, Kowalczyk S W, Zinsmeester R, Grosberg A Y,Rabin Y and Dekker C 2013 Fast translocation of proteinsthrough solid state nanopores Nano Lett. 13 658–63
[5] Mohammad M M, Prakash S, Matouschek A and Movileanu L2008 Controlling a single protein in a nanopore throughelectrostatic traps J. Am. Chem. Soc. 130 4081–8
[6] Rotem D, Jayasinghe L, Salichou M and Bayley H 2012Protein detection by nanopores equipped with aptamersJ. Am. Chem. Soc. 134 2781–7
[7] Kowalczyk S W, Kapinos L, Blosser T R, Magalhaes T,van Nies P, Lim R Y H and Dekker C 2011Single-molecule transport across an individual biomimeticnuclear pore complex Nature Nanotechnol. 6 433–8
[8] Yusko E C, Johnson J M, Majd S, Prangkio P, Rollings R C,Li J, Yang J and Mayer M 2011 Controlling proteintranslocation through nanopores with bio-inspired fluidwalls Nature Nanotechnol. 6 253–60
[9] Cressiot B, Oukhaled A, Patriarche G, Pastoriza-Gallego M,Betton J-M, Auvray L, Muthukumar M, Bacri L and Pelta J2012 Protein transport through a narrow solid-statenanopore at high voltage: experiments and theory ACSNano 6 6236–43
[10] Freedman K J, Haq S R, Edel J B, Jemth P and Kim M J 2013Single molecule unfolding and stretching of proteindomains inside a solid-state nanopore by electric field Sci.Rep. 3 1638
[11] Kowalczyk S W, Hall A R and Dekker C 2010 Detection oflocal protein structures along DNA using solid-statenanopores Nano Lett. 10 324–8
[12] Stoloff D H and Wanunu M 2013 Recent trends in nanoporesfor biotechnology Curr. Opin. Biotechnol. 24 699–704
[13] Howorka S and Siwy Z S 2012 Nanopores as protein sensorsNature Biotechnol. 30 506–7
[14] Miles B N, Ivanov A P, Wilson K A, Dogan F, Japrung D andEdel J B 2013 Single molecule sensing with solid-statenanopores: novel materials, methods, and applicationsChem. Soc. Rev. 42 15–28
[15] Oukhaled A, Bacri L, Pastoriza-Gallego M, Betton J-M andPelta J 2012 Sensing proteins through nanopores:fundamental to applications ACS Chem. Biol. 7 1935–49
6

Nanotechnology 25 (2014) 155502 S K Kannam et al
[16] Wanunu M 2012 Nanopores: a journey towards DNAsequencing Phys. Life Rev. 9 125–58
[17] Healy K 2007 Nanopore-based single-molecule DNA analysisNanomedicine 2 459–81
[18] Luan B, Peng H, Polonsky S, Rossnagel S, Stolovitzky G andMartyna G 2010 Base-by-base ratcheting of single strandedDNA through a solid-state nanopore Phys. Rev. Lett. 104 06
[19] Luan B, Afzali A, Harrer S, Peng H, Waggoner P, Polonsky S,Stolovitzky G and Martyna G 2010 Tribological effects onDNA translocation in a nanochannel coated with aself-assembled monolayer J. Phys. Chem. B 114 17172–6
[20] Luan B, Wang D, Zhou R, Harrer S, Peng H and Stolovitzky G2012 Dynamics of DNA translocation in a solid-statenanopore immersed in aqueous glycerol Nanotechnology23 455102
[21] Kong C Y and Muthukumar M 2005 Simulations of stochasticsensing of proteins J. Am. Chem. Soc. 127 18252–61
[22] Gumbart J and Schulten K 2006 Molecular dynamics studiesof the archaeal translocon Biophys. J. 90 2356–67
[23] Lee P-H, Helms V and Geyer T 2012 Coarse-grainedBrownian dynamics simulations of protein translocationthrough nanopores J. Chem. Phys. 137 145105
[24] Javidpour L, Tabar M R R and Sahimi M 2009 Molecularsimulation of protein dynamics in nanopores. II. DiffusionJ. Chem. Phys. 130 085105
[25] Kal L, Skeel R, Bhandarkar M, Brunner R, Gursoy A,Krawetz N, Phillips J, Shinozaki A, Varadarajan K andSchulten K 1999 NAMD2: greater scalability for parallelmolecular dynamics J. Comput. Phys. 312 283–312
[26] MacKerell A D Jr et al 1998 All-atom empirical potential formolecular modeling and dynamics studies of proteinsJ. Phys. Chem. B 102 3586–616
[27] Humphrey W, Dalke A and Schulten K 1996 VMD: visualmolecular dynamics J. Mol. Graph. 14 33–8
[28] Haynes W M 2010 CRC Handbook of Chemistry and Physics93rd edn (Boca Raton, FL: CRC Press)
[29] DeBlois R W 1970 Counting and sizing of submicron particlesby the resistive pulse technique Rev. Sci. Instrum. 41 909
[30] Smeets R M M, Keyser U F, Krapf D, Wu M-Y, Dekker N Hand Dekker C 2006 Salt dependence of ion transport andDNA translocation through solid-state nanopores Nano Lett.6 89–95
[31] Hall J E 1975 Access resistance of a small circular poreJ. Gen. Physiol. 66 531–2
7
Related Documents


![nanopores - arXivarXiv:1204.3841v1 [cond-mat.mtrl-sci] 17 Apr 2012 A non-equilibrium thermodynamics model for combined adsorption and diffusion processes in micro- and nanopores I.](https://static.cupdf.com/doc/110x72/6009454d10ee823f47343081/nanopores-arxiv-arxiv12043841v1-cond-matmtrl-sci-17-apr-2012-a-non-equilibrium.jpg)

![DNA Origami - uni-muenchen.de · DNA Origami –Assembly on Membranes–Nanopores–Conclusion. 28 Citations II Nanopores [0] Krishnan, S., Ziegler, D., Arnaut, V.et al.Molecular](https://static.cupdf.com/doc/110x72/60a247c2a4e22023710401ec/dna-origami-uni-dna-origami-aassembly-on-membranesananoporesaconclusion.jpg)
