1 Sense of Harmony between Product Sound Quality and Color Sensation: A Case Study of Vacuum Cleaner Hideyoshi Yanagisawa 1 , Ryo Yoshinaga 1 , Tamotsu Murakami 1 Koichi Ohtomi 2 and Rika Hosaka 2 1 The University of Tokyo, 7-3-1, Hongo, Bunkyo-ku, Tokyo, Japan {hide, yoshinaga, murakami}@mail.design.t.u-tokyo.ac.jp 2 Toshiba Corporation, 1, Komukai-Toshiba-cho, Saiwai-ku, Kawasaki, Japan {koichi.ootomi, rika.hosaka}@toshiba.co.jp Abstract In this work, we investigate the sense of harmony between sound quality and color sensitivity towards a consumer product. We conducted two sensory tests using vacuum cleaners as a case-study. In the first test, participants evaluated their total impressions of multiple samples having different colors and sounds using given adjective pairs. With the result, we analyzed the effects of sound and color upon the total impression and the interaction between the two modalities. In the second test, the participants evaluated synthetic samples that satisfy a variety of color features (CIE L*c*h) and sound quality metrics (SQM). Based on the result, we found that the sense of harmony between colors and sounds changes depending on the sound sharpness. Using factor analysis, we found that the sound sharpness maximizing the sense of harmony correlated with the potency factor of color perception. Keywords: sound quality, sense of harmony, color and sound, design of experiment, vacuum cleaner. 1 Introduction In the design of mature products, a product‟s kansei (or emotional) quality is becoming increasingly important due to diversifying customer‟s needs. Kansei is originally a Japanese word that refers to the human sensitivity of a sensory organ at which sensations or perceptions take place in response to stimuli (e.g., a product) from the external world. Kansei quality is a product‟s quality that evokes a customer‟s specific impressions, feelings or

Welcome message from author
This document is posted to help you gain knowledge. Please leave a comment to let me know what you think about it! Share it to your friends and learn new things together.
Transcript
1
Sense of Harmony between Product Sound Quality and Color Sensation: A Case Study of Vacuum Cleaner
Hideyoshi Yanagisawa1, Ryo Yoshinaga1, Tamotsu Murakami1
Koichi Ohtomi2 and Rika Hosaka2
1The University of Tokyo,
7-3-1, Hongo, Bunkyo-ku, Tokyo, Japan
{hide, yoshinaga, murakami}@mail.design.t.u-tokyo.ac.jp 2Toshiba Corporation,
1, Komukai-Toshiba-cho, Saiwai-ku, Kawasaki, Japan
{koichi.ootomi, rika.hosaka}@toshiba.co.jp
Abstract
In this work, we investigate the sense of harmony between sound quality and color sensitivity towards a consumer product. We conducted two sensory tests using vacuum cleaners as a case-study. In the first test, participants evaluated their total impressions of multiple samples having different colors and sounds using given adjective pairs. With the result, we analyzed the effects of sound and color upon the total impression and the interaction between the two modalities. In the second test, the participants evaluated synthetic samples that satisfy a variety of color features (CIE L*c*h) and sound quality metrics (SQM). Based on the result, we found that the sense of harmony between colors and sounds changes depending on the sound sharpness. Using factor analysis, we found that the sound sharpness maximizing the sense of harmony correlated with the potency factor of color perception.
Keywords: sound quality, sense of harmony, color and sound, design of experiment, vacuum cleaner.
1 Introduction
In the design of mature products, a product‟s kansei (or emotional) quality is becoming increasingly important due to diversifying customer‟s needs. Kansei is originally a Japanese word that refers to the human sensitivity of a sensory organ at which sensations or perceptions take place in response to stimuli (e.g., a product) from the external world. Kansei quality is a product‟s quality that evokes a customer‟s specific impressions, feelings or
INTERNOISE 2010 │ JUNE 13-16 │ LISBON │ PORTUGAL
2
emotions towards that product (e.g., luxury, delight)[1]. A product‟s sound is an important factor that affects the kansei quality. For quite a long time, sound engineering mainly dealt with the reduction of the overall sound pressure level (SPL) emitted by a product. Within the last decade, however, the focus started to switch more towards aspects related to the quality of the sound. The biggest change is that the design goal switched from objective values, such as the “decibel” levels that can be physically measured, to subjective ones such as emotional qualities. To design such emotional qualities of product sound, it is necessary to develop metrics to quantitatively evaluate such subjective qualities. Zwicker et al. developed SQM as an evaluation metric of the product sound quality. SQM provides values for simple perceptions of sound such as loudness and sharpness [2]. However, product emotional qualities include more complex affective perceptions, such as pleasant, annoying, luxurious, etc. To deal with such complex sensitivity in sound design, most conventional approaches conduct sensory tests using affect-laden words to score target emotional qualities. Statistical methods are used to compose a map between SQM and complex emotional qualities [3]. Several applications have been studied based on the approach[4]-[7]. The authors have studied methods to formalize kansei qualities of product sound expressed by adjectives and applied them to product stationary sounds (i.e. vacuum cleaner sound)[1][8]. On the other hand, people, such as potential customers, evaluate the kansei quality of a product through not only the sense of hearing but other senses such as visual perception. If sound and visual impressions are independent in terms of a target kansei quality, designers can independently design a product‟s sound and its appearance. If they interact, designers have to consider the harmony of sound and appearance. As the term „tone color‟ shows, we may assume that the color and sound interact in terms of kansei quality. In the following discussion; we call kansei quality perceived through different senses a multimodal kansei quality. In this work, we investigate the sense of harmony between a product‟s sound quality and color in a consumer product design. We conduct two sensory tests using the stationary sound of vacuum cleaners as a case study. With the result of the first test using multiple samples consisting of different colors and sounds, we analyze the effects of sound and color upon the total impression, i.e., multimodal kansei quality, and the interaction between the two modalities. Based on the result of the second test using synthetic samples, we investigate the quantitative effect of sound and color parameters on the multimodal kansei quality. In particular, we focus on the sense of harmony as a multimodal kansei quality and extract its factors using sound quality metrics.
2 First sensory test: effect and interaction of sound and color for multimodal kansei qualities
2.1 Purpose
To design a multimodal kansei quality, the designer must prioritize the most effective modality. Furthermore, he/she must consider the interaction between modalities in terms a multimodal kansei quality. The first sensory test has two purposes: 1) Investigate the quantitative effect of product sound and color on multimodal kansei
qualities 2) Extract the interaction between sound and color in terms of multimodal kansei qualities
INTERNOISE 2010 │ JUNE 13-16 │ LISBON │ PORTUGAL │ H. Yanagisawa
3
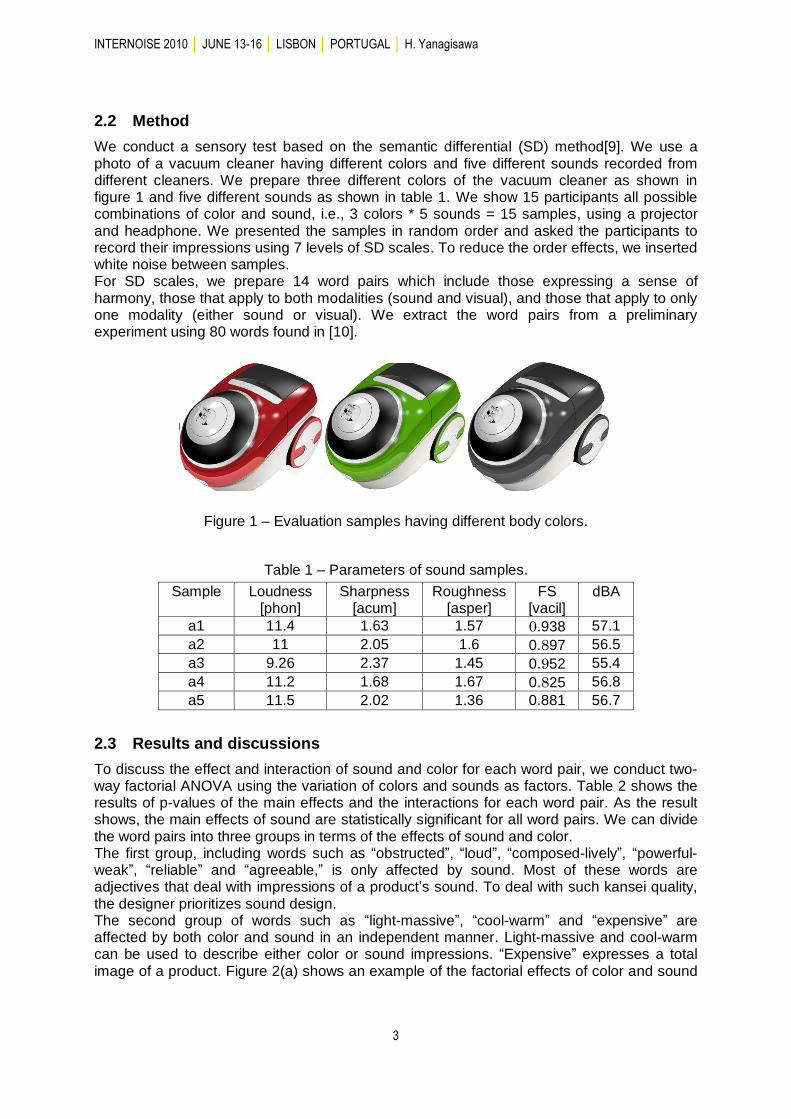
2.2 Method
We conduct a sensory test based on the semantic differential (SD) method[9]. We use a photo of a vacuum cleaner having different colors and five different sounds recorded from different cleaners. We prepare three different colors of the vacuum cleaner as shown in figure 1 and five different sounds as shown in table 1. We show 15 participants all possible combinations of color and sound, i.e., 3 colors * 5 sounds = 15 samples, using a projector and headphone. We presented the samples in random order and asked the participants to record their impressions using 7 levels of SD scales. To reduce the order effects, we inserted white noise between samples. For SD scales, we prepare 14 word pairs which include those expressing a sense of harmony, those that apply to both modalities (sound and visual), and those that apply to only one modality (either sound or visual). We extract the word pairs from a preliminary experiment using 80 words found in [10].
Figure 1 – Evaluation samples having different body colors.
Table 1 – Parameters of sound samples.
Sample Loudness [phon]
Sharpness [acum]
Roughness [asper]
FS [vacil]
dBA
a1 11.4 1.63 1.57 0.938 57.1
a2 11 2.05 1.6 0.897 56.5
a3 9.26 2.37 1.45 0.952 55.4
a4 11.2 1.68 1.67 0.825 56.8
a5 11.5 2.02 1.36 0.881 56.7
2.3 Results and discussions
To discuss the effect and interaction of sound and color for each word pair, we conduct two-way factorial ANOVA using the variation of colors and sounds as factors. Table 2 shows the results of p-values of the main effects and the interactions for each word pair. As the result shows, the main effects of sound are statistically significant for all word pairs. We can divide the word pairs into three groups in terms of the effects of sound and color. The first group, including words such as “obstructed”, “loud”, “composed-lively”, “powerful-weak”, “reliable” and “agreeable,” is only affected by sound. Most of these words are adjectives that deal with impressions of a product‟s sound. To deal with such kansei quality, the designer prioritizes sound design. The second group of words such as “light-massive”, “cool-warm” and “expensive” are affected by both color and sound in an independent manner. Light-massive and cool-warm can be used to describe either color or sound impressions. “Expensive” expresses a total image of a product. Figure 2(a) shows an example of the factorial effects of color and sound

INTERNOISE 2010 │ JUNE 13-16 │ LISBON │ PORTUGAL
4
for the word pair “cool-warm”. In the graph, the lines are roughly parallel, i.e., they are independent. To design such kansei quality, the designer can independently design color and sound.
Table 2 – P values of main effect and interaction in the result of two-way factorial ANOVA using sound and color as design parameters. (* 5% significance level, ** 1%significance level).
Word pairs Main effect Interaction
Sound Color
harmonized-disharmonized 0.00** 0.07 0.00**
shrill-dull 0.00** 0.38 0.04*
obstructed-unobstructed 0.00** 0.43 0.34
mellifluous-unvocal 0.01* 0.77 0.00**
loud-quiet 0.00** 0.60 0.41
clear-cloudy 0.00** 0.07 0.01*
light-massive 0.00** 0.00** 0.21
cool-warm 0.00** 0.00** 0.99
composed-lively 0.00** 0.14 0.58
powerful-weak 0.00** 0.18 0.11
reliable-unreliable 0.00** 0.08 0.43
expensive-cheap 0.00** 0.02* 0.36
agreeable-disagreeable 0.00** 0.55 0.10
like-dislike 0.00** 0.56 0.03*
In the third group, which includes words like “harmonized”, “shrill-dull”, “mellifluous-unvocal”, “clear-cloudy” and “like-dislike,” the color changes the sound‟s effect on impression. In the design of such multimodal kansei qualities, the sound designer needs to consider the color‟s effect. Figure 2(b) shows factorial effects of color and sound on the word “harmony”. The line plots have different shapes. We divide the line plots roughly into three patterns in terms of their shapes and values.
1
2
3
4
5
6
7
red black green
sense of
coo
lness
sound1
sound2
sound3
sound4
sound5
(a) “cool-warm”
1
2
3
4
5
6
7
red black green
sens
e of
har
mony
sound1
sound2
sound3
sound4
sound5
(b) “harmonized-disharmonized”
Figure 2 – Average SD score for evaluation samples.
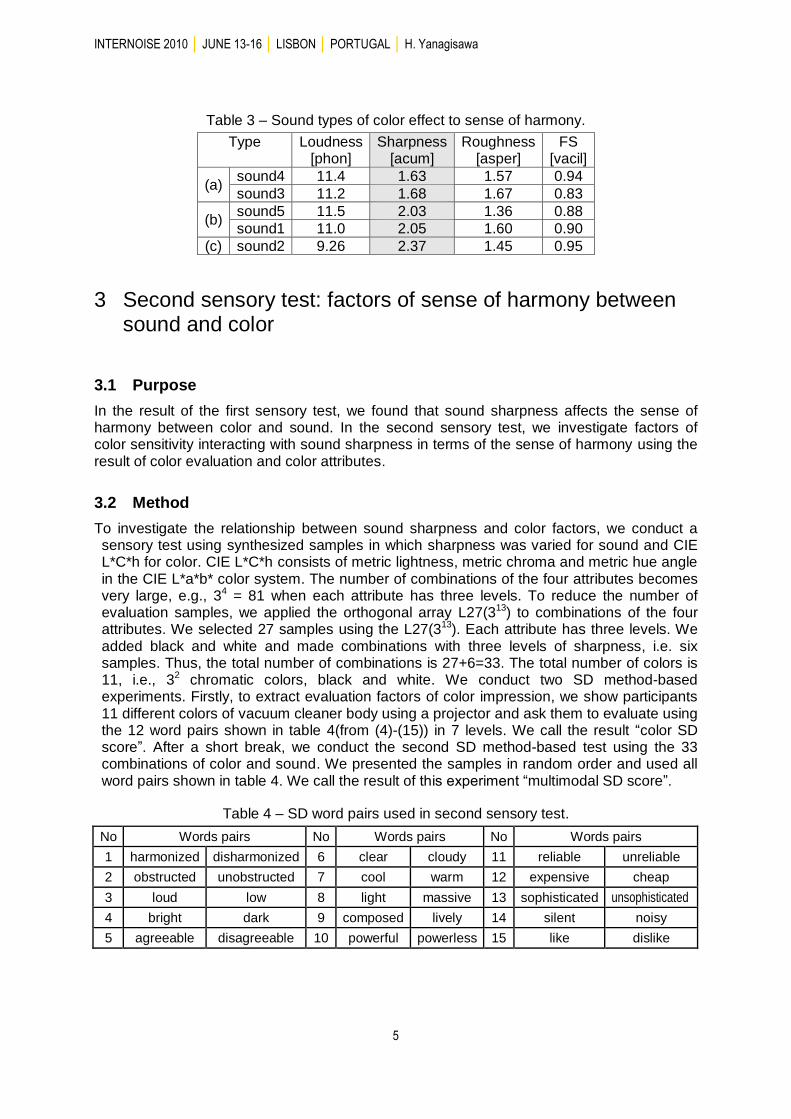
Table 3 shows the SQM for each type of sound. Sharpness tends to increase in ascending order of type (a), (b) and (c). In other words, the sense of harmony tends to increase as sharpness decreases. However, the shape of the graph for type (a) is different from those for type (b) and (c). Low sharpness sound (type (a)) harmonized with black color whereas high sharpness sound (type (c)) harmonized with green color.
INTERNOISE 2010 │ JUNE 13-16 │ LISBON │ PORTUGAL │ H. Yanagisawa
5
Table 3 – Sound types of color effect to sense of harmony.
Type Loudness [phon]
Sharpness [acum]
Roughness [asper]
FS [vacil]
(a) sound4 11.4 1.63 1.57 0.94
sound3 11.2 1.68 1.67 0.83
(b) sound5 11.5 2.03 1.36 0.88
sound1 11.0 2.05 1.60 0.90
(c) sound2 9.26 2.37 1.45 0.95
3 Second sensory test: factors of sense of harmony between sound and color
3.1 Purpose
In the result of the first sensory test, we found that sound sharpness affects the sense of harmony between color and sound. In the second sensory test, we investigate factors of color sensitivity interacting with sound sharpness in terms of the sense of harmony using the result of color evaluation and color attributes.
3.2 Method
To investigate the relationship between sound sharpness and color factors, we conduct a sensory test using synthesized samples in which sharpness was varied for sound and CIE L*C*h for color. CIE L*C*h consists of metric lightness, metric chroma and metric hue angle in the CIE L*a*b* color system. The number of combinations of the four attributes becomes very large, e.g., 34 = 81 when each attribute has three levels. To reduce the number of evaluation samples, we applied the orthogonal array L27(313) to combinations of the four attributes. We selected 27 samples using the L27(313). Each attribute has three levels. We added black and white and made combinations with three levels of sharpness, i.e. six samples. Thus, the total number of combinations is 27+6=33. The total number of colors is 11, i.e., 32 chromatic colors, black and white. We conduct two SD method-based experiments. Firstly, to extract evaluation factors of color impression, we show participants 11 different colors of vacuum cleaner body using a projector and ask them to evaluate using the 12 word pairs shown in table 4(from (4)-(15)) in 7 levels. We call the result “color SD score”. After a short break, we conduct the second SD method-based test using the 33 combinations of color and sound. We presented the samples in random order and used all word pairs shown in table 4. We call the result of this experiment “multimodal SD score”.
Table 4 – SD word pairs used in second sensory test.
No Words pairs No Words pairs No Words pairs
1 harmonized disharmonized 6 clear cloudy 11 reliable unreliable
2 obstructed unobstructed 7 cool warm 12 expensive cheap
3 loud low 8 light massive 13 sophisticated unsophisticated
4 bright dark 9 composed lively 14 silent noisy
5 agreeable disagreeable 10 powerful powerless 15 like dislike
INTERNOISE 2010 │ JUNE 13-16 │ LISBON │ PORTUGAL
6
3.3 Results and Discussions
3.3.1 Factor analysis: semantics of the sense of harmony
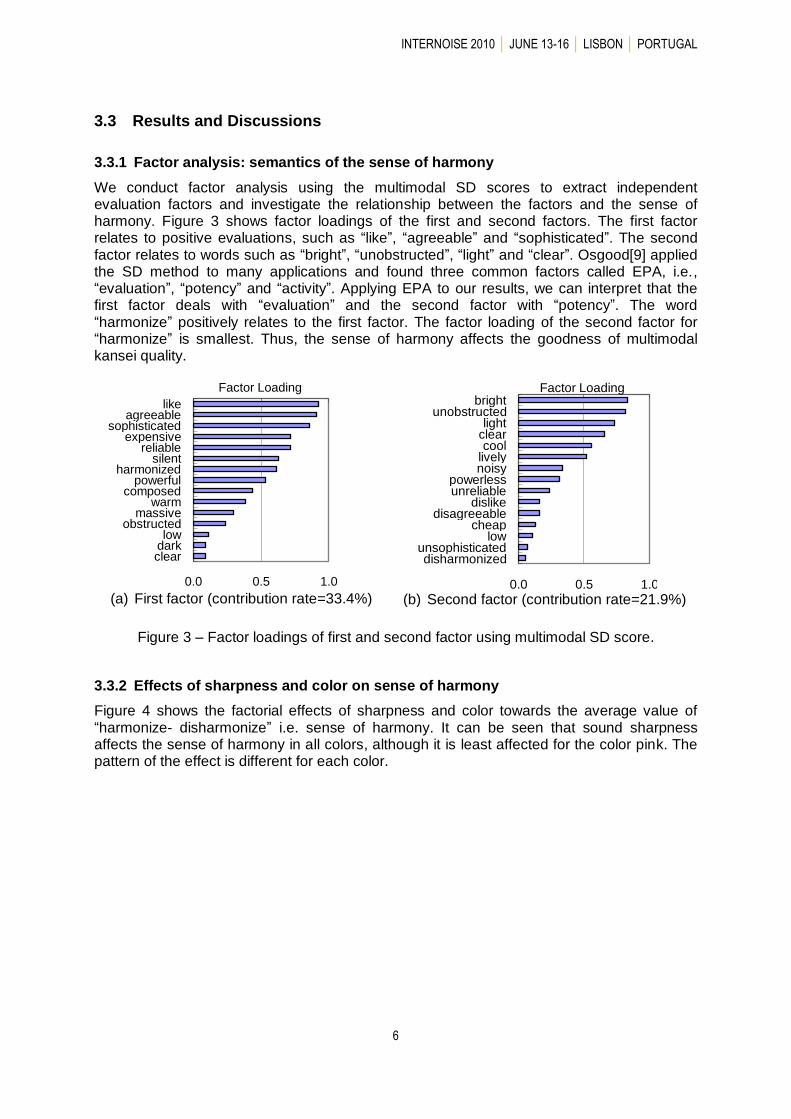
We conduct factor analysis using the multimodal SD scores to extract independent evaluation factors and investigate the relationship between the factors and the sense of harmony. Figure 3 shows factor loadings of the first and second factors. The first factor relates to positive evaluations, such as “like”, “agreeable” and “sophisticated”. The second factor relates to words such as “bright”, “unobstructed”, “light” and “clear”. Osgood[9] applied the SD method to many applications and found three common factors called EPA, i.e., “evaluation”, “potency” and “activity”. Applying EPA to our results, we can interpret that the first factor deals with “evaluation” and the second factor with “potency”. The word “harmonize” positively relates to the first factor. The factor loading of the second factor for “harmonize” is smallest. Thus, the sense of harmony affects the goodness of multimodal kansei quality.
0.0 0.5 1.0
likeagreeable
sophisticatedexpensive
reliablesilent
harmonizedpowerful
composedwarm
massiveobstructed
lowdarkclear
Factor Loading
(a) First factor (contribution rate=33.4%)
0.0 0.5 1.0
brightunobstructed
lightclearcool
livelynoisy
powerlessunreliable
dislikedisagreeable
cheaplow
unsophisticateddisharmonized
Factor Loading
(b) Second factor (contribution rate=21.9%)
Figure 3 – Factor loadings of first and second factor using multimodal SD score.
3.3.2 Effects of sharpness and color on sense of harmony
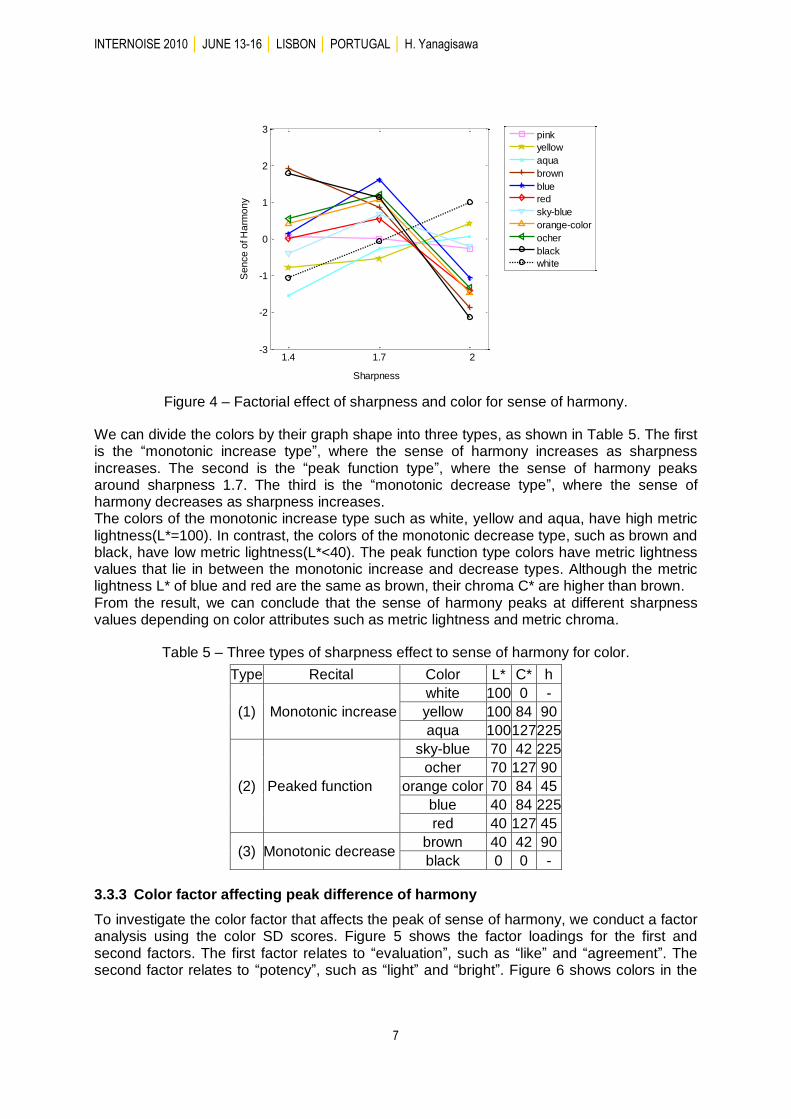
Figure 4 shows the factorial effects of sharpness and color towards the average value of “harmonize- disharmonize” i.e. sense of harmony. It can be seen that sound sharpness affects the sense of harmony in all colors, although it is least affected for the color pink. The pattern of the effect is different for each color.
INTERNOISE 2010 │ JUNE 13-16 │ LISBON │ PORTUGAL │ H. Yanagisawa
7
1.4 1.7 2-3
-2
-1
0
1
2
3
Sharpness
Se
nce
of H
arm
on
y
pink
yellow
aqua
brown
blue
red
sky-blue
orange-color
ocher
black
white
Figure 4 – Factorial effect of sharpness and color for sense of harmony.
We can divide the colors by their graph shape into three types, as shown in Table 5. The first is the “monotonic increase type”, where the sense of harmony increases as sharpness increases. The second is the “peak function type”, where the sense of harmony peaks around sharpness 1.7. The third is the “monotonic decrease type”, where the sense of harmony decreases as sharpness increases. The colors of the monotonic increase type such as white, yellow and aqua, have high metric lightness(L*=100). In contrast, the colors of the monotonic decrease type, such as brown and black, have low metric lightness(L*<40). The peak function type colors have metric lightness values that lie in between the monotonic increase and decrease types. Although the metric lightness L* of blue and red are the same as brown, their chroma C* are higher than brown. From the result, we can conclude that the sense of harmony peaks at different sharpness values depending on color attributes such as metric lightness and metric chroma.
Table 5 – Three types of sharpness effect to sense of harmony for color.
Type Recital Color L* C* h
(1) Monotonic increase
white 100 0 -
yellow 100 84 90
aqua 100 127 225
(2) Peaked function
sky-blue 70 42 225
ocher 70 127 90
orange color 70 84 45
blue 40 84 225
red 40 127 45
(3) Monotonic decrease brown 40 42 90
black 0 0 -
3.3.3 Color factor affecting peak difference of harmony
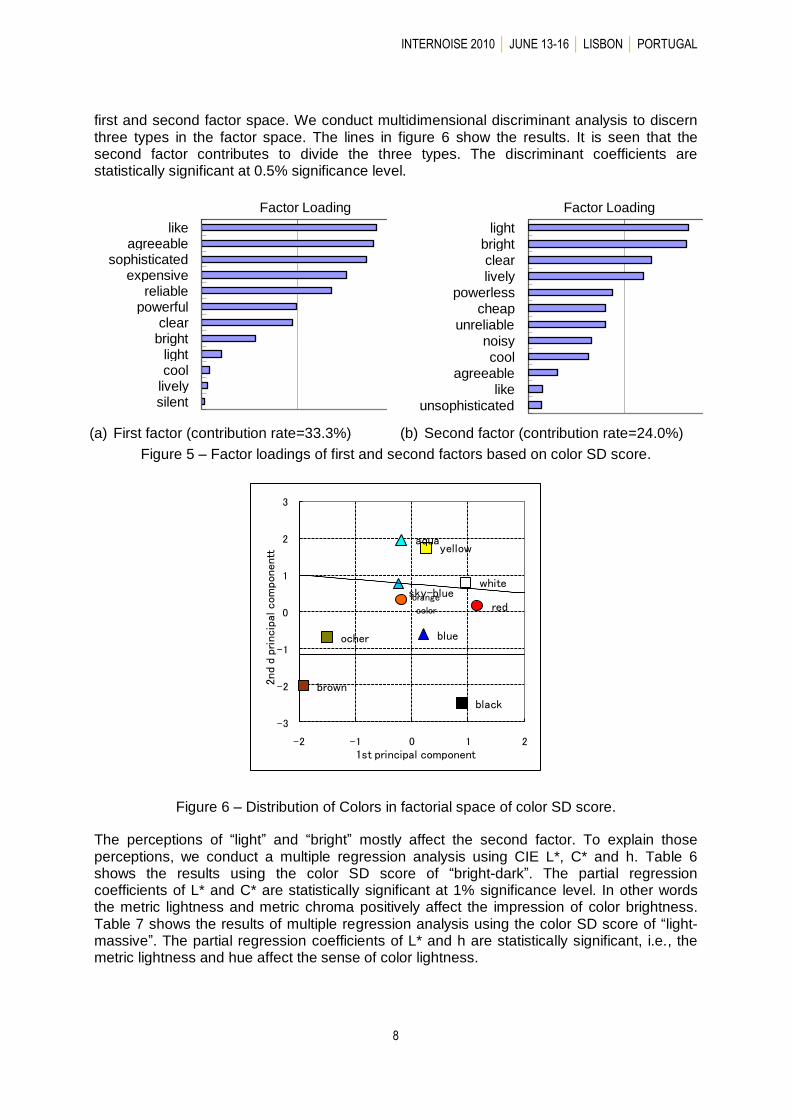
To investigate the color factor that affects the peak of sense of harmony, we conduct a factor analysis using the color SD scores. Figure 5 shows the factor loadings for the first and second factors. The first factor relates to “evaluation”, such as “like” and “agreement”. The second factor relates to “potency”, such as “light” and “bright”. Figure 6 shows colors in the
INTERNOISE 2010 │ JUNE 13-16 │ LISBON │ PORTUGAL
8
first and second factor space. We conduct multidimensional discriminant analysis to discern three types in the factor space. The lines in figure 6 show the results. It is seen that the second factor contributes to divide the three types. The discriminant coefficients are statistically significant at 0.5% significance level.
0.0 0.5 1.0
likeagreeable
sophisticatedexpensive
reliablepowerful
clearbright
lightcool
livelysilent
Factor Loading
(a) First factor (contribution rate=33.3%) 0.0 0.5 1.0
lightbrightclearlively
powerlesscheap
unreliablenoisycool
agreeablelike
unsophisticated
Factor Loading
(b) Second factor (contribution rate=24.0%)
Figure 5 – Factor loadings of first and second factors based on color SD score.
yellowaqua
brown
blue
redsky-blueorange
color
ocher
black
white
-3
-2
-1
0
1
2
3
-2 -1 0 1 2
2nd
d pr
inci
pal co
mpo
nent
t
1st principal component
Figure 6 – Distribution of Colors in factorial space of color SD score.
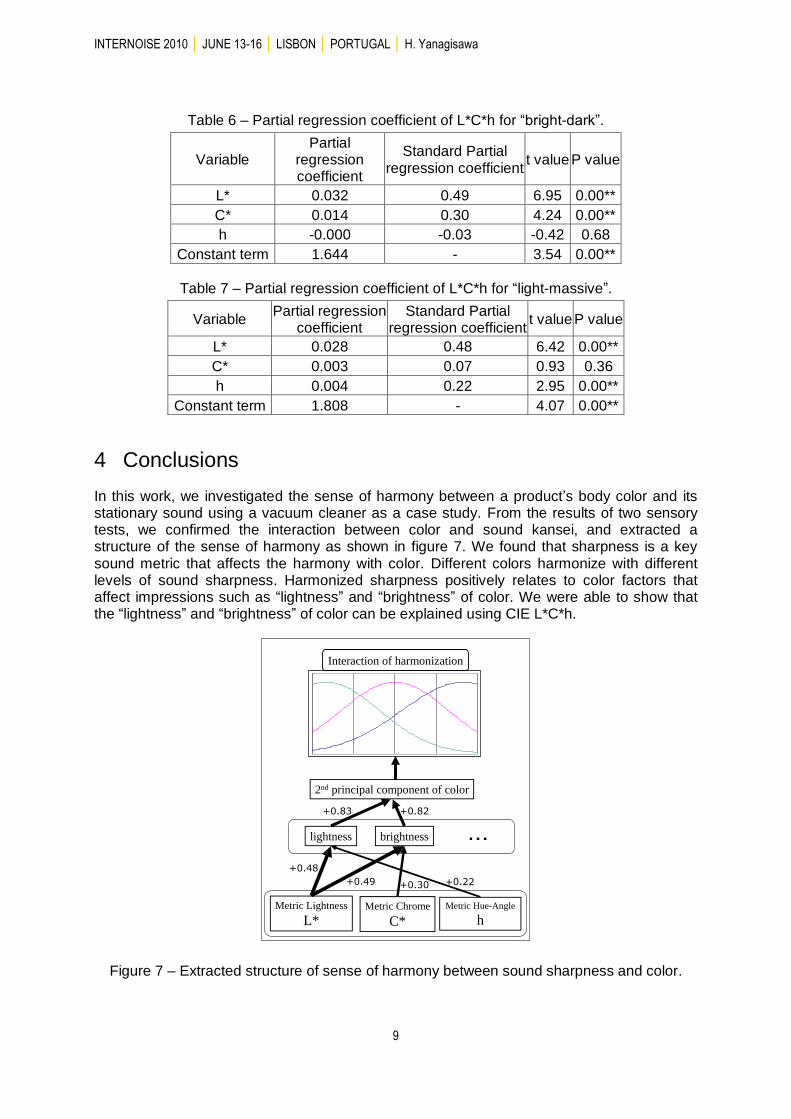
The perceptions of “light” and “bright” mostly affect the second factor. To explain those perceptions, we conduct a multiple regression analysis using CIE L*, C* and h. Table 6 shows the results using the color SD score of “bright-dark”. The partial regression coefficients of L* and C* are statistically significant at 1% significance level. In other words the metric lightness and metric chroma positively affect the impression of color brightness. Table 7 shows the results of multiple regression analysis using the color SD score of “light-massive”. The partial regression coefficients of L* and h are statistically significant, i.e., the metric lightness and hue affect the sense of color lightness.
INTERNOISE 2010 │ JUNE 13-16 │ LISBON │ PORTUGAL │ H. Yanagisawa
9
Table 6 – Partial regression coefficient of L*C*h for “bright-dark”.
Variable Partial
regression coefficient
Standard Partial regression coefficient
t value P value
L* 0.032 0.49 6.95 0.00**
C* 0.014 0.30 4.24 0.00**
h -0.000 -0.03 -0.42 0.68
Constant term 1.644 - 3.54 0.00**
Table 7 – Partial regression coefficient of L*C*h for “light-massive”.
Variable Partial regression
coefficient Standard Partial
regression coefficient t value P value
L* 0.028 0.48 6.42 0.00**
C* 0.003 0.07 0.93 0.36
h 0.004 0.22 2.95 0.00**
Constant term 1.808 - 4.07 0.00**
4 Conclusions
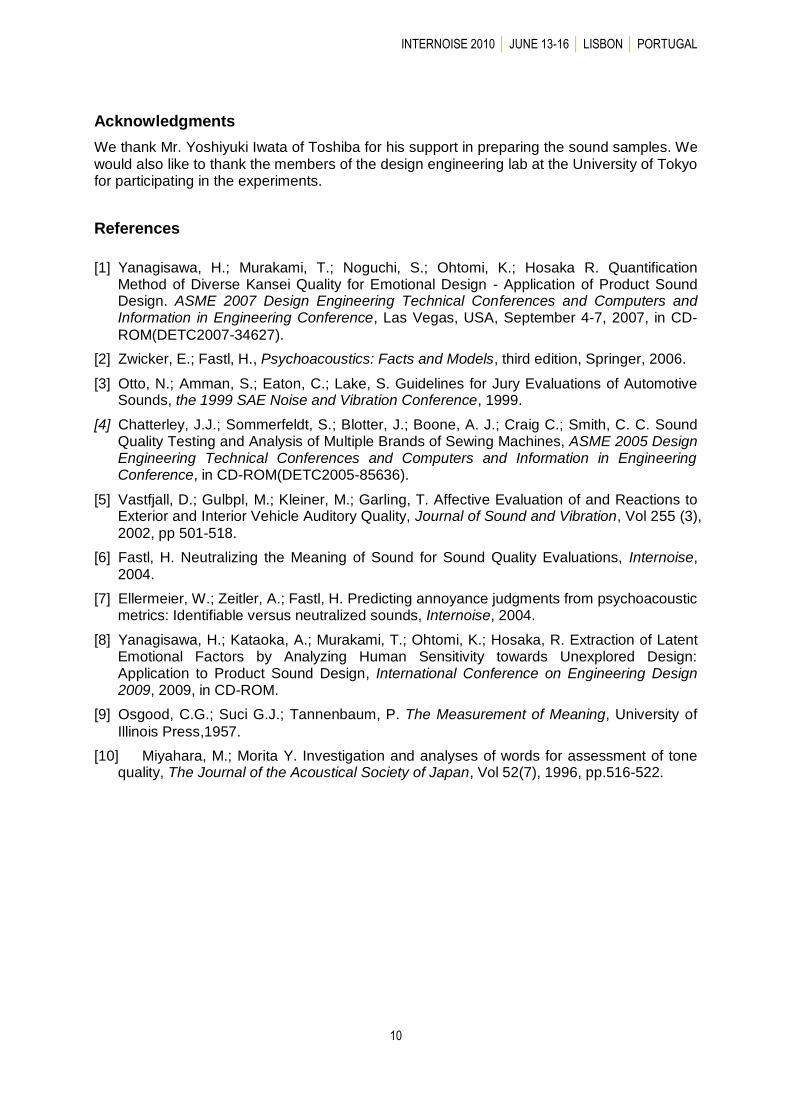
In this work, we investigated the sense of harmony between a product‟s body color and its stationary sound using a vacuum cleaner as a case study. From the results of two sensory tests, we confirmed the interaction between color and sound kansei, and extracted a structure of the sense of harmony as shown in figure 7. We found that sharpness is a key sound metric that affects the harmony with color. Different colors harmonize with different levels of sound sharpness. Harmonized sharpness positively relates to color factors that affect impressions such as “lightness” and “brightness” of color. We were able to show that the “lightness” and “brightness” of color can be explained using CIE L*C*h.
brightnesslightness
Metric Lightness
L*
Metric Hue-Angle
hMetric Chrome
C*
・・・
+0.48
+0.22+0.49 +0.30
+0.82+0.83
2nd principal component of color
Interaction of harmonization
Figure 7 – Extracted structure of sense of harmony between sound sharpness and color.
INTERNOISE 2010 │ JUNE 13-16 │ LISBON │ PORTUGAL
10
Acknowledgments
We thank Mr. Yoshiyuki Iwata of Toshiba for his support in preparing the sound samples. We would also like to thank the members of the design engineering lab at the University of Tokyo for participating in the experiments.
References
[1] Yanagisawa, H.; Murakami, T.; Noguchi, S.; Ohtomi, K.; Hosaka R. Quantification Method of Diverse Kansei Quality for Emotional Design - Application of Product Sound Design. ASME 2007 Design Engineering Technical Conferences and Computers and Information in Engineering Conference, Las Vegas, USA, September 4-7, 2007, in CD-
ROM(DETC2007-34627).
[2] Zwicker, E.; Fastl, H., Psychoacoustics: Facts and Models, third edition, Springer, 2006.
[3] Otto, N.; Amman, S.; Eaton, C.; Lake, S. Guidelines for Jury Evaluations of Automotive Sounds, the 1999 SAE Noise and Vibration Conference, 1999.
[4] Chatterley, J.J.; Sommerfeldt, S.; Blotter, J.; Boone, A. J.; Craig C.; Smith, C. C. Sound Quality Testing and Analysis of Multiple Brands of Sewing Machines, ASME 2005 Design Engineering Technical Conferences and Computers and Information in Engineering Conference, in CD-ROM(DETC2005-85636).
[5] Vastfjall, D.; Gulbpl, M.; Kleiner, M.; Garling, T. Affective Evaluation of and Reactions to Exterior and Interior Vehicle Auditory Quality, Journal of Sound and Vibration, Vol 255 (3), 2002, pp 501-518.
[6] Fastl, H. Neutralizing the Meaning of Sound for Sound Quality Evaluations, Internoise, 2004.
[7] Ellermeier, W.; Zeitler, A.; Fastl, H. Predicting annoyance judgments from psychoacoustic metrics: Identifiable versus neutralized sounds, Internoise, 2004.
[8] Yanagisawa, H.; Kataoka, A.; Murakami, T.; Ohtomi, K.; Hosaka, R. Extraction of Latent Emotional Factors by Analyzing Human Sensitivity towards Unexplored Design: Application to Product Sound Design, International Conference on Engineering Design 2009, 2009, in CD-ROM.
[9] Osgood, C.G.; Suci G.J.; Tannenbaum, P. The Measurement of Meaning, University of
Illinois Press,1957.
[10] Miyahara, M.; Morita Y. Investigation and analyses of words for assessment of tone quality, The Journal of the Acoustical Society of Japan, Vol 52(7), 1996, pp.516-522.
Related Documents