6. Senior Housing Survey 85 There are multiple ways to assess seniors’ current and future needs and desires. This study began with an evaluation of demographic data, with a special focus on housing, using primarily Census data. Other perspectives on housing needs were offered by senior housing facilities managers, who were surveyed by mail and email and participated in a focus group. A third perspective was provided by residents of senior housing facilities, who participated focus groups held around the state. To complete the picture of housing needs of seniors a statistically valid statewide survey of residents who are 55 years of age or older was undertaken, which is described in this chapter. The survey results, together with the other information gathering efforts noted above, are intended to give MSHDA an understanding of the types of senior housing, including the housing amenities, that would be appropriate in specific locations across the state. In addition, the survey had several goals: Gather information about the factors that are most likely to influence a senior’s propensity to move and determine what type of housing they will seek. Quantify the number of households based on age and income that will consider each type of senior housing. Identify the features seniors would like in their housing units. Identify the features seniors would like in the community in which they live. For the purposes of this study, the “community” is located within in or on the same property as a senior housing facility, outside of individual housing units. Identify the features seniors would like in the neighborhood in which they live. Gather information about the seniors’ assisted housing preferences and the reasons they would consider moving into such housing. A mail survey was chosen for this project. Development of the survey instrument began in August 2010 with the participation of members of a Steering Committee that had been assembled to monitor the study. 17 Thomas B. Jankowski, Ph.D., from the Institute of Gerontology at Wayne State University was engaged to assist with three key survey tasks: drawing the sample, entering and compiling data and returns, and reporting the results. In addition, Dr. Jankowski completed the required statistical analyses. Note that the cross-tabulations included in this Chapter are those where a significant relationship exists, as identified by Dr. Jankowski. The Michigan Secretary of State provided the database from which the survey sample of residents 55 years of age and older was derived. There were 3,182,300 cases in the data file after deleting those that had invalid zip codes. It is this data base from which the sample of 12,000 survey recipients was drawn. 17 Steering Committee members represented MSHDA (the project sponsors), Michigan Office of Services to the Aging, the Area Agencies on Aging (AAA), UPCAP Services, Inc., McKenna Associates, and NCB Capital Impact.

Welcome message from author
This document is posted to help you gain knowledge. Please leave a comment to let me know what you think about it! Share it to your friends and learn new things together.
Transcript

6. Senior Housing Survey
85
There are multiple ways to assess seniors’ current and future needs and desires. This study began with an
evaluation of demographic data, with a special focus on housing, using primarily Census data. Other perspectives
on housing needs were offered by senior housing facilities managers, who were surveyed by mail and email and
participated in a focus group. A third perspective was provided by residents of senior housing facilities, who
participated focus groups held around the state.
To complete the picture of housing needs of seniors a statistically valid statewide survey of residents who are 55
years of age or older was undertaken, which is described in this chapter. The survey results, together with the
other information gathering efforts noted above, are intended to give MSHDA an understanding of the types of
senior housing, including the housing amenities, that would be appropriate in specific locations across the state.
In addition, the survey had several goals:
Gather information about the factors that are most likely to influence a senior’s propensity to move and
determine what type of housing they will seek.
Quantify the number of households based on age and income that will consider each type of senior
housing.
Identify the features seniors would like in their housing units.
Identify the features seniors would like in the community in which they live. For the purposes of this
study, the “community” is located within in or on the same property as a senior housing facility, outside of
individual housing units.
Identify the features seniors would like in the neighborhood in which they live.
Gather information about the seniors’ assisted housing preferences and the reasons they would consider
moving into such housing.
A mail survey was chosen for this project. Development of the survey instrument began in August 2010 with the
participation of members of a Steering Committee that had been assembled to monitor the study.17
Thomas B. Jankowski, Ph.D., from the Institute of Gerontology at Wayne State University was engaged to assist
with three key survey tasks: drawing the sample, entering and compiling data and returns, and reporting the
results. In addition, Dr. Jankowski completed the required statistical analyses. Note that the cross-tabulations
included in this Chapter are those where a significant relationship exists, as identified by Dr. Jankowski.
The Michigan Secretary of State provided the database from which the survey sample of residents 55 years of age
and older was derived. There were 3,182,300 cases in the data file after deleting those that had invalid zip
codes. It is this data base from which the sample of 12,000 survey recipients was drawn.
17 Steering Committee members represented MSHDA (the project sponsors), Michigan Office of Services to the Aging, the Area Agencies on
Aging (AAA), UPCAP Services, Inc., McKenna Associates, and NCB Capital Impact.

6. Senior Housing Survey
86 MSHDA Senior Housing Market Study
At this point in the survey process, there was an interest in knowing how well the Secretary of State’s dataset
corresponded to the 2009 Census estimates, particularly with respect to Michigan Office of Services to the Aging
Planning and Service Areas (PSAs). As noted in Table 32 this comparison revealed an amazingly close
comparison, providing a high degree of comfort with the database.
Surveys were mailed with a MSHDA-addressed, stamped return envelope, in an effort to maximize return rates.
Survey printing and mailing was handled by the State of Michigan’s Print and Mail services.
Data entry was completed by the Institute of Gerontology personnel, with monitoring, auditing, and quality control
by senior staff to ensure that data were transcribed as accurately and reliably as reasonably possible. A total of
2,688 valid surveys were returned and entered, resulting in a margin of error of +-1.9% at the 95% confidence
interval at the state level.
This section presents a summary and analysis of notable survey results. The full results of the survey, including all
summary and analysis tables, are available in a companion document to this study.

6. Senior Housing Survey
87
The survey included several questions relative to the survey respondent’s current housing situation and
demographics. The purpose for collecting these data was two-fold: to be certain the survey properly represented
the senior population in Michigan, and, to provide valuable information to help analyze date later in this survey.
The following analysis summarizes the responses and identifies any trends associated with the current housing
patterns of survey respondents.
To verify the representative nature of the survey, a number of survey questions were compared with census data
for several measures to ensure that the results are in line with the general senior population in the State.
Following is an summary of the census validation measures.
Respondents were asked to identify their zip codes. Zip codes associated with the Area Agencies on Aging
Planning and Service Areas were used to determine the location of survey respondents. Additionally, a
respondent’s zip code was used to identify the type of settlement they reside in, urban, regional center, exurban,
or rural (see Chapter 1 for a description of settlement types).
Figure 7 illustrates the boundaries of AAA Planning and Service Areas and Table 32 reports the number of
respondents from each area. Survey responses per AAA Planning and Service Area align with the overall
percentage of population that reside in those areas. Table 32 reveals that the geographic location of survey
respondents is remarkably similar to the overall senior population.
Table 32. Respondents Location by AAA Planning and Service Areas
Figure 7. AAA Planning and Service Areas
Source: www.mi-seniors.net
AAA Location
Survey
Percent
2009 US Census Est.
Percent
1a 4.8% --
1b 26.6% 28.3%
1c 8.3% --
1a+1c 13.1% 17.9%
2 3.3% 3.2%
3a 2.9% 2.2%
3b 2.0% 2.1%
3c 1.0% 1.1%
4 3.3% 3.2%
5 6.4% 5.9%
6 4.0% 4.2%
7 7.1% 7.6%
8 8.9% 9.1%
9 3.5% 3.4%
10 4.0% 3.7%
11 4.2% 3.8%
14 4.0% 4.3%
Total: 100% 100%

6. Senior Housing Survey
88 MSHDA Senior Housing Market Study
Table 33. Gender
Survey respondents are slightly more likely to be female
than the general population, but this is not uncommon
for survey responses, and a variance of less than 4% is
well within acceptable bounds.
Table 34. Respondents Location by Settlement Type
Seniors are more likely to currently reside in a rural,
exurban or urban settlement type. They are least likely
to currently reside in a regional center.
Table 35. Household Size
Senior households predominately have 2 or few persons
residing in them. While the majority of households have
two persons, one person households account for almost
a quarter of all senior households in the State. Far less
common are households with more than three persons.
Table 36. Age Composition
The age composition of survey respondents is quite
consistent with the age composition of the State of
Michigan as reported by the US Census. Younger seniors
age 55-59 are somewhat under-represented in the
survey responses, but the remaining age cohorts are
well-distributed and consistent with the Census
composition.
Gender
Survey
Percent
2009 Census
Estimate Percent
Female 58.2% 54.5%
Male 41.8% 45.5%
Total: 100%
Settlement Type
Survey
Percent
2009 Census
Estimate Percent
Urban 27.1% 33.3%
Regional Center 16.5% 17.0%
Exurban 27.0% 28.4%
Rural 29.4% 21.3%
Total: 100% 100%
Household Size
Survey
Percent
2009 Census
Estimate Percent
1 24.7% 27.9%
2 60.1% 33.7%
3 8.9% 15.6%
4 or more 5.4% 22.8%
No answer 1.0% -
Total: 100% 100%
Age
Survey
Percent
2009 Census
Estimate Percent
55-59 20.0% 26.2%
60-64 23.1% 21.3%
65-69 18.7% 16.0%
70-74 14.2% 12.0%
75-79 10.0% 9.6%
80-84 7.3% 7.8%
85+ 6.7% 7.2%
Total: 100% 100%

6. Senior Housing Survey
89
Table 37. Current Dwelling
Survey respondents’ current dwelling status is generally
in line with overall Census figures for the state as a
whole. The most notable difference is that respondents
who lived in condominiums often chose the “other”
category, somewhat skewing the results and preventing a
direct comparison with Census data.
Table 38. Tenure
A high rate of ownership is prevalent among survey
respondents, consistent with Census data for the over 55
population.
Table 39. Income
The returned surveys are likely not as representative of
the population as a whole by income as by other
measures, particularly for lower income seniors.
However, the rest of the representation by income is
remarkably accurate.
There are a few reasons why the lower-income cohort is
underrepresented in the survey results. Lower income
groups are more transient which makes them harder to
locate for survey purposes. Also, lower income groups
are less likely to hold drivers’ licenses or to be
registered to vote, which means that they were less
likely to end up in the sample in the first place.
Current Dwelling
Survey
Percent
2009 Census
Estimate Percent
Single family house 78.5% 71.7%
Apartment, etc. 11.3% 22.7%
Mobile Home 4.3% 5.6%
Other 5.9% --
Total: 100% 100%
Tenure
Survey
Percent
2009 Census
Estimate Percent
I own my home 85.3% 82.1%
I live with
family/friends 3.1% --
I rent my home 11.6% 17.9%
Total: 100% 100%
Monthly Income
Survey
Percent
2006-2010
ACS PUMS
Under$832 10% 23.1%
$833 to $1,249 14.7% 12.4%
$1,250 to $2,083 19.1% 19.1%
$2,084 to $2,916 16.5% 13.9%
$2,917 to $4,166 17.1% 12.7%
$4,167 to $6,249 10.9% 9.7%
$6,250 to $8,333 5.1% 4.0%
$8,334 and over 6.7% 5.2%
Total: 100% 100%

6. Senior Housing Survey
90 MSHDA Senior Housing Market Study
Survey respondents were asked a number of questions about what would motivate them to move to an
independent living facility. The following is a summary of notable factors that influence a senior to consider
moving into an independent living facility. The primary purpose of this section is to identify demographic
characteristics that will inform the accuracy of market analyses for new senior housing facilities.
Table 40. Location of Previous Residence for Seniors Moving in the Previous Five Years
The table at left indicates that, for survey respondents who
have moved in the previous five years, 60.5% moved within the
same county and 11.5% moved from out of state.
This finding has implications for market analyses and facility
planning. Most importantly, it validates the findings from Table
16 on page 66 which indicates that between 71% and 100% of
residents in senior housing facilities had moved 25 miles or
less from their previous residence. Considering that a 25 mile
radius around a particular site will take in a good percentage of a county or counties, the above Table 40 is
consistent with the earlier finding. This confirms that most of the demand for new senior housing facilities will
come from within 25 miles of the site.
Survey respondents were asked to indicate if they planned on moving within the next 5 years. 11.8% indicated
yes, 62.4% indicated no, and 24.4% were not sure. By way of further examination, the results of the “planning to
move” question were cross tabulated with current tenure, type of current residence, length of residence, and age.
The following Figure 8 shows the percentage of “yes” responses broken down by four cross tabulations – tenure,
current house type, length of current residence, and age. Notable takeaways from the figure include:
Those living with family/friends and renters are much more likely to plan to move.
Those living in manufactured housing are somewhat more likely to plan to move.
The propensity to plan to move decreases based on length of residence.
Propensity to plan to move decreases with age.
Income is not included in the following Figure 8 because income is less related to the intent to move and more
related to what kind of housing a senior would prefer once they decide to move.
Moved From
Survey
Percent
Within the same county 60.5%
Another county 27.9%
Out of state 11.5%
Total: 100%

6. Senior Housing Survey
91
Figure 8. Planning to Move within 5 Years – Cross Tabulations
Table 41. Reasons Why Respondents Would Move
Respondents were asked to identify reasons why they
would want to move from their current home. The
table at left indicates that no longer being able to
maintain their home was the most selected response,
identified by over half of respondents. A reduced
living cost was also a popular choice, perhaps due to
the recent economic climate in the State. Better
weather and being closer to family were selected by
about 25% of respondents.
In terms of identifying likely candidates to move,
acuity and mobility limitations are commonly used
indicators for not being able to maintain a home in
Assisted Living market studies. Being closer to family
and better weather are not items that can be easily controlled for, and so will not likely have an impact on MSHDA
policy decisions. Reduced living costs is an important consideration, but likely will have more of an impact on
facility pricing than propensity to move.
12.0% 9.8%
35.0%
22.5%
11.3%
16.6% 18.3%
6.7%
17.8%
13.1%
8.9% 9.9%
5.5%
15.6%
9.5% 9.2% 8.4%
0.0%
5.0%
10.0%
15.0%
20.0%
25.0%
30.0%
35.0%
40.0%
Planning to Move within 5 Years Cross Tabulations
Percent Planning to Move by Grouping
Reason to Move
Survey
Percent
No longer able to maintain home 54.5%
Reduced living costs 38.8%
Better weather/climate 26.8%
Closer to family 26.4%
Other 13.2%
Access to hospitals/health services 12.8%
Accessible features not currently in home 12.3%
Access to community and social activities 12.0%
Lower crime/more safety 11.7%
Access to transportation services 8.7%
6. Senior Housing Survey
92 MSHDA Senior Housing Market Study
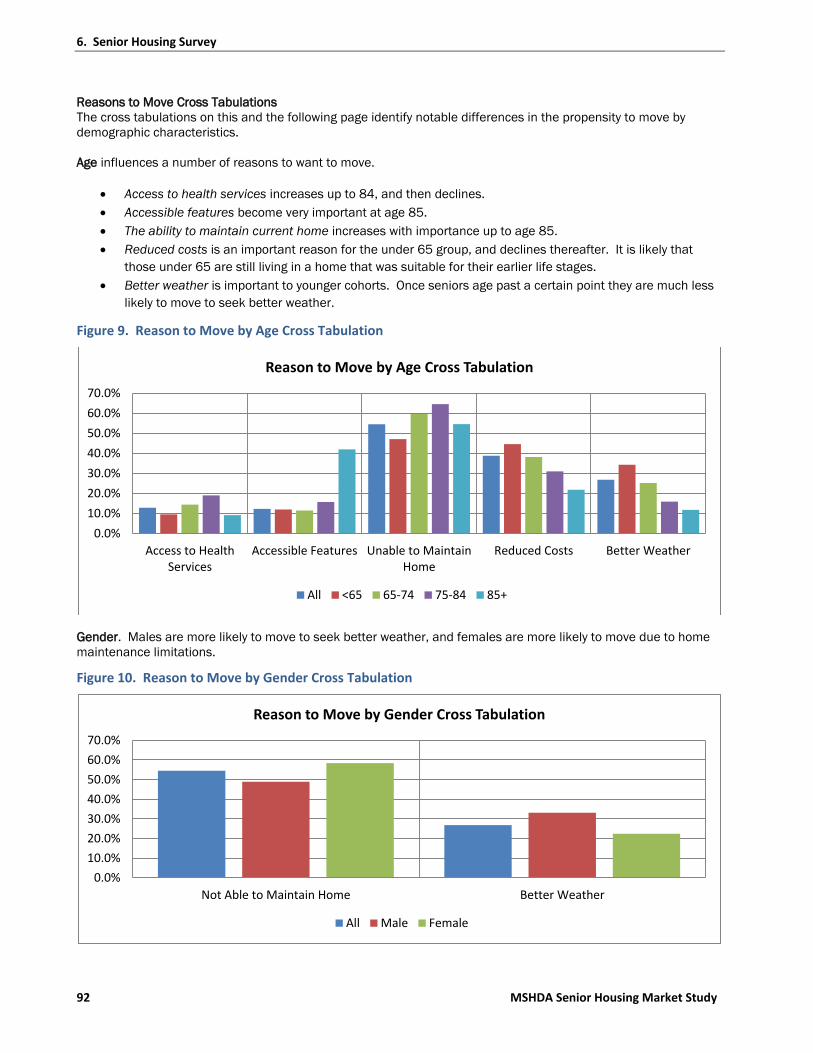
Reasons to Move Cross Tabulations
The cross tabulations on this and the following page identify notable differences in the propensity to move by
demographic characteristics.
Age influences a number of reasons to want to move.
Access to health services increases up to 84, and then declines.
Accessible features become very important at age 85.
The ability to maintain current home increases with importance up to age 85.
Reduced costs is an important reason for the under 65 group, and declines thereafter. It is likely that
those under 65 are still living in a home that was suitable for their earlier life stages.
Better weather is important to younger cohorts. Once seniors age past a certain point they are much less
likely to move to seek better weather.
Figure 9. Reason to Move by Age Cross Tabulation
Gender. Males are more likely to move to seek better weather, and females are more likely to move due to home
maintenance limitations.
Figure 10. Reason to Move by Gender Cross Tabulation
0.0%
10.0%
20.0%
30.0%
40.0%
50.0%
60.0%
70.0%
Access to HealthServices
Accessible Features Unable to MaintainHome
Reduced Costs Better Weather
Reason to Move by Age Cross Tabulation
All <65 65-74 75-84 85+
0.0%
10.0%
20.0%
30.0%
40.0%
50.0%
60.0%
70.0%
Not Able to Maintain Home Better Weather
Reason to Move by Gender Cross Tabulation
All Male Female

6. Senior Housing Survey
93
Current Tenure.
Better weather. Owners are more likely to move to seek better weather. This may be related to income
differences between owners and renters.
Reduced cost is most important to renters.
Access to transportation is of low importance overall, but of slightly higher importance to current renters.
Lower crime is more important to current renters.
Ability to maintain current home is important to current owners, who likely have much more maintenance
responsibilities than renters or co-dwellers.
Figure 11. Reason to Move by Current Tenure Cross Tabulation
Income. The desire for better weather is a greater factor for high income households, who can more readily afford
to move to a location of choice. Reduced costs are consistently important up to monthly income levels of $4,167
or more.
Figure 12. Reason to Move by Monthly Income Cross Tabulation
0.0%
10.0%
20.0%
30.0%
40.0%
50.0%
60.0%
70.0%
Better Weather Reduced Cost Access toTransportation
Lower Crime Not Able to MaintainHome
Reason to Move by Current Tenure Cross Tabulation
All Own Live with Family/Friends Rent
0.0%
10.0%
20.0%
30.0%
40.0%
50.0%
Better Weather Reduced Costs
Reason to Move by Income Cross Tabulation
All Under $832 $833 to $1,249 $1,250 to $2,083
$2,084 to $2,916 $2,917 to $4,166 $4,167 to $6,249 $6,250+

6. Senior Housing Survey
94 MSHDA Senior Housing Market Study
Table 42. Housing Types Respondents Would Consider Moving To
Our cultural preference for single-family housing
shows up in the survey responses. Over half of
respondents would consider moving to a single family
home or condo, while about 15% would consider
moving to an apartment with on-site services or into a
life-care facility.
Apartments that offer income-based rents and those
that are restricted to seniors only were identified by
about 25% of respondents as being desirable, which
is a notable difference from unrestricted apartments
and apartments with on-site services.
1 Respondents were given the option of choosing more than one type of housing. 2 See Appendix B
Housing Type Preference Cross Tabulations
The cross tabulations on this and the following page identify notable differences in the type of housing desired by
demographic characteristics.
Age. The desire for single family housing declines with age, while demand for age-restricted senior apartments
and life care facilities increase with age. Consistent with the results of the manager’s survey in Chapter 2, it is
reasonable to expect most residents of senior housing facilities will be 75 years of age or older.
Figure 13. Housing Type Preference by Age Cross Tabulation
0.0%
10.0%
20.0%
30.0%
40.0%
50.0%
60.0%
70.0%
Single Family Senior Apartment Life Care Facility
Type of Housing by Age Cross Tabulation
All <65 65-74 75-84 85+
Housing Type
Survey
Percent
Buy a single family home or condo 52.7%
Rent an apartment that offers rent based
on income 28.3%
Rent an apartment that is restricted to
seniors 24.4%
Rent apartment with onsite services 16.0%
Buy into a life care facility 14.7%
Rent an apartment without age restrictions 11.1%
Move in with family 9.5%
Other housing2 7.7%

6. Senior Housing Survey
95
Tenure. Those who currently own their homes are more likely to consider single family homes, while renters and
those who live with family are more likely to consider apartments. Life care facilities are much more desirable to
owners than renters, likely due to income or wealth differences (see below).
Figure 14. Housing Type Preference by Current Tenure Cross Tabulation
Income. Higher income households are more likely to desire single family houses or life care facilities, while lower
income households are more likely to consider income based apartments or moving in with family.
Figure 15. Housing Type Preference by Monthly Income Cross Tabulation
0.0%
10.0%
20.0%
30.0%
40.0%
50.0%
60.0%
70.0%
Single Family SeniorApartment
Income BasedApt.
RentUnrestrictedApartment
Life Care Facility Move inw/Family
Type of Housing by Current Tenure Cross Tabulation
All Own Live with Family/Friends Rent
0.0%
20.0%
40.0%
60.0%
80.0%
Single Family Income Based Apt. Life Care Facility Move in w/Family
Type of Housing by Income Cross Tabulation
All Under $832 $833 to $1,249 $1,250 to $2,083
$2,084 to $2,916 $2,917 to $4,166 $4,167 to $6,249 $6,250+

6. Senior Housing Survey
96 MSHDA Senior Housing Market Study
Gender. Males prefer single family residences while females are more likely to consider apartment-style living
arrangements.
Figure 16. Housing Type Preference by Gender Cross Tabulation
Table 43. Inter-Generational Housing Preference
Whether or not a senior prefers to live with other
seniors or in inter-generational community provides
senior housing providers with insight into whether or
not future communities should be age restricted.
Respondents would consider living in an un-restricted
community, but do not prefer children being permitted. About 1/3 of respondents would prefer an age-restricted
community, which is consistent with the housing type data from earlier in this section.
Respondents may have checked more than one option.
0.0%
10.0%
20.0%
30.0%
40.0%
50.0%
60.0%
70.0%
Single Family Senior Apartment Income Based Apt. Apt. w/Services Move in w/Family
Type of Housing by Gender Cross Tabulation
All Male Female
Housing Type
Survey
Percent
Multiple ages are present 61.6%
Only seniors (55 and older) 35.3%
Children are permitted 21.5%

6. Senior Housing Survey
97
Market studies should quantify the number of households based on age and income that will consider a particular
type of senior housing. The following factors are the most likely to influence a senior’s propensity to move and
what kind of housing they will seek.
Age is a critical factor that influences housing choice. Seniors under 75 are unlikely to consider living in a
senior housing facility.
Income is a critical factor that influences housing choice. Income will determine what kind of housing is
preferred. High income households with $4,166 or more of monthly income will choose detached or life
care facilities. Lower income households are more open to apartment-style senior housing. Households
with incomes under $2,083 are more likely to consider apartments, particularly apartments that are rent
based on income.
Distance. Seniors are most likely to move within 25 miles of their current residence. Those moving
farther than 25 miles will likely do so to seek better weather in a different state, to move closer to family,
or to move to a uniquely desirable continuing care retirement community (see Table 16 on page 66 for an
explanation of distance moved to a CCRC).
Tenure. Seniors that are renting or living with friends/family are much more likely to plan to move than
those who own their home.
No longer being able to maintain a current residence. Location and market study work should focus on
identifying households that are no longer able to maintain a home, such as those who are older than 75
and/or those with acuity or mobility limitations.
Market qualification of households. Generally, about 25% of qualified households will consider living in
an apartment style senior housing development. Which one they choose will be based on amenities and
rents that match their income level, so careful quantification of the pool of potential residents will be an
important market study step.

6. Senior Housing Survey
98 MSHDA Senior Housing Market Study
Now that we have examined the reasons why seniors might move to a new location, and what factors influence
their choice of what kind of housing to seek, we can examine facility-level preferences. This section summarizes
preferences for independent living facilities, and identifies the building features and community and neighborhood
amenities that will be important when choosing their next home.
First, we examine what influenced current senior housing residents to move to their current location. Survey
respondents were also asked to indicate if their dwelling was located in a building or community intended primarily
for people 55 years and older. The majority (91.7%) of respondents indicated that they do not live in such a
building or community. Of 7% that reside in such a building or community, the majority (48.4%) live in an
independent-living senior apartment building.
Those residents who already live in an independent living facility were then asked to identify factors that made
them choose an independent living community. Note that residents in assisted living or nursing home properties
may have been less likely to answer the survey due to physical limitations.
Table 44. Reasons Existing Senior Housing Residents Moved to Their Current Residence
The table at left indicates that the ability to age in
place without moving and safety and accessibility
features are important reasons that attracted
current senior housing residents. Location,
activities, and rent were also cited as important by
more than 1/3 of all respondents.
Table 45. Preferred Number of Bedrooms
Respondents were asked how many bedrooms would be
preferred in their next residence. The majority (60.1%) indicated
they would prefer a home with two bedrooms followed by 25.7%
indicating they would prefer three bedrooms. Less than 12% of
respondents indicated that they would prefer a studio or a
dwelling with only one bedroom. The responses to this question
should give direction for the design and construction of new
senior housing.
Characteristic
% Identifying as
Important
Ability to age in place without moving 45.0%
Home safety and accessibility features 43.9%
Location closer to family and friends 38.3%
Access to activities and services 36.7%
Reduced rent or rent based on income 35.6%
Assistance with home maintenance 27.8%
Access to community amenities and features 27.8%
Previous home not affordable 20.6%
Offers arranged transportation 13.9%
Number of Bedrooms Percent
0 (studio) .5%
1 11.4%
2 60.1%
3 25.7%
4 2.3%
Total: 100%

6. Senior Housing Survey
99
Bedroom Preference Cross Tabulation
There was a statistically significant relationship between household size and the number of bedrooms preferred.
Not surprisingly, households preferred a number of bedrooms that was generally equal to or greater than their
household size. The following chart indicates that:
Figure 17. Bedroom Preference by Household Size Cross Tabulation
Among the different household sizes, one bedroom units are most desirable to one-person households.
Yet only 30% of one-person households indicated a preference for a one bedroom unit, meaning that
most one person households would prefer a 2 bedroom unit.
Over 90% of two-person households would prefer a two or three bedroom unit.
Three person households are split, with 50% preferring a 2 bedroom unit and 40% preferring a four
bedroom unit.
Four person households display the most varied demand, with about 40% preferring 2 bedroom units,
40% preferring 3 bedroom units, and 15% preferring a 4 bedroom unit.
0.0%
10.0%
20.0%
30.0%
40.0%
50.0%
60.0%
70.0%
0 1 2 3 4
Bedrooms Preferred
Bedroom Preference by Household Size Cross Tabulation
All 1 2 3 4Household size:

6. Senior Housing Survey
100 MSHDA Senior Housing Market Study
The availability of features that improve an apartment’s safety and accessibility plays a role in where a senior may
choose to rent a dwelling. Respondents were asked to rate each feature as not important, somewhat important,
important, or extremely important.
The following Table 46 identifies those features deemed important. The table includes the percent of respondents
indicating if the feature was important or extremely important, and a cumulative column that is the sum of
important and extremely important responses.
The table is sorted in descending order according to the cumulative percentage, but it is very important to note
that the column labeled “Extremely Important” is also perfectly ordered in descending fashion. Respondents
indicating that the identified safety and accessibility features were important ranged in the 23% to 30% range
across all responses, meaning that the difference in ranking is attributed entirely to those responding that a
feature was extremely important. For this reason, it is more instructive to focus on the “Extremely Important”
column and discount the important and cumulative columns in the following table.
Based on the extremely important column, it is apparent that:
One-story units and bedrooms on the first floor are critical design features
Minimal steps into the unit and bathroom grab bars are of secondary importance and should be
incorporated into new facility design.
Room for a caregiver is not an important feature.
The remaining features less important for marketability to seniors.
Table 46. Important Safety and Accessibility Features
Feature1 Important Extremely Important Cumulative
Bedroom on 1st Floor 23.2% 63.0% 83.2%
One-Story 23.6% 54.7% 78.3%
Minimal step up to get into house/apartment 29.0% 46.6% 75.6%
Grab bars in shower/around toilet 28.4% 43.7% 72.1%
Wide hallways and doorways 30.4% 33.2% 63.6%
Shower only (with seat or ability to roll in wheel chair) 27.9% 30.6% 58.5%
Personal emergency response system 26.6% 30.2% 56.8%
Bathroom large enough for a wheel chair 25.2% 28.0% 53.2%
Bathtub with a door to assist stepping in 24.1% 20.6% 44.7%
Room for a caregiver 14.5% 14.0% 28.5%
1 See Appendix C for “other” features identified by respondents

6. Senior Housing Survey
101
Safety and Accessibility Cross Tabulations
The only cross tabulation with safety and accessibility features that showed a relationship was age. This makes
intuitive sense as safety and accessibility features are primarily related to the effects of aging which all seniors
experience, regardless of where they live, their income, or any of the other demographic factors.
Of the safety and accessibility features, there was no relationship to age cohort among the desirability of the 1st
floor bedroom, one-story unit, and minimal step features and age cohort. Each of those features was consistently
desired across all ages.
Figure 18. Safety and Accessibility Feature Preference by Age Cross Tabulation
In general, the importance of safety and accessibility features increases with respondent age.
There is a consistent demand spread of about 20% between the <65 and 85+ category.
The demand among 85+ seniors is over 60% for all safety and accessibility features.
Based on respondent demand from Table 46 and Figure 18, new senior housing facilities should
incorporate all safety and accessibility features except for bathtubs with doors and caregiver
accommodations. The exception may be rent based on income senior apartments, which appeal to the
65-74 age cohort. Rent-restricted facilities may not need all of the safety and accessibility features.
20.0%
30.0%
40.0%
50.0%
60.0%
70.0%
80.0%
90.0%
100.0%
BathroomGrab Bars
Wide Hallways Shower Only PersonalEmerg.
Reponse
WheelchairAccessibleBathroom
Bathtubw/Door
Room forCaregiver
Safety/Accessibility Preference by Age Cross Tabulation
All <65 65-74 75-84 85+

6. Senior Housing Survey
102 MSHDA Senior Housing Market Study
Features or amenities offered in a particular apartment affects where a senior may choose to reside in the future.
Respondents were asked to rate each feature as not important, somewhat important, important, or extremely
important.
The following Table 47 identifies those features deemed important. For purposes of determining the rank of
features, extremely important and important responses were combined. Once again, the extremely important
column nearly perfectly correlates with the ordering by cumulative importance, while the important column does
not show a ready relationship to cumulative importance. 25% to 35% of respondents replied that each amenity
was important, and so once again, the percent of respondents answering that an amenity is extremely important is
more instructive.
Table 47. Important Apartment Unit Features
Feature Important Extremely Important Cumulative
Laundry machines in apartment 26.1% 66.2% 92.3%
Energy efficient appliances 35.9% 49.8% 85.7%
Garage or carport parking 34.7% 47.6% 82.3%
Security system 31.1% 47.0% 78.1%
Private patio or balcony 35.1% 36.3% 71.4%
Dishwasher 26.5% 42.0% 68.5%
Additional storage 30.4% 35.6% 66.0%
High speed internet 30.4% 35.6% 66.0%
Walk-in closets 33.6% 32.1% 65.7%
Based on the extremely important column, it is apparent that:
Laundry machines in apartment units are the most important feature by a healthy margin.
Energy efficient appliances, garage or carport parking, security systems, and dishwashers are extremely
important to 40%-50% of respondents, enough that these should be mandatory for new senior housing
facilities.
The remaining features – private patio/balcony, additional storage, high-speed internet, and walk-in
closets were extremely important to between 30%-36% of respondents, and important or extremely
important to over 66% of respondents. It is possible that a new facility could be successful without one of
the features in the following table, but missing two or more of the features would most likely have a
negative impact on the desirability of the project.

6. Senior Housing Survey
103
Apartment Unit Features Crosstabulations
Apartment Unit Features by Settlement Type. When the apartment building features question was cross tabulated
with settlement type (rural, regional center, exurban, urban), there were a few notable differences that are
summarized in the following figure.
Note that laundry machines in the apartment, energy efficient appliances, and garage/carport parking displayed
no notable difference in demand among settlement types and are not included in the following figure.
Figure 19. Important Apartment Features by Settlement Type Cross Tabulations
Security systems are more important in urban and exurban areas (about 85%) than rural and regional
center areas (about 70%).
Patios/balconies are relatively less important to rural respondents than respondents from other
settlement types.
Dishwashers and additional storage are more important to exurban and urban respondents than rural or
regional center respondents.
High speed internet is most important to exurban respondents.
Walk-in closets are more important to exurban and urban respondents.
50.0%
55.0%
60.0%
65.0%
70.0%
75.0%
80.0%
85.0%
90.0%
Security System Patio/Balcony Dishwasher Additional Storage High-SpeedInternet
Walk-in Closets
Apartment Features by Settlement Type Cross Tabulations
All Rural Regional Center Exurban Urban

6. Senior Housing Survey
104 MSHDA Senior Housing Market Study
Apartment Unit Features by Income. When the apartment building features question was cross tabulated with
income group there were a few notable differences that are summarized in the following chart.
Note that laundry machines, energy efficient appliances, security systems, and private patio/balconies displayed
no notable difference among income groups and are not included in the following figure.
Figure 20. Important Apartment Features by Monthly Income Cross Tabulations
Generally, there is an increasing demand for features with higher income.
Garages are important to all income groups, but somewhat less important to the lowest two income
groups.
Dishwasher importance rises once incomes exceed $2,084 a month.
Additional storage and high-speed internet importance rises once incomes exceed $2,917 a month.
Walk in closets are more important to the highest income group.
50.0%
60.0%
70.0%
80.0%
90.0%
100.0%
Garage/Carport Dishwasher Additional Storage High-Speed Internet Walk-in Closets
Apartment Features by Income Cross Tabulations
All Under $832 $833 to $1,249 $1,250 to $2,083
$2,084 to $2,916 $2,917 to $4,166 $4,167 to $6,249 $6,250+

6. Senior Housing Survey
105
Apartment Features by Age. When the apartment building features question was cross tabulated with age group
there were a few notable differences that are summarized in the following figure.
Note that laundry security systems and walk-in closets displayed no notable difference among age groups and are
not included in the following figure.
Figure 21. Important Apartment Features by Age Cross Tabulations
Generally, there is an decreasing demand for features with higher age.
The 85+ age group is notably different than the other age groups.
There are smaller differences between the <65, 65-74, and 75-84 age groups.
As most seniors will start to consider senior housing facilities around age 75, it will be important for
independent living facilities to provide competitive facilities.
The above figure indicates that there is less importance for apartment features in assisted living facilities
that cater to the frail elderly which are generally older.
Apartment Features Cross Tabulations Conclusions. The above cross tabulation findings indicate that senior
housing projects that are targeted to urban and exurban, and higher income groups will require a more extensive
list of features than rural/regional center and lower income groups. However, it is important to note that even at
lower demand levels, all of the features are still rated as being important by more than half of respondents in all
demographic groups.
0.0%10.0%20.0%30.0%40.0%50.0%60.0%70.0%80.0%90.0%
100.0%
LaundryMachines
Energy EfficientAppliances
Garage/Carport Patio/Balcony Dishwasher AdditionalStorage
High-SpeedInternet
Apartment Features by Age Cross Tabulations
All <65 65-74 75-84 85+

6. Senior Housing Survey
106 MSHDA Senior Housing Market Study
Value of Apartment Unit Features
To further analyze how important apartment features were to respondents they were asked to put a value on how
much more per month would they be willing to pay for each feature.
The following table identifies the percentage of respondents and what they would be willing to pay for these
features to be included in their apartment. Respondents consistently identified $1-$25 as the most likely amount
they would be willing to pay for features if offered for an additional fee, with the exception of pets, which most
respondents are not willing to pay for.
Respondents appeared to have the highest tolerance for payment surcharges of more than $25 for utilities, which
makes intuitive sense as the respondent would have to pay for utilities separately if not included in the rent.
Table 48. Value of Apartment Unit Features
LaundryMachines
AdditionalStorage
Garage orCarport
Utilities incl. inRent (exceptcable/phone)
Pet Fee
$0 18% 35% 23.90% 16.60% 57.60%
$1-25 58.60% 49.20% 43.80% 28.90% 30.50%
$26-50 18.90% 13% 23.20% 24.50% 8.20%
$51-75 3% 1.90% 6.60% 18.10% 2%
$76-100 1.50% 0.90% 2.40% 11.90% 1.80%
0%
10%
20%
30%
40%
50%
60%
70%
Pe
rce
nt
6. Senior Housing Survey
107
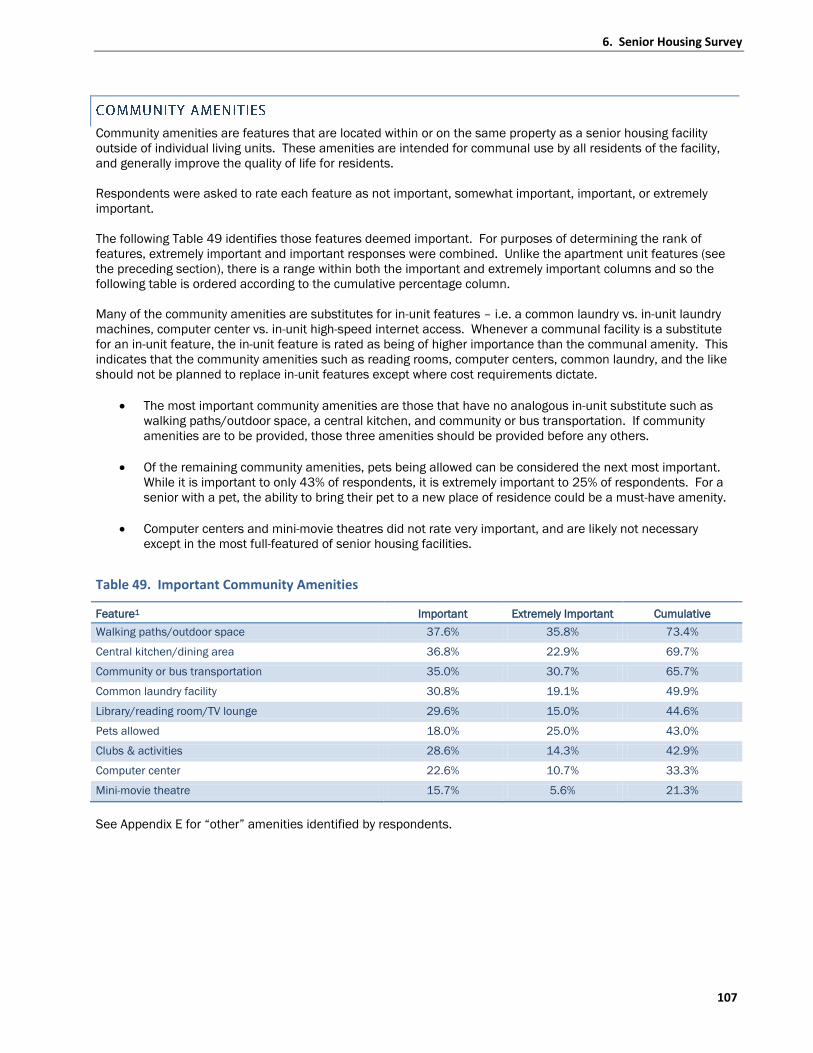
Community amenities are features that are located within or on the same property as a senior housing facility
outside of individual living units. These amenities are intended for communal use by all residents of the facility,
and generally improve the quality of life for residents.
Respondents were asked to rate each feature as not important, somewhat important, important, or extremely
important.
The following Table 49 identifies those features deemed important. For purposes of determining the rank of
features, extremely important and important responses were combined. Unlike the apartment unit features (see
the preceding section), there is a range within both the important and extremely important columns and so the
following table is ordered according to the cumulative percentage column.
Many of the community amenities are substitutes for in-unit features – i.e. a common laundry vs. in-unit laundry
machines, computer center vs. in-unit high-speed internet access. Whenever a communal facility is a substitute
for an in-unit feature, the in-unit feature is rated as being of higher importance than the communal amenity. This
indicates that the community amenities such as reading rooms, computer centers, common laundry, and the like
should not be planned to replace in-unit features except where cost requirements dictate.
The most important community amenities are those that have no analogous in-unit substitute such as
walking paths/outdoor space, a central kitchen, and community or bus transportation. If community
amenities are to be provided, those three amenities should be provided before any others.
Of the remaining community amenities, pets being allowed can be considered the next most important.
While it is important to only 43% of respondents, it is extremely important to 25% of respondents. For a
senior with a pet, the ability to bring their pet to a new place of residence could be a must-have amenity.
Computer centers and mini-movie theatres did not rate very important, and are likely not necessary
except in the most full-featured of senior housing facilities.
Table 49. Important Community Amenities
Feature1 Important Extremely Important Cumulative
Walking paths/outdoor space 37.6% 35.8% 73.4%
Central kitchen/dining area 36.8% 22.9% 69.7%
Community or bus transportation 35.0% 30.7% 65.7%
Common laundry facility 30.8% 19.1% 49.9%
Library/reading room/TV lounge 29.6% 15.0% 44.6%
Pets allowed 18.0% 25.0% 43.0%
Clubs & activities 28.6% 14.3% 42.9%
Computer center 22.6% 10.7% 33.3%
Mini-movie theatre 15.7% 5.6% 21.3%
See Appendix E for “other” amenities identified by respondents.

6. Senior Housing Survey
108 MSHDA Senior Housing Market Study
Community Amenities Cross Tabulations
The importance of community amenities across all demographic groups is remarkably consistent, with just a few
notable exceptions:
Settlement Type. There were four community amenities that showed a significant relationship between
respondent’s settlement type and preference:
Figure 22. Importance of Community Amenities by Settlement Type Cross Tabulation
Walking paths are more important to exurban respondents.
Clubs and activities are important to over 70% of all exurban respondents, compared to about 40% of
rural and regional center respondents and slightly less than 50% of urban respondents. We can only
speculate about the reasons for this result, but it does highlight an important consideration for facilities in
exurban areas.
Computer centers and mini-movie theatres, while not very important overall, are more important to
exurban and urban residents. Facilities in exurban and urban areas may want to consider incorporating
these kinds of amenities.
0.0%
20.0%
40.0%
60.0%
80.0%
100.0%
Walking paths/outdoorspace
Clubs and activities Computer center Mini-movie theatre
Community Amenities by Settlement Type Cross Tabulation
All Rural Regional center Exurban Urban

6. Senior Housing Survey
109
Age. There were three community amenities that showed a significant relationship between respondent’s age and
preference:
Figure 23. Importance of Community Amenities by Age Type Cross Tabulation
Walking paths are more important to younger seniors.
The ability to keep pets decreases with age. Half of respondents younger than 65 find it important to
keep pets, while just 25% of those older than 85 find it important.
Computer centers are more important to younger seniors. This may be a function of younger seniors
being more comfortable with computers than the older cohorts, and this feature may increase in
importance as the current younger senior cohort ages.
0.0%
10.0%
20.0%
30.0%
40.0%
50.0%
60.0%
70.0%
80.0%
90.0%
Walking paths/outdoor space Pets Allowed Computer center
Community Amenities by Age Cross Tabulation
All <65 65-74 75-84 85+

6. Senior Housing Survey
110 MSHDA Senior Housing Market Study
Neighborhood features are located within the same neighborhood as the senior housing facility, and serve all
residents of the neighborhood. These neighborhood features generally take two forms – features that serve
“needs of living” and features that do not serve needs of living but do offer “quality of life benefits.” Grocery
stores, pharmacies, and medical care are needs of living, while parks, restaurants, and the like offer quality of life
benefits.
Respondents were asked to rate each feature as not important, somewhat important, important, or extremely
important. The following Table 50 identifies those features deemed important. For purposes of determining the
rank of features, extremely important and important responses were combined. Like the apartment unit features
results, all neighborhood features were rated as being “important” by a similar percentage of respondents.
Therefore, the difference in ratings in the table is attributable to the percent of respondents rating each feature as
being “extremely important.”
Notable conclusions from the table include:
Grocery stores and pharmacies were rated as being “extremely important” by over half of respondents.
Over 93% of the respondents rated grocery stores “important” or “extremely important.” The
corresponding figure for pharmacies was 85.9%. Medical services and hospitals were slightly less
“extremely important,” but nearly equally “important” overall. Proximity to grocery stores, pharmacies,
medical services, and hospitals should be weighted in senior housing policy decisions. This finding is not
surprising, as these four services are necessities of living for seniors.
Proximity to churches and restaurants is desirable, being extremely important to about 1/3 and important
to about 2/3 of all respondents. Proximity to these features should not be a requirement for senior
housing facilities, but facilities that are located close to churches and restaurants should be given
preference.
Parks, fitness facilities, and libraries were rated as being extremely important by less than 20% of
respondents. Proximity to these features would likely benefit a senior housing facility, but such proximity
may not need to be given priority in senior housing location or funding decisions.
“Proximity” to neighborhood features will depend on the place-type in which the senior housing facility is
proposed. It is possible for a senior housing facility to be located within walking distance of several
neighborhood features in an urban or regional center context, a few features in an exurban context, and
no features in a rural context. The definition of “proximate” will have to be adjusted on a case-by-case
basis, but a potential rule of thumb would be to define proximity as being located within a 5 to 10 minute
travel time via walking, transit, or community bus. Travel time equalizes for distance, as one can travel
farther in the same amount of time in less developed areas when compared to busier, denser areas.
Table 50. Important Neighborhood Features
Feature Important Extremely Important Cumulative
Grocery stores 36.5% 57.0% 93.5%
Pharmacies 34.9% 51.0% 85.9%
Medical services 39.6% 45.5% 85.1%
Hospital 40.4% 42.6% 83.0%
Churches/places of worship 34.1% 36.8% 70.9%
Restaurants 38.8% 29.7% 68.5%
Parks and other outdoor recreation 38.7% 19.9% 57.6%
Fitness facility or similar 32.7% 17.7% 50.4%
Library (public) 31.7% 17.7% 49.4%

6. Senior Housing Survey
111
Neighborhood Features Cross Tabulations
The importance of neighborhood features is remarkably consistent across all demographic groups, with just a few
notable exceptions:
Settlement type. The following figure shows the importance given to neighborhood amenities by respondents from
different settlement types.
Note that there was no significant difference in demand for medical services, places of worship, or parks and
recreation among respondents from different settlement types.
Figure 24. Importance of Neighborhood Features by Settlement Type Cross Tabulation
Demand for neighborhood amenities generally increases along the rural-urban continuum, with urban
residents typically having about a 10% greater preference for neighborhood amenities than rural
residents.
The differences, while statistically significant, are not particularly large or divergent from the overall
averages. The cross tabulation may support a marginally lower neighborhood amenity standard or
importance in rural areas, where such neighborhood amenities may be sparse and separated, making
proximity to more than a few neighborhood amenities difficult. Still, senior facilities in rural areas would
benefit from being located as close as possible to concentrations of neighborhood features.
0.0%
20.0%
40.0%
60.0%
80.0%
100.0%
Grocery Stores Pharmacies Hospital Restaurants Fitness Facilities Libraries
Neighborhood Features by Settlement Type Cross Tabulations
All Rural Regional center Exurban Urban

6. Senior Housing Survey
112 MSHDA Senior Housing Market Study
Age. There are two significant relationships between age and importance of neighborhood features:
Parks and recreation are more important to younger seniors.
Fitness facilities are more important to younger seniors.
The importance of parks and physical fitness to younger seniors could be related to generally better health among
younger seniors, but it also could be related to a generational preference for health and physical fitness among
Baby Boomers. It will be interesting to see if current younger seniors’ zeal for physical fitness and recreation
persists as they age.
Figure 25. Importance of Neighborhood Features by Age Cross Tabulation
0.0%
20.0%
40.0%
60.0%
80.0%
100.0%
Parks Fitness Facilities
Neighborhood Features by Age Cross Tabulations
All <65 65-74 75-84 85+

6. Senior Housing Survey
113
The survey posed a series of questions regarding the reasons a respondent would consider moving into an
assisted living facility. The following is an analysis of those results.
Table 51. Reasons One Might Move to an Assisted Living Building
Respondents were asked to identify what the main
reason they might choose to move into an assisted living
apartment building as opposed to living in an
independent apartment building.
The table at left makes abundantly clear that being
unable to live independently is the primary reason that
respondents would choose assisted living.
1 9.6% of those who responded to this question selected multiple answers. Only the first of those was recorded.
Respondents were asked to identify how much they would be willing to pay monthly, in addition to their base rent,
for the features identified below.
Table 52. Value of Assisted Living Building Features
Note: Several respondents wrote in the margins of the survey that they had no idea what these services typically
cost, they had no need for these services, or they had no basis to judge the value of such services.
Daily Meal Housekeeping LaundryTransportation
Services
$0 20.7% 24.7% 25.1% 24.3%
$1-50 37.0% 47.1% 57.6% 53.2%
$50-100 18.0% 21.0% 13.9% 17.9%
$101-150 9.7% 5.4% 2.5% 2.9%
$151-200 7.8% 1.5% 0.7% 1.2%
$201-250 6.9% 0.5% 0.3% 0.5%
0.0%
10.0%
20.0%
30.0%
40.0%
50.0%
60.0%
70.0%
Reason Percent
No longer able to live independently 1 76.5%
I would not consider assisted living 9.8%
Knowledge that I could purchase services 7.9%
If my children wanted me to 2.9%
To live in a building with a manager present 1.6%
Total: 100%

6. Senior Housing Survey
114 MSHDA Senior Housing Market Study
About 75% of respondents indicated that they would be willing to pay for housekeeping, laundry, and
transportation services, with about half of respondents willing to pay between $1 and $25 for each
service.
Almost 80% of respondents indicated a willingness to pay some amount for daily meal service. 25% of
respondents indicated that they would pay more than $100 a month for meal service, while 55% would
pay between $1 and $100 dollars.
Meal service was the only building feature that a reasonably large percentage of respondents would pay
more than $100 for.
Respondents were asked to identify how much they would be willing to pay monthly, in addition to their base rent,
for the features identified below.
Table 53. Value of Assisted Living Building Personal Care Services
A high percentage of respondents indicated they would be unwilling to spend anything for the services
indicated, suggesting that many respondents have the expectation that such services would be included
in the base rent.
Among those who would pay extra for medication reminders or management and wellness nurse services,
most would pay a minimal amount, $1-50 per month.
Survey respondents indicated a greater willingness to pay for support with activities of daily living. About
a third of respondents would pay $1-$50, while another third would pay more than $50 a month for such
services.
The survey results may reflect a lack of knowledge by respondents about the actual costs of services.
Medication Reminders &Management
Wellness NurseSupport with Activites of
Daily Living
$0 42.9% 45.5% 28.4%
$1-50 46.4% 36.7% 36.6%
$50-100 7.9% 13.4% 18.8%
$101-150 1.8% 3.1% 8.4%
$151-200 0.5% 0.7% 4.9%
$201-250 0.5% 0.6% 3.0%
0.0%5.0%
10.0%15.0%20.0%25.0%30.0%35.0%40.0%45.0%50.0%

6. Senior Housing Survey
115
Table 54. Assisted Living Rent and Service Payment Preference
Respondents were asked to indicate their preference
regarding payment of rent and services in assisted living
facilities. Two out of five respondents would prefer to add
services as needs increase, indicating a demand for
independent living initially with the option to add in necessary
assisted living services when/if the need arises. This model
exists for some independent living and congregate facilities
and by definition all CCRC facilities.
Another third of respondents would prefer to pay for assisted living services based on their income.
Only 14% of respondents would prefer rent and services to be bundled together, as is sometimes the case with
market-rate assisted living facilities.
The survey results suggest that two pricing models are likely for assisted living facilities, with the pricing model
being tied to the type of facility:
Independent with Services facilities (including independent and CCRC facilities) should use the a-la-carte
payment for services model, as this model will allow seniors to customize their level of service(s) to their
own individual needs and ability to pay. This is a better model for facilities where seniors will be expected
to have longer terms of residence and where they will age in place. These additional fee-based services
can help to overcome the reason why a large majority of residents would move to assisted living, that
being the inability to live independently (see Table 51 and Table 54).
The implications of having very frail seniors in the same building as more independent seniors may have
implications on the marketability and desirability of the facility for more independent seniors. This point
warrants further research.
Assisted Living Facilities would appear to be best served by offering a program that allows residents to
add services as needs increase, or to offer a program that relates payment to income. Only 14.1% would
like rent and services bundled. Not withstanding these observations, there is a low tolerance for
individual feature pricing, with the majority of respondents being willing to pay $50 or less for each
service included in the survey.
Preference Percent
Add services as needs increase 41.9%
Pay based upon income 34.7%
Have rent and services be bundled 14.1%
Pay for rent and services separately 9.3%
Total: 100%
Related Documents