Frequency Table Frequency Percent 18 - 24 7 .7 25 - 34 107 10.7 35 - 44 129 12.9 45 - 54 224 22.4 55 - 70 330 33.0 71+ 195 19.5 Refused 8 .8 Total 1000 100.0 Frequency Percent Male 445 44.5 Female 555 55.5 Total 1000 100.0 Frequency Percent Democrat 329 32.9 Republican 376 37.6 Independent 145 14.5 Refused 150 15.0 Total 1000 100.0 Frequency Percent Valid Yes 1000 100.0 Frequency Percent NOT FAMILIAR/AWARE AT ALL 337 33.7 02 76 7.6 03 60 6.0 04 42 4.2 05 169 16.9 06 66 6.6 07 52 5.2 08 68 6.8 09 18 1.8 VERY FAMILIAR 92 9.2 DK/REF 20 2.0 Total 1000 100.0 QUAL1. Could you please tell me your age? Valid QUAL2. By observation: Valid QUAL3. Are you registered with a political party? Valid Q1. Are you familiar with the Seneca Nation of Indians' tobacco and gaming economy? Q2. Seneca Nation operations total $1.1 billion a year? Valid Q3. Seneca Nation employs 6,000 Western New Yorkers, more than half of whom are non-Indians

Welcome message from author
This document is posted to help you gain knowledge. Please leave a comment to let me know what you think about it! Share it to your friends and learn new things together.
Transcript

8/3/2019 Senecas Campaign First Poll Demographics
http://slidepdf.com/reader/full/senecas-campaign-first-poll-demographics 1/26
Frequency Table
Frequency Percent
18 - 24 7 .7
25 - 34 107 10.7
35 - 44 129 12.9
45 - 54 224 22.4
55 - 70 330 33.0
71+ 195 19.5
Refused 8 .8
Total 1000 100.0
Frequency Percent
Male 445 44.5
Female 555 55.5
Total 1000 100.0
Frequency Percent
Democrat 329 32.9
Republican 376 37.6
Independent 145 14.5Refused 150 15.0
Total 1000 100.0
Frequency Percent
Valid Yes 1000 100.0
Frequency Percent
NOT FAMILIAR/AWARE AT
ALL
337 33.7
02 76 7.6
03 60 6.0
04 42 4.2
05 169 16.9
06 66 6.6
07 52 5.2
08 68 6.8
09 18 1.8
VERY FAMILIAR 92 9.2
DK/REF 20 2.0
Total 1000 100.0
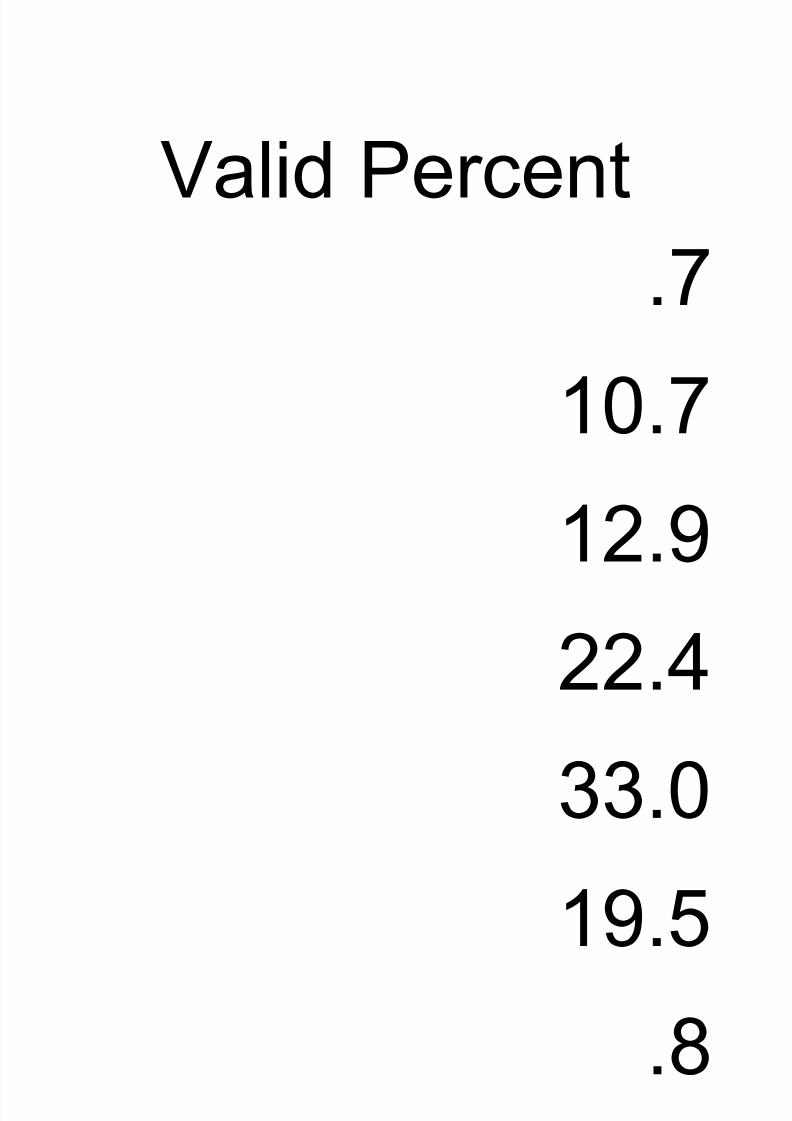
QUAL1. Could you please tell me your age?
Valid
QUAL2. By observation:
Valid
QUAL3. Are you registered with a political party?
Valid
Q1. Are you familiar with the Seneca Nation of Indians' tobacco and gaming economy?
Q2. Seneca Nation operations total $1.1 billion a year?
Valid
Q3. Seneca Nation employs 6,000 Western New Yorkers, more than half of whom are non-Indians
8/3/2019 Senecas Campaign First Poll Demographics
http://slidepdf.com/reader/full/senecas-campaign-first-poll-demographics 2/26
Frequency Percent
NOT FAMILIAR/AWARE AT
ALL
280 28.0
02 80 8.0
03 68 6.8
04 38 3.8
05 130 13.0
06 55 5.5
07 72 7.2
08 89 8.9
09 33 3.3
VERY FAMILIAR 139 13.9
DK/REF 16 1.6
Total 1000 100.0
Frequency Percent
NOT FAMILIAR/AWARE AT
ALL
422 42.2
02 105 10.5
03 75 7.5
04 39 3.9
05 104 10.4
06 37 3.7
07 36 3.608 46 4.6
09 24 2.4
VERY FAMILIAR 92 9.2
DK/REF 20 2.0
Total 1000 100.0
Frequency Percent
Not at all valuable 77 7.7
Somewhat invaluable 90 9.0
Neither 138 13.8
Somewhat valuable 266 26.6
Very valuable 404 40.4
DK/REF 25 2.5
Total 1000 100.0
Frequency Percent
Very important 591 59.1
Somewhat important 245 24.5
Neither 45 4.5
Somewhat unimportant 39 3.9
Not at all important 59 5.9
DK/REF 21 2.1
Valid
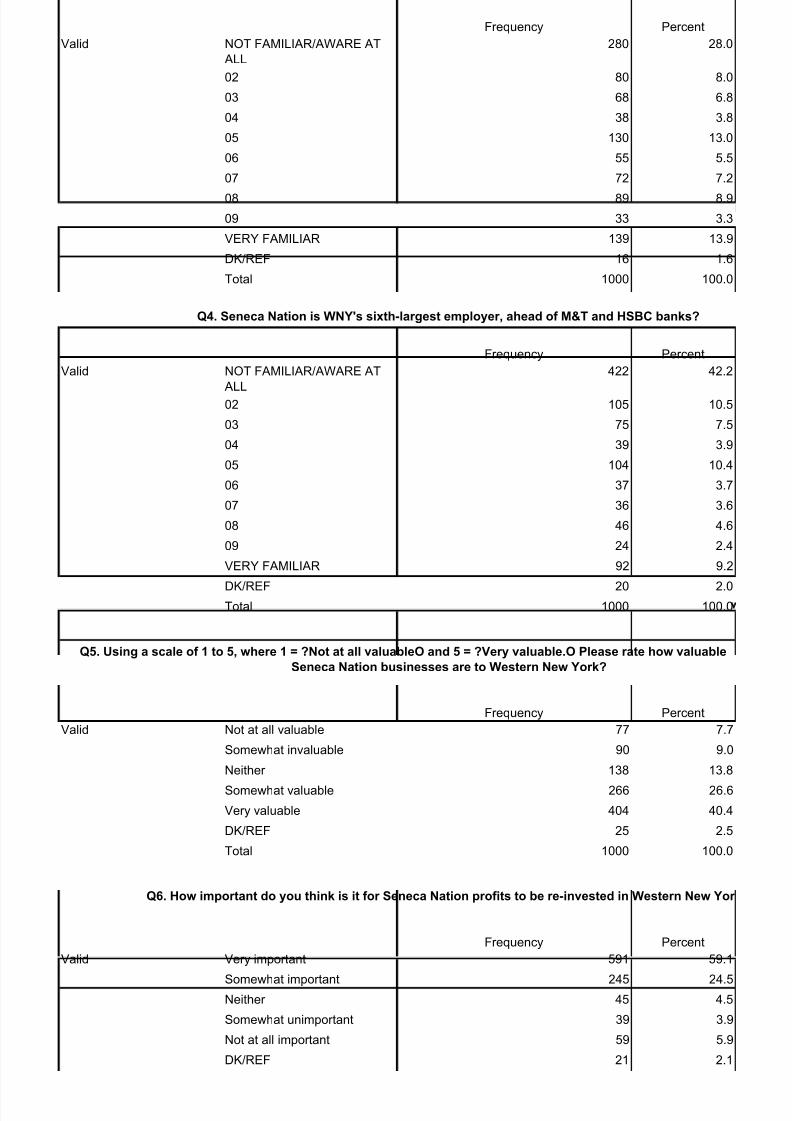
Q4. Seneca Nation is WNY's sixth-largest employer, ahead of M&T and HSBC banks?
Valid
Q5. Using a scale of 1 to 5, where 1 = ?Not at all valuableO and 5 = ?Very valuable.O Please rate how valuable
Seneca Nation businesses are to Western New York?
Valid
Q6. How important do you think is it for Seneca Nation profits to be re-invested in Western New Yor
Valid

8/3/2019 Senecas Campaign First Poll Demographics
http://slidepdf.com/reader/full/senecas-campaign-first-poll-demographics 3/26
Total 1000 100.0
Frequency Percent
Very positive 299 29.9
Somewhat positive 436 43.6
Neither 109 10.9
Somewhat negative 81 8.1
Very negative 39 3.9
DK/REF 36 3.6
Total 1000 100.0
Frequency Percent
Yes 888 88.8
No 102 10.2
DK/REF 10 1.0
Total 1000 100.0
Frequency Percent
STRONGLY DISAGREE 73 7.3
02 18 1.8
03 19 1.9
04 10 1.0
05 114 11.4
06 31 3.1
07 56 5.6
08 83 8.3
09 47 4.7STRONGLY AGREE 519 51.9
DK/REF 30 3.0
Total 1000 100.0
Frequency Percent
STRONGLY DISAGREE 45 4.5
02 14 1.4
03 19 1.9
04 13 1.3
05 149 14.9
06 40 4.0
07 59 5.9
08 87 8.7
09 48 4.8
STRONGLY AGREE 280 28.0
DK/REF* 246 24.6
Total 1000 100.0
Q7. In general, how do you view the Seneca Nation's influence on Western New York's economy?
Valid
Q8. Did you know the Seneca Nation is a sovereign nation, not living under New York law?
Valid
Q9. Seneca Nation's treaties with the federal government should be followed 100%?
Valid
Q10. Seneca Nation usually meets its treaty obligations?
Valid

8/3/2019 Senecas Campaign First Poll Demographics
http://slidepdf.com/reader/full/senecas-campaign-first-poll-demographics 4/26
Frequency Percent
STRONGLY DISAGREE 177 17.7
02 73 7.3
03 72 7.2
04 53 5.3
05 188 18.8
06 55 5.5
07 55 5.5
08 53 5.3
09 13 1.3
STRONGLY AGREE 98 9.8
DK/REF 163 16.3
Total 1000 100.0
Frequency Percent
Excellent 18 1.8
Above average 85
Average 342
Below average 284 28.4
Extremely Poo 255 25.5
DK/REF 16 1.6
Total 1000 100.0
Frequency Percent
Strongly Agree 27 2.7
Agree 126
Undecided 136 13.6
Disagree 316 31.6
Strongly Disagree 381 38.1DK/REF 14 1.4
Total 1000 100.0
Frequency Percent
Albany 610
Western New York 73 7.3
DK/REF 317 31.7
Total 1000 100.0
Frequency Percent
Yes 779 77.9
No 139 13.9
DK/REF 82 8.2
Total 1000 100.0
Q11. New York State usually meets its obligations to the Seneca Nation under its treaties with the United
Valid
Q12. How do you regard the state government's performance in Albany?
Valid
Q13. Do you think Albany has Western New York's best interests in mind?
Valid
Q14. Who would you blame for the weak economy?
Valid
Q15. Do you think the Seneca Nation economy helps Western New York's economy?
Valid

8/3/2019 Senecas Campaign First Poll Demographics
http://slidepdf.com/reader/full/senecas-campaign-first-poll-demographics 5/26
Frequency Percent
Yes 753 75.3
No 154 15.4
DK/REF 93 9.3
Total 1000 100.0
Frequency Percent
Very negative 78 7.8
Somewhat negative 162 16.2
Neither 267 26.7
Somewhat positive 327 32.7
Very positive 136 13.6
DK/REF 30 3.0Total 1000 100.0
Frequency Percent
Very negative 22 2.2
Somewhat negative 76 7.6
Neither 240 24.0Somewhat positive 136 13.6
Very positive 88 8.8
DK/REF 438 43.8
Total 1000 100.0
Frequency PercentVery negative 224 22.4
Somewhat negative 157 15.7
Neither 215 21.5
Somewhat positive 80 8.0
Very positive 37 3.7
DK/REF 287 28.7
Total 1000 100.0
Frequency Percent
Yes 704 70.4
No 282 28.2
DK/REF 14 1.4
Total 1000 100.0
Q16. Would you favor the continuous growth of the Seneca Nation economy through future developm
Valid
Q17. Using a scale of 1 to 5, where 1 = ?Very negativeO and 5 = ?Very positive.O How do you rate the job Gov. Adoing?
Valid
Q18. Using a scale of 1 to 5, where 1 = ?Very negativeO and 5 = ?Very positive.O How do you rate the job Senate
Dean Skelos is doing?
Valid
Q19. Using a scale of 1 to 5, where 1 = 'Very negative' and 5 = 'Very positive.O How do you rate the job Assembly
Silver is doing?
Valid
Q20. Are you aware of the fact that some Albany leaders want to legalize commercial casino gambling sta
Valid
Q21. How likel are ou to favor such a wholesale a roval of 'casinos on ever corner?'

8/3/2019 Senecas Campaign First Poll Demographics
http://slidepdf.com/reader/full/senecas-campaign-first-poll-demographics 6/26
Frequency Percent
Very likely 70 7.0
Likely 106 10.6
Neither likely nor unlikely 69 6.9
Unlikely 168 16.8
Very unlikely 276 27.6
DK/REF 15 1.5
Total 704 70.4
Missing System 296 29.6
1000 100.0
Frequency Percent
Yes 874 87.4
No 122 12.2
DK/REF 4 .4
Total 1000 100.0
Frequency Percent
Yes 344 34.4
No 529 52.9
Dk/Ref 2 .2
Total 875 87.5
Missing System 125 12.5
1000 100.0
Frequency PercentYes 354 35.4
No 502 50.2
Dk/Ref 18 1.8
Total 874 87.4
Missing System 126 12.6
1000 100.0
Frequency Percent
Yes 400 40.0
No 574 57.4
Dk/Ref 26 2.6
Total 1000 100.0
Valid
Total
Q22. Did you know the Seneca Nation has three casinos in Western New York?
Valid
Q23. Have you visited one in the last year?
Valid
Total
Q24. Did you know that the Seneca Nation has paid $476million to the state for the right to operate those
Valid
Total
Q25. Did you know that the Seneca Nation was promised a zone of exclusivity in Western New York where stat
competing casinos are permitted?
Valid
Q26. Given that New York State promised the Seneca Nation exclusivity, should other casinos be permitted in We

8/3/2019 Senecas Campaign First Poll Demographics
http://slidepdf.com/reader/full/senecas-campaign-first-poll-demographics 7/26
Frequency Percent
Yes 263 26.3
No 641 64.1
Dk/Ref 96 9.6
Total 1000 100.0
Frequency Percent
New York Indian Nation 622 62.2
Las Vegas 99 9.9
Malaysian based commercial
company
20 2.0
DK/REF 259 25.9
Total 1000 100.0
Frequency Percent
Seneca Nation of Indians' 598 59.8
New York State 191 19.1
DK/REF 211 21.1
Total 1000 100.0
Frequency Percent
Seneca Nation of Indians' 665 66.5
Las Vegas style 132 13.2
DK/REF 203 20.3
Total 1000 100.0
Frequency Percent
Yes 743 74.3
No 238 23.8
DK/REF 19 1.9
Total 1000 100.0
Frequency Percent
Yes 162 16.2
No 716 71.6
DK/REF 122 12.2
Total 1000 100.0
Valid
Q27. If new casinos were to open in some areas of New York State, do you prefer a New York Indian nation to ope
Vegas or Malaysia-based commercial company?
Valid
Q28. Who do you think would do a better job regulating casinos, the Seneca Nation or New York Sta
Valid
Q29. Do you favor continued operation of Seneca Nation gaming, and payments from it to the state, or do you pr
Las-Vegas-type gaming statewide?
Valid
Q30. Did you know the state already supports and markets casino-like 'racinos' at local horseracing tr
Valid
Q31. Do you think they should be expanded to full-blown commercial casinos at the expense of existing Seneca
Valid

8/3/2019 Senecas Campaign First Poll Demographics
http://slidepdf.com/reader/full/senecas-campaign-first-poll-demographics 8/26
Frequency Percent
Jobs 509 50.9
Taxes 240 24.0
Leadership 85 8.5
Wall Street 24 2.4
Upstate vs. Downstate 82 8.2
DK/REF 60 6.0
Total 1000 100.0
Frequency Percent
Some high school 22 2.2
High school graduate 265 26.5
Some college 162 16.2
Completed a 2 year college 154 15.4
Completed a 4 year college 190 19.0
Graduate /professional / postgrad work
194 19.4
No answer / refused 13 1.3
Total 1000 100.0
Frequency Percent
Employed full-time 369 36.9
Employed part-time 85 8.5
Not employed just now 62 6.2
Retired 432 43.2
Stay-at-home spouse 36 3.6
No answer/refused [DO NOTREAD]
16 1.6
Total 1000 100.0
Frequency Percent
Less than $25,000 143 14.3
$25-$50,000 252 25.2
$50-75,000 185 18.5
$75-100,000 115 11.5
$100,000 or more 122 12.2
No answer/refused [DO NOTREAD]
183 18.3
Total 1000 100.0
Frequency Percent
13143 1 .113146 3 .3
14001 4 .4
Q32. What is the biggest single issue challenging New York State at this time?
Valid
D1. What was the last grade of school you completed?
Valid
D2. Are you(tm)? [READ LIST]
Valid
D3. Can you please tell me which category most closely reflects your total household income? [READ
Valid
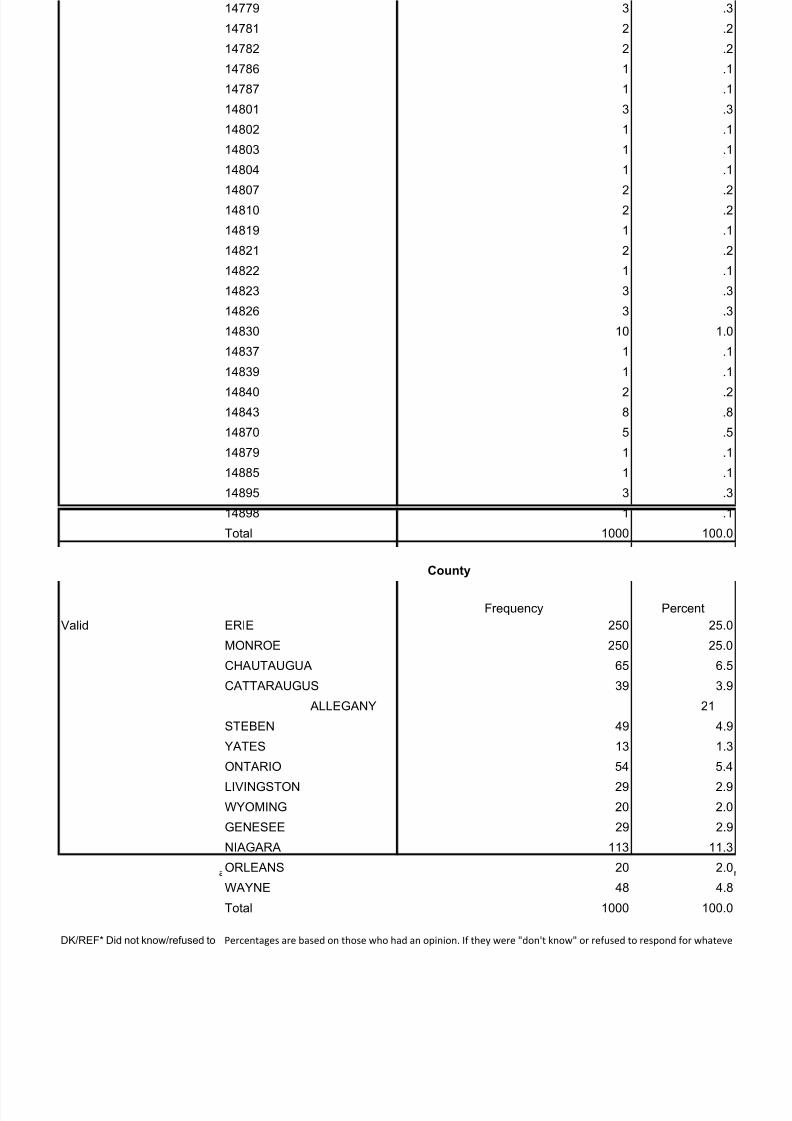
D4. What is your zip code at home?
Valid

8/3/2019 Senecas Campaign First Poll Demographics
http://slidepdf.com/reader/full/senecas-campaign-first-poll-demographics 9/26
14004 8 .8
14005 2 .2
14006 1 .1
14009 1 .1
14011 4 .4
14012 1 .1
14013 2 .2
14020 8 .8
14024 1 .1
14025 1 .1
14028 2 .2
14031 3 .3
14032 1 .1
14033 2 .2
14034 1 .1
14036 3 .3
14037 1 .1
14041 1 .1
14042 2 .2
14043 8 .8
14047 1 .1
14048 5 .5
14051 7 .7
14052 4 .4
14054 1 .1
14055 1 .1
14057 2 .2
14058 3 .3
14059 2 .2
14062 3 .3
14063 4 .4
14065 1 .1
14066 1 .1
14068 2 .2
14069 1 .1
14070 4 .4
14072 6 .6
14075 16 1.6
14080 2 .2
14082 1 .1
14085 5 .5
14086 8 .8
14092 5 .5
14094 25 2.5
14098 2 .2
14101 3 .3
14102 1 .1
14103 3 .3
14105 3 .3
14108 6 .6
14111 1 .1
14113 1 .1
14120 34 3.4

8/3/2019 Senecas Campaign First Poll Demographics
http://slidepdf.com/reader/full/senecas-campaign-first-poll-demographics 10/26
14125 2 .2
14127 8 .8
14129 1 .1
14131 2 .2
14132 4 .4
14136 1 .1
14139 1 .1
14141 2 .2
14143 1 .1
14145 1 .1
14150 20 2.0
14168 1 .1
14170 1 .1
14171 1 .1
14174 4 .4
14201 2 .2
14204 1 .1
14206 6 .6
14207 7 .7
14208 1 .1
14210 2 .2
14211 4 .4
14212 1 .1
14213 3 .3
14214 7 .7
14215 4 .4
14216 4 .4
14217 6 .6
14218 4 .4
14219 6 .6
14220 4 .4
14221 22 2.2
14222 5 .5
14223 9 .9
14224 10 1.0
14225 5 .5
14226 3 .3
14227 11 1.1
14228 4 .4
14301 2 .2
14304 17 1.7
14305 7 .7
14411 8 .8
14413 1 .1
14414 4 .4
14415 1 .1
14416 1 .1
14420 4 .4
14423 4 .4
14424 17 1.7
14425 4 .4
14427 1 .1
14428 3 .3

8/3/2019 Senecas Campaign First Poll Demographics
http://slidepdf.com/reader/full/senecas-campaign-first-poll-demographics 11/26
14432 3 .3
14433 1 .1
14435 4 .4
14437 4 .4
14445 2 .2
14450 14 1.4
14454 2 .2
14456 6 .6
14464 3 .3
14466 3 .3
14467 3 .3
14468 10 1.0
14469 2 .2
14470 5 .5
14472 8 .8
14475 1 .1
14476 1 .1
14481 1 .1
14482 5 .5
14487 1 .1
14489 3 .3
14502 5 .5
14505 2 .2
14507 1 .1
14512 2 .2
14513 8 .8
14517 3 .3
14519 8 .8
14522 5 .5
14525 1 .1
14526 5 .5
14527 9 .9
14530 1 .1
14532 3 .3
14533 1 .1
14534 5 .5
14536 1 .1
14543 2 .2
14544 1 .1
14545 1 .1
14546 2 .2
14548 1 .1
14550 1 .1
14551 3 .3
14557 1 .1
14559 12 1.2
14560 3 .3
14561 2 .2
14564 6 .6
14568 3 .3
14569 3 .3
14571 1 .1
14572 3 .3

8/3/2019 Senecas Campaign First Poll Demographics
http://slidepdf.com/reader/full/senecas-campaign-first-poll-demographics 12/26
14580 24 2.4
14586 4 .4
14589 3 .3
14590 3 .3
14591 2 .2
14606 8 .8
14607 3 .3
14608 1 .1
14609 18 1.8
14610 4 .4
14612 16 1.6
14613 2 .2
14615 8 .8
14616 12 1.2
14617 10 1.0
14618 14 1.4
14619 2 .2
14620 7 .7
14621 5 .5
14622 6 .6
14623 10 1.0
14624 14 1.4
14625 7 .7
14626 5 .5
14701 20 2.0
14709 1 .1
14710 4 .4
14711 1 .1
14715 4 .4
14719 3 .3
14723 1 .1
14724 2 .2
14727 6 .6
14728 2 .2
14729 1 .1
14733 8 .8
14737 1 .1
14738 1 .1
14740 2 .2
14741 1 .1
14742 1 .1
14743 1 .1
14747 2 .2
14748 1 .1
14750 1 .1
14755 1 .1
14757 1 .1
14760 10 1.0
14767 1 .1
14770 2 .2
14772 1 .1
14775 2 .2
14777 1 .1
8/3/2019 Senecas Campaign First Poll Demographics
http://slidepdf.com/reader/full/senecas-campaign-first-poll-demographics 13/26
14779 3 .3
14781 2 .2
14782 2 .2
14786 1 .1
14787 1 .1
14801 3 .3
14802 1 .1
14803 1 .1
14804 1 .1
14807 2 .2
14810 2 .2
14819 1 .1
14821 2 .2
14822 1 .1
14823 3 .3
14826 3 .3
14830 10 1.0
14837 1 .1
14839 1 .1
14840 2 .2
14843 8 .8
14870 5 .5
14879 1 .1
14885 1 .1
14895 3 .3
14898 1 .1
Total 1000 100.0
Frequency Percent
ERIE 250 25.0
MONROE 250 25.0
CHAUTAUGUA 65 6.5
CATTARAUGUS 39 3.9
ALLEGANY 21
STEBEN 49 4.9
YATES 13 1.3
ONTARIO 54 5.4
LIVINGSTON 29 2.9
WYOMING 20 2.0
GENESEE 29 2.9
NIAGARA 113 11.3
ORLEANS 20 2.0
WAYNE 48 4.8
Total 1000 100.0
DK/REF* Did not know/refused to Percentages are based on those who had an opinion. If they were "don't know" or refused to respond for whateve
Valid
County
8/3/2019 Senecas Campaign First Poll Demographics
http://slidepdf.com/reader/full/senecas-campaign-first-poll-demographics 14/26
Valid Percent
.7
10.7
12.9
22.4
33.0
19.5
.8
100.0
Valid Percent
44.5
55.5
100.0
Valid Percent
32.9
37.6
14.515.0
100.0
Valid Percent
100.0
Valid Percent
33.7
7.6
6.0
4.2
16.9
6.6
5.2
6.8
1.8
9.2
2.0
100 0

8/3/2019 Senecas Campaign First Poll Demographics
http://slidepdf.com/reader/full/senecas-campaign-first-poll-demographics 15/26
Valid Percent
28.0
8.0
6.8
3.8
13.0
5.5
7.2
8.9
3.3
13.9
1.6
100.0
Valid Percent
42.2
10.5
7.5
3.9
10.4
3.7
3.6
4.6
2.4
9.2
2.0
100.0
Valid Percent
7.7
9.0
13.826.6
40.4
2.5
100.0

8/3/2019 Senecas Campaign First Poll Demographics
http://slidepdf.com/reader/full/senecas-campaign-first-poll-demographics 16/26
100.0
Valid Percent
29.9
43.6
10.9
8.1
3.9
3.6
100.0
Valid Percent
88.8
10.2
1.0
100.0
Valid Percent
7.3
1.8
1.9
1.0
11.4
3.1
5.6
8.3
4.7
51.9
3.0100.0
Valid Percent
4.5
1.4
1.9
1.3
14.9

8/3/2019 Senecas Campaign First Poll Demographics
http://slidepdf.com/reader/full/senecas-campaign-first-poll-demographics 17/26
Valid Percent
17.7
7.3
7.2
5.3
18.8
5.5
5.5
5.3
1.3
9.8
16.3
100.0
Valid Percent
1.8
8.5
34.2
28.4
25.5
1.6
100.0
Valid Percent
2.7
12.6
13.6
31.6
38.1
1.4
100.0
Valid Percent
61.0
7.3
31.7
100.0

8/3/2019 Senecas Campaign First Poll Demographics
http://slidepdf.com/reader/full/senecas-campaign-first-poll-demographics 18/26
Valid Percent
75.3
15.4
9.3
100.0
Valid Percent
7.8
16.2
26.7
32.7
13.6
3.0
100.0
Valid Percent2.2
7.6
24.0
13.6
8.8
43.8
100.0
Valid Percent
22.4
15.7
21.5
8.0
3.7
28.7
100.0
Valid Percent
70.4
28 2

8/3/2019 Senecas Campaign First Poll Demographics
http://slidepdf.com/reader/full/senecas-campaign-first-poll-demographics 19/26
Valid Percent
9.9
15.1
9.8
23.9
39.2
2.1
100.0
Valid Percent
87.4
12.2
.4
100.0
Valid Percent
39.3
60.5
.2
100.0
Valid Percent
40.5
57.4
2.1
100.0
Valid Percent
40.0

8/3/2019 Senecas Campaign First Poll Demographics
http://slidepdf.com/reader/full/senecas-campaign-first-poll-demographics 20/26
Valid Percent
26.3
64.1
9.6
100.0
Valid Percent62.2
9.9
2.0
25.9
100.0
Valid Percent
59.8
19.1
21.1
100.0
Valid Percent
66.5
13.2
20.3
100.0
Valid Percent
74.3
23.8
1.9
100.0

8/3/2019 Senecas Campaign First Poll Demographics
http://slidepdf.com/reader/full/senecas-campaign-first-poll-demographics 21/26
Valid Percent
50.9
24.0
8.5
2.4
8.2
6.0
100.0
Valid Percent
2.2
26.5
16.2
15.4
19.0
19.4
1.3
100.0
Valid Percent
36.9
8.5
6.2
43.2
3.6
1.6
100.0
Valid Percent
14.3
25.2
18.5
11.5
12.2
18.3
100.0

8/3/2019 Senecas Campaign First Poll Demographics
http://slidepdf.com/reader/full/senecas-campaign-first-poll-demographics 22/26
.8
.2
.1
.1
.4
.1
.2
.8
.1
.1
.2
.3
.1
.2
.1
.3
.1
.1
.2
.8
.1
.5
.7
.4
.1
.1
.2
.3
.2
.3
.4
.1
.1
.2
.1
.4
.6
1.6
.2
.1
.5
.8
.5
2.5
.2
.3

8/3/2019 Senecas Campaign First Poll Demographics
http://slidepdf.com/reader/full/senecas-campaign-first-poll-demographics 23/26
.2
.8
.1
.2
.4
.1
.1
.2
.1
.1
2.0
.1
.1
.1
.4
.2
.1
.6
.7
.1
.2
.4
.1
.3
.7
.4
.4
.6
.4
.6
.4
2.2
.5
.9
1.0
.5
.3
1.1
.4
.2
1.7
.7
.8
.1
.4
.1

8/3/2019 Senecas Campaign First Poll Demographics
http://slidepdf.com/reader/full/senecas-campaign-first-poll-demographics 24/26
.3
.1
.4
.4
.2
1.4
.2
.6
.3
.3
.3
1.0
.2
.5
.8
.1
.1
.1
.5
.1
.3
.5
.2
.1
.2
.8
.3
.8
.5
.1
.5
.9
.1
.3
.1
.5
.1
.2
.1
.1
.2
.1
.1
.3
.1
1.2

8/3/2019 Senecas Campaign First Poll Demographics
http://slidepdf.com/reader/full/senecas-campaign-first-poll-demographics 25/26
2.4
.4
.3
.3
.2
.8
.3
.1
1.8
.4
1.6
.2
.8
1.2
1.0
1.4
.2
.7
.5
.6
1.0
1.4
.7
.5
2.0
.1
.4
.1
.4
.3
.1
.2
.6
.2
.1
.8
.1
.1
.2
.1
.1
.1
.2
.1
.1
.1

8/3/2019 Senecas Campaign First Poll Demographics
http://slidepdf.com/reader/full/senecas-campaign-first-poll-demographics 26/26
.3
.2
.2
.1
.1
.3
.1
.1
.1
.2
.2
.1
.2
.1
.3
.3
1.0
.1
.1
.2
.8
.5
.1
.1
.3
.1
100.0
Valid Percent
25.0
25.0
6.5
3.9
2.1
4.9
1.3
5.4
2.9
2.0
2.9
11.3
Related Documents