Sendai Framework for DRR Targets and Indicators Oct. 2016 Oct. 2016 TAKEYA Kimio [email protected] Distinguished Technical Advisor to the President, JICA UNISDR, Member of Intergovernmental Expert Working Group on Indicators & Terminology relating to Disaster Risk Reduction UNFCCC, Members of the Executive Committee of the Warsaw International Mechanism for Loss and Damage associated with Climate Change Impacts

Welcome message from author
This document is posted to help you gain knowledge. Please leave a comment to let me know what you think about it! Share it to your friends and learn new things together.
Transcript
Sendai Framework for DRR
Targets and Indicators
Oct. 2016Oct. 2016
TAKEYA Kimio [email protected]
Distinguished Technical Advisor to the President, JICA
�UNISDR, Member of Intergovernmental Expert Working Group on Indicators &
Terminology relating to Disaster Risk Reduction
�UNFCCC, Members of the Executive Committee of the Warsaw International
Mechanism for Loss and Damage associated with Climate Change Impacts
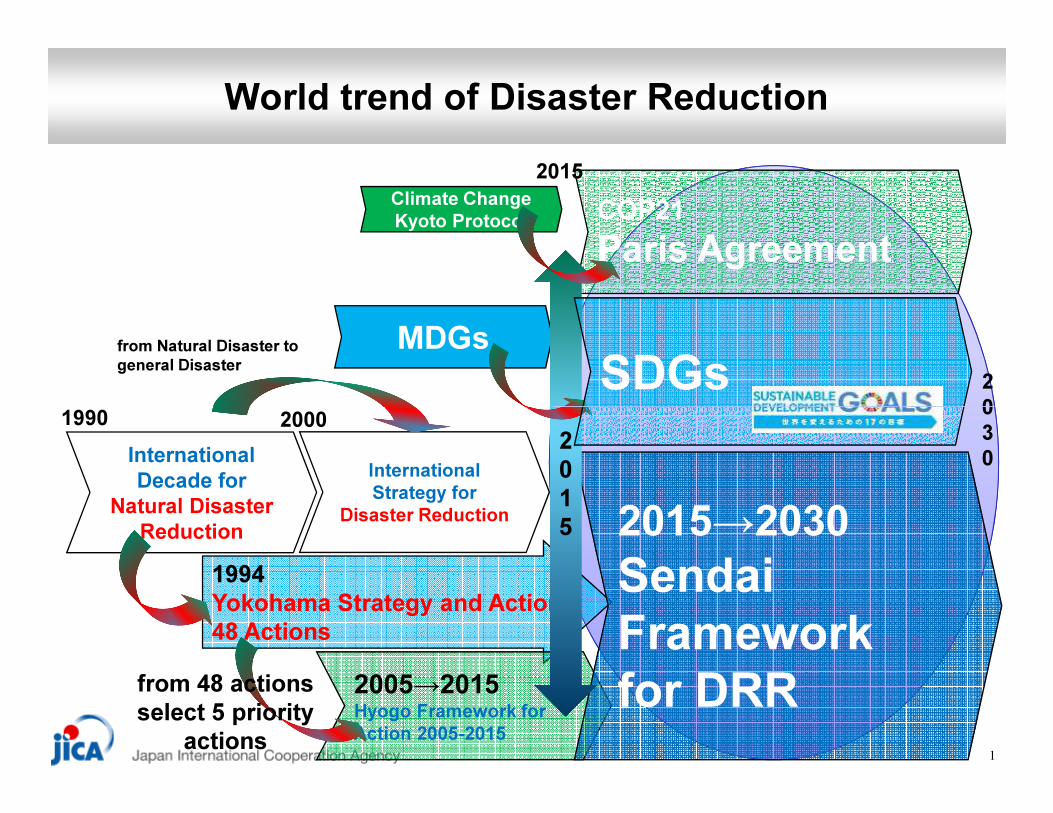
World trend of Disaster Reduction
1990
from Natural Disaster to
general Disaster
COP21
Paris Agreement
2015
2
0
Climate Change
Kyoto Protocol
MDGs
SDGs
1
International
Decade for
Natural Disaster
Reduction
1990 2000
1994
Yokohama Strategy and Actions
48 Actions
International
Strategy for
Disaster Reduction
2005→2015Hyogo Framework for
Action 2005-2015
2015→2030
Sendai
Framework
for DRRfrom 48 actions
select 5 priority
actions
0
3
02
0
1
5

Poor people
living in the
vulnerable area
easy to
damage
live more vulnerable area
sometime on the street
Development Obstructed by Disasters~Micro, Personal, Family Level~
2
far away from
developing plan
2
damage
loose
livelihood
easier to
be damaged
deflation
spiral
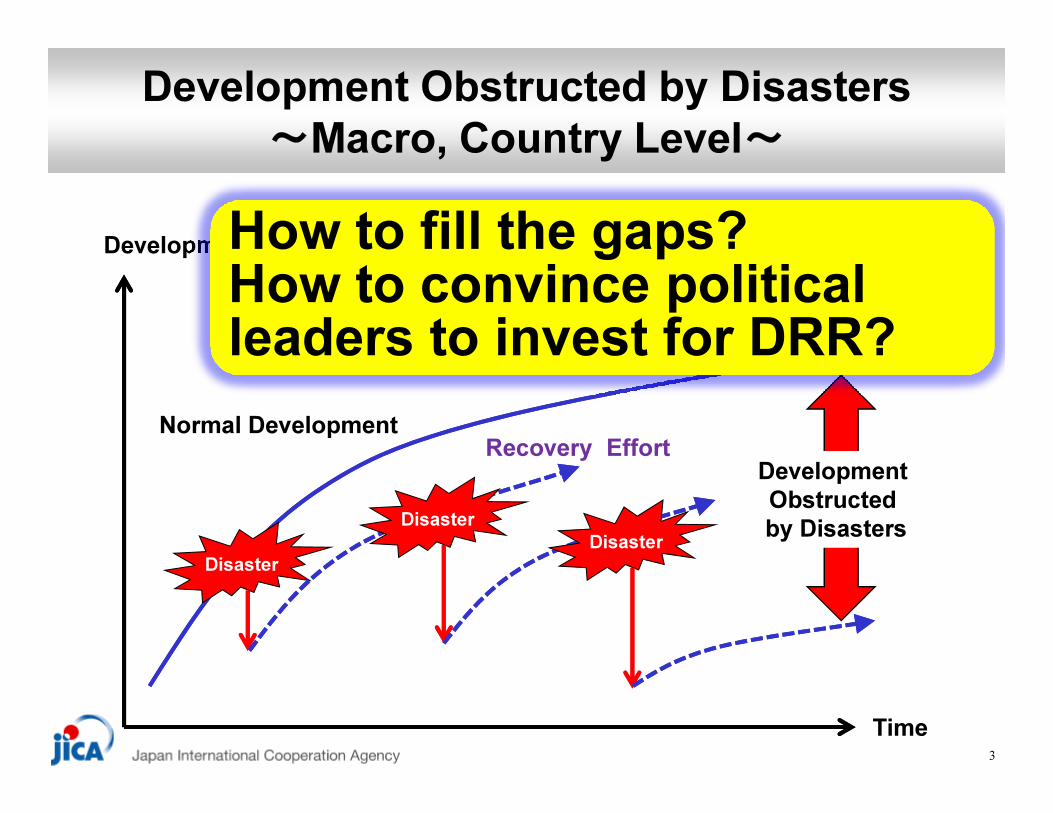
Development Obstructed by Disasters
~Macro, Country Level~
DevelopmentHow to fill the gaps?How to convince political leaders to invest for DRR?
3
Disaster
Disaster
Disaster
Time
Development
Obstructed
by Disasters
Normal DevelopmentRecovery Effort

Japanese position in the world DRR
• GFDRR & ODI reports, 20 years of international financing of disaster risk reduction (DRR)
• Donor financing is heavily concentrated with Japan and the World Bank accounting for more than 50% of the total.
41991-2010

Total $13.5 billion20 years of international financing of disaster risk reduction (DRR)
World Bank
$ 3.57 billion = 25.7%
Japan
$ 3.75 billion = 27.6%
≒4,000億円
5
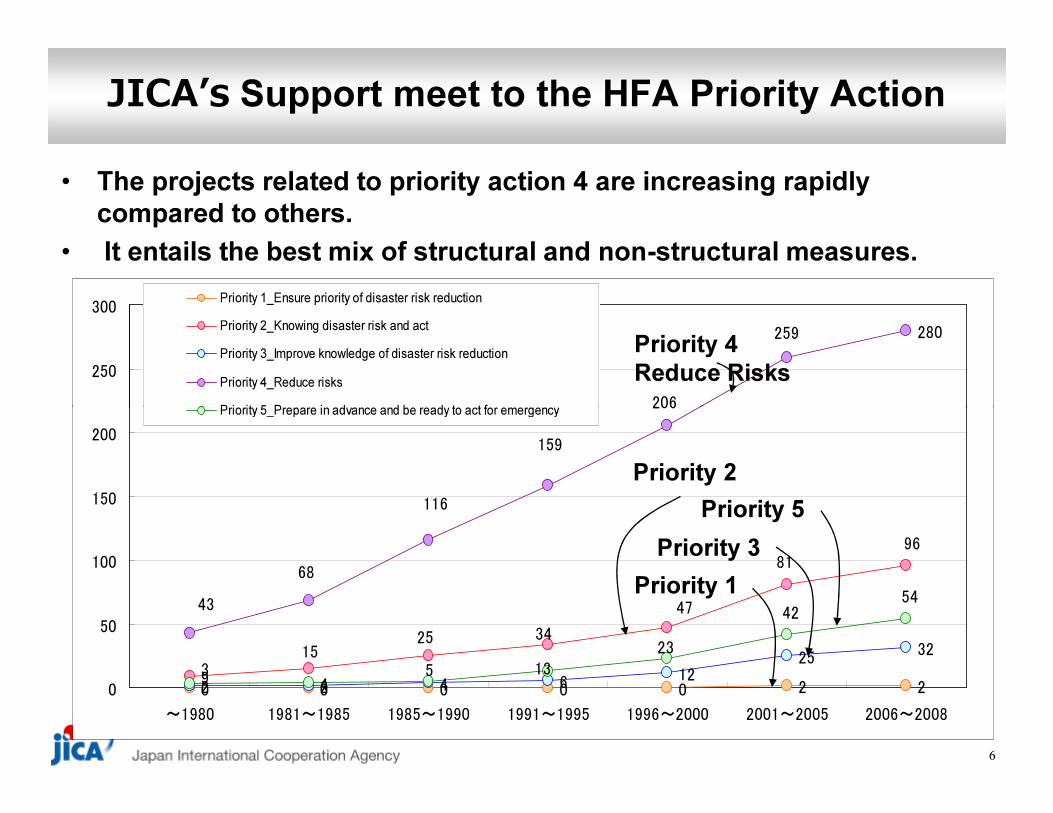
JICA’s Support meet to the HFA Priority Action
• The projects related to priority action 4 are increasing rapidly
compared to others.
• It entails the best mix of structural and non-structural measures.
280
206
259
250
300Priority 1_Ensure priority of disaster risk reduction
Priority 2_Knowing disaster risk and act
Priority 3_Improve knowledge of disaster risk reduction
Priority 4_Reduce risks
Priority 5_Prepare in advance and be ready to act for emergency
Priority 4
Reduce Risks
6
0 0 0 0 0 2 292 2 4 6
12
2532
4
96
1525 34
81
4743
68
116
159
206
5 13
23
42
54
3
0
50
100
150
200
~1980 1981~1985 1985~1990 1991~1995 1996~2000 2001~2005 2006~2008
Priority 5_Prepare in advance and be ready to act for emergency
Priority 2
Priority 5
Priority 3
Priority 1

Pre-investment is much Cheaper than recovery cost, but ・・・・・・
but still most of the DRR investment done
after disaster happened
7
Emergency Response
& Recovery
DRR

The importance of pre-disaster DRR investmentGlobal Assessment Report P-87
8
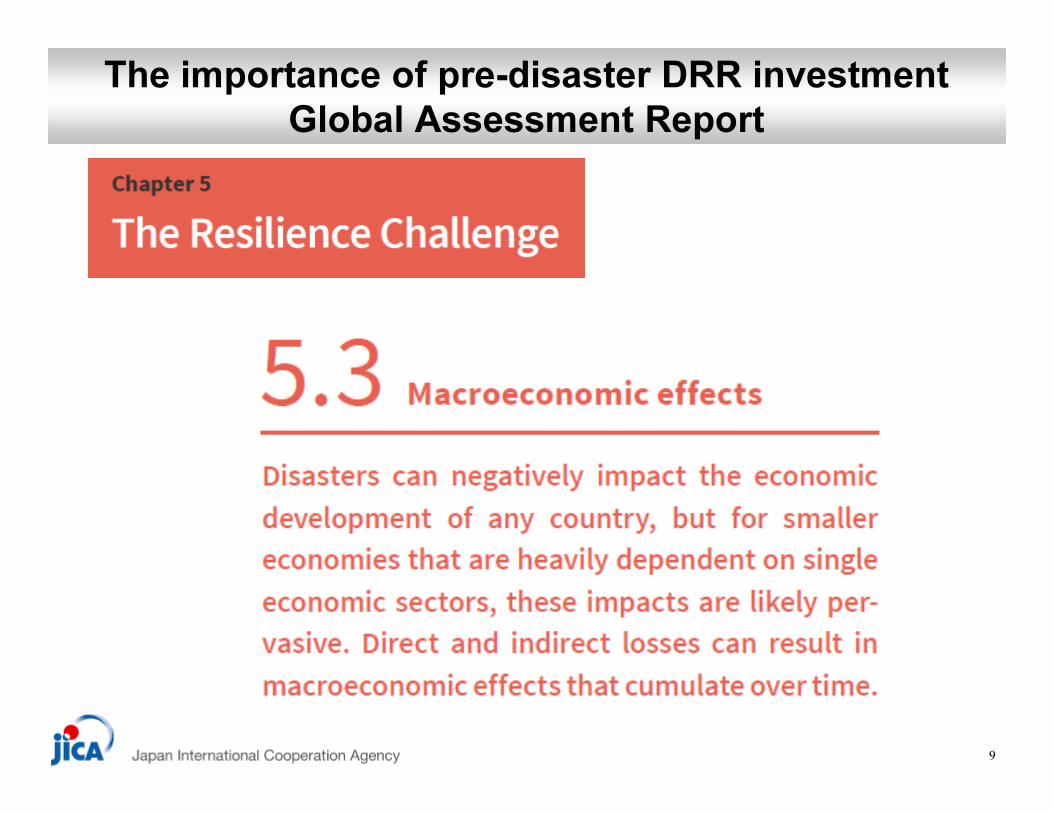
The importance of pre-disaster DRR investmentGlobal Assessment Report
9
The importance of pre-disaster DRR investmentGlobal Assessment Report P-87
10
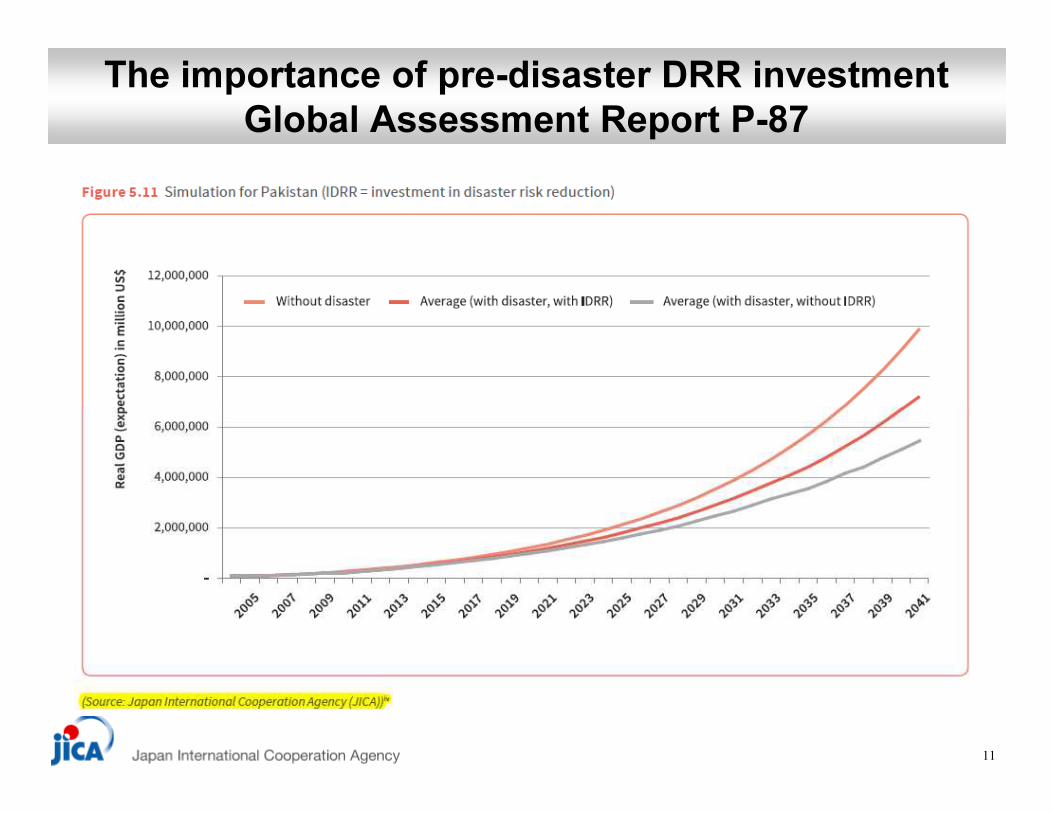
The importance of pre-disaster DRR investmentGlobal Assessment Report P-87
11
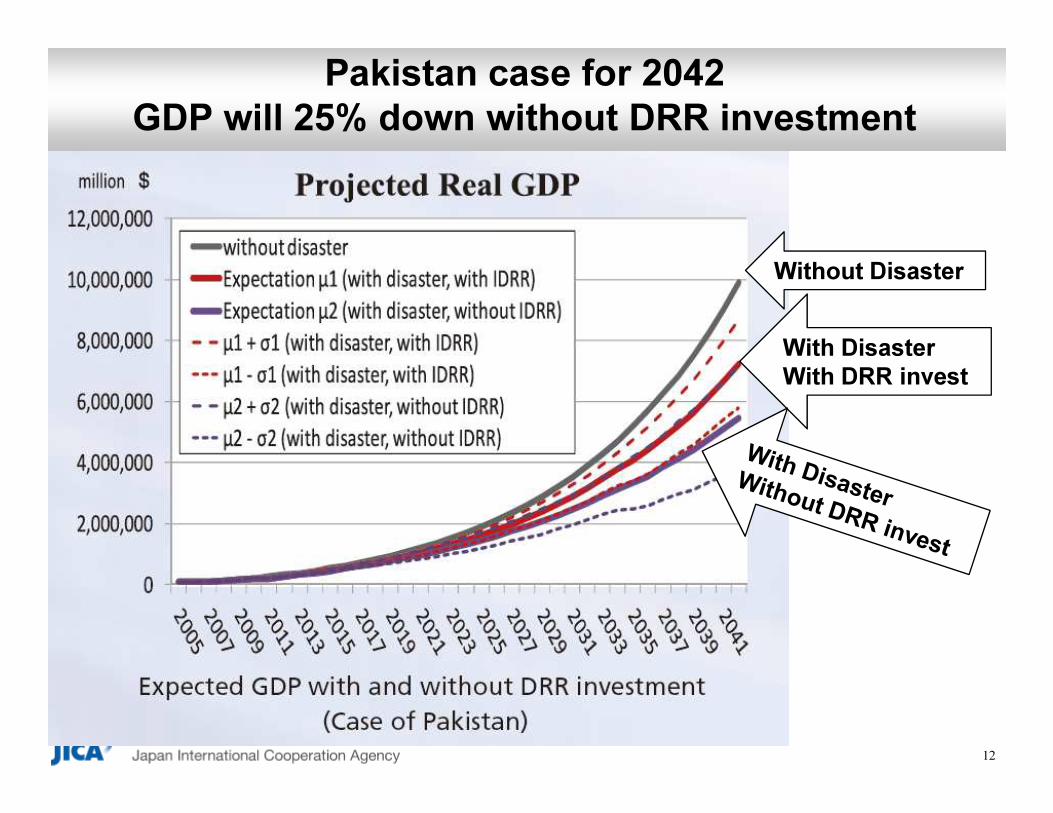
Pakistan case for 2042 GDP will 25% down without DRR investment
Without Disaster
With Disaster
With DRR invest
12
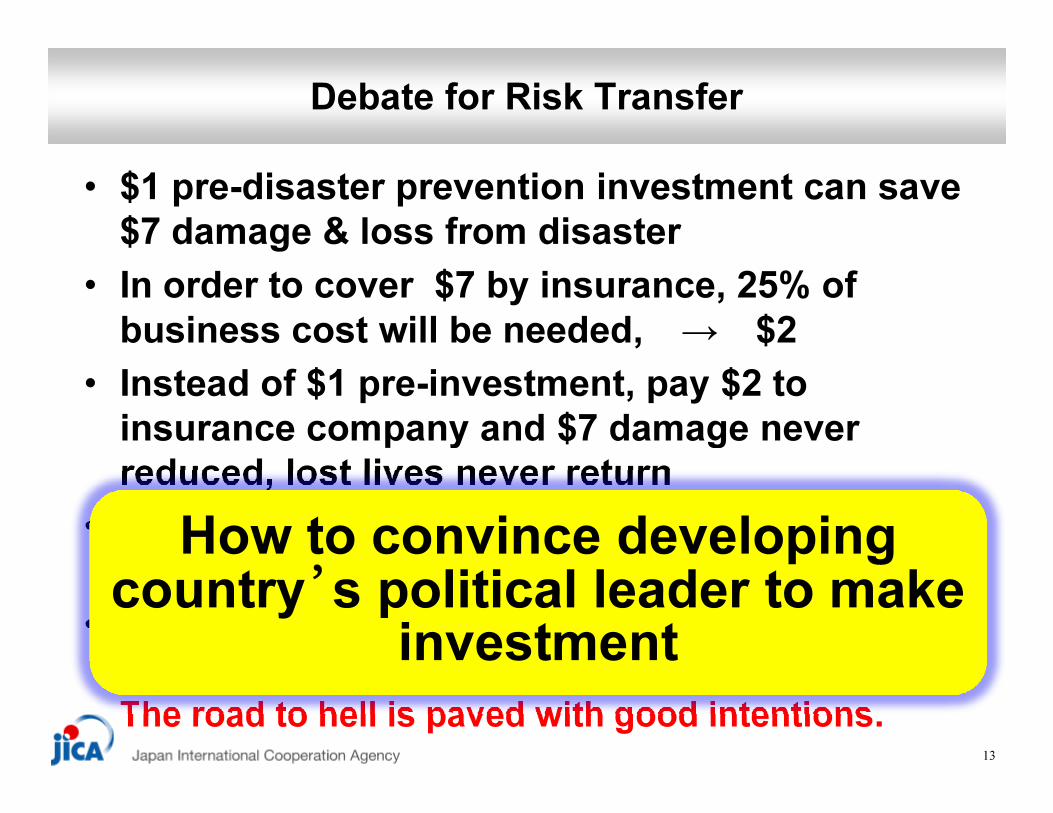
Debate for Risk Transfer
• $1 pre-disaster prevention investment can save $7 damage & loss from disaster
• In order to cover $7 by insurance, 25% of business cost will be needed, → $2
• Instead of $1 pre-investment, pay $2 to insurance company and $7 damage never insurance company and $7 damage never reduced, lost lives never return
• We do not deny the importance of financial failsafe system, as for short term issue, but
• If government rely on this without DRR effort or , forget the importance of DRR, I must sayThe road to hell is paved with good intentions.
13
How to convince developing country’s political leader to make
investment
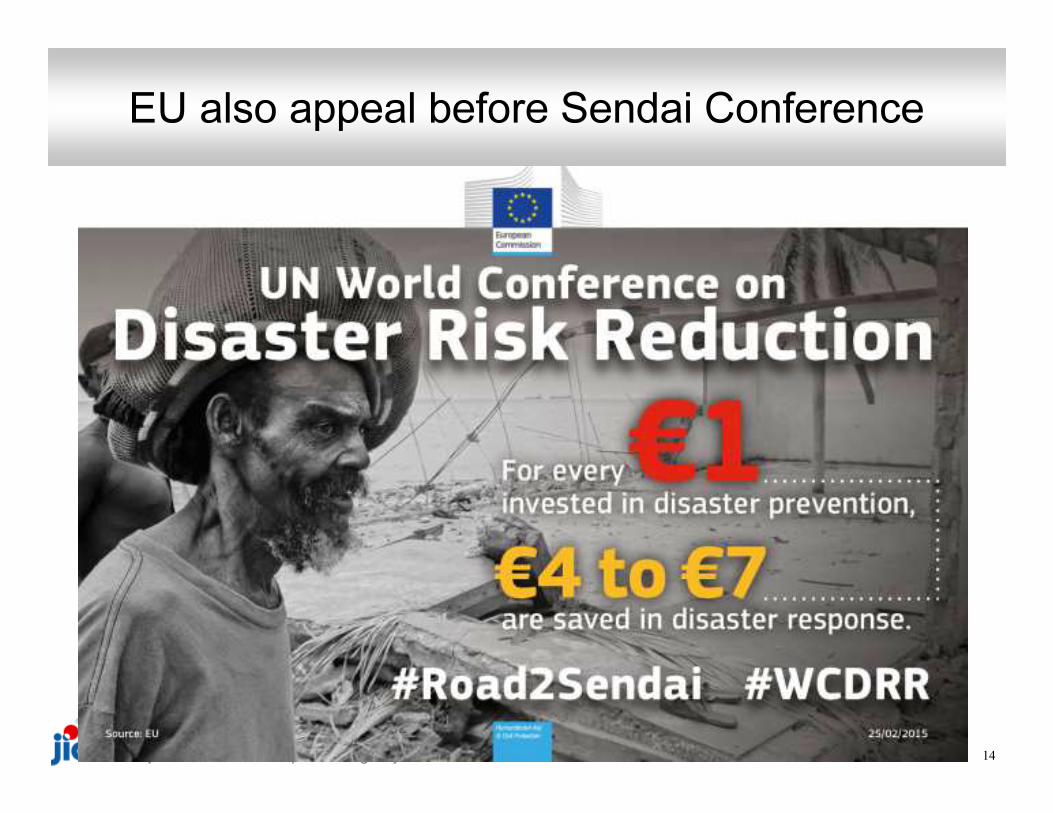
EU also appeal before Sendai Conference
14

Shown in the Global Assessment Report 2015 UNISDR as a success case
15
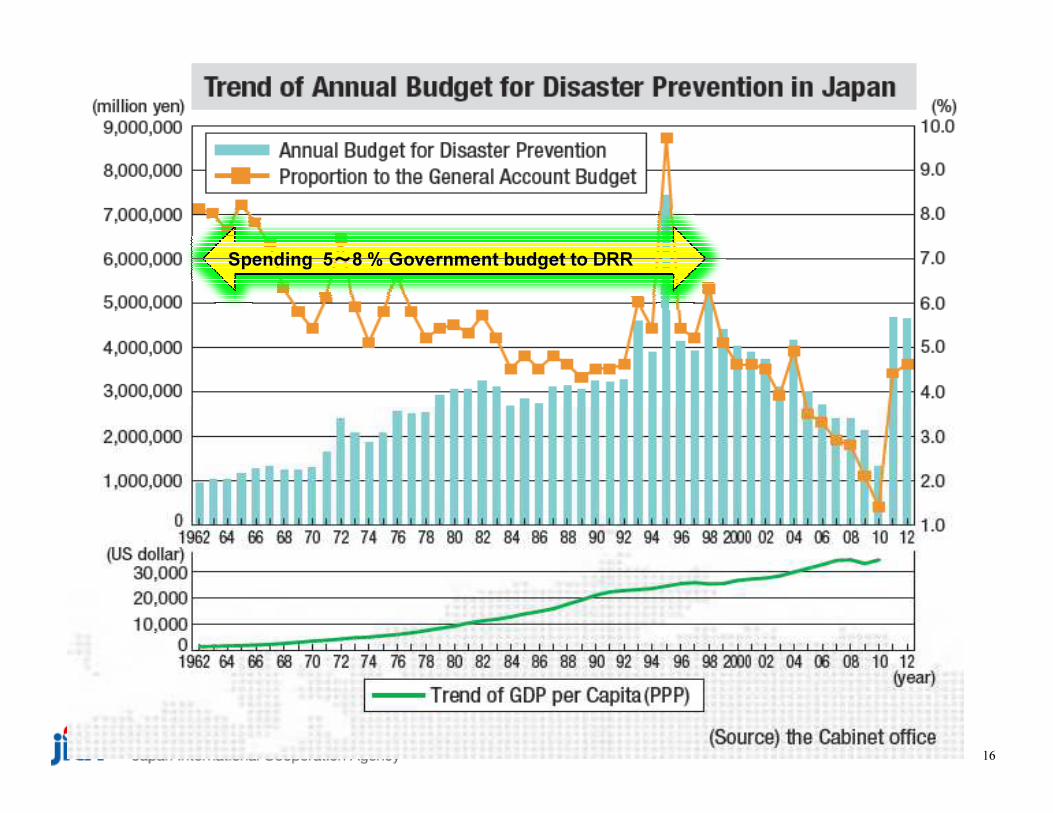
Spending 5~8 % Government budget to DRR
16
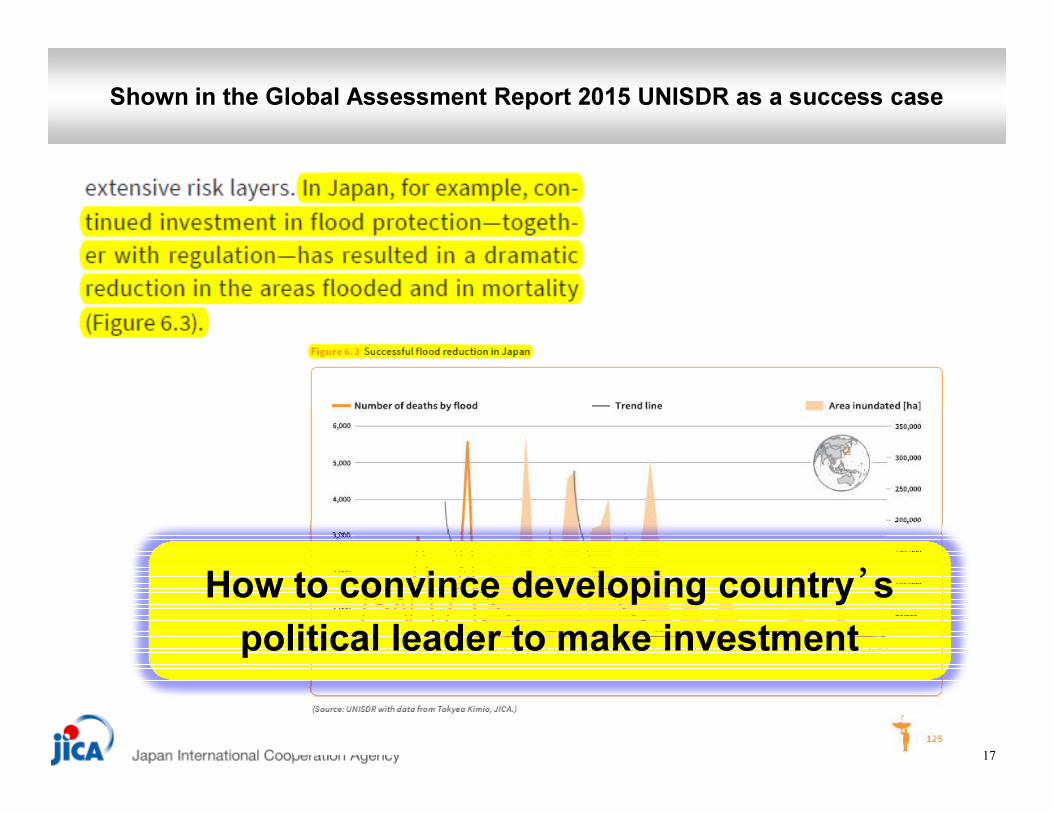
Shown in the Global Assessment Report 2015 UNISDR as a success case
17
How to convince developing country’s
political leader to make investment
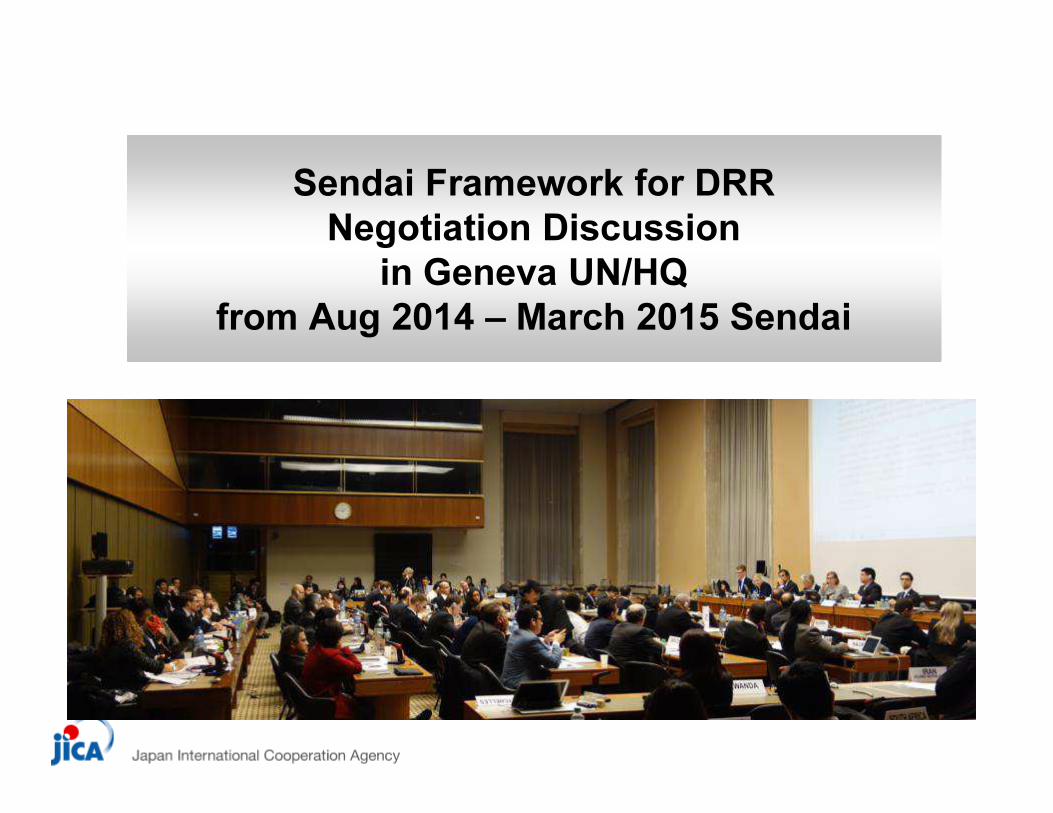
Sendai Framework for DRRNegotiation Discussion
in Geneva UN/HQfrom Aug 2014 – March 2015 Sendai
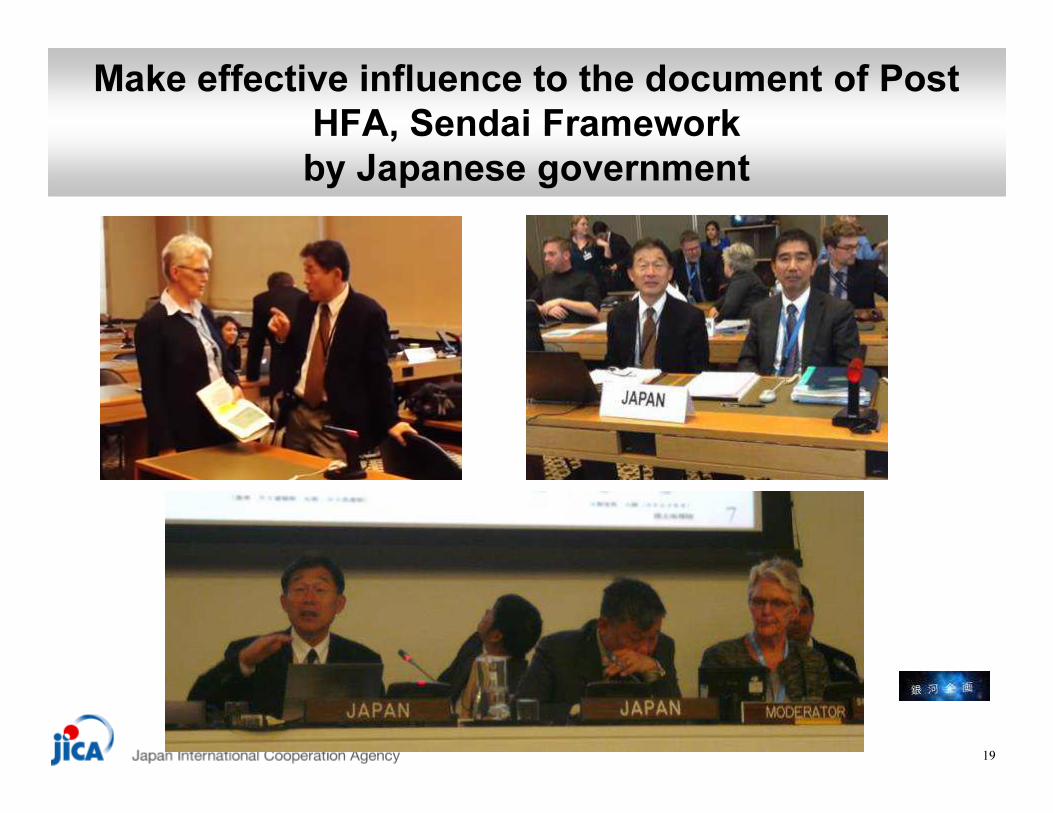
Make effective influence to the document of Post HFA, Sendai Frameworkby Japanese government
19

Finalized Sendai Framework for DRR
20
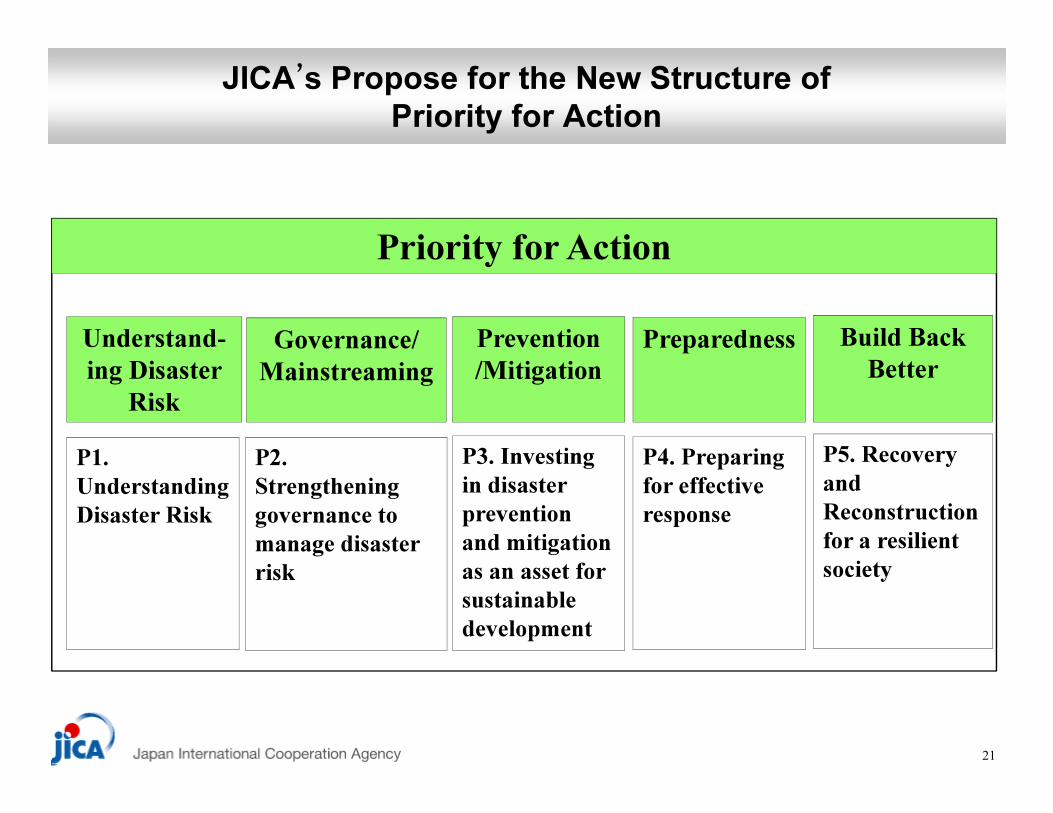
JICA’s Propose for the New Structure of Priority for Action
Priority for Action
Governance/
Mainstreaming
Prevention
/Mitigation
Build Back
Better
PreparednessUnderstand-
ing Disaster
Risk
21
P2.
Strengthening
governance to
manage disaster
risk
P3. Investing
in disaster
prevention
and mitigation
as an asset for
sustainable
development
P5. Recovery
and
Reconstruction
for a resilient
society
P4. Preparing
for effective
response
Risk
P1.
Understanding
Disaster Risk

Logic of the Priority for Action
Governance/Mainstreaming
P2. Strengthening governance to manage disaster risk
Prevention
/Mitigation
P3. Investing in
Preparedness
P4. Preparing for
Build Back
Better
P5. Recovery and
Disaster
Leadership/Governance/Management
22
P3. Investing in
disaster prevention
and mitigation as an
asset for sustainable
development
P4. Preparing for
effective response
P5. Recovery and
Reconstruction for a
resilient society
Understanding Disaster Risk
P1. Understanding Disaster Risk
Disaster management cycle
Knowledge/Evidence/Science Support

23
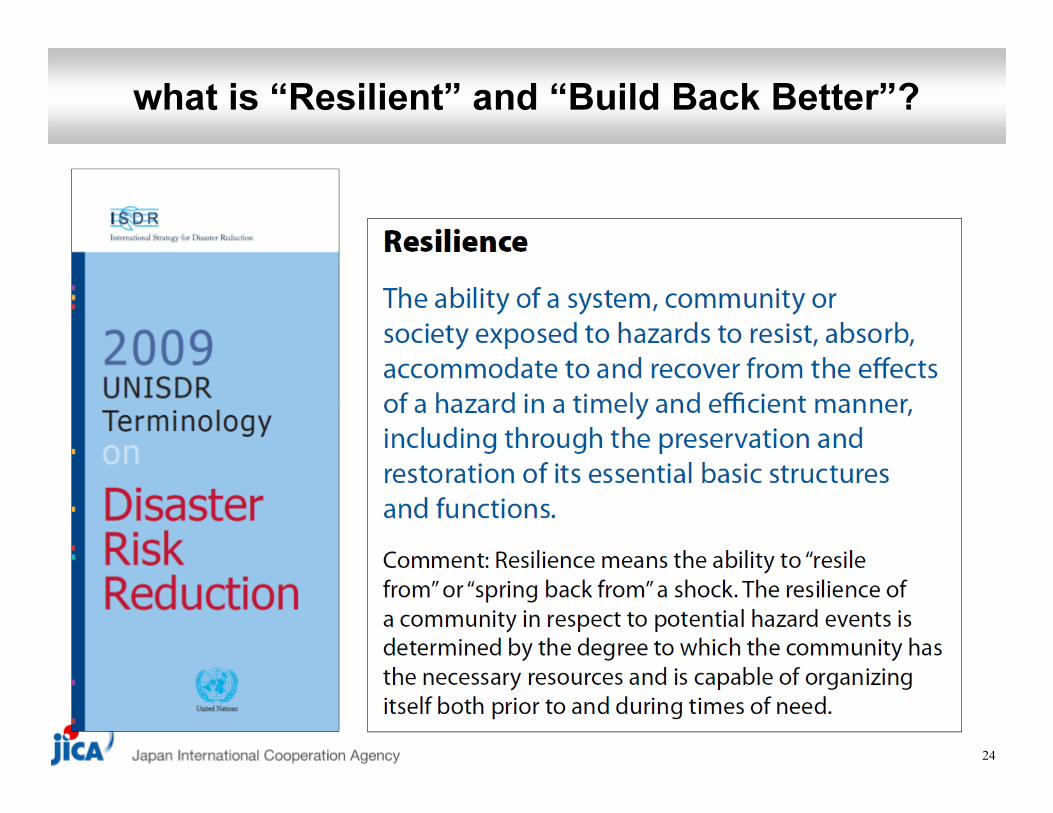
what is “Resilient” and “Build Back Better”?
24
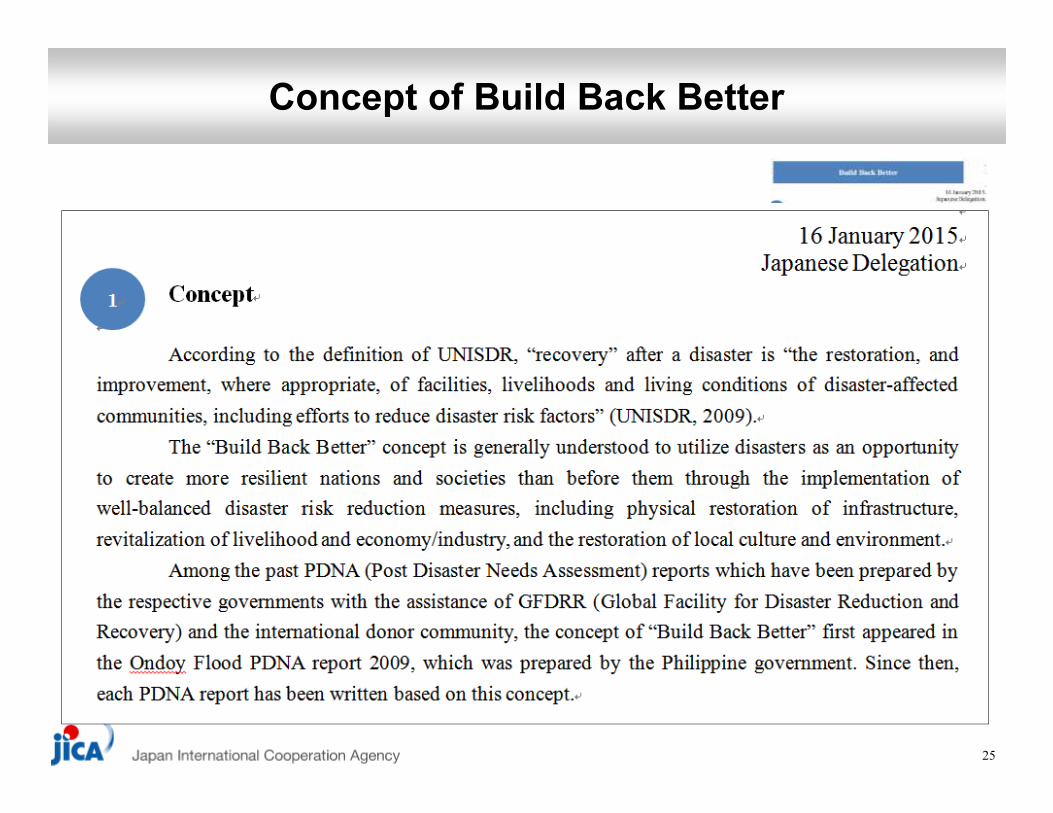
Concept of Build Back Better
25

4 Outcome Targets
Relation between each Targets
e. Increase number of
countries with national &
local strategies by 2020
3 input Target which can influence to another Targets
f. Enhance
International
Cooperation
g. Enhance Access to
the Disaster Risk
Information
4 Outcome Targets
26
a. Reduce disaster mortality
b. Reduce the number of affected people
d. Reduce disaster damage of critical infrastructures
c. Reduce disaster economic loss
economic loss
damage to critical
infrastructures
Relation between outcome Targetsand actions to be taken
affected people
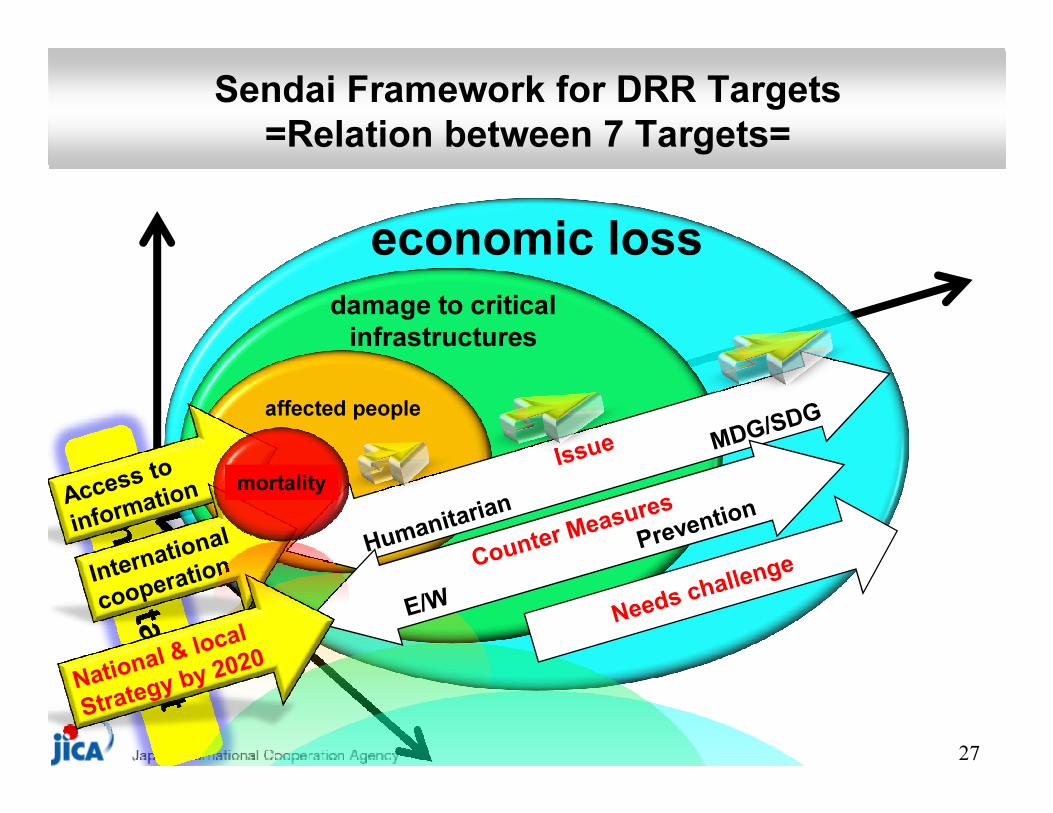
Sendai Framework for DRR Targets=Relation between 7 Targets=
27
affected people
mortality
economic loss
damage to critical
infrastructures
Relation between outcome Targetsand actions to be taken
affected people
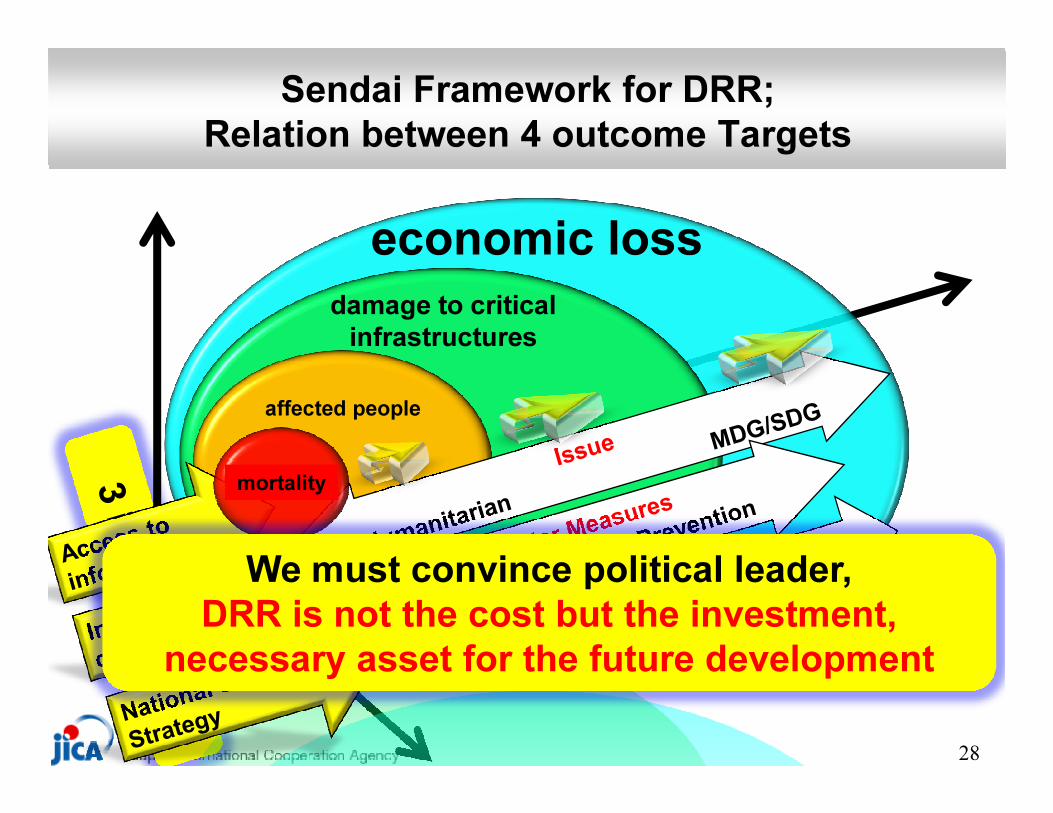
Sendai Framework for DRR;Relation between 4 outcome Targets
28
affected people
mortality
We must convince political leader,DRR is not the cost but the investment,
necessary asset for the future development
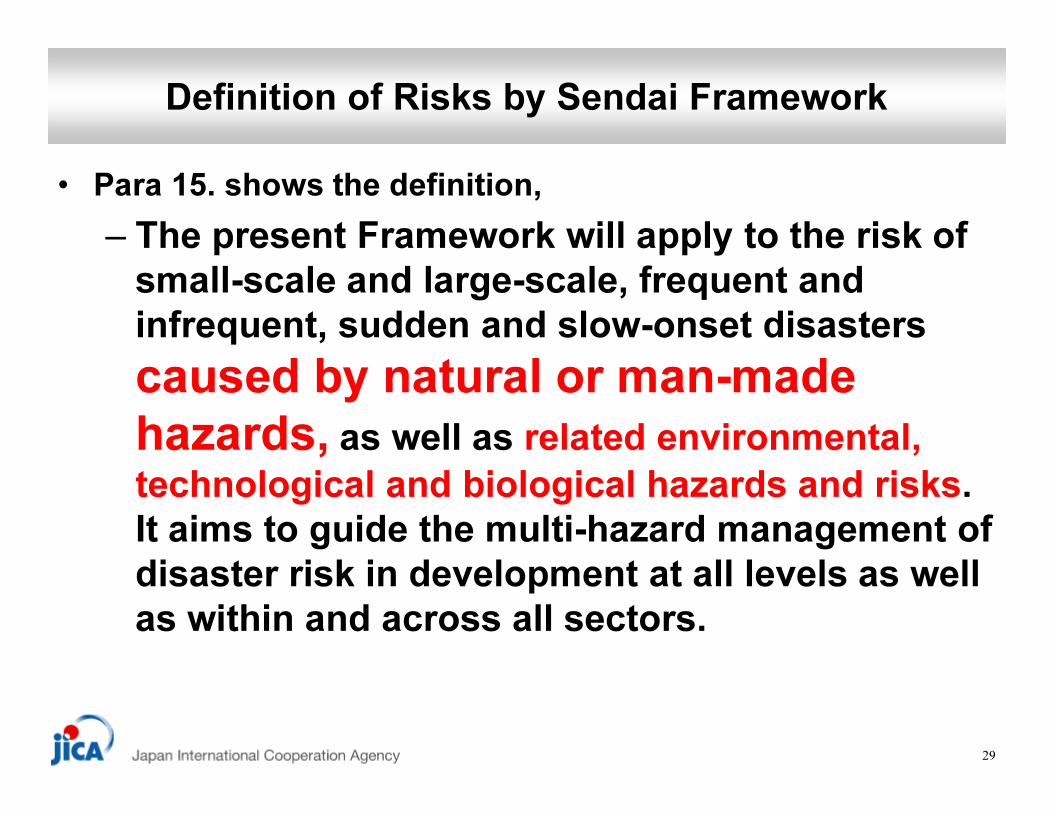
Definition of Risks by Sendai Framework
• Para 15. shows the definition,
– The present Framework will apply to the risk of small-scale and large-scale, frequent and infrequent, sudden and slow-onset disasters
caused by natural or man-made
hazards,hazards, as well as related environmental,
technological and biological hazards and risks. It aims to guide the multi-hazard management of disaster risk in development at all levels as well as within and across all sectors.
29

Indicators of Sendai Framework
• Indicator to monitor the implementation of Sendai Framework for DRR itself
• Used for relevant indicators for SDGs
• Indicator to monitor the achievement of the 7 Targets
• What kind of indicator be needed for Sendai Framework for DRR monitoring and mainstreaming DRR into the governmental policy?
①
governmental policy?
① minimum level:
monitor the implementation of Sendai Framework for DRR,
including proxy data-set also acceptable
② standard level:
not only monitor but show evidence to political leader, to
mainstream DRR as a development issue to Gov. policy
③ highest level:
back ground data set, scientifically, statistically can provide
future risk figure and solution, as academic resolution level30

1. Poverty eradication
2. Food security and nutrition
3. Health
4. Education
5. Gender equality and women's empowerment
6. Water & sanitation
7. Energy
17 Goals
169 Targets
Sustainable Development Goals(SDGs)(Adopted on Sep. 25th 2015)
230 Indicators have
been approved by
UN Statistical
Commission7. Energy
8. Economic Growth
9. Industrialization, innovation & infrastructure
10.Reducing inequality
11.Sustainable cities & human settlements
12.Sustainable Consumption and Production
13.Climate Change
14.Marine resources, oceans and seas
15.Ecosystems & biodiversity
16.Peaceful & inclusive society
17.Means of implementation
Commission
(Mar. 2016)
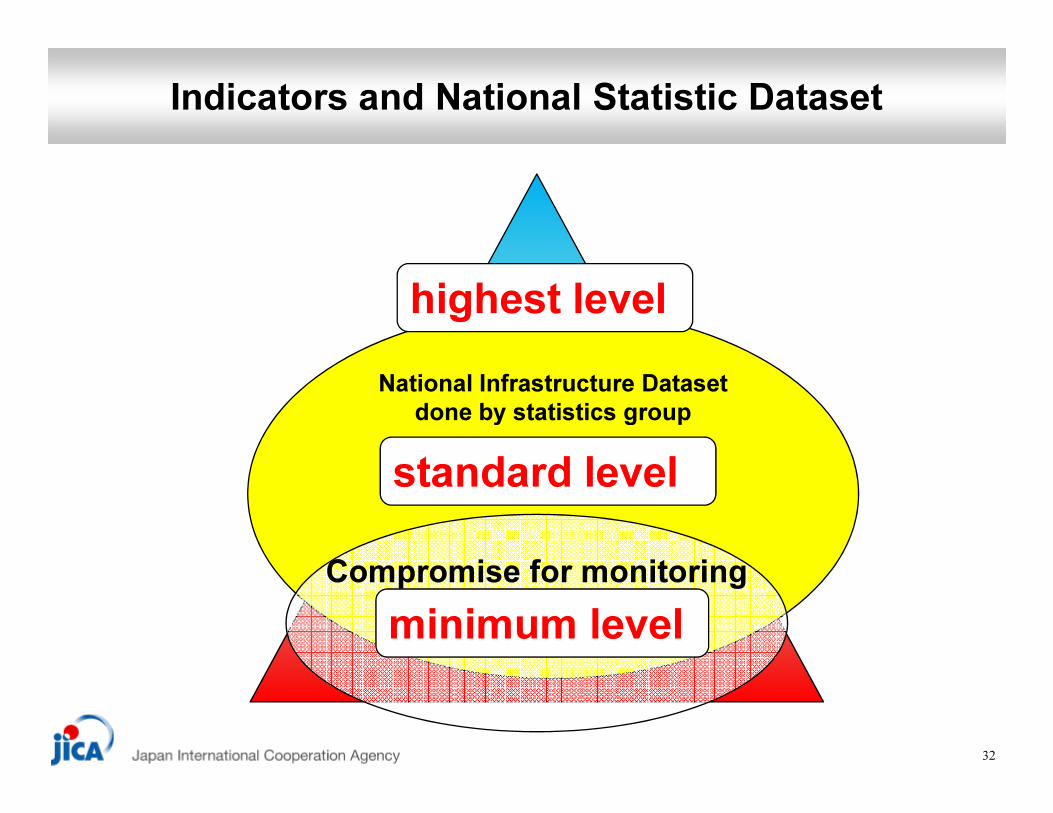
National Infrastructure Dataset
done by statistics group
Indicators and National Statistic Dataset
highest level
done by statistics group
32
Compromise for monitoring
minimum level
standard level

Variations of dataset 1
Globally Common Dataset
33
NationalSpecifiedDataset
Like Zodo?
Glacier melting?
Regional SpecifiedDataset
Cross border issue?
Monsoon specific?
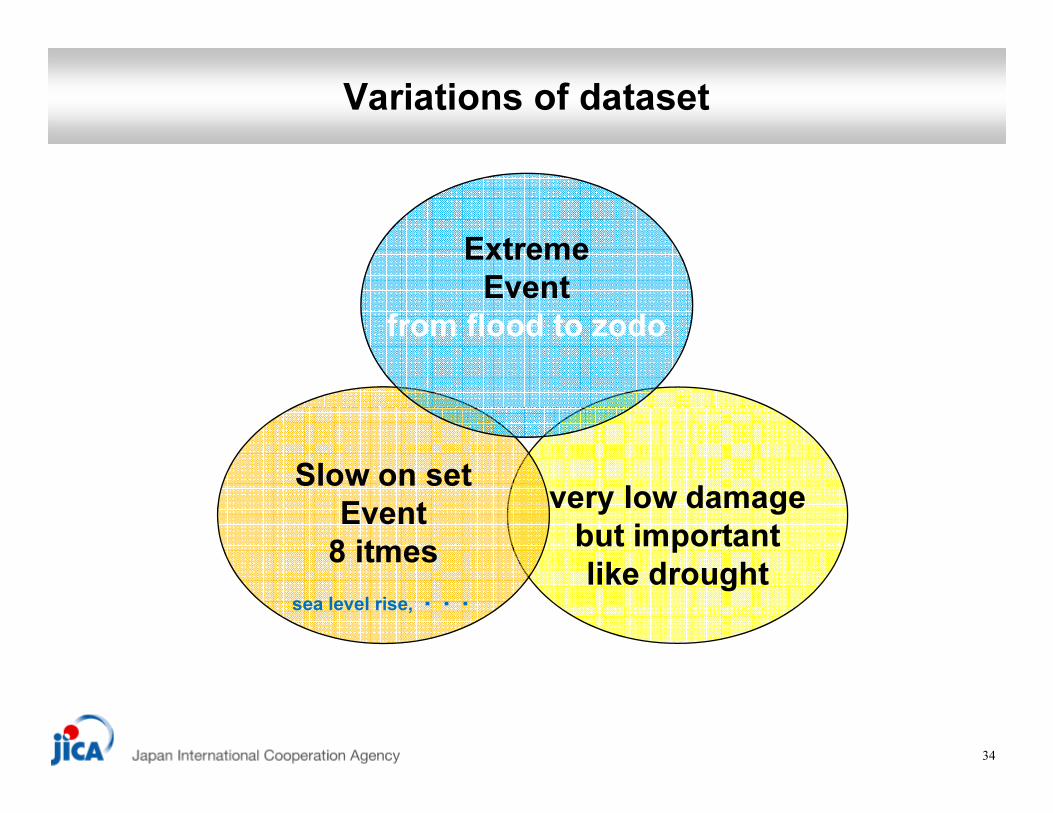
Variations of dataset
ExtremeEvent
from flood to zodo
34
very low damagebut importantlike drought
Slow on setEvent8 itmes
sea level rise, ・・・

Japanese Initiative for finalizing Indicators
35

Relation between Capacity and International Cooperation Needs
Total Support Input
(Capacity, Finance)
• Requested resources depends on each countries’ condition
Capacity → Finance → Capacity
• Start from Capacity Development Support for strategy
→shift to implementing financial support
→shift to every sector leaded by the central DRR agency
• support substances changes by this process
36
2020年
National & Local
DRR Strategy
pre-disaaster investment
Mainstreaming DRR into every
sector
(Capacity, Finance)
=Self Effort +International Cooperation
2030年?~ 2030年? 2050年?
Reconstruction Needs based on Random Disaster Happen

37

Poor people
living in the
vulnerable area
easy to
damage
live more vulnerable area
sometime on the street
Poor layer is continuously struggling with Spiral of “Disaster and Poverty”
3838
damage
loose
livelihood
easier to
be damaged
deflation
spiral
far away from
developing plan

Reduction of flood damages in Japan
by continuous investment6,000
5,000
4,000
3,000
2,000
1,000
01946 1951 1956 1961 1966 1971 1976 1981 1986 1991 1996 2001 2006
Number of fatalities by flood
Source: Water Disaster Statistics, Ministry of Land, Infrastructure Transport and Tourism
350,000
300,000
250,000
200,000
150,000
100,000
50,000
01962 1967 1972 1977 1982 1987 1992 1997 2002 2007
Area inundated (ha)
Number of fatalities and inundation area have dramatically been reduced in Japan
due to continuous investment in and efforts for flood mitigation.
1946 1951 1956 1961 1966 1971 1976 1981 1986 1991 1996 2001 2006

Proposing tools for Post MDG/HFA
Convince Policy Maker
by DR2AD Model
Approach for today’s invest
40
Disaster Risk Assessment
to all projects
Approach for today’s invest
Low Regret Investment

41

Existing knowledge for each priority area from the practitioner’s “brute” view, enough or not?
= not from deliver side but from needs on the ground =
A ctio n A reaE xistin g K n o w led g e/R esea rch en o u g h o r n o t?
E xp ected su p p o rt fro m S & T
P rio rity 1
U n d erstan d in g d isaster risk h azard /risk m ap p in g ○
D isa ster sta tistic d a ta sto ck ×S tan d ard ization of d ataset △
C C /d o w n sca lin g in to p ra ctica l p la n /red u ce u n certa in ty ×E arth q u ake p rid iction ×U sin g satelite/n on d estru ctive m eth od ology △U sin g in n ovated tech n ology for M eteorology ○
42
P rio rity 2S tren gth en in g d isaster riskgovern an ce to m an age d isaster risk
N ation al/Local D R R P lan n in g ○
P o litica l m ech a n ism /d yn a m ism resea rch ×C o n v in ce P o litica l L ea d er/S o cia l, P o litica l S cien ce ×E ffective M on itarin g m eth od ology ×
P rio rity 3In vestin g in d isaster risk red u ction forresilien ce
P ractical p reven tion m esu res ○M a cro eco n o m ic ev id en ce o f D R R effectiv en ess ×C C /d o w n sca lin g in to p ra ctica l p la n /red u ce u n certa in ty ×
P rio rity 4 -1E n h an cin g d isaster p rep ared n ess foreffective resp on se
U sin g sa telite p ra ctica l m eth o d o lo g y ×P reven t p rod u ce fu tu re/u n d erlyin g risk ×
P rio rity 4 -2“B u ild B ack B etter” in recovery,reh ab ilitation an d recon stru ction
C C /d o w n sca lin g in to p ra ctica l p la n /red u ce u n certa in ty ×A p p ro p ria te seism ic d esig n fo r m a so n ry h o u se △
Related Documents