Semonti Basu PBS Technical Assistance Facilitator Grace Martino-Brewster PBS Specialist Austin Independent School District Connecting Data Dots Using data-based decision making for continuous school improvement

Semonti Basu PBS Technical Assistance Facilitator Grace Martino-Brewster PBS Specialist Austin Independent School District Connecting Data Dots Using data-based.
Dec 14, 2015
Welcome message from author
This document is posted to help you gain knowledge. Please leave a comment to let me know what you think about it! Share it to your friends and learn new things together.
Transcript
Semonti Basu PBS Technical Assistance Facilitator
Grace Martino-BrewsterPBS Specialist
Austin Independent School District
Connecting Data Dots Using data-based decision making for
continuous school improvement
Why Worry About the Data?Without continual growth and progress, such words as improvement, achievement, and success have no meaning.
Benjamin Franklin
When thinking about academics, we ask ourselves…
• What is it we want our students to know and to do?
• How will we know when they have learned it?
• What will we do when some of them have not learned it?
What would happen if we asked the same questions and utilized similar data to think about student behavior?
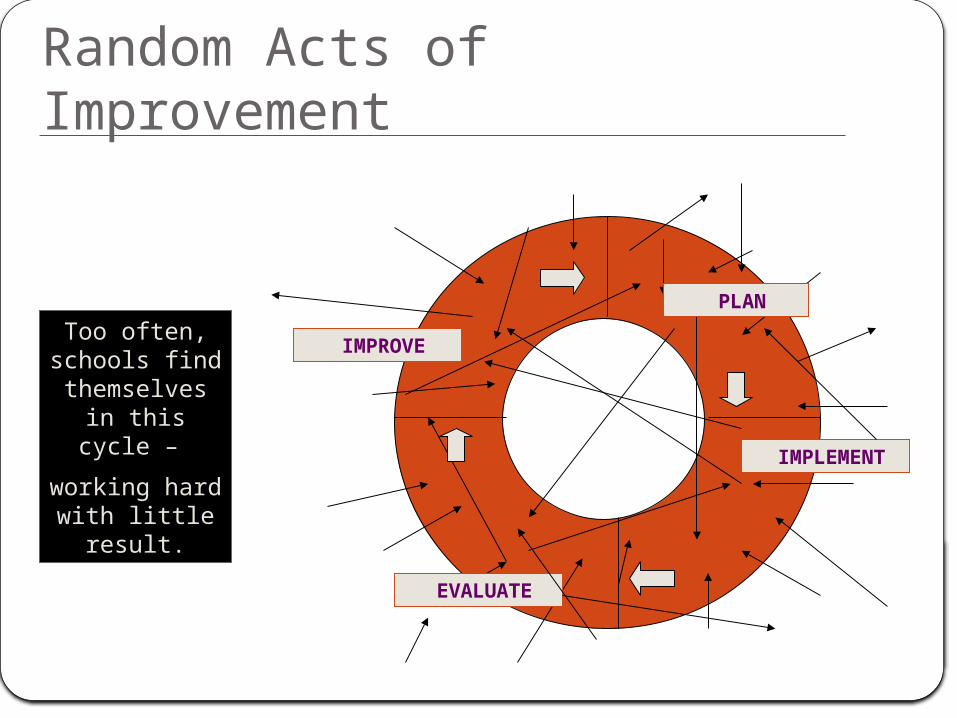
IMPLEMENT
IMPROVE
EVALUATE
PLAN
Random Acts of Improvement
Too often, schools find
themselves in this cycle –
working hard with little result.
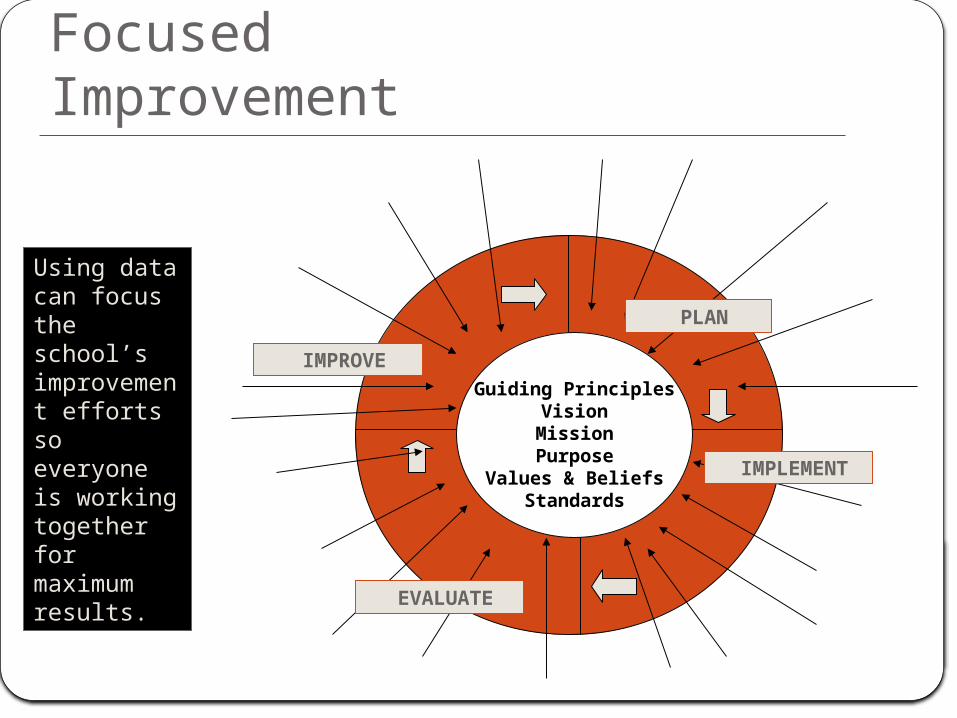
Guiding PrinciplesVision
MissionPurpose
Values & BeliefsStandards
IMPROVE
EVALUATE
PLAN
IMPLEMENT
Focused Improvement
Using data can focus the school’s improvement efforts so everyone is working together for maximum results.
What does this mean for a PBS Campus?• The PBS Process relies on a culture of data-
driven decision making – objective information about behavior is more reliable than labels, conclusions, and stereotypes.
• The campus PBS team must learn to utilize all the data available to make the best possible decisions for school improvement.
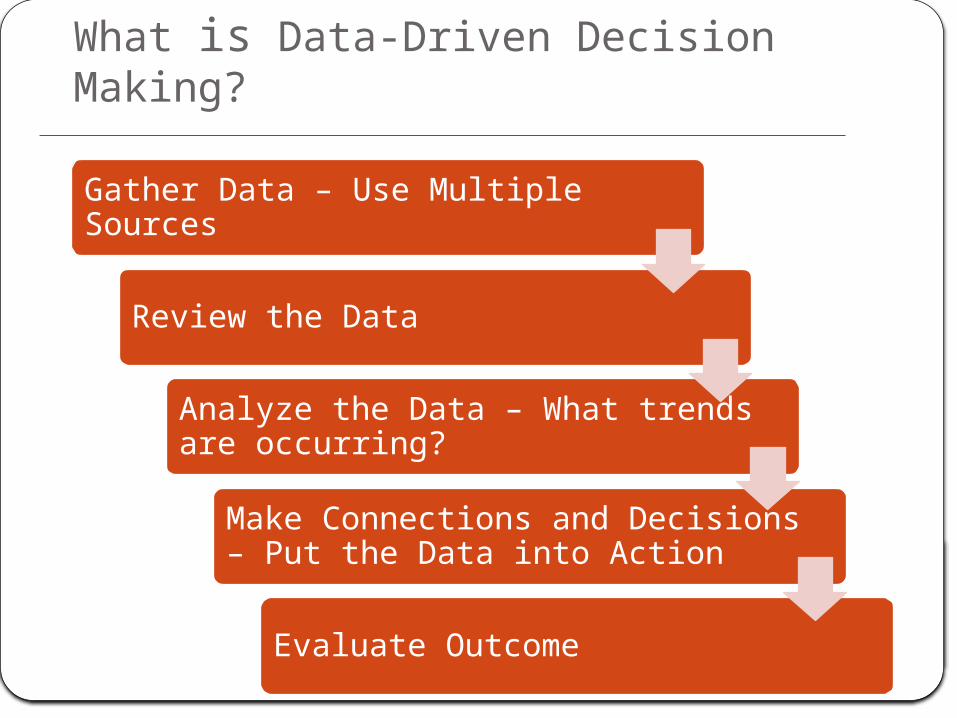
What is Data-Driven Decision Making?
Gather Data – Use Multiple Sources
Review the Data
Analyze the Data – What trends are occurring?
Make Connections and Decisions – Put the Data into Action
Evaluate Outcome
Data- Driven decision making using a single data source
How to Analyze Discipline Data
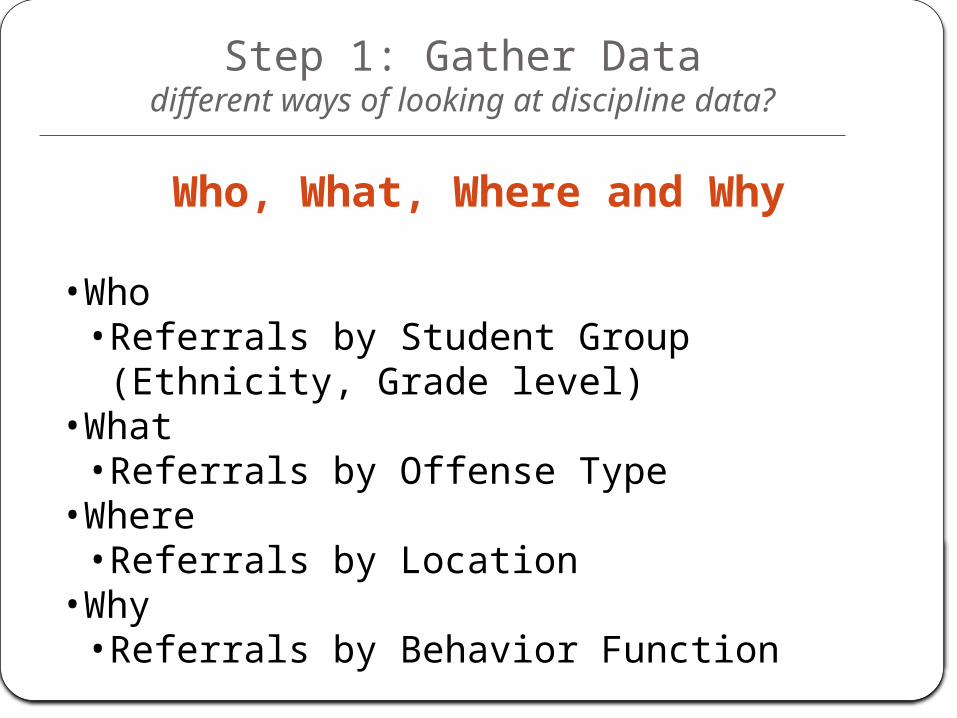
Who, What, Where and Why
Step 1: Gather Datadifferent ways of looking at discipline data?
•Who• Referrals by Student Group (Ethnicity, Grade level)
•What• Referrals by Offense Type
•Where• Referrals by Location
•Why• Referrals by Behavior Function
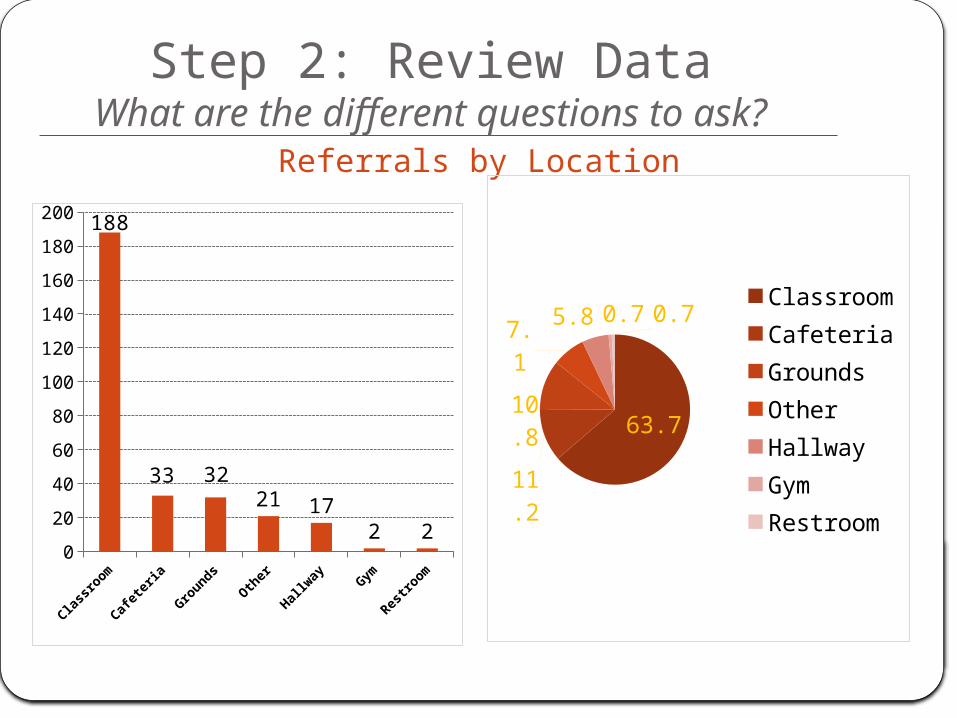
Referrals by Location
Step 2: Review DataWhat are the different questions to ask?
Class
room
Cafet
eria
Gro
unds
Oth
er
Hallw
ayGym
Restroo
m
0
20
40
60
80
100
120
140
160
180
200 188
33 3221 17
2 2
63.711.2
10.8
7.15.8 0.7 0.7
ClassroomCafeteriaGroundsOtherHallwayGymRestroom
Step 3: Analyze DataWhat are some trends to consider ?
•From what location on campus are the greatest number of referrals generated?
•What school-wide patterns and trends does the Location data reveal?

Step 4: Make ConnectionsHow to put data into action?
•If greater than 40% of referrals originate from the classroom what types of school-wide initiatives for classroom management may be appropriate to consider?
(e.g. classroom coaching, scaffolding classroom management)
•What types of interventions may be appropriate for common areas which generate high numbers of referrals?
(e.g. active supervision training)

Data- Driven decision making using multiple data sources
How to Incorporate Other Data into Your Improvement Plan
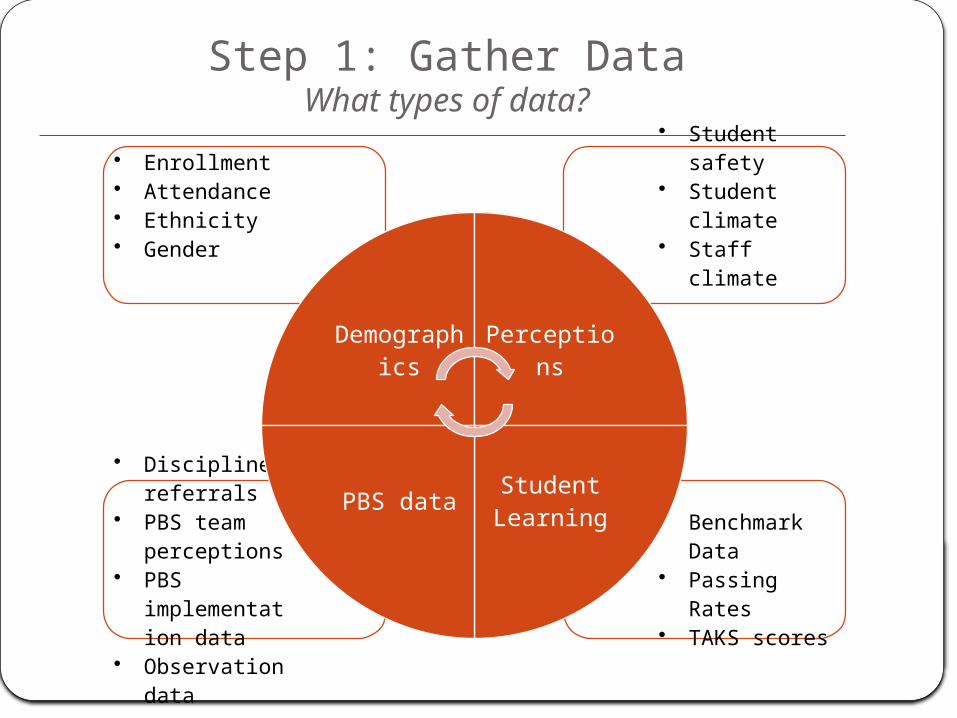
Step 1: Gather DataWhat types of data?
• Enrollment• Attendance• Ethnicity• Gender
• Student safety
• Student climate
• Staff climate
• Benchmark Data
• Passing Rates• TAKS scores
• Discipline referrals
• PBS team perceptions
• PBS implementation data
• Observation data
Demographics
Perceptions
Student LearningPBS data
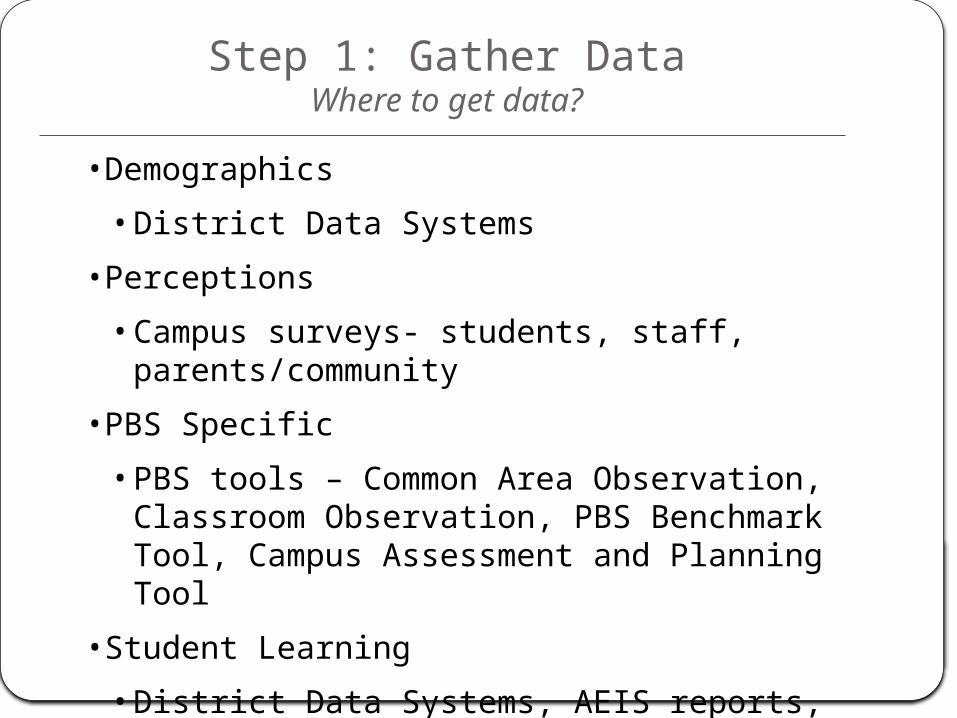
•Demographics
• District Data Systems
•Perceptions
• Campus surveys- students, staff, parents/community
•PBS Specific
• PBS tools – Common Area Observation, Classroom Observation, PBS Benchmark Tool, Campus Assessment and Planning Tool
•Student Learning
• District Data Systems, AEIS reports, TEA ratings
Step 1: Gather DataWhere to get data?
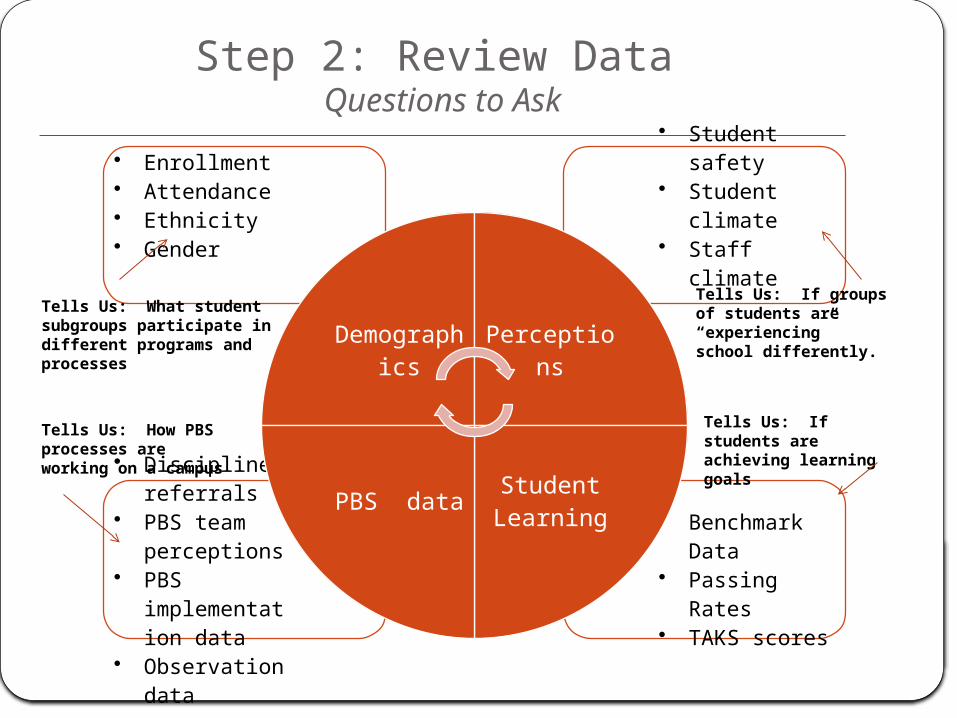
Step 2: Review Data Questions to Ask
• Enrollment• Attendance• Ethnicity• Gender
• Student safety
• Student climate
• Staff climate
• Benchmark Data
• Passing Rates• TAKS scores
• Discipline referrals
• PBS team perceptions
• PBS implementation data
• Observation data
Demographics
Perceptions
Student LearningPBS data
Tells Us: If students are achieving learning goals
Tells Us: If groups of students are “experiencing” school differently.
Tells Us: What student subgroups participate in different programs and processes
Tells Us: How PBS processes are working on a campus
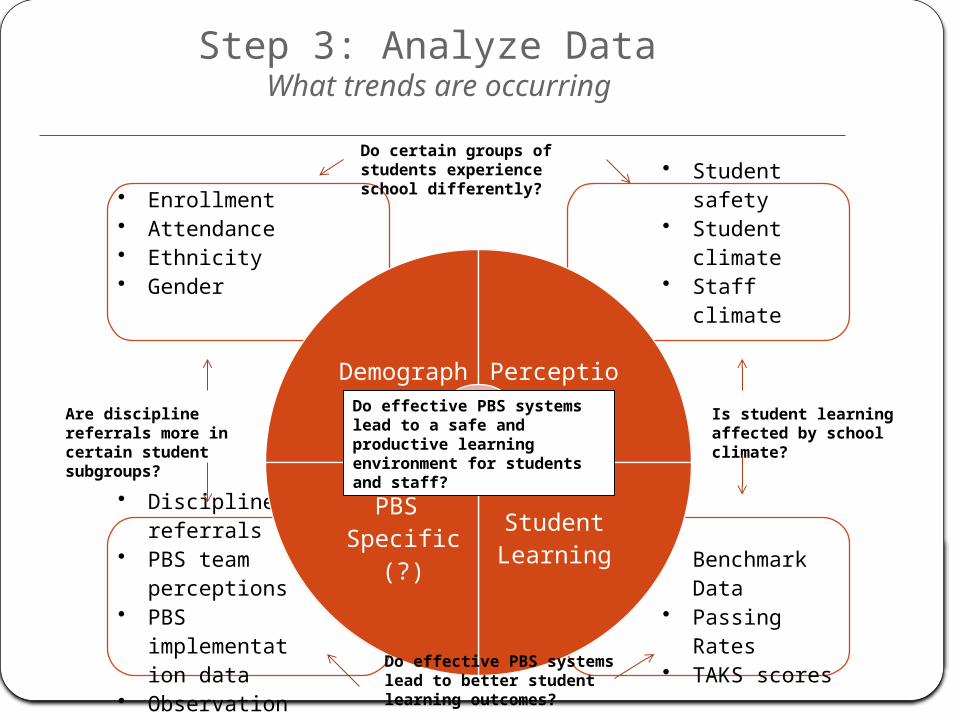
Step 3: Analyze Data What trends are occurring
• Enrollment• Attendance• Ethnicity• Gender
• Student safety
• Student climate
• Staff climate
• Benchmark Data
• Passing Rates• TAKS scores
• Discipline referrals
• PBS team perceptions
• PBS implementation data
• Observation data
Demographics
Perceptions
Student Learning
PBS Specific
(?)
Are discipline referrals more in certain student subgroups?
Do effective PBS systems lead to a safe and productive learning environment for students and staff?
Do effective PBS systems lead to better student learning outcomes?
Is student learning affected by school climate?
Do certain groups of students experience school differently?
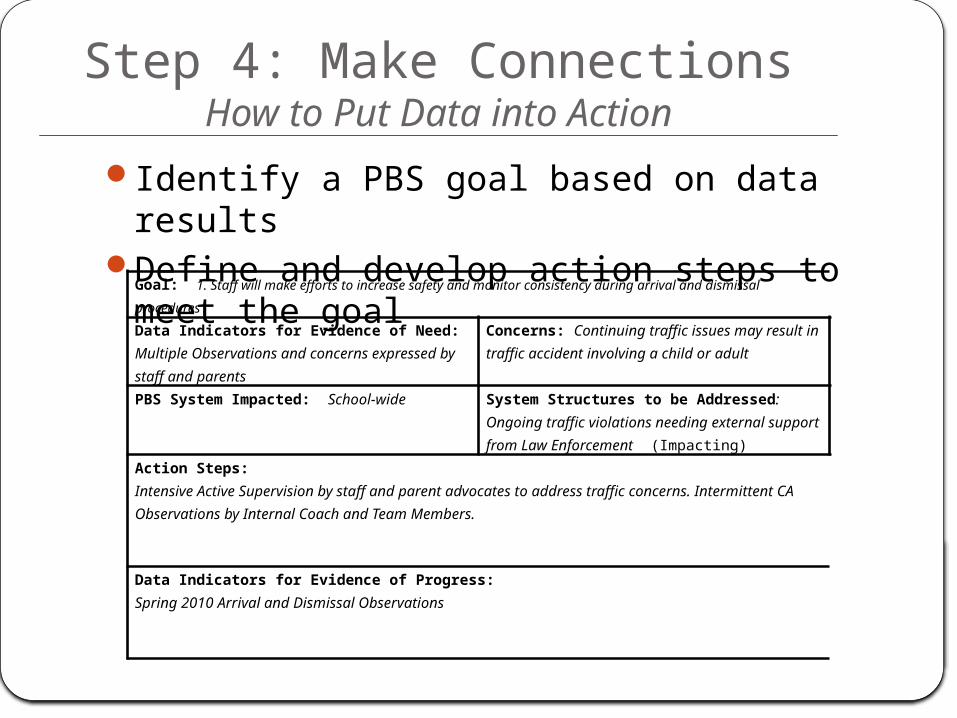
Step 4: Make ConnectionsHow to Put Data into Action
Identify a PBS goal based on data results Define and develop action steps to meet
the goal Goal: 1. Staff will make efforts to increase safety and monitor consistency during arrival and dismissal procedures.
Data Indicators for Evidence of Need:Multiple Observations and concerns expressed by staff and parents
Concerns: Continuing traffic issues may result in traffic accident involving a child or adult
PBS System Impacted: School-wide System Structures to be Addressed: Ongoing traffic violations needing external support from Law Enforcement (Impacting)
Action Steps:Intensive Active Supervision by staff and parent advocates to address traffic concerns. Intermittent CA Observations by Internal Coach and Team Members.
Data Indicators for Evidence of Progress:Spring 2010 Arrival and Dismissal Observations

Step 5: Evaluate Outcomes
For Discipline Data For District Data Are interventions
addressing data trends successful?
Have interventions led to fewer discipline referrals?
How have PBS interventions affected school climate and student achievement
What impact does PBS have on dropout rates?

Data based decision making using PBS tools
Introduction to AISD PBS Tools
Observation Tools
What it does• Structured information gathering to inform
implementation
Why it is useful• Provides a tool for identifying needs in specific
PBS systems• Ensure consistent data collection
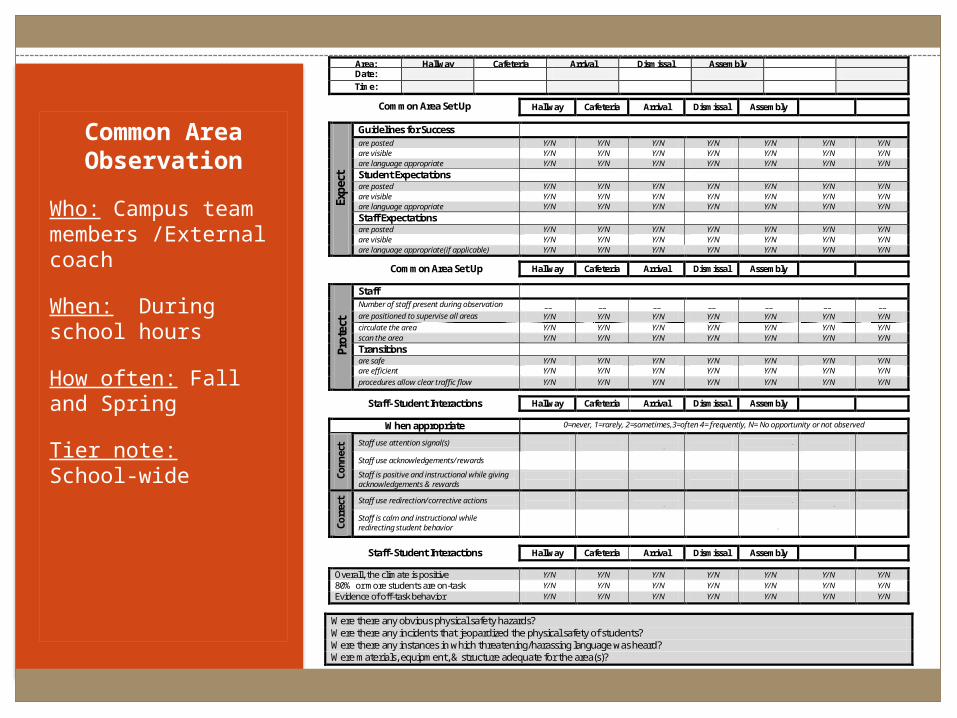
Common Area Observation
Who: Campus team members /External coach
When: During school hours
How often: Fall and Spring
Tier note: School-wide
PBS Common Area Observation Form For _____________________ Area: Hallway Cafeteria Arrival Dismissal Assembly Date: Time:
Common Area Set Up Hallway Cafeteria Arrival Dismissal Assembly
Ex
pect
Guidelines for Success are posted Y/N Y/N Y/N Y/N Y/N Y/N Y/N are visible Y/N Y/N Y/N Y/N Y/N Y/N Y/N are language appropriate Y/N Y/N Y/N Y/N Y/N Y/N Y/N
Student Expectations are posted Y/N Y/N Y/N Y/N Y/N Y/N Y/N are visible Y/N Y/N Y/N Y/N Y/N Y/N Y/N are language appropriate Y/N Y/N Y/N Y/N Y/N Y/N Y/N
Staff Expectations are posted Y/N Y/N Y/N Y/N Y/N Y/N Y/N are visible Y/N Y/N Y/N Y/N Y/N Y/N Y/N are language appropriate(if applicable) Y/N Y/N Y/N Y/N Y/N Y/N Y/N
Common Area Set Up Hallway Cafeteria Arrival Dismissal Assembly
Pr
otec
t
Staff
Number of staff present during observation __ __ __ __ __ __ __ are positioned to supervise all areas Y/N Y/N Y/N Y/N Y/N Y/N Y/N circulate the area Y/N Y/N Y/N Y/N Y/N Y/N Y/N scan the area Y/N Y/N Y/N Y/N Y/N Y/N Y/N
Transitions are safe Y/N Y/N Y/N Y/N Y/N Y/N Y/N are efficient Y/N Y/N Y/N Y/N Y/N Y/N Y/N procedures allow clear traffic flow Y/N Y/N Y/N Y/N Y/N Y/N Y/N
Staff- Student Interactions Hallway Cafeteria Arrival Dismissal Assembly
When appropriate 0=never, 1=rarely, 2=sometimes,3=often 4= frequently, N= No opportunity or not observed
Conn
ect Staff use attention signal(s) Choose an
item. Choose an
item. Choose an
item. Choose an
item. Choose an item. Choose an item.
Choose an item.
Staff use acknowledgements/rewards Choose an item.
Choose an item.
Choose an item.
Choose an item.
Choose an item.
Choose an item.
Choose an item.
Staff is positive and instructional while giving acknowledgements & rewards
Choose an item.
Choose an item.
Choose an item.
Choose an item.
Choose an item.
Choose an item.
Choose an item.
Corr
ect Staff use redirection/corrective actions Choose an
item. Choose an
item. Choose an
item. Choose an
item. Choose an item. Choose an item.
Choose an item.
Staff is calm and instructional while redirecting student behavior
Choose an item.
Choose an item.
Choose an item.
Choose an item.
Choose an item.
Choose an item.
Choose an item.
Staff- Student Interactions Hallway Cafeteria Arrival Dismissal Assembly
Overall, the climate is positive Y/N Y/N Y/N Y/N Y/N Y/N Y/N 80% or more students are on-task Y/N Y/N Y/N Y/N Y/N Y/N Y/N Evidence of off-task behavior Y/N Y/N Y/N Y/N Y/N Y/N Y/N
Were there any obvious physical safety hazards? Were there any incidents that jeopardized the physical safety of students? Were there any instances in which threatening/harassing language was heard? Were materials, equipment, & structure adequate for the area(s)?
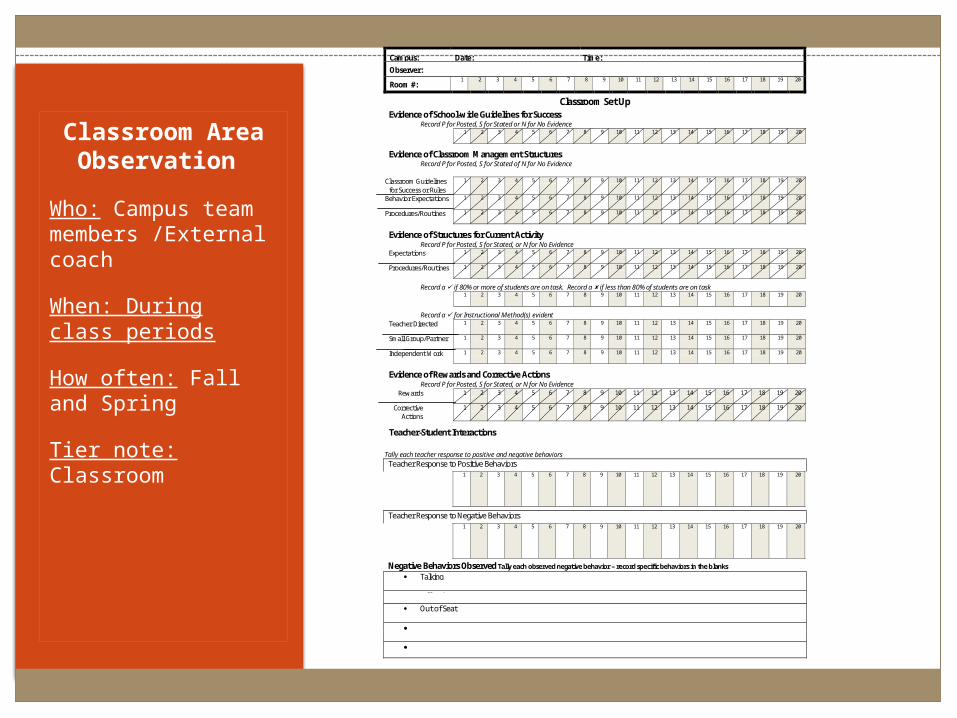
Classroom Area Observation
Who: Campus team members /External coach
When: During class periods
How often: Fall and Spring
Tier note: Classroom
PBS Multiple Classroom Observation Form
Campus: Date: Time:
Observer:
Room #: 1 2 3 4 5 6 7 8 9 10 11 12 13 14 15 16 17 18 19 20
Classroom Set Up Evidence of School-wide Guidelines for Success
Record P for Posted, S for Stated or N for No Evidence
1 2 3 4 5 6 7 8 9 10 11 12 13 14 15 16 17 18 19 20
Evidence of Classroom Management Structures Record P for Posted, S for Stated of N for No Evidence
Classroom Guidelines
for Success or Rules 1 2 3 4 5 6 7 8 9 10 11 12 13 14 15 16 17 18 19 20
Behavior Expectations 1 2 3 4 5 6 7 8 9 10 11 12 13 14 15 16 17 18 19 20
Procedures/Routines 1 2 3 4 5 6 7 8 9 10 11 12 13 14 15 16 17 18 19 20
Evidence of Structures for Current Activity Record P for Posted, S for Stated, or N for No Evidence
Expectations 1 2 3 4 5 6 7 8 9 10 11 12 13 14 15 16 17 18 19 20
Procedures/Routines 1 2 3 4 5 6 7 8 9 10 11 12 13 14 15 16 17 18 19 20
Record a if 80% or more of students are on task. Record a if less than 80% of students are on task 1 2 3 4 5 6 7 8 9 10 11 12 13 14 15 16 17 18 19 20
Record a for Instructional Method(s) evident Teacher Directed 1 2 3 4 5 6 7 8 9 10 11 12 13 14 15 16 17 18 19 20
Small Group/Partner 1 2 3 4 5 6 7 8 9 10 11 12 13 14 15 16 17 18 19 20
Independent Work 1 2 3 4 5 6 7 8 9 10 11 12 13 14 15 16 17 18 19 20
Evidence of Rewards and Corrective Actions Record P for Posted, S for Stated, or N for No Evidence
Rewards 1 2 3 4 5 6 7 8 9 10 11 12 13 14 15 16 17 18 19 20
Corrective Actions
1 2 3 4 5 6 7 8 9 10 11 12 13 14 15 16 17 18 19 20
Teacher-Student Interactions
Tally each teacher response to positive and negative behaviors Teacher Response to Positive Behaviors
1 2 3 4 5 6 7 8 9 10 11 12 13 14 15 16 17 18 19 20
Teacher Response to Negative Behaviors
1 2 3 4 5 6 7 8 9 10 11 12 13 14 15 16 17 18 19 20
Negative Behaviors Observed Tally each observed negative behavior – record specific behaviors in the blanks
Talking
Off Task Out of Seat
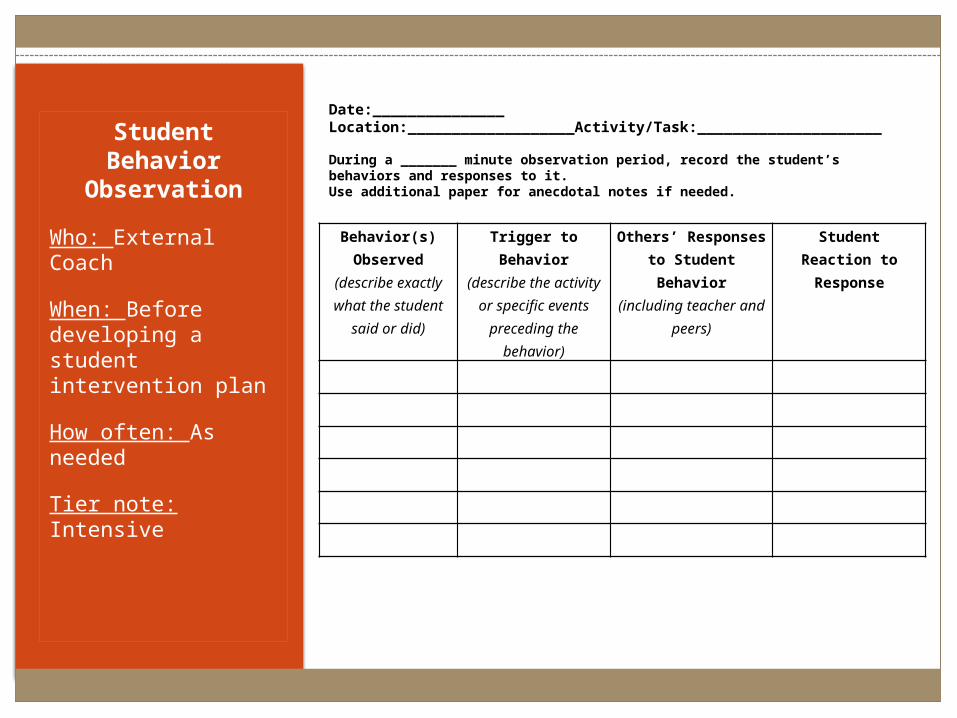
Student Behavior
Observation
Who: External Coach
When: Before developing a student intervention plan
How often: As needed
Tier note: Intensive
Behavior(s) Observed
(describe exactly what the student said
or did)
Trigger to Behavior(describe the activity
or specific events preceding the
behavior)
Others’ Responses to Student Behavior
(including teacher and peers)
Student Reaction to Response
Date:_______________ Location:___________________Activity/Task:_____________________
During a _______ minute observation period, record the student’s behaviors and responses to it. Use additional paper for anecdotal notes if needed.
CAPT and Benchmark
What it does• CAPT -Provides status of campus activities• Benchmark – Provides quality of campus
activities
Why it is useful• Evidence of fidelity provided• Multiple perspectives incorporated
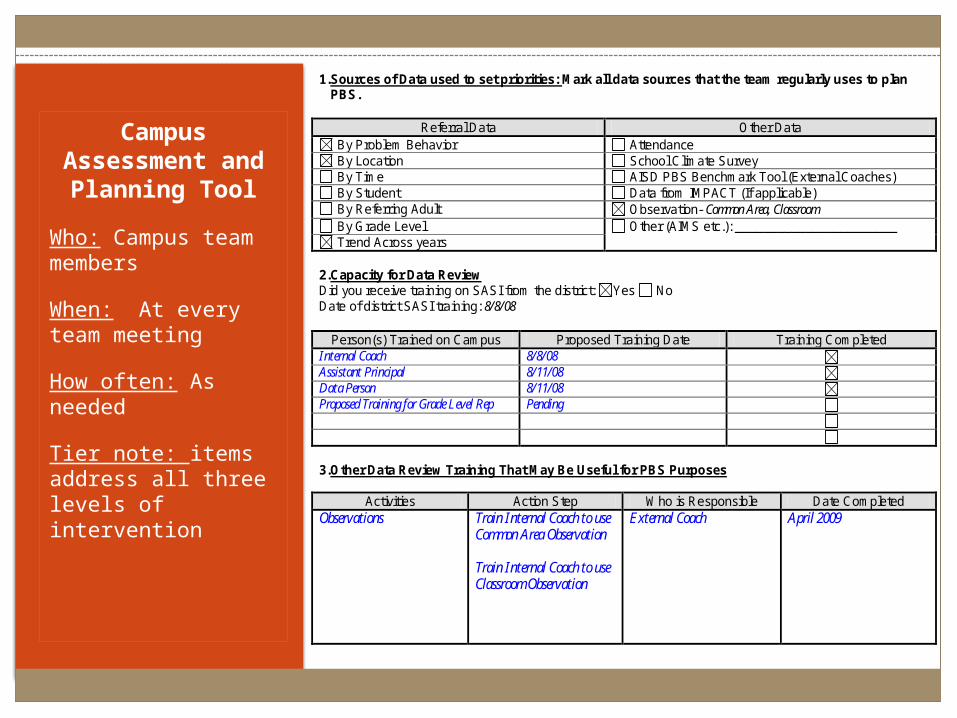
Campus Assessment and
Planning Tool
Who: Campus team members
When: At every team meeting
How often: As needed
Tier note: items address all three levels of intervention
1. Sources of Data used to set priorities: Mark all data sources that the team regularly uses to plan PBS.
Referral Data Other Data
By Problem Behavior Attendance By Location School Climate Survey By Time AISD PBS Benchmark Tool (External Coaches) By Student Data from IMPACT (If applicable) By Referring Adult Observation- Common Area, Classroom By Grade Level Other (AIMS etc.): _______________________ Trend Across years
2. Capacity for Data Review Did you receive training on SASI from the district: Yes No Date of district SASI training: 8/8/08
Person(s) Trained on Campus Proposed Training Date Training Completed Internal Coach 8/8/08 Assistant Principal 8/11/08 Data Person 8/11/08 Proposed Training for Grade Level Rep Pending 3. Other Data Review Training That May Be Useful for PBS Purposes
Activities Action Step Who is Responsible Date Completed Observations
Train Internal Coach to use Common Area Observation
Train Internal Coach to use Classroom Observation
External Coach April 2009
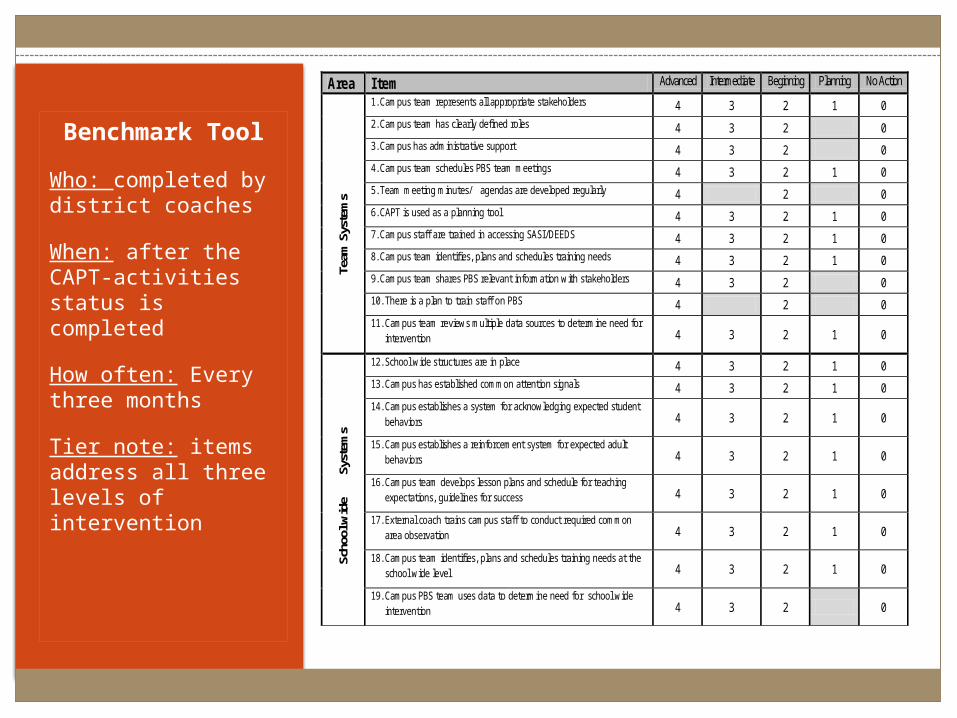
Benchmark Tool
Who: completed by district coaches
When: after the CAPT-activities status is completed
How often: Every three months
Tier note: items address all three levels of intervention
Area Item Advanced Intermediate Beginning Planning No Action
Team
Sys
tem
s
1. Campus team represents all appropriate stakeholders 4 3 2 1 0 2. Campus team has clearly defined roles 4 3 2 0 3. Campus has administrative support 4 3 2 0 4. Campus team schedules PBS team meetings 4 3 2 1 0 5. Team meeting minutes/ agendas are developed regularly 4 2 0 6. CAPT is used as a planning tool 4 3 2 1 0 7. Campus staff are trained in accessing SASI/DEEDS 4 3 2 1 0 8. Campus team identifies, plans and schedules training needs 4 3 2 1 0 9. Campus team shares PBS relevant information with stakeholders 4 3 2 0 10. There is a plan to train staff on PBS 4 2 0 11. Campus team reviews multiple data sources to determine need for
intervention 4 3 2 1 0 Sc
hool
wid
e S
yste
ms
12. School wide structures are in place 4 3 2 1 0 13. Campus has established common attention signals 4 3 2 1 0 14. Campus establishes a system for acknowledging expected student
behaviors 4 3 2 1 0
15. Campus establishes a reinforcement system for expected adult behaviors 4 3 2 1 0
16. Campus team develops lesson plans and schedule for teaching expectations, guidelines for success 4 3 2 1 0
17. External coach trains campus staff to conduct required common area observation 4 3 2 1 0
18. Campus team identifies, plans and schedules training needs at the school wide level 4 3 2 1 0
19. Campus PBS team uses data to determine need for school wide intervention 4 3 2 0
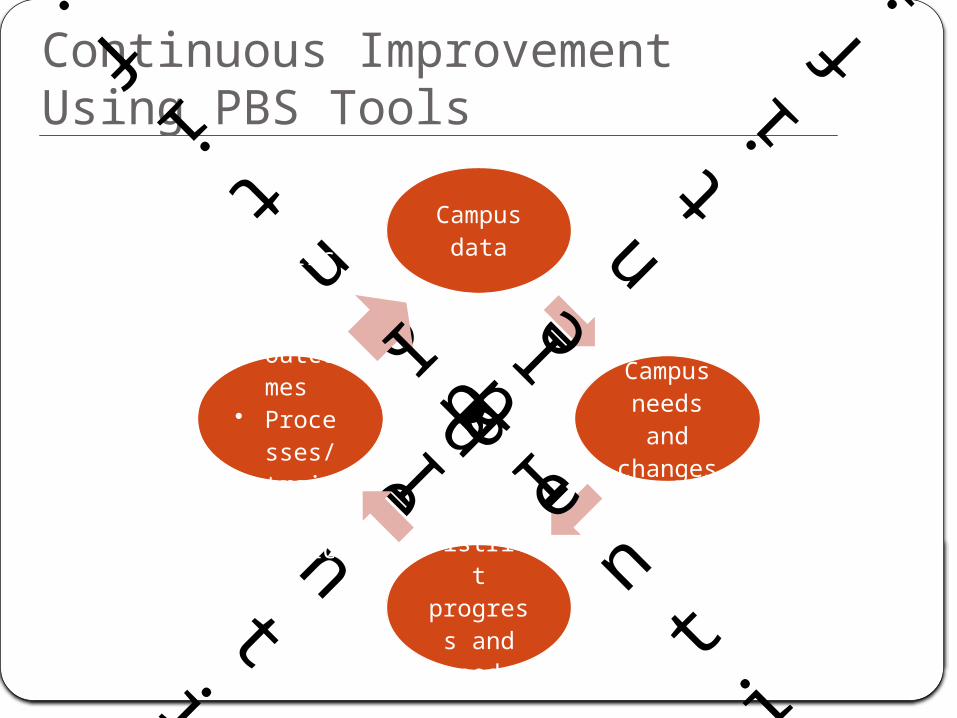
Continuous Improvement Using PBS Tools
Campus data
Id
en
ti
fi
es
Campus needs and
changesI
de
nt
if
ie
s
District progress
and needs
Id
en
ti
fi
es
District change• Outco
mes• Proces
ses/training
• Policy
Id
en
ti
fi
es

Campus Implementation Report
What it Does? Graph summarizes implementation level by
areaTable summarizes priorities identified by the
campusWhy is it useful? Provides a campus snapshot for
implementationProvides feedback on whether campus
teams are identifying needs based on implementation data
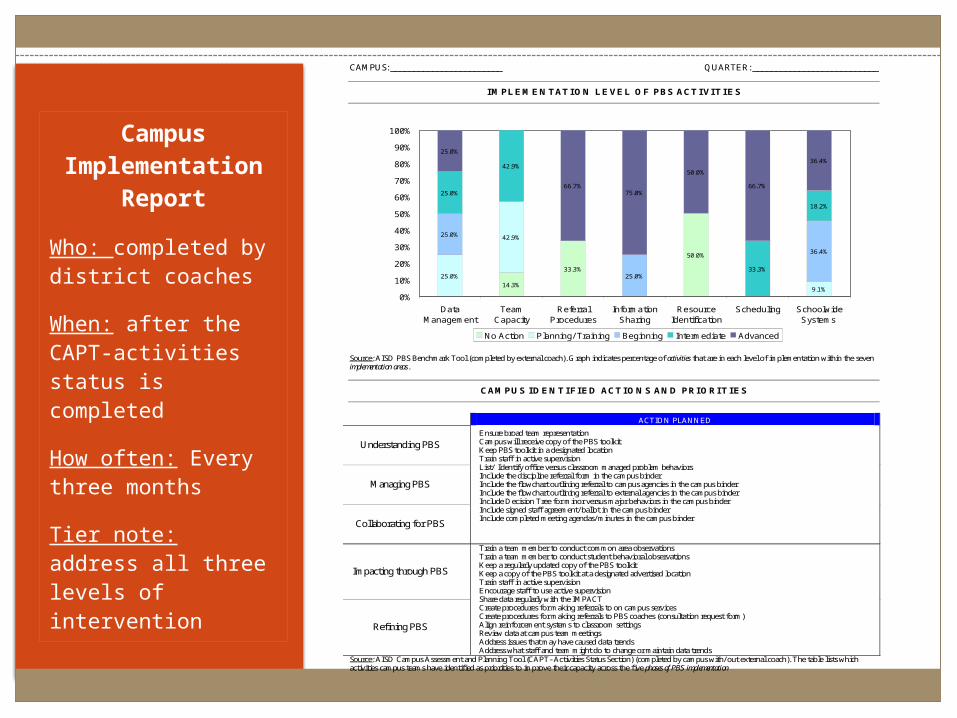
Campus Implementatio
n Report
Who: completed by district coaches
When: after the CAPT-activities status is completed
How often: Every three months
Tier note: address all three levels of intervention
PBS QUARTERLY IMPLEMENTATION REPORT
CAMPUS: ________________________ QUARTER: ___________________________
IMPLEMENTATION LEVEL OF PBS ACTIVITIES
14.3%
33.3%
50.0%
25.0%
42.9%
9.1%
25.0%
25.0%
36.4%
25.0%
42.9%
33.3%
18.2%
25.0%
66.7%75.0%
50.0%
66.7%
36.4%
0%
10%
20%
30%
40%
50%
60%
70%
80%
90%
100%
DataManagement
TeamCapacity
ReferralProcedures
InformationSharing
ResourceIdentification
Scheduling SchoolwideSystems
No Action Planning/ Training Beginning Intermediate Advanced
Source: AISD PBS Benchmark Tool (completed by external coach). Graph indicates percentage of activities that are in each level of implementation within the seven implementation areas.
CAMPUS IDENTIFIED ACTIONS AND PRIORITIES
ACTION PLANNED
Understanding PBS Ensure broad team representation Campus will receive copy of the PBS toolkit Keep PBS toolkit in a designated location Train staff in active supervision List/ Identify office versus classroom managed problem behaviors Include the discipline referral form in the campus binder Include the flowchart outlining referral to campus agencies in the campus binder Include the flowchart outlining referral to external agencies in the campus binder Include Decision Tree for minor versus major behaviors in the campus binder Include signed staff agreement/ ballot in the campus binder Include completed meeting agendas/minutes in the campus binder
Managing PBS
Collaborating for PBS
Impacting through PBS
Train a team member to conduct common area observations Train a team member to conduct student behavioral observations Keep a regularly updated copy of the PBS toolkit Keep a copy of the PBS toolkit at a designated advertised location Train staff in active supervision Encourage staff to use active supervision Share data regularly with the IMPACT Create procedures for making referrals to on campus services Create procedures for making referrals to PBS coaches (consultation request form) Align reinforcement systems to classroom settings Review data at campus team meetings Address issues that may have caused data trends Address what staff and team might do to change or maintain data trends
Refining PBS
Source: AISD Campus Assessment and Planning Tool (CAPT- Activities Status Section) (completed by campus with/out external coach). The table lists which activities campus teams have identified as priorities to improve their capacity across the five phases of PBS implementation
Things to Remember…
PBS is a strength-based model that emphasizes a proactive and positive approach to developing a safe, civil, and productive school.
.
Data Graphics taken from…
• Bernhardt, Victoria, PhD., Data Analysis for Continuous School Improvement
Also for your consideration…
• http://www.centerforcsri.org/pubs/pg/sbr.htm
• http://www.rand.org/pubs/occasional_papers/2006/RAND_OP170.pdf
Related Documents