Semiperipheral varieties of capitalism: state capacities and energy policies in BRIC Carlos Henrique Santana Assotiate Researcher at INCT and AvH/Capes Fellow at TU Darmstadt International Conference RETHINKING THE STATE IN GLOBALIZED CAPITALISM 21-24 March 2018

Welcome message from author
This document is posted to help you gain knowledge. Please leave a comment to let me know what you think about it! Share it to your friends and learn new things together.
Transcript

Semiperipheral varieties of capitalism:statecapacities and energy
policiesinBRIC
CarlosHenriqueSantanaAssotiate Researcher at INCTand
AvH/CapesFellow at TUDarmstadt
International ConferenceRETHINKINGTHESTATEINGLOBALIZEDCAPITALISM
21-24March2018

Why energy policiesamong BRICcountries?
• Between 2000and 2006,55percent of the globalgrowth of CO2emissions happened inChina.In2004,Chinabecame the world’s largest extractor of fossil fuels;two years later,iteclipsed the USasthe topemitter;
• Emissions Embodied inTrade(EET)and Fossil Capital:From 1990to 2009Foreign Direct Investimentsquintupled.Chinawas the main destination forFDInearly twice those of Russia and India combined.In2002,industry inChinaabsorved morethan 90percent of all coal consumed and 48percent of the country’stotalemissions between 2002and 2008were generated inthe export sphere (Malm 2016).
• Beside to be stillacountrywith the most renewable energy inthe world– 43,5percent of totaldomesticenergy supply is renewable – Brazil has discovered inpre-salt one of the world’s most important oil reservesinthe past decade.Thepre-salt province comprises large accumulations of excellent quality,highcommercial value lightoil;
• Due to be the largest naturalgas exporter and second biggest inoil,Russia has an economy and fiscalbudgetincreasingly dependent on energy commodities.
• Despite the percapitaelectricity consumption has been continuously increasing overthe years,India stillhasone of the lowest percapitaconsumption inthe world.India power generation mix is quitesimilarwithChinese – coal playing approximately 70percent.Thechallenge is how to rise the percapta eletricityconsumption inIndia without reproducing the same pattern from China

0
100
200
300
400
500
600
700
800
900
1971 1973 1975 1977 1979 1981 1983 1985 1987 1989 1991 1993 1995 1997 1999 2001 2003 2005 2007 2009 2011 2013
Mto
e
Coal** Oil Natural gas Nuclear Hydro Biofuels/waste Geothermal/solar/wind
Total primary energy supply*
IEA Energy Statistics
India
* Excluding electricity trade. ** In this graph, peat and oil shale are aggregated with coal, when relevant.
Statistics on the web: http://www.iea.org/statistics/
For more detailed data, please consult our on-line data service at http://data.iea.org.© OECD/IEA 2016
0
500
1 000
1 500
2 000
2 500
3 000
3 500
1971 1973 1975 1977 1979 1981 1983 1985 1987 1989 1991 1993 1995 1997 1999 2001 2003 2005 2007 2009 2011 2013
Mto
e
Coal** Oil Natural gas Nuclear Hydro Biofuels/waste Geothermal/solar/wind
Total primary energy supply*
IEA Energy Statistics
People's Republic of China
* Excluding electricity trade. ** In this graph, peat and oil shale are aggregated with coal, when relevant.
Statistics on the web: http://www.iea.org/statistics/
For more detailed data, please consult our on-line data service at http://data.iea.org.© OECD/IEA 2016

0
50
100
150
200
250
300
350
1971 1973 1975 1977 1979 1981 1983 1985 1987 1989 1991 1993 1995 1997 1999 2001 2003 2005 2007 2009 2011 2013
Mto
e
Coal** Oil Natural gas Nuclear Hydro Biofuels/waste Geothermal/solar/wind
Total primary energy supply*
IEA Energy Statistics
Brazil
* Excluding electricity trade. ** In this graph, peat and oil shale are aggregated with coal, when relevant.
Statistics on the web: http://www.iea.org/statistics/
For more detailed data, please consult our on-line data service at http://data.iea.org.© OECD/IEA 2016

0
100
200
300
400
500
600
700
800
900
1990 1991 1992 1993 1994 1995 1996 1997 1998 1999 2000 2001 2002 2003 2004 2005 2006 2007 2008 2009 2010 2011 2012 2013 2014
Mto
e
Coal** Oil Natural gas Nuclear Hydro Biofuels/waste Geothermal/solar/wind
Total primary energy supply*
IEA Energy Statistics
Russian Federation
* Excluding electricity trade. ** In this graph, peat and oil shale are aggregated with coal, when relevant.
Statistics on the web: http://www.iea.org/statistics/
For more detailed data, please consult our on-line data service at http://data.iea.org.© OECD/IEA 2016

0100020003000400050006000700080009000
10000
1994 1995 1996 1997 1998 1999 2000 2001 2002 2003 2004 2005 2006 2007 2008 2009 2010 2011 2012 2013 2014
TotalCarbon Dioxide Emissions from the Consumption of Energy(Million Metric Tons)
Brazil China India Russia
Source:InternationalEnergyAgency

Source:WorldBank,WorldDevelopment Indicators
0
1000
2000
3000
4000
5000
6000
7000
8000
ElectricPowerConsumption(KWhpercapta)
Brazil China India Russia

Classical State Capacities
• State capacities ascoertion:“Theonly human Gemeinschaft which lays claim tothe monopoly on the legitimated useof physical forceoveracertain geographicalarea”(Weber)
• State capacities asInfrastructural power:“institutional capacities of acentralstate,despotic or not,to penetrate itsterritories and loggistically implementdecisions.This is collective power,“power through”society,coordinating sociallife through state infrastrutures.Itdefinestate asasetof centraland radialinstitutions penetrating itsterritories”(Mann)
• State capacities asbureaucratic performance:“meritocratic recruitment,whichideally is based on somecombination of education and examination;andpredictable career ladder,which provides long-term tangible and intangiblerewards forthose recruited into the bureaucracy”(Rauch and Evans)

What’s missing on state capacities approachto analyse BRICcountries?
• Most of state capacities accounts fail to attend to infranationalvariation instate effects or to analyze coordination (or conflict)between regionaland national ruler;
• Inmultilevel systems,regionalinstitutions impact investments flowsand investitors’decisions inthree distinct ways:
• 1)ensuring complementarity between contradictory organizational(horizontalor vertical)or ownership (public or privat)forms;
• 2)providing (un)reliable information;and• 3)enhancing (or reducing)the uncertainty and credibility of higher-level decisions and policies(Sinha 2005)
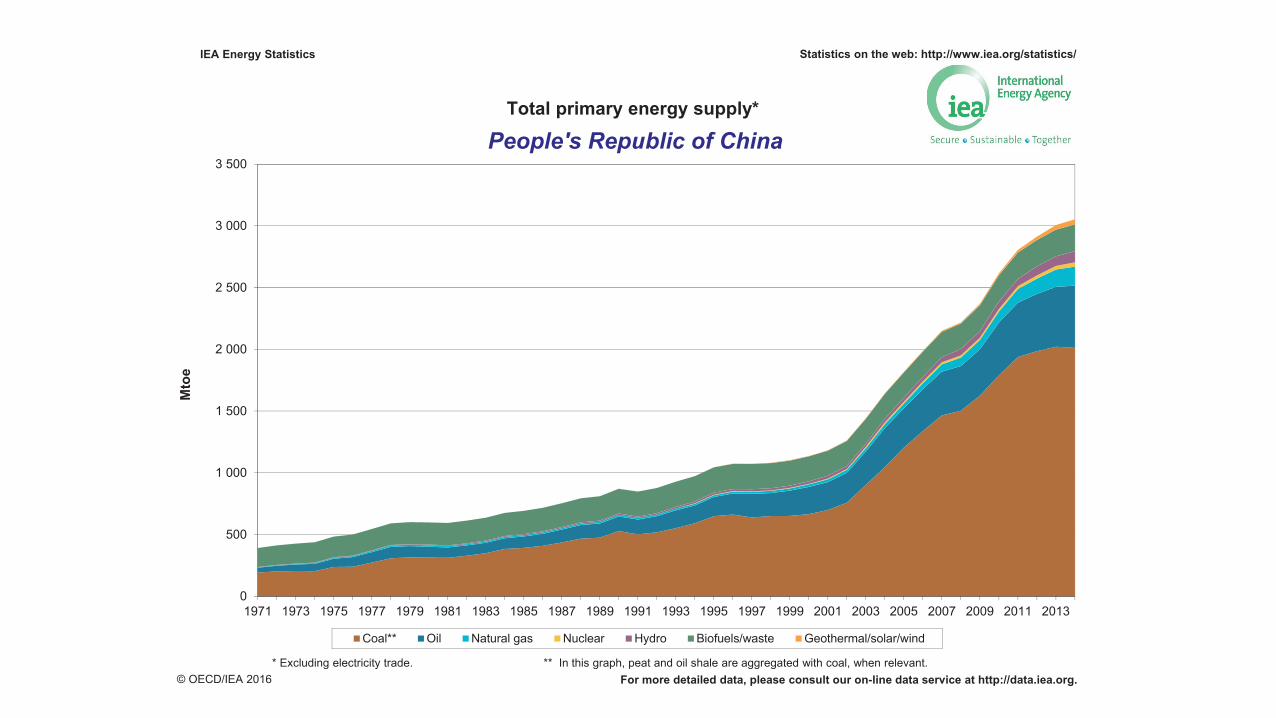
Howexploreenergypolicyasaninstrumentthroughwhichstatecapacitiesorganizeandfeedthemselvesasanaxisofinstitutional
complementaritiesonBRICcountries?• 1- recognitionofvariousdomesticinstitutionsasthemostrelevantfactorforunderstandingthemaintrendsinenergypolicy;
• 2- panoramaoffederalismdilemmasthataffectedenergypoliciesinthe1990sthatareimportantforthecomprehensionofmarketreformsaswellfortheevaluationofthecentralizationmovementwhichoccurredinthefollowingdecade;
• 3- roleofadministrativereforms,ortheabsencethereof,inordertounderstandthebureaucraticcapacitiesasacoordinatingelementofenergypolicies;
• 4- theroleofpublicbanksandstate-ownedenergycompaniesasaninstrumentofpolicysupportaswellascircumventingthecentrifugalmechanismsofstatecapacities

Whydomesticinstitutionsasthemostrelevantfactorforunderstandingthemaintrendsinenergypolicy?
• 1)provideenergyatpricesthatpermitthesupplychainofotherindustriestoexportgoodsatacompetitiveprice;
• 2)instrumentoffiscal,monetaryanddistributiveaccommodation,asitservesasanimportantsourceofrevenuecollectionforthegovernmentandmoderatesinflationarypressures,whichpreventsthelossofwages’purchasingpower;
• 3)instrumentforpoliticalbargainingandaccommodatedomesticpoliticalstrugglesamonginterestgroupsandinstitutionaldecision-makerslayers.Energybillsareacentralinstrumentforguaranteeingmacroeconomicmaneuveringspacefornationalgovernment,aswellaslong-termgrowth.

Developmental Triad
CentralState
BusinessActorsSubnational StateActors

Multi-level Model
CentralPolicyElites
Institutions at FederalLevel:State-Owned Enterprises(Banksand EnergyCompanies)Regulatory agencies
RegionalPolicyElites
Institutions at RegionalLevels
PrivateBusinessGroups
InvestmentLevels
Source:Sinha (2003)

Thefederalism dilemmas
• Though trends,rhythms and pressures between strategic actors mayhave gone indiverging directions,the necessity to stabilizeendogenous pressures inthe political systemand incorporatestrategic domestic powers innational policy solutions have beeninescapable themes forenergy policy guidelines.
• Inorderforthistobedone,itisnecessarytoemphasizethesizeandshapeofthestate,observingtheimplementationofeconomicpoliciesastheproductofanintergovernmentalinteraction.Inotherwords:atypeof“theoryofpolycentrichierarchy.”(Sinha2005)

China• ThemainpolicystrategyoftheChineseCommunistParty’sleadersforimplementingtheeconomicreformwasfinancialdecentralization,orasitwaspopularlyknown:“eatinginseparatekitchens”(fenzao chifou).Basedonfinancialautonomyforprovincialgovernments,thisstrategyguaranteedtangibleinstrumentsoffinancialincentivestosub-nationalbureaucraticleadershiptosupportthereform’sagenda.(Oi1992).
• EventhoughtheChinesestateisunitary,differentfromRussia,BrazilandIndia(thatarefederal),thereformsthattookplaceunderDengXiaopingincorporatedtheprovincesatthecenterofthedecision-makingprocess,significantlyexpandingtheirbargainingpower;
• Fiscaldecentralizationwasnotonlytheresultofthebeliefthatthemarketwasthebestinstrumentforstimulatinginvestmentandproductivitybutalsothemainpoliticalmechanismforguaranteeinginstrumentsforthemobilizationofstrategicactorsinfavorofreforms(vestedinterests);
• Fromthatpointon,theevolutionoffiscalschemeshaverevealedthecapacitiesofprovincialpubliccadrestoobtainconcessionsfromcentralleaders,necessaryforguaranteeingsupportforreformsaswellastheirownpoliticalcareers.Aconstellationofregionalandlocalgovernmentalactorsthatresultedfromthereformshavethoroughlyconsolidatedthemselvesintheenergysector,includingprovincialgovernments(investmentfunds),state-ownedenterprisesandsubsidiarytransmissiongroups(Cunningham2015).

India
• thecentralgovernment,seekingtoguaranteethefinancialsustainabilityofenergyenterprisesasameansofprotectingitsownfinances,andontheother,stategovernmentsseekingtoguaranteethemeansofsustainingitsconstituencies;
• thecentralgovernmentneedstobargainwithsub-nationalleadershiptoguaranteepoliticalsupportandsub-nationalleadersneedpublicstatebanks,controlledbythecentralgovernment,asameansofrefinancingDiscoms’debts;
• GuaranteeingabalancethatdoesnotharmpowerfulgroupsofinterestinaneconomicallyrelevantwayhasbeenamainchallengeinthearrangementofIndia’spolycentrichierarchy
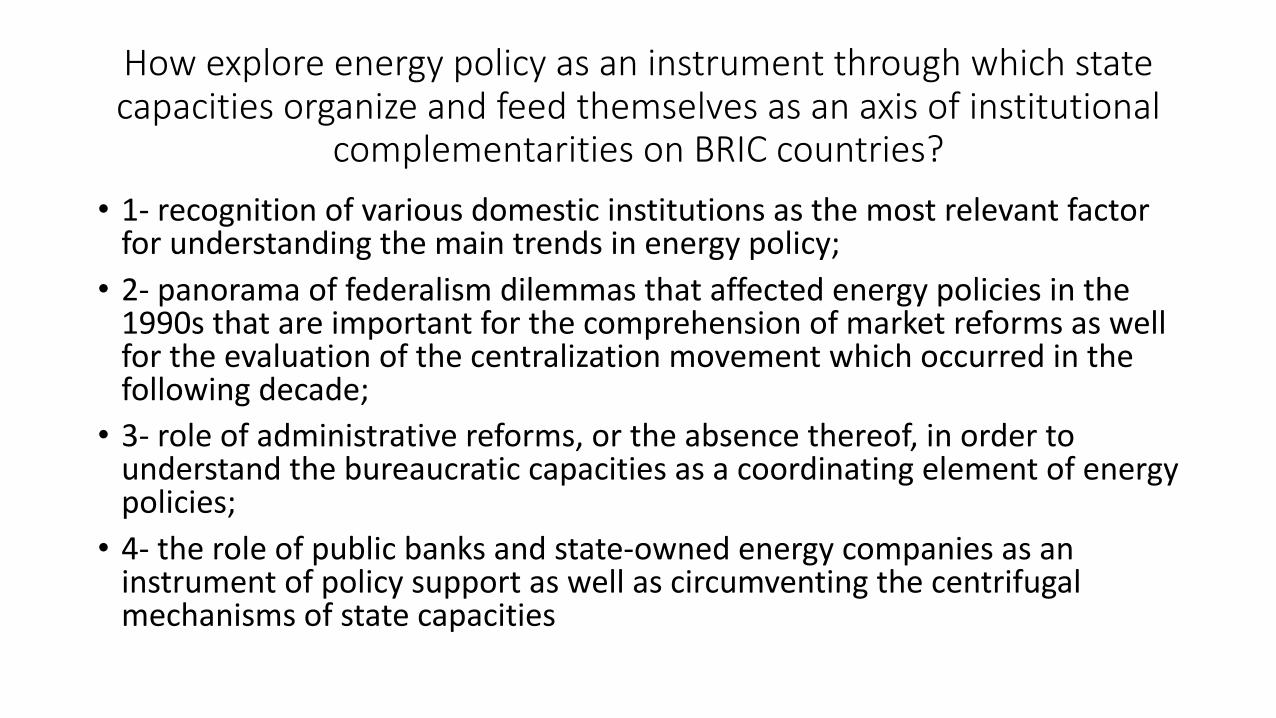
Russia• Shocktherapyadoptedin1990’smeantanextensiveprivatizationprogramwhichputtogetherdifferentinterestgroupsagainstthecentralizedbureaucracywhohadnaturalresistancetomarket-orientedreforms.“Every enterpriserippedoutofthestateandtransferredtothehandsofaprivateownerwasawayofdestroyingcommunisminRussia”(AnatolyChubais – architectofRussia’sprivatizationprogram).
• Thebackbonefordismantlingofcentralstatesovereigntywasenergysector.Notonlytheprivatizationofstate-ownedenterprisesbutalsobroadadministrativeconcessionsforstategovernors;
• Theunbundling,restructuring,andsaleofelectricityassetsorchestratedbyliberalreformersundercutregionalutilities.Theregionalmonopolies– Energos – weredissolvedandthemostvaluablepowerplantswerebundledinto“de-territorialized”holdingcompanies,theso-calledOGKs.(Wengle 2015)
• Incentivesforacquiringpropertywentbeyondthepursuitofprofit: theassetswerekeytoestablishing,defending,orexpandingone’spositioninthenewsystem.Asasourceofpoliticalpower,ownershipcouldmeansignificantinfluenceoverpoliticians(Barnes)
• Thefinancialcrisesofthe1990scausedtheRussiangovernmenttoalienatevaluablepetroleumandminingassets,usingcontractualmechanisms(loansforshares)wheretheKremlinofferedthecontrolofstate-ownedenterprisesasawayofguaranteeingtheriskofnonpaymentofloanstakenfromprivateagents,popularlyknownasoligarchs(Hoffman2002).

Brazil
• centrifugalpatternofBrazilianfederalism:between1982and1994,abroadprocessofdecentralizationinbothfinancialandpoliticalterms,andapredatoryandnon-cooperativemodelofintergovernmentalrelations;
• Asfarascentralgovernmentlostitsfiscalcapacitiestomakedirectinvestment,thenewConstitutionfrom1988transferredaseriesofrevenueinstrumentstosubnationalspheres.Withthisinmind,theabilitytoimplementinfrastructurepolicies,suchasenergy,hasbeenchallengedwithlackofcoordinationandbureaucraticspecializationwhichthesubnationalgovernmentsdon'thaveinisolation(Afonso;Araújo;andBiasoto 2005).
• between1995-2010,centraladministrationrecoveredfiscalcapacitiesandestablishedcapstofiscalexpendituresofsubnationalspheres- nottoimprovedirectinvestmentcapacitiesofcentralstatebuttofeedapredatorymonetarypolicybasedonhighbenchmarkinterestrates onwhichthestabilizationplanwasbased.
• Thecentralgovernment’surgentnecessitytoregainsovereigntyovermonetaryemissioninmiddleof1990scoincidedwiththecollapseofstategovernments’publicfinancesthatbecamedeprivedofthefinancingmechanisms.Regionalstate-ownedbanksandenterprises(electricityretailers)wereprivatizedinexchangeofnationalizationofregionaldebts;

Tax revenue (centralgovernment)aspercentage of GDP
0
2
4
6
8
10
12
14
16
18
India RussianFederation Brazil
%
Source:WorldDevelopment Indicators (WorldBank)

Bureaucratic cohesion asacoordinating element ofenergy policies
China
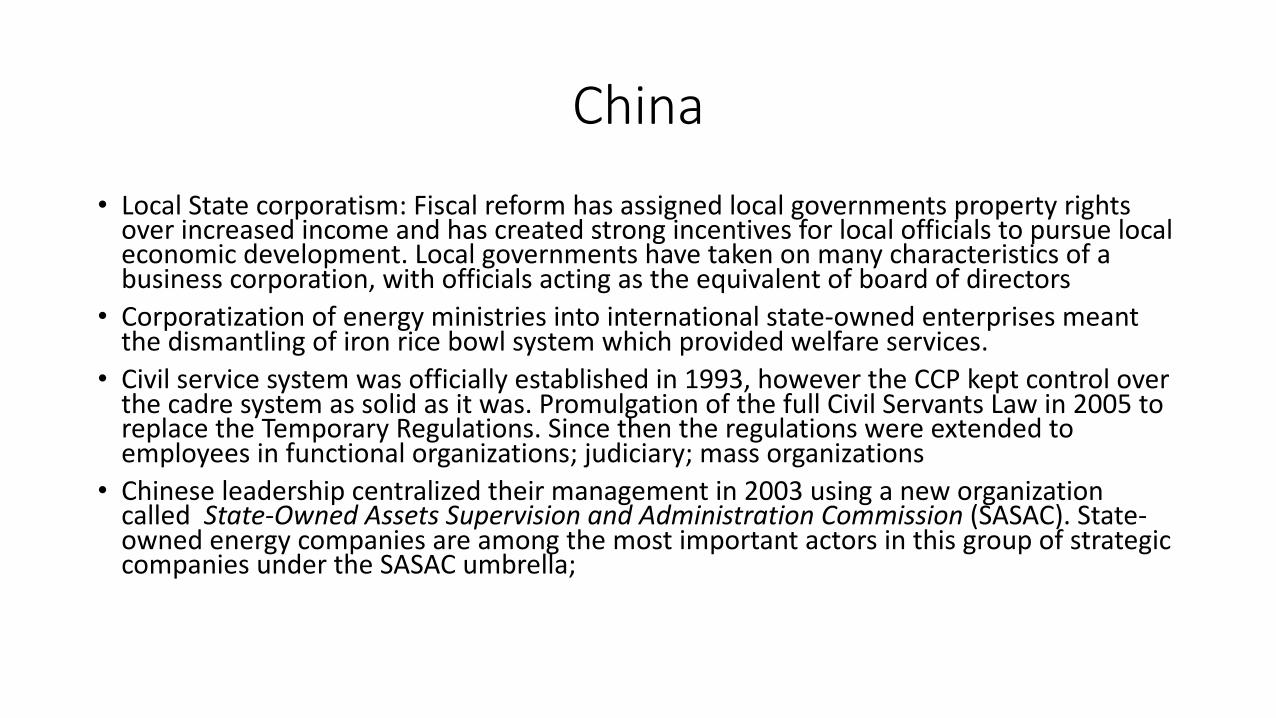
• LocalStatecorporatism:Fiscalreformhasassignedlocalgovernmentspropertyrightsoverincreasedincomeandhascreatedstrongincentivesforlocalofficialstopursuelocaleconomicdevelopment.Localgovernmentshavetakenonmanycharacteristicsofabusinesscorporation,withofficialsactingastheequivalentofboardofdirectors
• Corporatizationofenergyministriesintointernationalstate-ownedenterprisesmeantthedismantlingofironricebowlsystemwhichprovidedwelfareservices.
• Civilservice systemwas officially established in1993,however the CCPkept control overthe cadre systemassolid asitwas.Promulgation of the full CivilServants Lawin2005toreplace the Temporary Regulations.Since then the regulations were extended toemployees infunctional organizations;judiciary;mass organizations
• Chineseleadershipcentralizedtheirmanagementin2003usinganeworganizationcalledState-OwnedAssetsSupervisionandAdministrationCommission (SASAC).State-ownedenergycompaniesareamongthemostimportantactorsinthisgroupofstrategiccompaniesundertheSASACumbrella;

India• Market-orientedreformsinIndiahadapragmaticscope,avoidinglargeprivatizationsprocedures:between1991and2008privatizationsraised$12.9billionat2011exchangerates,comparedwithacumulativeinvestmentinthe242survivingCPSEsof$91billionoverthesameperiod(Pratap,2011)Thereare849operatingstatelevelpublicenterprises(SLPEs)inIndiawithabout18.0lakhemployees(GoI,2012).MajorsectorsofoperationofSLPEsaremanufacturing,finance,power,infrastructure,agricultureandalliedservices.
• InthepowersectorinIndia,therehavebeenimpressivedevelopmentsincapacitygeneration,privatesectorparticipation,expansionofelectricitymarketsandrestructuringofstateelectricityboards(SEBs).Distributionandretailsupply,however,remaintheweakestlinkintheentirevaluechain.Theenactment of the Electricity Act,2003mandated unbundling of the SEBs into separateand independent generation,transmission and distribution companies (Discoms).Reforminitiatives were extended through the Accelerated PowerDevelopment and Reforms Programme(APDRP)in2002-03and Restructured-APDRPin2008
• ShortaveragedurationsofemploymentofIndiaAdministrativeService (IAS)workersandagrowingnumberofpositionswithvaryingsalaries,levelsofimportanceandrequirementsallowpoliticalleadershiptopromotelateraltransferstopunishbureaucratics thatgoagainsttheirinterests(Iyer andMani2012);
Russia
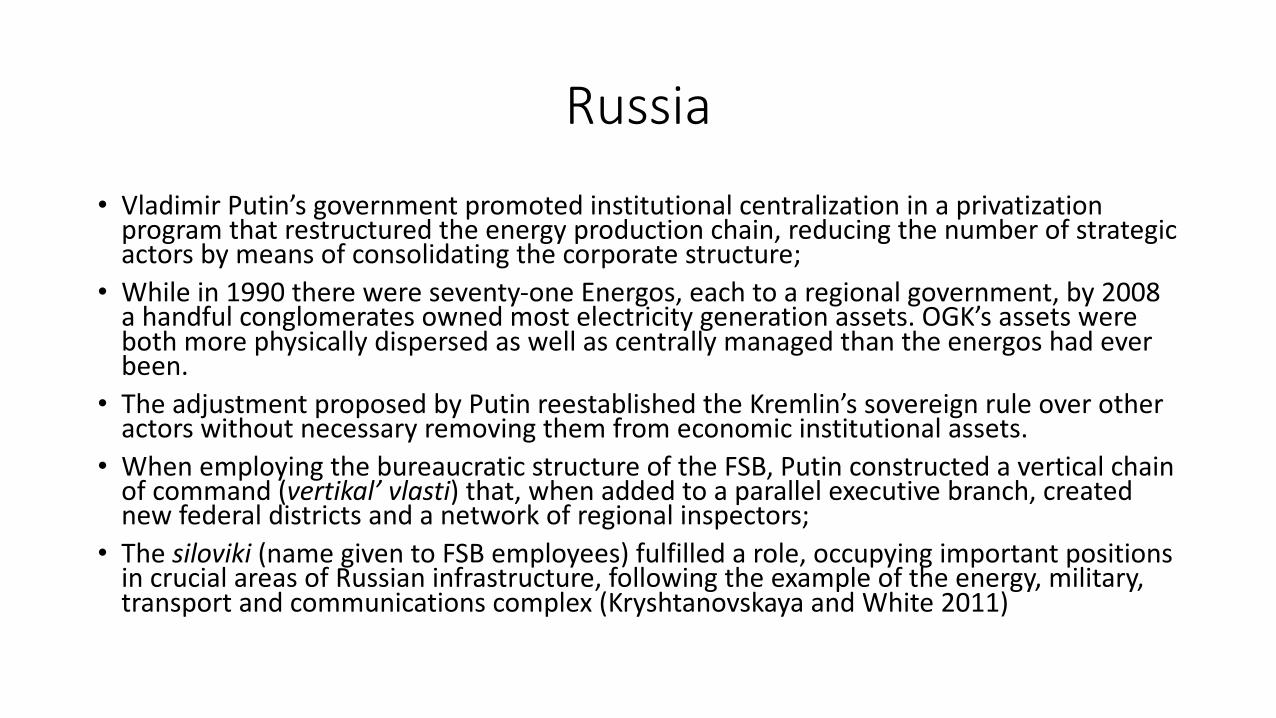
• VladimirPutin’sgovernmentpromotedinstitutionalcentralizationinaprivatizationprogramthatrestructuredtheenergyproductionchain,reducingthenumberofstrategicactorsbymeansofconsolidatingthecorporatestructure;
• Whilein1990therewereseventy-oneEnergos,eachtoaregionalgovernment,by2008ahandfulconglomeratesownedmostelectricitygenerationassets.OGK’sassetswerebothmorephysicallydispersedaswellascentrallymanagedthantheenergos hadeverbeen.
• TheadjustmentproposedbyPutinreestablishedtheKremlin’ssovereignruleoverotheractorswithoutnecessaryremovingthemfromeconomicinstitutionalassets.
• WhenemployingthebureaucraticstructureoftheFSB,Putinconstructedaverticalchainofcommand(vertikal’vlasti)that,whenaddedtoaparallelexecutivebranch,creatednewfederaldistrictsandanetworkofregionalinspectors;
• Thesiloviki (namegiventoFSBemployees)fulfilledarole,occupyingimportantpositionsincrucialareasofRussianinfrastructure,followingtheexampleoftheenergy,military,transportandcommunicationscomplex(Kryshtanovskaya andWhite2011)

Brazil
• Deverticalization oftheenergychaininthe1990scausedthecentralgovernmenttolosepartofitsinstrumentsofpolicycoordination.CentralStatebureaucraticmachinewasalsosignificantlydilapidatedwithmassretirementinpublicserviceandsuspensionofhirings foralmostonedecade.State-ownedenterprisesinenergysector,suchasEletrobras andPetrobras,wereforcedtocollaboratewithfiscalsurplustofeedpredatorymonetarypolicy;
• Withthisbackdrop,anoutsourcingfeverbeganinthegreaterpartofpublicservices,reducingthequality,raisingcostsandmultiplyingthenumberofaccidents,suchasblackoutsoroilspillsnearoffshoreplatforms.Investmentsduringtheperiodwereinsufficienttoaccompanytherateofgrowthandtoalsoguaranteethemaintenanceofinstallations.
• Accordingtodataconcerningprofissionalization thereisahighlevelofqualificationintheenergysector’sbureaucracy,71%withspecializedtraining.Butinrelationtoautonomy52%ofemployeesinenergysectorhavestablejobsand49%mentionnedpoliticalinterferenceasaprimaryproblemaffectingworkroutines(Gomide andPereira2016)

State-ownedbanksandenergyenterprisesreinforcingstatecapacitiesandcircumventingthe
centrifugalmechanisms

-8672-13830 -15389
-37986-44469
-71621-67336
-58275
-80000
-70000
-60000
-50000
-40000
-30000
-20000
-10000
02005-06 2006-07 2007-08 2008-09 2009-10 2012-13 2013-14 2014-15
AggregateLosses- IndiaUtitlitiessellingdirectlytoconsummers(SubsidyReceivedBasis)
RsCrores
Source:PowerFinance CorporationLtd.
0
2000
4000
6000
8000
10000
12000
14000
16000
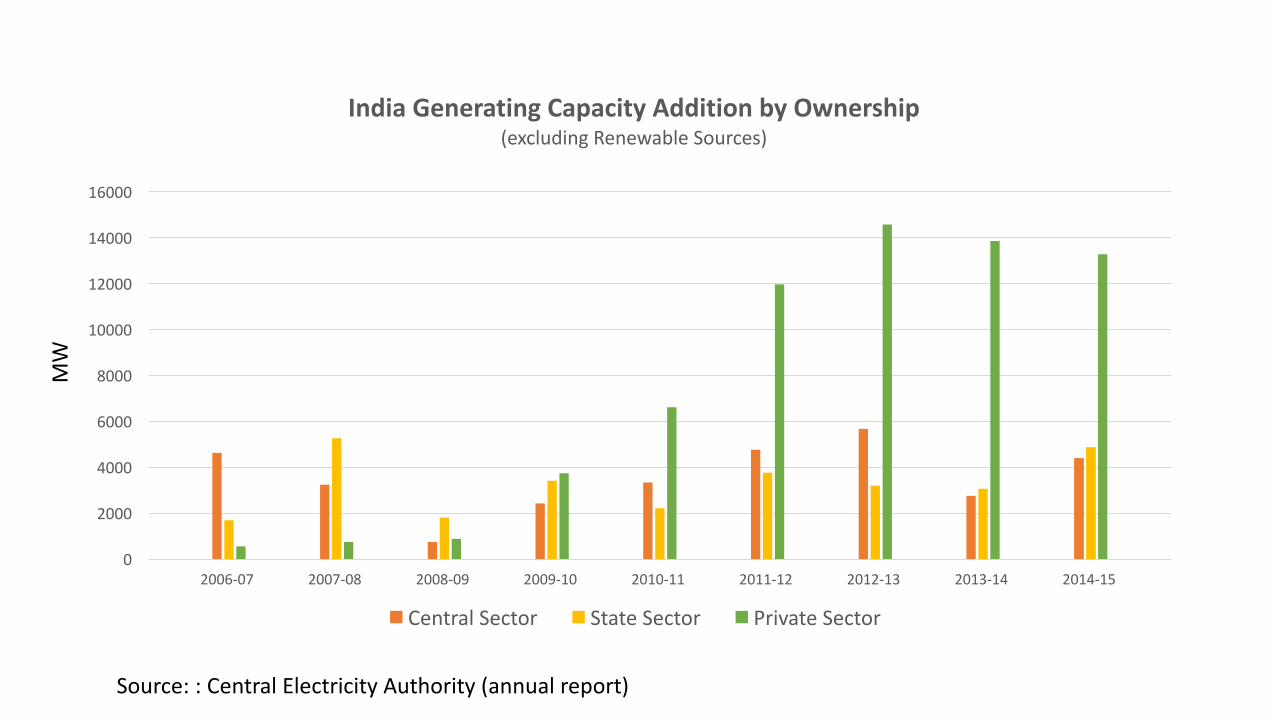
2006-07 2007-08 2008-09 2009-10 2010-11 2011-12 2012-13 2013-14 2014-15
India Generating Capacity Addition by Ownership(excluding Renewable Sources)
CentralSector StateSector PrivateSector
Source::CentralElectricity Authority (annual report)
MW

India Installed Electricity Generation Capacity
27%
38%
35%
By Ownership(2015)
CentralSector PrivateSector StateSector
15%
70%
2%
13%
By Source(2015)
Hydro Thermal Nuclear RenewableEnergySources

India
• One of the key reasons forthe deteriorating finances of distribution entities is delay and non-payment of subsidiesby state governments.These subsidiesaremeant to be paid to theDiscoms to compensate forcheaper power supplies to certain segments promised by thestate governments,specially the farm sector.
• Electricity is aconcurrent subject under the purview of states;asaresult,oversight ofDiscoms is the domain of state governments.Nevertheless,key reforms undertaken overtheyears have largely been at the initiative of the CentralGovernment through policy guidanceaswell asproviding suitable environment forenabling regulations inconsultations with stategovernments.
• Avaiable datareport the existence of 853State Level Public Enterprises that accounted for7,1%of the GDPem2008.60%of the investments of these enterprises arefinanced by long-term loans,oririgating from public state-owned banks (Mishra;Kumari and Srinivas 2004)
• Thetotalcapitalemployed by commercial banks inthe power sectorhas progressivelyincreased overthe years despite the weak financialpositionof Discoms.Outstanding debt ofDiscoms has increased from about Rs.2.4lakh crore in2011-12to about `4.3lakh crore in2014-15,with interest ratesinthe rangeof 14-15percent.Asof September 2015,banks’exposure to Discoms was inthe rangeRs 1.6-1.8trillion,which comprise about 30percent ofbanks’exposure to the power sector(ICRA,2015).
0
50
100
150
200
250
300
350
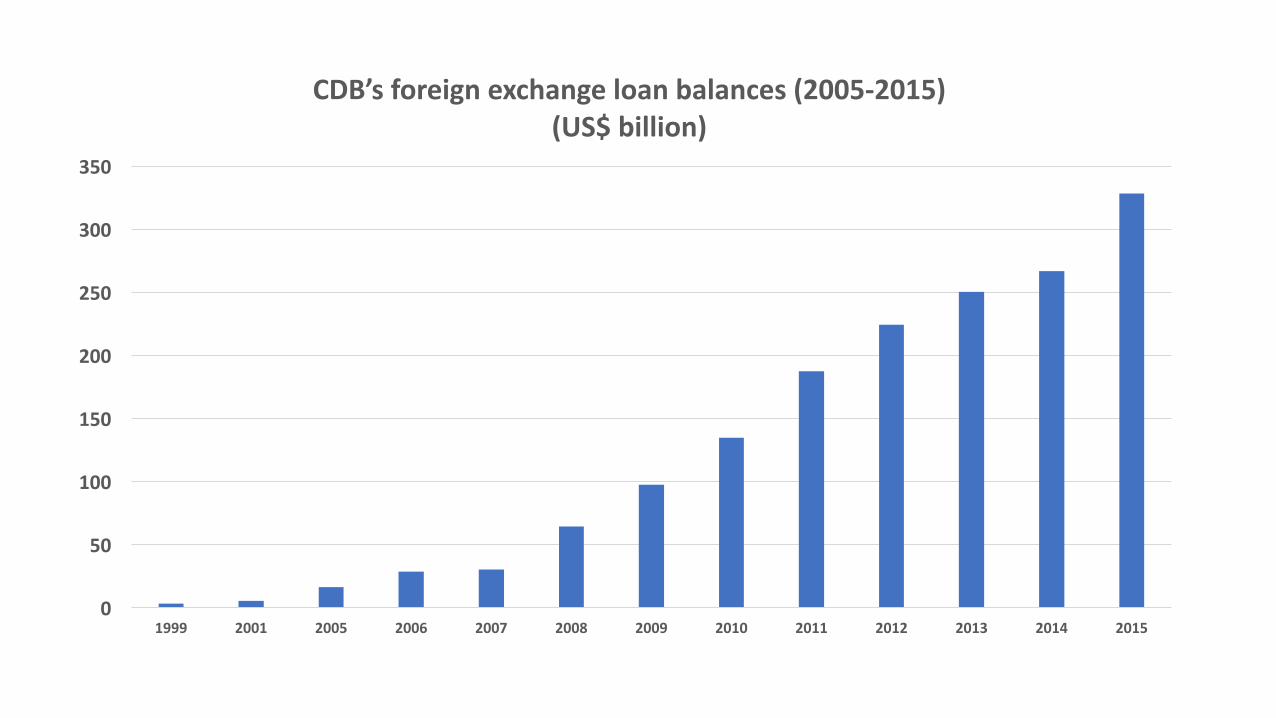
1999 2001 2005 2006 2007 2008 2009 2010 2011 2012 2013 2014 2015
CDB’s foreign exchange loan balances(2005-2015)(US$billion)

Chinese Enterprises among the 100largest globalCompaniesRANK COMPANY Ownership REVENUES($M)2 State Grid EnergySOE $315,1993 SinopecGroup EnergySOE $267,5184 ChinaNational Petroleum EnergySOE $262,57322 Industrial&Commercial Bankof China State Owned Bank $147,67524 ChinaState Construction Engineering StateOwnedBank $144,50528 ChinaConstructionBank State Owned Bank $135,09338 AgriculturalBankofChina State Owned Bank $117,27541 SAICMotor SOE $113,86142 BankofChina State Owned Bank $113,70847 ChinaMobileCommunications SOE $107,11751 ChinaLifeInsurance SOE $104,81855 ChinaRailwayEngineering SOE $96,97958 ChinaRailwayConstruction SOE $94,87783 HuaweiInvestment&Holding Employee-owned company $78,51186 ChinaResourcesNational SOE $75,77689 PacificConstructionGroup Private $74,629100 ChinaSouthernPowerGrid EnergySOE $71,242
Source:Fortune
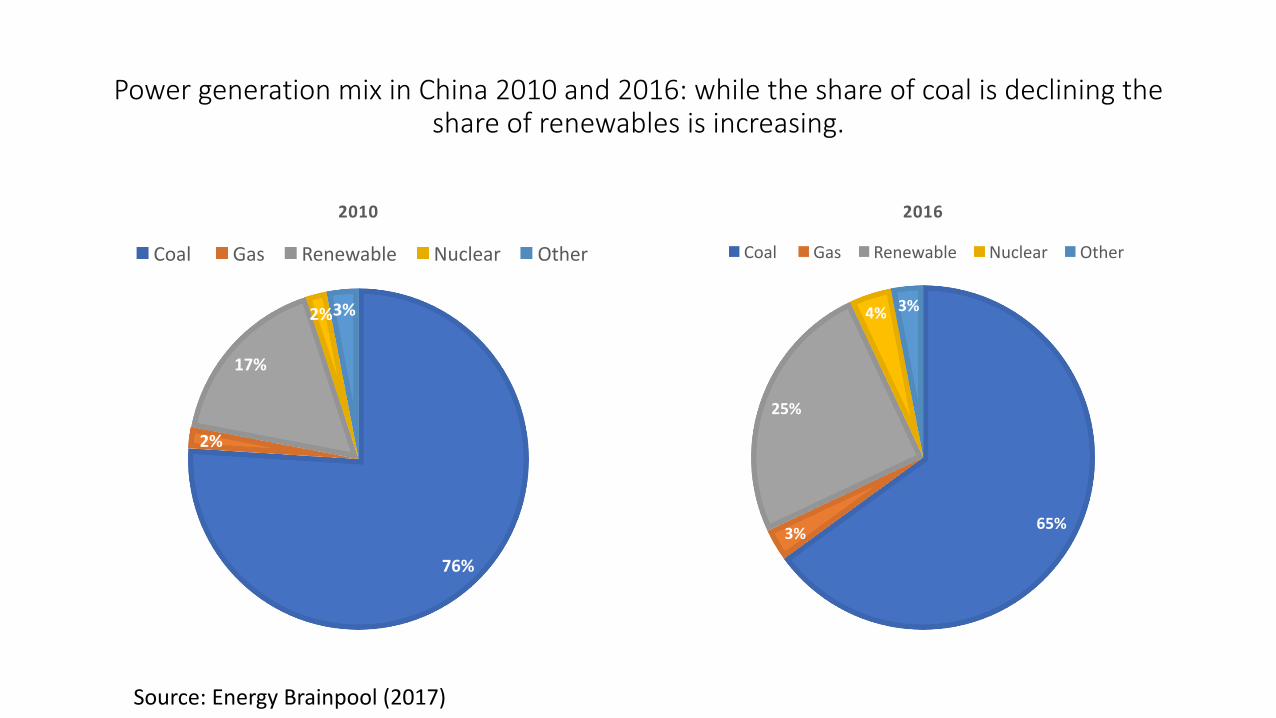
Powergeneration mix inChina2010and 2016:while the share of coal is declining theshare of renewables is increasing.
65%3%
25%
4% 3%
2016
Coal Gas Renewable Nuclear Other
76%
2%
17%
2%3%
2010
Coal Gas Renewable Nuclear Other
Source:EnergyBrainpool (2017)

China
• Between 1978and 2008,the number of SOEs fell by 33%and employees declined by 23,8%while totalassets grew by 59%;revenue and profit increased 35and 40fold,respectively during the same period.Chinese investments inenergy exceeded US$211billion between 2008and 2015,or 4.5timeswhatwas invested between 2000-07;
• Chinadismantled the State PowerCorporationon December 29,2002and setup 11newcompanies inamoveto end the corporation’s monopoly of the power industry.Theformer State PowerCorporationowned 46%of the country’s electricity generation assets and 90%of the electricity supply assets.
• Em2008,Chinaannounced astimulus package equivalent to 12.5%of that year’s GDPdue to financialcrisis.ChinesegovernmentdecidedthatitwouldbecoordinatedbythestatebankingsystembymeansofLocalGovernmentFinancingVehicles(LGFVs)Using funds obtained by the issuance of ling-termliabilities,the ChinaDevelopment bank (CDB)became the centraloperator of this financing.
• Thefinancialcenterof Chinese energy enterprises is policy banks,among which the CDBand Exportand Import Bankof China(Chexim)arethe most relevant.Chinese banks loans to energy companies forexternal investment (OFDI)totalled US$144billion between 2002and 2012,of which 88%camefromCDBand Chexim and the rest from commercial banks;
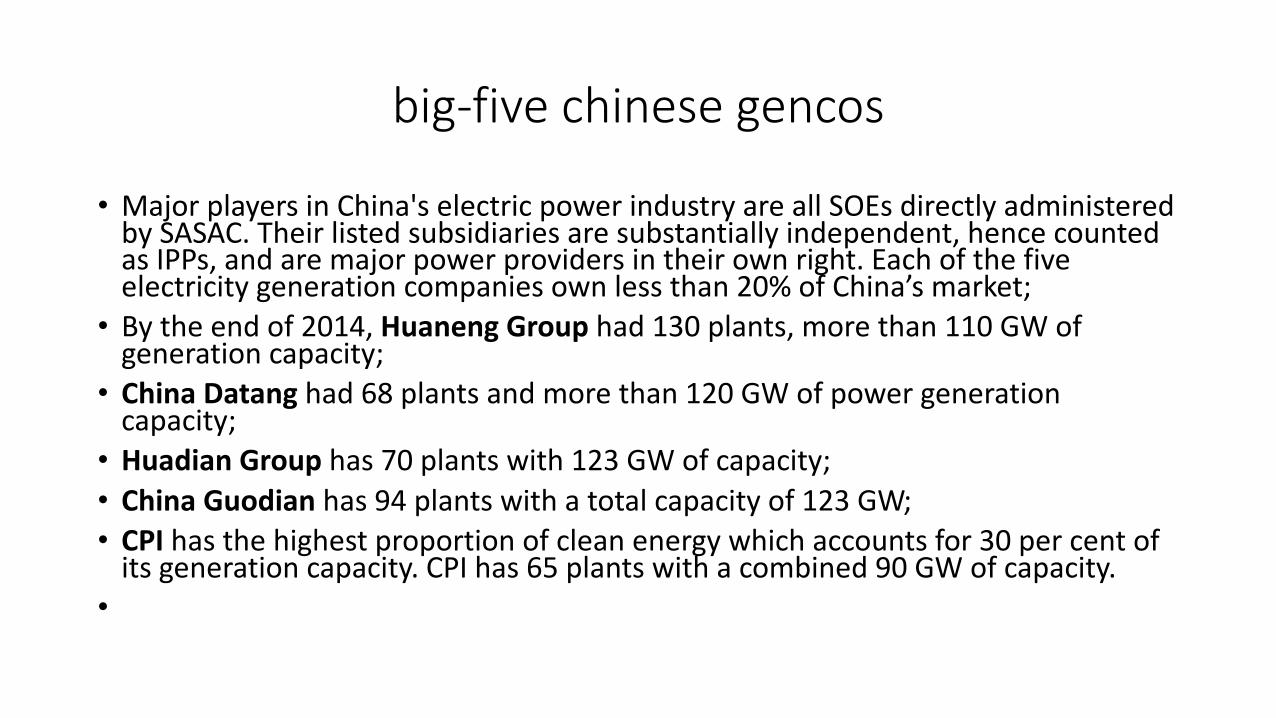
big-five chinese gencos
• MajorplayersinChina's electric power industry areall SOEs directly administeredby SASAC. Their listed subsidiaries aresubstantially independent,hence countedas IPPs,and aremajorpower providers intheir own right.Each of the fiveelectricity generation companies own less than 20%of China’s market;
• By the end of 2014,Huaneng Group had 130plants,morethan 110GWofgeneration capacity;
• ChinaDatang had 68plants and morethan 120GWof power generationcapacity;
• Huadian Group has 70plants with 123GWof capacity;• ChinaGuodian has 94plants with atotalcapacity of 123GW;• CPI has the highest proportion of cleanenergy which accounts for30percent ofitsgeneration capacity.CPIhas 65plants with acombined 90GWof capacity.
•
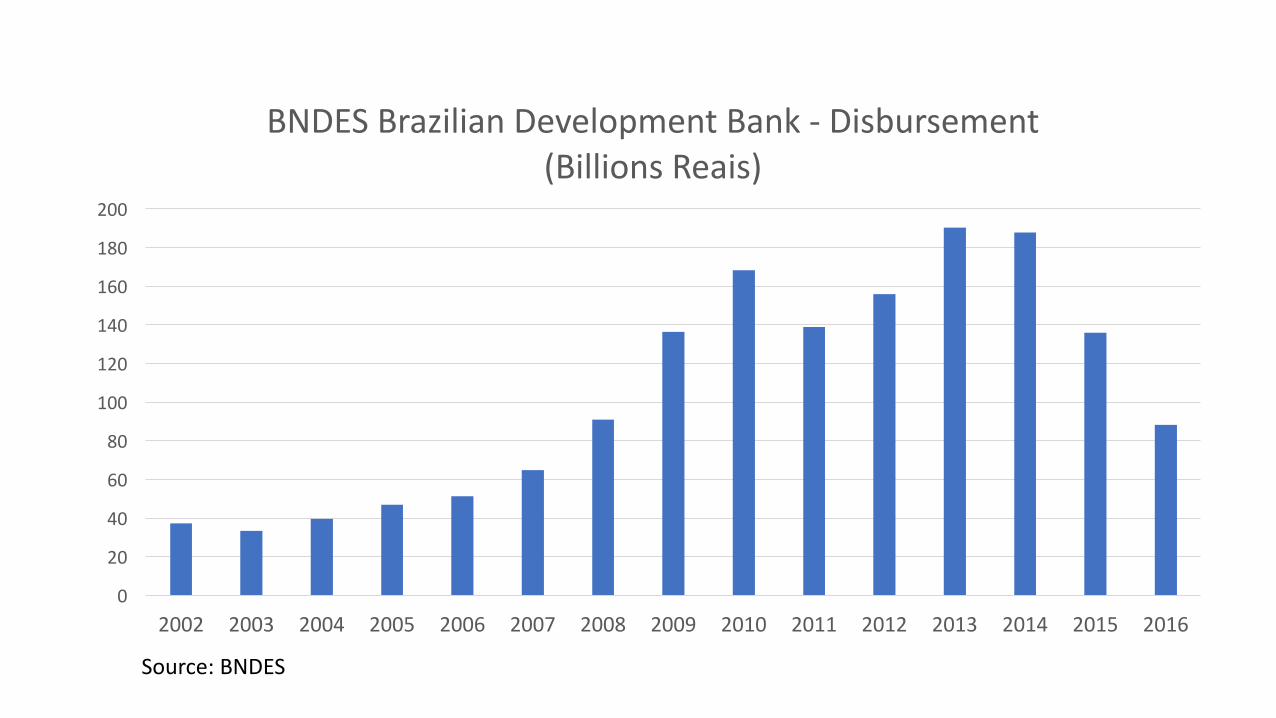
0
20
40
60
80
100
120
140
160
180
200
2002 2003 2004 2005 2006 2007 2008 2009 2010 2011 2012 2013 2014 2015 2016
BNDESBrazilian Development Bank- Disbursement(Billions Reais)
Source:BNDES

Brazilian domestic supply of energy in2016
Oilandderivatives
65%
NaturalGas22%
MineralCoal10%
Nuclear2%
Othernon-renewable
1%
NON-RENEWABLE ENERGY(56,5PERCENT)
Sugarcanebiomass40%
Hydraulic29%
Firewoodandcharcoal18%
Otherrenewables
13%
RENEWABLE ENERGY(43,5PERCENT)

BNDESinvestment inelectricity generation(2007-2014)
Installedcapacity2007*(A)
Increaseininstalledcapacity2007e2014(B)
Variationininstalledcapacity(B/A)
CapacityaddedbyprojectssupportedbytheBNDES(C)
BNDESparticipation(C/B)
Hydroelectric 71.747 12.348 17% 12.348 100%
Thermoelectric 22.487 17.330 77% 6.811 39%
Wind 142 4.746 3339% 3.011 63%
Smallhydro 2.041 3.058 150% 1.892 62%
Totalgeneration 96.417 37.480 39% 24.061 64%

Ownership Structure inBrazilian electricity matrix - 2015
GenerationTransmission Lines
Distribution
Enterprise GW Percentage Enterprise KM(thousands) Percentage Enterprise Consumers
(millions) Percentage
Eletrobras 45,39 32,22 Eletrobras 68,09 52,66 Neoenergia 10,6 13,41Tractebel 7,3 5,18 CTEEP 18,47 14,28 Cemig 8,1 10,26Cemig 7,13 5,06 TAESA 7,5 5,8 AES 8,1 10,23CTG 6 4,26 CEMIG 7,5 5,8 CPFL 7,7 9,69Copel 5,6 3,98 CEEE 6,6 5,1 Energisa 6,4 8,11AES 3,3 2,34 StateGrid 5,7 4,41 ENELBrasil 6 7,58
CPFL(State Grid) 3,1 2,2 Energisa 4 3,09 Equatorial 4,6 5,79EDP 2,7 1,92 Copel 3,7 2,86 Copel 4,4 5,59DUKE 2,3 1,63 Neoenergia 0,6 0,46 Light 4,3 5,45
Neoenergia 1,61 1,14 - - - Eletrobras 4,1 5,13Subtotal 84,43 59,94 Subtotal 122,15 94,47 Subtotal 64,2 81,25Total 140,87 100 Total 129,3 100 Total 78,9 100
Source:MinistériodeMinaseEnergia,AbradeeeDemonstraçõesFinanceirasdasEmpresas
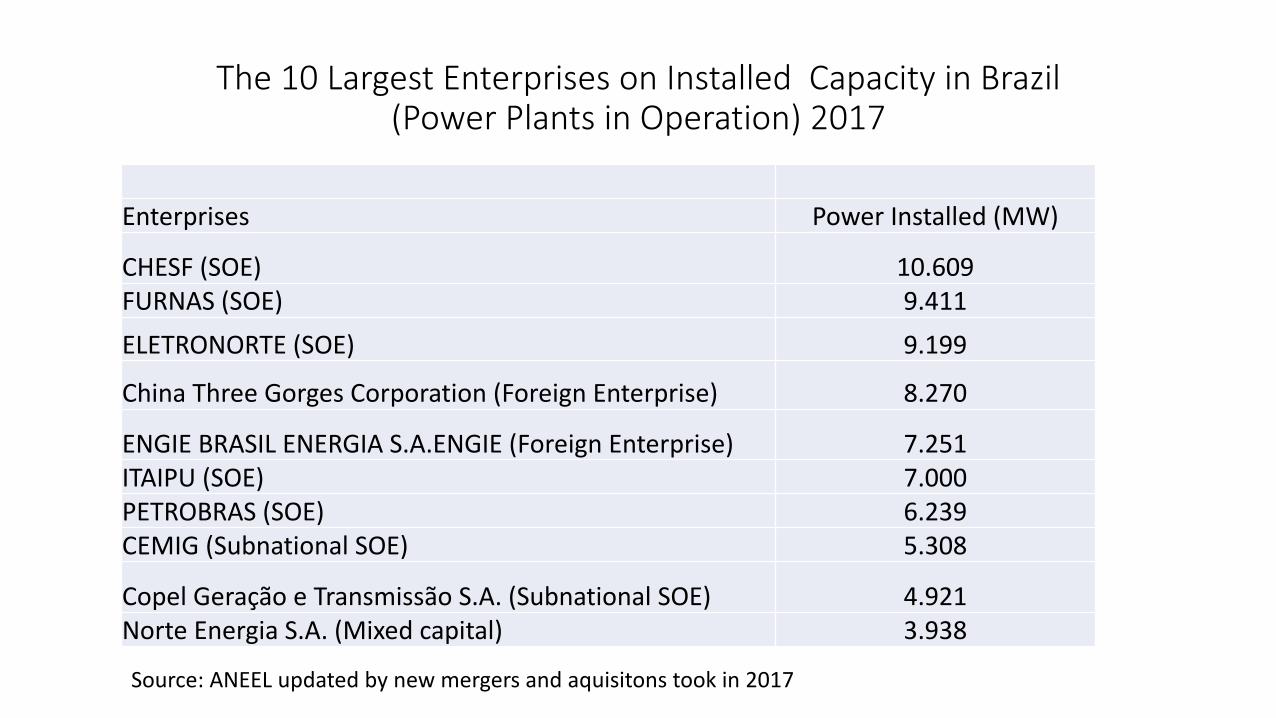
The10Largest Enterprises on Installed Capacity inBrazil(PowerPlants inOperation)2017
Enterprises PowerInstalled (MW)
CHESF(SOE) 10.609FURNAS(SOE) 9.411ELETRONORTE(SOE) 9.199
ChinaThree Gorges Corporation (Foreign Enterprise) 8.270
ENGIEBRASILENERGIAS.A.ENGIE(Foreign Enterprise) 7.251ITAIPU(SOE) 7.000PETROBRAS(SOE) 6.239CEMIG(Subnational SOE) 5.308
CopelGeraçãoeTransmissãoS.A. (Subnational SOE) 4.921NorteEnergiaS.A.(Mixed capital) 3.938
Source:ANEELupdated by newmergers and aquisitons took in2017

Brazil• Anewregulatorymodelwasadoptedin2004whichgavethecentralgovernmentaroleincoordinatingtheenergymarketagain.Lulaadministration(2003-2010)raisedgovernmentspendingbyanaveragerealvalueof3.2percentperyear,whileinvestmentbypublicadministrationandstateenterprisesgrewby14%and16,3%,respectively;
• Inlate2010,thegovernmentdecidedtostopthisgrowthtrend,promotingarigorousfiscaladjustmenttoattainaprimarysurplusof3.1%ofGDPin2011.Thegovernmentconsumptionfellby2.2%andpublicinvestments,inboththecentralgovernmentandstate-ownedenterprisesfellby17,9%and7.8%,respectively.Investmentofpublicadministrationdecreasedbyrealannualaveragevalueof1%between2011and2014whileinvestmentsinstateenterprisesgrewby2.7%duringthesameperiod;
• TheNationalBankofDevelopment(BNDES)isamongthefivelargestbanksofthismodalityintheworldandwasthemaininstrumentofcountercyclicalfiscalpolicyinBrazilduringthecriticalperiodoftheglobalcreditcrisisof2007/08.TotalBNDESdisbursementsbetween2007and2014grewatanaveragerealrateof12%peryear,reachinganequivalentof3.7%oftheGDP.
• TheBNDESfinancedallninenewhydroelectricplantsthatwentonlineinBrazilbetween2007and2014usingamodelofprojectfinanceandcofinance withcommercialbanks,multilateralorgansandinfrastructuredebentures.Inotherrenewableenergyprojects(windandsmallhydro)theparticipationoftheBNDESwascloseto63%.Thebankwasalsoresponsiblefor39%ofnewthermoelectricenergyaddedtothegrid.

05000000
1000000015000000200000002500000030000000350000004000000045000000
Volumeof Loans Granted by 30Largest Russian Banksto Resident LegalEntities and IndividualEntrepreneurs,by Economic Activity and Useof Funds
(millions rubles)
2009 2010 2011 2012 2013 2014 2015 2016
Source:Author's elaboration based on datafrom Russia's CentralBank

Distribution of Russia state ownership byindustry,2006–2014(%)
percent inthe sample of114companies
the average totalsharesowned by the state
Nuclearpower 2,63 99,93Banking 6,14 30,46
Oilandgas 11,4 26,59Pipelinetransportation 0,88 100
Electricpower 21,93 38,21Infrastructure construction 1,75 47,06
Source:Abramova;Radygina;Chernova (2017)

Rosfnet39%
lukoil16%
Surgutneftegaz12%
Gazprom(including
GazpromNeft)10%
Tatneft5%
Slavneft3%
Bashneft3%
Russneft3%
PSAoperators3%
Novatek1%
Others5%
Russia's Oil Production by Company, 2014 Thousand b/d
Gazprom69%
Novatek10%
Rosneft9%
Lukoil3%
Surgutneftegaz1%
PSAoperators5%
Others3%
Russia's Natural Gas Production by Company, 2014Bcf/d
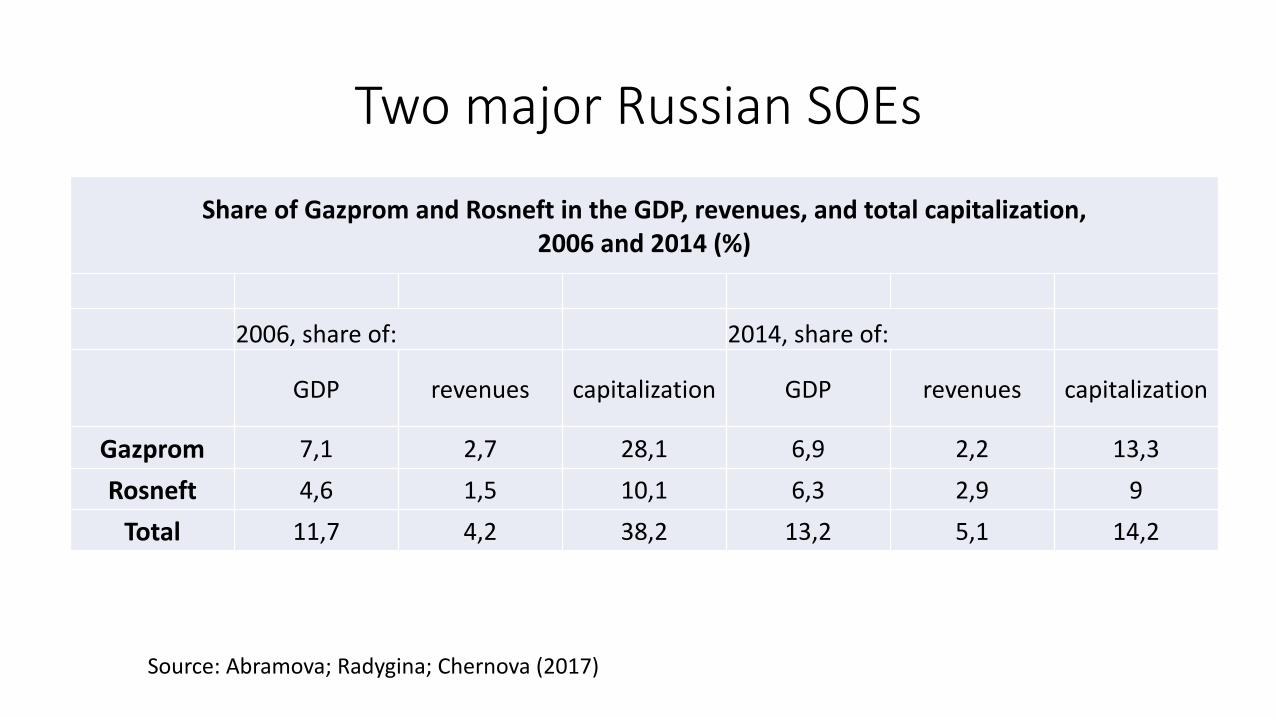
Two majorRussian SOEs
Share of Gazpromand Rosneft inthe GDP,revenues,and totalcapitalization,2006and 2014(%)
2006,shareof: 2014,shareof:
GDP revenues capitalization GDP revenues capitalization
Gazprom 7,1 2,7 28,1 6,9 2,2 13,3Rosneft 4,6 1,5 10,1 6,3 2,9 9Total 11,7 4,2 38,2 13,2 5,1 14,2
Source:Abramova;Radygina;Chernova (2017)
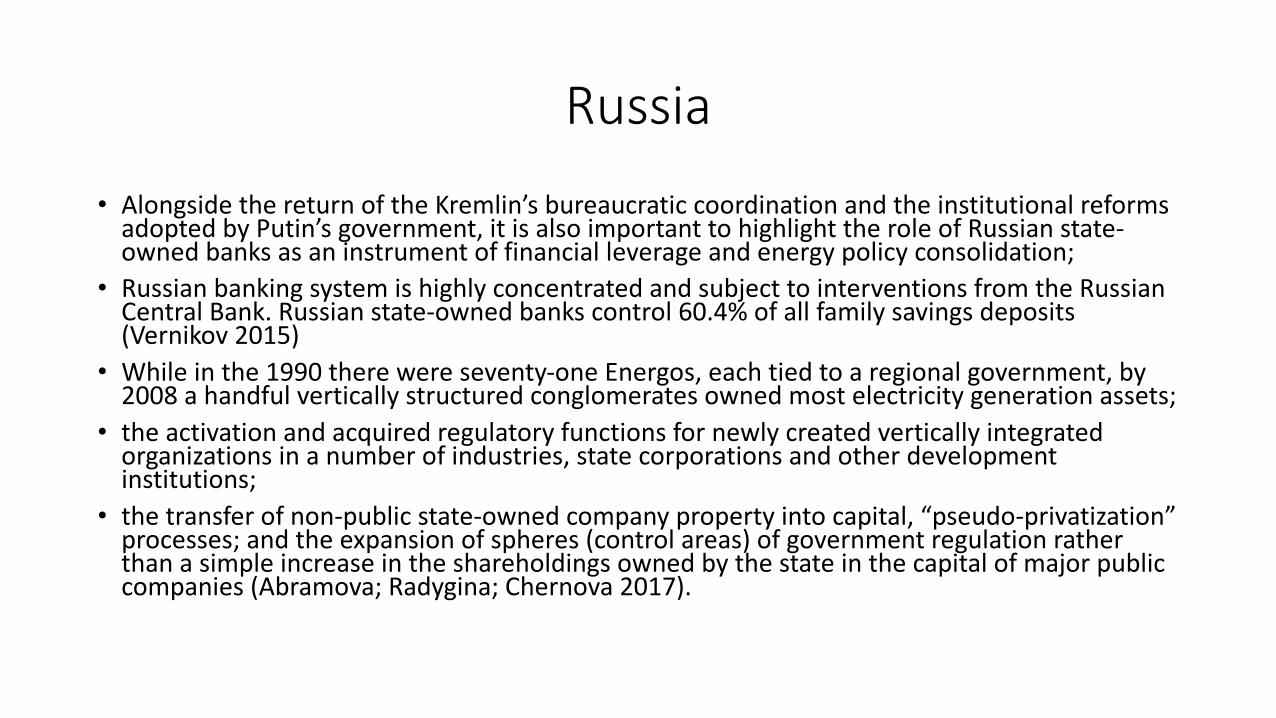
Russia
• Alongside the return of the Kremlin’s bureaucratic coordination and the institutional reformsadopted by Putin’s government,itis also important to highlight the roleof Russian state-owned banks asan instrument of financialleverage and energy policy consolidation;
• Russian bankingsystemis highly concentrated and subject to interventions from the RussianCentralBank.Russian state-owned banks control 60.4%of all family savings deposits(Vernikov 2015)
• While inthe 1990there were seventy-one Energos,each tied to aregionalgovernment,by2008ahandful vertically structured conglomerates owned most electricity generation assets;
• the activation and acquired regulatory functions fornewly created vertically integratedorganizations inanumber of industries,state corporations and other developmentinstitutions;
• the transfer of non-public state-owned company property into capital,“pseudo-privatization”processes;and the expansion of spheres (control areas)of government regulation ratherthan asimple increase inthe shareholdings owned by the state inthe capitalof majorpubliccompanies (Abramova;Radygina;Chernova 2017).

Electricity industry structures and forms of ownership,regulationand competition
China Russia Brazil IndiaIndustry model Corporatised Corporatised Corporatised CorporatisedOwnership ofgeneration State Mixed private and
governmentMixed private and
governmentMixed private and
governmentOwnership oftransmission State State Federaland state Federalgovt
Ownership ofdistribution State State Mixed Mixed
Keylegislation State and federal Federal Federal State and federal
Form of regulation Priceregulation Priceregulation Competitive marketoversight Price regulation
Regulator/s NDRC,State ElectricityRegulatory Commission
Ministry of Energy,FederalTariff Service,
FAS
MME,ANEEL,CNPEand CMSE MoP,CERC
Extent of competitionCompetition to buildnewpower plants,but
not fordispatchNone
Limited:periodicauctions held fornewgeneration capacity
Nocompetitive market.Capacity shortages and
substantial self-generation
Source:Wilson,Yangand Kuang (2015)

Centrifugal tendenciesState-owned BanksandEnterprises
BureaucraticCapacities FederalismDilemmas
Brasil(1982-2000)
Privatizations on electricityretailers and corporativization ofoil SOEand Eletrobras
dismantlement of bureaucraticpersonal due the low ratesof publicinvestments and privatizations
Fiscaldecentralization due torevenue transfers to subnationalspheres by 1988Constitution andnon-cooperative model ofintergovernmental relations
Russia (1990-2000)
Privatization of oil sectoranddecentralization of electricityretailers
Thecollapse of centralbureacraticauthority upon electricity systemandoil sector
Therise of subnational sovereiginityoverenergy policiesand collapsetributary capacity of centralgovernment
China(1978-2002)
Decentralization of electricityretailers (coal producers)andCorporativization oil state-ownedenterprises
Former energy ministries hasbecome corporations and suppressedthe iron ricebowl system.Overlapping of regulatory bodies onenergy policies
Fiscaldescentralization
Índia(1991-2003) State Divestment andCorporativization
Long-term coordination problems byCentralgovernment and electricityretailers under subnational control
Conservation of extensiveprerogatives from regionalpowerupon State Electricity Boards

Centripetal tendenciesState-ownedBanksandEnterprises BureaucraticCapacities FederalismDilemmas
Brasil(2004-2016)
Centralgovernment recoveredcoordinating roleinenergymarket in2004and StateOwned Banksresumed itsanti-cyclical role
Recouvering ofstatebureaucraticpersonel
Fiscalcentralizationduetoinflationstabilizationplanwhichraisedcentralgovernmenttaxextration tothedetrimentofsubnationalspheres
Russia (2001-2016)
Verticalization andcorporateconcentrationofoilandelectricityindustrialchain
Recovering ofcommanding chain bycentralbureaucracy
Thedemiseofsubnationalsovereiginity overenergypoliciesandtaxreformswhichenabledcentraladministrationtocapturethelargeramountofenergyrevenuesurplus
China(2003-2016)
Therise national championpolicy under SASACcoordination
Promulgation of the fullCivilServants Lawin2005to replace the TemporaryRegulations.
Recoveryof centralgovernment tributaryand fiscalcapacities and exponential creditpoliciesby State-Owned Banksasmainstayof energy investment
Índia(2003-2016)
Enactment of Electricity Act2003
Centralgovernment has attempted to usefinancialleverage from Public SectorComercialBanksto share the burden ofsubsidieswith regionalgovernments –without asuccess
Related Documents