SemiAnnual Report JANUARY 31, 2022 Investor Service Access Flex Bear High Yield ProFund AFBIX AFBSX Access Flex High Yield ProFund FYAIX FYASX Banks UltraSector ProFund BKPIX BKPSX Basic Materials UltraSector ProFund BMPIX BMPSX Bear ProFund BRPIX BRPSX Biotechnology UltraSector ProFund BIPIX BIPSX Bitcoin Strategy ProFund BTCFX Bull ProFund BLPIX BLPSX Communication Services UltraSector ProFund WCPIX WCPSX Consumer Goods UltraSector ProFund CNPIX CNPSX Consumer Services UltraSector ProFund CYPIX CYPSX Europe 30 ProFund UEPIX UEPSX Falling U.S. Dollar ProFund FDPIX FDPSX Financials UltraSector ProFund FNPIX FNPSX Health Care UltraSector ProFund HCPIX HCPSX Industrials UltraSector ProFund IDPIX IDPSX Internet UltraSector ProFund INPIX INPSX Large-Cap Growth ProFund LGPIX LGPSX Large-Cap Value ProFund LVPIX LVPSX Mid-Cap Growth ProFund MGPIX MGPSX Mid-Cap ProFund MDPIX MDPSX Mid-Cap Value ProFund MLPIX MLPSX Nasdaq-100 ProFund OTPIX OTPSX Oil & Gas UltraSector ProFund ENPIX ENPSX Oil Equipment & Services UltraSector ProFund OEPIX OEPSX Pharmaceuticals UltraSector ProFund PHPIX PHPSX Precious Metals UltraSector ProFund PMPIX PMPSX Real Estate UltraSector ProFund REPIX REPSX Rising Rates Opportunity ProFund RRPIX RRPSX Rising Rates Opportunity 10 ProFund RTPIX RTPSX Rising U.S. Dollar ProFund RDPIX RDPSX Investor Service Semiconductor UltraSector ProFund SMPIX SMPSX Short Nasdaq-100 ProFund SOPIX SOPSX Short Oil & Gas ProFund SNPIX SNPSX Short Precious Metals ProFund SPPIX SPPSX Short Real Estate ProFund SRPIX SRPSX Short Small-Cap ProFund SHPIX SHPSX Small-Cap Growth ProFund SGPIX SGPSX Small-Cap ProFund SLPIX SLPSX Small-Cap Value ProFund SVPIX SVPSX Technology UltraSector ProFund TEPIX TEPSX Telecommunications UltraSector ProFund TCPIX TCPSX UltraBear ProFund URPIX URPSX UltraBull ProFund ULPIX ULPSX UltraChina ProFund UGPIX UGPSX UltraDow 30 ProFund UDPIX UDPSX UltraEmerging Markets ProFund UUPIX UUPSX UltraInternational ProFund UNPIX UNPSX UltraJapan ProFund UJPIX UJPSX UltraLatin America ProFund UBPIX UBPSX UltraMid-Cap ProFund UMPIX UMPSX UltraNasdaq-100 ProFund UOPIX UOPSX UltraShort China ProFund UHPIX UHPSX UltraShort Dow 30 ProFund UWPIX UWPSX UltraShort Emerging Markets ProFund UVPIX UVPSX UltraShort International ProFund UXPIX UXPSX UltraShort Japan ProFund UKPIX UKPSX UltraShort Latin America ProFund UFPIX UFPSX UltraShort Mid-Cap ProFund UIPIX UIPSX UltraShort Nasdaq-100 ProFund USPIX USPSX UltraShort Small-Cap ProFund UCPIX UCPSX UltraSmall-Cap ProFund UAPIX UAPSX U.S. Government Plus ProFund GVPIX GVPSX Utilities UltraSector ProFund UTPIX UTPSX

Welcome message from author
This document is posted to help you gain knowledge. Please leave a comment to let me know what you think about it! Share it to your friends and learn new things together.
Transcript

SemiAnnual ReportJANUARY 31, 2022
Investor Service
Access Flex Bear High Yield ProFund AFBIX AFBSXAccess Flex High Yield ProFund FYAIX FYASXBanks UltraSector ProFund BKPIX BKPSXBasic Materials UltraSector ProFund BMPIX BMPSXBear ProFund BRPIX BRPSXBiotechnology UltraSector ProFund BIPIX BIPSXBitcoin Strategy ProFund BTCFXBull ProFund BLPIX BLPSXCommunication Services UltraSector ProFund WCPIX WCPSXConsumer Goods UltraSector ProFund CNPIX CNPSXConsumer Services UltraSector ProFund CYPIX CYPSXEurope 30 ProFund UEPIX UEPSXFalling U.S. Dollar ProFund FDPIX FDPSXFinancials UltraSector ProFund FNPIX FNPSXHealth Care UltraSector ProFund HCPIX HCPSXIndustrials UltraSector ProFund IDPIX IDPSXInternet UltraSector ProFund INPIX INPSXLarge-Cap Growth ProFund LGPIX LGPSXLarge-Cap Value ProFund LVPIX LVPSXMid-Cap Growth ProFund MGPIX MGPSXMid-Cap ProFund MDPIX MDPSXMid-Cap Value ProFund MLPIX MLPSXNasdaq-100 ProFund OTPIX OTPSXOil & Gas UltraSector ProFund ENPIX ENPSXOil Equipment & Services UltraSector ProFund OEPIX OEPSXPharmaceuticals UltraSector ProFund PHPIX PHPSXPrecious Metals UltraSector ProFund PMPIX PMPSXReal Estate UltraSector ProFund REPIX REPSXRising Rates Opportunity ProFund RRPIX RRPSXRising Rates Opportunity 10 ProFund RTPIX RTPSXRising U.S. Dollar ProFund RDPIX RDPSX
Investor Service
Semiconductor UltraSector ProFund SMPIX SMPSXShort Nasdaq-100 ProFund SOPIX SOPSXShort Oil & Gas ProFund SNPIX SNPSXShort Precious Metals ProFund SPPIX SPPSXShort Real Estate ProFund SRPIX SRPSXShort Small-Cap ProFund SHPIX SHPSXSmall-Cap Growth ProFund SGPIX SGPSXSmall-Cap ProFund SLPIX SLPSXSmall-Cap Value ProFund SVPIX SVPSXTechnology UltraSector ProFund TEPIX TEPSXTelecommunications UltraSector ProFund TCPIX TCPSXUltraBear ProFund URPIX URPSXUltraBull ProFund ULPIX ULPSXUltraChina ProFund UGPIX UGPSXUltraDow 30 ProFund UDPIX UDPSXUltraEmerging Markets ProFund UUPIX UUPSXUltraInternational ProFund UNPIX UNPSXUltraJapan ProFund UJPIX UJPSXUltraLatin America ProFund UBPIX UBPSXUltraMid-Cap ProFund UMPIX UMPSXUltraNasdaq-100 ProFund UOPIX UOPSXUltraShort China ProFund UHPIX UHPSXUltraShort Dow 30 ProFund UWPIX UWPSXUltraShort Emerging Markets ProFund UVPIX UVPSXUltraShort International ProFund UXPIX UXPSXUltraShort Japan ProFund UKPIX UKPSXUltraShort Latin America ProFund UFPIX UFPSXUltraShort Mid-Cap ProFund UIPIX UIPSXUltraShort Nasdaq-100 ProFund USPIX USPSXUltraShort Small-Cap ProFund UCPIX UCPSXUltraSmall-Cap ProFund UAPIX UAPSXU.S. Government Plus ProFund GVPIX GVPSXUtilities UltraSector ProFund UTPIX UTPSX
Toppan Merrill - ProFunds Public Semi-Annual Report [Funds] 01-31-2022 ED [AUX] | akiesli | 29-Mar-22 08:42 | 22-1296-2.aa | Sequence: 1CHKSUM Content: 46804 Layout: 43829 Graphics: 61486 CLEAN
JOB: 22-1296-2 CYCLE#;BL#: 8; 0 TRIM: 8.25" x 10.75" AS: New York: 212-620-5600COLORS: ~note-color 2, Black GRAPHICS: ProFunds_CVR_logo_k.eps, ProFunds_FC_art_k.eps V1.5
Beginning on January 1, 2021, as permitted by regulations adopted by the Securities and Exchange Commission, paper copies of the Fund's annual and semiannual shareholder reports will no longer be sentby mail, unless you specifically request paper copies of the reports. Instead, the reports will be made available on the Fund's website (profunds.com), and you will be notified by mail each time a report is postedand provided with a website link to access the report.
If you already elected to receive shareholder reports electronically, you will not be affected by this changeand you need not take any action. You may elect to receive shareholder reports and other communications from the Fund electronically anytime by contacting your financial intermediary (such as abroker-dealer or bank) or, if you are a direct investor, by calling 888-PRO-FNDS (888-776-3637) or by sendingand e-mail request to [email protected].
Beginning on January 1, 2019, you may elect to receive all future reports in paper free of charge. If youinvest through a financial intermediary, you can contact your financial intermediary to request that you continue to receive paper copies of your shareholder reports. If you invest directly with the Fund, you cancall 888-PRO-FNDS (888-776-3637) or send an email request to [email protected] to let the Fund knowyou wish to continue receiving paper copies of your shareholder reports. Your election to receive reports inpaper will apply to all funds held in your account in you invest through your financial intermediary or allfunds held with the fund complex if you invest directly with the Fund.
Toppan Merrill - ProFunds Public Semi-Annual Report [Funds] 01-31-2022 ED [AUX] | akiesli | 29-Mar-22 08:42 | 22-1296-2.aa | Sequence: 2CHKSUM Content: 5423 Layout: 33270 Graphics: 0 CLEAN
JOB: 22-1296-2 CYCLE#;BL#: 8; 0 TRIM: 8.25" x 10.75" AS: New York: 212-620-5600COLORS: Black, ~note-color 2 GRAPHICS: none V1.5
Table of Contents
1 Message from the Chairman
3 Allocation of Portfolio Holdings
and Index Composition
27 Expense Examples
Schedules of Portfolio Investments
34 Access Flex Bear High Yield ProFund35 Access Flex High Yield ProFund 36 Banks UltraSector ProFund38 Basic Materials UltraSector ProFund40 Bear ProFund41 Biotechnology UltraSector ProFund43 Bitcoin Strategy ProFund44 Bull ProFund47 Communication Services
UltraSector ProFund49 Consumer Goods UltraSector ProFund52 Consumer Services UltraSector ProFund55 Europe 30 ProFund56 Falling U.S. Dollar ProFund57 Financials UltraSector ProFund61 Health Care UltraSector ProFund64 Industrials UltraSector ProFund68 Internet UltraSector ProFund70 Large-Cap Growth ProFund74 Large-Cap Value ProFund80 Mid-Cap Growth ProFund84 Mid-Cap ProFund90 Mid-Cap Value ProFund95 Nasdaq-100 ProFund98 Oil & Gas UltraSector ProFund
100 Oil Equipment & ServicesUltraSector ProFund
102 Pharmaceuticals UltraSector ProFund104 Precious Metals UltraSector ProFund106 Real Estate UltraSector ProFund109 Rising Rates Opportunity ProFund110 Rising Rates Opportunity 10 ProFund111 Rising U.S. Dollar ProFund112 Semiconductor UltraSector ProFund
114 Short Nasdaq-100 ProFund115 Short Oil & Gas ProFund116 Short Precious Metals ProFund117 Short Real Estate ProFund118 Short Small-Cap ProFund119 Small-Cap Growth ProFund124 Small-Cap ProFund127 Small-Cap Value ProFund134 Technology UltraSector ProFund137 Telecommunications UltraSector ProFund139 UltraBear ProFund140 UltraBull ProFund143 UltraChina ProFund145 UltraDow 30 ProFund147 UltraEmerging Markets ProFund149 UltraInternational ProFund150 UltraJapan ProFund151 UltraLatin America ProFund153 UltraMid-Cap ProFund160 UltraNasdaq-100 ProFund163 UltraShort China ProFund164 UltraShort Dow 30 ProFund165 UltraShort Emerging Markets ProFund166 UltraShort International ProFund167 UltraShort Japan ProFund168 UltraShort Latin America ProFund169 UltraShort Mid-Cap ProFund170 UltraShort Nasdaq-100 ProFund171 UltraShort Small-Cap ProFund172 UltraSmall-Cap ProFund175 U.S. Government Plus ProFund176 Utilities UltraSector ProFund179 Statements of Assets and Liabilities195 Statements of Operations211 Statements of Changes in Net Assets239 Consolidated Statement of Cash Flows241 Financial Highlights275 Notes to Financial Statements317 Board Approval of Investment Advisory
Agreement320 Liquidity Risk Management Program
Receive investor materials electronically:Shareholders may sign up for electronic delivery of investor materials. By doing so, you will receive the information faster and help usreduce the impact on the environment of providing these materials. To enroll in electronic delivery,
1. Go to www.icsdelivery.com2. Select the first letter of your brokerage firm’s name.3. From the list that follows, select your brokerage firm. If your brokerage firm is not listed, electronic delivery may not be available.
Please contact your brokerage firm.4. Complete the information requested, including the e-mail address where you would like to receive notifications for electronic documents.
Your information will be kept confidential and will not be used for any purpose other than electronic delivery. If you change your mind,you can cancel electronic delivery at any time and revert to physical delivery of your materials. Just go to www.icsdelivery.com, performthe first three steps above, and follow the instructions for cancelling electronic delivery. If you have any questions, please contact yourbrokerage firm.
Toppan Merrill - ProFunds Public Semi-Annual Report [Funds] 01-31-2022 ED [AUX] | pvangb | 29-Mar-22 10:06 | 22-1296-2.ac | Sequence: 1CHKSUM Content: 41233 Layout: 56263 Graphics: 0 CLEAN
JOB: 22-1296-2 CYCLE#;BL#: 10; 0 TRIM: 8.25" x 10.75" AS: New York: 212-620-5600COLORS: Black, ~note-color 2 GRAPHICS: none V1.5

This Page Intentionally Left Blank
Toppan Merrill - ProFunds Public Semi-Annual Report [Funds] 01-31-2022 ED [AUX] | akiesli | 29-Mar-22 08:42 | 22-1296-2.ba | Sequence: 1CHKSUM Content: 40530 Layout: 21608 Graphics: 0 CLEAN
JOB: 22-1296-2 CYCLE#;BL#: 8; 0 TRIM: 8.25" x 10.75" AS: New York: 212-620-5600COLORS: Black, ~note-color 2 GRAPHICS: none V1.5
1
Message from the Chairman
Dear Shareholder:
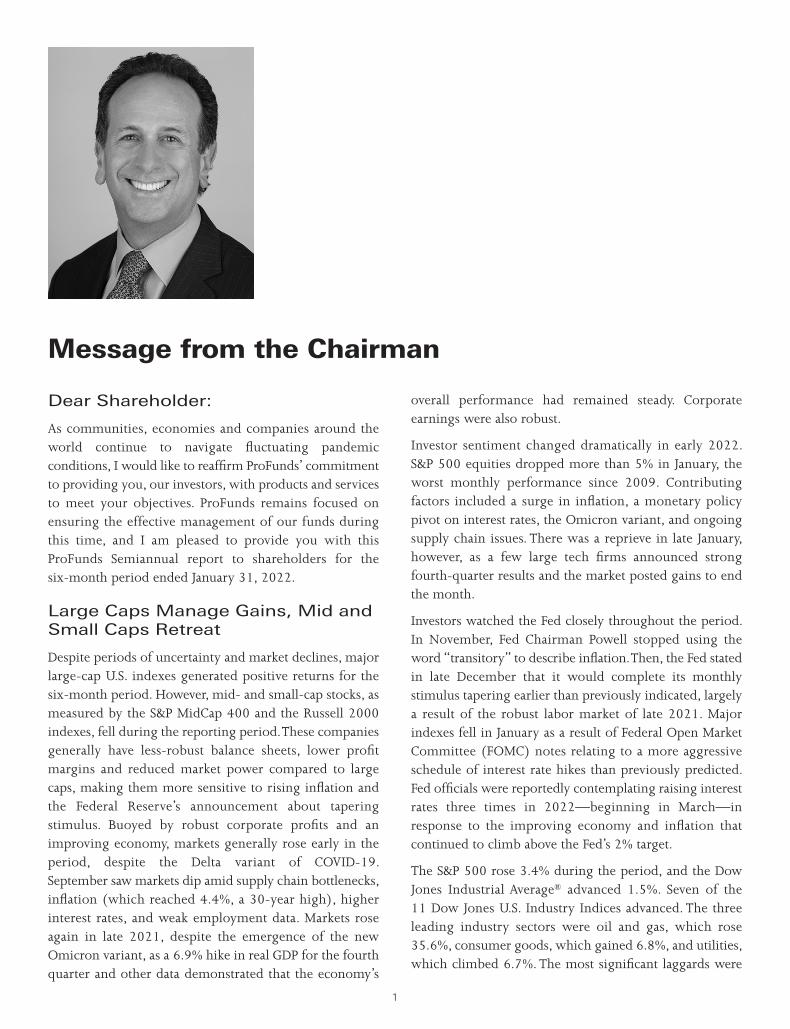
As communities, economies and companies around theworld continue to navigate fluctuating pandemicconditions, I would like to reaffirm ProFunds’ commitmentto providing you, our investors, with products and servicesto meet your objectives. ProFunds remains focused onensuring the effective management of our funds duringthis time, and I am pleased to provide you with thisProFunds Semiannual report to shareholders for thesix-month period ended January 31, 2022.
Large Caps Manage Gains, Mid andSmall Caps Retreat
Despite periods of uncertainty and market declines, majorlarge-cap U.S. indexes generated positive returns for thesix-month period. However, mid- and small-cap stocks, asmeasured by the S&P MidCap 400 and the Russell 2000indexes, fell during the reporting period. These companiesgenerally have less-robust balance sheets, lower profitmargins and reduced market power compared to largecaps, making them more sensitive to rising inflation andthe Federal Reserve’s announcement about taperingstimulus. Buoyed by robust corporate profits and animproving economy, markets generally rose early in theperiod, despite the Delta variant of COVID-19.September saw markets dip amid supply chain bottlenecks,inflation (which reached 4.4%, a 30-year high), higherinterest rates, and weak employment data. Markets roseagain in late 2021, despite the emergence of the newOmicron variant, as a 6.9% hike in real GDP for the fourthquarter and other data demonstrated that the economy’s
overall performance had remained steady. Corporateearnings were also robust.
Investor sentiment changed dramatically in early 2022.S&P 500 equities dropped more than 5% in January, theworst monthly performance since 2009. Contributingfactors included a surge in inflation, a monetary policypivot on interest rates, the Omicron variant, and ongoingsupply chain issues. There was a reprieve in late January,however, as a few large tech firms announced strongfourth-quarter results and the market posted gains to endthe month.
Investors watched the Fed closely throughout the period.In November, Fed Chairman Powell stopped using theword “transitory” to describe inflation. Then, the Fed statedin late December that it would complete its monthlystimulus tapering earlier than previously indicated, largelya result of the robust labor market of late 2021. Majorindexes fell in January as a result of Federal Open MarketCommittee (FOMC) notes relating to a more aggressiveschedule of interest rate hikes than previously predicted.Fed officials were reportedly contemplating raising interestrates three times in 2022—beginning in March—inresponse to the improving economy and inflation thatcontinued to climb above the Fed’s 2% target.
The S&P 500 rose 3.4% during the period, and the DowJones Industrial Average® advanced 1.5%. Seven of the11 Dow Jones U.S. Industry Indices advanced. The threeleading industry sectors were oil and gas, which rose35.6%, consumer goods, which gained 6.8%, and utilities,which climbed 6.7%. The most significant laggards were
Toppan Merrill - ProFunds Public Semi-Annual Report [Funds] 01-31-2022 ED [AUX] | akiesli | 29-Mar-22 08:42 | 22-1296-2.ba | Sequence: 2CHKSUM Content: 63590 Layout: 56825 Graphics: 6994 CLEAN
JOB: 22-1296-2 CYCLE#;BL#: 8; 0 TRIM: 8.25" x 10.75" AS: New York: 212-620-5600COLORS: ~note-color 2, Black GRAPHICS: michael_sapir_3-20_photo.eps V1.5
2
telecom, which fell 7.4%, and consumer services, whichdeclined 6.7%. The small-cap Russell 2000® Index retreated8.4%, and the S&P MidCap 400® fell 1.9%.
International Equity Markets Retreatfor the Period
Both developed and emerging international markets trailedU.S. markets during most of the period. A strengtheningU.S. dollar relative to international currencies also detractedfrom returns for U.S. investors in international markets.Shares of Eurozone and Asian companies fell inJanuary amid caution over the outlook for U.S. interest ratesand geopolitical risk due to the Russian buildup of troopson Ukraine’s borders.
The MSCI EAFE Index, which represents the performanceof developed markets equities outside of the United Statesand Canada, retreated 3.4%, the MSCI Europe Indexcontracted 2.5%, and the Nikkei 225 Index fell 4.8%. TheBNY Mellon Emerging Markets Index dropped 9.3% forthe period. Chinese stocks, as measured by the BNY ChinaSelect ADR Index, tumbled 22.4%, and Latin Americanmarkets decreased 3.9%, as measured by the BNY MellonLatin America Index.
10-Year Rates Traded below 2% asthe Fed Provided Stimulus
U.S. Treasury yields, which move opposite to bond prices,rose throughout the period due to aforementionedinflation concerns and Fed monetary policy changes.High-yield corporate bonds finished 2021 as thebest-performing segments of the fixed income market,though they fell in January due to concern about higherrates. Long U.S. Treasurys, as represented by the Ryan Labs10-Year and 30-Year Indexes, declined 5.8% and 8.2%,
respectively, for the period. Investment-grade corporatebonds dropped 5.1%, as measured by the Markit iBoxx®
$ Liquid Investment Grade Index, while their high-yieldcounterparts declined 1.7%, according to the MarkitiBoxx® $ Liquid High Yield Index.
ProFunds Mutual Funds InvestorPerformance
ProFunds’ index-based mutual funds offer investorsadvantages such as diverse market exposures, a transparentinvestment process, efficient fund management, and highdaily correlation to their indexes. Investors in ourlong-duration bond and Treasury funds generally benefitedduring the period. Long investors in ProFunds dollar fundswere also generally rewarded in terms of performanceduring the period, as the U.S. dollar climbed 3.8% in thesix-month period, according to the Bloomberg Dollar SpotIndex.
No matter what direction the market takes in these rapidlychanging times, our extensive lineup of ProFunds mutualfunds offers a range of strategies designed to meet yourobjectives, help you manage risk, and potentially enhanceyour returns.
We appreciate the trust and confidence you have placed inus by choosing ProFunds, and we look forward tocontinuing to serve your investing needs.
Sincerely,
Michael L. SapirChairman of the Board of Trustees
Toppan Merrill - ProFunds Public Semi-Annual Report [Funds] 01-31-2022 ED [AUX] | akiesli | 29-Mar-22 08:42 | 22-1296-2.ba | Sequence: 3CHKSUM Content: 57381 Layout: 28691 Graphics: 52749 CLEAN
JOB: 22-1296-2 CYCLE#;BL#: 8; 0 TRIM: 8.25" x 10.75" AS: New York: 212-620-5600COLORS: ~note-color 2, Black GRAPHICS: Michael_Sapir_sig.eps V1.5

Allocation of Portfolio Holdings and Index Composition
Toppan Merrill - ProFunds Public Semi-Annual Report [Funds] 01-31-2022 ED [AUX] | akiesli | 29-Mar-22 08:42 | 22-1296-2.ca | Sequence: 1CHKSUM Content: 22702 Layout: 45663 Graphics: 0 CLEAN
JOB: 22-1296-2 CYCLE#;BL#: 8; 0 TRIM: 8.25" x 10.75" AS: New York: 212-620-5600COLORS: Black, ~note-color 2 GRAPHICS: none V1.5
Access Flex Bear High Yield ProFund
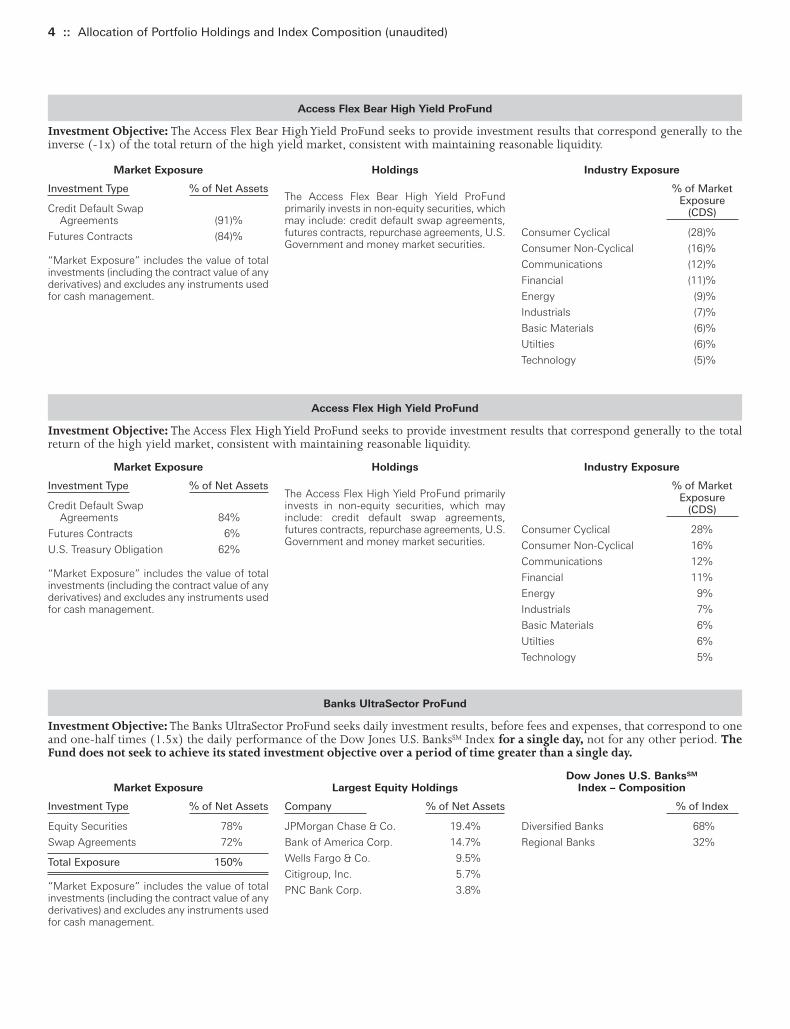
Investment Objective: The Access Flex Bear High Yield ProFund seeks to provide investment results that correspond generally to theinverse (-1x) of the total return of the high yield market, consistent with maintaining reasonable liquidity.
4 :: Allocation of Portfolio Holdings and Index Composition (unaudited)
Access Flex High Yield ProFund
Investment Objective: The Access Flex High Yield ProFund seeks to provide investment results that correspond generally to the totalreturn of the high yield market, consistent with maintaining reasonable liquidity.
Market Exposure
Investment Type % of Net Assets
Credit Default Swap Agreements 84%
Futures Contracts 6%
U.S. Treasury Obligation 62%
“Market Exposure” includes the value of totalinvestments (including the contract value of anyderivatives) and excludes any instruments usedfor cash management.
Holdings
The Access Flex High Yield ProFund primarilyinvests in non-equity securities, which mayinclude: credit default swap agreements,futures contracts, repurchase agreements, U.S.Government and money market securities.
Industry Exposure
% of Market Exposure
(CDS)
Consumer Cyclical 28%
Consumer Non-Cyclical 16%
Communications 12%
Financial 11%
Energy 9%
Industrials 7%
Basic Materials 6%
Utilties 6%
Technology 5%
Banks UltraSector ProFund
Investment Objective: The Banks UltraSector ProFund seeks daily investment results, before fees and expenses, that correspond to oneand one-half times (1.5x) the daily performance of the Dow Jones U.S. BanksSM Index for a single day, not for any other period. TheFund does not seek to achieve its stated investment objective over a period of time greater than a single day.
Market Exposure
Investment Type % of Net Assets
Equity Securities 78%
Swap Agreements 72%
Total Exposure 150%
“Market Exposure” includes the value of totalinvestments (including the contract value of anyderivatives) and excludes any instruments usedfor cash management.
Largest Equity Holdings
Company % of Net Assets
JPMorgan Chase & Co. 19.4%
Bank of America Corp. 14.7%
Wells Fargo & Co. 9.5%
Citigroup, Inc. 5.7%
PNC Bank Corp. 3.8%
Dow Jones U.S. BanksSM
Index – Composition
% of Index
Diversified Banks 68%
Regional Banks 32%
Market Exposure
Investment Type % of Net Assets
Credit Default Swap Agreements (91)%
Futures Contracts (84)%
“Market Exposure” includes the value of totalinvestments (including the contract value of anyderivatives) and excludes any instruments usedfor cash management.
Holdings
The Access Flex Bear High Yield ProFundprimarily invests in non-equity securities, whichmay include: credit default swap agreements,futures contracts, repurchase agreements, U.S.Government and money market securities.
Industry Exposure
% of Market Exposure
(CDS)
Consumer Cyclical (28)%
Consumer Non-Cyclical (16)%
Communications (12)%
Financial (11)%
Energy (9)%
Industrials (7)%
Basic Materials (6)%
Utilties (6)%
Technology (5)%
Toppan Merrill - ProFunds Public Semi-Annual Report [Funds] 01-31-2022 ED [AUX] | akiesli | 29-Mar-22 08:42 | 22-1296-2.ca | Sequence: 2CHKSUM Content: 57347 Layout: 52844 Graphics: 0 CLEAN
JOB: 22-1296-2 CYCLE#;BL#: 8; 0 TRIM: 8.25" x 10.75" AS: New York: 212-620-5600COLORS: ~note-color 2, Black, ~note-color 3 GRAPHICS: none V1.5
Allocation of Portfolio Holdings and Index Composition (unaudited) :: 5
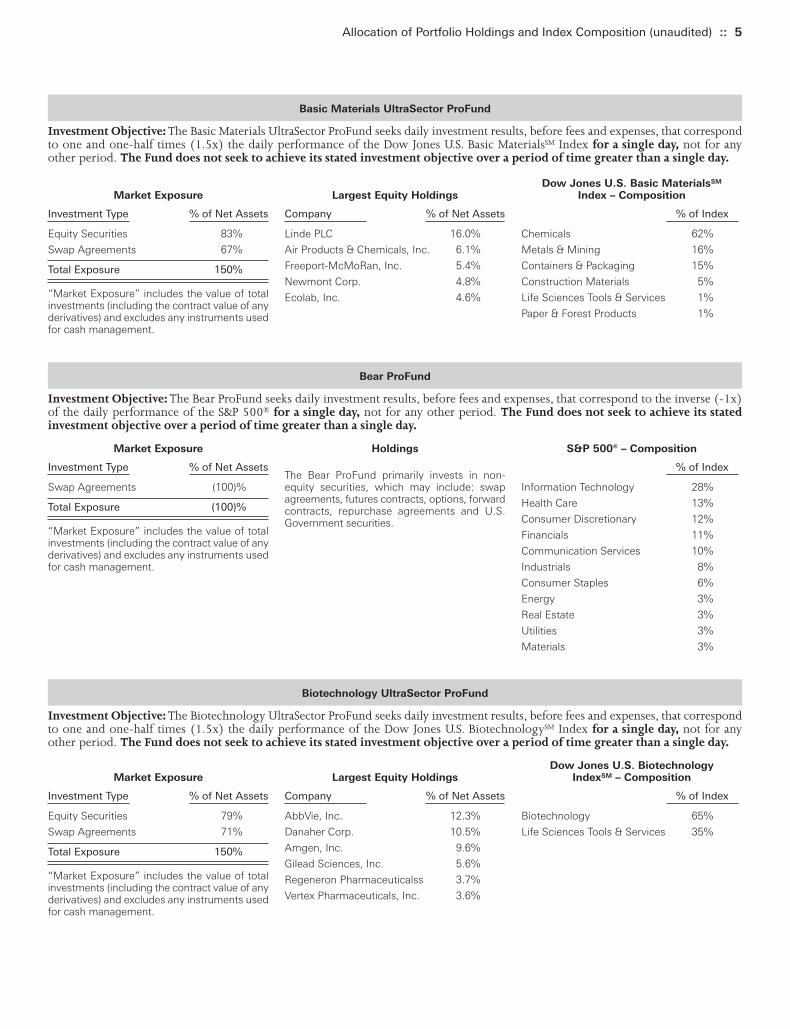
Basic Materials UltraSector ProFund
Investment Objective: The Basic Materials UltraSector ProFund seeks daily investment results, before fees and expenses, that correspondto one and one-half times (1.5x) the daily performance of the Dow Jones U.S. Basic MaterialsSM Index for a single day, not for anyother period. The Fund does not seek to achieve its stated investment objective over a period of time greater than a single day.
Market Exposure
Investment Type % of Net Assets
Equity Securities 83%
Swap Agreements 67%
Total Exposure 150%
“Market Exposure” includes the value of totalinvestments (including the contract value of anyderivatives) and excludes any instruments usedfor cash management.
Largest Equity Holdings
Company % of Net Assets
Linde PLC 16.0%
Air Products & Chemicals, Inc. 6.1%
Freeport-McMoRan, Inc. 5.4%
Newmont Corp. 4.8%
Ecolab, Inc. 4.6%
Dow Jones U.S. Basic MaterialsSM
Index – Composition
% of Index
Chemicals 62%
Metals & Mining 16%
Containers & Packaging 15%
Construction Materials 5%
Life Sciences Tools & Services 1%
Paper & Forest Products 1%
Bear ProFund
Investment Objective: The Bear ProFund seeks daily investment results, before fees and expenses, that correspond to the inverse (-1x)of the daily performance of the S&P 500® for a single day, not for any other period. The Fund does not seek to achieve its statedinvestment objective over a period of time greater than a single day.
Market Exposure
Investment Type % of Net Assets
Swap Agreements (100)%
Total Exposure (100)%
“Market Exposure” includes the value of totalinvestments (including the contract value of anyderivatives) and excludes any instruments usedfor cash management.
Holdings
The Bear ProFund primarily invests in non-equity securities, which may include: swapagreements, futures contracts, options, forwardcontracts, repurchase agreements and U.S.Government securities.
S&P 500® – Composition
% of Index
Information Technology 28%
Health Care 13%
Consumer Discretionary 12%
Financials 11%
Communication Services 10%
Industrials 8%
Consumer Staples 6%
Energy 3%
Real Estate 3%
Utilities 3%
Materials 3%
Biotechnology UltraSector ProFund
Investment Objective: The Biotechnology UltraSector ProFund seeks daily investment results, before fees and expenses, that correspondto one and one-half times (1.5x) the daily performance of the Dow Jones U.S. BiotechnologySM Index for a single day, not for anyother period. The Fund does not seek to achieve its stated investment objective over a period of time greater than a single day.
Market Exposure
Investment Type % of Net Assets
Equity Securities 79%
Swap Agreements 71%
Total Exposure 150%
“Market Exposure” includes the value of totalinvestments (including the contract value of anyderivatives) and excludes any instruments usedfor cash management.
Largest Equity Holdings
Company % of Net Assets
AbbVie, Inc. 12.3%
Danaher Corp. 10.5%
Amgen, Inc. 9.6%
Gilead Sciences, Inc. 5.6%
Regeneron Pharmaceuticalss 3.7%
Vertex Pharmaceuticals, Inc. 3.6%
Dow Jones U.S. BiotechnologyIndexSM – Composition
% of Index
Biotechnology 65%
Life Sciences Tools & Services 35%
Toppan Merrill - ProFunds Public Semi-Annual Report [Funds] 01-31-2022 ED [AUX] | akiesli | 29-Mar-22 08:42 | 22-1296-2.ca | Sequence: 3CHKSUM Content: 61068 Layout: 44136 Graphics: 0 CLEAN
JOB: 22-1296-2 CYCLE#;BL#: 8; 0 TRIM: 8.25" x 10.75" AS: New York: 212-620-5600COLORS: ~note-color 2, Black, ~note-color 3 GRAPHICS: none V1.5

6 :: Allocation of Portfolio Holdings and Index Composition (unaudited)
Bitcoin Strategy ProFund
Investment Objective: The Bitcoin Strategy ProFund seeks to provide capital appreciation by investing all or substantially all of itsassets through actively managed exposure to bitcoin futures contracts. The Fund does not invest directly in bitcoin.
Market Exposure
Investment Type % of Net Assets
Futures Contracts 100%
Total Exposure 100%
“Market Exposure” includes the value of totalinvestments (including the contract value of anyderivatives) and excludes any instruments usedfor cash management.
Holdings
The Bitcoin Strategy ProFund primarily investsin non-equity securities, which may include:futures contracts, Canadian Exchange TradedFunds, repurchase agreements and reverserepurchase agreements, and U.S. Governmentsecurities.
Bull ProFund
Investment Objective: The Bull ProFund seeks investment results, before fees and expenses, that correspond to the performance of theS&P 500®.
Market Exposure
Investment Type % of Net Assets
Equity Securities 78%
Swap Agreements 22%
Total Exposure 100%
“Market Exposure” includes the value of totalinvestments (including the contract value of anyderivatives) and excludes any instruments usedfor cash management or collateral for securitiesloaned.
Largest Equity Holdings
Company % of Net Assets
Apple, Inc. 5.5%
Microsoft Corp. 4.7%
Alphabet, Inc. 3.2%
Amazon.com, Inc. 2.6%
Tesla, Inc. 1.5%
S&P 500® – Composition
% of Index
Information Technology 28%
Health Care 13%
Consumer Discretionary 12%
Financials 11%
Communication Services 10%
Industrials 8%
Consumer Staples 6%
Energy 3%
Real Estate 3%
Utilities 3%
Materials 3%
Communication Services UltraSector ProFund
Investment Objective: The Communication Services UltraSector ProFund seeks daily investment results, before fees and expenses, thatcorrespond to one and one-half times (1.5x) the daily performance of the S&P Communication Services Select SectorSM Index for asingle day, not for any other period. The Fund does not seek to achieve its stated investment objective over a period of time greaterthan a single day.
Market Exposure
Investment Type % of Net Assets
Equity Securities 82%
Swap Agreements 68%
Total Exposure 150%
“Market Exposure” includes the value of totalinvestments (including the contract value of anyderivatives) and excludes any instruments usedfor cash management or collateral for securitiesloaned.
Largest Equity Holdings
Company % of Net Assets
Meta Platforms, Inc. 18.4%
Alphabet, Inc. 17.7%
AT&T, Inc. 4.2%
Verizon Communications, Inc. 4.0%
Activision Blizzard, Inc. 4.0%
S&P Communication Services SelectSectorSM Index – Composition
% of Index
Media & Entertainment 90%
Telecommunication Services 10%
Toppan Merrill - ProFunds Public Semi-Annual Report [Funds] 01-31-2022 ED [AUX] | akiesli | 29-Mar-22 08:42 | 22-1296-2.ca | Sequence: 4CHKSUM Content: 10814 Layout: 10735 Graphics: 0 CLEAN
JOB: 22-1296-2 CYCLE#;BL#: 8; 0 TRIM: 8.25" x 10.75" AS: New York: 212-620-5600COLORS: ~note-color 2, Black, ~note-color 3 GRAPHICS: none V1.5
Allocation of Portfolio Holdings and Index Composition (unaudited) :: 7
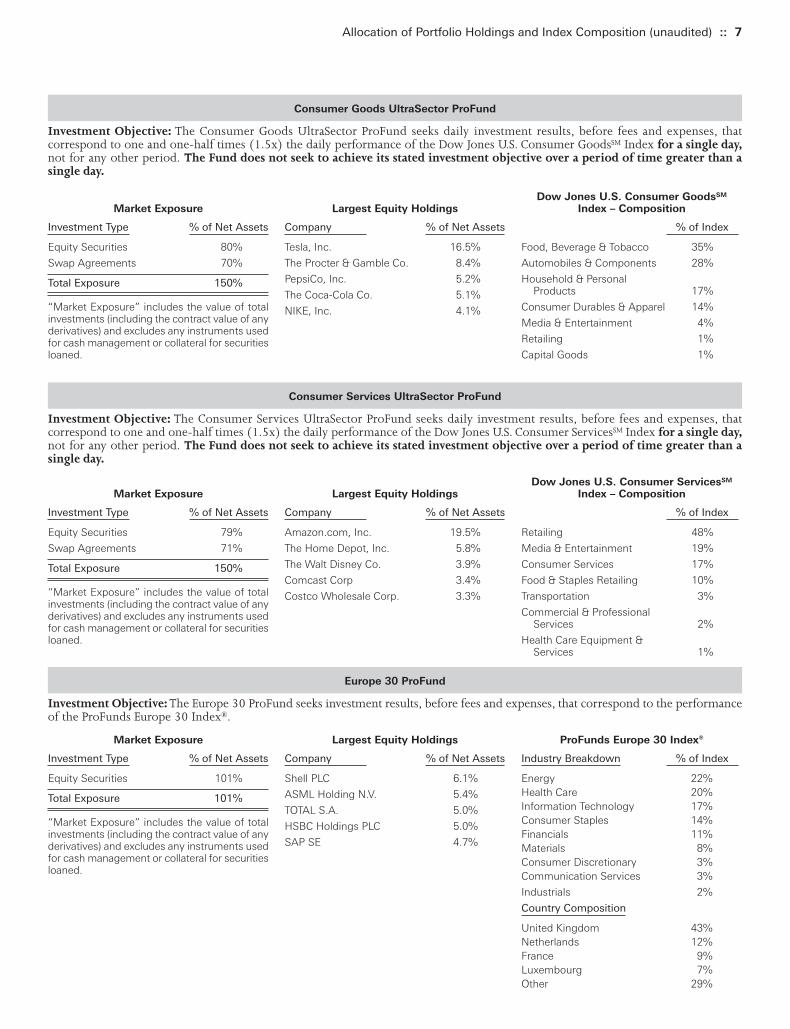
Consumer Goods UltraSector ProFund
Investment Objective: The Consumer Goods UltraSector ProFund seeks daily investment results, before fees and expenses, thatcorrespond to one and one-half times (1.5x) the daily performance of the Dow Jones U.S. Consumer GoodsSM Index for a single day,not for any other period. The Fund does not seek to achieve its stated investment objective over a period of time greater than asingle day.
Market Exposure
Investment Type % of Net Assets
Equity Securities 80%
Swap Agreements 70%
Total Exposure 150%
“Market Exposure” includes the value of totalinvestments (including the contract value of anyderivatives) and excludes any instruments usedfor cash management or collateral for securitiesloaned.
Largest Equity Holdings
Company % of Net Assets
Tesla, Inc. 16.5%
The Procter & Gamble Co. 8.4%
PepsiCo, Inc. 5.2%
The Coca-Cola Co. 5.1%
NIKE, Inc. 4.1%
Dow Jones U.S. Consumer GoodsSM
Index – Composition
% of Index
Food, Beverage & Tobacco 35%
Automobiles & Components 28%
Household & Personal Products 17%
Consumer Durables & Apparel 14%
Media & Entertainment 4%
Retailing 1%
Capital Goods 1%
Consumer Services UltraSector ProFund
Investment Objective: The Consumer Services UltraSector ProFund seeks daily investment results, before fees and expenses, thatcorrespond to one and one-half times (1.5x) the daily performance of the Dow Jones U.S. Consumer ServicesSM Index for a single day,not for any other period. The Fund does not seek to achieve its stated investment objective over a period of time greater than asingle day.
Market Exposure
Investment Type % of Net Assets
Equity Securities 79%
Swap Agreements 71%
Total Exposure 150%
“Market Exposure” includes the value of totalinvestments (including the contract value of anyderivatives) and excludes any instruments usedfor cash management or collateral for securitiesloaned.
Largest Equity Holdings
Company % of Net Assets
Amazon.com, Inc. 19.5%
The Home Depot, Inc. 5.8%
The Walt Disney Co. 3.9%
Comcast Corp 3.4%
Costco Wholesale Corp. 3.3%
Dow Jones U.S. Consumer ServicesSM
Index – Composition
% of Index
Retailing 48%
Media & Entertainment 19%
Consumer Services 17%
Food & Staples Retailing 10%
Transportation 3%
Commercial & Professional Services 2%
Health Care Equipment & Services 1%
Europe 30 ProFund
Investment Objective: The Europe 30 ProFund seeks investment results, before fees and expenses, that correspond to the performanceof the ProFunds Europe 30 Index®.
Market Exposure
Investment Type % of Net Assets
Equity Securities 101%
Total Exposure 101%
“Market Exposure” includes the value of totalinvestments (including the contract value of anyderivatives) and excludes any instruments usedfor cash management or collateral for securitiesloaned.
Largest Equity Holdings
Company % of Net Assets
Shell PLC 6.1%
ASML Holding N.V. 5.4%
TOTAL S.A. 5.0%
HSBC Holdings PLC 5.0%
SAP SE 4.7%
ProFunds Europe 30 Index®
Industry Breakdown % of Index
Energy 22%Health Care 20%Information Technology 17%Consumer Staples 14%Financials 11%Materials 8%Consumer Discretionary 3%Communication Services 3%
Industrials 2%
Country Composition
United Kingdom 43%Netherlands 12%France 9%Luxembourg 7%Other 29%
Toppan Merrill - ProFunds Public Semi-Annual Report [Funds] 01-31-2022 ED [AUX] | akiesli | 29-Mar-22 08:42 | 22-1296-2.ca | Sequence: 5CHKSUM Content: 20802 Layout: 51943 Graphics: 0 CLEAN
JOB: 22-1296-2 CYCLE#;BL#: 8; 0 TRIM: 8.25" x 10.75" AS: New York: 212-620-5600COLORS: ~note-color 2, Black, ~note-color 3 GRAPHICS: none V1.5
8 :: Allocation of Portfolio Holdings and Index Composition (unaudited)
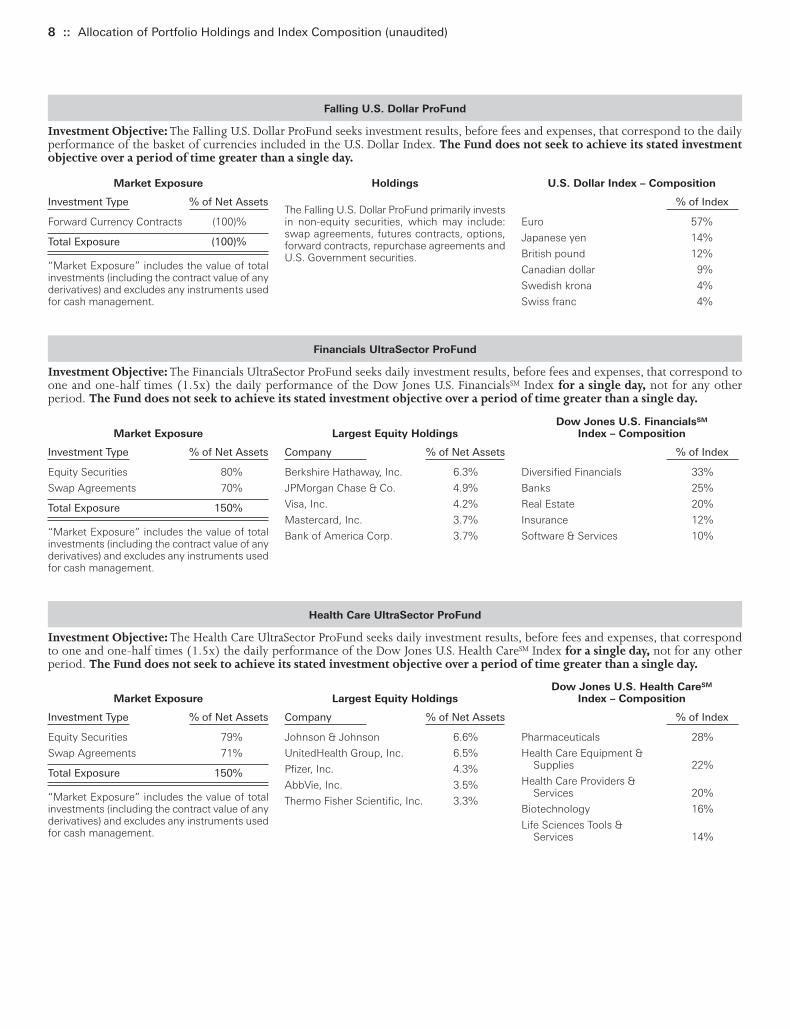
Falling U.S. Dollar ProFund
Investment Objective: The Falling U.S. Dollar ProFund seeks investment results, before fees and expenses, that correspond to the dailyperformance of the basket of currencies included in the U.S. Dollar Index. The Fund does not seek to achieve its stated investmentobjective over a period of time greater than a single day.
Market Exposure
Investment Type % of Net Assets
Forward Currency Contracts (100)%
Total Exposure (100)%
“Market Exposure” includes the value of totalinvestments (including the contract value of anyderivatives) and excludes any instruments usedfor cash management.
Holdings
The Falling U.S. Dollar ProFund primarily investsin non-equity securities, which may include:swap agreements, futures contracts, options,forward contracts, repurchase agreements andU.S. Government securities.
U.S. Dollar Index – Composition
% of Index
Euro 57%
Japanese yen 14%
British pound 12%
Canadian dollar 9%
Swedish krona 4%
Swiss franc 4%
Financials UltraSector ProFund
Investment Objective: The Financials UltraSector ProFund seeks daily investment results, before fees and expenses, that correspond toone and one-half times (1.5x) the daily performance of the Dow Jones U.S. FinancialsSM Index for a single day, not for any otherperiod. The Fund does not seek to achieve its stated investment objective over a period of time greater than a single day.
Market Exposure
Investment Type % of Net Assets
Equity Securities 80%
Swap Agreements 70%
Total Exposure 150%
“Market Exposure” includes the value of totalinvestments (including the contract value of anyderivatives) and excludes any instruments usedfor cash management.
Largest Equity Holdings
Company % of Net Assets
Berkshire Hathaway, Inc. 6.3%
JPMorgan Chase & Co. 4.9%
Visa, Inc. 4.2%
Mastercard, Inc. 3.7%
Bank of America Corp. 3.7%
Dow Jones U.S. FinancialsSM
Index – Composition
% of Index
Diversified Financials 33%
Banks 25%
Real Estate 20%
Insurance 12%
Software & Services 10%
Health Care UltraSector ProFund
Investment Objective: The Health Care UltraSector ProFund seeks daily investment results, before fees and expenses, that correspondto one and one-half times (1.5x) the daily performance of the Dow Jones U.S. Health CareSM Index for a single day, not for any otherperiod. The Fund does not seek to achieve its stated investment objective over a period of time greater than a single day.
Market Exposure
Investment Type % of Net Assets
Equity Securities 79%
Swap Agreements 71%
Total Exposure 150%
“Market Exposure” includes the value of totalinvestments (including the contract value of anyderivatives) and excludes any instruments usedfor cash management.
Largest Equity Holdings
Company % of Net Assets
Johnson & Johnson 6.6%
UnitedHealth Group, Inc. 6.5%
Pfizer, Inc. 4.3%
AbbVie, Inc. 3.5%
Thermo Fisher Scientific, Inc. 3.3%
Dow Jones U.S. Health CareSM
Index – Composition
% of Index
Pharmaceuticals 28%
Health Care Equipment & Supplies 22%
Health Care Providers & Services 20%
Biotechnology 16%
Life Sciences Tools & Services 14%
Toppan Merrill - ProFunds Public Semi-Annual Report [Funds] 01-31-2022 ED [AUX] | akiesli | 29-Mar-22 08:42 | 22-1296-2.ca | Sequence: 6CHKSUM Content: 112 Layout: 16091 Graphics: 0 CLEAN
JOB: 22-1296-2 CYCLE#;BL#: 8; 0 TRIM: 8.25" x 10.75" AS: New York: 212-620-5600COLORS: ~note-color 2, Black, ~note-color 3 GRAPHICS: none V1.5

Allocation of Portfolio Holdings and Index Composition (unaudited) :: 9
Industrials UltraSector ProFund
Investment Objective: the Industrials UltraSector ProFund seeks daily investment results, before fees and expenses, that correspond toone and one-half times (1.5x) the daily performance of the Dow Jones U.S. IndustrialsSM Index for a single day, not for any otherperiod. The Fund does not seek to achieve its stated investment objective over a period of time greater than a single day.
Market Exposure
Investment Type % of Net Assets
Equity Securities 82%
Swap Agreements 69%
Total Exposure 151%
“Market Exposure” includes the value of totalinvestments (including the contract value of anyderivatives) and excludes any instruments usedfor cash management.
Largest Equity Holdings
Company % of Net Assets
Accenture PLC 3.8%
PayPal Holdings, Inc. 3.4%
Union Pacific Corp. 2.7%
United Parcel Service, Inc. 2.5%
Honeywell International, Inc. 2.4%
Dow Jones U.S. IndustrialsSM
Index – Composition
% of Index
Capital Goods 48%
Software & Services 19%
Transportation 13%
Commercial & Professional Services 7%
Materials 6%
Technology Hardware & Equipment 6%
Pharmaceuticals, Biotechnology & Life Sciences 1%
Internet UltraSector ProFund
Investment Objective: The Internet UltraSector ProFund seeks daily investment results, before fees and expenses, that correspond toone and one-half (1.5x) the daily performance of the Dow Jones Internet CompositeSM Index for a single day, not for any other period.The Fund does not seek to achieve its stated investment objective over a period of time greater than a single day.
Market Exposure
Investment Type % of Net Assets
Equity Securities 81%
Swap Agreements 69%
Total Exposure 150%
“Market Exposure” includes the value of totalinvestments (including the contract value of anyderivatives) and excludes any instruments usedfor cash management.
Largest Equity Holdings
Company % of Net Assets
Alphabet, Inc. 8.6%
Amazon.com, Inc. 7.6%
Meta Platforms, Inc. 6.4%
Cisco Systems, Inc. 4.2%
Salesforce.com, Inc. 3.9%
Dow Jones Internet CompositeSM
Index – Composition
% of Index
Interactive Media & Services 27%
Software 20%
IT Services 15%
Internet & Direct Marketing Retail 14%
Communications Equipment 11%
Hotels, Restaurants & Leisure 5%
Entertainment 4%
Health Care Technology 3%
Real Estate Management & Development 1%
Large-Cap Growth ProFund
Investment Objective: The Large-Cap Growth ProFund seeks investment results, before fees and expenses, that correspond to theperformance of the S&P 500® Growth Index.
Market Exposure
Investment Type % of Net Assets
Equity Securities 100%
Total Exposure 100%
“Market Exposure” includes the value of totalinvestments (including the contract value of anyderivatives) and excludes any instruments usedfor cash management.
Largest Equity Holdings
Company % of Net Assets
Apple, Inc. 14.0%
Microsoft Corp. 12.0%
Alphabet, Inc. 8.1%
Amazon.com, Inc. 6.7%
Tesla, Inc. 3.9%
S&P 500® Growth Index – Composition
% of Index
Information Technology 46%
Consumer Discretionary 16%
Communication Services 13%
Health Care 10%
Financials 7%
Industrials 3%
Real Estate 2%
Consumer Staples 1%
Materials 1%
Energy 1%
Toppan Merrill - ProFunds Public Semi-Annual Report [Funds] 01-31-2022 ED [AUX] | akiesli | 29-Mar-22 08:42 | 22-1296-2.ca | Sequence: 7CHKSUM Content: 32084 Layout: 7632 Graphics: 0 CLEAN
JOB: 22-1296-2 CYCLE#;BL#: 8; 0 TRIM: 8.25" x 10.75" AS: New York: 212-620-5600COLORS: ~note-color 2, Black, ~note-color 3 GRAPHICS: none V1.5
10 :: Allocation of Portfolio Holdings and Index Composition (unaudited)
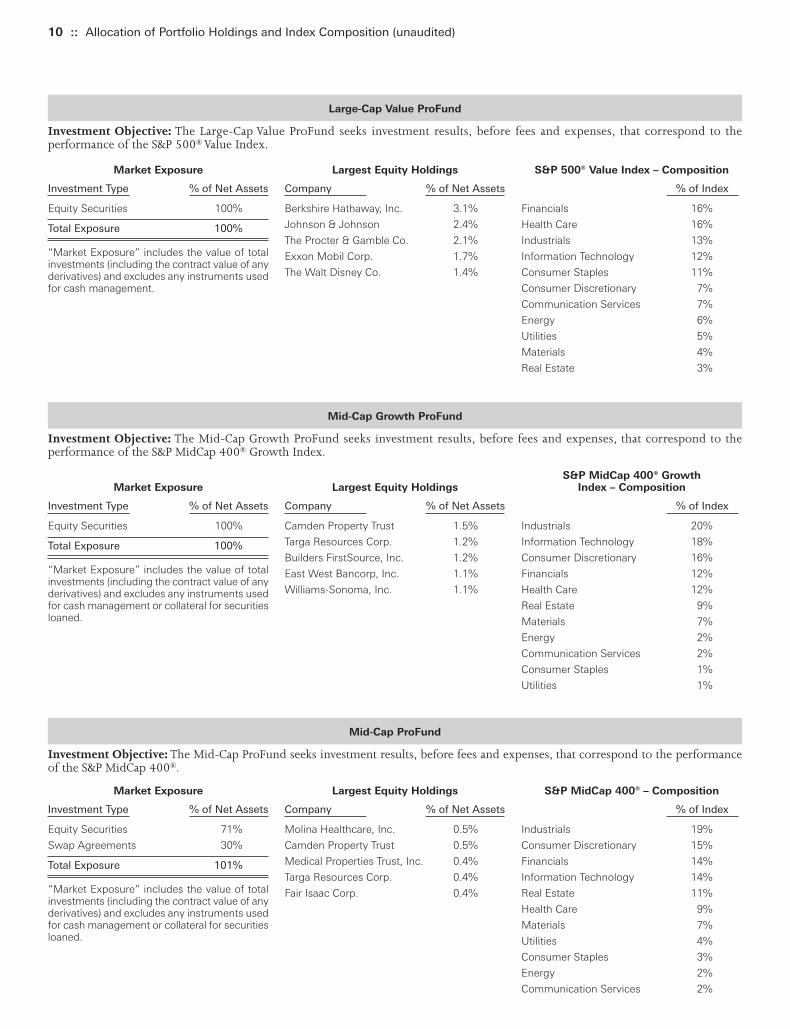
Large-Cap Value ProFund
Investment Objective: The Large-Cap Value ProFund seeks investment results, before fees and expenses, that correspond to theperformance of the S&P 500® Value Index.
Market Exposure
Investment Type % of Net Assets
Equity Securities 100%
Total Exposure 100%
“Market Exposure” includes the value of totalinvestments (including the contract value of anyderivatives) and excludes any instruments usedfor cash management.
Largest Equity Holdings
Company % of Net Assets
Berkshire Hathaway, Inc. 3.1%
Johnson & Johnson 2.4%
The Procter & Gamble Co. 2.1%
Exxon Mobil Corp. 1.7%
The Walt Disney Co. 1.4%
S&P 500® Value Index – Composition
% of Index
Financials 16%
Health Care 16%
Industrials 13%
Information Technology 12%
Consumer Staples 11%
Consumer Discretionary 7%
Communication Services 7%
Energy 6%
Utilities 5%
Materials 4%
Real Estate 3%
Mid-Cap Growth ProFund
Investment Objective: The Mid-Cap Growth ProFund seeks investment results, before fees and expenses, that correspond to theperformance of the S&P MidCap 400® Growth Index.
Market Exposure
Investment Type % of Net Assets
Equity Securities 100%
Total Exposure 100%
“Market Exposure” includes the value of totalinvestments (including the contract value of anyderivatives) and excludes any instruments usedfor cash management or collateral for securitiesloaned.
Largest Equity Holdings
Company % of Net Assets
Camden Property Trust 1.5%
Targa Resources Corp. 1.2%
Builders FirstSource, Inc. 1.2%
East West Bancorp, Inc. 1.1%
Williams-Sonoma, Inc. 1.1%
S&P MidCap 400® GrowthIndex – Composition
% of Index
Industrials 20%
Information Technology 18%
Consumer Discretionary 16%
Financials 12%
Health Care 12%
Real Estate 9%
Materials 7%
Energy 2%
Communication Services 2%
Consumer Staples 1%
Utilities 1%
Mid-Cap ProFund
Investment Objective: The Mid-Cap ProFund seeks investment results, before fees and expenses, that correspond to the performanceof the S&P MidCap 400®.
Market Exposure
Investment Type % of Net Assets
Equity Securities 71%
Swap Agreements 30%
Total Exposure 101%
“Market Exposure” includes the value of totalinvestments (including the contract value of anyderivatives) and excludes any instruments usedfor cash management or collateral for securitiesloaned.
Largest Equity Holdings
Company % of Net Assets
Molina Healthcare, Inc. 0.5%
Camden Property Trust 0.5%
Medical Properties Trust, Inc. 0.4%
Targa Resources Corp. 0.4%
Fair Isaac Corp. 0.4%
S&P MidCap 400® – Composition
% of Index
Industrials 19%
Consumer Discretionary 15%
Financials 14%
Information Technology 14%
Real Estate 11%
Health Care 9%
Materials 7%
Utilities 4%
Consumer Staples 3%
Energy 2%
Communication Services 2%
Toppan Merrill - ProFunds Public Semi-Annual Report [Funds] 01-31-2022 ED [AUX] | akiesli | 29-Mar-22 08:42 | 22-1296-2.ca | Sequence: 8CHKSUM Content: 23054 Layout: 35201 Graphics: 0 CLEAN
JOB: 22-1296-2 CYCLE#;BL#: 8; 0 TRIM: 8.25" x 10.75" AS: New York: 212-620-5600COLORS: ~note-color 2, Black, ~note-color 3 GRAPHICS: none V1.5

Allocation of Portfolio Holdings and Index Composition (unaudited) :: 11
Mid-Cap Value ProFund
Investment Objective: The Mid-Cap Value ProFund seeks investment results, before fees and expenses, that correspond to theperformance of the S&P Mid-Cap 400® Value Index.
Market Exposure
Investment Type % of Net Assets
Equity Securities 100%
Total Exposure 100%
“Market Exposure” includes the value of totalinvestments (including the contract value of anyderivatives) and excludes any instruments usedfor cash management.
Largest Equity Holdings
Company % of Net Assets
Medical Properties Trust, Inc. 1.2%
Lear Corp. 0.9%
AECOM 0.9%
Reliance Steel & Aluminum Co. 0.8%
UGI Corp. 0.8%
S&P MidCap 400® ValueIndex – Composition
% of Index
Industrials 20%
Financials 17%
Consumer Discretionary 14%
Real Estate 12%
Information Technology 11%
Health Care 7%
Materials 6%
Consumer Staples 5%
Utilities 5%
Energy 2%
Communication Services 1%
Nasdaq-100 ProFund
Investment Objective: The Nasdaq-100 ProFund seeks investment results, before fees and expenses, that correspond to the performanceof the Nasdaq-100® Index.
Market Exposure
Investment Type % of Net Assets
Equity Securities 82%
Futures Contracts 1%
Swap Agreements 17%
Total Exposure 100%
“Market Exposure” includes the value of totalinvestments (including the contract value of anyderivatives) and excludes any instruments usedfor cash management or collateral for securitiesloaned.
Largest Equity Holdings
Company % of Net Assets
Apple, Inc. 10.3%
Microsoft Corp. 8.4%
Alphabet, Inc. 6.0%
Amazon.com, Inc. 5.5%
Meta Platforms, Inc. 4.0%
Nasdaq-100® Index – Composition
% of Index
Information Technology 51%
Communication Services 19%
Consumer Discretionary 16%
Health Care 5%
Consumer Staples 5%
Industrials 3%
Utilities 1%
Oil & Gas UltraSector ProFund
Investment Objective: The Oil & Gas UltraSector ProFund seeks daily investment results, before fees and expenses, that correspond toone and one-half times (1.5x) the daily performance of the Dow Jones U.S. Oil & GasSM Index for a single day, not for any other period.The Fund does not seek to achieve its stated investment objective over a period of time greater than a single day.
Market Exposure
Investment Type % of Net Assets
Equity Securities 72%
Swap Agreements 78%
Total Exposure 150%
“Market Exposure” includes the value of totalinvestments (including the contract value of anyderivatives) and excludes any instruments usedfor cash management.
Largest Equity Holdings
Company % of Net Assets
Exxon Mobil Corp. 16.5%
Chevron Corp. 13.0%
ConocoPhillips 6.0%
EOG Resources, Inc. 3.3%
Schlumberger, Ltd. 2.8%
Dow Jones U.S. Oil & GasSM
Index – Composition
% of Index
Oil, Gas & Consumable Fuels 90%
Energy Equipment & Services 8%
Semiconductors & Semiconductor Equipment 1%
Electric Utilities 1%
Toppan Merrill - ProFunds Public Semi-Annual Report [Funds] 01-31-2022 ED [AUX] | akiesli | 29-Mar-22 08:42 | 22-1296-2.ca | Sequence: 9CHKSUM Content: 65069 Layout: 33569 Graphics: 0 CLEAN
JOB: 22-1296-2 CYCLE#;BL#: 8; 0 TRIM: 8.25" x 10.75" AS: New York: 212-620-5600COLORS: ~note-color 2, Black, ~note-color 3 GRAPHICS: none V1.5

12 :: Allocation of Portfolio Holdings and Index Composition (unaudited)
Oil Equipment & Services UltraSector ProFund
Investment Objective: The Oil Equipment & Services UltraSector ProFund seeks daily investment results, before fees and expenses,that correspond to one and one-half times (1.5x) the daily performance of the Dow Jones U.S Select Oil Equipment & ServicesSM Indexfor a single day, not for any other period. The Fund does not seek to achieve its stated investment objective over a period of timegreater than a single day.
Market Exposure
Investment Type % of Net Assets
Equity Securities 73%
Swap Agreements 77%
Total Exposure 150%
“Market Exposure” includes the value of totalinvestments (including the contract value of anyderivatives) and excludes any instruments usedfor cash management.
Largest Equity Holdings
Company % of Net Assets
Schlumberger, Ltd. 17.8%
Baker Hughes Co. 15.2%
Halliburton Co. 3.7%
NOV, Inc. 3.5%
Helmerich & Payne, Inc. 3.3%
Dow Jones U.S. Select Oil Equipment &ServicesSM Index – Composition
% of Index
Oil & Gas Equipment & Services 84%
Oil & Gas Drilling 16%
Pharmaceuticals UltraSector ProFund
Investment Objective: The Pharmaceuticals UltraSector ProFund seeks daily investment results, before fees and expenses, that correspondto one and one-half times (1.5x) the daily performance of the Dow Jones U.S. PharmaceuticalsSM Index for a single day, not for anyother period. The Fund does not seek to achieve its stated investment objective over a period of time greater than a single day.
Market Exposure
Investment Type % of Net Assets
Equity Securities 77%
Swap Agreements 74%
Total Exposure 151%
“Market Exposure” includes the value of totalinvestments (including the contract value of anyderivatives) and excludes any instruments usedfor cash management or collateral for securitiesloaned.
Largest Equity Holdings
Company % of Net Assets
Johnson & Johnson 17.8%
Pfizer, Inc. 16.8%
Viatris, Inc. 4.1%
Bristol-Myers Squibb Co. 3.8%
Merck & Co., Inc. 3.8%
Dow Jones U.S. SelectPharmaceuticalsSM Index – Composition
% of Index
Pharmaceuticals 98%
Biotechnology 2%
Precious Metals UltraSector ProFund
Investment Objective: The Precious Metals UltraSector ProFund seeks daily investment results, before fees and expenses, that correspondto one and one-half times (1.5x) the daily performance of the Dow Jones Precious MetalsSM Index for a single day, not for any otherperiod. The Fund does not seek to achieve its stated investment objective over a period of time greater than a single day.
Market Exposure
Investment Type % of Net Assets
Equity Securities 72%
Swap Agreements 79%
Total Exposure 151%
“Market Exposure” includes the value of totalinvestments (including the contract value of anyderivatives) and excludes any instruments usedfor cash management or collateral for securitiesloaned.
Largest Equity Holdings
Company % of Net Assets
Newmont Corp. 15.1%
Barrick Gold Corp. 10.5%
Franco-Nevada Corp. 7.8%
Wheaton Precious Metals Corp. 5.6%
Agnico Eagle Mines, Ltd. 3.6%
Dow Jones Precious MetalsSM
Index – Composition
% of Index
Gold 90%
Silver 5%
Precious Metals & Minerals 5%
Toppan Merrill - ProFunds Public Semi-Annual Report [Funds] 01-31-2022 ED [AUX] | akiesli | 29-Mar-22 08:42 | 22-1296-2.ca | Sequence: 10CHKSUM Content: 22371 Layout: 35268 Graphics: 0 CLEAN
JOB: 22-1296-2 CYCLE#;BL#: 8; 0 TRIM: 8.25" x 10.75" AS: New York: 212-620-5600COLORS: ~note-color 2, Black, ~note-color 3 GRAPHICS: none V1.5
Allocation of Portfolio Holdings and Index Composition (unaudited) :: 13
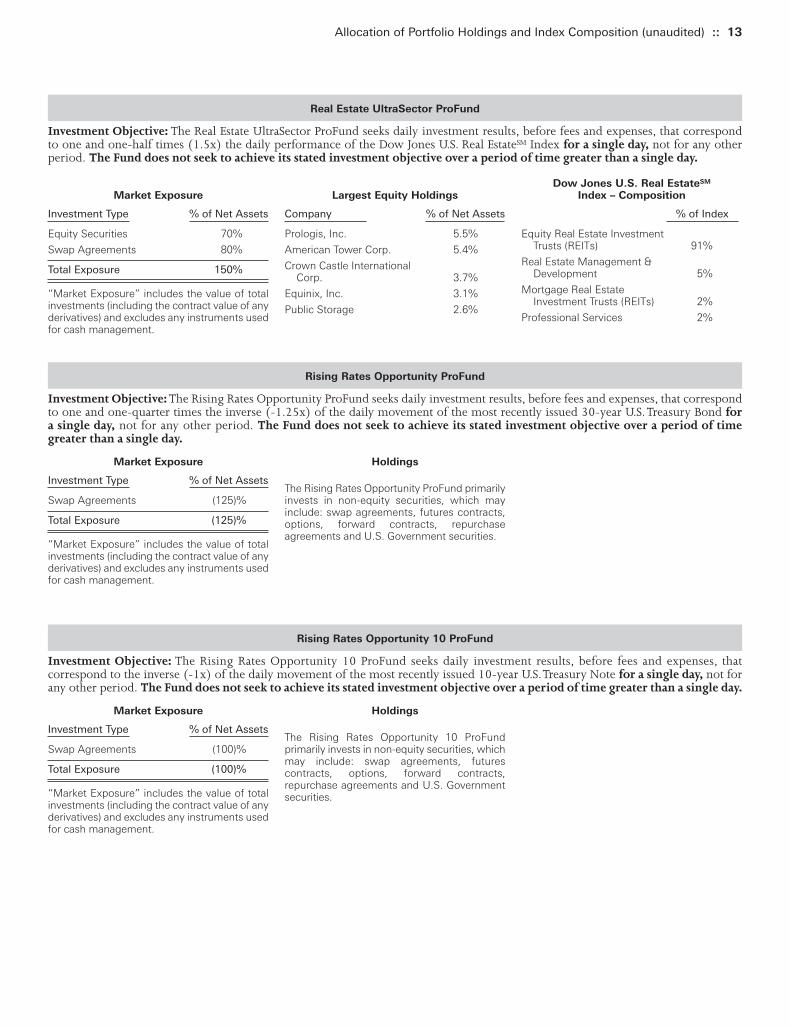
Real Estate UltraSector ProFund
Investment Objective: The Real Estate UltraSector ProFund seeks daily investment results, before fees and expenses, that correspondto one and one-half times (1.5x) the daily performance of the Dow Jones U.S. Real EstateSM Index for a single day, not for any otherperiod. The Fund does not seek to achieve its stated investment objective over a period of time greater than a single day.
Market Exposure
Investment Type % of Net Assets
Equity Securities 70%
Swap Agreements 80%
Total Exposure 150%
“Market Exposure” includes the value of totalinvestments (including the contract value of anyderivatives) and excludes any instruments usedfor cash management.
Largest Equity Holdings
Company % of Net Assets
Prologis, Inc. 5.5%
American Tower Corp. 5.4%
Crown Castle International Corp. 3.7%
Equinix, Inc. 3.1%
Public Storage 2.6%
Dow Jones U.S. Real EstateSM
Index – Composition
% of Index
Equity Real Estate Investment Trusts (REITs) 91%
Real Estate Management & Development 5%
Mortgage Real Estate Investment Trusts (REITs) 2%
Professional Services 2%
Rising Rates Opportunity ProFund
Investment Objective: The Rising Rates Opportunity ProFund seeks daily investment results, before fees and expenses, that correspondto one and one-quarter times the inverse (-1.25x) of the daily movement of the most recently issued 30-year U.S. Treasury Bond fora single day, not for any other period. The Fund does not seek to achieve its stated investment objective over a period of timegreater than a single day.
Market Exposure
Investment Type % of Net Assets
Swap Agreements (125)%
Total Exposure (125)%
“Market Exposure” includes the value of totalinvestments (including the contract value of anyderivatives) and excludes any instruments usedfor cash management.
Holdings
The Rising Rates Opportunity ProFund primarilyinvests in non-equity securities, which mayinclude: swap agreements, futures contracts,options, forward contracts, repurchaseagreements and U.S. Government securities.
Rising Rates Opportunity 10 ProFund
Investment Objective: The Rising Rates Opportunity 10 ProFund seeks daily investment results, before fees and expenses, thatcorrespond to the inverse (-1x) of the daily movement of the most recently issued 10-year U.S. Treasury Note for a single day, not forany other period. The Fund does not seek to achieve its stated investment objective over a period of time greater than a single day.
Market Exposure
Investment Type % of Net Assets
Swap Agreements (100)%
Total Exposure (100)%
“Market Exposure” includes the value of totalinvestments (including the contract value of anyderivatives) and excludes any instruments usedfor cash management.
Holdings
The Rising Rates Opportunity 10 ProFundprimarily invests in non-equity securities, whichmay include: swap agreements, futurescontracts, options, forward contracts,repurchase agreements and U.S. Governmentsecurities.
Toppan Merrill - ProFunds Public Semi-Annual Report [Funds] 01-31-2022 ED [AUX] | akiesli | 29-Mar-22 08:42 | 22-1296-2.ca | Sequence: 11CHKSUM Content: 38125 Layout: 13674 Graphics: 0 CLEAN
JOB: 22-1296-2 CYCLE#;BL#: 8; 0 TRIM: 8.25" x 10.75" AS: New York: 212-620-5600COLORS: ~note-color 2, Black, ~note-color 3 GRAPHICS: none V1.5

14 :: Allocation of Portfolio Holdings and Index Composition (unaudited)
Rising U.S. Dollar ProFund
Investment Objective: The Rising U.S. Dollar ProFund seeks daily investment results, before fees and expenses, that correspond to theinverse (-1x) of the return of the basket of currencies included in the U.S. Dollar Index for a single day, not for any other period. TheFund does not seek to achieve its stated investment objective over a period of time greater than a single day.
Market Exposure
Investment Type % of Net Assets
Forward Currency Contracts 101%
Total Exposure 101%
“Market Exposure” includes the value of totalinvestments (including the contract value of anyderivatives) and excludes any instruments usedfor cash management.
Largest Equity Holdings
The Rising U.S. Dollar ProFund primarily investsin non-equity securities, which may include:swap agreements, futures contracts, options,forward contracts, repurchase agreements andU.S. Government securities.
U.S. Dollar Index – Composition
% of Index
Euro 57%
Japanese yen 14%
British pound 12%
Canadian dollar 9%
Swedish krona 4%
Swiss franc 4%
Semiconductor UltraSector ProFund
Investment Objective: The Semiconductor UltraSector ProFund seeks daily investment results, before fees and expenses, that correspondto one and one-half times (1.5x) of the return of the Dow Jones U.S. SemiconductorsSM Index for a single day, not for any other period.The Fund does not seek to achieve its stated investment objective over a period of time greater than a single day.
Market Exposure
Investment Type % of Net Assets
Equity Securities 77%
Swap Agreements 73%
Total Exposure 150%
“Market Exposure” includes the value of totalinvestments (including the contract value of anyderivatives) and excludes any instruments usedfor cash management.
Largest Equity Holdings
Company % of Net Assets
NVIDIA Corp. 19.6%
Broadcom, Inc. 7.7%
Intel Corp. 6.3%
Qualcomm, Inc. 6.3%
Texas Instruments, Inc. 5.3%
Dow Jones U.S. SemiconductorsSM
Index – Composition
% of Index
Semiconductors & Semiconductor Equipment 100%
Short Nasdaq-100 ProFund
Investment Objective: The Short Nasdaq-100 ProFund seeks daily investment results, before fees and expenses, that correspond to theinverse (-1x) of the return of the Nasdaq-100® Index for a single day, not for any other period. The Fund does not seek to achieveits stated investment objective over a period of time greater than a single day.
Market Exposure
Investment Type % of Net Assets
Swap Agreements (100)%
Total Exposure (100)%
“Market Exposure” includes the value of totalinvestments (including the contract value of anyderivatives) and excludes any instruments usedfor cash management.
Holdings
The Short Nasdaq-100 ProFund primarily investsin non-equity securities, which may include:swap agreements, futures contracts, options,forward contracts, repurchase agreements andU.S. Government securities.
Nasdaq-100® Index – Composition
% of Index
Information Technology 51%
Communication Services 19%
Consumer Discretionary 16%
Health Care 5%
Consumer Staples 5%
Industrials 3%
Utilities 1%
Toppan Merrill - ProFunds Public Semi-Annual Report [Funds] 01-31-2022 ED [AUX] | akiesli | 29-Mar-22 08:42 | 22-1296-2.ca | Sequence: 12CHKSUM Content: 39776 Layout: 6574 Graphics: 0 CLEAN
JOB: 22-1296-2 CYCLE#;BL#: 8; 0 TRIM: 8.25" x 10.75" AS: New York: 212-620-5600COLORS: ~note-color 2, Black, ~note-color 3 GRAPHICS: none V1.5
Allocation of Portfolio Holdings and Index Composition (unaudited) :: 15
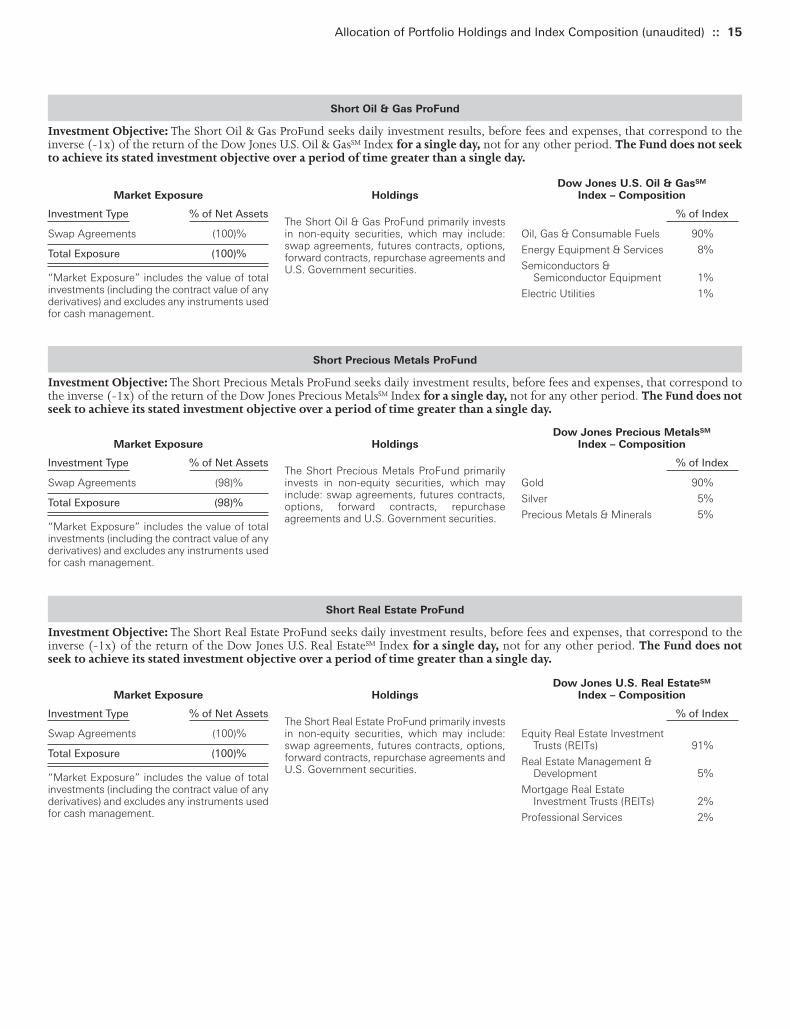
Short Oil & Gas ProFund
Investment Objective: The Short Oil & Gas ProFund seeks daily investment results, before fees and expenses, that correspond to theinverse (-1x) of the return of the Dow Jones U.S. Oil & GasSM Index for a single day, not for any other period. The Fund does not seekto achieve its stated investment objective over a period of time greater than a single day.
Market Exposure
Investment Type % of Net Assets
Swap Agreements (100)%
Total Exposure (100)%
“Market Exposure” includes the value of totalinvestments (including the contract value of anyderivatives) and excludes any instruments usedfor cash management.
Holdings
The Short Oil & Gas ProFund primarily investsin non-equity securities, which may include:swap agreements, futures contracts, options,forward contracts, repurchase agreements andU.S. Government securities.
Dow Jones U.S. Oil & GasSM
Index – Composition
% of Index
Oil, Gas & Consumable Fuels 90%
Energy Equipment & Services 8%
Semiconductors & Semiconductor Equipment 1%
Electric Utilities 1%
Short Precious Metals ProFund
Investment Objective: The Short Precious Metals ProFund seeks daily investment results, before fees and expenses, that correspond tothe inverse (-1x) of the return of the Dow Jones Precious MetalsSM Index for a single day, not for any other period. The Fund does notseek to achieve its stated investment objective over a period of time greater than a single day.
Market Exposure
Investment Type % of Net Assets
Swap Agreements (98)%
Total Exposure (98)%
“Market Exposure” includes the value of totalinvestments (including the contract value of anyderivatives) and excludes any instruments usedfor cash management.
Holdings
The Short Precious Metals ProFund primarilyinvests in non-equity securities, which mayinclude: swap agreements, futures contracts,options, forward contracts, repurchaseagreements and U.S. Government securities.
Dow Jones Precious MetalsSM
Index – Composition
% of Index
Gold 90%
Silver 5%
Precious Metals & Minerals 5%
Short Real Estate ProFund
Investment Objective: The Short Real Estate ProFund seeks daily investment results, before fees and expenses, that correspond to theinverse (-1x) of the return of the Dow Jones U.S. Real EstateSM Index for a single day, not for any other period. The Fund does notseek to achieve its stated investment objective over a period of time greater than a single day.
Market Exposure
Investment Type % of Net Assets
Swap Agreements (100)%
Total Exposure (100)%
“Market Exposure” includes the value of totalinvestments (including the contract value of anyderivatives) and excludes any instruments usedfor cash management.
Holdings
The Short Real Estate ProFund primarily investsin non-equity securities, which may include:swap agreements, futures contracts, options,forward contracts, repurchase agreements andU.S. Government securities.
Dow Jones U.S. Real EstateSM
Index – Composition
% of Index
Equity Real Estate Investment Trusts (REITs) 91%
Real Estate Management & Development 5%
Mortgage Real Estate Investment Trusts (REITs) 2%
Professional Services 2%
Toppan Merrill - ProFunds Public Semi-Annual Report [Funds] 01-31-2022 ED [AUX] | akiesli | 29-Mar-22 08:42 | 22-1296-2.ca | Sequence: 13CHKSUM Content: 23928 Layout: 17567 Graphics: 0 CLEAN
JOB: 22-1296-2 CYCLE#;BL#: 8; 0 TRIM: 8.25" x 10.75" AS: New York: 212-620-5600COLORS: ~note-color 2, Black, ~note-color 3 GRAPHICS: none V1.5
16 :: Allocation of Portfolio Holdings and Index Composition (unaudited)
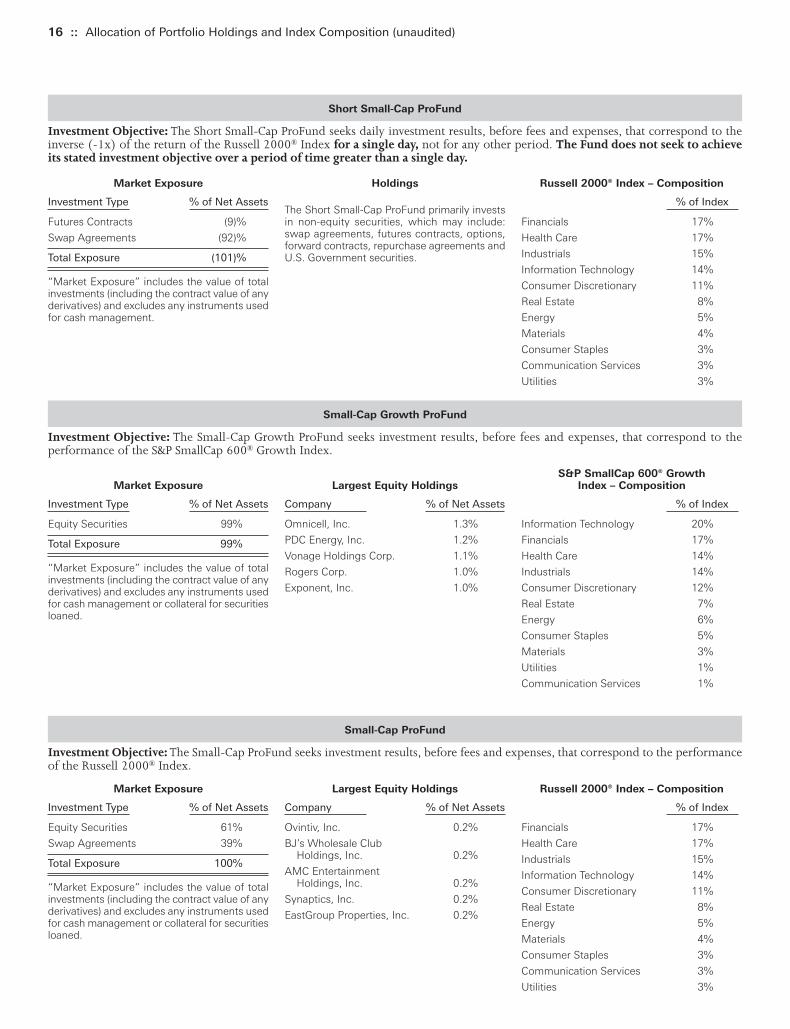
Short Small-Cap ProFund
Investment Objective: The Short Small-Cap ProFund seeks daily investment results, before fees and expenses, that correspond to theinverse (-1x) of the return of the Russell 2000® Index for a single day, not for any other period. The Fund does not seek to achieveits stated investment objective over a period of time greater than a single day.
Market Exposure
Investment Type % of Net Assets
Futures Contracts (9)%
Swap Agreements (92)%
Total Exposure (101)%
“Market Exposure” includes the value of totalinvestments (including the contract value of anyderivatives) and excludes any instruments usedfor cash management.
Holdings
The Short Small-Cap ProFund primarily investsin non-equity securities, which may include:swap agreements, futures contracts, options,forward contracts, repurchase agreements andU.S. Government securities.
Russell 2000® Index – Composition
% of Index
Financials 17%
Health Care 17%
Industrials 15%
Information Technology 14%
Consumer Discretionary 11%
Real Estate 8%
Energy 5%
Materials 4%
Consumer Staples 3%
Communication Services 3%
Utilities 3%
Small-Cap Growth ProFund
Investment Objective: The Small-Cap Growth ProFund seeks investment results, before fees and expenses, that correspond to theperformance of the S&P SmallCap 600® Growth Index.
Market Exposure
Investment Type % of Net Assets
Equity Securities 99%
Total Exposure 99%
“Market Exposure” includes the value of totalinvestments (including the contract value of anyderivatives) and excludes any instruments usedfor cash management or collateral for securitiesloaned.
Largest Equity Holdings
Company % of Net Assets
Omnicell, Inc. 1.3%
PDC Energy, Inc. 1.2%
Vonage Holdings Corp. 1.1%
Rogers Corp. 1.0%
Exponent, Inc. 1.0%
S&P SmallCap 600® GrowthIndex – Composition
% of Index
Information Technology 20%
Financials 17%
Health Care 14%
Industrials 14%
Consumer Discretionary 12%
Real Estate 7%
Energy 6%
Consumer Staples 5%
Materials 3%
Utilities 1%
Communication Services 1%
Small-Cap ProFund
Investment Objective: The Small-Cap ProFund seeks investment results, before fees and expenses, that correspond to the performanceof the Russell 2000® Index.
Market Exposure
Investment Type % of Net Assets
Equity Securities 61%
Swap Agreements 39%
Total Exposure 100%
“Market Exposure” includes the value of totalinvestments (including the contract value of anyderivatives) and excludes any instruments usedfor cash management or collateral for securitiesloaned.
Largest Equity Holdings
Company % of Net Assets
Ovintiv, Inc. 0.2%
BJ’s Wholesale Club Holdings, Inc. 0.2%
AMC Entertainment Holdings, Inc. 0.2%
Synaptics, Inc. 0.2%
EastGroup Properties, Inc. 0.2%
Russell 2000® Index – Composition
% of Index
Financials 17%
Health Care 17%
Industrials 15%
Information Technology 14%
Consumer Discretionary 11%
Real Estate 8%
Energy 5%
Materials 4%
Consumer Staples 3%
Communication Services 3%
Utilities 3%
Toppan Merrill - ProFunds Public Semi-Annual Report [Funds] 01-31-2022 ED [AUX] | akiesli | 29-Mar-22 08:42 | 22-1296-2.ca | Sequence: 14CHKSUM Content: 25893 Layout: 37902 Graphics: 0 CLEAN
JOB: 22-1296-2 CYCLE#;BL#: 8; 0 TRIM: 8.25" x 10.75" AS: New York: 212-620-5600COLORS: ~note-color 2, Black, ~note-color 3 GRAPHICS: none V1.5
Allocation of Portfolio Holdings and Index Composition (unaudited) :: 17
Small-Cap Value ProFund
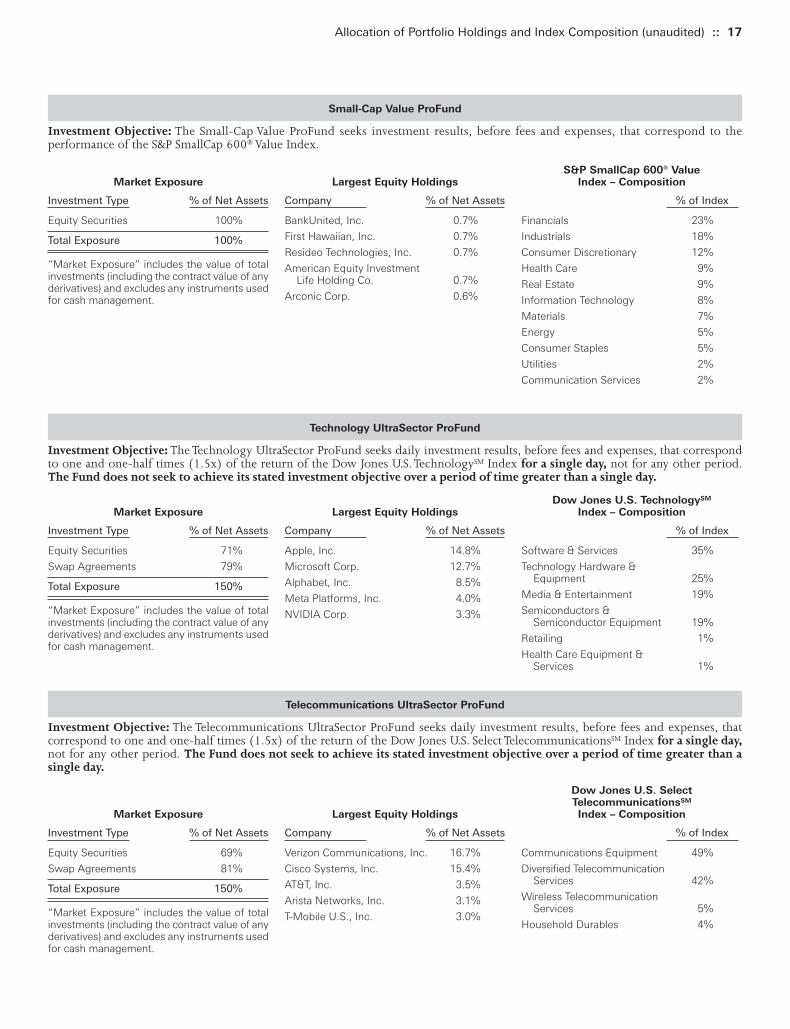
Investment Objective: The Small-Cap Value ProFund seeks investment results, before fees and expenses, that correspond to theperformance of the S&P SmallCap 600® Value Index.
Market Exposure
Investment Type % of Net Assets
Equity Securities 100%
Total Exposure 100%
“Market Exposure” includes the value of totalinvestments (including the contract value of anyderivatives) and excludes any instruments usedfor cash management.
Largest Equity Holdings
Company % of Net Assets
BankUnited, Inc. 0.7%
First Hawaiian, Inc. 0.7%
Resideo Technologies, Inc. 0.7%
American Equity Investment Life Holding Co. 0.7%
Arconic Corp. 0.6%
S&P SmallCap 600® ValueIndex – Composition
% of Index
Financials 23%
Industrials 18%
Consumer Discretionary 12%
Health Care 9%
Real Estate 9%
Information Technology 8%
Materials 7%
Energy 5%
Consumer Staples 5%
Utilities 2%
Communication Services 2%
Technology UltraSector ProFund
Investment Objective: The Technology UltraSector ProFund seeks daily investment results, before fees and expenses, that correspondto one and one-half times (1.5x) of the return of the Dow Jones U.S. TechnologySM Index for a single day, not for any other period.The Fund does not seek to achieve its stated investment objective over a period of time greater than a single day.
Market Exposure
Investment Type % of Net Assets
Equity Securities 71%
Swap Agreements 79%
Total Exposure 150%
“Market Exposure” includes the value of totalinvestments (including the contract value of anyderivatives) and excludes any instruments usedfor cash management.
Largest Equity Holdings
Company % of Net Assets
Apple, Inc. 14.8%
Microsoft Corp. 12.7%
Alphabet, Inc. 8.5%
Meta Platforms, Inc. 4.0%
NVIDIA Corp. 3.3%
Dow Jones U.S. TechnologySM
Index – Composition
% of Index
Software & Services 35%
Technology Hardware & Equipment 25%
Media & Entertainment 19%
Semiconductors & Semiconductor Equipment 19%
Retailing 1%
Health Care Equipment & Services 1%
Telecommunications UltraSector ProFund
Investment Objective: The Telecommunications UltraSector ProFund seeks daily investment results, before fees and expenses, thatcorrespond to one and one-half times (1.5x) of the return of the Dow Jones U.S. Select TelecommunicationsSM Index for a single day,not for any other period. The Fund does not seek to achieve its stated investment objective over a period of time greater than asingle day.
Market Exposure
Investment Type % of Net Assets
Equity Securities 69%
Swap Agreements 81%
Total Exposure 150%
“Market Exposure” includes the value of totalinvestments (including the contract value of anyderivatives) and excludes any instruments usedfor cash management.
Largest Equity Holdings
Company % of Net Assets
Verizon Communications, Inc. 16.7%
Cisco Systems, Inc. 15.4%
AT&T, Inc. 3.5%
Arista Networks, Inc. 3.1%
T-Mobile U.S., Inc. 3.0%
Dow Jones U.S. SelectTelecommunicationsSM
Index – Composition
% of Index
Communications Equipment 49%
Diversified TelecommunicationServices 42%
Wireless Telecommunication Services 5%
Household Durables 4%
Toppan Merrill - ProFunds Public Semi-Annual Report [Funds] 01-31-2022 ED [AUX] | akiesli | 29-Mar-22 08:42 | 22-1296-2.ca | Sequence: 15CHKSUM Content: 50506 Layout: 30689 Graphics: 0 CLEAN
JOB: 22-1296-2 CYCLE#;BL#: 8; 0 TRIM: 8.25" x 10.75" AS: New York: 212-620-5600COLORS: ~note-color 2, Black, ~note-color 3 GRAPHICS: none V1.5

18 :: Allocation of Portfolio Holdings and Index Composition (unaudited)
UltraBear ProFund
Investment Objective: the UltraBear ProFund seeks daily investment results, before fees and expenses, that correspond to two timesthe inverse (-2x) of the return of the S&P 500® for a single day, not for any other period. The Fund does not seek to achieve its statedinvestment objective over a period of time greater than a single day.
Market Exposure
Investment Type % of Net Assets
Swap Agreements (200)%
Total Exposure (200)%
“Market Exposure” includes the value of totalinvestments (including the contract value of anyderivatives) and excludes any instruments usedfor cash management.
Holdings
The UltraBear ProFund primarily invests in non-equity securities, which may include: swapagreements, futures contracts, options, forwardcontracts, repurchase agreements and U.S.Government securities.
S&P 500® – Composition
% of Index
Information Technology 28%
Health Care 13%
Consumer Discretionary 12%
Financials 11%
Communication Services 10%
Industrials 8%
Consumer Staples 6%
Energy 3%
Real Estate 3%
Utilities 3%
Materials 3%
UltraBull ProFund
Investment Objective: The UltraBull ProFund seeks daily investment results, before fees and expenses, that correspond to two times(2x) of the return of the S&P 500® for a single day, not for any other period. The Fund does not seek to achieve its stated investmentobjective over a period of time greater than a single day.
Market Exposure
Investment Type % of Net Assets
Equity Securities 77%
Swap Agreements 122%
Total Exposure 199%
“Market Exposure” includes the value of totalinvestments (including the contract value of anyderivatives) and excludes any instruments usedfor cash management or collateral for securitiesloaned.
Largest Equity Holdings
Company % of Net Assets
Apple, Inc. 5.5%
Microsoft Corp. 4.7%
Alphabet, Inc. 3.2%
Amazon.com, Inc. 2.6%
Tesla, Inc. 1.5%
S&P 500® – Composition
% of Index
Information Technology 28%
Health Care 13%
Consumer Discretionary 12%
Financials 11%
Communication Services 10%
Industrials 8%
Consumer Staples 6%
Energy 3%
Real Estate 3%
Utilities 3%
Materials 3%
UltraChina ProFund
Investment Objective: The UltraChina ProFund seeks daily investment results, before fees and expenses, that correspond to two times(2x) of the return of the S&P/BNY Mellon China Select ADR Index (USD) for a single day, not for any other period. The Fund doesnot seek to achieve its stated investment objective over a period of time greater than a single day.
Market Exposure
Investment Type % of Net Assets
Equity Securities 83%
Swap Agreements 119%
Total Exposure 202%
“Market Exposure” includes the value of totalinvestments (including the contract value of anyderivatives) and excludes any instruments usedfor cash management or collateral for securitiesloaned.
Largest Equity Holdings
Company % of Net Assets
Alibaba Group Holding, Ltd. 17.9%
JD.com, Inc. 9.8%
Baidu, Inc. 6.6%
NetEase, Inc. 5.6%
Pinduoduo, Inc. 3.8%
S&P/BNY Mellon China Select ADRIndex (USD) – Composition
Industry Breakdown % of Index
Consumer Discretionary 49%Communication Services 21%Energy 7%Health Care 5%Financials 5%Industrials 4%Information Technology 4%Real Estate 3%Materials 1%Utilities 1%
Country Composition
China 99%Singapore 1%
Toppan Merrill - ProFunds Public Semi-Annual Report [Funds] 01-31-2022 ED [AUX] | akiesli | 29-Mar-22 08:42 | 22-1296-2.ca | Sequence: 16CHKSUM Content: 5964 Layout: 16463 Graphics: 0 CLEAN
JOB: 22-1296-2 CYCLE#;BL#: 8; 0 TRIM: 8.25" x 10.75" AS: New York: 212-620-5600COLORS: ~note-color 2, Black, ~note-color 3 GRAPHICS: none V1.5

Allocation of Portfolio Holdings and Index Composition (unaudited) :: 19
UltraDow 30 ProFund
Investment Objective: The UltraDow 30 ProFund seeks daily investment results, before fees and expenses, that correspond to twotimes (2x) of the return of the Dow Jones Industrial Average® for a single day, not for any other period. The Fund does not seek toachieve its stated investment objective over a period of time greater than a single day.
Market Exposure
Investment Type % of Net Assets
Equity Securities 74%Futures Contracts 7%Swap Agreements 119%
Total Exposure 200%
“Market Exposure” includes the value of totalinvestments (including the contract value of anyderivatives) and excludes any instruments usedfor cash management.
Largest Equity Holdings
Company % of Net Assets
UnitedHealth Group, Inc. 6.6%
The Home Depot, Inc. 5.1%
The Goldman Sachs Group, Inc. 4.9%
Microsoft Corp. 4.3%
McDonald’s Corp. 3.6%
Dow Jones IndustrialAverage® – Composition
% of Index
Information Technology 22%Health Care 18%Financials 16%Consumer Discretionary 15%Industrials 14%Consumer Staples 8%Communication Services 4%Energy 2%Materials 1%
UltraEmerging Markets ProFund
Investment Objective: The UltraEmerging Markets ProFund seeks daily investment results, before fees and expenses, that correspond totwo times (2x) of the return of the S&P/BNY Mellon Emerging Markets 50 ADR Index (USD) for a single day, not for any other period.The Fund does not seek to achieve its stated investment objective over a period of time greater than a single day.
Market Exposure
Investment Type % of Net Assets
Equity Securities 84%
Swap Agreements 117%
Total Exposure 201%
“Market Exposure” includes the value of totalinvestments (including the contract value of anyderivatives) and excludes any instruments usedfor cash management or collateral for securitiesloaned.
Largest Equity Holdings
Company % of Net Assets
Taiwan Semiconductor Manufacturing Co., Ltd. 16.9%
Alibaba Group Holding, Ltd. 11.9%
HDFC Bank, Ltd. 4.8%
Infosys Technologies, Ltd. 4.4%
JD.com, Inc. 3.6%
S&P/BNY Mellon Emerging 50 ADRIndex (USD) – Composition
Industry Breakdown % of Index
Information Technology 28%Consumer Discretionary 25%Financials 16%Communication Services 10%Materials 10%Energy 5%Consumer Staples 2%Health Care 2%Industrials 1%Real Estate 1%Country Composition
China 35%Taiwan 24%India 17%Brazil 13%Other 11%
UltraInternational ProFund
Investment Objective: The UltraInternational ProFund seeks daily investment results, before fees and expenses, that correspond to twotimes (2x) of the return of the Morgan Stanley Capital International Europe, Australasia and Far East (“MSCI EAFE®”) Index for a singleday, not for any other period. The Fund does not seek to achieve its stated investment objective over a period of time greater thana single day.
Market Exposure
Investment Type % of Net Assets
Swap Agreements 200%
Total Exposure 200%
“Market Exposure” includes the value of totalinvestments (including the contract value of anyderivatives) and excludes any instruments usedfor cash management.
Holdings
The UltraInternational ProFund primarily investsin non-equity securities, which may include:swap agreements, futures contracts, options,forward contracts, repurchase agreements andU.S. Government securities.
MSCI EAFE® Index – Composition
Industry Breakdown % of Index
Financials 18%Industrials 15%Consumer Discretionary 13%Health Care 12%Consumer Staples 10%Information Technology 9%Materials 8%Communication Services 5%Energy 4%Utilities 3%Real Estate 3%Country Composition
Japan 22%United Kingdom 15%France 11%Switzerland 11%Germany 9%Other 32%
Toppan Merrill - ProFunds Public Semi-Annual Report [Funds] 01-31-2022 ED [AUX] | akiesli | 29-Mar-22 08:42 | 22-1296-2.ca | Sequence: 17CHKSUM Content: 7481 Layout: 14528 Graphics: 0 CLEAN
JOB: 22-1296-2 CYCLE#;BL#: 8; 0 TRIM: 8.25" x 10.75" AS: New York: 212-620-5600COLORS: ~note-color 2, Black, ~note-color 3 GRAPHICS: none V1.5
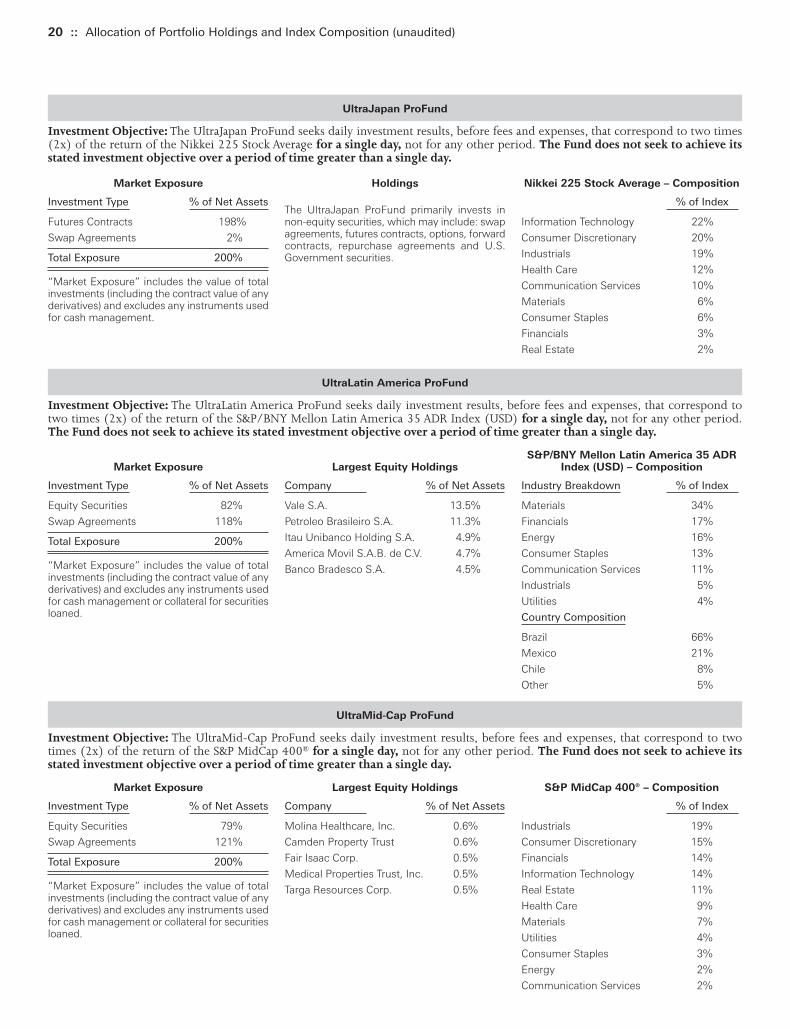
20 :: Allocation of Portfolio Holdings and Index Composition (unaudited)
UltraJapan ProFund
Investment Objective: The UltraJapan ProFund seeks daily investment results, before fees and expenses, that correspond to two times(2x) of the return of the Nikkei 225 Stock Average for a single day, not for any other period. The Fund does not seek to achieve itsstated investment objective over a period of time greater than a single day.
Market Exposure
Investment Type % of Net Assets
Futures Contracts 198%
Swap Agreements 2%
Total Exposure 200%
“Market Exposure” includes the value of totalinvestments (including the contract value of anyderivatives) and excludes any instruments usedfor cash management.
Holdings
The UltraJapan ProFund primarily invests innon-equity securities, which may include: swapagreements, futures contracts, options, forwardcontracts, repurchase agreements and U.S.Government securities.
Nikkei 225 Stock Average – Composition
% of Index
Information Technology 22%
Consumer Discretionary 20%
Industrials 19%
Health Care 12%
Communication Services 10%
Materials 6%
Consumer Staples 6%
Financials 3%
Real Estate 2%
UltraLatin America ProFund
Investment Objective: The UltraLatin America ProFund seeks daily investment results, before fees and expenses, that correspond totwo times (2x) of the return of the S&P/BNY Mellon Latin America 35 ADR Index (USD) for a single day, not for any other period.The Fund does not seek to achieve its stated investment objective over a period of time greater than a single day.
Market Exposure
Investment Type % of Net Assets
Equity Securities 82%
Swap Agreements 118%
Total Exposure 200%
“Market Exposure” includes the value of totalinvestments (including the contract value of anyderivatives) and excludes any instruments usedfor cash management or collateral for securitiesloaned.
Largest Equity Holdings
Company % of Net Assets
Vale S.A. 13.5%
Petroleo Brasileiro S.A. 11.3%
Itau Unibanco Holding S.A. 4.9%
America Movil S.A.B. de C.V. 4.7%
Banco Bradesco S.A. 4.5%
S&P/BNY Mellon Latin America 35 ADRIndex (USD) – Composition
Industry Breakdown % of Index
Materials 34%
Financials 17%
Energy 16%
Consumer Staples 13%
Communication Services 11%
Industrials 5%
Utilities 4%
Country Composition
Brazil 66%
Mexico 21%
Chile 8%
Other 5%
UltraMid-Cap ProFund
Investment Objective: The UltraMid-Cap ProFund seeks daily investment results, before fees and expenses, that correspond to twotimes (2x) of the return of the S&P MidCap 400® for a single day, not for any other period. The Fund does not seek to achieve itsstated investment objective over a period of time greater than a single day.
Market Exposure
Investment Type % of Net Assets
Equity Securities 79%
Swap Agreements 121%
Total Exposure 200%
“Market Exposure” includes the value of totalinvestments (including the contract value of anyderivatives) and excludes any instruments usedfor cash management or collateral for securitiesloaned.
Largest Equity Holdings
Company % of Net Assets
Molina Healthcare, Inc. 0.6%
Camden Property Trust 0.6%
Fair Isaac Corp. 0.5%
Medical Properties Trust, Inc. 0.5%
Targa Resources Corp. 0.5%
S&P MidCap 400® – Composition
% of Index
Industrials 19%
Consumer Discretionary 15%
Financials 14%
Information Technology 14%
Real Estate 11%
Health Care 9%
Materials 7%
Utilities 4%
Consumer Staples 3%
Energy 2%
Communication Services 2%
Toppan Merrill - ProFunds Public Semi-Annual Report [Funds] 01-31-2022 ED [AUX] | akiesli | 29-Mar-22 08:42 | 22-1296-2.ca | Sequence: 18CHKSUM Content: 20915 Layout: 33509 Graphics: 0 CLEAN
JOB: 22-1296-2 CYCLE#;BL#: 8; 0 TRIM: 8.25" x 10.75" AS: New York: 212-620-5600COLORS: ~note-color 2, Black, ~note-color 3 GRAPHICS: none V1.5
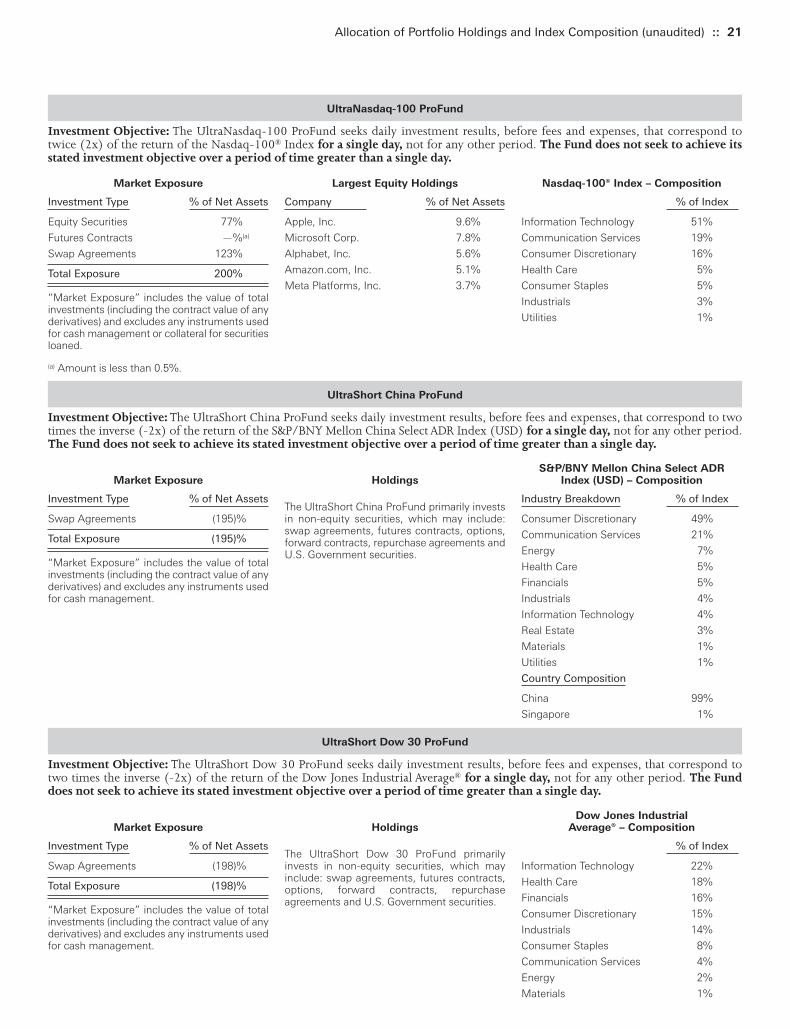
Allocation of Portfolio Holdings and Index Composition (unaudited) :: 21
UltraNasdaq-100 ProFund
Investment Objective: The UltraNasdaq-100 ProFund seeks daily investment results, before fees and expenses, that correspond totwice (2x) of the return of the Nasdaq-100® Index for a single day, not for any other period. The Fund does not seek to achieve itsstated investment objective over a period of time greater than a single day.
Market Exposure
Investment Type % of Net Assets
Equity Securities 77%
Futures Contracts —%(a)
Swap Agreements 123%
Total Exposure 200%
“Market Exposure” includes the value of totalinvestments (including the contract value of anyderivatives) and excludes any instruments usedfor cash management or collateral for securitiesloaned.
(a) Amount is less than 0.5%.
Largest Equity Holdings
Company % of Net Assets
Apple, Inc. 9.6%
Microsoft Corp. 7.8%
Alphabet, Inc. 5.6%
Amazon.com, Inc. 5.1%
Meta Platforms, Inc. 3.7%
Nasdaq-100® Index – Composition
% of Index
Information Technology 51%
Communication Services 19%
Consumer Discretionary 16%
Health Care 5%
Consumer Staples 5%
Industrials 3%
Utilities 1%
UltraShort China ProFund
Investment Objective: The UltraShort China ProFund seeks daily investment results, before fees and expenses, that correspond to twotimes the inverse (-2x) of the return of the S&P/BNY Mellon China Select ADR Index (USD) for a single day, not for any other period.The Fund does not seek to achieve its stated investment objective over a period of time greater than a single day.
Market Exposure
Investment Type % of Net Assets
Swap Agreements (195)%
Total Exposure (195)%
“Market Exposure” includes the value of totalinvestments (including the contract value of anyderivatives) and excludes any instruments usedfor cash management.
Holdings
The UltraShort China ProFund primarily investsin non-equity securities, which may include:swap agreements, futures contracts, options,forward contracts, repurchase agreements andU.S. Government securities.
S&P/BNY Mellon China Select ADR Index (USD) – Composition
Industry Breakdown % of Index
Consumer Discretionary 49%
Communication Services 21%
Energy 7%
Health Care 5%
Financials 5%
Industrials 4%
Information Technology 4%
Real Estate 3%
Materials 1%
Utilities 1%
Country Composition
China 99%
Singapore 1%
UltraShort Dow 30 ProFund
Investment Objective: The UltraShort Dow 30 ProFund seeks daily investment results, before fees and expenses, that correspond totwo times the inverse (-2x) of the return of the Dow Jones Industrial Average® for a single day, not for any other period. The Funddoes not seek to achieve its stated investment objective over a period of time greater than a single day.
Market Exposure
Investment Type % of Net Assets
Swap Agreements (198)%
Total Exposure (198)%
“Market Exposure” includes the value of totalinvestments (including the contract value of anyderivatives) and excludes any instruments usedfor cash management.
Holdings
The UltraShort Dow 30 ProFund primarilyinvests in non-equity securities, which mayinclude: swap agreements, futures contracts,options, forward contracts, repurchaseagreements and U.S. Government securities.
Dow Jones IndustrialAverage® – Composition
% of Index
Information Technology 22%
Health Care 18%
Financials 16%
Consumer Discretionary 15%
Industrials 14%
Consumer Staples 8%
Communication Services 4%
Energy 2%
Materials 1%
Toppan Merrill - ProFunds Public Semi-Annual Report [Funds] 01-31-2022 ED [AUX] | akiesli | 29-Mar-22 08:42 | 22-1296-2.ca | Sequence: 19CHKSUM Content: 35387 Layout: 17048 Graphics: 0 CLEAN
JOB: 22-1296-2 CYCLE#;BL#: 8; 0 TRIM: 8.25" x 10.75" AS: New York: 212-620-5600COLORS: ~note-color 2, Black, ~note-color 3 GRAPHICS: none V1.5
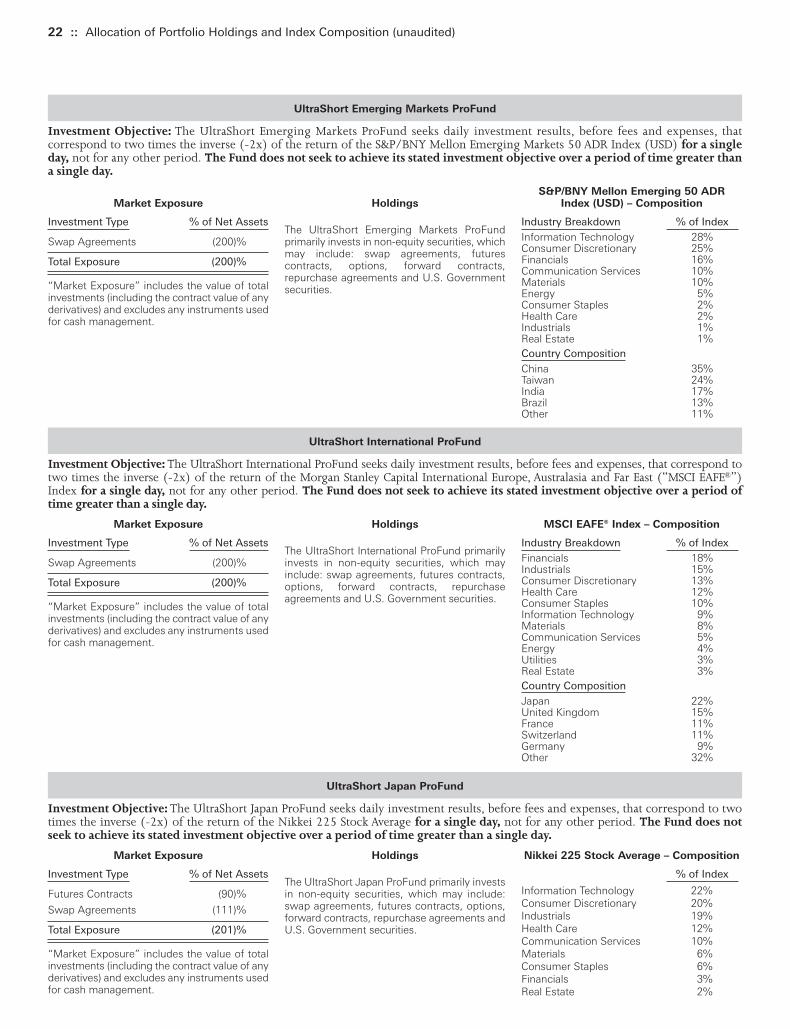
22 :: Allocation of Portfolio Holdings and Index Composition (unaudited)
UltraShort Emerging Markets ProFund
Investment Objective: The UltraShort Emerging Markets ProFund seeks daily investment results, before fees and expenses, thatcorrespond to two times the inverse (-2x) of the return of the S&P/BNY Mellon Emerging Markets 50 ADR Index (USD) for a singleday, not for any other period. The Fund does not seek to achieve its stated investment objective over a period of time greater thana single day.
Market Exposure
Investment Type % of Net Assets
Swap Agreements (200)%
Total Exposure (200)%
“Market Exposure” includes the value of totalinvestments (including the contract value of anyderivatives) and excludes any instruments usedfor cash management.
Holdings
The UltraShort Emerging Markets ProFundprimarily invests in non-equity securities, whichmay include: swap agreements, futurescontracts, options, forward contracts,repurchase agreements and U.S. Governmentsecurities.
S&P/BNY Mellon Emerging 50 ADRIndex (USD) – Composition
Industry Breakdown % of IndexInformation Technology 28%Consumer Discretionary 25%Financials 16%Communication Services 10%Materials 10%Energy 5%Consumer Staples 2%Health Care 2%Industrials 1%Real Estate 1%Country CompositionChina 35%Taiwan 24%India 17%Brazil 13%Other 11%
UltraShort International ProFund
Investment Objective: The UltraShort International ProFund seeks daily investment results, before fees and expenses, that correspond totwo times the inverse (-2x) of the return of the Morgan Stanley Capital International Europe, Australasia and Far East (“MSCI EAFE®”)Index for a single day, not for any other period. The Fund does not seek to achieve its stated investment objective over a period oftime greater than a single day.
Market Exposure
Investment Type % of Net Assets
Swap Agreements (200)%
Total Exposure (200)%
“Market Exposure” includes the value of totalinvestments (including the contract value of anyderivatives) and excludes any instruments usedfor cash management.
Holdings
The UltraShort International ProFund primarilyinvests in non-equity securities, which mayinclude: swap agreements, futures contracts,options, forward contracts, repurchaseagreements and U.S. Government securities.
MSCI EAFE® Index – Composition
Industry Breakdown % of IndexFinancials 18%Industrials 15%Consumer Discretionary 13%Health Care 12%Consumer Staples 10%Information Technology 9%Materials 8%Communication Services 5%Energy 4%Utilities 3%Real Estate 3%Country CompositionJapan 22%United Kingdom 15%France 11%Switzerland 11%Germany 9%Other 32%
UltraShort Japan ProFund
Investment Objective: The UltraShort Japan ProFund seeks daily investment results, before fees and expenses, that correspond to twotimes the inverse (-2x) of the return of the Nikkei 225 Stock Average for a single day, not for any other period. The Fund does notseek to achieve its stated investment objective over a period of time greater than a single day.
Market Exposure
Investment Type % of Net Assets
Futures Contracts (90)%
Swap Agreements (111)%
Total Exposure (201)%
“Market Exposure” includes the value of totalinvestments (including the contract value of anyderivatives) and excludes any instruments usedfor cash management.
Holdings
The UltraShort Japan ProFund primarily investsin non-equity securities, which may include:swap agreements, futures contracts, options,forward contracts, repurchase agreements andU.S. Government securities.
Nikkei 225 Stock Average – Composition
% of Index
Information Technology 22%Consumer Discretionary 20%Industrials 19%Health Care 12%Communication Services 10%Materials 6%Consumer Staples 6%Financials 3%Real Estate 2%
Toppan Merrill - ProFunds Public Semi-Annual Report [Funds] 01-31-2022 ED [AUX] | akiesli | 29-Mar-22 08:42 | 22-1296-2.ca | Sequence: 20CHKSUM Content: 64634 Layout: 7116 Graphics: 0 CLEAN
JOB: 22-1296-2 CYCLE#;BL#: 8; 0 TRIM: 8.25" x 10.75" AS: New York: 212-620-5600COLORS: ~note-color 2, Black, ~note-color 3 GRAPHICS: none V1.5

Allocation of Portfolio Holdings and Index Composition (unaudited) :: 23
UltraShort Latin America ProFund
Investment Objective: The UltraShort Latin America ProFund seeks daily investment results, before fees and expenses, that correspond totwo times the inverse (-2x) of the return of the S&P/BNY Mellon Latin America 35 ADR Index for a single day, not for any other period.The Fund does not seek to achieve its stated investment objective over a period of time greater than a single day.
Market Exposure
Investment Type % of Net Assets
Swap Agreements (200)%
Total Exposure (200)%
“Market Exposure” includes the value of totalinvestments (including the contract value of anyderivatives) and excludes any instruments usedfor cash management.
Holdings
The UltraShort Latin America ProFund primarilyinvests in non-equity securities, which mayinclude: swap agreements, futures contracts,options, forward contracts, repurchaseagreements and U.S. Government securities.
S&P/BNY Mellon Latin America 35 ADRIndex (USD) – Composition
Industry Breakdown % of Index
Materials 34%
Financials 17%
Energy 16%
Consumer Staples 13%
Communication Services 11%
Industrials 5%
Utilities 4%
Country Composition
Brazil 66%
Mexico 21%
Chile 8%
Other 5%
UltraShort Mid-Cap ProFund
Investment Objective: the UltraShort Mid-Cap ProFund seeks daily investment results, before fees and expenses, that correspond totwo times the inverse (-2x) of the return of the S&P MidCap 400® Index for a single day, not for any other period. The Fund does notseek to achieve its stated investment objective over a period of time greater than a single day.
Market Exposure
Investment Type % of Net Assets
Swap Agreements (201)%
Total Exposure (201)%
“Market Exposure” includes the value of totalinvestments (including the contract value of anyderivatives) and excludes any instruments usedfor cash management.
Holdings
The UltraShort Mid-Cap ProFund primarilyinvests in non-equity securities, which mayinclude: swap agreements, futures contracts,options, forward contracts, repurchaseagreements and U.S. Government securities.
S&P MidCap 400® – Composition
% of Index
Industrials 19%
Consumer Discretionary 15%
Financials 14%
Information Technology 14%
Real Estate 11%
Health Care 9%
Materials 7%
Utilities 4%
Consumer Staples 3%
Energy 2%
Communication Services 2%
UltraShort Nasdaq-100 ProFund
Investment Objective: The UltraShort Nasdaq-100 ProFund seeks daily investment results, before fees and expenses, that correspondto two times the inverse (-2x) of the return of the Nasdaq-100® Index for a single day, not for any other period. The Fund does notseek to achieve its stated investment objective over a period of time greater than a single day.
Market Exposure
Investment Type % of Net Assets
Swap Agreements (200)%
Total Exposure (200)%
“Market Exposure” includes the value of totalinvestments (including the contract value of anyderivatives) and excludes any instruments usedfor cash management.
Holdings
The UltraShort Nasdaq-100 ProFund primarilyinvests in non-equity securities, which mayinclude: swap agreements, futures contracts,options, forward contracts, repurchaseagreements and U.S. Government securities.
Nasdaq-100® Index – Composition
% of Index
Information Technology 51%
Communication Services 19%
Consumer Discretionary 16%
Health Care 5%
Consumer Staples 5%
Industrials 3%
Utilities 1%
Toppan Merrill - ProFunds Public Semi-Annual Report [Funds] 01-31-2022 ED [AUX] | akiesli | 29-Mar-22 08:42 | 22-1296-2.ca | Sequence: 21CHKSUM Content: 38305 Layout: 12668 Graphics: 0 CLEAN
JOB: 22-1296-2 CYCLE#;BL#: 8; 0 TRIM: 8.25" x 10.75" AS: New York: 212-620-5600COLORS: ~note-color 2, Black, ~note-color 3 GRAPHICS: none V1.5
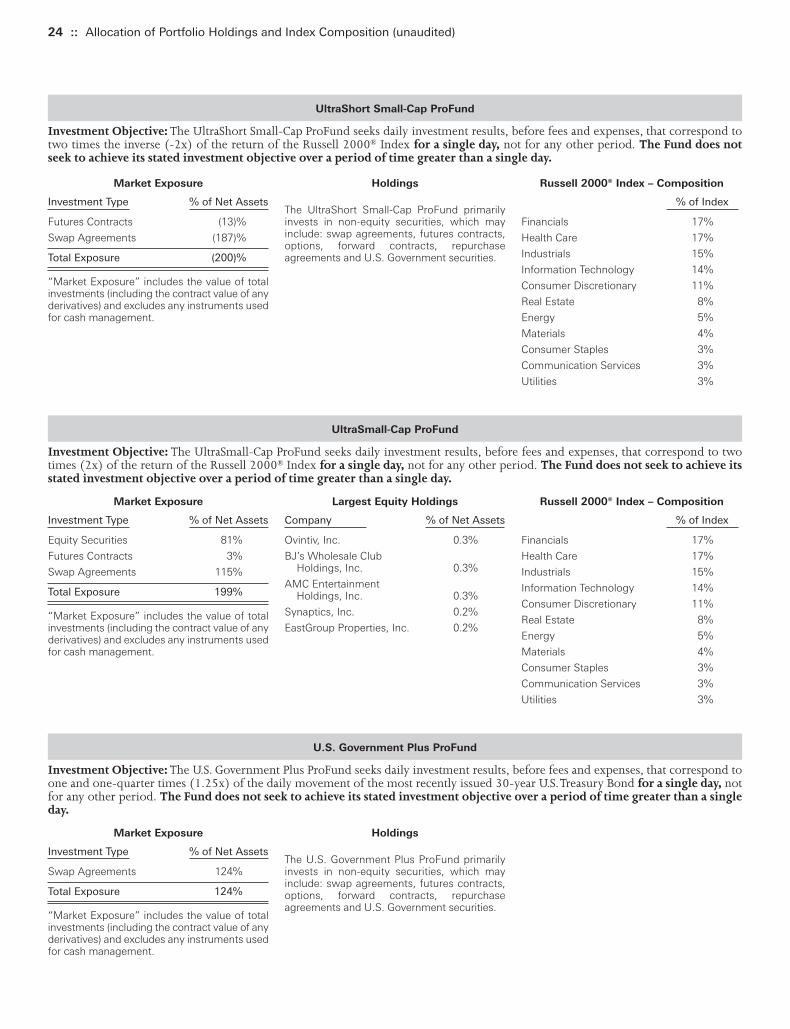
24 :: Allocation of Portfolio Holdings and Index Composition (unaudited)
UltraShort Small-Cap ProFund
Investment Objective: The UltraShort Small-Cap ProFund seeks daily investment results, before fees and expenses, that correspond totwo times the inverse (-2x) of the return of the Russell 2000® Index for a single day, not for any other period. The Fund does notseek to achieve its stated investment objective over a period of time greater than a single day.
Market Exposure
Investment Type % of Net Assets
Futures Contracts (13)%
Swap Agreements (187)%
Total Exposure (200)%
“Market Exposure” includes the value of totalinvestments (including the contract value of anyderivatives) and excludes any instruments usedfor cash management.
Holdings
The UltraShort Small-Cap ProFund primarilyinvests in non-equity securities, which mayinclude: swap agreements, futures contracts,options, forward contracts, repurchaseagreements and U.S. Government securities.
Russell 2000® Index – Composition
% of Index
Financials 17%
Health Care 17%
Industrials 15%
Information Technology 14%
Consumer Discretionary 11%
Real Estate 8%
Energy 5%
Materials 4%
Consumer Staples 3%
Communication Services 3%
Utilities 3%
UltraSmall-Cap ProFund
Investment Objective: The UltraSmall-Cap ProFund seeks daily investment results, before fees and expenses, that correspond to twotimes (2x) of the return of the Russell 2000® Index for a single day, not for any other period. The Fund does not seek to achieve itsstated investment objective over a period of time greater than a single day.
Market Exposure
Investment Type % of Net Assets
Equity Securities 81%
Futures Contracts 3%
Swap Agreements 115%
Total Exposure 199%
“Market Exposure” includes the value of totalinvestments (including the contract value of anyderivatives) and excludes any instruments usedfor cash management.
Largest Equity Holdings
Company % of Net Assets
Ovintiv, Inc. 0.3%
BJ’s Wholesale Club Holdings, Inc. 0.3%
AMC Entertainment Holdings, Inc. 0.3%
Synaptics, Inc. 0.2%
EastGroup Properties, Inc. 0.2%
Russell 2000® Index – Composition
% of Index
Financials 17%
Health Care 17%
Industrials 15%
Information Technology 14%
Consumer Discretionary 11%
Real Estate 8%
Energy 5%
Materials 4%
Consumer Staples 3%
Communication Services 3%
Utilities 3%
U.S. Government Plus ProFund
Investment Objective: The U.S. Government Plus ProFund seeks daily investment results, before fees and expenses, that correspond toone and one-quarter times (1.25x) of the daily movement of the most recently issued 30-year U.S. Treasury Bond for a single day, notfor any other period. The Fund does not seek to achieve its stated investment objective over a period of time greater than a singleday.
Market Exposure
Investment Type % of Net Assets
Swap Agreements 124%
Total Exposure 124%
“Market Exposure” includes the value of totalinvestments (including the contract value of anyderivatives) and excludes any instruments usedfor cash management.
Holdings
The U.S. Government Plus ProFund primarilyinvests in non-equity securities, which mayinclude: swap agreements, futures contracts,options, forward contracts, repurchaseagreements and U.S. Government securities.
Toppan Merrill - ProFunds Public Semi-Annual Report [Funds] 01-31-2022 ED [AUX] | akiesli | 29-Mar-22 08:42 | 22-1296-2.ca | Sequence: 22CHKSUM Content: 60873 Layout: 63346 Graphics: 0 CLEAN
JOB: 22-1296-2 CYCLE#;BL#: 8; 0 TRIM: 8.25" x 10.75" AS: New York: 212-620-5600COLORS: ~note-color 2, Black, ~note-color 3 GRAPHICS: none V1.5

Allocation of Portfolio Holdings and Index Composition (unaudited) :: 25
Utilities UltraSector ProFund
Investment Objective: The Utilities UltraSector ProFund seeks daily investment results, before fees and expenses, that correspond toone and one-half times (1.5x) of the return of the Dow Jones U.S. UtilitiesSM Index (the “Index”) for a single day, not for any otherperiod. The Fund does not seek to achieve its stated investment objective over a period of time greater than a single day.
Market Exposure
Investment Type % of Net Assets
Equity Securities 76%
Swap Agreements 74%
Total Exposure 150%
“Market Exposure” includes the value of totalinvestments (including the contract value of anyderivatives) and excludes any instruments usedfor cash management.
Largest Equity Holdings
Company % of Net Assets
NextEra Energy, Inc. 10.7%
Duke Energy Corp. 5.7%
The Southern Co. 5.1%
Dominion Energy, Inc. 4.6%
Exelon Corp. 4.0%
Dow Jones U.S. UtilitiesSM
Index – Composition
% of Index
Electric Utilities 60%
Multi-Utilities 29%
Gas Utilities 4%
Water Utilities 4%
Independent Power and Renewable Electricity Producers 3%
Toppan Merrill - ProFunds Public Semi-Annual Report [Funds] 01-31-2022 ED [AUX] | akiesli | 29-Mar-22 08:42 | 22-1296-2.ca | Sequence: 23CHKSUM Content: 60502 Layout: 19613 Graphics: 0 CLEAN
JOB: 22-1296-2 CYCLE#;BL#: 8; 0 TRIM: 8.25" x 10.75" AS: New York: 212-620-5600COLORS: ~note-color 2, Black, ~note-color 3 GRAPHICS: none V1.5

This Page Intentionally Left Blank
Toppan Merrill - ProFunds Public Semi-Annual Report [Funds] 01-31-2022 ED [AUX] | akiesli | 29-Mar-22 08:42 | 22-1296-2.cc | Sequence: 1CHKSUM Content: 40530 Layout: 29762 Graphics: 0 CLEAN
JOB: 22-1296-2 CYCLE#;BL#: 8; 0 TRIM: 8.25" x 10.75" AS: New York: 212-620-5600COLORS: Black, ~note-color 2 GRAPHICS: none V1.5

Expense Examples
Toppan Merrill - ProFunds Public Semi-Annual Report [Funds] 01-31-2022 ED [AUX] | akiesli | 29-Mar-22 08:42 | 22-1296-2.cc | Sequence: 2CHKSUM Content: 10028 Layout: 43900 Graphics: 0 CLEAN
JOB: 22-1296-2 CYCLE#;BL#: 8; 0 TRIM: 8.25" x 10.75" AS: New York: 212-620-5600COLORS: ~note-color 2, Black, ~note-color 3 GRAPHICS: none V1.5
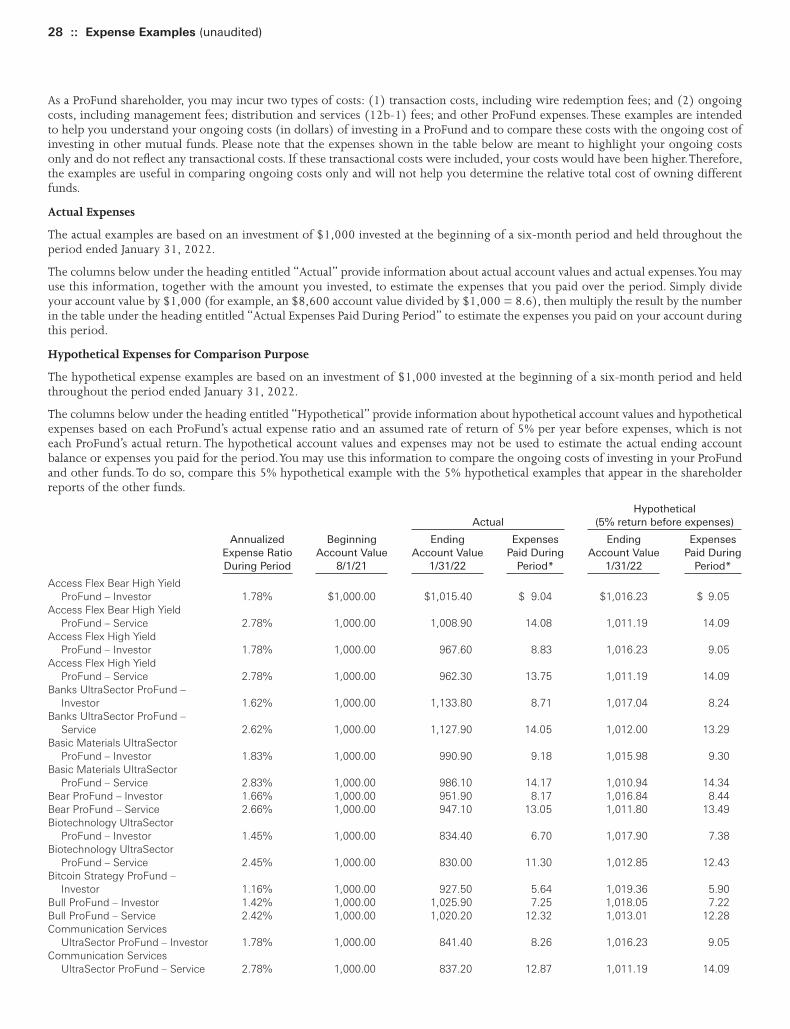
As a ProFund shareholder, you may incur two types of costs: (1) transaction costs, including wire redemption fees; and (2) ongoingcosts, including management fees; distribution and services (12b-1) fees; and other ProFund expenses. These examples are intendedto help you understand your ongoing costs (in dollars) of investing in a ProFund and to compare these costs with the ongoing cost ofinvesting in other mutual funds. Please note that the expenses shown in the table below are meant to highlight your ongoing costsonly and do not reflect any transactional costs. If these transactional costs were included, your costs would have been higher. Therefore,the examples are useful in comparing ongoing costs only and will not help you determine the relative total cost of owning differentfunds.
Actual Expenses
The actual examples are based on an investment of $1,000 invested at the beginning of a six-month period and held throughout theperiod ended January 31, 2022.
The columns below under the heading entitled “Actual” provide information about actual account values and actual expenses. You mayuse this information, together with the amount you invested, to estimate the expenses that you paid over the period. Simply divideyour account value by $1,000 (for example, an $8,600 account value divided by $1,000 = 8.6), then multiply the result by the numberin the table under the heading entitled “Actual Expenses Paid During Period” to estimate the expenses you paid on your account duringthis period.
Hypothetical Expenses for Comparison Purpose
The hypothetical expense examples are based on an investment of $1,000 invested at the beginning of a six-month period and heldthroughout the period ended January 31, 2022.
The columns below under the heading entitled “Hypothetical” provide information about hypothetical account values and hypotheticalexpenses based on each ProFund’s actual expense ratio and an assumed rate of return of 5% per year before expenses, which is noteach ProFund’s actual return. The hypothetical account values and expenses may not be used to estimate the actual ending accountbalance or expenses you paid for the period. You may use this information to compare the ongoing costs of investing in your ProFundand other funds. To do so, compare this 5% hypothetical example with the 5% hypothetical examples that appear in the shareholderreports of the other funds.
HypotheticalActual (5% return before expenses)
Annualized Beginning Ending Expenses Ending ExpensesExpense Ratio Account Value Account Value Paid During Account Value Paid DuringDuring Period 8/1/21 1/31/22 Period* 1/31/22 Period*
Access Flex Bear High Yield ProFund – Investor 1.78% $1,000.00 $1,015.40 $ 9.04 $1,016.23 $ 9.05
Access Flex Bear High Yield ProFund – Service 2.78% 1,000.00 1,008.90 14.08 1,011.19 14.09
Access Flex High Yield ProFund – Investor 1.78% 1,000.00 967.60 8.83 1,016.23 9.05
Access Flex High Yield ProFund – Service 2.78% 1,000.00 962.30 13.75 1,011.19 14.09
Banks UltraSector ProFund –Investor 1.62% 1,000.00 1,133.80 8.71 1,017.04 8.24
Banks UltraSector ProFund –Service 2.62% 1,000.00 1,127.90 14.05 1,012.00 13.29
Basic Materials UltraSector ProFund – Investor 1.83% 1,000.00 990.90 9.18 1,015.98 9.30
Basic Materials UltraSector ProFund – Service 2.83% 1,000.00 986.10 14.17 1,010.94 14.34
Bear ProFund – Investor 1.66% 1,000.00 951.90 8.17 1,016.84 8.44Bear ProFund – Service 2.66% 1,000.00 947.10 13.05 1,011.80 13.49Biotechnology UltraSector
ProFund – Investor 1.45% 1,000.00 834.40 6.70 1,017.90 7.38Biotechnology UltraSector
ProFund – Service 2.45% 1,000.00 830.00 11.30 1,012.85 12.43Bitcoin Strategy ProFund –
Investor 1.16% 1,000.00 927.50 5.64 1,019.36 5.90Bull ProFund – Investor 1.42% 1,000.00 1,025.90 7.25 1,018.05 7.22Bull ProFund – Service 2.42% 1,000.00 1,020.20 12.32 1,013.01 12.28Communication Services
UltraSector ProFund – Investor 1.78% 1,000.00 841.40 8.26 1,016.23 9.05Communication Services
UltraSector ProFund – Service 2.78% 1,000.00 837.20 12.87 1,011.19 14.09
28 :: Expense Examples (unaudited)
Toppan Merrill - ProFunds Public Semi-Annual Report [Funds] 01-31-2022 ED [AUX] | akiesli | 29-Mar-22 08:42 | 22-1296-2.cc | Sequence: 3CHKSUM Content: 30922 Layout: 52899 Graphics: 0 CLEAN
JOB: 22-1296-2 CYCLE#;BL#: 8; 0 TRIM: 8.25" x 10.75" AS: New York: 212-620-5600COLORS: Black, ~note-color 2 GRAPHICS: none V1.5
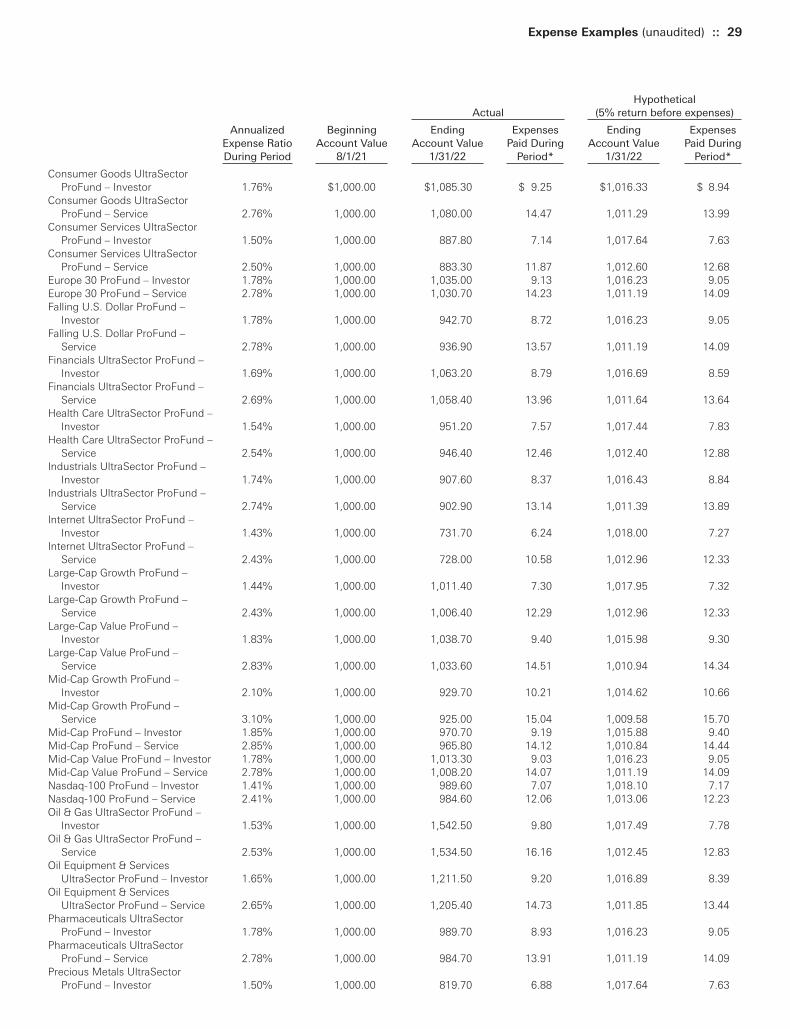
HypotheticalActual (5% return before expenses)
Annualized Beginning Ending Expenses Ending ExpensesExpense Ratio Account Value Account Value Paid During Account Value Paid DuringDuring Period 8/1/21 1/31/22 Period* 1/31/22 Period*
Consumer Goods UltraSector ProFund – Investor 1.76% $1,000.00 $1,085.30 $ 9.25 $1,016.33 $ 8.94
Consumer Goods UltraSector ProFund – Service 2.76% 1,000.00 1,080.00 14.47 1,011.29 13.99
Consumer Services UltraSector ProFund – Investor 1.50% 1,000.00 887.80 7.14 1,017.64 7.63
Consumer Services UltraSector ProFund – Service 2.50% 1,000.00 883.30 11.87 1,012.60 12.68
Europe 30 ProFund – Investor 1.78% 1,000.00 1,035.00 9.13 1,016.23 9.05Europe 30 ProFund – Service 2.78% 1,000.00 1,030.70 14.23 1,011.19 14.09Falling U.S. Dollar ProFund –
Investor 1.78% 1,000.00 942.70 8.72 1,016.23 9.05Falling U.S. Dollar ProFund –
Service 2.78% 1,000.00 936.90 13.57 1,011.19 14.09Financials UltraSector ProFund –
Investor 1.69% 1,000.00 1,063.20 8.79 1,016.69 8.59Financials UltraSector ProFund –
Service 2.69% 1,000.00 1,058.40 13.96 1,011.64 13.64Health Care UltraSector ProFund –
Investor 1.54% 1,000.00 951.20 7.57 1,017.44 7.83Health Care UltraSector ProFund –
Service 2.54% 1,000.00 946.40 12.46 1,012.40 12.88Industrials UltraSector ProFund –
Investor 1.74% 1,000.00 907.60 8.37 1,016.43 8.84Industrials UltraSector ProFund –
Service 2.74% 1,000.00 902.90 13.14 1,011.39 13.89Internet UltraSector ProFund –
Investor 1.43% 1,000.00 731.70 6.24 1,018.00 7.27Internet UltraSector ProFund –
Service 2.43% 1,000.00 728.00 10.58 1,012.96 12.33Large-Cap Growth ProFund –
Investor 1.44% 1,000.00 1,011.40 7.30 1,017.95 7.32Large-Cap Growth ProFund –
Service 2.43% 1,000.00 1,006.40 12.29 1,012.96 12.33Large-Cap Value ProFund –
Investor 1.83% 1,000.00 1,038.70 9.40 1,015.98 9.30Large-Cap Value ProFund –
Service 2.83% 1,000.00 1,033.60 14.51 1,010.94 14.34Mid-Cap Growth ProFund –
Investor 2.10% 1,000.00 929.70 10.21 1,014.62 10.66Mid-Cap Growth ProFund –
Service 3.10% 1,000.00 925.00 15.04 1,009.58 15.70Mid-Cap ProFund – Investor 1.85% 1,000.00 970.70 9.19 1,015.88 9.40Mid-Cap ProFund – Service 2.85% 1,000.00 965.80 14.12 1,010.84 14.44Mid-Cap Value ProFund – Investor 1.78% 1,000.00 1,013.30 9.03 1,016.23 9.05Mid-Cap Value ProFund – Service 2.78% 1,000.00 1,008.20 14.07 1,011.19 14.09Nasdaq-100 ProFund – Investor 1.41% 1,000.00 989.60 7.07 1,018.10 7.17Nasdaq-100 ProFund – Service 2.41% 1,000.00 984.60 12.06 1,013.06 12.23Oil & Gas UltraSector ProFund –
Investor 1.53% 1,000.00 1,542.50 9.80 1,017.49 7.78Oil & Gas UltraSector ProFund –
Service 2.53% 1,000.00 1,534.50 16.16 1,012.45 12.83Oil Equipment & Services
UltraSector ProFund – Investor 1.65% 1,000.00 1,211.50 9.20 1,016.89 8.39Oil Equipment & Services
UltraSector ProFund – Service 2.65% 1,000.00 1,205.40 14.73 1,011.85 13.44Pharmaceuticals UltraSector
ProFund – Investor 1.78% 1,000.00 989.70 8.93 1,016.23 9.05Pharmaceuticals UltraSector
ProFund – Service 2.78% 1,000.00 984.70 13.91 1,011.19 14.09Precious Metals UltraSector
ProFund – Investor 1.50% 1,000.00 819.70 6.88 1,017.64 7.63
Expense Examples (unaudited) :: 29
Toppan Merrill - ProFunds Public Semi-Annual Report [Funds] 01-31-2022 ED [AUX] | akiesli | 29-Mar-22 08:42 | 22-1296-2.cc | Sequence: 4CHKSUM Content: 7923 Layout: 30319 Graphics: 0 CLEAN
JOB: 22-1296-2 CYCLE#;BL#: 8; 0 TRIM: 8.25" x 10.75" AS: New York: 212-620-5600COLORS: Black, ~note-color 2 GRAPHICS: none V1.5
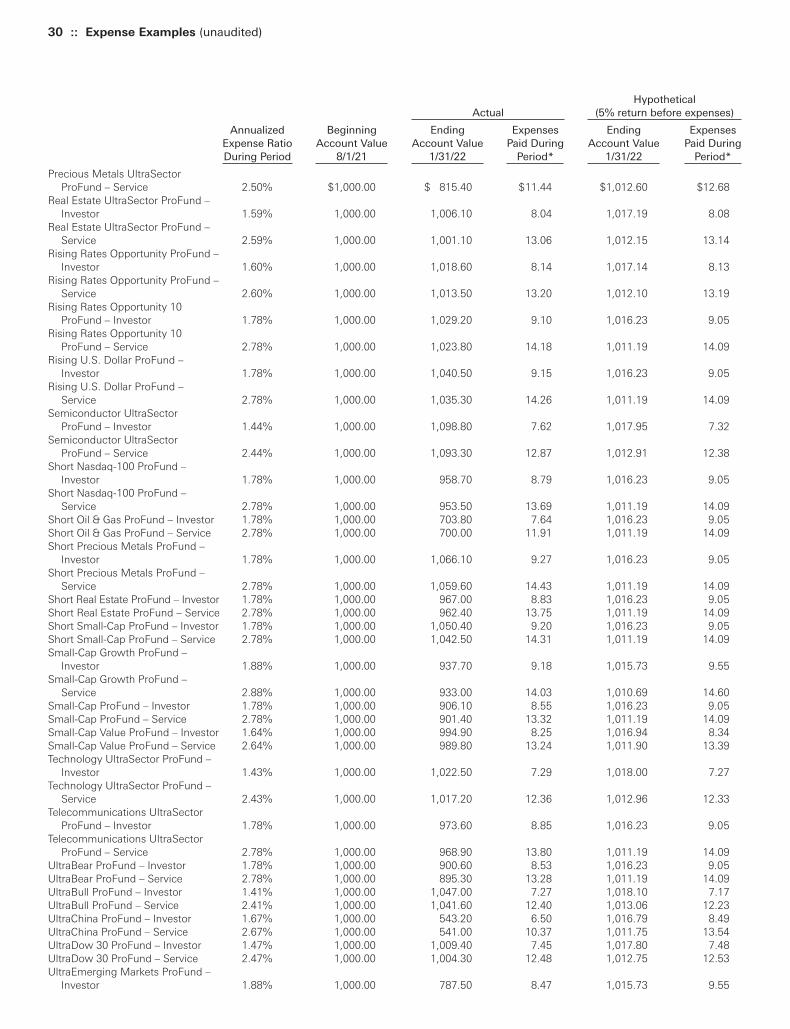
HypotheticalActual (5% return before expenses)
Annualized Beginning Ending Expenses Ending ExpensesExpense Ratio Account Value Account Value Paid During Account Value Paid DuringDuring Period 8/1/21 1/31/22 Period* 1/31/22 Period*
Precious Metals UltraSector ProFund – Service 2.50% $1,000.00 $ 815.40 $11.44 $1,012.60 $12.68
Real Estate UltraSector ProFund –Investor 1.59% 1,000.00 1,006.10 8.04 1,017.19 8.08
Real Estate UltraSector ProFund –Service 2.59% 1,000.00 1,001.10 13.06 1,012.15 13.14
Rising Rates Opportunity ProFund –Investor 1.60% 1,000.00 1,018.60 8.14 1,017.14 8.13
Rising Rates Opportunity ProFund –Service 2.60% 1,000.00 1,013.50 13.20 1,012.10 13.19
Rising Rates Opportunity 10 ProFund – Investor 1.78% 1,000.00 1,029.20 9.10 1,016.23 9.05
Rising Rates Opportunity 10 ProFund – Service 2.78% 1,000.00 1,023.80 14.18 1,011.19 14.09
Rising U.S. Dollar ProFund –Investor 1.78% 1,000.00 1,040.50 9.15 1,016.23 9.05
Rising U.S. Dollar ProFund –Service 2.78% 1,000.00 1,035.30 14.26 1,011.19 14.09
Semiconductor UltraSector ProFund – Investor 1.44% 1,000.00 1,098.80 7.62 1,017.95 7.32
Semiconductor UltraSector ProFund – Service 2.44% 1,000.00 1,093.30 12.87 1,012.91 12.38
Short Nasdaq-100 ProFund –Investor 1.78% 1,000.00 958.70 8.79 1,016.23 9.05
Short Nasdaq-100 ProFund –Service 2.78% 1,000.00 953.50 13.69 1,011.19 14.09
Short Oil & Gas ProFund – Investor 1.78% 1,000.00 703.80 7.64 1,016.23 9.05Short Oil & Gas ProFund – Service 2.78% 1,000.00 700.00 11.91 1,011.19 14.09Short Precious Metals ProFund –
Investor 1.78% 1,000.00 1,066.10 9.27 1,016.23 9.05Short Precious Metals ProFund –
Service 2.78% 1,000.00 1,059.60 14.43 1,011.19 14.09Short Real Estate ProFund – Investor 1.78% 1,000.00 967.00 8.83 1,016.23 9.05Short Real Estate ProFund – Service 2.78% 1,000.00 962.40 13.75 1,011.19 14.09Short Small-Cap ProFund – Investor 1.78% 1,000.00 1,050.40 9.20 1,016.23 9.05Short Small-Cap ProFund – Service 2.78% 1,000.00 1,042.50 14.31 1,011.19 14.09Small-Cap Growth ProFund –
Investor 1.88% 1,000.00 937.70 9.18 1,015.73 9.55Small-Cap Growth ProFund –
Service 2.88% 1,000.00 933.00 14.03 1,010.69 14.60Small-Cap ProFund – Investor 1.78% 1,000.00 906.10 8.55 1,016.23 9.05Small-Cap ProFund – Service 2.78% 1,000.00 901.40 13.32 1,011.19 14.09Small-Cap Value ProFund – Investor 1.64% 1,000.00 994.90 8.25 1,016.94 8.34Small-Cap Value ProFund – Service 2.64% 1,000.00 989.80 13.24 1,011.90 13.39Technology UltraSector ProFund –
Investor 1.43% 1,000.00 1,022.50 7.29 1,018.00 7.27Technology UltraSector ProFund –
Service 2.43% 1,000.00 1,017.20 12.36 1,012.96 12.33Telecommunications UltraSector
ProFund – Investor 1.78% 1,000.00 973.60 8.85 1,016.23 9.05Telecommunications UltraSector
ProFund – Service 2.78% 1,000.00 968.90 13.80 1,011.19 14.09UltraBear ProFund – Investor 1.78% 1,000.00 900.60 8.53 1,016.23 9.05UltraBear ProFund – Service 2.78% 1,000.00 895.30 13.28 1,011.19 14.09UltraBull ProFund – Investor 1.41% 1,000.00 1,047.00 7.27 1,018.10 7.17UltraBull ProFund – Service 2.41% 1,000.00 1,041.60 12.40 1,013.06 12.23UltraChina ProFund – Investor 1.67% 1,000.00 543.20 6.50 1,016.79 8.49UltraChina ProFund – Service 2.67% 1,000.00 541.00 10.37 1,011.75 13.54UltraDow 30 ProFund – Investor 1.47% 1,000.00 1,009.40 7.45 1,017.80 7.48UltraDow 30 ProFund – Service 2.47% 1,000.00 1,004.30 12.48 1,012.75 12.53UltraEmerging Markets ProFund –
Investor 1.88% 1,000.00 787.50 8.47 1,015.73 9.55
30 :: Expense Examples (unaudited)
Toppan Merrill - ProFunds Public Semi-Annual Report [Funds] 01-31-2022 ED [AUX] | akiesli | 29-Mar-22 08:42 | 22-1296-2.cc | Sequence: 5CHKSUM Content: 649 Layout: 4103 Graphics: 0 CLEAN
JOB: 22-1296-2 CYCLE#;BL#: 8; 0 TRIM: 8.25" x 10.75" AS: New York: 212-620-5600COLORS: Black, ~note-color 2 GRAPHICS: none V1.5
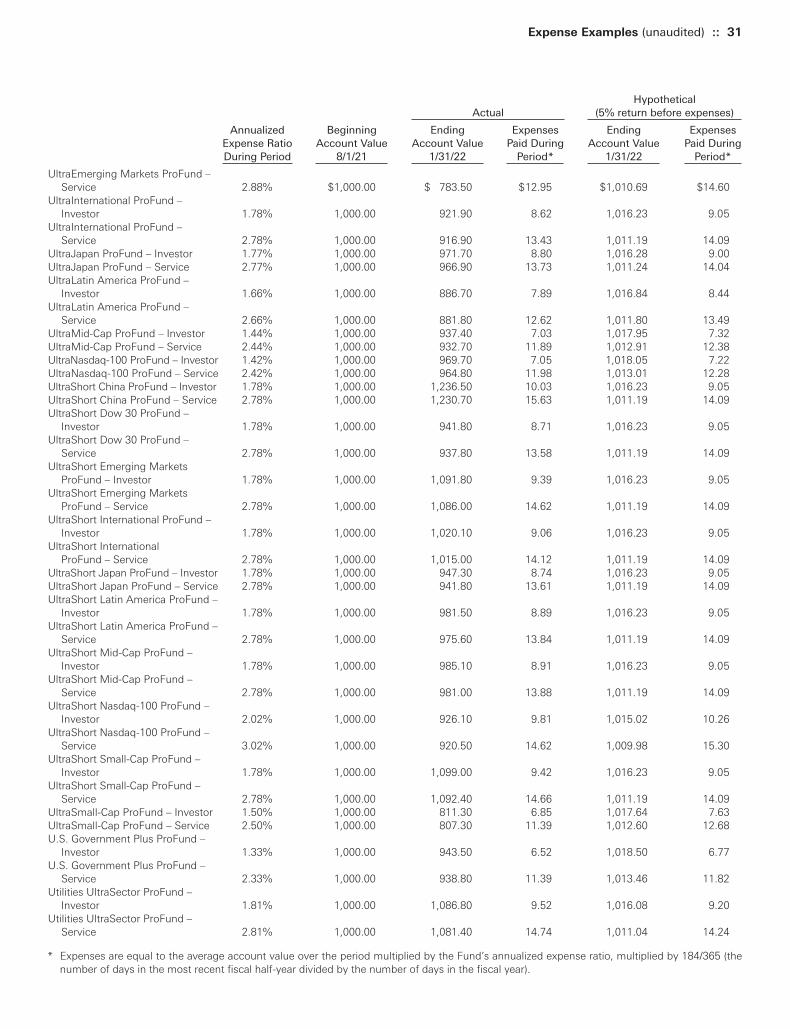
HypotheticalActual (5% return before expenses)
Annualized Beginning Ending Expenses Ending ExpensesExpense Ratio Account Value Account Value Paid During Account Value Paid DuringDuring Period 8/1/21 1/31/22 Period* 1/31/22 Period*
UltraEmerging Markets ProFund –Service 2.88% $1,000.00 $ 783.50 $12.95 $1,010.69 $14.60
UltraInternational ProFund –Investor 1.78% 1,000.00 921.90 8.62 1,016.23 9.05
UltraInternational ProFund –Service 2.78% 1,000.00 916.90 13.43 1,011.19 14.09
UltraJapan ProFund – Investor 1.77% 1,000.00 971.70 8.80 1,016.28 9.00UltraJapan ProFund – Service 2.77% 1,000.00 966.90 13.73 1,011.24 14.04UltraLatin America ProFund –
Investor 1.66% 1,000.00 886.70 7.89 1,016.84 8.44UltraLatin America ProFund –
Service 2.66% 1,000.00 881.80 12.62 1,011.80 13.49UltraMid-Cap ProFund – Investor 1.44% 1,000.00 937.40 7.03 1,017.95 7.32UltraMid-Cap ProFund – Service 2.44% 1,000.00 932.70 11.89 1,012.91 12.38UltraNasdaq-100 ProFund – Investor 1.42% 1,000.00 969.70 7.05 1,018.05 7.22UltraNasdaq-100 ProFund – Service 2.42% 1,000.00 964.80 11.98 1,013.01 12.28UltraShort China ProFund – Investor 1.78% 1,000.00 1,236.50 10.03 1,016.23 9.05UltraShort China ProFund – Service 2.78% 1,000.00 1,230.70 15.63 1,011.19 14.09UltraShort Dow 30 ProFund –
Investor 1.78% 1,000.00 941.80 8.71 1,016.23 9.05UltraShort Dow 30 ProFund –
Service 2.78% 1,000.00 937.80 13.58 1,011.19 14.09UltraShort Emerging Markets
ProFund – Investor 1.78% 1,000.00 1,091.80 9.39 1,016.23 9.05UltraShort Emerging Markets
ProFund – Service 2.78% 1,000.00 1,086.00 14.62 1,011.19 14.09UltraShort International ProFund –
Investor 1.78% 1,000.00 1,020.10 9.06 1,016.23 9.05UltraShort International
ProFund – Service 2.78% 1,000.00 1,015.00 14.12 1,011.19 14.09UltraShort Japan ProFund – Investor 1.78% 1,000.00 947.30 8.74 1,016.23 9.05UltraShort Japan ProFund – Service 2.78% 1,000.00 941.80 13.61 1,011.19 14.09UltraShort Latin America ProFund –
Investor 1.78% 1,000.00 981.50 8.89 1,016.23 9.05UltraShort Latin America ProFund –
Service 2.78% 1,000.00 975.60 13.84 1,011.19 14.09UltraShort Mid-Cap ProFund –
Investor 1.78% 1,000.00 985.10 8.91 1,016.23 9.05UltraShort Mid-Cap ProFund –
Service 2.78% 1,000.00 981.00 13.88 1,011.19 14.09UltraShort Nasdaq-100 ProFund –
Investor 2.02% 1,000.00 926.10 9.81 1,015.02 10.26UltraShort Nasdaq-100 ProFund –
Service 3.02% 1,000.00 920.50 14.62 1,009.98 15.30UltraShort Small-Cap ProFund –
Investor 1.78% 1,000.00 1,099.00 9.42 1,016.23 9.05UltraShort Small-Cap ProFund –
Service 2.78% 1,000.00 1,092.40 14.66 1,011.19 14.09UltraSmall-Cap ProFund – Investor 1.50% 1,000.00 811.30 6.85 1,017.64 7.63UltraSmall-Cap ProFund – Service 2.50% 1,000.00 807.30 11.39 1,012.60 12.68U.S. Government Plus ProFund –
Investor 1.33% 1,000.00 943.50 6.52 1,018.50 6.77U.S. Government Plus ProFund –
Service 2.33% 1,000.00 938.80 11.39 1,013.46 11.82Utilities UltraSector ProFund –
Investor 1.81% 1,000.00 1,086.80 9.52 1,016.08 9.20Utilities UltraSector ProFund –
Service 2.81% 1,000.00 1,081.40 14.74 1,011.04 14.24
* Expenses are equal to the average account value over the period multiplied by the Fund’s annualized expense ratio, multiplied by 184/365 (thenumber of days in the most recent fiscal half-year divided by the number of days in the fiscal year).
Expense Examples (unaudited) :: 31
Toppan Merrill - ProFunds Public Semi-Annual Report [Funds] 01-31-2022 ED [AUX] | akiesli | 29-Mar-22 08:42 | 22-1296-2.cc | Sequence: 6CHKSUM Content: 31620 Layout: 2934 Graphics: 0 CLEAN
JOB: 22-1296-2 CYCLE#;BL#: 8; 0 TRIM: 8.25" x 10.75" AS: New York: 212-620-5600COLORS: Black, ~note-color 2 GRAPHICS: none V1.5

This Page Intentionally Left Blank
Toppan Merrill - ProFunds Public Semi-Annual Report [Funds] 01-31-2022 ED [AUX] | akiesli | 29-Mar-22 08:42 | 22-1296-2.da | Sequence: 1CHKSUM Content: 40530 Layout: 21608 Graphics: 0 CLEAN
JOB: 22-1296-2 CYCLE#;BL#: 8; 0 TRIM: 8.25" x 10.75" AS: New York: 212-620-5600COLORS: Black, ~note-color 2 GRAPHICS: none V1.5

Schedules of Portfolio Investments
Toppan Merrill - ProFunds Public Semi-Annual Report [Funds] 01-31-2022 ED [AUX] | akiesli | 29-Mar-22 08:42 | 22-1296-2.da | Sequence: 2CHKSUM Content: 64633 Layout: 45663 Graphics: 0 CLEAN
JOB: 22-1296-2 CYCLE#;BL#: 8; 0 TRIM: 8.25" x 10.75" AS: New York: 212-620-5600COLORS: Black, ~note-color 2 GRAPHICS: none V1.5
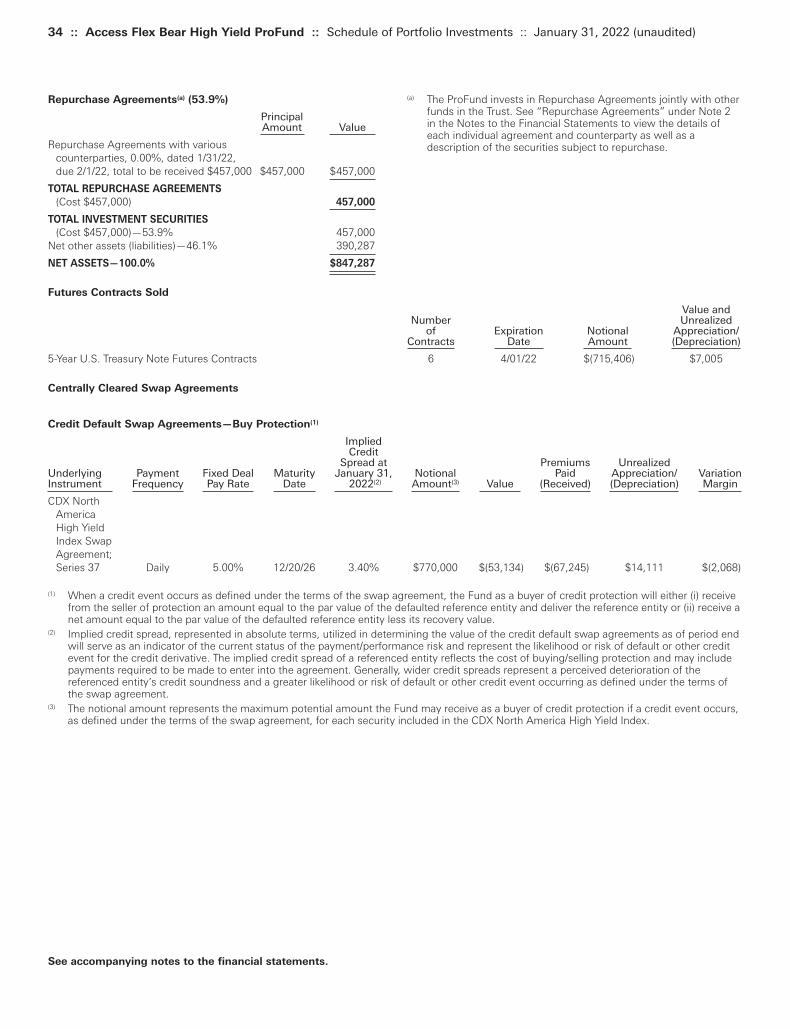
34 :: Access Flex Bear High Yield ProFund :: Schedule of Portfolio Investments :: January 31, 2022 (unaudited)
(a) The ProFund invests in Repurchase Agreements jointly with otherfunds in the Trust. See “Repurchase Agreements” under Note 2in the Notes to the Financial Statements to view the details ofeach individual agreement and counterparty as well as adescription of the securities subject to repurchase.
Repurchase Agreements(a) (53.9%)
PrincipalAmount Value
Repurchase Agreements with various counterparties, 0.00%, dated 1/31/22, due 2/1/22, total to be received $457,000 $457,000 $457,000
TOTAL REPURCHASE AGREEMENTS
(Cost $457,000) 457,000
TOTAL INVESTMENT SECURITIES
(Cost $457,000)—53.9% 457,000Net other assets (liabilities)—46.1% 390,287
NET ASSETS—100.0% $847,287
See accompanying notes to the financial statements.
Futures Contracts Sold
Value and Number Unrealized
of Expiration Notional Appreciation/Contracts Date Amount (Depreciation)
5-Year U.S. Treasury Note Futures Contracts 6 4/01/22 $(715,406) $7,005
Centrally Cleared Swap Agreements
Credit Default Swap Agreements—Buy Protection(1)
Implied Credit Spread at Premiums UnrealizedUnderlying Payment Fixed Deal Maturity January 31, Notional Paid Appreciation/ VariationInstrument Frequency Pay Rate Date 2022(2) Amount(3) Value (Received) (Depreciation) Margin CDX North
America High Yield Index SwapAgreement; Series 37 Daily 5.00% 12/20/26 3.40% $770,000 $(53,134) $(67,245) $14,111 $(2,068)
(1) When a credit event occurs as defined under the terms of the swap agreement, the Fund as a buyer of credit protection will either (i) receivefrom the seller of protection an amount equal to the par value of the defaulted reference entity and deliver the reference entity or (ii) receive anet amount equal to the par value of the defaulted reference entity less its recovery value.
(2) Implied credit spread, represented in absolute terms, utilized in determining the value of the credit default swap agreements as of period endwill serve as an indicator of the current status of the payment/performance risk and represent the likelihood or risk of default or other creditevent for the credit derivative. The implied credit spread of a referenced entity reflects the cost of buying/selling protection and may includepayments required to be made to enter into the agreement. Generally, wider credit spreads represent a perceived deterioration of thereferenced entity’s credit soundness and a greater likelihood or risk of default or other credit event occurring as defined under the terms ofthe swap agreement.
(3) The notional amount represents the maximum potential amount the Fund may receive as a buyer of credit protection if a credit event occurs,as defined under the terms of the swap agreement, for each security included in the CDX North America High Yield Index.
Toppan Merrill - ProFunds Public Semi-Annual Report [Funds] 01-31-2022 ED [AUX] | akiesli | 29-Mar-22 08:42 | 22-1296-2.da | Sequence: 3CHKSUM Content: 16344 Layout: 24068 Graphics: 0 CLEAN
JOB: 22-1296-2 CYCLE#;BL#: 8; 0 TRIM: 8.25" x 10.75" AS: New York: 212-620-5600COLORS: ~note-color 2, Black, ~note-color 3 GRAPHICS: none V1.5
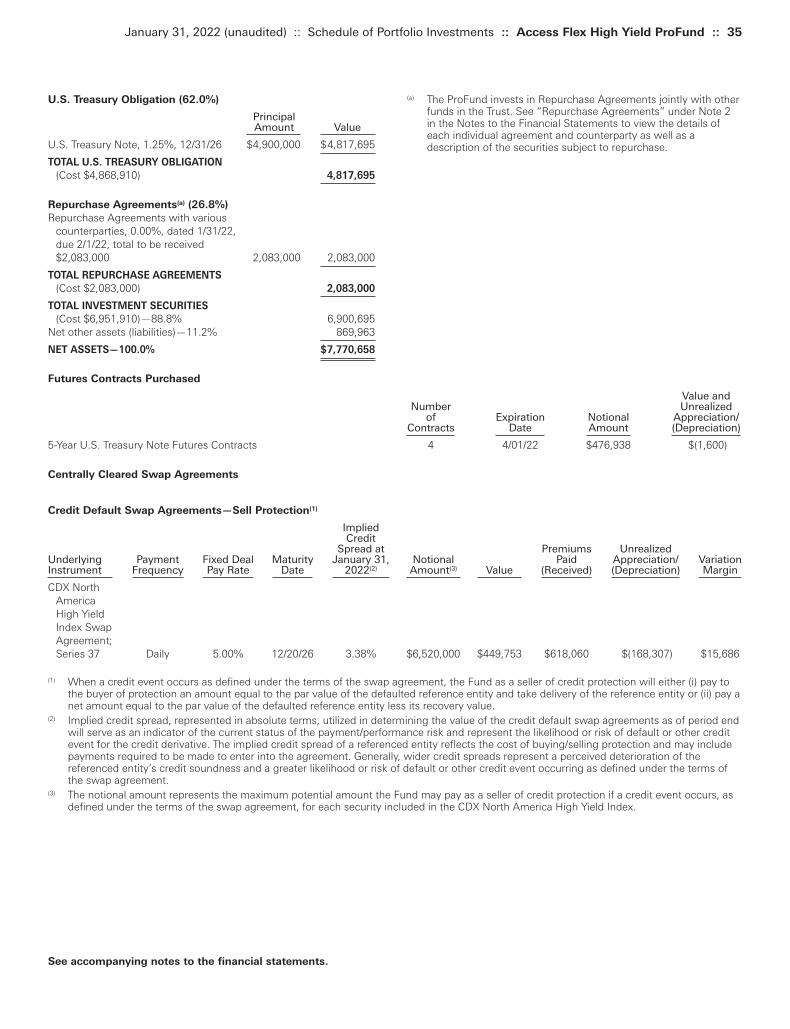
(a) The ProFund invests in Repurchase Agreements jointly with otherfunds in the Trust. See “Repurchase Agreements” under Note 2in the Notes to the Financial Statements to view the details ofeach individual agreement and counterparty as well as adescription of the securities subject to repurchase.
U.S. Treasury Obligation (62.0%)
Principal Amount Value
U.S. Treasury Note, 1.25%, 12/31/26 $4,900,000 $4,817,695
TOTAL U.S. TREASURY OBLIGATION
(Cost $4,868,910) 4,817,695
Repurchase Agreements(a) (26.8%)
Repurchase Agreements with various counterparties, 0.00%, dated 1/31/22, due 2/1/22, total to be received $2,083,000 2,083,000 2,083,000
TOTAL REPURCHASE AGREEMENTS
(Cost $2,083,000) 2,083,000
TOTAL INVESTMENT SECURITIES
(Cost $6,951,910)—88.8% 6,900,695Net other assets (liabilities)—11.2% 869,963
NET ASSETS—100.0% $7,770,658
January 31, 2022 (unaudited) :: Schedule of Portfolio Investments :: Access Flex High Yield ProFund :: 35
See accompanying notes to the financial statements.
Futures Contracts Purchased
Value and Number Unrealized
of Expiration Notional Appreciation/Contracts Date Amount (Depreciation)
5-Year U.S. Treasury Note Futures Contracts 4 4/01/22 $476,938 $(1,600)
Centrally Cleared Swap Agreements
Credit Default Swap Agreements—Sell Protection(1)
Implied Credit Spread at Premiums UnrealizedUnderlying Payment Fixed Deal Maturity January 31, Notional Paid Appreciation/ Variation Instrument Frequency Pay Rate Date 2022(2) Amount(3) Value (Received) (Depreciation) Margin CDX North
America High Yield Index Swap Agreement; Series 37 Daily 5.00% 12/20/26 3.38% $6,520,000 $449,753 $618,060 $(168,307) $15,686
(1) When a credit event occurs as defined under the terms of the swap agreement, the Fund as a seller of credit protection will either (i) pay tothe buyer of protection an amount equal to the par value of the defaulted reference entity and take delivery of the reference entity or (ii) pay anet amount equal to the par value of the defaulted reference entity less its recovery value.
(2) Implied credit spread, represented in absolute terms, utilized in determining the value of the credit default swap agreements as of period endwill serve as an indicator of the current status of the payment/performance risk and represent the likelihood or risk of default or other creditevent for the credit derivative. The implied credit spread of a referenced entity reflects the cost of buying/selling protection and may includepayments required to be made to enter into the agreement. Generally, wider credit spreads represent a perceived deterioration of thereferenced entity’s credit soundness and a greater likelihood or risk of default or other credit event occurring as defined under the terms ofthe swap agreement.
(3) The notional amount represents the maximum potential amount the Fund may pay as a seller of credit protection if a credit event occurs, asdefined under the terms of the swap agreement, for each security included in the CDX North America High Yield Index.
Toppan Merrill - ProFunds Public Semi-Annual Report [Funds] 01-31-2022 ED [AUX] | akiesli | 29-Mar-22 08:42 | 22-1296-2.da | Sequence: 4CHKSUM Content: 10142 Layout: 12734 Graphics: 0 CLEAN
JOB: 22-1296-2 CYCLE#;BL#: 8; 0 TRIM: 8.25" x 10.75" AS: New York: 212-620-5600COLORS: ~note-color 2, Black, ~note-color 3 GRAPHICS: none V1.5
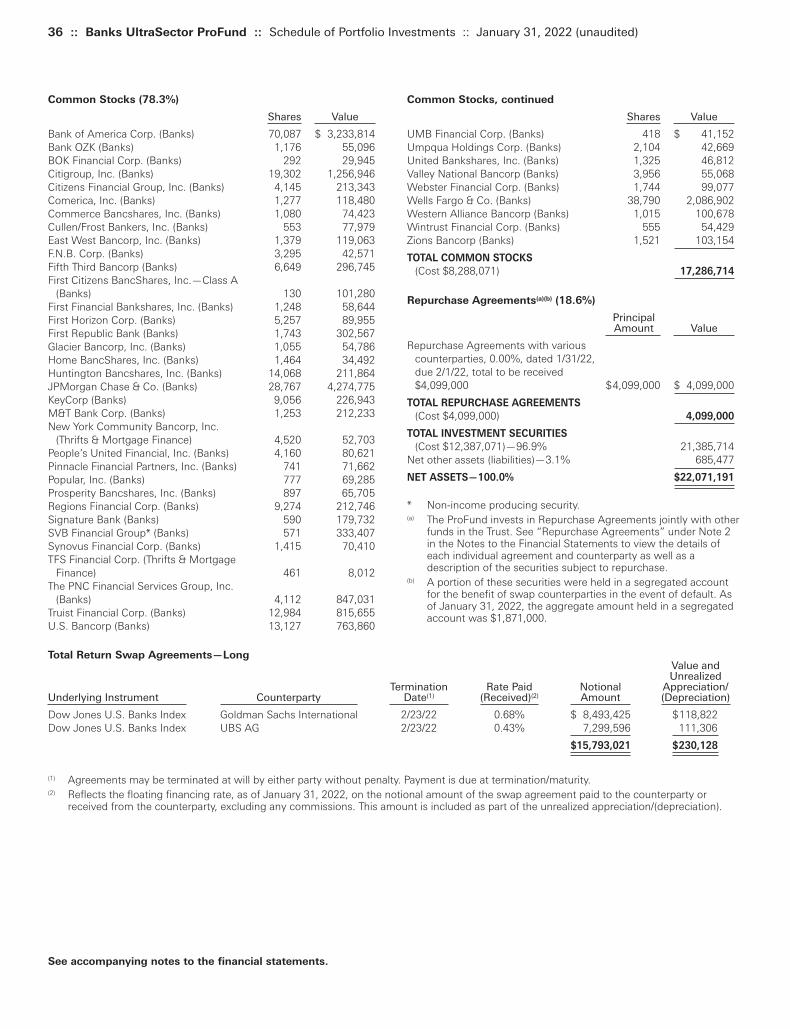
36 :: Banks UltraSector ProFund :: Schedule of Portfolio Investments :: January 31, 2022 (unaudited)
Common Stocks, continued
Shares Value UMB Financial Corp. (Banks) 418 $ 41,152Umpqua Holdings Corp. (Banks) 2,104 42,669United Bankshares, Inc. (Banks) 1,325 46,812Valley National Bancorp (Banks) 3,956 55,068Webster Financial Corp. (Banks) 1,744 99,077Wells Fargo & Co. (Banks) 38,790 2,086,902Western Alliance Bancorp (Banks) 1,015 100,678Wintrust Financial Corp. (Banks) 555 54,429Zions Bancorp (Banks) 1,521 103,154
TOTAL COMMON STOCKS
(Cost $8,288,071) 17,286,714
Repurchase Agreements(a)(b) (18.6%)
Principal Amount Value
Repurchase Agreements with various counterparties, 0.00%, dated 1/31/22, due 2/1/22, total to be received $4,099,000 $4,099,000 $ 4,099,000
TOTAL REPURCHASE AGREEMENTS
(Cost $4,099,000) 4,099,000
TOTAL INVESTMENT SECURITIES
(Cost $12,387,071)—96.9% 21,385,714Net other assets (liabilities)—3.1% 685,477
NET ASSETS—100.0% $22,071,191
* Non-income producing security.(a) The ProFund invests in Repurchase Agreements jointly with other
funds in the Trust. See “Repurchase Agreements” under Note 2in the Notes to the Financial Statements to view the details ofeach individual agreement and counterparty as well as adescription of the securities subject to repurchase.
(b) A portion of these securities were held in a segregated accountfor the benefit of swap counterparties in the event of default. Asof January 31, 2022, the aggregate amount held in a segregatedaccount was $1,871,000.
Common Stocks (78.3%)
Shares Value Bank of America Corp. (Banks) 70,087 $ 3,233,814Bank OZK (Banks) 1,176 55,096BOK Financial Corp. (Banks) 292 29,945Citigroup, Inc. (Banks) 19,302 1,256,946Citizens Financial Group, Inc. (Banks) 4,145 213,343Comerica, Inc. (Banks) 1,277 118,480Commerce Bancshares, Inc. (Banks) 1,080 74,423Cullen/Frost Bankers, Inc. (Banks) 553 77,979East West Bancorp, Inc. (Banks) 1,379 119,063F.N.B. Corp. (Banks) 3,295 42,571Fifth Third Bancorp (Banks) 6,649 296,745First Citizens BancShares, Inc.—Class A
(Banks) 130 101,280First Financial Bankshares, Inc. (Banks) 1,248 58,644First Horizon Corp. (Banks) 5,257 89,955First Republic Bank (Banks) 1,743 302,567Glacier Bancorp, Inc. (Banks) 1,055 54,786Home BancShares, Inc. (Banks) 1,464 34,492Huntington Bancshares, Inc. (Banks) 14,068 211,864JPMorgan Chase & Co. (Banks) 28,767 4,274,775KeyCorp (Banks) 9,056 226,943M&T Bank Corp. (Banks) 1,253 212,233New York Community Bancorp, Inc.
(Thrifts & Mortgage Finance) 4,520 52,703People’s United Financial, Inc. (Banks) 4,160 80,621Pinnacle Financial Partners, Inc. (Banks) 741 71,662Popular, Inc. (Banks) 777 69,285Prosperity Bancshares, Inc. (Banks) 897 65,705Regions Financial Corp. (Banks) 9,274 212,746Signature Bank (Banks) 590 179,732SVB Financial Group* (Banks) 571 333,407Synovus Financial Corp. (Banks) 1,415 70,410TFS Financial Corp. (Thrifts & Mortgage
Finance) 461 8,012The PNC Financial Services Group, Inc.
(Banks) 4,112 847,031Truist Financial Corp. (Banks) 12,984 815,655U.S. Bancorp (Banks) 13,127 763,860
See accompanying notes to the financial statements.
Total Return Swap Agreements—LongValue and Unrealized
Termination Rate Paid Notional Appreciation/Underlying Instrument Counterparty Date(1) (Received)(2) Amount (Depreciation)
Dow Jones U.S. Banks Index Goldman Sachs International 2/23/22 0.68% $ 8,493,425 $118,822Dow Jones U.S. Banks Index UBS AG 2/23/22 0.43% 7,299,596 111,306
$15,793,021 $230,128
(1) Agreements may be terminated at will by either party without penalty. Payment is due at termination/maturity.(2) Reflects the floating financing rate, as of January 31, 2022, on the notional amount of the swap agreement paid to the counterparty or
received from the counterparty, excluding any commissions. This amount is included as part of the unrealized appreciation/(depreciation).
Toppan Merrill - ProFunds Public Semi-Annual Report [Funds] 01-31-2022 ED [AUX] | akiesli | 29-Mar-22 08:42 | 22-1296-2.da | Sequence: 5CHKSUM Content: 24239 Layout: 62163 Graphics: 0 CLEAN
JOB: 22-1296-2 CYCLE#;BL#: 8; 0 TRIM: 8.25" x 10.75" AS: New York: 212-620-5600COLORS: ~note-color 2, Black, ~note-color 3 GRAPHICS: none V1.5
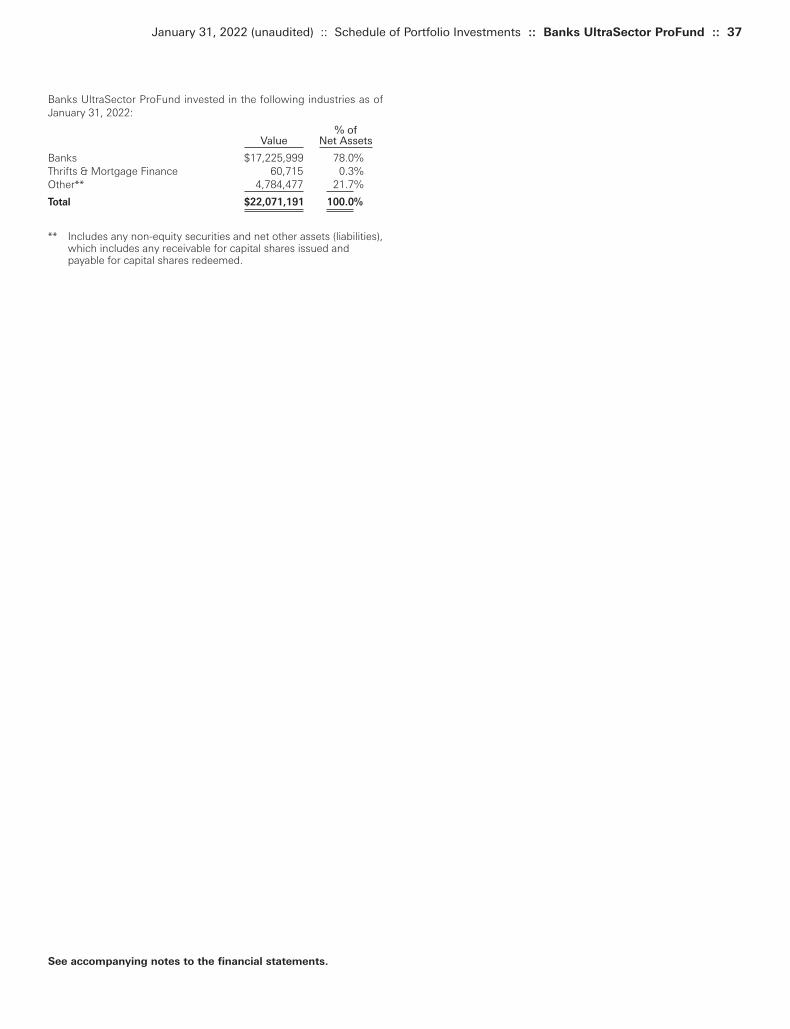
Banks UltraSector ProFund invested in the following industries as ofJanuary 31, 2022:
% ofValue Net Assets
Banks $17,225,999 78.0%Thrifts & Mortgage Finance 60,715 0.3%Other** 4,784,477 21.7% Total $22,071,191 100.0%
** Includes any non-equity securities and net other assets (liabilities),which includes any receivable for capital shares issued andpayable for capital shares redeemed.
January 31, 2022 (unaudited) :: Schedule of Portfolio Investments :: Banks UltraSector ProFund :: 37
See accompanying notes to the financial statements.
Toppan Merrill - ProFunds Public Semi-Annual Report [Funds] 01-31-2022 ED [AUX] | akiesli | 29-Mar-22 08:42 | 22-1296-2.da | Sequence: 6CHKSUM Content: 20059 Layout: 40923 Graphics: 0 CLEAN
JOB: 22-1296-2 CYCLE#;BL#: 8; 0 TRIM: 8.25" x 10.75" AS: New York: 212-620-5600COLORS: ~note-color 2, Black, ~note-color 3 GRAPHICS: none V1.5
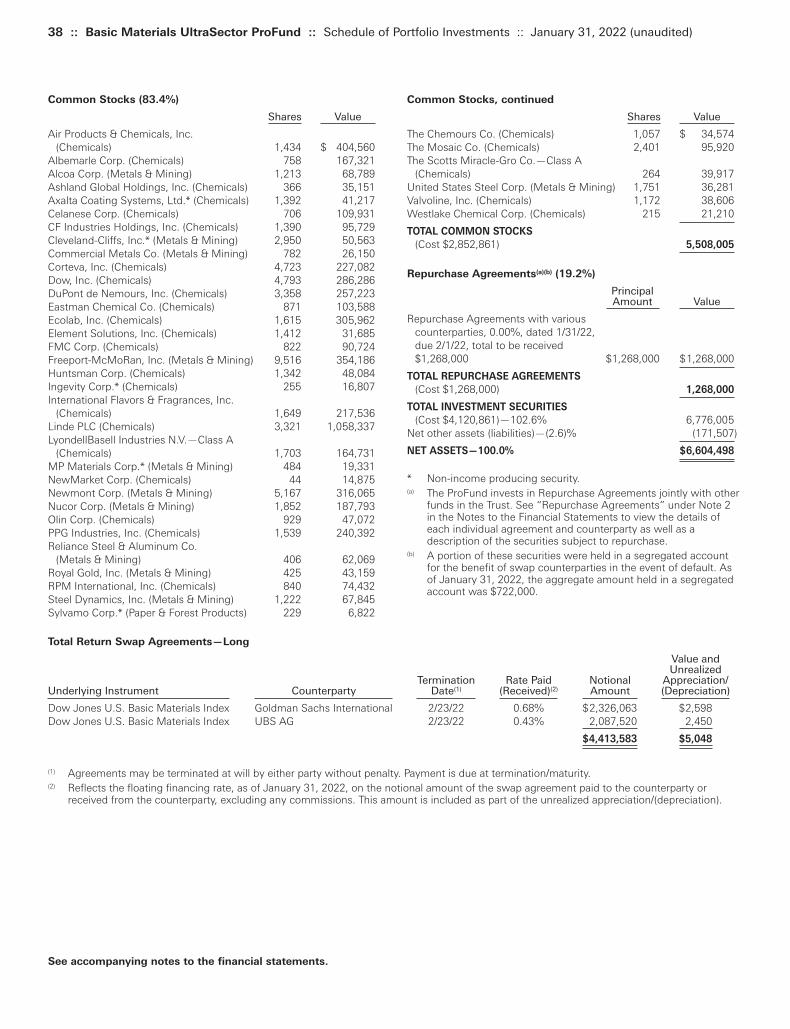
38 :: Basic Materials UltraSector ProFund :: Schedule of Portfolio Investments :: January 31, 2022 (unaudited)
Common Stocks, continued
Shares Value The Chemours Co. (Chemicals) 1,057 $ 34,574The Mosaic Co. (Chemicals) 2,401 95,920The Scotts Miracle-Gro Co.—Class A
(Chemicals) 264 39,917United States Steel Corp. (Metals & Mining) 1,751 36,281Valvoline, Inc. (Chemicals) 1,172 38,606Westlake Chemical Corp. (Chemicals) 215 21,210
TOTAL COMMON STOCKS
(Cost $2,852,861) 5,508,005
Repurchase Agreements(a)(b) (19.2%)
Principal Amount Value
Repurchase Agreements with various counterparties, 0.00%, dated 1/31/22, due 2/1/22, total to be received $1,268,000 $1,268,000 $1,268,000
TOTAL REPURCHASE AGREEMENTS
(Cost $1,268,000) 1,268,000
TOTAL INVESTMENT SECURITIES
(Cost $4,120,861)—102.6% 6,776,005Net other assets (liabilities)—(2.6)% (171,507)
NET ASSETS—100.0% $6,604,498
* Non-income producing security.(a) The ProFund invests in Repurchase Agreements jointly with other
funds in the Trust. See “Repurchase Agreements” under Note 2in the Notes to the Financial Statements to view the details ofeach individual agreement and counterparty as well as adescription of the securities subject to repurchase.
(b) A portion of these securities were held in a segregated accountfor the benefit of swap counterparties in the event of default. Asof January 31, 2022, the aggregate amount held in a segregatedaccount was $722,000.
Common Stocks (83.4%)
Shares Value Air Products & Chemicals, Inc.
(Chemicals) 1,434 $ 404,560Albemarle Corp. (Chemicals) 758 167,321Alcoa Corp. (Metals & Mining) 1,213 68,789Ashland Global Holdings, Inc. (Chemicals) 366 35,151Axalta Coating Systems, Ltd.* (Chemicals) 1,392 41,217Celanese Corp. (Chemicals) 706 109,931CF Industries Holdings, Inc. (Chemicals) 1,390 95,729Cleveland-Cliffs, Inc.* (Metals & Mining) 2,950 50,563Commercial Metals Co. (Metals & Mining) 782 26,150Corteva, Inc. (Chemicals) 4,723 227,082Dow, Inc. (Chemicals) 4,793 286,286DuPont de Nemours, Inc. (Chemicals) 3,358 257,223Eastman Chemical Co. (Chemicals) 871 103,588Ecolab, Inc. (Chemicals) 1,615 305,962Element Solutions, Inc. (Chemicals) 1,412 31,685FMC Corp. (Chemicals) 822 90,724Freeport-McMoRan, Inc. (Metals & Mining) 9,516 354,186Huntsman Corp. (Chemicals) 1,342 48,084Ingevity Corp.* (Chemicals) 255 16,807International Flavors & Fragrances, Inc.
(Chemicals) 1,649 217,536Linde PLC (Chemicals) 3,321 1,058,337LyondellBasell Industries N.V.—Class A
(Chemicals) 1,703 164,731MP Materials Corp.* (Metals & Mining) 484 19,331NewMarket Corp. (Chemicals) 44 14,875Newmont Corp. (Metals & Mining) 5,167 316,065Nucor Corp. (Metals & Mining) 1,852 187,793Olin Corp. (Chemicals) 929 47,072PPG Industries, Inc. (Chemicals) 1,539 240,392Reliance Steel & Aluminum Co.
(Metals & Mining) 406 62,069Royal Gold, Inc. (Metals & Mining) 425 43,159RPM International, Inc. (Chemicals) 840 74,432Steel Dynamics, Inc. (Metals & Mining) 1,222 67,845Sylvamo Corp.* (Paper & Forest Products) 229 6,822
See accompanying notes to the financial statements.
Total Return Swap Agreements—Long
Value andUnrealized
Termination Rate Paid Notional Appreciation/Underlying Instrument Counterparty Date(1) (Received)(2) Amount (Depreciation) Dow Jones U.S. Basic Materials Index Goldman Sachs International 2/23/22 0.68% $2,326,063 $2,598Dow Jones U.S. Basic Materials Index UBS AG 2/23/22 0.43% 2,087,520 2,450
$4,413,583 $5,048
(1) Agreements may be terminated at will by either party without penalty. Payment is due at termination/maturity.(2) Reflects the floating financing rate, as of January 31, 2022, on the notional amount of the swap agreement paid to the counterparty or
received from the counterparty, excluding any commissions. This amount is included as part of the unrealized appreciation/(depreciation).
Toppan Merrill - ProFunds Public Semi-Annual Report [Funds] 01-31-2022 ED [AUX] | akiesli | 29-Mar-22 08:42 | 22-1296-2.da | Sequence: 7CHKSUM Content: 61385 Layout: 15718 Graphics: 0 CLEAN
JOB: 22-1296-2 CYCLE#;BL#: 8; 0 TRIM: 8.25" x 10.75" AS: New York: 212-620-5600COLORS: ~note-color 2, Black, ~note-color 3 GRAPHICS: none V1.5
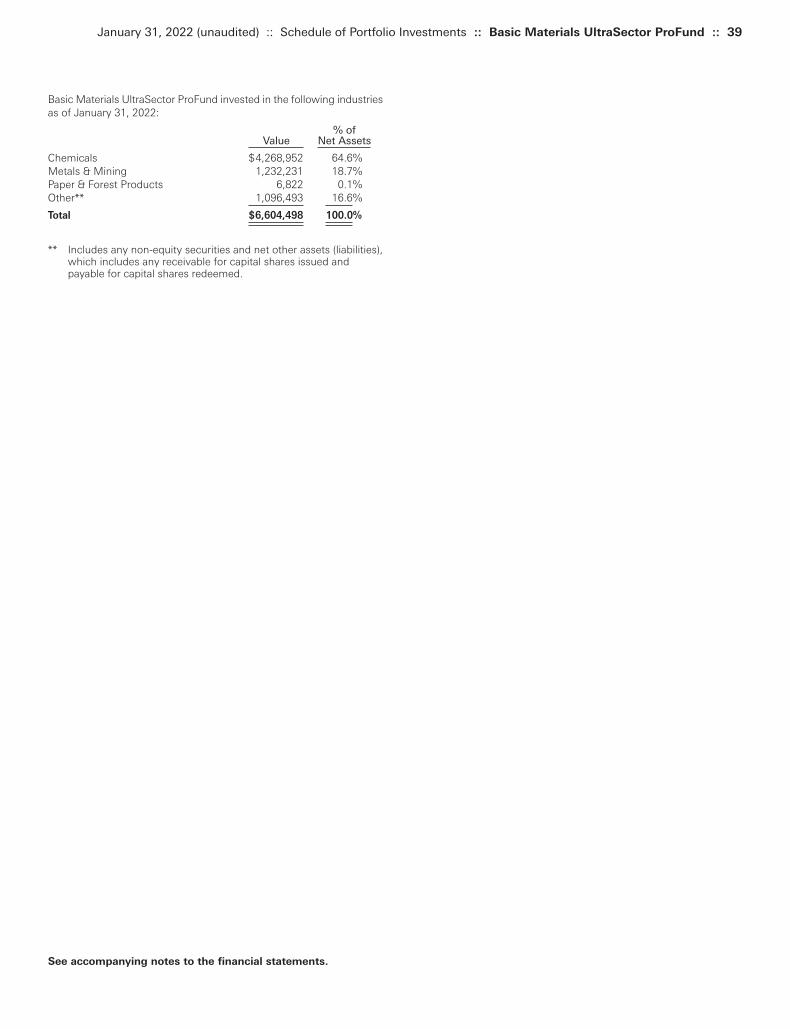
Basic Materials UltraSector ProFund invested in the following industriesas of January 31, 2022:
% ofValue Net Assets
Chemicals $4,268,952 64.6%Metals & Mining 1,232,231 18.7%Paper & Forest Products 6,822 0.1%Other** 1,096,493 16.6%
Total $6,604,498 100.0%
** Includes any non-equity securities and net other assets (liabilities),which includes any receivable for capital shares issued andpayable for capital shares redeemed.
January 31, 2022 (unaudited) :: Schedule of Portfolio Investments :: Basic Materials UltraSector ProFund :: 39
See accompanying notes to the financial statements.
Toppan Merrill - ProFunds Public Semi-Annual Report [Funds] 01-31-2022 ED [AUX] | akiesli | 29-Mar-22 08:42 | 22-1296-2.da | Sequence: 8CHKSUM Content: 22065 Layout: 45098 Graphics: 0 CLEAN
JOB: 22-1296-2 CYCLE#;BL#: 8; 0 TRIM: 8.25" x 10.75" AS: New York: 212-620-5600COLORS: ~note-color 2, Black, ~note-color 3 GRAPHICS: none V1.5
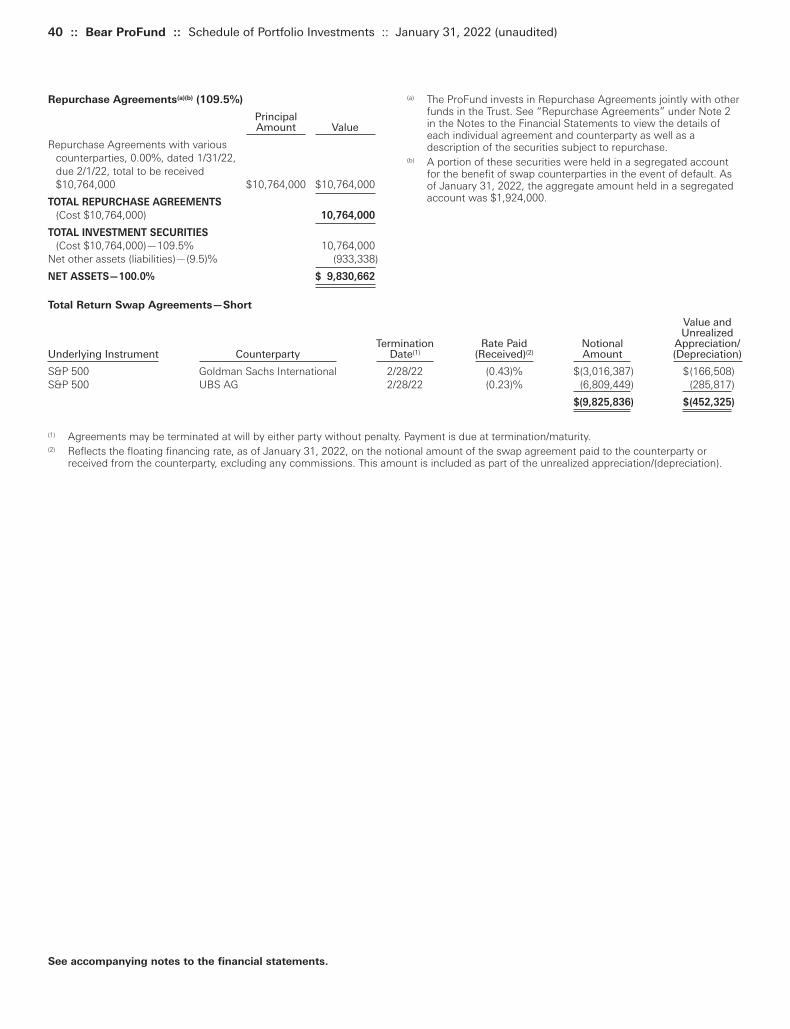
40 :: Bear ProFund :: Schedule of Portfolio Investments :: January 31, 2022 (unaudited)
(a) The ProFund invests in Repurchase Agreements jointly with otherfunds in the Trust. See “Repurchase Agreements” under Note 2in the Notes to the Financial Statements to view the details ofeach individual agreement and counterparty as well as adescription of the securities subject to repurchase.
(b) A portion of these securities were held in a segregated accountfor the benefit of swap counterparties in the event of default. Asof January 31, 2022, the aggregate amount held in a segregatedaccount was $1,924,000.
Repurchase Agreements(a)(b) (109.5%)
Principal Amount Value
Repurchase Agreements with various counterparties, 0.00%, dated 1/31/22, due 2/1/22, total to be received $10,764,000 $10,764,000 $10,764,000
TOTAL REPURCHASE AGREEMENTS
(Cost $10,764,000) 10,764,000
TOTAL INVESTMENT SECURITIES
(Cost $10,764,000)—109.5% 10,764,000Net other assets (liabilities)—(9.5)% (933,338)
NET ASSETS—100.0% $ 9,830,662
See accompanying notes to the financial statements.
Total Return Swap Agreements—Short
Value and Unrealized
Termination Rate Paid Notional Appreciation/ Underlying Instrument Counterparty Date(1) (Received)(2) Amount (Depreciation)
S&P 500 Goldman Sachs International 2/28/22 (0.43)% $(3,016,387) $(166,508)S&P 500 UBS AG 2/28/22 (0.23)% (6,809,449) (285,817)
$(9,825,836) $(452,325)
(1) Agreements may be terminated at will by either party without penalty. Payment is due at termination/maturity.(2) Reflects the floating financing rate, as of January 31, 2022, on the notional amount of the swap agreement paid to the counterparty or
received from the counterparty, excluding any commissions. This amount is included as part of the unrealized appreciation/(depreciation).
Toppan Merrill - ProFunds Public Semi-Annual Report [Funds] 01-31-2022 ED [AUX] | akiesli | 29-Mar-22 08:42 | 22-1296-2.da | Sequence: 9CHKSUM Content: 890 Layout: 65077 Graphics: 0 CLEAN
JOB: 22-1296-2 CYCLE#;BL#: 8; 0 TRIM: 8.25" x 10.75" AS: New York: 212-620-5600COLORS: ~note-color 2, Black, ~note-color 3 GRAPHICS: none V1.5
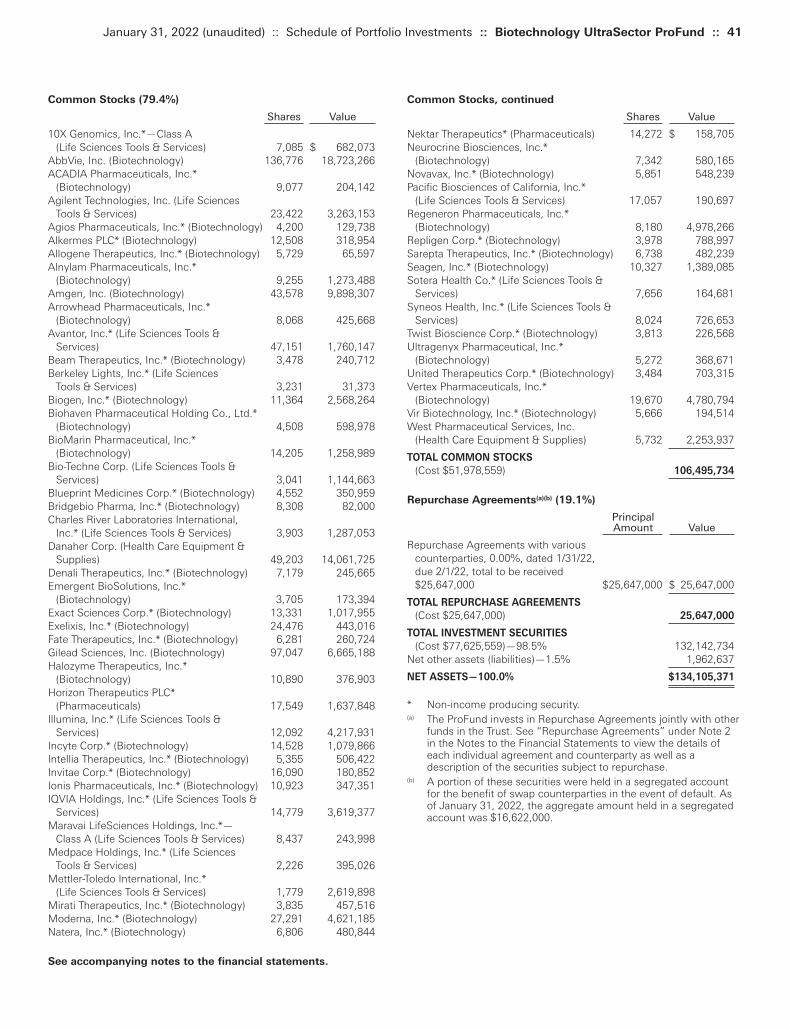
Common Stocks, continued
Shares Value
Nektar Therapeutics* (Pharmaceuticals) 14,272 $ 158,705Neurocrine Biosciences, Inc.*
(Biotechnology) 7,342 580,165Novavax, Inc.* (Biotechnology) 5,851 548,239Pacific Biosciences of California, Inc.*
(Life Sciences Tools & Services) 17,057 190,697Regeneron Pharmaceuticals, Inc.*
(Biotechnology) 8,180 4,978,266Repligen Corp.* (Biotechnology) 3,978 788,997Sarepta Therapeutics, Inc.* (Biotechnology) 6,738 482,239Seagen, Inc.* (Biotechnology) 10,327 1,389,085Sotera Health Co.* (Life Sciences Tools &
Services) 7,656 164,681Syneos Health, Inc.* (Life Sciences Tools &
Services) 8,024 726,653Twist Bioscience Corp.* (Biotechnology) 3,813 226,568Ultragenyx Pharmaceutical, Inc.*
(Biotechnology) 5,272 368,671United Therapeutics Corp.* (Biotechnology) 3,484 703,315Vertex Pharmaceuticals, Inc.*
(Biotechnology) 19,670 4,780,794Vir Biotechnology, Inc.* (Biotechnology) 5,666 194,514West Pharmaceutical Services, Inc.
(Health Care Equipment & Supplies) 5,732 2,253,937
TOTAL COMMON STOCKS
(Cost $51,978,559) 106,495,734
Repurchase Agreements(a)(b) (19.1%)
Principal Amount Value
Repurchase Agreements with various counterparties, 0.00%, dated 1/31/22, due 2/1/22, total to be received $25,647,000 $25,647,000 $ 25,647,000
TOTAL REPURCHASE AGREEMENTS
(Cost $25,647,000) 25,647,000
TOTAL INVESTMENT SECURITIES
(Cost $77,625,559)—98.5% 132,142,734Net other assets (liabilities)—1.5% 1,962,637
NET ASSETS—100.0% $134,105,371
* Non-income producing security.(a) The ProFund invests in Repurchase Agreements jointly with other
funds in the Trust. See “Repurchase Agreements” under Note 2in the Notes to the Financial Statements to view the details ofeach individual agreement and counterparty as well as adescription of the securities subject to repurchase.
(b) A portion of these securities were held in a segregated accountfor the benefit of swap counterparties in the event of default. Asof January 31, 2022, the aggregate amount held in a segregatedaccount was $16,622,000.
Common Stocks (79.4%)
Shares Value
10X Genomics, Inc.*—Class A (Life Sciences Tools & Services) 7,085 $ 682,073
AbbVie, Inc. (Biotechnology) 136,776 18,723,266ACADIA Pharmaceuticals, Inc.*
(Biotechnology) 9,077 204,142Agilent Technologies, Inc. (Life Sciences
Tools & Services) 23,422 3,263,153Agios Pharmaceuticals, Inc.* (Biotechnology) 4,200 129,738Alkermes PLC* (Biotechnology) 12,508 318,954Allogene Therapeutics, Inc.* (Biotechnology) 5,729 65,597Alnylam Pharmaceuticals, Inc.*
(Biotechnology) 9,255 1,273,488Amgen, Inc. (Biotechnology) 43,578 9,898,307Arrowhead Pharmaceuticals, Inc.*
(Biotechnology) 8,068 425,668Avantor, Inc.* (Life Sciences Tools &
Services) 47,151 1,760,147Beam Therapeutics, Inc.* (Biotechnology) 3,478 240,712Berkeley Lights, Inc.* (Life Sciences
Tools & Services) 3,231 31,373Biogen, Inc.* (Biotechnology) 11,364 2,568,264Biohaven Pharmaceutical Holding Co., Ltd.*
(Biotechnology) 4,508 598,978BioMarin Pharmaceutical, Inc.*
(Biotechnology) 14,205 1,258,989Bio-Techne Corp. (Life Sciences Tools &
Services) 3,041 1,144,663Blueprint Medicines Corp.* (Biotechnology) 4,552 350,959Bridgebio Pharma, Inc.* (Biotechnology) 8,308 82,000Charles River Laboratories International,
Inc.* (Life Sciences Tools & Services) 3,903 1,287,053Danaher Corp. (Health Care Equipment &
Supplies) 49,203 14,061,725Denali Therapeutics, Inc.* (Biotechnology) 7,179 245,665Emergent BioSolutions, Inc.*
(Biotechnology) 3,705 173,394Exact Sciences Corp.* (Biotechnology) 13,331 1,017,955Exelixis, Inc.* (Biotechnology) 24,476 443,016Fate Therapeutics, Inc.* (Biotechnology) 6,281 260,724Gilead Sciences, Inc. (Biotechnology) 97,047 6,665,188Halozyme Therapeutics, Inc.*
(Biotechnology) 10,890 376,903Horizon Therapeutics PLC*
(Pharmaceuticals) 17,549 1,637,848Illumina, Inc.* (Life Sciences Tools &
Services) 12,092 4,217,931Incyte Corp.* (Biotechnology) 14,528 1,079,866Intellia Therapeutics, Inc.* (Biotechnology) 5,355 506,422Invitae Corp.* (Biotechnology) 16,090 180,852Ionis Pharmaceuticals, Inc.* (Biotechnology) 10,923 347,351IQVIA Holdings, Inc.* (Life Sciences Tools &
Services) 14,779 3,619,377Maravai LifeSciences Holdings, Inc.*—
Class A (Life Sciences Tools & Services) 8,437 243,998Medpace Holdings, Inc.* (Life Sciences
Tools & Services) 2,226 395,026Mettler-Toledo International, Inc.*
(Life Sciences Tools & Services) 1,779 2,619,898Mirati Therapeutics, Inc.* (Biotechnology) 3,835 457,516Moderna, Inc.* (Biotechnology) 27,291 4,621,185Natera, Inc.* (Biotechnology) 6,806 480,844
January 31, 2022 (unaudited) :: Schedule of Portfolio Investments :: Biotechnology UltraSector ProFund :: 41
See accompanying notes to the financial statements.
Toppan Merrill - ProFunds Public Semi-Annual Report [Funds] 01-31-2022 ED [AUX] | akiesli | 29-Mar-22 08:42 | 22-1296-2.da | Sequence: 10CHKSUM Content: 34813 Layout: 28352 Graphics: 0 CLEAN
JOB: 22-1296-2 CYCLE#;BL#: 8; 0 TRIM: 8.25" x 10.75" AS: New York: 212-620-5600COLORS: ~note-color 2, Black, ~note-color 3 GRAPHICS: none V1.5
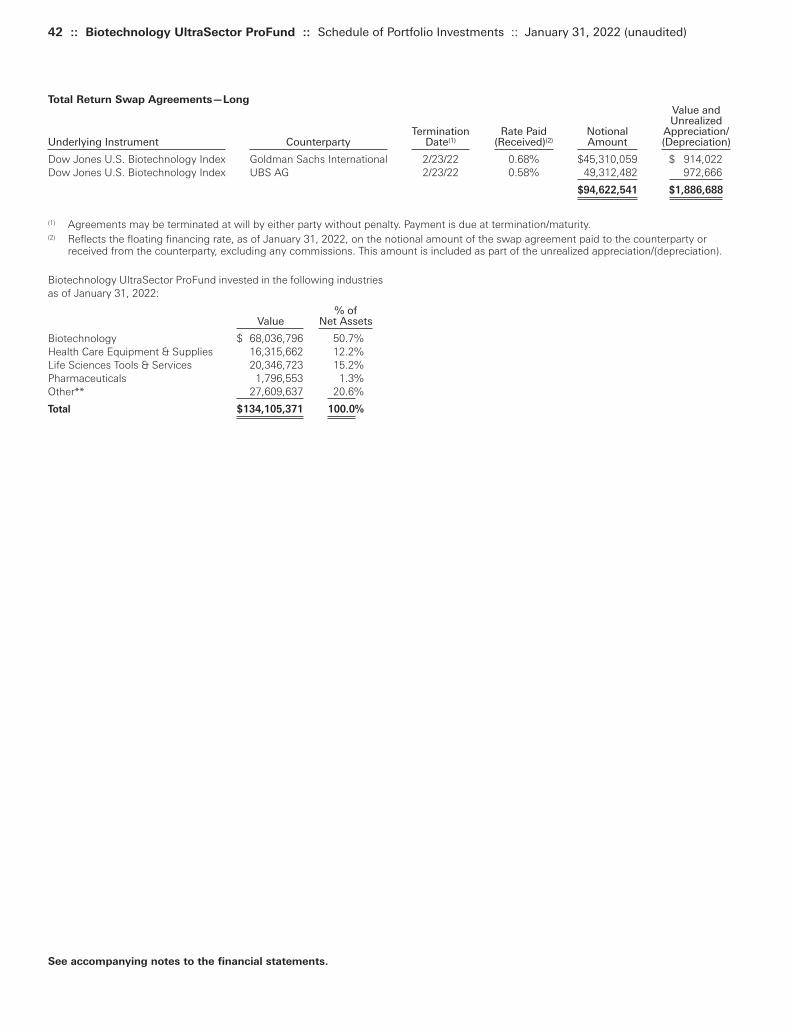
Biotechnology UltraSector ProFund invested in the following industriesas of January 31, 2022:
% ofValue Net Assets
Biotechnology $ 68,036,796 50.7%Health Care Equipment & Supplies 16,315,662 12.2%Life Sciences Tools & Services 20,346,723 15.2%Pharmaceuticals 1,796,553 1.3%Other** 27,609,637 20.6%
Total $134,105,371 100.0%
42 :: Biotechnology UltraSector ProFund :: Schedule of Portfolio Investments :: January 31, 2022 (unaudited)
Total Return Swap Agreements—LongValue and Unrealized
Termination Rate Paid Notional Appreciation/Underlying Instrument Counterparty Date(1) (Received)(2) Amount (Depreciation)
Dow Jones U.S. Biotechnology Index Goldman Sachs International 2/23/22 0.68% $45,310,059 $ 914,022Dow Jones U.S. Biotechnology Index UBS AG 2/23/22 0.58% 49,312,482 972,666
$94,622,541 $1,886,688
(1) Agreements may be terminated at will by either party without penalty. Payment is due at termination/maturity.(2) Reflects the floating financing rate, as of January 31, 2022, on the notional amount of the swap agreement paid to the counterparty or
received from the counterparty, excluding any commissions. This amount is included as part of the unrealized appreciation/(depreciation).
See accompanying notes to the financial statements.
Toppan Merrill - ProFunds Public Semi-Annual Report [Funds] 01-31-2022 ED [AUX] | akiesli | 29-Mar-22 08:42 | 22-1296-2.da | Sequence: 11CHKSUM Content: 39319 Layout: 64686 Graphics: 0 CLEAN
JOB: 22-1296-2 CYCLE#;BL#: 8; 0 TRIM: 8.25" x 10.75" AS: New York: 212-620-5600COLORS: ~note-color 2, Black, ~note-color 3 GRAPHICS: none V1.5

January 31, 2022 (unaudited) :: Consolidated Schedule of Portfolio Investments :: Bitcoin Strategy ProFund :: 43
U.S. Treasury Obligation (96.9%)
Principal Amount Value
U.S. Treasury Bill, 0.26%+, 5/19/22^ $26,000,000 $ 25,979,761
TOTAL U.S. TREASURY OBLIGATION
(Cost $25,995,931) 25,979,761
TOTAL INVESTMENT SECURITIES
(Cost $25,995,931)—96.9% 25,979,761Reverse Repurchase Agreements
including accrued interest—(74.5)% (19,985,044)
Net other assets (liabilities)—77.6% 20,807,568
NET ASSETS—100.0% $ 26,802,285
See accompanying notes to the financial statements.
+ Reflects the effective yield or interest rate in effect at January 31,2022.
^ $19,985,044 of this security has been pledged as collateral forreverse repurchase agreements.
Futures Contracts Purchased
Value and Number Unrealized
of Expiration Notional Appreciation/Contracts Date Amount (Depreciation)
CME Bitcoin Futures Contracts 104 2/28/22 $20,012,200 $(945,086)CME Bitcoin Futures Contracts 35 3/28/22 6,750,625 499,099CME Micro Bitcoin Futures Contracts 8 2/28/22 30,860 2,397
$26,793,685 $(443,590)
Toppan Merrill - ProFunds Public Semi-Annual Report [Funds] 01-31-2022 ED [AUX] | akiesli | 29-Mar-22 08:42 | 22-1296-2.da | Sequence: 12CHKSUM Content: 8337 Layout: 48581 Graphics: 0 CLEAN
JOB: 22-1296-2 CYCLE#;BL#: 8; 0 TRIM: 8.25" x 10.75" AS: New York: 212-620-5600COLORS: ~note-color 2, Black, ~note-color 3 GRAPHICS: none V1.5

44 :: Bull ProFund :: Summary Schedule of Portfolio Investments :: January 31, 2022 (unaudited)
Common Stocks, continued
Percentageof Net Assets Shares Value
Meta Platforms, Inc.—Class A* (Interactive Media & Services)* 1.5% 2,389 $ 748,378
Microsoft Corp. (Software) 4.7% 7,577 2,356,295Netflix, Inc.* (Entertainment)* 0.4% 447 190,932NIKE, Inc.—Class B (Textiles,
Apparel & Luxury Goods) 0.4% 1,290 191,010NVIDIA Corp.
(Semiconductors & Semiconductor Equipment) 1.2% 2,523 617,781
PayPal Holdings, Inc.* (IT Services)* 0.4% 1,186 203,921
PepsiCo, Inc. (Beverages) 0.5% 1,395 242,060Pfizer, Inc. (Pharmaceuticals) 0.6% 5,665 298,489Qualcomm, Inc.
(Semiconductors & Semiconductor Equipment) 0.4% 1,130 198,609
Salesforce.com, Inc.* (Software)* 0.5% 988 229,838
Tesla, Inc.* (Automobiles)* 1.5% 821 769,047Texas Instruments, Inc.
(Semiconductors & Semiconductor Equipment) 0.3% 932 167,285
The Coca-Cola Co. (Beverages) 0.5% 3,923 239,342
The Home Depot, Inc. (Specialty Retail) 0.8% 1,065 390,833
The Procter & Gamble Co. (Household Products) 0.8% 2,442 391,818
The Walt Disney Co.* (Entertainment)* 0.5% 1,834 262,207
Thermo Fisher Scientific, Inc. (Life Sciences Tools & Services) 0.5% 398 231,356
UnitedHealth Group, Inc. (Health Care Providers & Services) 0.9% 951 449,415
Verizon Communications, Inc. (Diversified Telecommunication Services) 0.4% 4,178 222,394
Visa, Inc.—Class A (IT Services) 0.8% 1,693 382,906
Walmart, Inc. (Food & Staples Retailing) 0.4% 1,435 200,627
Wells Fargo & Co. (Banks) 0.4% 4,023 216,437Other Common Stocks(a) 35.3% 178,660 17,610,969
TOTAL COMMON STOCKS
(Cost $6,930,176) 38,585,680
Repurchase Agreements(b)(c) (18.2%)
Principal Amount Value
Repurchase Agreements with various counterparties, 0.00%, dated 1/31/22, due 2/1/22, total to be received $9,060,000 $9,060,000 $ 9,060,000
TOTAL REPURCHASE AGREEMENTS
(Cost $9,060,000) 9,060,000
Common Stocks (77.6%)
Percentageof Net Assets Shares Value
Abbott Laboratories (Health Care Equipment & Supplies) 0.5% 1,785 $ 227,517
AbbVie, Inc. (Biotechnology) 0.5% 1,784 244,212Accenture PLC—Class A
(IT Services) 0.5% 637 225,230Adobe, Inc.* (Software)* 0.5% 480 256,464Alphabet, Inc.—Class C*
(Interactive Media & Services)* 1.5% 282 765,340
Alphabet, Inc.—Class A* (Interactive Media & Services)* 1.7% 304 822,645
Amazon.com, Inc.* (Internet & Direct Marketing Retail)* 2.6% 440 1,316,247
Apple, Inc. (Technology Hardware, Storage & Peripherals) 5.5% 15,729 2,749,115
AT&T, Inc. (Diversified Telecommunication Services) 0.4% 7,207 183,779
Bank of America Corp. (Banks) 0.7% 7,269 335,392
Berkshire Hathaway, Inc.—Class B* (Diversified Financial Services)* 1.2% 1,848 578,461
Broadcom, Inc. (Semiconductors & Semiconductor Equipment) 0.5% 415 243,139
Chevron Corp. (Oil, Gas & Consumable Fuels) 0.5% 1,946 255,568
Cisco Systems, Inc. (Communications Equipment) 0.5% 4,257 236,987
Comcast Corp.—Class A (Media) 0.5% 4,602 230,054
Costco Wholesale Corp. (Food & Staples Retailing) 0.5% 446 225,288
Danaher Corp. (Health Care Equipment & Supplies) 0.4% 642 183,477
Eli Lilly & Co. (Pharmaceuticals) 0.4% 801 196,557
Exxon Mobil Corp. (Oil, Gas & Consumable Fuels) 0.7% 4,272 324,501
Intel Corp. (Semiconductors & Semiconductor Equipment) 0.4% 4,105 200,405
Johnson & Johnson (Pharmaceuticals) 0.9% 2,657 457,774
JPMorgan Chase & Co. (Banks) 0.9% 2,982 443,125
Linde PLC (Chemicals) 0.3% 517 164,759Lowe’s Cos., Inc.
(Specialty Retail) 0.3% 699 165,908Mastercard, Inc.—Class A
(IT Services) 0.7% 876 338,469McDonald’s Corp. (Hotels,
Restaurants & Leisure) 0.4% 754 195,625Merck & Co., Inc.
(Pharmaceuticals) 0.4% 2,549 207,693
See accompanying notes to the financial statements.
Toppan Merrill - ProFunds Public Semi-Annual Report [Funds] 01-31-2022 ED [AUX] | akiesli | 29-Mar-22 08:42 | 22-1296-2.da | Sequence: 13CHKSUM Content: 1853 Layout: 7836 Graphics: 0 CLEAN
JOB: 22-1296-2 CYCLE#;BL#: 8; 0 TRIM: 8.25" x 10.75" AS: New York: 212-620-5600COLORS: ~note-color 2, Black, ~note-color 3 GRAPHICS: none V1.5
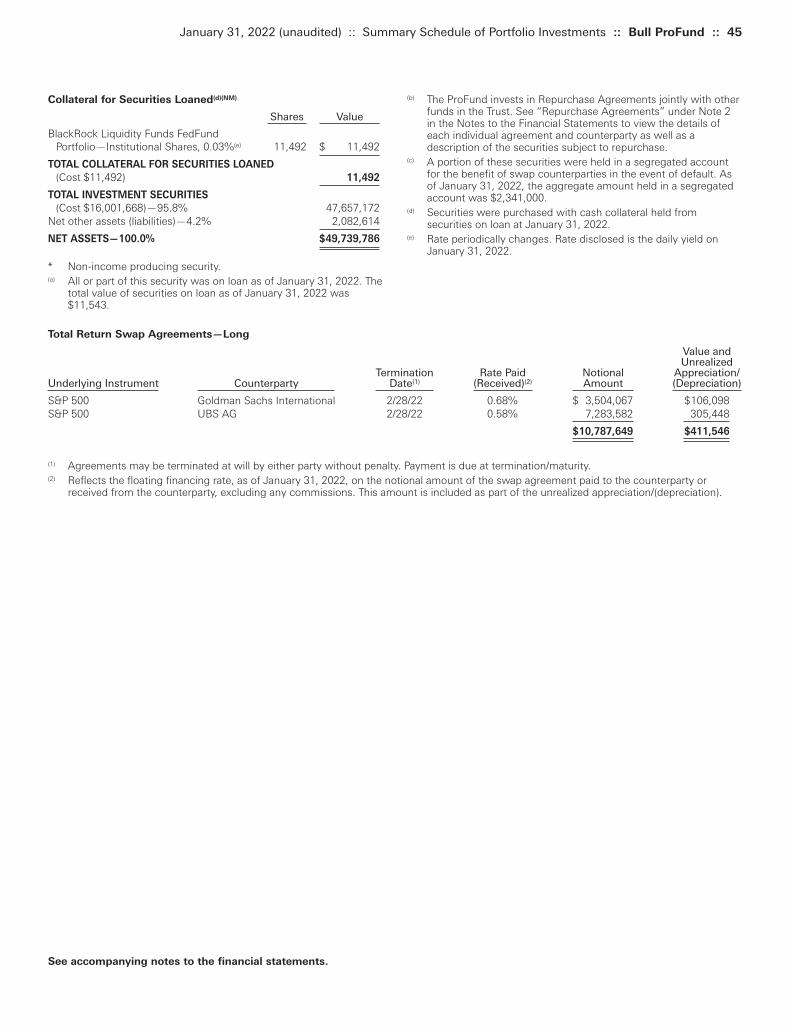
(b) The ProFund invests in Repurchase Agreements jointly with otherfunds in the Trust. See “Repurchase Agreements” under Note 2in the Notes to the Financial Statements to view the details ofeach individual agreement and counterparty as well as adescription of the securities subject to repurchase.
(c) A portion of these securities were held in a segregated accountfor the benefit of swap counterparties in the event of default. Asof January 31, 2022, the aggregate amount held in a segregatedaccount was $2,341,000.
(d) Securities were purchased with cash collateral held fromsecurities on loan at January 31, 2022.
(e) Rate periodically changes. Rate disclosed is the daily yield onJanuary 31, 2022.
Collateral for Securities Loaned(d)(NM)
Shares Value
BlackRock Liquidity Funds FedFund Portfolio—Institutional Shares, 0.03%(e) 11,492 $ 11,492
TOTAL COLLATERAL FOR SECURITIES LOANED
(Cost $11,492) 11,492
TOTAL INVESTMENT SECURITIES
(Cost $16,001,668)—95.8% 47,657,172Net other assets (liabilities)—4.2% 2,082,614
NET ASSETS—100.0% $49,739,786
* Non-income producing security.(a) All or part of this security was on loan as of January 31, 2022. The
total value of securities on loan as of January 31, 2022 was$11,543.
January 31, 2022 (unaudited) :: Summary Schedule of Portfolio Investments :: Bull ProFund :: 45
See accompanying notes to the financial statements.
Total Return Swap Agreements—Long
Value andUnrealized
Termination Rate Paid Notional Appreciation/Underlying Instrument Counterparty Date(1) (Received)(2) Amount (Depreciation)
S&P 500 Goldman Sachs International 2/28/22 0.68% $ 3,504,067 $106,098S&P 500 UBS AG 2/28/22 0.58% 7,283,582 305,448
$10,787,649 $411,546
(1) Agreements may be terminated at will by either party without penalty. Payment is due at termination/maturity.(2) Reflects the floating financing rate, as of January 31, 2022, on the notional amount of the swap agreement paid to the counterparty or
received from the counterparty, excluding any commissions. This amount is included as part of the unrealized appreciation/(depreciation).
Toppan Merrill - ProFunds Public Semi-Annual Report [Funds] 01-31-2022 ED [AUX] | akiesli | 29-Mar-22 08:42 | 22-1296-2.da | Sequence: 14CHKSUM Content: 39380 Layout: 1464 Graphics: 0 CLEAN
JOB: 22-1296-2 CYCLE#;BL#: 8; 0 TRIM: 8.25" x 10.75" AS: New York: 212-620-5600COLORS: ~note-color 2, Black, ~note-color 3 GRAPHICS: none V1.5
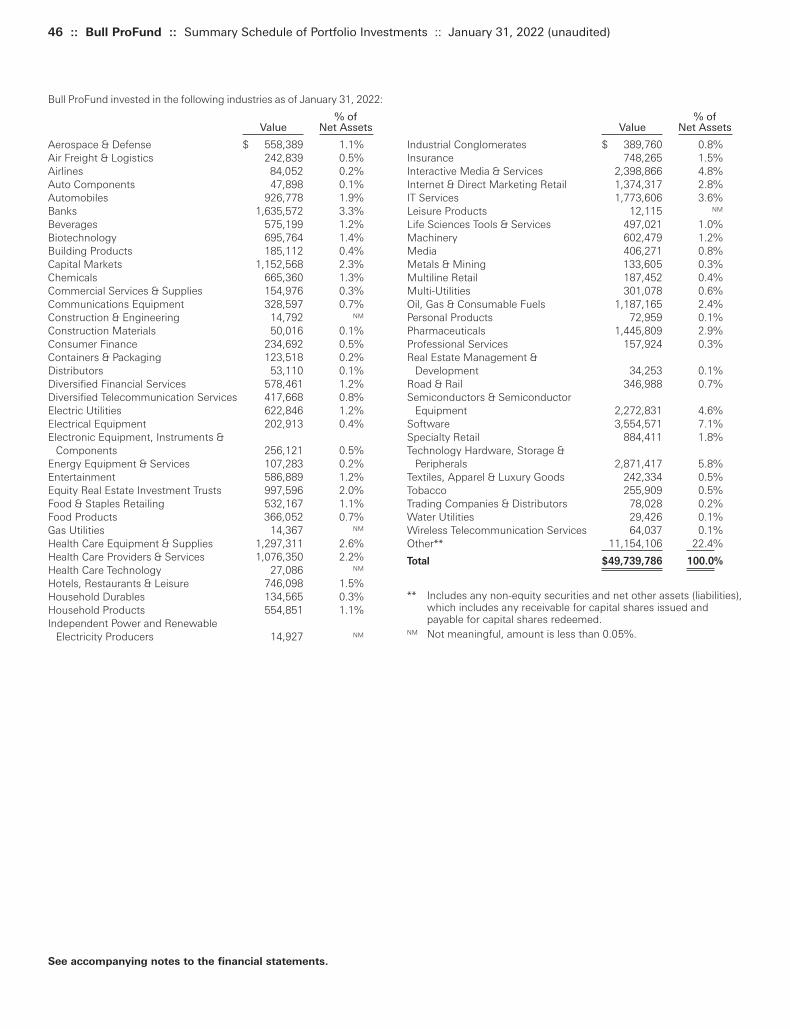
46 :: Bull ProFund :: Summary Schedule of Portfolio Investments :: January 31, 2022 (unaudited)
% ofValue Net Assets
Industrial Conglomerates $ 389,760 0.8%Insurance 748,265 1.5%Interactive Media & Services 2,398,866 4.8%Internet & Direct Marketing Retail 1,374,317 2.8%IT Services 1,773,606 3.6%Leisure Products 12,115 NM
Life Sciences Tools & Services 497,021 1.0%Machinery 602,479 1.2%Media 406,271 0.8%Metals & Mining 133,605 0.3%Multiline Retail 187,452 0.4%Multi-Utilities 301,078 0.6%Oil, Gas & Consumable Fuels 1,187,165 2.4%Personal Products 72,959 0.1%Pharmaceuticals 1,445,809 2.9%Professional Services 157,924 0.3%Real Estate Management &
Development 34,253 0.1%Road & Rail 346,988 0.7%Semiconductors & Semiconductor
Equipment 2,272,831 4.6%Software 3,554,571 7.1%Specialty Retail 884,411 1.8%Technology Hardware, Storage &
Peripherals 2,871,417 5.8%Textiles, Apparel & Luxury Goods 242,334 0.5%Tobacco 255,909 0.5%Trading Companies & Distributors 78,028 0.2%Water Utilities 29,426 0.1%Wireless Telecommunication Services 64,037 0.1%Other** 11,154,106 22.4%
Total $49,739,786 100.0%
** Includes any non-equity securities and net other assets (liabilities),which includes any receivable for capital shares issued andpayable for capital shares redeemed.
NM Not meaningful, amount is less than 0.05%.
Bull ProFund invested in the following industries as of January 31, 2022:
% ofValue Net Assets
Aerospace & Defense $ 558,389 1.1%Air Freight & Logistics 242,839 0.5%Airlines 84,052 0.2%Auto Components 47,898 0.1%Automobiles 926,778 1.9%Banks 1,635,572 3.3%Beverages 575,199 1.2%Biotechnology 695,764 1.4%Building Products 185,112 0.4%Capital Markets 1,152,568 2.3%Chemicals 665,360 1.3%Commercial Services & Supplies 154,976 0.3%Communications Equipment 328,597 0.7%Construction & Engineering 14,792 NM
Construction Materials 50,016 0.1%Consumer Finance 234,692 0.5%Containers & Packaging 123,518 0.2%Distributors 53,110 0.1%Diversified Financial Services 578,461 1.2%Diversified Telecommunication Services 417,668 0.8%Electric Utilities 622,846 1.2%Electrical Equipment 202,913 0.4%Electronic Equipment, Instruments &
Components 256,121 0.5%Energy Equipment & Services 107,283 0.2%Entertainment 586,889 1.2%Equity Real Estate Investment Trusts 997,596 2.0%Food & Staples Retailing 532,167 1.1%Food Products 366,052 0.7%Gas Utilities 14,367 NM
Health Care Equipment & Supplies 1,297,311 2.6%Health Care Providers & Services 1,076,350 2.2%Health Care Technology 27,086 NM
Hotels, Restaurants & Leisure 746,098 1.5%Household Durables 134,565 0.3%Household Products 554,851 1.1%Independent Power and Renewable
Electricity Producers 14,927 NM
See accompanying notes to the financial statements.
Toppan Merrill - ProFunds Public Semi-Annual Report [Funds] 01-31-2022 ED [AUX] | akiesli | 29-Mar-22 08:42 | 22-1296-2.da | Sequence: 15CHKSUM Content: 45863 Layout: 37075 Graphics: 0 CLEAN
JOB: 22-1296-2 CYCLE#;BL#: 8; 0 TRIM: 8.25" x 10.75" AS: New York: 212-620-5600COLORS: ~note-color 2, Black, ~note-color 3 GRAPHICS: none V1.5
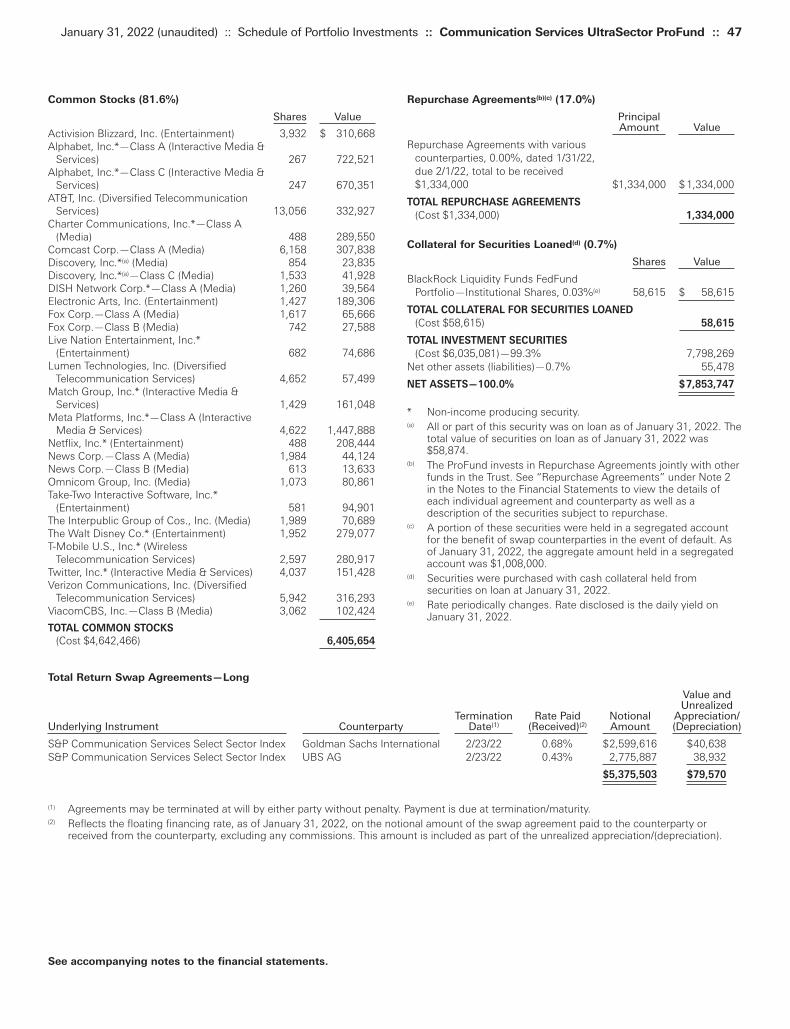
Repurchase Agreements(b)(c) (17.0%)
Principal Amount Value
Repurchase Agreements with various counterparties, 0.00%, dated 1/31/22, due 2/1/22, total to be received $1,334,000 $1,334,000 $ 1,334,000
TOTAL REPURCHASE AGREEMENTS
(Cost $1,334,000) 1,334,000
Collateral for Securities Loaned(d) (0.7%)
Shares Value
BlackRock Liquidity Funds FedFund Portfolio—Institutional Shares, 0.03%(e) 58,615 $ 58,615
TOTAL COLLATERAL FOR SECURITIES LOANED
(Cost $58,615) 58,615
TOTAL INVESTMENT SECURITIES
(Cost $6,035,081)—99.3% 7,798,269Net other assets (liabilities)—0.7% 55,478
NET ASSETS—100.0% $7,853,747
* Non-income producing security.(a) All or part of this security was on loan as of January 31, 2022. The
total value of securities on loan as of January 31, 2022 was$58,874.
(b) The ProFund invests in Repurchase Agreements jointly with otherfunds in the Trust. See “Repurchase Agreements” under Note 2in the Notes to the Financial Statements to view the details ofeach individual agreement and counterparty as well as adescription of the securities subject to repurchase.
(c) A portion of these securities were held in a segregated accountfor the benefit of swap counterparties in the event of default. Asof January 31, 2022, the aggregate amount held in a segregatedaccount was $1,008,000.
(d) Securities were purchased with cash collateral held fromsecurities on loan at January 31, 2022.
(e) Rate periodically changes. Rate disclosed is the daily yield onJanuary 31, 2022.
Common Stocks (81.6%)
Shares Value
Activision Blizzard, Inc. (Entertainment) 3,932 $ 310,668Alphabet, Inc.*—Class A (Interactive Media &
Services) 267 722,521Alphabet, Inc.*—Class C (Interactive Media &
Services) 247 670,351AT&T, Inc. (Diversified Telecommunication
Services) 13,056 332,927Charter Communications, Inc.*—Class A
(Media) 488 289,550Comcast Corp.—Class A (Media) 6,158 307,838Discovery, Inc.*(a) (Media) 854 23,835Discovery, Inc.*(a)—Class C (Media) 1,533 41,928DISH Network Corp.*—Class A (Media) 1,260 39,564Electronic Arts, Inc. (Entertainment) 1,427 189,306Fox Corp.—Class A (Media) 1,617 65,666Fox Corp.—Class B (Media) 742 27,588Live Nation Entertainment, Inc.*
(Entertainment) 682 74,686Lumen Technologies, Inc. (Diversified
Telecommunication Services) 4,652 57,499Match Group, Inc.* (Interactive Media &
Services) 1,429 161,048Meta Platforms, Inc.*—Class A (Interactive
Media & Services) 4,622 1,447,888Netflix, Inc.* (Entertainment) 488 208,444News Corp.—Class A (Media) 1,984 44,124News Corp.—Class B (Media) 613 13,633Omnicom Group, Inc. (Media) 1,073 80,861Take-Two Interactive Software, Inc.*
(Entertainment) 581 94,901The Interpublic Group of Cos., Inc. (Media) 1,989 70,689The Walt Disney Co.* (Entertainment) 1,952 279,077T-Mobile U.S., Inc.* (Wireless
Telecommunication Services) 2,597 280,917Twitter, Inc.* (Interactive Media & Services) 4,037 151,428Verizon Communications, Inc. (Diversified
Telecommunication Services) 5,942 316,293ViacomCBS, Inc.—Class B (Media) 3,062 102,424
TOTAL COMMON STOCKS
(Cost $4,642,466) 6,405,654
January 31, 2022 (unaudited) :: Schedule of Portfolio Investments :: Communication Services UltraSector ProFund :: 47
See accompanying notes to the financial statements.
Total Return Swap Agreements—Long
Value and Unrealized
Termination Rate Paid Notional Appreciation/ Underlying Instrument Counterparty Date(1) (Received)(2) Amount (Depreciation)
S&P Communication Services Select Sector Index Goldman Sachs International 2/23/22 0.68% $2,599,616 $40,638S&P Communication Services Select Sector Index UBS AG 2/23/22 0.43% 2,775,887 38,932
$5,375,503 $79,570
(1) Agreements may be terminated at will by either party without penalty. Payment is due at termination/maturity.(2) Reflects the floating financing rate, as of January 31, 2022, on the notional amount of the swap agreement paid to the counterparty or
received from the counterparty, excluding any commissions. This amount is included as part of the unrealized appreciation/(depreciation).
Toppan Merrill - ProFunds Public Semi-Annual Report [Funds] 01-31-2022 ED [AUX] | akiesli | 29-Mar-22 08:43 | 22-1296-2.dc | Sequence: 1CHKSUM Content: 29036 Layout: 6871 Graphics: 0 CLEAN
JOB: 22-1296-2 CYCLE#;BL#: 8; 0 TRIM: 8.25" x 10.75" AS: New York: 212-620-5600COLORS: ~note-color 2, Black, ~note-color 3 GRAPHICS: none V1.5
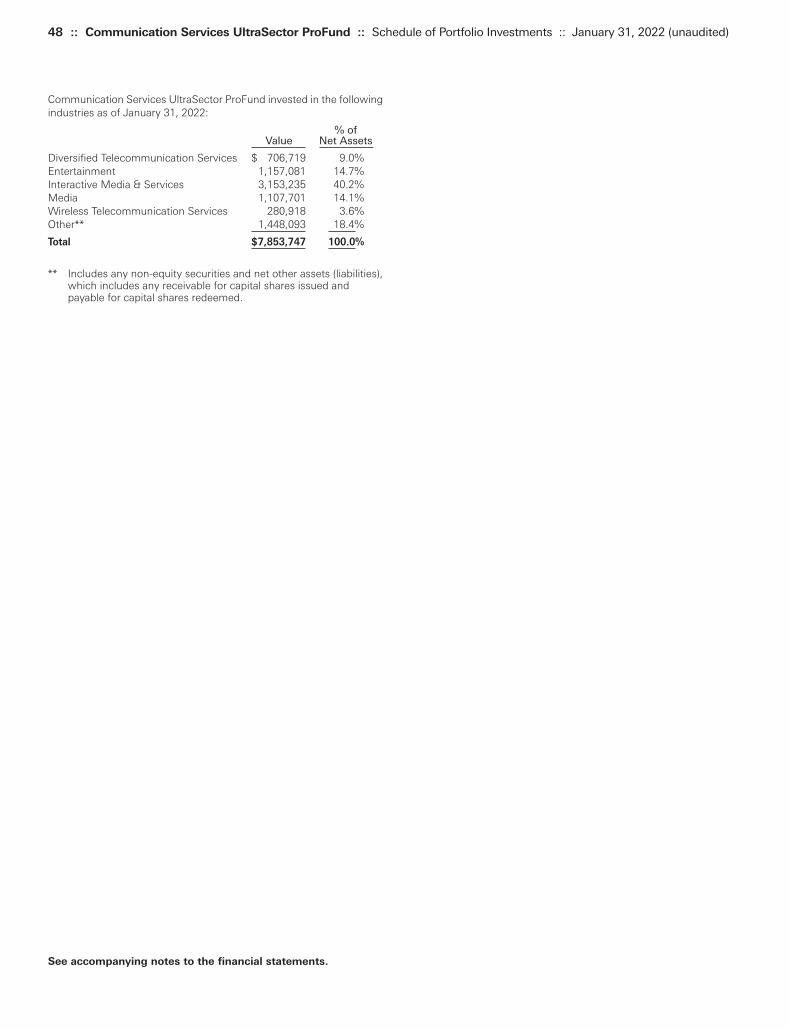
48 :: Communication Services UltraSector ProFund :: Schedule of Portfolio Investments :: January 31, 2022 (unaudited)
Communication Services UltraSector ProFund invested in the followingindustries as of January 31, 2022:
% ofValue Net Assets
Diversified Telecommunication Services $ 706,719 9.0%Entertainment 1,157,081 14.7%Interactive Media & Services 3,153,235 40.2%Media 1,107,701 14.1%Wireless Telecommunication Services 280,918 3.6%Other** 1,448,093 18.4%
Total $7,853,747 100.0%
** Includes any non-equity securities and net other assets (liabilities),which includes any receivable for capital shares issued andpayable for capital shares redeemed.
See accompanying notes to the financial statements.
Toppan Merrill - ProFunds Public Semi-Annual Report [Funds] 01-31-2022 ED [AUX] | akiesli | 29-Mar-22 08:43 | 22-1296-2.dc | Sequence: 2CHKSUM Content: 13537 Layout: 7864 Graphics: 0 CLEAN
JOB: 22-1296-2 CYCLE#;BL#: 8; 0 TRIM: 8.25" x 10.75" AS: New York: 212-620-5600COLORS: ~note-color 2, Black, ~note-color 3 GRAPHICS: none V1.5

Common Stocks, continued
Shares Value
Lucid Group, Inc.*(a) (Automobiles) 1,242 $ 36,502Lululemon Athletica, Inc.* (Textiles,
Apparel & Luxury Goods) 266 88,780Luminar Technologies, Inc.* (Auto
Components) 487 7,130Mattel, Inc.* (Leisure Products) 792 16,569McCormick & Co., Inc. (Food Products) 562 56,374Mohawk Industries, Inc.* (Household
Durables) 123 19,418Molson Coors Beverage Co.—Class B
(Beverages) 426 20,303Mondelez International, Inc.—Class A
(Food Products) 3,146 210,875Monster Beverage Corp.* (Beverages) 847 73,452National Beverage Corp. (Beverages) 54 2,412Newell Brands, Inc. (Household Durables) 856 19,868NIKE, Inc.—Class B (Textiles, Apparel &
Luxury Goods) 2,880 426,441NVR, Inc.* (Household Durables) 7 37,291Peloton Interactive, Inc.*—Class A
(Leisure Products) 674 18,420PepsiCo, Inc. (Beverages) 3,117 540,862Performance Food Group Co.* (Food &
Staples Retailing) 349 14,724Philip Morris International, Inc. (Tobacco) 3,511 361,106Pilgrim’s Pride Corp.* (Food Products) 112 3,133Playtika Holding Corp.* (Entertainment) 233 3,968Polaris, Inc. (Leisure Products) 128 14,412Pool Corp. (Distributors) 90 42,862Post Holdings, Inc.* (Food Products) 131 13,862PulteGroup, Inc. (Household Durables) 572 30,139PVH Corp. (Textiles, Apparel & Luxury Goods) 161 15,297QuantumScape Corp.* (Auto Components) 561 9,363Ralph Lauren Corp. (Textiles, Apparel &
Luxury Goods) 110 12,192Reynolds Consumer Products, Inc.
(Household Products) 125 3,784Rivian Automotive, Inc.*—Class A
(Automobiles) 350 23,009ROBLOX Corp.*—Class A (Entertainment) 96 6,323Seaboard Corp. (Food Products) 1 3,820Skechers U.S.A., Inc.*—Class A (Textiles,
Apparel & Luxury Goods) 305 12,810Stanley Black & Decker, Inc. (Machinery) 368 64,271Take-Two Interactive Software, Inc.*
(Entertainment) 260 42,468Tapestry, Inc. (Textiles, Apparel &
Luxury Goods) 621 23,567Tempur Sealy International, Inc.
(Household Durables) 436 17,357Tesla, Inc.* (Automobiles) 1,832 1,716,071The Boston Beer Co., Inc.*—Class A
(Beverages) 21 8,837The Clorox Co. (Household Products) 276 46,329The Coca-Cola Co. (Beverages) 8,768 534,936The Estee Lauder Co., Inc.
(Personal Products) 523 163,066The Hain Celestial Group, Inc.*
(Food Products) 211 7,708The Hershey Co. (Food Products) 328 64,639
Common Stocks (80.0%)
Shares Value
Activision Blizzard, Inc. (Entertainment) 1,757 $ 138,821Altria Group, Inc. (Tobacco) 4,143 210,796Aptiv PLC* (Auto Components) 610 83,313Archer-Daniels-Midland Co. (Food Products) 1,262 94,649Autoliv, Inc. (Auto Components) 177 17,530Beyond Meat, Inc.*(a) (Food Products) 136 8,858BorgWarner, Inc. (Auto Components) 542 23,767Brown-Forman Corp.—Class B (Beverages) 414 27,916Brunswick Corp. (Leisure Products) 174 15,797Bunge, Ltd. (Food Products) 317 31,339Callaway Golf Co.* (Leisure Products) 266 6,347Campbell Soup Co. (Food Products) 458 20,207Capri Holdings, Ltd.* (Textiles, Apparel &
Luxury Goods) 340 20,424Carter’s, Inc. (Textiles, Apparel &
Luxury Goods) 96 8,940Church & Dwight Co., Inc. (Household
Products) 550 56,458Colgate-Palmolive Co. (Household Products) 1,902 156,820Columbia Sportswear Co. (Textiles, Apparel &
Luxury Goods) 78 7,244Conagra Brands, Inc. (Food Products) 1,084 37,680Constellation Brands, Inc.—Class A
(Beverages) 370 87,968Coty, Inc.*—Class A (Personal Products) 759 6,436Cricut, Inc.*—Class A (Household Durables) 83 1,642Crocs, Inc.* (Textiles, Apparel & Luxury Goods) 132 13,546D.R. Horton, Inc. (Household Durables) 735 65,576Darling Ingredients, Inc.* (Food Products) 366 23,340Deckers Outdoor Corp.* (Textiles, Apparel &
Luxury Goods) 63 20,174Electronic Arts, Inc. (Entertainment) 637 84,504Energizer Holdings, Inc. (Household Products) 143 5,378Flowers Foods, Inc. (Food Products) 450 12,659Ford Motor Co. (Automobiles) 8,852 179,696Fox Factory Holding Corp.* (Auto
Components) 96 12,775Freshpet, Inc.* (Food Products) 98 9,117General Mills, Inc. (Food Products) 1,367 93,886General Motors Co.* (Automobiles) 3,274 172,638Gentex Corp. (Auto Components) 534 16,768Genuine Parts Co. (Distributors) 320 42,634Hanesbrands, Inc. (Textiles, Apparel &
Luxury Goods) 789 12,703Harley-Davidson, Inc. (Automobiles) 349 12,065Hasbro, Inc. (Leisure Products) 292 27,004Helen of Troy, Ltd.* (Household Durables) 54 11,304Herbalife Nutrition, Ltd.* (Personal Products) 225 9,565Hormel Foods Corp. (Food Products) 638 30,286Ingredion, Inc. (Food Products) 151 14,300Kellogg Co. (Food Products) 578 36,414Keurig Dr Pepper, Inc. (Beverages) 1,664 63,149Kimberly-Clark Corp. (Household Products) 760 104,614Lamb Weston Holding, Inc. (Food Products) 330 21,189Lancaster Colony Corp. (Food Products) 45 7,145Lear Corp. (Auto Components) 134 22,421Leggett & Platt, Inc. (Household Durables) 303 12,075Lennar Corp.—Class A (Household Durables) 612 58,818Lennar Corp.—Class B (Household Durables) 36 2,906Levi Strauss & Co. (Textiles, Apparel &
Luxury Goods) 220 4,825
January 31, 2022 (unaudited) :: Schedule of Portfolio Investments :: Consumer Goods UltraSector ProFund :: 49
See accompanying notes to the financial statements.
Toppan Merrill - ProFunds Public Semi-Annual Report [Funds] 01-31-2022 ED [AUX] | akiesli | 29-Mar-22 08:43 | 22-1296-2.dc | Sequence: 3CHKSUM Content: 2383 Layout: 22246 Graphics: 0 CLEAN
JOB: 22-1296-2 CYCLE#;BL#: 8; 0 TRIM: 8.25" x 10.75" AS: New York: 212-620-5600COLORS: ~note-color 2, Black, ~note-color 3 GRAPHICS: none V1.5
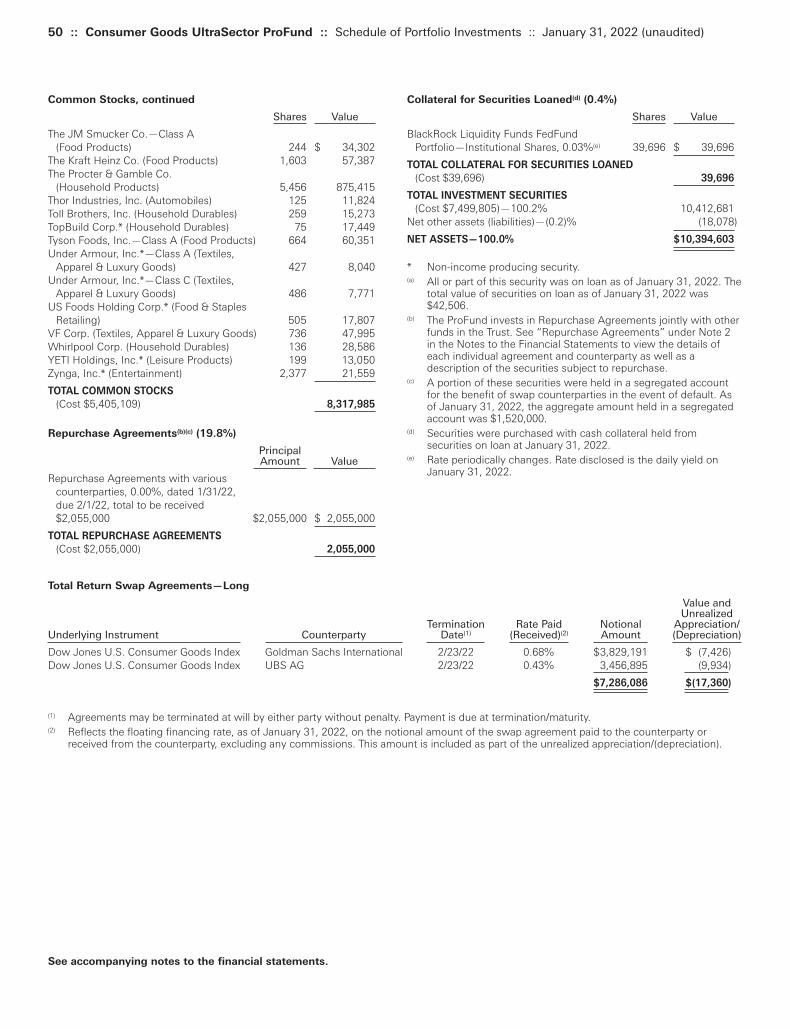
50 :: Consumer Goods UltraSector ProFund :: Schedule of Portfolio Investments :: January 31, 2022 (unaudited)
Collateral for Securities Loaned(d) (0.4%)
Shares Value
BlackRock Liquidity Funds FedFund Portfolio—Institutional Shares, 0.03%(e) 39,696 $ 39,696
TOTAL COLLATERAL FOR SECURITIES LOANED
(Cost $39,696) 39,696
TOTAL INVESTMENT SECURITIES
(Cost $7,499,805)—100.2% 10,412,681Net other assets (liabilities)—(0.2)% (18,078)
NET ASSETS—100.0% $10,394,603
* Non-income producing security.(a) All or part of this security was on loan as of January 31, 2022. The
total value of securities on loan as of January 31, 2022 was$42,506.
(b) The ProFund invests in Repurchase Agreements jointly with otherfunds in the Trust. See “Repurchase Agreements” under Note 2in the Notes to the Financial Statements to view the details ofeach individual agreement and counterparty as well as adescription of the securities subject to repurchase.
(c) A portion of these securities were held in a segregated accountfor the benefit of swap counterparties in the event of default. Asof January 31, 2022, the aggregate amount held in a segregatedaccount was $1,520,000.
(d) Securities were purchased with cash collateral held fromsecurities on loan at January 31, 2022.
(e) Rate periodically changes. Rate disclosed is the daily yield onJanuary 31, 2022.
Common Stocks, continued
Shares Value
The JM Smucker Co.—Class A (Food Products) 244 $ 34,302
The Kraft Heinz Co. (Food Products) 1,603 57,387The Procter & Gamble Co.
(Household Products) 5,456 875,415Thor Industries, Inc. (Automobiles) 125 11,824Toll Brothers, Inc. (Household Durables) 259 15,273TopBuild Corp.* (Household Durables) 75 17,449Tyson Foods, Inc.—Class A (Food Products) 664 60,351Under Armour, Inc.*—Class A (Textiles,
Apparel & Luxury Goods) 427 8,040Under Armour, Inc.*—Class C (Textiles,
Apparel & Luxury Goods) 486 7,771US Foods Holding Corp.* (Food & Staples
Retailing) 505 17,807VF Corp. (Textiles, Apparel & Luxury Goods) 736 47,995Whirlpool Corp. (Household Durables) 136 28,586YETI Holdings, Inc.* (Leisure Products) 199 13,050Zynga, Inc.* (Entertainment) 2,377 21,559
TOTAL COMMON STOCKS
(Cost $5,405,109) 8,317,985
Repurchase Agreements(b)(c) (19.8%)
Principal Amount Value
Repurchase Agreements with various counterparties, 0.00%, dated 1/31/22, due 2/1/22, total to be received $2,055,000 $2,055,000 $ 2,055,000
TOTAL REPURCHASE AGREEMENTS
(Cost $2,055,000) 2,055,000
See accompanying notes to the financial statements.
Total Return Swap Agreements—Long
Value and Unrealized
Termination Rate Paid Notional Appreciation/ Underlying Instrument Counterparty Date(1) (Received)(2) Amount (Depreciation)
Dow Jones U.S. Consumer Goods Index Goldman Sachs International 2/23/22 0.68% $3,829,191 $ (7,426)Dow Jones U.S. Consumer Goods Index UBS AG 2/23/22 0.43% 3,456,895 (9,934)
$7,286,086 $(17,360)
(1) Agreements may be terminated at will by either party without penalty. Payment is due at termination/maturity.(2) Reflects the floating financing rate, as of January 31, 2022, on the notional amount of the swap agreement paid to the counterparty or
received from the counterparty, excluding any commissions. This amount is included as part of the unrealized appreciation/(depreciation).
Toppan Merrill - ProFunds Public Semi-Annual Report [Funds] 01-31-2022 ED [AUX] | akiesli | 29-Mar-22 08:43 | 22-1296-2.dc | Sequence: 4CHKSUM Content: 20813 Layout: 36934 Graphics: 0 CLEAN
JOB: 22-1296-2 CYCLE#;BL#: 8; 0 TRIM: 8.25" x 10.75" AS: New York: 212-620-5600COLORS: ~note-color 2, Black, ~note-color 3 GRAPHICS: none V1.5

Consumer Goods UltraSector ProFund invested in the followingindustries as of January 31, 2022:
% ofValue Net Assets
Auto Components $ 193,067 1.9%Automobiles 2,151,805 20.7%Beverages 1,359,835 13.1%Distributors 85,496 0.8%Entertainment 297,643 2.9%Food & Staples Retailing 32,531 0.3%Food Products 953,520 9.2%Household Durables 337,702 3.2%Household Products 1,248,798 12.0%Leisure Products 111,599 1.1%Machinery 64,271 0.6%Personal Products 179,067 1.7%Textiles, Apparel & Luxury Goods 730,749 7.0%Tobacco 571,902 5.5%Other** 2,076,618 20.0%
Total $10,394,603 100.0%
** Includes any non-equity securities and net other assets (liabilities),which includes any receivable for capital shares issued andpayable for capital shares redeemed.
January 31, 2022 (unaudited) :: Schedule of Portfolio Investments :: Consumer Goods UltraSector ProFund :: 51
See accompanying notes to the financial statements.
Toppan Merrill - ProFunds Public Semi-Annual Report [Funds] 01-31-2022 ED [AUX] | akiesli | 29-Mar-22 08:43 | 22-1296-2.dc | Sequence: 5CHKSUM Content: 36329 Layout: 52512 Graphics: 0 CLEAN
JOB: 22-1296-2 CYCLE#;BL#: 8; 0 TRIM: 8.25" x 10.75" AS: New York: 212-620-5600COLORS: ~note-color 2, Black, ~note-color 3 GRAPHICS: none V1.5
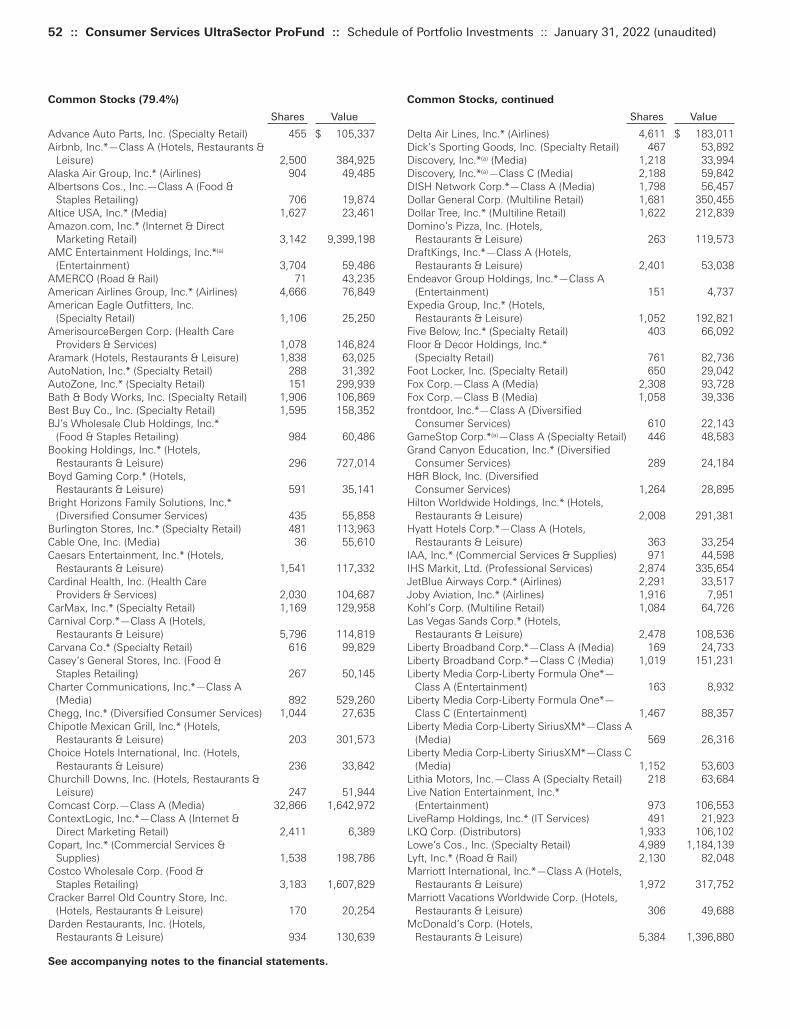
52 :: Consumer Services UltraSector ProFund :: Schedule of Portfolio Investments :: January 31, 2022 (unaudited)
Common Stocks, continued
Shares Value
Delta Air Lines, Inc.* (Airlines) 4,611 $ 183,011Dick’s Sporting Goods, Inc. (Specialty Retail) 467 53,892Discovery, Inc.*(a) (Media) 1,218 33,994Discovery, Inc.*(a)—Class C (Media) 2,188 59,842DISH Network Corp.*—Class A (Media) 1,798 56,457Dollar General Corp. (Multiline Retail) 1,681 350,455Dollar Tree, Inc.* (Multiline Retail) 1,622 212,839Domino’s Pizza, Inc. (Hotels,
Restaurants & Leisure) 263 119,573DraftKings, Inc.*—Class A (Hotels,
Restaurants & Leisure) 2,401 53,038Endeavor Group Holdings, Inc.*—Class A
(Entertainment) 151 4,737Expedia Group, Inc.* (Hotels,
Restaurants & Leisure) 1,052 192,821Five Below, Inc.* (Specialty Retail) 403 66,092Floor & Decor Holdings, Inc.*
(Specialty Retail) 761 82,736Foot Locker, Inc. (Specialty Retail) 650 29,042Fox Corp.—Class A (Media) 2,308 93,728Fox Corp.—Class B (Media) 1,058 39,336frontdoor, Inc.*—Class A (Diversified
Consumer Services) 610 22,143GameStop Corp.*(a)—Class A (Specialty Retail) 446 48,583Grand Canyon Education, Inc.* (Diversified
Consumer Services) 289 24,184H&R Block, Inc. (Diversified
Consumer Services) 1,264 28,895Hilton Worldwide Holdings, Inc.* (Hotels,
Restaurants & Leisure) 2,008 291,381Hyatt Hotels Corp.*—Class A (Hotels,
Restaurants & Leisure) 363 33,254IAA, Inc.* (Commercial Services & Supplies) 971 44,598IHS Markit, Ltd. (Professional Services) 2,874 335,654JetBlue Airways Corp.* (Airlines) 2,291 33,517Joby Aviation, Inc.* (Airlines) 1,916 7,951Kohl’s Corp. (Multiline Retail) 1,084 64,726Las Vegas Sands Corp.* (Hotels,
Restaurants & Leisure) 2,478 108,536Liberty Broadband Corp.*—Class A (Media) 169 24,733Liberty Broadband Corp.*—Class C (Media) 1,019 151,231Liberty Media Corp-Liberty Formula One*—
Class A (Entertainment) 163 8,932Liberty Media Corp-Liberty Formula One*—
Class C (Entertainment) 1,467 88,357Liberty Media Corp-Liberty SiriusXM*—Class A
(Media) 569 26,316Liberty Media Corp-Liberty SiriusXM*—Class C
(Media) 1,152 53,603Lithia Motors, Inc.—Class A (Specialty Retail) 218 63,684Live Nation Entertainment, Inc.*
(Entertainment) 973 106,553LiveRamp Holdings, Inc.* (IT Services) 491 21,923LKQ Corp. (Distributors) 1,933 106,102Lowe’s Cos., Inc. (Specialty Retail) 4,989 1,184,139Lyft, Inc.* (Road & Rail) 2,130 82,048Marriott International, Inc.*—Class A (Hotels,
Restaurants & Leisure) 1,972 317,752Marriott Vacations Worldwide Corp. (Hotels,
Restaurants & Leisure) 306 49,688McDonald’s Corp. (Hotels,
Restaurants & Leisure) 5,384 1,396,880
Common Stocks (79.4%)
Shares Value
Advance Auto Parts, Inc. (Specialty Retail) 455 $ 105,337Airbnb, Inc.*—Class A (Hotels, Restaurants &
Leisure) 2,500 384,925Alaska Air Group, Inc.* (Airlines) 904 49,485Albertsons Cos., Inc.—Class A (Food &
Staples Retailing) 706 19,874Altice USA, Inc.* (Media) 1,627 23,461Amazon.com, Inc.* (Internet & Direct
Marketing Retail) 3,142 9,399,198AMC Entertainment Holdings, Inc.*(a)
(Entertainment) 3,704 59,486AMERCO (Road & Rail) 71 43,235American Airlines Group, Inc.* (Airlines) 4,666 76,849American Eagle Outfitters, Inc.
(Specialty Retail) 1,106 25,250AmerisourceBergen Corp. (Health Care
Providers & Services) 1,078 146,824Aramark (Hotels, Restaurants & Leisure) 1,838 63,025AutoNation, Inc.* (Specialty Retail) 288 31,392AutoZone, Inc.* (Specialty Retail) 151 299,939Bath & Body Works, Inc. (Specialty Retail) 1,906 106,869Best Buy Co., Inc. (Specialty Retail) 1,595 158,352BJ’s Wholesale Club Holdings, Inc.*
(Food & Staples Retailing) 984 60,486Booking Holdings, Inc.* (Hotels,
Restaurants & Leisure) 296 727,014Boyd Gaming Corp.* (Hotels,
Restaurants & Leisure) 591 35,141Bright Horizons Family Solutions, Inc.*
(Diversified Consumer Services) 435 55,858Burlington Stores, Inc.* (Specialty Retail) 481 113,963Cable One, Inc. (Media) 36 55,610Caesars Entertainment, Inc.* (Hotels,
Restaurants & Leisure) 1,541 117,332Cardinal Health, Inc. (Health Care
Providers & Services) 2,030 104,687CarMax, Inc.* (Specialty Retail) 1,169 129,958Carnival Corp.*—Class A (Hotels,
Restaurants & Leisure) 5,796 114,819Carvana Co.* (Specialty Retail) 616 99,829Casey’s General Stores, Inc. (Food &
Staples Retailing) 267 50,145Charter Communications, Inc.*—Class A
(Media) 892 529,260Chegg, Inc.* (Diversified Consumer Services) 1,044 27,635Chipotle Mexican Grill, Inc.* (Hotels,
Restaurants & Leisure) 203 301,573Choice Hotels International, Inc. (Hotels,
Restaurants & Leisure) 236 33,842Churchill Downs, Inc. (Hotels, Restaurants &
Leisure) 247 51,944Comcast Corp.—Class A (Media) 32,866 1,642,972ContextLogic, Inc.*—Class A (Internet &
Direct Marketing Retail) 2,411 6,389Copart, Inc.* (Commercial Services &
Supplies) 1,538 198,786Costco Wholesale Corp. (Food &
Staples Retailing) 3,183 1,607,829Cracker Barrel Old Country Store, Inc.
(Hotels, Restaurants & Leisure) 170 20,254Darden Restaurants, Inc. (Hotels,
Restaurants & Leisure) 934 130,639
See accompanying notes to the financial statements.
Toppan Merrill - ProFunds Public Semi-Annual Report [Funds] 01-31-2022 ED [AUX] | akiesli | 29-Mar-22 08:43 | 22-1296-2.dc | Sequence: 6CHKSUM Content: 50210 Layout: 46902 Graphics: 0 CLEAN
JOB: 22-1296-2 CYCLE#;BL#: 8; 0 TRIM: 8.25" x 10.75" AS: New York: 212-620-5600COLORS: ~note-color 2, Black, ~note-color 3 GRAPHICS: none V1.5
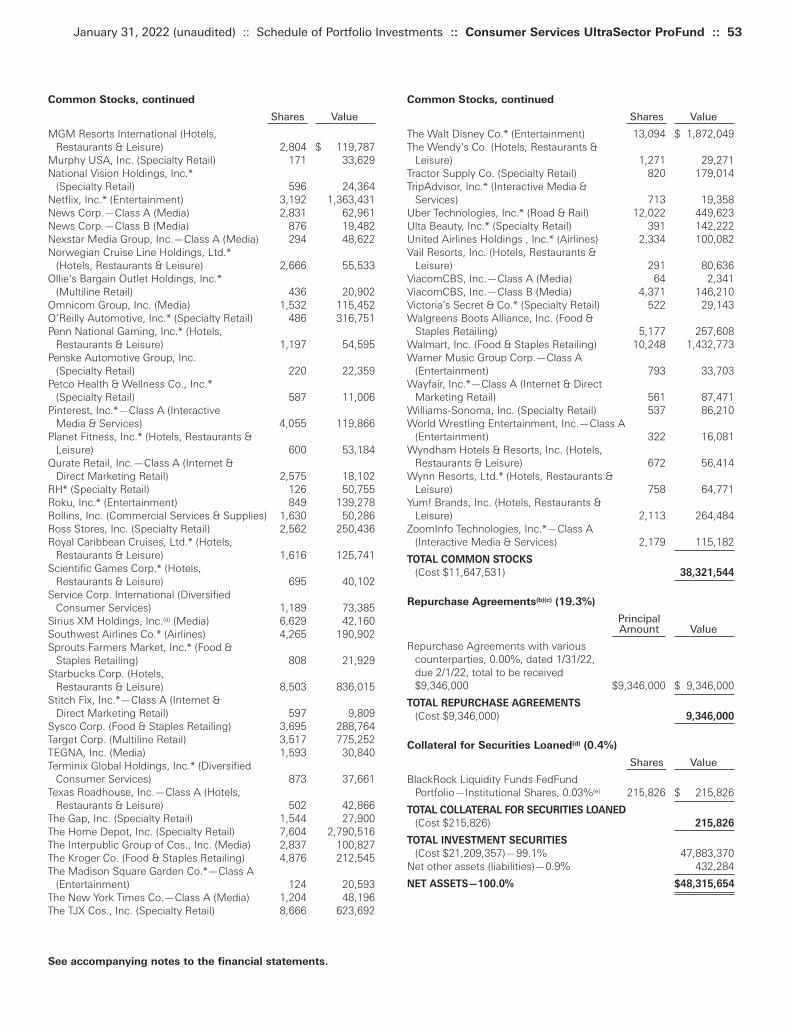
Common Stocks, continued
Shares Value
The Walt Disney Co.* (Entertainment) 13,094 $ 1,872,049The Wendy’s Co. (Hotels, Restaurants &
Leisure) 1,271 29,271Tractor Supply Co. (Specialty Retail) 820 179,014TripAdvisor, Inc.* (Interactive Media &
Services) 713 19,358Uber Technologies, Inc.* (Road & Rail) 12,022 449,623Ulta Beauty, Inc.* (Specialty Retail) 391 142,222United Airlines Holdings , Inc.* (Airlines) 2,334 100,082Vail Resorts, Inc. (Hotels, Restaurants &
Leisure) 291 80,636ViacomCBS, Inc.—Class A (Media) 64 2,341ViacomCBS, Inc.—Class B (Media) 4,371 146,210Victoria’s Secret & Co.* (Specialty Retail) 522 29,143Walgreens Boots Alliance, Inc. (Food &
Staples Retailing) 5,177 257,608Walmart, Inc. (Food & Staples Retailing) 10,248 1,432,773Warner Music Group Corp.—Class A
(Entertainment) 793 33,703Wayfair, Inc.*—Class A (Internet & Direct
Marketing Retail) 561 87,471Williams-Sonoma, Inc. (Specialty Retail) 537 86,210World Wrestling Entertainment, Inc.—Class A
(Entertainment) 322 16,081Wyndham Hotels & Resorts, Inc. (Hotels,
Restaurants & Leisure) 672 56,414Wynn Resorts, Ltd.* (Hotels, Restaurants &
Leisure) 758 64,771Yum! Brands, Inc. (Hotels, Restaurants &
Leisure) 2,113 264,484ZoomInfo Technologies, Inc.*—Class A
(Interactive Media & Services) 2,179 115,182
TOTAL COMMON STOCKS
(Cost $11,647,531) 38,321,544
Repurchase Agreements(b)(c) (19.3%)
Principal Amount Value
Repurchase Agreements with various counterparties, 0.00%, dated 1/31/22, due 2/1/22, total to be received $9,346,000 $9,346,000 $ 9,346,000
TOTAL REPURCHASE AGREEMENTS
(Cost $9,346,000) 9,346,000
Collateral for Securities Loaned(d) (0.4%)
Shares Value
BlackRock Liquidity Funds FedFund Portfolio—Institutional Shares, 0.03%(e) 215,826 $ 215,826
TOTAL COLLATERAL FOR SECURITIES LOANED
(Cost $215,826) 215,826
TOTAL INVESTMENT SECURITIES
(Cost $21,209,357)—99.1% 47,883,370Net other assets (liabilities)—0.9% 432,284
NET ASSETS—100.0% $48,315,654
Common Stocks, continued
Shares Value
MGM Resorts International (Hotels, Restaurants & Leisure) 2,804 $ 119,787
Murphy USA, Inc. (Specialty Retail) 171 33,629National Vision Holdings, Inc.*
(Specialty Retail) 596 24,364Netflix, Inc.* (Entertainment) 3,192 1,363,431News Corp.—Class A (Media) 2,831 62,961News Corp.—Class B (Media) 876 19,482Nexstar Media Group, Inc.—Class A (Media) 294 48,622Norwegian Cruise Line Holdings, Ltd.*
(Hotels, Restaurants & Leisure) 2,666 55,533Ollie’s Bargain Outlet Holdings, Inc.*
(Multiline Retail) 436 20,902Omnicom Group, Inc. (Media) 1,532 115,452O’Reilly Automotive, Inc.* (Specialty Retail) 486 316,751Penn National Gaming, Inc.* (Hotels,
Restaurants & Leisure) 1,197 54,595Penske Automotive Group, Inc.
(Specialty Retail) 220 22,359Petco Health & Wellness Co., Inc.*
(Specialty Retail) 587 11,006Pinterest, Inc.*—Class A (Interactive
Media & Services) 4,055 119,866Planet Fitness, Inc.* (Hotels, Restaurants &
Leisure) 600 53,184Qurate Retail, Inc.—Class A (Internet &
Direct Marketing Retail) 2,575 18,102RH* (Specialty Retail) 126 50,755Roku, Inc.* (Entertainment) 849 139,278Rollins, Inc. (Commercial Services & Supplies) 1,630 50,286Ross Stores, Inc. (Specialty Retail) 2,562 250,436Royal Caribbean Cruises, Ltd.* (Hotels,
Restaurants & Leisure) 1,616 125,741Scientific Games Corp.* (Hotels,
Restaurants & Leisure) 695 40,102Service Corp. International (Diversified
Consumer Services) 1,189 73,385Sirius XM Holdings, Inc.(a) (Media) 6,629 42,160Southwest Airlines Co.* (Airlines) 4,265 190,902Sprouts Farmers Market, Inc.* (Food &
Staples Retailing) 808 21,929Starbucks Corp. (Hotels,
Restaurants & Leisure) 8,503 836,015Stitch Fix, Inc.*—Class A (Internet &
Direct Marketing Retail) 597 9,809Sysco Corp. (Food & Staples Retailing) 3,695 288,764Target Corp. (Multiline Retail) 3,517 775,252TEGNA, Inc. (Media) 1,593 30,840Terminix Global Holdings, Inc.* (Diversified
Consumer Services) 873 37,661Texas Roadhouse, Inc.—Class A (Hotels,
Restaurants & Leisure) 502 42,866The Gap, Inc. (Specialty Retail) 1,544 27,900The Home Depot, Inc. (Specialty Retail) 7,604 2,790,516The Interpublic Group of Cos., Inc. (Media) 2,837 100,827The Kroger Co. (Food & Staples Retailing) 4,876 212,545The Madison Square Garden Co.*—Class A
(Entertainment) 124 20,593The New York Times Co.—Class A (Media) 1,204 48,196The TJX Cos., Inc. (Specialty Retail) 8,666 623,692
January 31, 2022 (unaudited) :: Schedule of Portfolio Investments :: Consumer Services UltraSector ProFund :: 53
See accompanying notes to the financial statements.
Toppan Merrill - ProFunds Public Semi-Annual Report [Funds] 01-31-2022 ED [AUX] | akiesli | 29-Mar-22 08:43 | 22-1296-2.dc | Sequence: 7CHKSUM Content: 10561 Layout: 53689 Graphics: 0 CLEAN
JOB: 22-1296-2 CYCLE#;BL#: 8; 0 TRIM: 8.25" x 10.75" AS: New York: 212-620-5600COLORS: ~note-color 2, Black, ~note-color 3 GRAPHICS: none V1.5

54 :: Consumer Services UltraSector ProFund :: Schedule of Portfolio Investments :: January 31, 2022 (unaudited)
See accompanying notes to the financial statements.
Total Return Swap Agreements—Long
Value and Unrealized
Termination Rate Paid Notional Appreciation/ Underlying Instrument Counterparty Date(1) (Received)(2) Amount (Depreciation)
Dow Jones U.S. Consumer Services Index Goldman Sachs International 2/23/22 0.68% $17,570,948 $366,600Dow Jones U.S. Consumer Services Index UBS AG 2/23/22 0.43% 16,533,769 312,327
$34,104,717 $678,927
(1) Agreements may be terminated at will by either party without penalty. Payment is due at termination/maturity.(2) Reflects the floating financing rate, as of January 31, 2022, on the notional amount of the swap agreement paid to the counterparty or
received from the counterparty, excluding any commissions. This amount is included as part of the unrealized appreciation/(depreciation).
Consumer Services UltraSector ProFund invested in the followingindustries as of January 31, 2022:
% ofValue Net Assets
Airlines $ 641,797 1.3%Commercial Services & Supplies 293,670 0.6%Distributors 106,102 0.2%Diversified Consumer Services 269,761 0.6%Entertainment 3,713,200 7.7%Food & Staples Retailing 3,951,953 8.2%Health Care Providers & Services 251,511 0.5%Hotels, Restaurants & Leisure 6,366,830 13.2%Interactive Media & Services 254,406 0.5%Internet & Direct Marketing Retail 9,520,970 19.8%IT Services 21,923 NM
Media 3,407,634 7.1%Multiline Retail 1,424,173 2.9%Professional Services 335,654 0.7%Road & Rail 574,906 1.2%Specialty Retail 7,187,054 14.9%Other** 9,994,110 20.6%
Total $48,315,654 100.0%
** Includes any non-equity securities and net other assets (liabilities),which includes any receivable for capital shares issued andpayable for capital shares redeemed.
NM Not meaningful, amount is less than 0.05%.
* Non-income producing security.(a) All or part of this security was on loan as of January 31, 2022. The
total value of securities on loan as of January 31, 2022 was$218,661.
(b) The ProFund invests in Repurchase Agreements jointly with otherfunds in the Trust. See “Repurchase Agreements” under Note 2in the Notes to the Financial Statements to view the details ofeach individual agreement and counterparty as well as adescription of the securities subject to repurchase.
(c) A portion of these securities were held in a segregated accountfor the benefit of swap counterparties in the event of default. Asof January 31, 2022, the aggregate amount held in a segregatedaccount was $6,201,000.
(d) Securities were purchased with cash collateral held fromsecurities on loan at January 31, 2022.
(e) Rate periodically changes. Rate disclosed is the daily yield onJanuary 31, 2022.
Toppan Merrill - ProFunds Public Semi-Annual Report [Funds] 01-31-2022 ED [AUX] | akiesli | 29-Mar-22 08:43 | 22-1296-2.dc | Sequence: 8CHKSUM Content: 9244 Layout: 9699 Graphics: 0 CLEAN
JOB: 22-1296-2 CYCLE#;BL#: 8; 0 TRIM: 8.25" x 10.75" AS: New York: 212-620-5600COLORS: ~note-color 2, Black, ~note-color 3 GRAPHICS: none V1.5
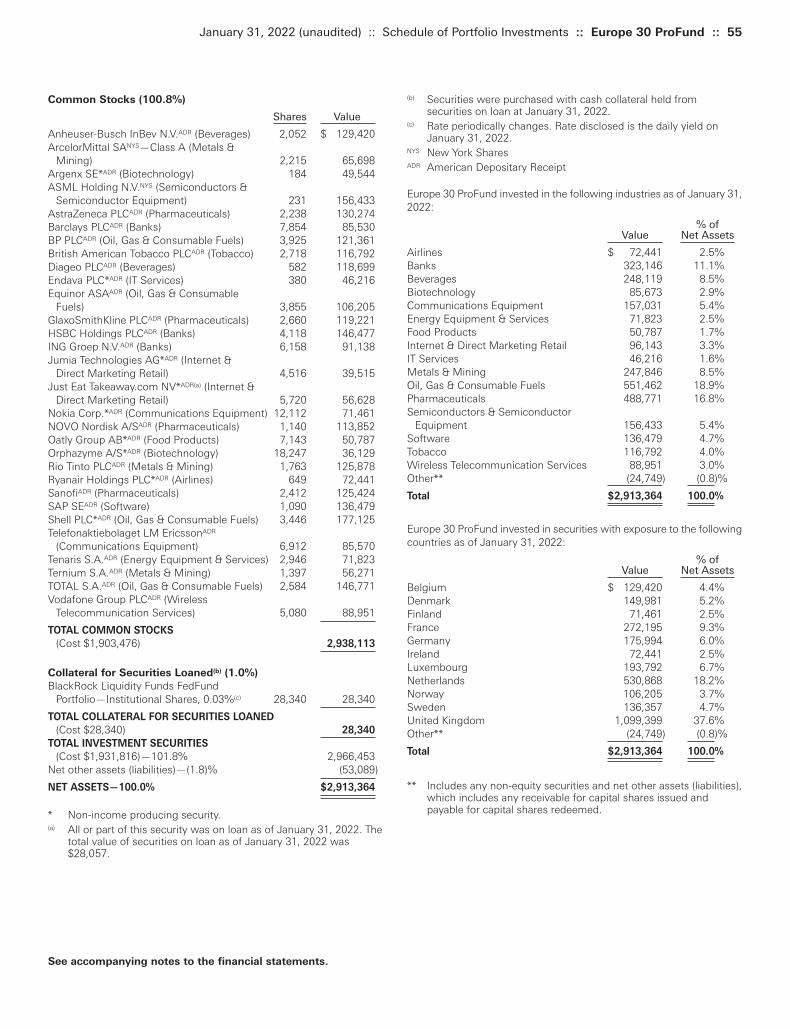
(b) Securities were purchased with cash collateral held fromsecurities on loan at January 31, 2022.
(c) Rate periodically changes. Rate disclosed is the daily yield onJanuary 31, 2022.
NYS New York SharesADR American Depositary Receipt
Europe 30 ProFund invested in the following industries as of January 31,2022:
% ofValue Net Assets
Airlines $ 72,441 2.5%Banks 323,146 11.1%Beverages 248,119 8.5%Biotechnology 85,673 2.9%Communications Equipment 157,031 5.4%Energy Equipment & Services 71,823 2.5%Food Products 50,787 1.7%Internet & Direct Marketing Retail 96,143 3.3%IT Services 46,216 1.6%Metals & Mining 247,846 8.5%Oil, Gas & Consumable Fuels 551,462 18.9%Pharmaceuticals 488,771 16.8%Semiconductors & Semiconductor
Equipment 156,433 5.4%Software 136,479 4.7%Tobacco 116,792 4.0%Wireless Telecommunication Services 88,951 3.0%Other** (24,749) (0.8)%
Total $2,913,364 100.0%
Europe 30 ProFund invested in securities with exposure to the followingcountries as of January 31, 2022:
% ofValue Net Assets
Belgium $ 129,420 4.4%Denmark 149,981 5.2%Finland 71,461 2.5%France 272,195 9.3%Germany 175,994 6.0%Ireland 72,441 2.5%Luxembourg 193,792 6.7%Netherlands 530,868 18.2%Norway 106,205 3.7%Sweden 136,357 4.7%United Kingdom 1,099,399 37.6%Other** (24,749) (0.8)%
Total $2,913,364 100.0%
** Includes any non-equity securities and net other assets (liabilities),which includes any receivable for capital shares issued andpayable for capital shares redeemed.
Common Stocks (100.8%)
Shares Value
Anheuser-Busch InBev N.V.ADR (Beverages) 2,052 $ 129,420ArcelorMittal SANYS—Class A (Metals &
Mining) 2,215 65,698Argenx SE*ADR (Biotechnology) 184 49,544ASML Holding N.V.NYS (Semiconductors &
Semiconductor Equipment) 231 156,433AstraZeneca PLCADR (Pharmaceuticals) 2,238 130,274Barclays PLCADR (Banks) 7,854 85,530BP PLCADR (Oil, Gas & Consumable Fuels) 3,925 121,361British American Tobacco PLCADR (Tobacco) 2,718 116,792Diageo PLCADR (Beverages) 582 118,699Endava PLC*ADR (IT Services) 380 46,216Equinor ASAADR (Oil, Gas & Consumable
Fuels) 3,855 106,205GlaxoSmithKline PLCADR (Pharmaceuticals) 2,660 119,221HSBC Holdings PLCADR (Banks) 4,118 146,477ING Groep N.V.ADR (Banks) 6,158 91,138Jumia Technologies AG*ADR (Internet &
Direct Marketing Retail) 4,516 39,515Just Eat Takeaway.com NV*ADR(a) (Internet &
Direct Marketing Retail) 5,720 56,628Nokia Corp.*ADR (Communications Equipment) 12,112 71,461NOVO Nordisk A/SADR (Pharmaceuticals) 1,140 113,852Oatly Group AB*ADR (Food Products) 7,143 50,787Orphazyme A/S*ADR (Biotechnology) 18,247 36,129Rio Tinto PLCADR (Metals & Mining) 1,763 125,878Ryanair Holdings PLC*ADR (Airlines) 649 72,441SanofiADR (Pharmaceuticals) 2,412 125,424SAP SEADR (Software) 1,090 136,479Shell PLC*ADR (Oil, Gas & Consumable Fuels) 3,446 177,125Telefonaktiebolaget LM EricssonADR
(Communications Equipment) 6,912 85,570Tenaris S.A.ADR (Energy Equipment & Services) 2,946 71,823Ternium S.A.ADR (Metals & Mining) 1,397 56,271TOTAL S.A.ADR (Oil, Gas & Consumable Fuels) 2,584 146,771Vodafone Group PLCADR (Wireless
Telecommunication Services) 5,080 88,951
TOTAL COMMON STOCKS
(Cost $1,903,476) 2,938,113
Collateral for Securities Loaned(b) (1.0%)
BlackRock Liquidity Funds FedFund Portfolio—Institutional Shares, 0.03%(c) 28,340 28,340
TOTAL COLLATERAL FOR SECURITIES LOANED
(Cost $28,340) 28,340
TOTAL INVESTMENT SECURITIES
(Cost $1,931,816)—101.8% 2,966,453Net other assets (liabilities)—(1.8)% (53,089)
NET ASSETS—100.0% $2,913,364
* Non-income producing security.(a) All or part of this security was on loan as of January 31, 2022. The
total value of securities on loan as of January 31, 2022 was$28,057.
January 31, 2022 (unaudited) :: Schedule of Portfolio Investments :: Europe 30 ProFund :: 55
See accompanying notes to the financial statements.
Toppan Merrill - ProFunds Public Semi-Annual Report [Funds] 01-31-2022 ED [AUX] | akiesli | 29-Mar-22 08:43 | 22-1296-2.dc | Sequence: 9CHKSUM Content: 9481 Layout: 636 Graphics: 0 CLEAN
JOB: 22-1296-2 CYCLE#;BL#: 8; 0 TRIM: 8.25" x 10.75" AS: New York: 212-620-5600COLORS: ~note-color 2, Black, ~note-color 3 GRAPHICS: none V1.5
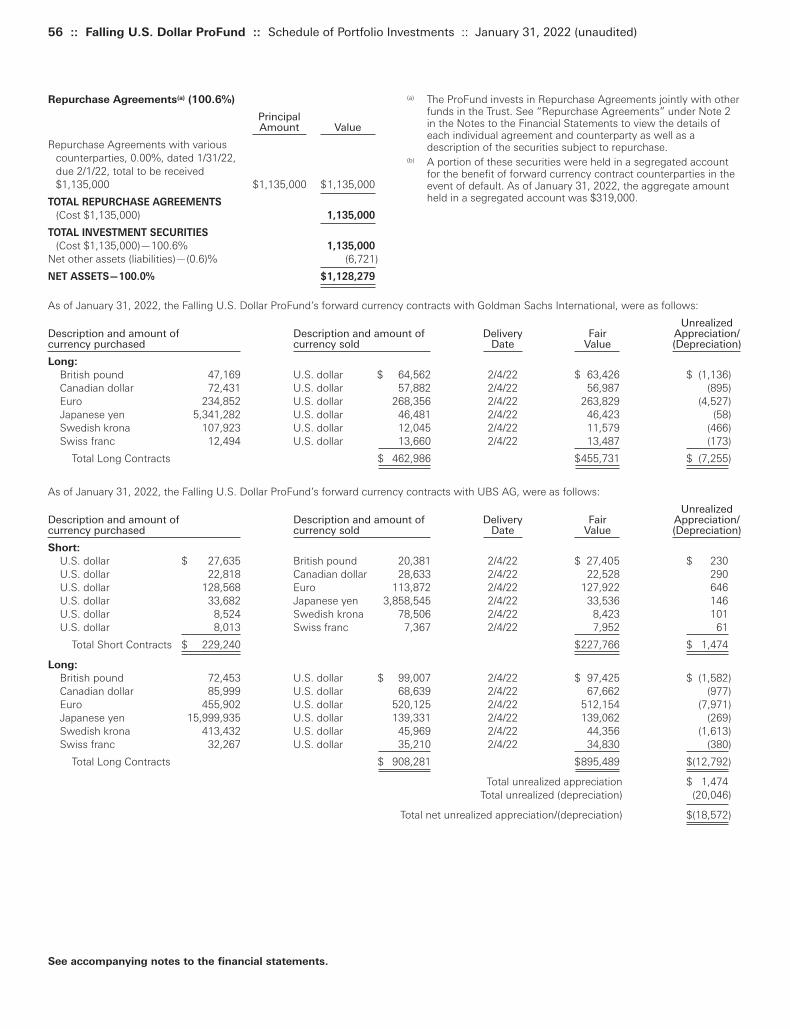
56 :: Falling U.S. Dollar ProFund :: Schedule of Portfolio Investments :: January 31, 2022 (unaudited)
See accompanying notes to the financial statements.
(a) The ProFund invests in Repurchase Agreements jointly with otherfunds in the Trust. See “Repurchase Agreements” under Note 2in the Notes to the Financial Statements to view the details ofeach individual agreement and counterparty as well as adescription of the securities subject to repurchase.
(b) A portion of these securities were held in a segregated accountfor the benefit of forward currency contract counterparties in theevent of default. As of January 31, 2022, the aggregate amountheld in a segregated account was $319,000.
Repurchase Agreements(a) (100.6%)
Principal Amount Value
Repurchase Agreements with various counterparties, 0.00%, dated 1/31/22, due 2/1/22, total to be received $1,135,000 $1,135,000 $1,135,000
TOTAL REPURCHASE AGREEMENTS
(Cost $1,135,000) 1,135,000
TOTAL INVESTMENT SECURITIES
(Cost $1,135,000)—100.6% 1,135,000
Net other assets (liabilities)—(0.6)% (6,721)
NET ASSETS—100.0% $1,128,279
As of January 31, 2022, the Falling U.S. Dollar ProFund’s forward currency contracts with Goldman Sachs International, were as follows:
UnrealizedDescription and amount of Description and amount of Delivery Fair Appreciation/currency purchased currency sold Date Value (Depreciation)
Long:
British pound 47,169 U.S. dollar $ 64,562 2/4/22 $ 63,426 $ (1,136)Canadian dollar 72,431 U.S. dollar 57,882 2/4/22 56,987 (895)Euro 234,852 U.S. dollar 268,356 2/4/22 263,829 (4,527)Japanese yen 5,341,282 U.S. dollar 46,481 2/4/22 46,423 (58)Swedish krona 107,923 U.S. dollar 12,045 2/4/22 11,579 (466)Swiss franc 12,494 U.S. dollar 13,660 2/4/22 13,487 (173)
Total Long Contracts $ 462,986 $455,731 $ (7,255)
As of January 31, 2022, the Falling U.S. Dollar ProFund’s forward currency contracts with UBS AG, were as follows:
UnrealizedDescription and amount of Description and amount of Delivery Fair Appreciation/currency purchased currency sold Date Value (Depreciation)
Short:
U.S. dollar $ 27,635 British pound 20,381 2/4/22 $ 27,405 $ 230U.S. dollar 22,818 Canadian dollar 28,633 2/4/22 22,528 290U.S. dollar 128,568 Euro 113,872 2/4/22 127,922 646U.S. dollar 33,682 Japanese yen 3,858,545 2/4/22 33,536 146U.S. dollar 8,524 Swedish krona 78,506 2/4/22 8,423 101U.S. dollar 8,013 Swiss franc 7,367 2/4/22 7,952 61
Total Short Contracts $ 229,240 $227,766 $ 1,474
Long:
British pound 72,453 U.S. dollar $ 99,007 2/4/22 $ 97,425 $ (1,582)Canadian dollar 85,999 U.S. dollar 68,639 2/4/22 67,662 (977)Euro 455,902 U.S. dollar 520,125 2/4/22 512,154 (7,971)Japanese yen 15,999,935 U.S. dollar 139,331 2/4/22 139,062 (269)Swedish krona 413,432 U.S. dollar 45,969 2/4/22 44,356 (1,613)Swiss franc 32,267 U.S. dollar 35,210 2/4/22 34,830 (380)
Total Long Contracts $ 908,281 $895,489 $(12,792)
Total unrealized appreciation $ 1,474Total unrealized (depreciation) (20,046)
Total net unrealized appreciation/(depreciation) $(18,572)
Toppan Merrill - ProFunds Public Semi-Annual Report [Funds] 01-31-2022 ED [AUX] | akiesli | 29-Mar-22 08:43 | 22-1296-2.dc | Sequence: 10CHKSUM Content: 630 Layout: 50802 Graphics: 0 CLEAN
JOB: 22-1296-2 CYCLE#;BL#: 8; 0 TRIM: 8.25" x 10.75" AS: New York: 212-620-5600COLORS: ~note-color 2, Black, ~note-color 3 GRAPHICS: none V1.5
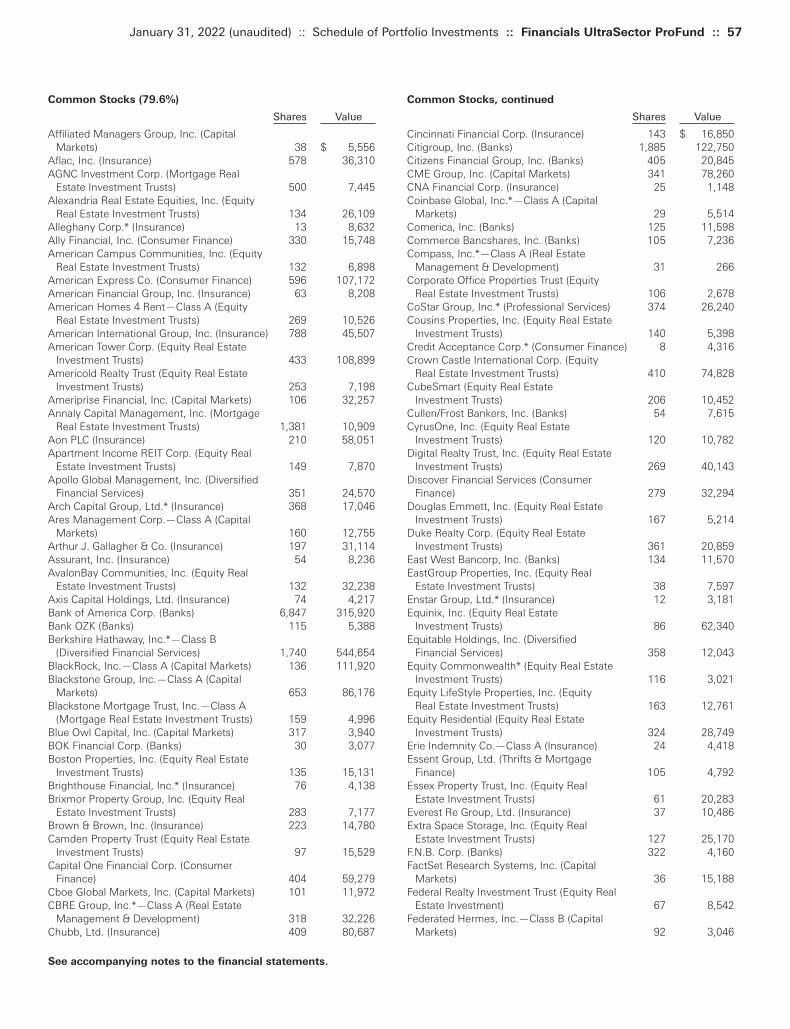
Common Stocks, continued
Shares Value
Cincinnati Financial Corp. (Insurance) 143 $ 16,850Citigroup, Inc. (Banks) 1,885 122,750Citizens Financial Group, Inc. (Banks) 405 20,845CME Group, Inc. (Capital Markets) 341 78,260CNA Financial Corp. (Insurance) 25 1,148Coinbase Global, Inc.*—Class A (Capital
Markets) 29 5,514Comerica, Inc. (Banks) 125 11,598Commerce Bancshares, Inc. (Banks) 105 7,236Compass, Inc.*—Class A (Real Estate
Management & Development) 31 266Corporate Office Properties Trust (Equity
Real Estate Investment Trusts) 106 2,678CoStar Group, Inc.* (Professional Services) 374 26,240Cousins Properties, Inc. (Equity Real Estate
Investment Trusts) 140 5,398Credit Acceptance Corp.* (Consumer Finance) 8 4,316Crown Castle International Corp. (Equity
Real Estate Investment Trusts) 410 74,828CubeSmart (Equity Real Estate
Investment Trusts) 206 10,452Cullen/Frost Bankers, Inc. (Banks) 54 7,615CyrusOne, Inc. (Equity Real Estate
Investment Trusts) 120 10,782Digital Realty Trust, Inc. (Equity Real Estate
Investment Trusts) 269 40,143Discover Financial Services (Consumer
Finance) 279 32,294Douglas Emmett, Inc. (Equity Real Estate
Investment Trusts) 167 5,214Duke Realty Corp. (Equity Real Estate
Investment Trusts) 361 20,859East West Bancorp, Inc. (Banks) 134 11,570EastGroup Properties, Inc. (Equity Real
Estate Investment Trusts) 38 7,597Enstar Group, Ltd.* (Insurance) 12 3,181Equinix, Inc. (Equity Real Estate
Investment Trusts) 86 62,340Equitable Holdings, Inc. (Diversified
Financial Services) 358 12,043Equity Commonwealth* (Equity Real Estate
Investment Trusts) 116 3,021Equity LifeStyle Properties, Inc. (Equity
Real Estate Investment Trusts) 163 12,761Equity Residential (Equity Real Estate
Investment Trusts) 324 28,749Erie Indemnity Co.—Class A (Insurance) 24 4,418Essent Group, Ltd. (Thrifts & Mortgage
Finance) 105 4,792Essex Property Trust, Inc. (Equity Real
Estate Investment Trusts) 61 20,283Everest Re Group, Ltd. (Insurance) 37 10,486Extra Space Storage, Inc. (Equity Real
Estate Investment Trusts) 127 25,170F.N.B. Corp. (Banks) 322 4,160FactSet Research Systems, Inc. (Capital
Markets) 36 15,188Federal Realty Investment Trust (Equity Real
Estate Investment) 67 8,542Federated Hermes, Inc.—Class B (Capital
Markets) 92 3,046
Common Stocks (79.6%)
Shares Value
Affiliated Managers Group, Inc. (Capital Markets) 38 $ 5,556
Aflac, Inc. (Insurance) 578 36,310AGNC Investment Corp. (Mortgage Real
Estate Investment Trusts) 500 7,445Alexandria Real Estate Equities, Inc. (Equity
Real Estate Investment Trusts) 134 26,109Alleghany Corp.* (Insurance) 13 8,632Ally Financial, Inc. (Consumer Finance) 330 15,748American Campus Communities, Inc. (Equity
Real Estate Investment Trusts) 132 6,898American Express Co. (Consumer Finance) 596 107,172American Financial Group, Inc. (Insurance) 63 8,208American Homes 4 Rent—Class A (Equity
Real Estate Investment Trusts) 269 10,526American International Group, Inc. (Insurance) 788 45,507American Tower Corp. (Equity Real Estate
Investment Trusts) 433 108,899Americold Realty Trust (Equity Real Estate
Investment Trusts) 253 7,198Ameriprise Financial, Inc. (Capital Markets) 106 32,257Annaly Capital Management, Inc. (Mortgage
Real Estate Investment Trusts) 1,381 10,909Aon PLC (Insurance) 210 58,051Apartment Income REIT Corp. (Equity Real
Estate Investment Trusts) 149 7,870Apollo Global Management, Inc. (Diversified
Financial Services) 351 24,570Arch Capital Group, Ltd.* (Insurance) 368 17,046Ares Management Corp.—Class A (Capital
Markets) 160 12,755Arthur J. Gallagher & Co. (Insurance) 197 31,114Assurant, Inc. (Insurance) 54 8,236AvalonBay Communities, Inc. (Equity Real
Estate Investment Trusts) 132 32,238Axis Capital Holdings, Ltd. (Insurance) 74 4,217Bank of America Corp. (Banks) 6,847 315,920Bank OZK (Banks) 115 5,388Berkshire Hathaway, Inc.*—Class B
(Diversified Financial Services) 1,740 544,654BlackRock, Inc.—Class A (Capital Markets) 136 111,920Blackstone Group, Inc.—Class A (Capital
Markets) 653 86,176Blackstone Mortgage Trust, Inc.—Class A
(Mortgage Real Estate Investment Trusts) 159 4,996Blue Owl Capital, Inc. (Capital Markets) 317 3,940BOK Financial Corp. (Banks) 30 3,077Boston Properties, Inc. (Equity Real Estate
Investment Trusts) 135 15,131Brighthouse Financial, Inc.* (Insurance) 76 4,138Brixmor Property Group, Inc. (Equity Real
Estate Investment Trusts) 283 7,177Brown & Brown, Inc. (Insurance) 223 14,780Camden Property Trust (Equity Real Estate
Investment Trusts) 97 15,529Capital One Financial Corp. (Consumer
Finance) 404 59,279Cboe Global Markets, Inc. (Capital Markets) 101 11,972CBRE Group, Inc.*—Class A (Real Estate
Management & Development) 318 32,226Chubb, Ltd. (Insurance) 409 80,687
January 31, 2022 (unaudited) :: Schedule of Portfolio Investments :: Financials UltraSector ProFund :: 57
See accompanying notes to the financial statements.
Toppan Merrill - ProFunds Public Semi-Annual Report [Funds] 01-31-2022 ED [AUX] | akiesli | 29-Mar-22 08:43 | 22-1296-2.dc | Sequence: 11CHKSUM Content: 23704 Layout: 36242 Graphics: 0 CLEAN
JOB: 22-1296-2 CYCLE#;BL#: 8; 0 TRIM: 8.25" x 10.75" AS: New York: 212-620-5600COLORS: ~note-color 2, Black, ~note-color 3 GRAPHICS: none V1.5
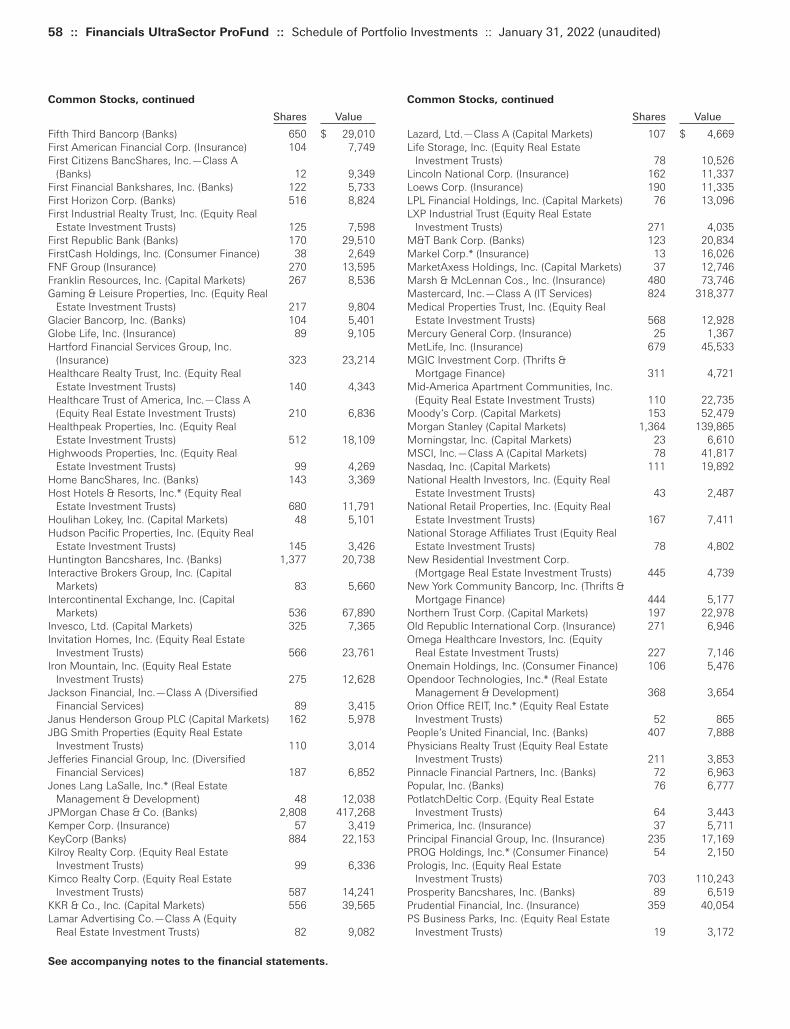
58 :: Financials UltraSector ProFund :: Schedule of Portfolio Investments :: January 31, 2022 (unaudited)
Common Stocks, continued
Shares Value
Lazard, Ltd.—Class A (Capital Markets) 107 $ 4,669Life Storage, Inc. (Equity Real Estate
Investment Trusts) 78 10,526Lincoln National Corp. (Insurance) 162 11,337Loews Corp. (Insurance) 190 11,335LPL Financial Holdings, Inc. (Capital Markets) 76 13,096LXP Industrial Trust (Equity Real Estate
Investment Trusts) 271 4,035M&T Bank Corp. (Banks) 123 20,834Markel Corp.* (Insurance) 13 16,026MarketAxess Holdings, Inc. (Capital Markets) 37 12,746Marsh & McLennan Cos., Inc. (Insurance) 480 73,746Mastercard, Inc.—Class A (IT Services) 824 318,377Medical Properties Trust, Inc. (Equity Real
Estate Investment Trusts) 568 12,928Mercury General Corp. (Insurance) 25 1,367MetLife, Inc. (Insurance) 679 45,533MGIC Investment Corp. (Thrifts &
Mortgage Finance) 311 4,721Mid-America Apartment Communities, Inc.
(Equity Real Estate Investment Trusts) 110 22,735Moody’s Corp. (Capital Markets) 153 52,479Morgan Stanley (Capital Markets) 1,364 139,865Morningstar, Inc. (Capital Markets) 23 6,610MSCI, Inc.—Class A (Capital Markets) 78 41,817Nasdaq, Inc. (Capital Markets) 111 19,892National Health Investors, Inc. (Equity Real
Estate Investment Trusts) 43 2,487National Retail Properties, Inc. (Equity Real
Estate Investment Trusts) 167 7,411National Storage Affiliates Trust (Equity Real
Estate Investment Trusts) 78 4,802New Residential Investment Corp.
(Mortgage Real Estate Investment Trusts) 445 4,739New York Community Bancorp, Inc. (Thrifts &
Mortgage Finance) 444 5,177Northern Trust Corp. (Capital Markets) 197 22,978Old Republic International Corp. (Insurance) 271 6,946Omega Healthcare Investors, Inc. (Equity
Real Estate Investment Trusts) 227 7,146Onemain Holdings, Inc. (Consumer Finance) 106 5,476Opendoor Technologies, Inc.* (Real Estate
Management & Development) 368 3,654Orion Office REIT, Inc.* (Equity Real Estate
Investment Trusts) 52 865People’s United Financial, Inc. (Banks) 407 7,888Physicians Realty Trust (Equity Real Estate
Investment Trusts) 211 3,853Pinnacle Financial Partners, Inc. (Banks) 72 6,963Popular, Inc. (Banks) 76 6,777PotlatchDeltic Corp. (Equity Real Estate
Investment Trusts) 64 3,443Primerica, Inc. (Insurance) 37 5,711Principal Financial Group, Inc. (Insurance) 235 17,169PROG Holdings, Inc.* (Consumer Finance) 54 2,150Prologis, Inc. (Equity Real Estate
Investment Trusts) 703 110,243Prosperity Bancshares, Inc. (Banks) 89 6,519Prudential Financial, Inc. (Insurance) 359 40,054PS Business Parks, Inc. (Equity Real Estate
Investment Trusts) 19 3,172
Common Stocks, continued
Shares Value
Fifth Third Bancorp (Banks) 650 $ 29,010First American Financial Corp. (Insurance) 104 7,749First Citizens BancShares, Inc.—Class A
(Banks) 12 9,349First Financial Bankshares, Inc. (Banks) 122 5,733First Horizon Corp. (Banks) 516 8,824First Industrial Realty Trust, Inc. (Equity Real
Estate Investment Trusts) 125 7,598First Republic Bank (Banks) 170 29,510FirstCash Holdings, Inc. (Consumer Finance) 38 2,649FNF Group (Insurance) 270 13,595Franklin Resources, Inc. (Capital Markets) 267 8,536Gaming & Leisure Properties, Inc. (Equity Real
Estate Investment Trusts) 217 9,804Glacier Bancorp, Inc. (Banks) 104 5,401Globe Life, Inc. (Insurance) 89 9,105Hartford Financial Services Group, Inc.
(Insurance) 323 23,214Healthcare Realty Trust, Inc. (Equity Real
Estate Investment Trusts) 140 4,343Healthcare Trust of America, Inc.—Class A
(Equity Real Estate Investment Trusts) 210 6,836Healthpeak Properties, Inc. (Equity Real
Estate Investment Trusts) 512 18,109Highwoods Properties, Inc. (Equity Real
Estate Investment Trusts) 99 4,269Home BancShares, Inc. (Banks) 143 3,369Host Hotels & Resorts, Inc.* (Equity Real
Estate Investment Trusts) 680 11,791Houlihan Lokey, Inc. (Capital Markets) 48 5,101Hudson Pacific Properties, Inc. (Equity Real
Estate Investment Trusts) 145 3,426Huntington Bancshares, Inc. (Banks) 1,377 20,738Interactive Brokers Group, Inc. (Capital
Markets) 83 5,660Intercontinental Exchange, Inc. (Capital
Markets) 536 67,890Invesco, Ltd. (Capital Markets) 325 7,365Invitation Homes, Inc. (Equity Real Estate
Investment Trusts) 566 23,761Iron Mountain, Inc. (Equity Real Estate
Investment Trusts) 275 12,628Jackson Financial, Inc.—Class A (Diversified
Financial Services) 89 3,415Janus Henderson Group PLC (Capital Markets) 162 5,978JBG Smith Properties (Equity Real Estate
Investment Trusts) 110 3,014Jefferies Financial Group, Inc. (Diversified
Financial Services) 187 6,852Jones Lang LaSalle, Inc.* (Real Estate
Management & Development) 48 12,038JPMorgan Chase & Co. (Banks) 2,808 417,268Kemper Corp. (Insurance) 57 3,419KeyCorp (Banks) 884 22,153Kilroy Realty Corp. (Equity Real Estate
Investment Trusts) 99 6,336Kimco Realty Corp. (Equity Real Estate
Investment Trusts) 587 14,241KKR & Co., Inc. (Capital Markets) 556 39,565Lamar Advertising Co.—Class A (Equity
Real Estate Investment Trusts) 82 9,082
See accompanying notes to the financial statements.
Toppan Merrill - ProFunds Public Semi-Annual Report [Funds] 01-31-2022 ED [AUX] | akiesli | 29-Mar-22 08:43 | 22-1296-2.dc | Sequence: 12CHKSUM Content: 16709 Layout: 47328 Graphics: 0 CLEAN
JOB: 22-1296-2 CYCLE#;BL#: 8; 0 TRIM: 8.25" x 10.75" AS: New York: 212-620-5600COLORS: ~note-color 2, Black, ~note-color 3 GRAPHICS: none V1.5
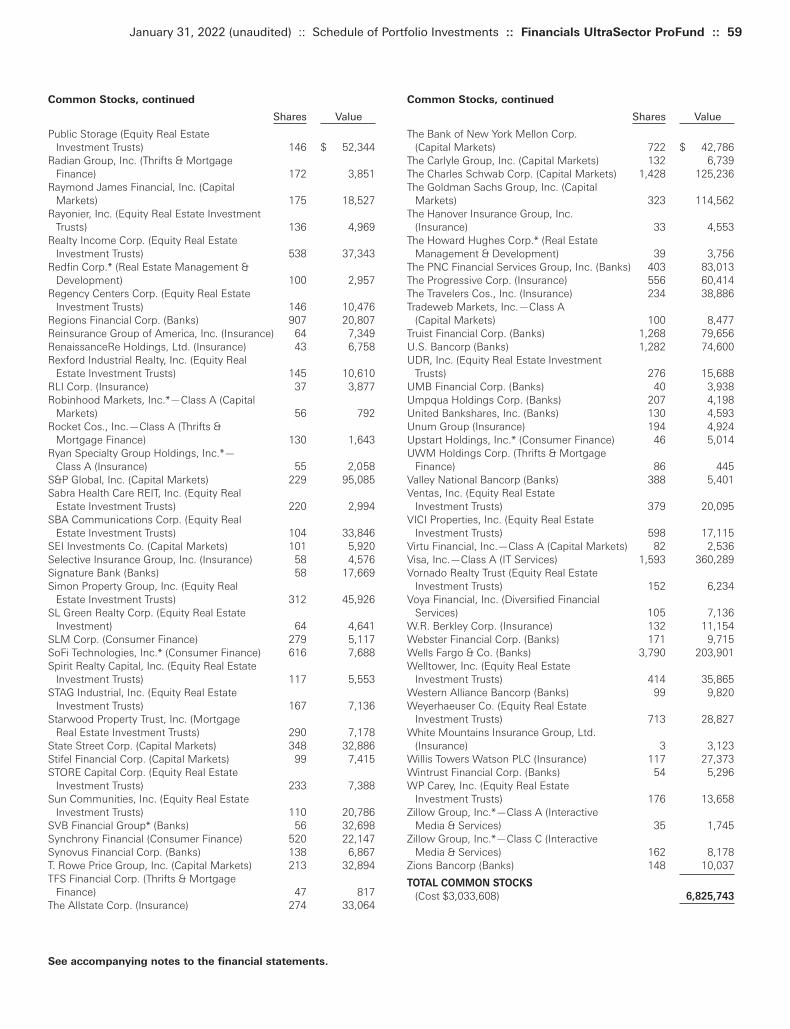
Common Stocks, continued
Shares Value
The Bank of New York Mellon Corp. (Capital Markets) 722 $ 42,786
The Carlyle Group, Inc. (Capital Markets) 132 6,739The Charles Schwab Corp. (Capital Markets) 1,428 125,236The Goldman Sachs Group, Inc. (Capital
Markets) 323 114,562The Hanover Insurance Group, Inc.
(Insurance) 33 4,553The Howard Hughes Corp.* (Real Estate
Management & Development) 39 3,756The PNC Financial Services Group, Inc. (Banks) 403 83,013The Progressive Corp. (Insurance) 556 60,414The Travelers Cos., Inc. (Insurance) 234 38,886Tradeweb Markets, Inc.—Class A
(Capital Markets) 100 8,477Truist Financial Corp. (Banks) 1,268 79,656U.S. Bancorp (Banks) 1,282 74,600UDR, Inc. (Equity Real Estate Investment
Trusts) 276 15,688UMB Financial Corp. (Banks) 40 3,938Umpqua Holdings Corp. (Banks) 207 4,198United Bankshares, Inc. (Banks) 130 4,593Unum Group (Insurance) 194 4,924Upstart Holdings, Inc.* (Consumer Finance) 46 5,014UWM Holdings Corp. (Thrifts & Mortgage
Finance) 86 445Valley National Bancorp (Banks) 388 5,401Ventas, Inc. (Equity Real Estate
Investment Trusts) 379 20,095VICI Properties, Inc. (Equity Real Estate
Investment Trusts) 598 17,115Virtu Financial, Inc.—Class A (Capital Markets) 82 2,536Visa, Inc.—Class A (IT Services) 1,593 360,289Vornado Realty Trust (Equity Real Estate
Investment Trusts) 152 6,234Voya Financial, Inc. (Diversified Financial
Services) 105 7,136W.R. Berkley Corp. (Insurance) 132 11,154Webster Financial Corp. (Banks) 171 9,715Wells Fargo & Co. (Banks) 3,790 203,901Welltower, Inc. (Equity Real Estate
Investment Trusts) 414 35,865Western Alliance Bancorp (Banks) 99 9,820Weyerhaeuser Co. (Equity Real Estate
Investment Trusts) 713 28,827White Mountains Insurance Group, Ltd.
(Insurance) 3 3,123Willis Towers Watson PLC (Insurance) 117 27,373Wintrust Financial Corp. (Banks) 54 5,296WP Carey, Inc. (Equity Real Estate
Investment Trusts) 176 13,658Zillow Group, Inc.*—Class A (Interactive
Media & Services) 35 1,745Zillow Group, Inc.*—Class C (Interactive
Media & Services) 162 8,178Zions Bancorp (Banks) 148 10,037
TOTAL COMMON STOCKS
(Cost $3,033,608) 6,825,743
Common Stocks, continued
Shares Value
Public Storage (Equity Real Estate Investment Trusts) 146 $ 52,344
Radian Group, Inc. (Thrifts & Mortgage Finance) 172 3,851
Raymond James Financial, Inc. (Capital Markets) 175 18,527
Rayonier, Inc. (Equity Real Estate Investment Trusts) 136 4,969
Realty Income Corp. (Equity Real Estate Investment Trusts) 538 37,343
Redfin Corp.* (Real Estate Management & Development) 100 2,957
Regency Centers Corp. (Equity Real Estate Investment Trusts) 146 10,476
Regions Financial Corp. (Banks) 907 20,807Reinsurance Group of America, Inc. (Insurance) 64 7,349RenaissanceRe Holdings, Ltd. (Insurance) 43 6,758Rexford Industrial Realty, Inc. (Equity Real
Estate Investment Trusts) 145 10,610RLI Corp. (Insurance) 37 3,877Robinhood Markets, Inc.*—Class A (Capital
Markets) 56 792Rocket Cos., Inc.—Class A (Thrifts &
Mortgage Finance) 130 1,643Ryan Specialty Group Holdings, Inc.*—
Class A (Insurance) 55 2,058S&P Global, Inc. (Capital Markets) 229 95,085Sabra Health Care REIT, Inc. (Equity Real
Estate Investment Trusts) 220 2,994SBA Communications Corp. (Equity Real
Estate Investment Trusts) 104 33,846SEI Investments Co. (Capital Markets) 101 5,920Selective Insurance Group, Inc. (Insurance) 58 4,576Signature Bank (Banks) 58 17,669Simon Property Group, Inc. (Equity Real
Estate Investment Trusts) 312 45,926SL Green Realty Corp. (Equity Real Estate
Investment) 64 4,641SLM Corp. (Consumer Finance) 279 5,117SoFi Technologies, Inc.* (Consumer Finance) 616 7,688Spirit Realty Capital, Inc. (Equity Real Estate
Investment Trusts) 117 5,553STAG Industrial, Inc. (Equity Real Estate
Investment Trusts) 167 7,136Starwood Property Trust, Inc. (Mortgage
Real Estate Investment Trusts) 290 7,178State Street Corp. (Capital Markets) 348 32,886Stifel Financial Corp. (Capital Markets) 99 7,415STORE Capital Corp. (Equity Real Estate
Investment Trusts) 233 7,388Sun Communities, Inc. (Equity Real Estate
Investment Trusts) 110 20,786SVB Financial Group* (Banks) 56 32,698Synchrony Financial (Consumer Finance) 520 22,147Synovus Financial Corp. (Banks) 138 6,867T. Rowe Price Group, Inc. (Capital Markets) 213 32,894TFS Financial Corp. (Thrifts & Mortgage
Finance) 47 817The Allstate Corp. (Insurance) 274 33,064
January 31, 2022 (unaudited) :: Schedule of Portfolio Investments :: Financials UltraSector ProFund :: 59
See accompanying notes to the financial statements.
Toppan Merrill - ProFunds Public Semi-Annual Report [Funds] 01-31-2022 ED [AUX] | akiesli | 29-Mar-22 08:43 | 22-1296-2.dc | Sequence: 13CHKSUM Content: 48454 Layout: 13630 Graphics: 0 CLEAN
JOB: 22-1296-2 CYCLE#;BL#: 8; 0 TRIM: 8.25" x 10.75" AS: New York: 212-620-5600COLORS: ~note-color 2, Black, ~note-color 3 GRAPHICS: none V1.5
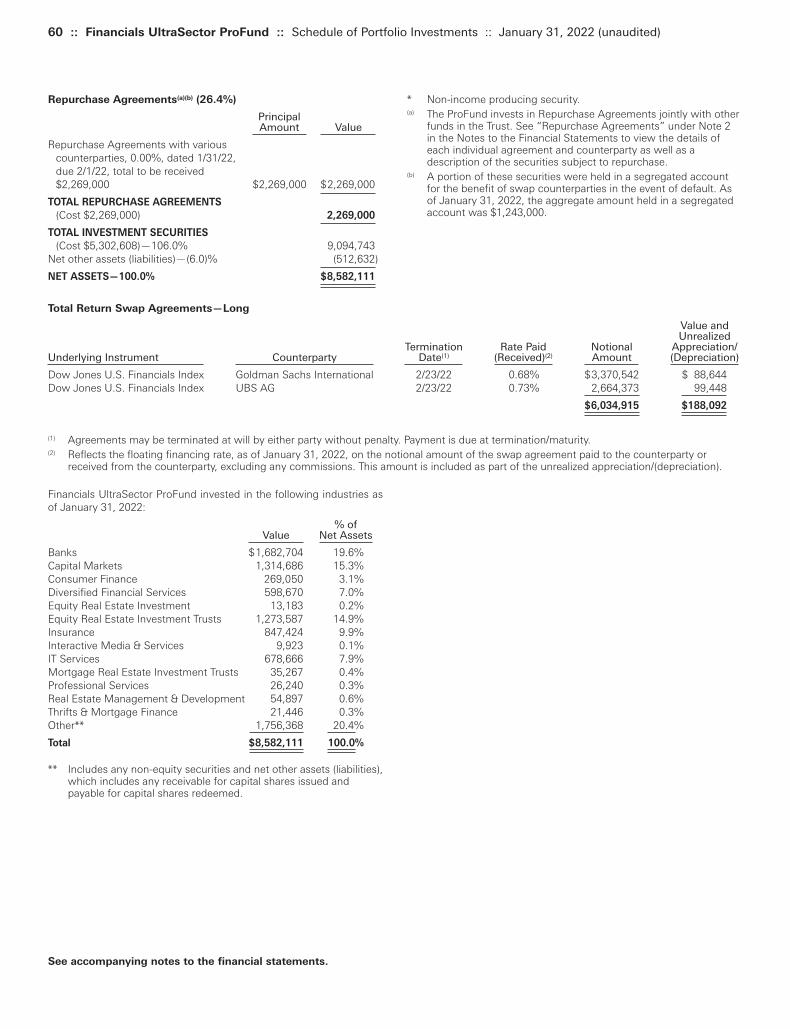
60 :: Financials UltraSector ProFund :: Schedule of Portfolio Investments :: January 31, 2022 (unaudited)
* Non-income producing security.(a) The ProFund invests in Repurchase Agreements jointly with other
funds in the Trust. See “Repurchase Agreements” under Note 2in the Notes to the Financial Statements to view the details ofeach individual agreement and counterparty as well as adescription of the securities subject to repurchase.
(b) A portion of these securities were held in a segregated accountfor the benefit of swap counterparties in the event of default. Asof January 31, 2022, the aggregate amount held in a segregatedaccount was $1,243,000.
Repurchase Agreements(a)(b) (26.4%)
Principal Amount Value
Repurchase Agreements with various counterparties, 0.00%, dated 1/31/22, due 2/1/22, total to be received $2,269,000 $2,269,000 $2,269,000
TOTAL REPURCHASE AGREEMENTS
(Cost $2,269,000) 2,269,000
TOTAL INVESTMENT SECURITIES
(Cost $5,302,608)—106.0% 9,094,743Net other assets (liabilities)—(6.0)% (512,632)
NET ASSETS—100.0% $8,582,111
See accompanying notes to the financial statements.
Total Return Swap Agreements—Long
Value and Unrealized
Termination Rate Paid Notional Appreciation/ Underlying Instrument Counterparty Date(1) (Received)(2) Amount (Depreciation)
Dow Jones U.S. Financials Index Goldman Sachs International 2/23/22 0.68% $3,370,542 $ 88,644Dow Jones U.S. Financials Index UBS AG 2/23/22 0.73% 2,664,373 99,448
$6,034,915 $188,092
(1) Agreements may be terminated at will by either party without penalty. Payment is due at termination/maturity.(2) Reflects the floating financing rate, as of January 31, 2022, on the notional amount of the swap agreement paid to the counterparty or
received from the counterparty, excluding any commissions. This amount is included as part of the unrealized appreciation/(depreciation).
Financials UltraSector ProFund invested in the following industries asof January 31, 2022:
% ofValue Net Assets
Banks $1,682,704 19.6%Capital Markets 1,314,686 15.3%Consumer Finance 269,050 3.1%Diversified Financial Services 598,670 7.0%Equity Real Estate Investment 13,183 0.2%Equity Real Estate Investment Trusts 1,273,587 14.9%Insurance 847,424 9.9%Interactive Media & Services 9,923 0.1%IT Services 678,666 7.9%Mortgage Real Estate Investment Trusts 35,267 0.4%Professional Services 26,240 0.3%Real Estate Management & Development 54,897 0.6%Thrifts & Mortgage Finance 21,446 0.3%Other** 1,756,368 20.4%
Total $8,582,111 100.0%
** Includes any non-equity securities and net other assets (liabilities),which includes any receivable for capital shares issued andpayable for capital shares redeemed.
Toppan Merrill - ProFunds Public Semi-Annual Report [Funds] 01-31-2022 ED [AUX] | akiesli | 29-Mar-22 08:43 | 22-1296-2.dc | Sequence: 14CHKSUM Content: 64981 Layout: 63066 Graphics: 0 CLEAN
JOB: 22-1296-2 CYCLE#;BL#: 8; 0 TRIM: 8.25" x 10.75" AS: New York: 212-620-5600COLORS: ~note-color 2, Black, ~note-color 3 GRAPHICS: none V1.5
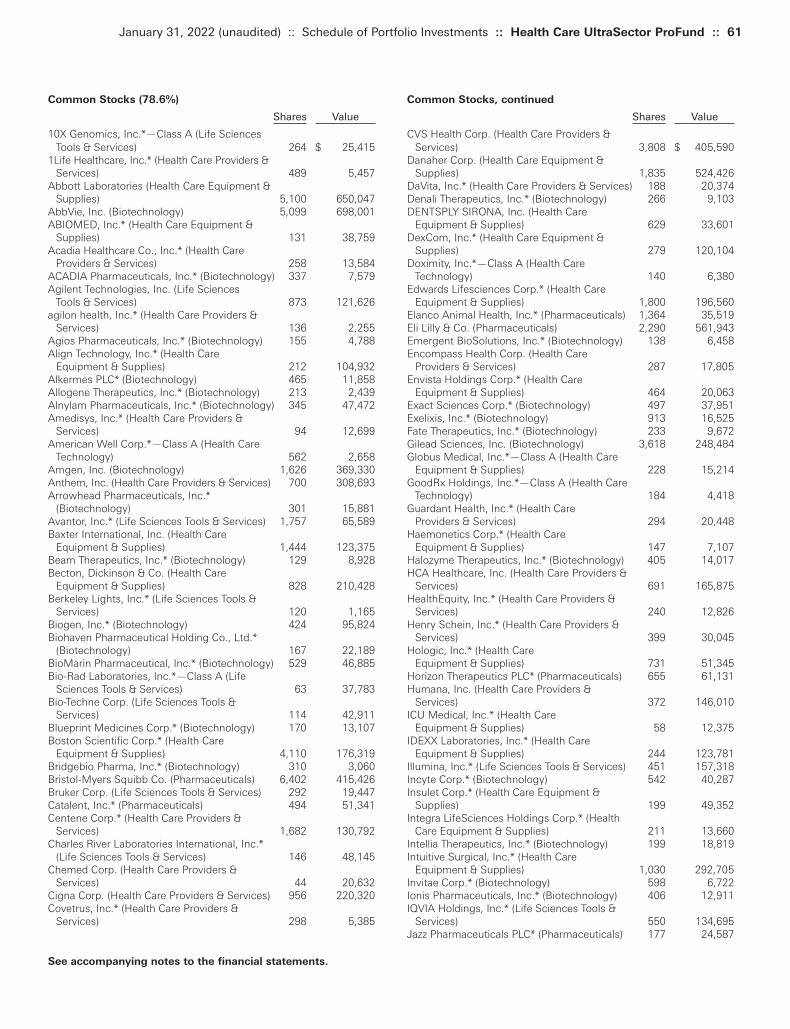
Common Stocks, continued
Shares Value
CVS Health Corp. (Health Care Providers & Services) 3,808 $ 405,590
Danaher Corp. (Health Care Equipment & Supplies) 1,835 524,426
DaVita, Inc.* (Health Care Providers & Services) 188 20,374Denali Therapeutics, Inc.* (Biotechnology) 266 9,103DENTSPLY SIRONA, Inc. (Health Care
Equipment & Supplies) 629 33,601DexCom, Inc.* (Health Care Equipment &
Supplies) 279 120,104Doximity, Inc.*—Class A (Health Care
Technology) 140 6,380Edwards Lifesciences Corp.* (Health Care
Equipment & Supplies) 1,800 196,560Elanco Animal Health, Inc.* (Pharmaceuticals) 1,364 35,519Eli Lilly & Co. (Pharmaceuticals) 2,290 561,943Emergent BioSolutions, Inc.* (Biotechnology) 138 6,458Encompass Health Corp. (Health Care
Providers & Services) 287 17,805Envista Holdings Corp.* (Health Care
Equipment & Supplies) 464 20,063Exact Sciences Corp.* (Biotechnology) 497 37,951Exelixis, Inc.* (Biotechnology) 913 16,525Fate Therapeutics, Inc.* (Biotechnology) 233 9,672Gilead Sciences, Inc. (Biotechnology) 3,618 248,484Globus Medical, Inc.*—Class A (Health Care
Equipment & Supplies) 228 15,214GoodRx Holdings, Inc.*—Class A (Health Care
Technology) 184 4,418Guardant Health, Inc.* (Health Care
Providers & Services) 294 20,448Haemonetics Corp.* (Health Care
Equipment & Supplies) 147 7,107Halozyme Therapeutics, Inc.* (Biotechnology) 405 14,017HCA Healthcare, Inc. (Health Care Providers &
Services) 691 165,875HealthEquity, Inc.* (Health Care Providers &
Services) 240 12,826Henry Schein, Inc.* (Health Care Providers &
Services) 399 30,045Hologic, Inc.* (Health Care
Equipment & Supplies) 731 51,345Horizon Therapeutics PLC* (Pharmaceuticals) 655 61,131Humana, Inc. (Health Care Providers &
Services) 372 146,010ICU Medical, Inc.* (Health Care
Equipment & Supplies) 58 12,375IDEXX Laboratories, Inc.* (Health Care
Equipment & Supplies) 244 123,781Illumina, Inc.* (Life Sciences Tools & Services) 451 157,318Incyte Corp.* (Biotechnology) 542 40,287Insulet Corp.* (Health Care Equipment &
Supplies) 199 49,352Integra LifeSciences Holdings Corp.* (Health
Care Equipment & Supplies) 211 13,660Intellia Therapeutics, Inc.* (Biotechnology) 199 18,819Intuitive Surgical, Inc.* (Health Care
Equipment & Supplies) 1,030 292,705Invitae Corp.* (Biotechnology) 598 6,722Ionis Pharmaceuticals, Inc.* (Biotechnology) 406 12,911IQVIA Holdings, Inc.* (Life Sciences Tools &
Services) 550 134,695Jazz Pharmaceuticals PLC* (Pharmaceuticals) 177 24,587
Common Stocks (78.6%)
Shares Value
10X Genomics, Inc.*—Class A (Life Sciences Tools & Services) 264 $ 25,415
1Life Healthcare, Inc.* (Health Care Providers & Services) 489 5,457
Abbott Laboratories (Health Care Equipment & Supplies) 5,100 650,047
AbbVie, Inc. (Biotechnology) 5,099 698,001ABIOMED, Inc.* (Health Care Equipment &
Supplies) 131 38,759Acadia Healthcare Co., Inc.* (Health Care
Providers & Services) 258 13,584ACADIA Pharmaceuticals, Inc.* (Biotechnology) 337 7,579Agilent Technologies, Inc. (Life Sciences
Tools & Services) 873 121,626agilon health, Inc.* (Health Care Providers &
Services) 136 2,255Agios Pharmaceuticals, Inc.* (Biotechnology) 155 4,788Align Technology, Inc.* (Health Care
Equipment & Supplies) 212 104,932Alkermes PLC* (Biotechnology) 465 11,858Allogene Therapeutics, Inc.* (Biotechnology) 213 2,439Alnylam Pharmaceuticals, Inc.* (Biotechnology) 345 47,472Amedisys, Inc.* (Health Care Providers &
Services) 94 12,699American Well Corp.*—Class A (Health Care
Technology) 562 2,658Amgen, Inc. (Biotechnology) 1,626 369,330Anthem, Inc. (Health Care Providers & Services) 700 308,693Arrowhead Pharmaceuticals, Inc.*
(Biotechnology) 301 15,881Avantor, Inc.* (Life Sciences Tools & Services) 1,757 65,589Baxter International, Inc. (Health Care
Equipment & Supplies) 1,444 123,375Beam Therapeutics, Inc.* (Biotechnology) 129 8,928Becton, Dickinson & Co. (Health Care
Equipment & Supplies) 828 210,428Berkeley Lights, Inc.* (Life Sciences Tools &
Services) 120 1,165Biogen, Inc.* (Biotechnology) 424 95,824Biohaven Pharmaceutical Holding Co., Ltd.*
(Biotechnology) 167 22,189BioMarin Pharmaceutical, Inc.* (Biotechnology) 529 46,885Bio-Rad Laboratories, Inc.*—Class A (Life
Sciences Tools & Services) 63 37,783Bio-Techne Corp. (Life Sciences Tools &
Services) 114 42,911Blueprint Medicines Corp.* (Biotechnology) 170 13,107Boston Scientific Corp.* (Health Care
Equipment & Supplies) 4,110 176,319Bridgebio Pharma, Inc.* (Biotechnology) 310 3,060Bristol-Myers Squibb Co. (Pharmaceuticals) 6,402 415,426Bruker Corp. (Life Sciences Tools & Services) 292 19,447Catalent, Inc.* (Pharmaceuticals) 494 51,341Centene Corp.* (Health Care Providers &
Services) 1,682 130,792Charles River Laboratories International, Inc.*
(Life Sciences Tools & Services) 146 48,145Chemed Corp. (Health Care Providers &
Services) 44 20,632Cigna Corp. (Health Care Providers & Services) 956 220,320Covetrus, Inc.* (Health Care Providers &
Services) 298 5,385
January 31, 2022 (unaudited) :: Schedule of Portfolio Investments :: Health Care UltraSector ProFund :: 61
See accompanying notes to the financial statements.
Toppan Merrill - ProFunds Public Semi-Annual Report [Funds] 01-31-2022 ED [AUX] | akiesli | 29-Mar-22 08:43 | 22-1296-2.dc | Sequence: 15CHKSUM Content: 43287 Layout: 32688 Graphics: 0 CLEAN
JOB: 22-1296-2 CYCLE#;BL#: 8; 0 TRIM: 8.25" x 10.75" AS: New York: 212-620-5600COLORS: ~note-color 2, Black, ~note-color 3 GRAPHICS: none V1.5
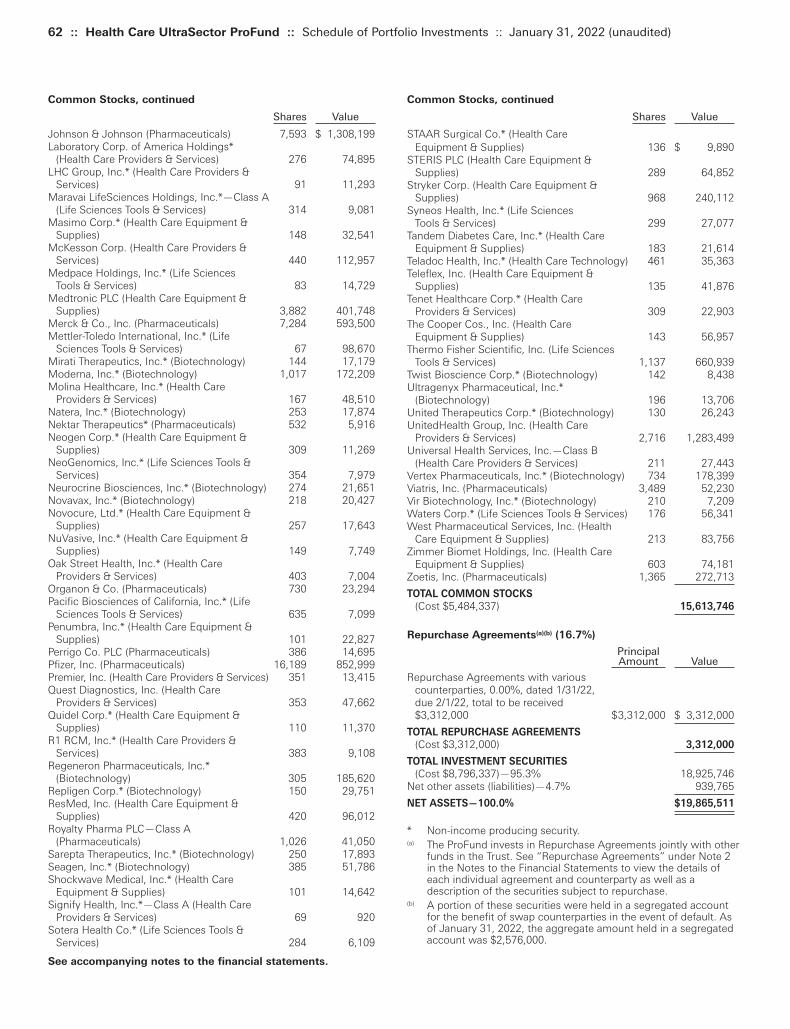
62 :: Health Care UltraSector ProFund :: Schedule of Portfolio Investments :: January 31, 2022 (unaudited)
Common Stocks, continued
Shares Value
STAAR Surgical Co.* (Health Care Equipment & Supplies) 136 $ 9,890
STERIS PLC (Health Care Equipment & Supplies) 289 64,852
Stryker Corp. (Health Care Equipment & Supplies) 968 240,112
Syneos Health, Inc.* (Life Sciences Tools & Services) 299 27,077
Tandem Diabetes Care, Inc.* (Health Care Equipment & Supplies) 183 21,614
Teladoc Health, Inc.* (Health Care Technology) 461 35,363Teleflex, Inc. (Health Care Equipment &
Supplies) 135 41,876Tenet Healthcare Corp.* (Health Care
Providers & Services) 309 22,903The Cooper Cos., Inc. (Health Care
Equipment & Supplies) 143 56,957Thermo Fisher Scientific, Inc. (Life Sciences
Tools & Services) 1,137 660,939Twist Bioscience Corp.* (Biotechnology) 142 8,438Ultragenyx Pharmaceutical, Inc.*
(Biotechnology) 196 13,706United Therapeutics Corp.* (Biotechnology) 130 26,243UnitedHealth Group, Inc. (Health Care
Providers & Services) 2,716 1,283,499Universal Health Services, Inc.—Class B
(Health Care Providers & Services) 211 27,443Vertex Pharmaceuticals, Inc.* (Biotechnology) 734 178,399Viatris, Inc. (Pharmaceuticals) 3,489 52,230Vir Biotechnology, Inc.* (Biotechnology) 210 7,209Waters Corp.* (Life Sciences Tools & Services) 176 56,341West Pharmaceutical Services, Inc. (Health
Care Equipment & Supplies) 213 83,756Zimmer Biomet Holdings, Inc. (Health Care
Equipment & Supplies) 603 74,181Zoetis, Inc. (Pharmaceuticals) 1,365 272,713
TOTAL COMMON STOCKS
(Cost $5,484,337) 15,613,746
Repurchase Agreements(a)(b) (16.7%)
Principal Amount Value
Repurchase Agreements with various counterparties, 0.00%, dated 1/31/22, due 2/1/22, total to be received $3,312,000 $3,312,000 $ 3,312,000
TOTAL REPURCHASE AGREEMENTS
(Cost $3,312,000) 3,312,000
TOTAL INVESTMENT SECURITIES
(Cost $8,796,337)—95.3% 18,925,746Net other assets (liabilities)—4.7% 939,765
NET ASSETS—100.0% $19,865,511
* Non-income producing security.(a) The ProFund invests in Repurchase Agreements jointly with other
funds in the Trust. See “Repurchase Agreements” under Note 2in the Notes to the Financial Statements to view the details ofeach individual agreement and counterparty as well as adescription of the securities subject to repurchase.
(b) A portion of these securities were held in a segregated accountfor the benefit of swap counterparties in the event of default. Asof January 31, 2022, the aggregate amount held in a segregatedaccount was $2,576,000.
Common Stocks, continued
Shares Value
Johnson & Johnson (Pharmaceuticals) 7,593 $ 1,308,199Laboratory Corp. of America Holdings*
(Health Care Providers & Services) 276 74,895LHC Group, Inc.* (Health Care Providers &
Services) 91 11,293Maravai LifeSciences Holdings, Inc.*—Class A
(Life Sciences Tools & Services) 314 9,081Masimo Corp.* (Health Care Equipment &
Supplies) 148 32,541McKesson Corp. (Health Care Providers &
Services) 440 112,957Medpace Holdings, Inc.* (Life Sciences
Tools & Services) 83 14,729Medtronic PLC (Health Care Equipment &
Supplies) 3,882 401,748Merck & Co., Inc. (Pharmaceuticals) 7,284 593,500Mettler-Toledo International, Inc.* (Life
Sciences Tools & Services) 67 98,670Mirati Therapeutics, Inc.* (Biotechnology) 144 17,179Moderna, Inc.* (Biotechnology) 1,017 172,209Molina Healthcare, Inc.* (Health Care
Providers & Services) 167 48,510Natera, Inc.* (Biotechnology) 253 17,874Nektar Therapeutics* (Pharmaceuticals) 532 5,916Neogen Corp.* (Health Care Equipment &
Supplies) 309 11,269NeoGenomics, Inc.* (Life Sciences Tools &
Services) 354 7,979Neurocrine Biosciences, Inc.* (Biotechnology) 274 21,651Novavax, Inc.* (Biotechnology) 218 20,427Novocure, Ltd.* (Health Care Equipment &
Supplies) 257 17,643NuVasive, Inc.* (Health Care Equipment &
Supplies) 149 7,749Oak Street Health, Inc.* (Health Care
Providers & Services) 403 7,004Organon & Co. (Pharmaceuticals) 730 23,294Pacific Biosciences of California, Inc.* (Life
Sciences Tools & Services) 635 7,099Penumbra, Inc.* (Health Care Equipment &
Supplies) 101 22,827Perrigo Co. PLC (Pharmaceuticals) 386 14,695Pfizer, Inc. (Pharmaceuticals) 16,189 852,999Premier, Inc. (Health Care Providers & Services) 351 13,415Quest Diagnostics, Inc. (Health Care
Providers & Services) 353 47,662Quidel Corp.* (Health Care Equipment &
Supplies) 110 11,370R1 RCM, Inc.* (Health Care Providers &
Services) 383 9,108Regeneron Pharmaceuticals, Inc.*
(Biotechnology) 305 185,620Repligen Corp.* (Biotechnology) 150 29,751ResMed, Inc. (Health Care Equipment &
Supplies) 420 96,012Royalty Pharma PLC—Class A
(Pharmaceuticals) 1,026 41,050Sarepta Therapeutics, Inc.* (Biotechnology) 250 17,893Seagen, Inc.* (Biotechnology) 385 51,786Shockwave Medical, Inc.* (Health Care
Equipment & Supplies) 101 14,642Signify Health, Inc.*—Class A (Health Care
Providers & Services) 69 920Sotera Health Co.* (Life Sciences Tools &
Services) 284 6,109
See accompanying notes to the financial statements.
Toppan Merrill - ProFunds Public Semi-Annual Report [Funds] 01-31-2022 ED [AUX] | akiesli | 29-Mar-22 08:43 | 22-1296-2.dc | Sequence: 16CHKSUM Content: 50763 Layout: 9698 Graphics: 0 CLEAN
JOB: 22-1296-2 CYCLE#;BL#: 8; 0 TRIM: 8.25" x 10.75" AS: New York: 212-620-5600COLORS: ~note-color 2, Black, ~note-color 3 GRAPHICS: none V1.5

January 31, 2022 (unaudited) :: Schedule of Portfolio Investments :: Health Care UltraSector ProFund :: 63
See accompanying notes to the financial statements.
Total Return Swap Agreements—Long
Value and Unrealized
Termination Rate Paid Notional Appreciation/ Underlying Instrument Counterparty Date(1) (Received)(2) Amount (Depreciation)
Dow Jones U.S. Health Care Index Goldman Sachs International 2/23/22 0.68% $ 6,425,871 $119,238Dow Jones U.S. Health Care Index UBS AG 2/23/22 0.43% 7,726,614 77,400
$14,152,485 $196,638
(1) Agreements may be terminated at will by either party without penalty. Payment is due at termination/maturity.(2) Reflects the floating financing rate, as of January 31, 2022, on the notional amount of the swap agreement paid to the counterparty or
received from the counterparty, excluding any commissions. This amount is included as part of the unrealized appreciation/(depreciation).
Health Care UltraSector ProFund invested in the following industries asof January 31, 2022:
% ofValue Net Assets
Biotechnology $ 2,536,675 12.8%Health Care Equipment & Supplies 3,973,192 20.0%Health Care Providers & Services 3,198,399 16.1%Health Care Technology 48,819 0.2%Life Sciences Tools & Services 1,542,118 7.8%Pharmaceuticals 4,314,543 21.7%Other** 4,251,765 21.4%
Total $19,865,511 100.0%
** Includes any non-equity securities and net other assets (liabilities),which includes any receivable for capital shares issued andpayable for capital shares redeemed.
Toppan Merrill - ProFunds Public Semi-Annual Report [Funds] 01-31-2022 ED [AUX] | akiesli | 29-Mar-22 08:43 | 22-1296-2.dc | Sequence: 17CHKSUM Content: 26339 Layout: 56764 Graphics: 0 CLEAN
JOB: 22-1296-2 CYCLE#;BL#: 8; 0 TRIM: 8.25" x 10.75" AS: New York: 212-620-5600COLORS: ~note-color 2, Black, ~note-color 3 GRAPHICS: none V1.5

64 :: Industrials UltraSector ProFund :: Schedule of Portfolio Investments :: January 31, 2022 (unaudited)
Common Stocks, continued
Shares Value
Coherent, Inc.* (Electronic Equipment, Instruments & Components) 24 $ 6,204
Colfax Corp.* (Machinery) 127 5,222Concentrix Corp. (IT Services) 41 8,241Core & Main, Inc.*—Class A (Trading
Companies & Distributors) 53 1,275Corning, Inc. (Electronic Equipment,
Instruments & Components) 731 30,731Crane Co. (Machinery) 48 4,968Crown Holdings, Inc. (Containers &
Packaging) 122 13,957CSX Corp. (Road & Rail) 2,113 72,306Cummins, Inc. (Machinery) 137 30,261Curtiss-Wright Corp. (Aerospace & Defense) 37 4,913Deere & Co. (Machinery) 269 101,252Donaldson Co., Inc. (Machinery) 118 6,568Dover Corp. (Machinery) 137 23,278Dun & Bradstreet Holdings, Inc.*
(Professional Services) 142 2,849Eagle Materials, Inc. (Construction Materials) 39 5,688Eaton Corp. PLC (Electrical Equipment) 380 60,204EMCOR Group, Inc. (Construction &
Engineering) 51 6,080Emerson Electric Co. (Electrical Equipment) 569 52,320EnerSys (Electrical Equipment) 40 2,997Equifax, Inc. (Professional Services) 116 27,812Euronet Worldwide, Inc.* (IT Services) 51 6,828Expeditors International of Washington, Inc.
(Air Freight & Logistics) 161 18,431Fastenal Co. (Trading Companies &
Distributors) 548 31,060FedEx Corp. (Air Freight & Logistics) 233 57,285Fidelity National Information Services, Inc.
(IT Services) 580 69,554Fiserv, Inc.* (IT Services) 566 59,826FleetCor Technologies, Inc.* (IT Services) 77 18,346Flowserve Corp. (Machinery) 123 4,012Fortive Corp. (Machinery) 342 24,125Fortune Brands Home & Security, Inc.
(Building Products) 130 12,242FTI Consulting, Inc.* (Professional Services) 33 4,812Gates Industrial Corp. PLC* (Machinery) 91 1,408Generac Holdings, Inc.* (Electrical Equipment) 60 16,943General Dynamics Corp. (Aerospace &
Defense) 220 46,662General Electric Co. (Industrial Conglomerates) 1,046 98,826Genpact, Ltd. (IT Services) 165 8,209Global Payments, Inc. (IT Services) 277 41,517Graco, Inc. (Machinery) 162 11,755Graphic Packaging Holding Co. (Containers &
Packaging) 267 5,049GXO Logistics, Inc.* (Air Freight & Logistics) 94 7,634HEICO Corp. (Aerospace & Defense) 41 5,592HEICO Corp.—Class A (Aerospace & Defense) 71 7,789Hertz Global Holdings, Inc.* (Road & Rail) 52 1,002Hexcel Corp.* (Aerospace & Defense) 80 4,174Honeywell International, Inc. (Industrial
Conglomerates) 656 134,139Howmet Aerospace, Inc. (Aerospace &
Defense) 366 11,379Hubbell, Inc. (Electrical Equipment) 52 9,739
Common Stocks (81.5%)
Shares Value
3M Co. (Industrial Conglomerates) 550 $ 91,311A.O. Smith Corp. (Building Products) 127 9,705Accenture PLC—Class A (IT Services) 602 212,854Acuity Brands, Inc. (Electrical Equipment) 34 6,512ADT, Inc. (Commercial Services & Supplies) 137 1,040Advanced Drainage Systems, Inc. (Building
Products) 53 5,994AECOM (Construction & Engineering) 137 9,471Affirm Holdings, Inc.* (IT Services) 140 8,970AGCO Corp. (Machinery) 59 6,915Air Lease Corp. (Trading Companies &
Distributors) 102 4,061Alight, Inc.*—Class A (Professional Services) 232 2,241Allegion PLC (Building Products) 86 10,555Allison Transmission Holdings, Inc. (Machinery) 98 3,723Amcor PLC (Containers & Packaging) 1,459 17,523AMETEK, Inc. (Electrical Equipment) 220 30,089Amphenol Corp.—Class A (Electronic
Equipment, Instruments & Components) 569 45,286Applied Industrial Technologies, Inc. (Trading
Companies & Distributors) 37 3,625AptarGroup, Inc. (Containers & Packaging) 63 7,390Armstrong World Industries, Inc. (Building
Products) 45 4,456Arrow Electronics, Inc.* (Electronic
Equipment, Instruments & Components) 66 8,184ASGN, Inc.* (Professional Services) 50 5,744Automatic Data Processing, Inc. (IT Services) 402 82,880Avery Dennison Corp. (Containers &
Packaging) 79 16,228Avnet, Inc. (Electronic Equipment,
Instruments & Components) 94 3,794Axon Enterprise, Inc.* (Aerospace & Defense) 63 8,816Ball Corp. (Containers & Packaging) 308 29,906Berry Global Group, Inc.* (Containers &
Packaging) 129 8,697Booz Allen Hamilton Holding Corp.
(Professional Services) 128 9,821Broadridge Financial Solutions, Inc.
(IT Services) 112 17,833Builders FirstSource, Inc.* (Building Products) 183 12,442BWX Technologies, Inc. (Aerospace &
Defense) 88 3,917C.H. Robinson Worldwide, Inc. (Air
Freight & Logistics) 124 12,977CACI International, Inc.*—Class A
(Professional Services) 23 5,692Carlisle Cos., Inc. (Industrial Conglomerates) 50 11,172Carrier Global Corp. (Building Products) 826 39,384Caterpillar, Inc. (Machinery) 516 104,004ChargePoint Holdings, Inc.* (Electrical
Equipment) 162 2,244Chart Industries, Inc.* (Machinery) 34 4,144Cimpress PLC* (Commercial Services &
Supplies) 19 1,277Cintas Corp. (Commercial Services &
Supplies) 83 32,497Clarivate PLC* (Professional Services) 353 5,810Clean Harbors, Inc.* (Commercial
Services & Supplies) 48 4,442Cognex Corp. (Electronic Equipment,
Instruments & Components) 169 11,232
See accompanying notes to the financial statements.
Toppan Merrill - ProFunds Public Semi-Annual Report [Funds] 01-31-2022 ED [AUX] | akiesli | 29-Mar-22 08:43 | 22-1296-2.dc | Sequence: 18CHKSUM Content: 20482 Layout: 5072 Graphics: 0 CLEAN
JOB: 22-1296-2 CYCLE#;BL#: 8; 0 TRIM: 8.25" x 10.75" AS: New York: 212-620-5600COLORS: ~note-color 2, Black, ~note-color 3 GRAPHICS: none V1.5

Common Stocks, continued
Shares Value
Oshkosh Corp. (Machinery) 65 $ 7,398Otis Worldwide Corp. (Machinery) 404 34,514Owens Corning (Building Products) 95 8,427PACCAR, Inc. (Machinery) 331 30,780Packaging Corp. of America (Containers &
Packaging) 91 13,707Parker-Hannifin Corp. (Machinery) 123 38,131Paychex, Inc. (IT Services) 306 36,035PayPal Holdings, Inc.* (IT Services) 1,120 192,573Pentair PLC (Machinery) 158 10,065PerkinElmer, Inc. (Life Sciences Tools &
Services) 121 20,833Quanta Services, Inc. (Construction &
Engineering) 136 13,970Raytheon Technologies Corp. (Aerospace &
Defense) 1,426 128,610RBC Bearings, Inc.* (Machinery) 27 4,873Regal Rexnord Corp. (Electrical Equipment) 64 10,143Republic Services, Inc.—Class A (Commercial
Services & Supplies) 199 25,404Robert Half International, Inc. (Professional
Services) 106 12,006Rockwell Automation, Inc. (Electrical
Equipment) 111 32,103Roper Technologies, Inc. (Industrial
Conglomerates) 101 44,153Saia, Inc.* (Road & Rail) 24 6,823Science Applications International Corp.
(Professional Services) 55 4,512Sealed Air Corp. (Containers & Packaging) 141 9,577Sensata Technologies Holding PLC*
(Electrical Equipment) 151 8,661Shift4 Payments, Inc.*—Class A (IT Services) 45 2,372Shoals Technologies Group, Inc.*—Class A
(Electrical Equipment) 98 1,652Silgan Holdings, Inc. (Containers & Packaging) 79 3,538Siteone Landscape Supply, Inc.* (Trading
Companies & Distributors) 43 7,745Snap-on, Inc. (Machinery) 52 10,829Sonoco Products Co. (Containers & Packaging) 93 5,268Square, Inc.*—Class A (IT Services) 469 57,354Stericycle, Inc.* (Commercial Services &
Supplies) 88 5,169Sunrun, Inc.* (Electrical Equipment) 197 5,108TaskUS, Inc.*—Class A (IT Services) 26 832TE Connectivity, Ltd. (Electronic Equipment,
Instruments & Components) 311 44,476Teledyne Technologies, Inc.* (Electronic
Equipment, Instruments & Components) 44 18,543Tetra Tech, Inc. (Commercial Services &
Supplies) 52 7,238Textron, Inc. (Aerospace & Defense) 209 14,225The Boeing Co.* (Aerospace & Defense) 527 105,525The Middleby Corp.* (Machinery) 53 9,816The Sherwin-Williams Co. (Chemicals) 230 65,897The Timken Co. (Machinery) 66 4,409The Toro Co. (Machinery) 102 9,851The Western Union Co. (IT Services) 382 7,224Trane Technologies PLC (Building Products) 227 39,294TransDigm Group, Inc.* (Aerospace & Defense) 50 30,810TransUnion (Professional Services) 183 18,871Trex Co., Inc.* (Building Products) 110 10,062
Common Stocks, continued
Shares Value
Huntington Ingalls Industries, Inc. (Aerospace & Defense) 38 $ 7,114
IDEX Corp. (Machinery) 73 15,727II-VI, Inc.* (Electronic Equipment,
Instruments & Components) 102 6,467Illinois Tool Works, Inc. (Machinery) 272 63,626Ingersoll Rand, Inc. (Machinery) 388 21,809Insperity, Inc. (Professional Services) 34 3,656International Paper Co. (Containers &
Packaging) 369 17,803IPG Photonics Corp.* (Electronic
Equipment, Instruments & Components) 34 5,252Itron, Inc.* (Electronic Equipment,
Instruments & Components) 43 2,666ITT, Inc. (Machinery) 82 7,537J.B. Hunt Transport Services, Inc. (Road & Rail) 80 15,403Jabil, Inc. (Electronic Equipment,
Instruments & Components) 137 8,424Jack Henry & Associates, Inc. (IT Services) 71 11,915Jacobs Engineering Group, Inc. (Professional
Services) 124 16,142Johnson Controls International PLC (Building
Products) 676 49,124KBR, Inc. (Professional Services) 133 5,772Keysight Technologies, Inc.* (Electronic
Equipment, Instruments & Components) 176 29,712Kirby Corp.* (Marine) 57 3,715Knight-Swift Transportation Holdings, Inc.
(Road & Rail) 158 8,940L3Harris Technologies, Inc. (Aerospace &
Defense) 187 39,137Landstar System, Inc. (Road & Rail) 36 5,760Leidos Holdings, Inc. (Professional Services) 134 11,986Lennox International, Inc. (Building Products) 33 9,359Lincoln Electric Holdings, Inc. (Machinery) 56 7,159Littelfuse, Inc. (Electronic Equipment,
Instruments & Components) 24 6,479Lockheed Martin Corp. (Aerospace & Defense) 234 91,056Louisiana-Pacific Corp. (Paper & Forest
Products) 83 5,515ManpowerGroup, Inc. (Professional Services) 52 5,453Marqeta, Inc.*—Class A (IT Services) 220 2,596Martin Marietta Materials, Inc. (Construction
Materials) 59 22,958Masco Corp. (Building Products) 233 14,756MasTec, Inc.* (Construction & Engineering) 54 4,651MAXIMUS, Inc. (IT Services) 59 4,562Mercury Systems, Inc.* (Aerospace & Defense) 54 3,074MSA Safety, Inc. (Commercial Services &
Supplies) 34 4,672MSC Industrial Direct Co., Inc. (Trading
Companies & Distributors) 44 3,592National Instruments Corp. (Electronic
Equipment, Instruments & Components) 126 5,194Nielsen Holdings PLC (Professional Services) 341 6,431Nikola Corp.* (Machinery) 195 1,566Nordson Corp. (Machinery) 52 12,092Norfolk Southern Corp. (Road & Rail) 232 63,102Northrop Grumman Corp. (Aerospace &
Defense) 141 52,156nVent Electric PLC (Electrical Equipment) 160 5,534Old Dominion Freight Line, Inc. (Road & Rail) 89 26,872
January 31, 2022 (unaudited) :: Schedule of Portfolio Investments :: Industrials UltraSector ProFund :: 65
See accompanying notes to the financial statements.
Toppan Merrill - ProFunds Public Semi-Annual Report [Funds] 01-31-2022 ED [AUX] | akiesli | 29-Mar-22 08:43 | 22-1296-2.dc | Sequence: 19CHKSUM Content: 18521 Layout: 36242 Graphics: 0 CLEAN
JOB: 22-1296-2 CYCLE#;BL#: 8; 0 TRIM: 8.25" x 10.75" AS: New York: 212-620-5600COLORS: ~note-color 2, Black, ~note-color 3 GRAPHICS: none V1.5

66 :: Industrials UltraSector ProFund :: Schedule of Portfolio Investments :: January 31, 2022 (unaudited)
Common Stocks, continued
Shares Value
Woodward, Inc. (Machinery) 60 $ 6,616XPO Logistics, Inc.* (Air Freight & Logistics) 94 6,220Xylem, Inc. (Machinery) 172 18,063Zebra Technologies Corp.* (Electronic
Equipment, Instruments & Components) 51 25,965Zurn Water Solutions Corp. (Building Products) 115 3,512
TOTAL COMMON STOCKS
(Cost $1,646,805) 4,605,246
Repurchase Agreements(a)(b) (20.2%)
Principal Amount Value
Repurchase Agreements with various counterparties, 0.00%, dated 1/31/22, due 2/1/22, total to be received $1,139,000 $1,139,000 $1,139,000
TOTAL REPURCHASE AGREEMENTS
(Cost $1,139,000) 1,139,000
TOTAL INVESTMENT SECURITIES
(Cost $2,785,805)—101.7% 5,744,246Net other assets (liabilities)—(1.7)% (95,395)
NET ASSETS—100.0% $5,648,851
* Non-income producing security.(a) The ProFund invests in Repurchase Agreements jointly with other
funds in the Trust. See “Repurchase Agreements” under Note 2in the Notes to the Financial Statements to view the details ofeach individual agreement and counterparty as well as adescription of the securities subject to repurchase.
(b) A portion of these securities were held in a segregated accountfor the benefit of swap counterparties in the event of default. Asof January 31, 2022, the aggregate amount held in a segregatedaccount was $917,000.
Common Stocks, continued
Shares Value
Trimble, Inc.* (Electronic Equipment, Instruments & Components) 239 $ 17,246
TriNet Group, Inc.* (Professional Services) 38 3,238TuSimple Holdings, Inc.*—Class A
(Road & Rail) 31 582Union Pacific Corp. (Road & Rail) 613 149,908United Parcel Service, Inc.—Class B (Air
Freight & Logistics) 695 140,536United Rentals, Inc.* (Trading Companies &
Distributors) 69 22,088Univar Solutions, Inc.* (Trading Companies &
Distributors) 162 4,293Upwork, Inc.* (Professional Services) 114 3,101Valmont Industries, Inc. (Construction &
Engineering) 20 4,345Verisk Analytics, Inc. (Professional Services) 154 30,203Vertiv Holdings Co. (Electrical Equipment) 287 5,987Virgin Galactic Holdings, Inc.* (Aerospace &
Defense) 169 1,555Vontier Corp. (Electronic Equipment,
Instruments & Components) 161 4,526Vulcan Materials Co. (Construction Materials) 127 24,170W.W. Grainger, Inc. (Trading Companies &
Distributors) 41 20,300Waste Management, Inc. (Commercial
Services & Supplies) 366 55,061Watsco, Inc. (Trading Companies &
Distributors) 32 9,042WESCO International, Inc.* (Trading
Companies & Distributors) 1 122Westinghouse Air Brake Technologies Corp.
(Machinery) 178 15,824WestRock Co. (Containers & Packaging) 254 11,725WEX, Inc.* (IT Services) 43 6,922WillScot Mobile Mini Holdings Corp.*
(Construction & Engineering) 212 7,852
See accompanying notes to the financial statements.
Total Return Swap Agreements—Long
Value and Unrealized
Termination Rate Paid Notional Appreciation/ Underlying Instrument Counterparty Date(1) (Received)(2) Amount (Depreciation)
Dow Jones U.S. Industrials Index Goldman Sachs International 2/23/22 0.68% $2,324,701 $ 320Dow Jones U.S. Industrials Index UBS AG 2/23/22 0.43% 1,590,639 (9,912)
$3,915,340 $(9,592)
(1) Agreements may be terminated at will by either party without penalty. Payment is due at termination/maturity.(2) Reflects the floating financing rate, as of January 31, 2022, on the notional amount of the swap agreement paid to the counterparty or
received from the counterparty, excluding any commissions. This amount is included as part of the unrealized appreciation/(depreciation).
Toppan Merrill - ProFunds Public Semi-Annual Report [Funds] 01-31-2022 ED [AUX] | akiesli | 29-Mar-22 08:43 | 22-1296-2.dc | Sequence: 20CHKSUM Content: 30181 Layout: 23666 Graphics: 0 CLEAN
JOB: 22-1296-2 CYCLE#;BL#: 8; 0 TRIM: 8.25" x 10.75" AS: New York: 212-620-5600COLORS: ~note-color 2, Black, ~note-color 3 GRAPHICS: none V1.5
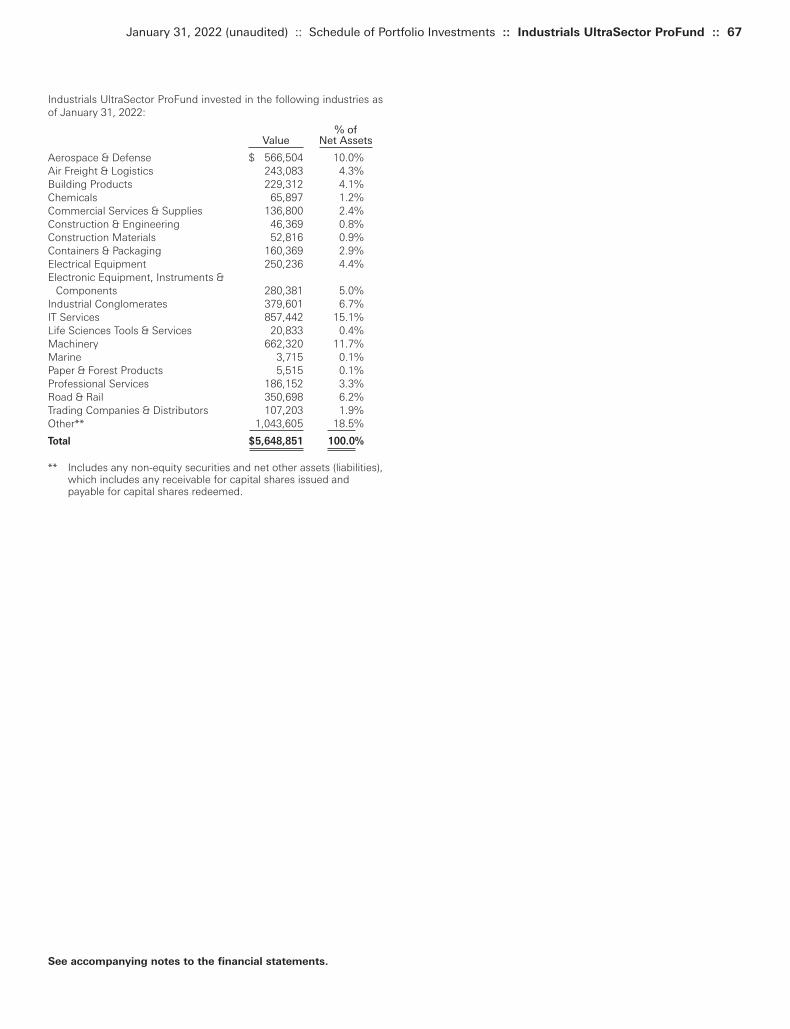
Industrials UltraSector ProFund invested in the following industries asof January 31, 2022:
% ofValue Net Assets
Aerospace & Defense $ 566,504 10.0%Air Freight & Logistics 243,083 4.3%Building Products 229,312 4.1%Chemicals 65,897 1.2%Commercial Services & Supplies 136,800 2.4%Construction & Engineering 46,369 0.8%Construction Materials 52,816 0.9%Containers & Packaging 160,369 2.9%Electrical Equipment 250,236 4.4%Electronic Equipment, Instruments &
Components 280,381 5.0%Industrial Conglomerates 379,601 6.7%IT Services 857,442 15.1%Life Sciences Tools & Services 20,833 0.4%Machinery 662,320 11.7%Marine 3,715 0.1%Paper & Forest Products 5,515 0.1%Professional Services 186,152 3.3%Road & Rail 350,698 6.2%Trading Companies & Distributors 107,203 1.9%Other** 1,043,605 18.5%
Total $5,648,851 100.0%
** Includes any non-equity securities and net other assets (liabilities),which includes any receivable for capital shares issued andpayable for capital shares redeemed.
January 31, 2022 (unaudited) :: Schedule of Portfolio Investments :: Industrials UltraSector ProFund :: 67
See accompanying notes to the financial statements.
Toppan Merrill - ProFunds Public Semi-Annual Report [Funds] 01-31-2022 ED [AUX] | akiesli | 29-Mar-22 08:43 | 22-1296-2.dc | Sequence: 21CHKSUM Content: 63230 Layout: 43729 Graphics: 0 CLEAN
JOB: 22-1296-2 CYCLE#;BL#: 8; 0 TRIM: 8.25" x 10.75" AS: New York: 212-620-5600COLORS: ~note-color 2, Black, ~note-color 3 GRAPHICS: none V1.5
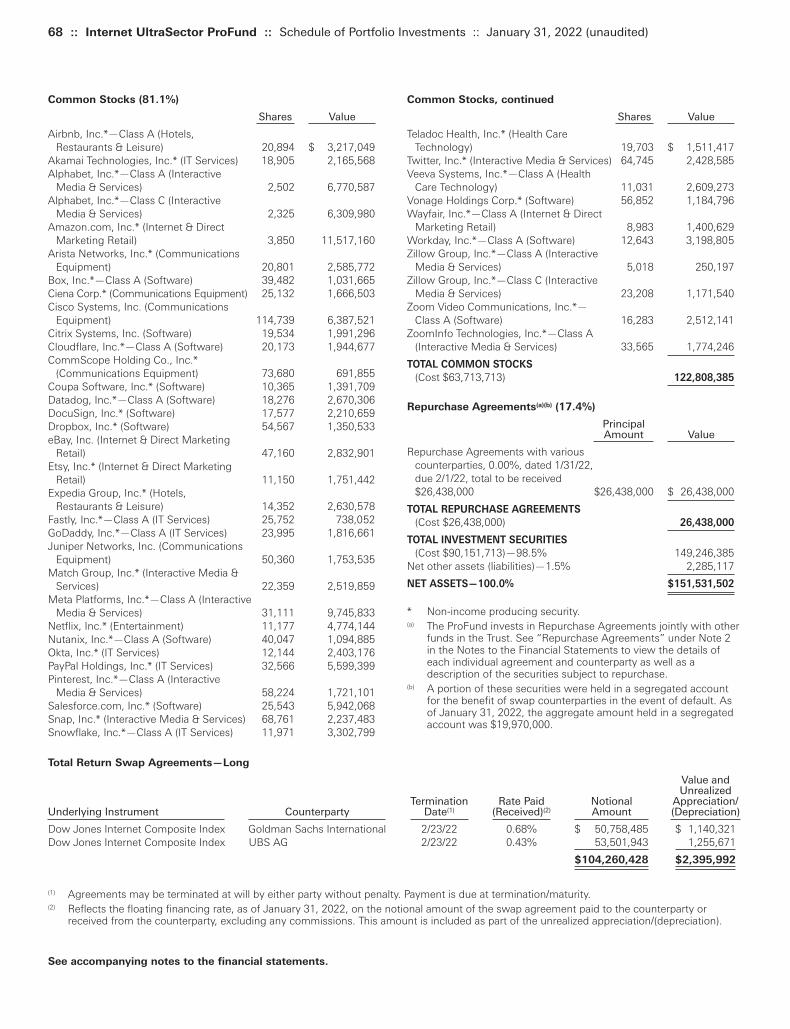
68 :: Internet UltraSector ProFund :: Schedule of Portfolio Investments :: January 31, 2022 (unaudited)
See accompanying notes to the financial statements.
Total Return Swap Agreements—Long
Value and Unrealized
Termination Rate Paid Notional Appreciation/ Underlying Instrument Counterparty Date(1) (Received)(2) Amount (Depreciation)
Dow Jones Internet Composite Index Goldman Sachs International 2/23/22 0.68% $ 50,758,485 $ 1,140,321Dow Jones Internet Composite Index UBS AG 2/23/22 0.43% 53,501,943 1,255,671
$104,260,428 $2,395,992
(1) Agreements may be terminated at will by either party without penalty. Payment is due at termination/maturity.(2) Reflects the floating financing rate, as of January 31, 2022, on the notional amount of the swap agreement paid to the counterparty or
received from the counterparty, excluding any commissions. This amount is included as part of the unrealized appreciation/(depreciation).
Common Stocks, continued
Shares Value
Teladoc Health, Inc.* (Health Care Technology) 19,703 $ 1,511,417
Twitter, Inc.* (Interactive Media & Services) 64,745 2,428,585Veeva Systems, Inc.*—Class A (Health
Care Technology) 11,031 2,609,273Vonage Holdings Corp.* (Software) 56,852 1,184,796Wayfair, Inc.*—Class A (Internet & Direct
Marketing Retail) 8,983 1,400,629Workday, Inc.*—Class A (Software) 12,643 3,198,805Zillow Group, Inc.*—Class A (Interactive
Media & Services) 5,018 250,197Zillow Group, Inc.*—Class C (Interactive
Media & Services) 23,208 1,171,540Zoom Video Communications, Inc.*—
Class A (Software) 16,283 2,512,141ZoomInfo Technologies, Inc.*—Class A
(Interactive Media & Services) 33,565 1,774,246
TOTAL COMMON STOCKS
(Cost $63,713,713) 122,808,385
Repurchase Agreements(a)(b) (17.4%)
Principal Amount Value
Repurchase Agreements with various counterparties, 0.00%, dated 1/31/22, due 2/1/22, total to be received $26,438,000 $26,438,000 $ 26,438,000
TOTAL REPURCHASE AGREEMENTS
(Cost $26,438,000) 26,438,000
TOTAL INVESTMENT SECURITIES
(Cost $90,151,713)—98.5% 149,246,385Net other assets (liabilities)—1.5% 2,285,117
NET ASSETS—100.0% $151,531,502
* Non-income producing security.(a) The ProFund invests in Repurchase Agreements jointly with other
funds in the Trust. See “Repurchase Agreements” under Note 2in the Notes to the Financial Statements to view the details ofeach individual agreement and counterparty as well as adescription of the securities subject to repurchase.
(b) A portion of these securities were held in a segregated accountfor the benefit of swap counterparties in the event of default. Asof January 31, 2022, the aggregate amount held in a segregatedaccount was $19,970,000.
Common Stocks (81.1%)
Shares Value
Airbnb, Inc.*—Class A (Hotels, Restaurants & Leisure) 20,894 $ 3,217,049
Akamai Technologies, Inc.* (IT Services) 18,905 2,165,568Alphabet, Inc.*—Class A (Interactive
Media & Services) 2,502 6,770,587Alphabet, Inc.*—Class C (Interactive
Media & Services) 2,325 6,309,980Amazon.com, Inc.* (Internet & Direct
Marketing Retail) 3,850 11,517,160Arista Networks, Inc.* (Communications
Equipment) 20,801 2,585,772Box, Inc.*—Class A (Software) 39,482 1,031,665Ciena Corp.* (Communications Equipment) 25,132 1,666,503Cisco Systems, Inc. (Communications
Equipment) 114,739 6,387,521Citrix Systems, Inc. (Software) 19,534 1,991,296Cloudflare, Inc.*—Class A (Software) 20,173 1,944,677CommScope Holding Co., Inc.*
(Communications Equipment) 73,680 691,855Coupa Software, Inc.* (Software) 10,365 1,391,709Datadog, Inc.*—Class A (Software) 18,276 2,670,306DocuSign, Inc.* (Software) 17,577 2,210,659Dropbox, Inc.* (Software) 54,567 1,350,533eBay, Inc. (Internet & Direct Marketing
Retail) 47,160 2,832,901Etsy, Inc.* (Internet & Direct Marketing
Retail) 11,150 1,751,442Expedia Group, Inc.* (Hotels,
Restaurants & Leisure) 14,352 2,630,578Fastly, Inc.*—Class A (IT Services) 25,752 738,052GoDaddy, Inc.*—Class A (IT Services) 23,995 1,816,661Juniper Networks, Inc. (Communications
Equipment) 50,360 1,753,535Match Group, Inc.* (Interactive Media &
Services) 22,359 2,519,859Meta Platforms, Inc.*—Class A (Interactive
Media & Services) 31,111 9,745,833Netflix, Inc.* (Entertainment) 11,177 4,774,144Nutanix, Inc.*—Class A (Software) 40,047 1,094,885Okta, Inc.* (IT Services) 12,144 2,403,176PayPal Holdings, Inc.* (IT Services) 32,566 5,599,399Pinterest, Inc.*—Class A (Interactive
Media & Services) 58,224 1,721,101Salesforce.com, Inc.* (Software) 25,543 5,942,068Snap, Inc.* (Interactive Media & Services) 68,761 2,237,483Snowflake, Inc.*—Class A (IT Services) 11,971 3,302,799
Toppan Merrill - ProFunds Public Semi-Annual Report [Funds] 01-31-2022 ED [AUX] | akiesli | 29-Mar-22 08:43 | 22-1296-2.de | Sequence: 1CHKSUM Content: 49029 Layout: 28632 Graphics: 0 CLEAN
JOB: 22-1296-2 CYCLE#;BL#: 8; 0 TRIM: 8.25" x 10.75" AS: New York: 212-620-5600COLORS: ~note-color 2, Black, ~note-color 3 GRAPHICS: none V1.5
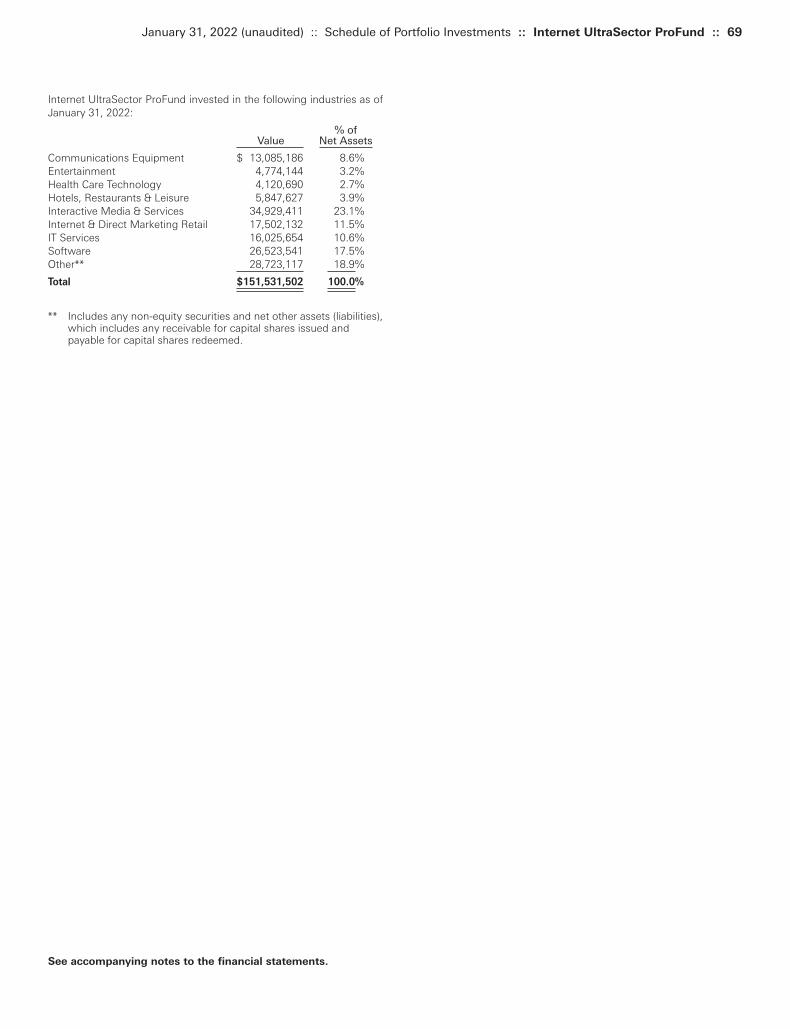
January 31, 2022 (unaudited) :: Schedule of Portfolio Investments :: Internet UltraSector ProFund :: 69
See accompanying notes to the financial statements.
Internet UltraSector ProFund invested in the following industries as ofJanuary 31, 2022:
% ofValue Net Assets
Communications Equipment $ 13,085,186 8.6%Entertainment 4,774,144 3.2%Health Care Technology 4,120,690 2.7%Hotels, Restaurants & Leisure 5,847,627 3.9%Interactive Media & Services 34,929,411 23.1%Internet & Direct Marketing Retail 17,502,132 11.5%IT Services 16,025,654 10.6%Software 26,523,541 17.5%Other** 28,723,117 18.9%
Total $151,531,502 100.0%
** Includes any non-equity securities and net other assets (liabilities),which includes any receivable for capital shares issued andpayable for capital shares redeemed.
Toppan Merrill - ProFunds Public Semi-Annual Report [Funds] 01-31-2022 ED [AUX] | akiesli | 29-Mar-22 08:43 | 22-1296-2.de | Sequence: 2CHKSUM Content: 47179 Layout: 20605 Graphics: 0 CLEAN
JOB: 22-1296-2 CYCLE#;BL#: 8; 0 TRIM: 8.25" x 10.75" AS: New York: 212-620-5600COLORS: ~HTML color, ~watermark, ~note-color 2, Black, ~note-color 3 GRAPHICS: none V1.5
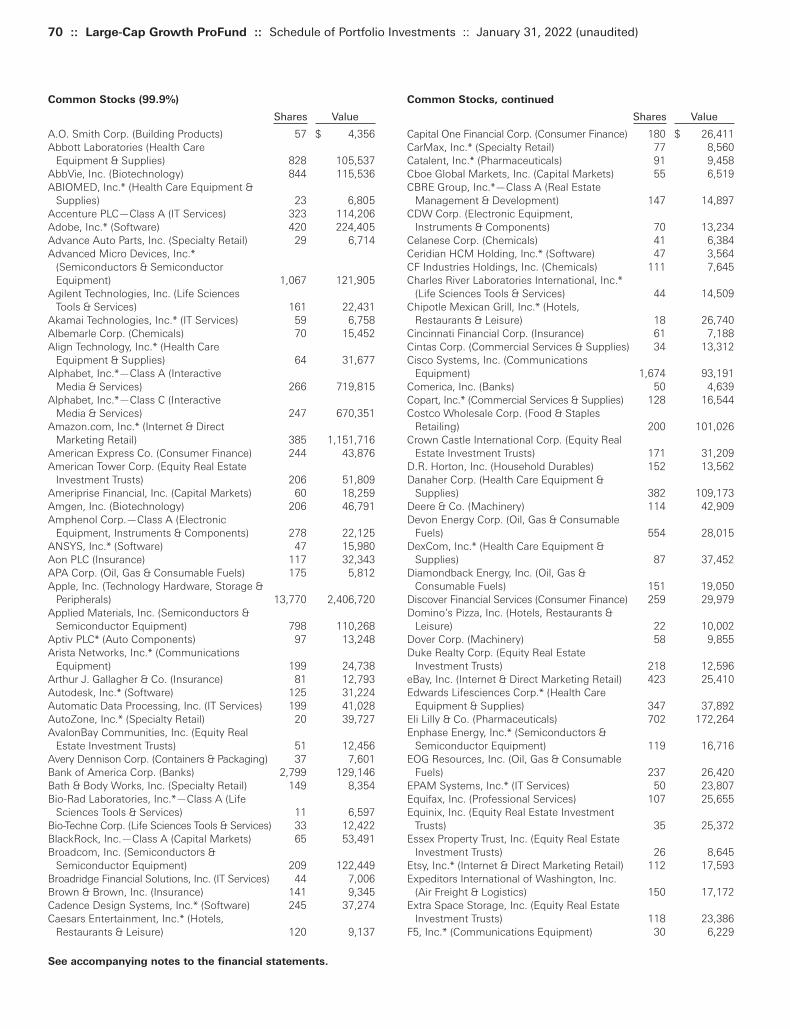
70 :: Large-Cap Growth ProFund :: Schedule of Portfolio Investments :: January 31, 2022 (unaudited)
Common Stocks, continued
Shares Value
Capital One Financial Corp. (Consumer Finance) 180 $ 26,411CarMax, Inc.* (Specialty Retail) 77 8,560Catalent, Inc.* (Pharmaceuticals) 91 9,458Cboe Global Markets, Inc. (Capital Markets) 55 6,519CBRE Group, Inc.*—Class A (Real Estate
Management & Development) 147 14,897CDW Corp. (Electronic Equipment,
Instruments & Components) 70 13,234Celanese Corp. (Chemicals) 41 6,384Ceridian HCM Holding, Inc.* (Software) 47 3,564CF Industries Holdings, Inc. (Chemicals) 111 7,645Charles River Laboratories International, Inc.*
(Life Sciences Tools & Services) 44 14,509Chipotle Mexican Grill, Inc.* (Hotels,
Restaurants & Leisure) 18 26,740Cincinnati Financial Corp. (Insurance) 61 7,188Cintas Corp. (Commercial Services & Supplies) 34 13,312Cisco Systems, Inc. (Communications
Equipment) 1,674 93,191Comerica, Inc. (Banks) 50 4,639Copart, Inc.* (Commercial Services & Supplies) 128 16,544Costco Wholesale Corp. (Food & Staples
Retailing) 200 101,026Crown Castle International Corp. (Equity Real
Estate Investment Trusts) 171 31,209D.R. Horton, Inc. (Household Durables) 152 13,562Danaher Corp. (Health Care Equipment &
Supplies) 382 109,173Deere & Co. (Machinery) 114 42,909Devon Energy Corp. (Oil, Gas & Consumable
Fuels) 554 28,015DexCom, Inc.* (Health Care Equipment &
Supplies) 87 37,452Diamondback Energy, Inc. (Oil, Gas &
Consumable Fuels) 151 19,050Discover Financial Services (Consumer Finance) 259 29,979Domino’s Pizza, Inc. (Hotels, Restaurants &
Leisure) 22 10,002Dover Corp. (Machinery) 58 9,855Duke Realty Corp. (Equity Real Estate
Investment Trusts) 218 12,596eBay, Inc. (Internet & Direct Marketing Retail) 423 25,410Edwards Lifesciences Corp.* (Health Care
Equipment & Supplies) 347 37,892Eli Lilly & Co. (Pharmaceuticals) 702 172,264Enphase Energy, Inc.* (Semiconductors &
Semiconductor Equipment) 119 16,716EOG Resources, Inc. (Oil, Gas & Consumable
Fuels) 237 26,420EPAM Systems, Inc.* (IT Services) 50 23,807Equifax, Inc. (Professional Services) 107 25,655Equinix, Inc. (Equity Real Estate Investment
Trusts) 35 25,372Essex Property Trust, Inc. (Equity Real Estate
Investment Trusts) 26 8,645Etsy, Inc.* (Internet & Direct Marketing Retail) 112 17,593Expeditors International of Washington, Inc.
(Air Freight & Logistics) 150 17,172Extra Space Storage, Inc. (Equity Real Estate
Investment Trusts) 118 23,386F5, Inc.* (Communications Equipment) 30 6,229
Common Stocks (99.9%)
Shares Value
A.O. Smith Corp. (Building Products) 57 $ 4,356Abbott Laboratories (Health Care
Equipment & Supplies) 828 105,537AbbVie, Inc. (Biotechnology) 844 115,536ABIOMED, Inc.* (Health Care Equipment &
Supplies) 23 6,805Accenture PLC—Class A (IT Services) 323 114,206Adobe, Inc.* (Software) 420 224,405Advance Auto Parts, Inc. (Specialty Retail) 29 6,714Advanced Micro Devices, Inc.*
(Semiconductors & Semiconductor Equipment) 1,067 121,905
Agilent Technologies, Inc. (Life Sciences Tools & Services) 161 22,431
Akamai Technologies, Inc.* (IT Services) 59 6,758Albemarle Corp. (Chemicals) 70 15,452Align Technology, Inc.* (Health Care
Equipment & Supplies) 64 31,677Alphabet, Inc.*—Class A (Interactive
Media & Services) 266 719,815Alphabet, Inc.*—Class C (Interactive
Media & Services) 247 670,351Amazon.com, Inc.* (Internet & Direct
Marketing Retail) 385 1,151,716American Express Co. (Consumer Finance) 244 43,876American Tower Corp. (Equity Real Estate
Investment Trusts) 206 51,809Ameriprise Financial, Inc. (Capital Markets) 60 18,259Amgen, Inc. (Biotechnology) 206 46,791Amphenol Corp.—Class A (Electronic
Equipment, Instruments & Components) 278 22,125ANSYS, Inc.* (Software) 47 15,980Aon PLC (Insurance) 117 32,343APA Corp. (Oil, Gas & Consumable Fuels) 175 5,812Apple, Inc. (Technology Hardware, Storage &
Peripherals) 13,770 2,406,720Applied Materials, Inc. (Semiconductors &
Semiconductor Equipment) 798 110,268Aptiv PLC* (Auto Components) 97 13,248Arista Networks, Inc.* (Communications
Equipment) 199 24,738Arthur J. Gallagher & Co. (Insurance) 81 12,793Autodesk, Inc.* (Software) 125 31,224Automatic Data Processing, Inc. (IT Services) 199 41,028AutoZone, Inc.* (Specialty Retail) 20 39,727AvalonBay Communities, Inc. (Equity Real
Estate Investment Trusts) 51 12,456Avery Dennison Corp. (Containers & Packaging) 37 7,601Bank of America Corp. (Banks) 2,799 129,146Bath & Body Works, Inc. (Specialty Retail) 149 8,354Bio-Rad Laboratories, Inc.*—Class A (Life
Sciences Tools & Services) 11 6,597Bio-Techne Corp. (Life Sciences Tools & Services) 33 12,422BlackRock, Inc.—Class A (Capital Markets) 65 53,491Broadcom, Inc. (Semiconductors &
Semiconductor Equipment) 209 122,449Broadridge Financial Solutions, Inc. (IT Services) 44 7,006Brown & Brown, Inc. (Insurance) 141 9,345Cadence Design Systems, Inc.* (Software) 245 37,274Caesars Entertainment, Inc.* (Hotels,
Restaurants & Leisure) 120 9,137
See accompanying notes to the financial statements.
Toppan Merrill - ProFunds Public Semi-Annual Report [Funds] 01-31-2022 ED [AUX] | akiesli | 29-Mar-22 08:43 | 22-1296-2.de | Sequence: 3CHKSUM Content: 52784 Layout: 44922 Graphics: 0 CLEAN
JOB: 22-1296-2 CYCLE#;BL#: 8; 0 TRIM: 8.25" x 10.75" AS: New York: 212-620-5600COLORS: ~note-color 2, Black, ~note-color 3 GRAPHICS: none V1.5
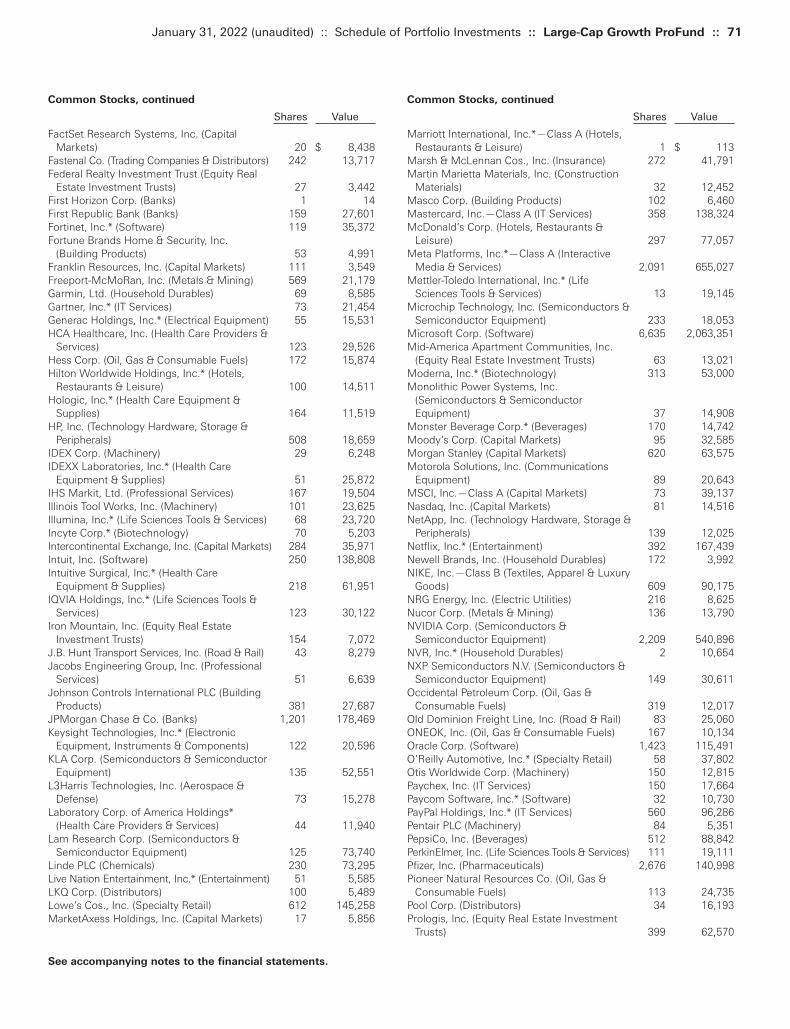
Common Stocks, continued
Shares Value
Marriott International, Inc.*—Class A (Hotels, Restaurants & Leisure) 1 $ 113
Marsh & McLennan Cos., Inc. (Insurance) 272 41,791Martin Marietta Materials, Inc. (Construction
Materials) 32 12,452Masco Corp. (Building Products) 102 6,460Mastercard, Inc.—Class A (IT Services) 358 138,324McDonald’s Corp. (Hotels, Restaurants &
Leisure) 297 77,057Meta Platforms, Inc.*—Class A (Interactive
Media & Services) 2,091 655,027Mettler-Toledo International, Inc.* (Life
Sciences Tools & Services) 13 19,145Microchip Technology, Inc. (Semiconductors &
Semiconductor Equipment) 233 18,053Microsoft Corp. (Software) 6,635 2,063,351Mid-America Apartment Communities, Inc.
(Equity Real Estate Investment Trusts) 63 13,021Moderna, Inc.* (Biotechnology) 313 53,000Monolithic Power Systems, Inc.
(Semiconductors & Semiconductor Equipment) 37 14,908
Monster Beverage Corp.* (Beverages) 170 14,742Moody’s Corp. (Capital Markets) 95 32,585Morgan Stanley (Capital Markets) 620 63,575Motorola Solutions, Inc. (Communications
Equipment) 89 20,643MSCI, Inc.—Class A (Capital Markets) 73 39,137Nasdaq, Inc. (Capital Markets) 81 14,516NetApp, Inc. (Technology Hardware, Storage &
Peripherals) 139 12,025Netflix, Inc.* (Entertainment) 392 167,439Newell Brands, Inc. (Household Durables) 172 3,992NIKE, Inc.—Class B (Textiles, Apparel & Luxury
Goods) 609 90,175NRG Energy, Inc. (Electric Utilities) 216 8,625Nucor Corp. (Metals & Mining) 136 13,790NVIDIA Corp. (Semiconductors &
Semiconductor Equipment) 2,209 540,896NVR, Inc.* (Household Durables) 2 10,654NXP Semiconductors N.V. (Semiconductors &
Semiconductor Equipment) 149 30,611Occidental Petroleum Corp. (Oil, Gas &
Consumable Fuels) 319 12,017Old Dominion Freight Line, Inc. (Road & Rail) 83 25,060ONEOK, Inc. (Oil, Gas & Consumable Fuels) 167 10,134Oracle Corp. (Software) 1,423 115,491O’Reilly Automotive, Inc.* (Specialty Retail) 58 37,802Otis Worldwide Corp. (Machinery) 150 12,815Paychex, Inc. (IT Services) 150 17,664Paycom Software, Inc.* (Software) 32 10,730PayPal Holdings, Inc.* (IT Services) 560 96,286Pentair PLC (Machinery) 84 5,351PepsiCo, Inc. (Beverages) 512 88,842PerkinElmer, Inc. (Life Sciences Tools & Services) 111 19,111Pfizer, Inc. (Pharmaceuticals) 2,676 140,998Pioneer Natural Resources Co. (Oil, Gas &
Consumable Fuels) 113 24,735Pool Corp. (Distributors) 34 16,193Prologis, Inc. (Equity Real Estate Investment
Trusts) 399 62,570
Common Stocks, continued
Shares Value
FactSet Research Systems, Inc. (Capital Markets) 20 $ 8,438
Fastenal Co. (Trading Companies & Distributors) 242 13,717Federal Realty Investment Trust (Equity Real
Estate Investment Trusts) 27 3,442First Horizon Corp. (Banks) 1 14First Republic Bank (Banks) 159 27,601Fortinet, Inc.* (Software) 119 35,372Fortune Brands Home & Security, Inc.
(Building Products) 53 4,991Franklin Resources, Inc. (Capital Markets) 111 3,549Freeport-McMoRan, Inc. (Metals & Mining) 569 21,179Garmin, Ltd. (Household Durables) 69 8,585Gartner, Inc.* (IT Services) 73 21,454Generac Holdings, Inc.* (Electrical Equipment) 55 15,531HCA Healthcare, Inc. (Health Care Providers &
Services) 123 29,526Hess Corp. (Oil, Gas & Consumable Fuels) 172 15,874Hilton Worldwide Holdings, Inc.* (Hotels,
Restaurants & Leisure) 100 14,511Hologic, Inc.* (Health Care Equipment &
Supplies) 164 11,519HP, Inc. (Technology Hardware, Storage &
Peripherals) 508 18,659IDEX Corp. (Machinery) 29 6,248IDEXX Laboratories, Inc.* (Health Care
Equipment & Supplies) 51 25,872IHS Markit, Ltd. (Professional Services) 167 19,504Illinois Tool Works, Inc. (Machinery) 101 23,625Illumina, Inc.* (Life Sciences Tools & Services) 68 23,720Incyte Corp.* (Biotechnology) 70 5,203Intercontinental Exchange, Inc. (Capital Markets) 284 35,971Intuit, Inc. (Software) 250 138,808Intuitive Surgical, Inc.* (Health Care
Equipment & Supplies) 218 61,951IQVIA Holdings, Inc.* (Life Sciences Tools &
Services) 123 30,122Iron Mountain, Inc. (Equity Real Estate
Investment Trusts) 154 7,072J.B. Hunt Transport Services, Inc. (Road & Rail) 43 8,279Jacobs Engineering Group, Inc. (Professional
Services) 51 6,639Johnson Controls International PLC (Building
Products) 381 27,687JPMorgan Chase & Co. (Banks) 1,201 178,469Keysight Technologies, Inc.* (Electronic
Equipment, Instruments & Components) 122 20,596KLA Corp. (Semiconductors & Semiconductor
Equipment) 135 52,551L3Harris Technologies, Inc. (Aerospace &
Defense) 73 15,278Laboratory Corp. of America Holdings*
(Health Care Providers & Services) 44 11,940Lam Research Corp. (Semiconductors &
Semiconductor Equipment) 125 73,740Linde PLC (Chemicals) 230 73,295Live Nation Entertainment, Inc.* (Entertainment) 51 5,585LKQ Corp. (Distributors) 100 5,489Lowe’s Cos., Inc. (Specialty Retail) 612 145,258MarketAxess Holdings, Inc. (Capital Markets) 17 5,856
January 31, 2022 (unaudited) :: Schedule of Portfolio Investments :: Large-Cap Growth ProFund :: 71
See accompanying notes to the financial statements.
Toppan Merrill - ProFunds Public Semi-Annual Report [Funds] 01-31-2022 ED [AUX] | akiesli | 29-Mar-22 08:43 | 22-1296-2.de | Sequence: 4CHKSUM Content: 36617 Layout: 54287 Graphics: 0 CLEAN
JOB: 22-1296-2 CYCLE#;BL#: 8; 0 TRIM: 8.25" x 10.75" AS: New York: 212-620-5600COLORS: ~note-color 2, Black, ~note-color 3 GRAPHICS: none V1.5
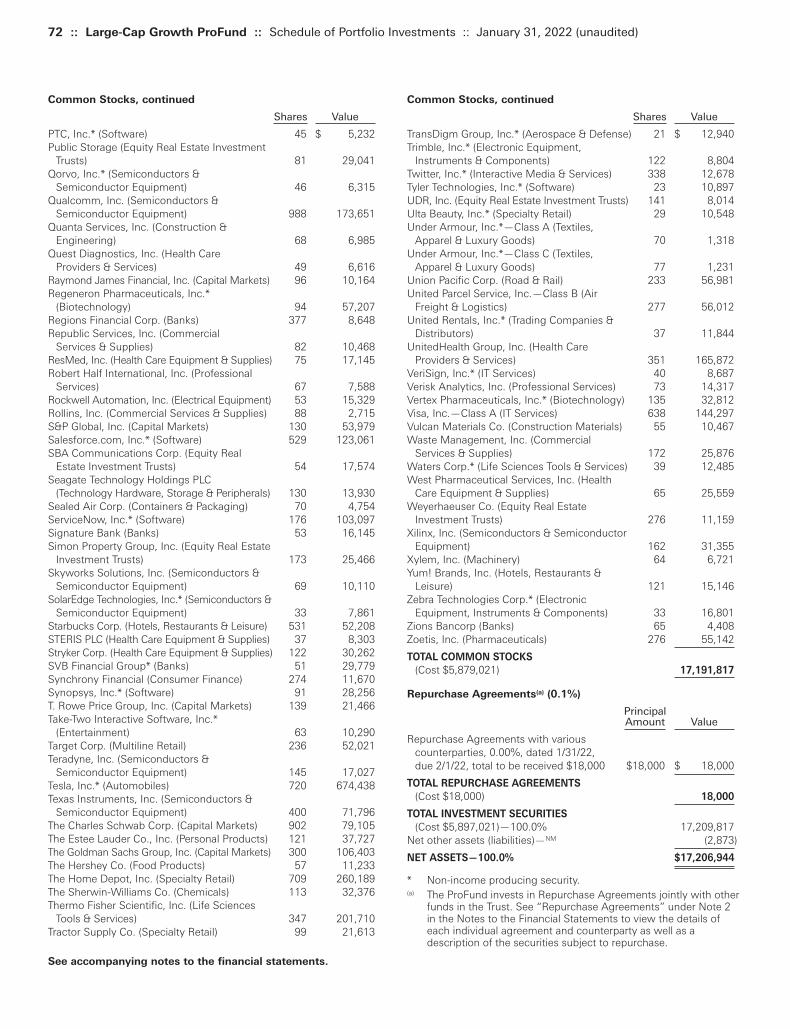
72 :: Large-Cap Growth ProFund :: Schedule of Portfolio Investments :: January 31, 2022 (unaudited)
Common Stocks, continued
Shares Value
TransDigm Group, Inc.* (Aerospace & Defense) 21 $ 12,940Trimble, Inc.* (Electronic Equipment,
Instruments & Components) 122 8,804Twitter, Inc.* (Interactive Media & Services) 338 12,678Tyler Technologies, Inc.* (Software) 23 10,897UDR, Inc. (Equity Real Estate Investment Trusts) 141 8,014Ulta Beauty, Inc.* (Specialty Retail) 29 10,548Under Armour, Inc.*—Class A (Textiles,
Apparel & Luxury Goods) 70 1,318Under Armour, Inc.*—Class C (Textiles,
Apparel & Luxury Goods) 77 1,231Union Pacific Corp. (Road & Rail) 233 56,981United Parcel Service, Inc.—Class B (Air
Freight & Logistics) 277 56,012United Rentals, Inc.* (Trading Companies &
Distributors) 37 11,844UnitedHealth Group, Inc. (Health Care
Providers & Services) 351 165,872VeriSign, Inc.* (IT Services) 40 8,687Verisk Analytics, Inc. (Professional Services) 73 14,317Vertex Pharmaceuticals, Inc.* (Biotechnology) 135 32,812Visa, Inc.—Class A (IT Services) 638 144,297Vulcan Materials Co. (Construction Materials) 55 10,467Waste Management, Inc. (Commercial
Services & Supplies) 172 25,876Waters Corp.* (Life Sciences Tools & Services) 39 12,485West Pharmaceutical Services, Inc. (Health
Care Equipment & Supplies) 65 25,559Weyerhaeuser Co. (Equity Real Estate
Investment Trusts) 276 11,159Xilinx, Inc. (Semiconductors & Semiconductor
Equipment) 162 31,355Xylem, Inc. (Machinery) 64 6,721Yum! Brands, Inc. (Hotels, Restaurants &
Leisure) 121 15,146Zebra Technologies Corp.* (Electronic
Equipment, Instruments & Components) 33 16,801Zions Bancorp (Banks) 65 4,408Zoetis, Inc. (Pharmaceuticals) 276 55,142
TOTAL COMMON STOCKS
(Cost $5,879,021) 17,191,817
Repurchase Agreements(a) (0.1%)
Principal Amount Value
Repurchase Agreements with various counterparties, 0.00%, dated 1/31/22, due 2/1/22, total to be received $18,000 $18,000 $ 18,000
TOTAL REPURCHASE AGREEMENTS
(Cost $18,000) 18,000
TOTAL INVESTMENT SECURITIES
(Cost $5,897,021)—100.0% 17,209,817Net other assets (liabilities)—NM (2,873)
NET ASSETS—100.0% $17,206,944
* Non-income producing security.(a) The ProFund invests in Repurchase Agreements jointly with other
funds in the Trust. See “Repurchase Agreements” under Note 2in the Notes to the Financial Statements to view the details ofeach individual agreement and counterparty as well as adescription of the securities subject to repurchase.
Common Stocks, continued
Shares Value
PTC, Inc.* (Software) 45 $ 5,232Public Storage (Equity Real Estate Investment
Trusts) 81 29,041Qorvo, Inc.* (Semiconductors &
Semiconductor Equipment) 46 6,315Qualcomm, Inc. (Semiconductors &
Semiconductor Equipment) 988 173,651Quanta Services, Inc. (Construction &
Engineering) 68 6,985Quest Diagnostics, Inc. (Health Care
Providers & Services) 49 6,616Raymond James Financial, Inc. (Capital Markets) 96 10,164Regeneron Pharmaceuticals, Inc.*
(Biotechnology) 94 57,207Regions Financial Corp. (Banks) 377 8,648Republic Services, Inc. (Commercial
Services & Supplies) 82 10,468ResMed, Inc. (Health Care Equipment & Supplies) 75 17,145Robert Half International, Inc. (Professional
Services) 67 7,588Rockwell Automation, Inc. (Electrical Equipment) 53 15,329Rollins, Inc. (Commercial Services & Supplies) 88 2,715S&P Global, Inc. (Capital Markets) 130 53,979Salesforce.com, Inc.* (Software) 529 123,061SBA Communications Corp. (Equity Real
Estate Investment Trusts) 54 17,574Seagate Technology Holdings PLC
(Technology Hardware, Storage & Peripherals) 130 13,930Sealed Air Corp. (Containers & Packaging) 70 4,754ServiceNow, Inc.* (Software) 176 103,097Signature Bank (Banks) 53 16,145Simon Property Group, Inc. (Equity Real Estate
Investment Trusts) 173 25,466Skyworks Solutions, Inc. (Semiconductors &
Semiconductor Equipment) 69 10,110SolarEdge Technologies, Inc.* (Semiconductors &
Semiconductor Equipment) 33 7,861Starbucks Corp. (Hotels, Restaurants & Leisure) 531 52,208STERIS PLC (Health Care Equipment & Supplies) 37 8,303Stryker Corp. (Health Care Equipment & Supplies) 122 30,262SVB Financial Group* (Banks) 51 29,779Synchrony Financial (Consumer Finance) 274 11,670Synopsys, Inc.* (Software) 91 28,256T. Rowe Price Group, Inc. (Capital Markets) 139 21,466Take-Two Interactive Software, Inc.*
(Entertainment) 63 10,290Target Corp. (Multiline Retail) 236 52,021Teradyne, Inc. (Semiconductors &
Semiconductor Equipment) 145 17,027Tesla, Inc.* (Automobiles) 720 674,438Texas Instruments, Inc. (Semiconductors &
Semiconductor Equipment) 400 71,796The Charles Schwab Corp. (Capital Markets) 902 79,105The Estee Lauder Co., Inc. (Personal Products) 121 37,727The Goldman Sachs Group, Inc. (Capital Markets) 300 106,403The Hershey Co. (Food Products) 57 11,233The Home Depot, Inc. (Specialty Retail) 709 260,189The Sherwin-Williams Co. (Chemicals) 113 32,376Thermo Fisher Scientific, Inc. (Life Sciences
Tools & Services) 347 201,710Tractor Supply Co. (Specialty Retail) 99 21,613
See accompanying notes to the financial statements.
Toppan Merrill - ProFunds Public Semi-Annual Report [Funds] 01-31-2022 ED [AUX] | akiesli | 29-Mar-22 08:43 | 22-1296-2.de | Sequence: 5CHKSUM Content: 53452 Layout: 20589 Graphics: 0 CLEAN
JOB: 22-1296-2 CYCLE#;BL#: 8; 0 TRIM: 8.25" x 10.75" AS: New York: 212-620-5600COLORS: ~note-color 2, Black, ~note-color 3 GRAPHICS: none V1.5
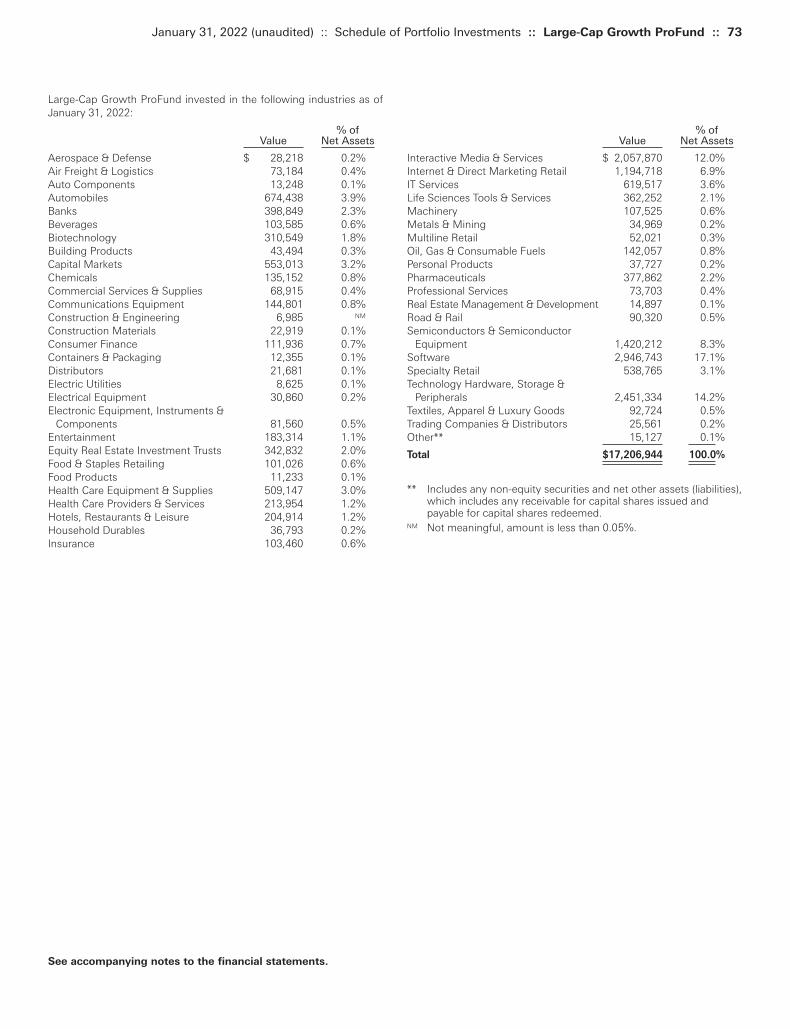
% ofValue Net Assets
Interactive Media & Services $ 2,057,870 12.0%Internet & Direct Marketing Retail 1,194,718 6.9%IT Services 619,517 3.6%Life Sciences Tools & Services 362,252 2.1%Machinery 107,525 0.6%Metals & Mining 34,969 0.2%Multiline Retail 52,021 0.3%Oil, Gas & Consumable Fuels 142,057 0.8%Personal Products 37,727 0.2%Pharmaceuticals 377,862 2.2%Professional Services 73,703 0.4%Real Estate Management & Development 14,897 0.1%Road & Rail 90,320 0.5%Semiconductors & Semiconductor
Equipment 1,420,212 8.3%Software 2,946,743 17.1%Specialty Retail 538,765 3.1%Technology Hardware, Storage &
Peripherals 2,451,334 14.2%Textiles, Apparel & Luxury Goods 92,724 0.5%Trading Companies & Distributors 25,561 0.2%Other** 15,127 0.1%
Total $17,206,944 100.0%
** Includes any non-equity securities and net other assets (liabilities),which includes any receivable for capital shares issued andpayable for capital shares redeemed.
NM Not meaningful, amount is less than 0.05%.
Large-Cap Growth ProFund invested in the following industries as ofJanuary 31, 2022:
% ofValue Net Assets
Aerospace & Defense $ 28,218 0.2%Air Freight & Logistics 73,184 0.4%Auto Components 13,248 0.1%Automobiles 674,438 3.9%Banks 398,849 2.3%Beverages 103,585 0.6%Biotechnology 310,549 1.8%Building Products 43,494 0.3%Capital Markets 553,013 3.2%Chemicals 135,152 0.8%Commercial Services & Supplies 68,915 0.4%Communications Equipment 144,801 0.8%Construction & Engineering 6,985 NM
Construction Materials 22,919 0.1%Consumer Finance 111,936 0.7%Containers & Packaging 12,355 0.1%Distributors 21,681 0.1%Electric Utilities 8,625 0.1%Electrical Equipment 30,860 0.2%Electronic Equipment, Instruments &
Components 81,560 0.5%Entertainment 183,314 1.1%Equity Real Estate Investment Trusts 342,832 2.0%Food & Staples Retailing 101,026 0.6%Food Products 11,233 0.1%Health Care Equipment & Supplies 509,147 3.0%Health Care Providers & Services 213,954 1.2%Hotels, Restaurants & Leisure 204,914 1.2%Household Durables 36,793 0.2%Insurance 103,460 0.6%
January 31, 2022 (unaudited) :: Schedule of Portfolio Investments :: Large-Cap Growth ProFund :: 73
See accompanying notes to the financial statements.
Toppan Merrill - ProFunds Public Semi-Annual Report [Funds] 01-31-2022 ED [AUX] | akiesli | 29-Mar-22 08:43 | 22-1296-2.de | Sequence: 6CHKSUM Content: 19098 Layout: 12156 Graphics: 0 CLEAN
JOB: 22-1296-2 CYCLE#;BL#: 8; 0 TRIM: 8.25" x 10.75" AS: New York: 212-620-5600COLORS: ~note-color 2, Black, ~note-color 3 GRAPHICS: none V1.5

74 :: Large-Cap Value ProFund :: Schedule of Portfolio Investments :: January 31, 2022 (unaudited)
Common Stocks, continued
Shares Value
Bath & Body Works, Inc. (Specialty Retail) 140 $ 7,850Baxter International, Inc. (Health Care
Equipment & Supplies) 754 64,422Becton, Dickinson & Co. (Health Care
Equipment & Supplies) 428 108,772Berkshire Hathaway, Inc.*—Class B
(Diversified Financial Services) 2,750 860,805Best Buy Co., Inc. (Specialty Retail) 334 33,160Biogen, Inc.* (Biotechnology) 218 49,268Bio-Rad Laboratories, Inc.*—Class A (Life
Sciences Tools & Services) 14 8,396BlackRock, Inc.—Class A (Capital Markets) 109 89,700Booking Holdings, Inc.* (Hotels, Restaurants &
Leisure) 61 149,825BorgWarner, Inc. (Auto Components) 370 16,225Boston Properties, Inc. (Equity Real Estate
Investment Trusts) 211 23,649Boston Scientific Corp.* (Health Care
Equipment & Supplies) 2,147 92,106Bristol-Myers Squibb Co. (Pharmaceuticals) 3,345 217,057Broadcom, Inc. (Semiconductors &
Semiconductor Equipment) 262 153,501Broadridge Financial Solutions, Inc. (IT Services) 103 16,400Brown & Brown, Inc. (Insurance) 103 6,827Brown-Forman Corp.—Class B (Beverages) 274 18,476C.H. Robinson Worldwide, Inc. (Air Freight &
Logistics) 190 19,884Caesars Entertainment, Inc.* (Hotels,
Restaurants & Leisure) 114 8,680Campbell Soup Co. (Food Products) 310 13,677Capital One Financial Corp. (Consumer Finance) 334 49,008Cardinal Health, Inc. (Health Care Providers &
Services) 434 22,381CarMax, Inc.* (Specialty Retail) 114 12,673Carnival Corp.*—Class A (Hotels,
Restaurants & Leisure) 1,217 24,109Carrier Global Corp. (Building Products) 1,310 62,461Catalent, Inc.* (Pharmaceuticals) 109 11,328Caterpillar, Inc. (Machinery) 808 162,860Cboe Global Markets, Inc. (Capital Markets) 73 8,653CBRE Group, Inc.*—Class A (Real Estate
Management & Development) 251 25,436CDW Corp. (Electronic Equipment,
Instruments & Components) 87 16,447Celanese Corp. (Chemicals) 96 14,948Centene Corp.* (Health Care Providers &
Services) 874 67,962CenterPoint Energy, Inc. (Multi-Utilities) 951 26,970Ceridian HCM Holding, Inc.* (Software) 123 9,326Cerner Corp. (Health Care Technology) 445 40,584CF Industries Holdings, Inc. (Chemicals) 123 8,471Charter Communications, Inc.*—Class A (Media) 179 106,207Chevron Corp. (Oil, Gas & Consumable Fuels) 2,891 379,675Chipotle Mexican Grill, Inc.* (Hotels,
Restaurants & Leisure) 14 20,798Chubb, Ltd. (Insurance) 640 126,258Church & Dwight Co., Inc. (Household Products) 365 37,467Cigna Corp. (Health Care Providers & Services) 494 113,847Cincinnati Financial Corp. (Insurance) 114 13,433Cintas Corp. (Commercial Services & Supplies) 76 29,756
Common Stocks (99.9%)
Shares Value
3M Co. (Industrial Conglomerates) 867 $ 143,939A.O. Smith Corp. (Building Products) 98 7,489Abbott Laboratories (Health Care Equipment &
Supplies) 1,235 157,413AbbVie, Inc. (Biotechnology) 1,215 166,322ABIOMED, Inc.* (Health Care Equipment &
Supplies) 29 8,580Accenture PLC—Class A (IT Services) 399 141,078Activision Blizzard, Inc. (Entertainment) 1,176 92,916Advance Auto Parts, Inc. (Specialty Retail) 46 10,649Aflac, Inc. (Insurance) 919 57,732Agilent Technologies, Inc. (Life Sciences
Tools & Services) 179 24,938Air Products & Chemicals, Inc. (Chemicals) 334 94,227Akamai Technologies, Inc.* (IT Services) 140 16,037Alaska Air Group, Inc.* (Airlines) 201 11,003Albemarle Corp. (Chemicals) 61 13,465Alexandria Real Estate Equities, Inc. (Equity
Real Estate Investment Trusts) 211 41,111Allegion PLC (Building Products) 136 16,691Alliant Energy Corp. (Electric Utilities) 385 23,046Altria Group, Inc. (Tobacco) 2,772 141,039Amcor PLC (Containers & Packaging) 2,310 27,743Ameren Corp. (Multi-Utilities) 385 34,165American Airlines Group, Inc.* (Airlines) 982 16,174American Electric Power Co., Inc. (Electric
Utilities) 757 68,433American Express Co. (Consumer Finance) 522 93,866American International Group, Inc. (Insurance) 1,252 72,303American Tower Corp. (Equity Real Estate
Investment Trusts) 334 84,002American Water Works Co., Inc. (Water Utilities) 272 43,738Ameriprise Financial, Inc. (Capital Markets) 73 22,215AmerisourceBergen Corp. (Health Care
Providers & Services) 223 30,373AMETEK, Inc. (Electrical Equipment) 351 48,006Amgen, Inc. (Biotechnology) 494 112,207Amphenol Corp.—Class A (Electronic
Equipment, Instruments & Components) 419 33,348Analog Devices, Inc. (Semiconductors &
Semiconductor Equipment) 800 131,176ANSYS, Inc.* (Software) 53 18,021Anthem, Inc. (Health Care Providers & Services) 365 160,961Aon PLC (Insurance) 136 37,596APA Corp. (Oil, Gas & Consumable Fuels) 244 8,103Aptiv PLC* (Auto Components) 237 32,369Archer-Daniels-Midland Co. (Food Products) 841 63,075Arthur J. Gallagher & Co. (Insurance) 175 27,640Assurant, Inc. (Insurance) 87 13,268AT&T, Inc. (Diversified Telecommunication
Services) 10,731 273,641Atmos Energy Corp. (Gas Utilities) 192 20,586Autodesk, Inc.* (Software) 116 28,976Automatic Data Processing, Inc. (IT Services) 293 60,408AvalonBay Communities, Inc. (Equity Real
Estate Investment Trusts) 124 30,285Avery Dennison Corp. (Containers & Packaging) 61 12,531Baker Hughes Co.—Class A (Energy
Equipment & Services) 1,320 36,221Ball Corp. (Containers & Packaging) 483 46,899Bank of America Corp. (Banks) 6,060 279,608
See accompanying notes to the financial statements.
Toppan Merrill - ProFunds Public Semi-Annual Report [Funds] 01-31-2022 ED [AUX] | akiesli | 29-Mar-22 08:43 | 22-1296-2.de | Sequence: 7CHKSUM Content: 21243 Layout: 44922 Graphics: 0 CLEAN
JOB: 22-1296-2 CYCLE#;BL#: 8; 0 TRIM: 8.25" x 10.75" AS: New York: 212-620-5600COLORS: ~note-color 2, Black, ~note-color 3 GRAPHICS: none V1.5

Common Stocks, continued
Shares Value
Ecolab, Inc. (Chemicals) 379 $ 71,802Edison International (Electric Utilities) 570 35,790Edwards Lifesciences Corp.* (Health Care
Equipment & Supplies) 351 38,329Electronic Arts, Inc. (Entertainment) 418 55,452Emerson Electric Co. (Electrical Equipment) 898 82,571Entergy Corp. (Electric Utilities) 301 33,643EOG Resources, Inc. (Oil, Gas & Consumable
Fuels) 471 52,507Equinix, Inc. (Equity Real Estate Investment
Trusts) 76 55,092Equity Residential (Equity Real Estate
Investment Trusts) 509 45,164Essex Property Trust, Inc. (Equity Real Estate
Investment Trusts) 61 20,283Everest Re Group, Ltd. (Insurance) 61 17,287Evergy, Inc. (Electric Utilities) 351 22,801Eversource Energy (Electric Utilities) 515 46,087Exelon Corp. (Electric Utilities) 1,473 85,360Expedia Group, Inc.* (Hotels, Restaurants &
Leisure) 218 39,957Exxon Mobil Corp. (Oil, Gas & Consumable
Fuels) 6,362 483,258F5, Inc.* (Communications Equipment) 46 9,551FactSet Research Systems, Inc. (Capital Markets) 21 8,860Fastenal Co. (Trading Companies & Distributors) 443 25,109Federal Realty Investment Trust (Equity Real
Estate Investment Trusts) 61 7,777FedEx Corp. (Air Freight & Logistics) 368 90,476Fidelity National Information Services, Inc.
(IT Services) 910 109,127Fifth Third Bancorp (Banks) 1,034 46,147First Horizon Corp. (Banks) 1 15FirstEnergy Corp. (Electric Utilities) 828 34,743Fiserv, Inc.* (IT Services) 891 94,179FleetCor Technologies, Inc.* (IT Services) 124 29,544FMC Corp. (Chemicals) 187 20,639Ford Motor Co. (Automobiles) 5,899 119,750Fortive Corp. (Machinery) 531 37,457Fortune Brands Home & Security, Inc.
(Building Products) 113 10,641Fox Corp.—Class A (Media) 489 19,858Fox Corp.—Class B (Media) 227 8,440Franklin Resources, Inc. (Capital Markets) 240 7,673Freeport-McMoRan, Inc. (Metals & Mining) 1,233 45,892Garmin, Ltd. (Household Durables) 114 14,184General Dynamics Corp. (Aerospace & Defense) 351 74,447General Electric Co. (Industrial Conglomerates) 1,657 156,553General Mills, Inc. (Food Products) 919 63,117General Motors Co.* (Automobiles) 2,191 115,531Genuine Parts Co. (Distributors) 211 28,112Gilead Sciences, Inc. (Biotechnology) 1,879 129,050Global Payments, Inc. (IT Services) 433 64,898Globe Life, Inc. (Insurance) 140 14,322Halliburton Co. (Energy Equipment & Services) 1,352 41,560Hartford Financial Services Group, Inc.
(Insurance) 517 37,157Hasbro, Inc. (Leisure Products) 190 17,571HCA Healthcare, Inc. (Health Care
Providers & Services) 148 35,527
Common Stocks, continued
Shares Value
Cisco Systems, Inc. (Communications Equipment) 3,489 $ 194,232
Citigroup, Inc. (Banks) 2,985 194,383Citizens Financial Group, Inc. (Banks) 646 33,250Citrix Systems, Inc. (Software) 187 19,063CME Group, Inc. (Capital Markets) 534 122,553CMS Energy Corp. (Multi-Utilities) 437 28,134Cognizant Technology Solutions Corp.—
Class A (IT Services) 785 67,055Colgate-Palmolive Co. (Household Products) 1,274 105,041Comcast Corp.—Class A (Media) 6,848 342,331Comerica, Inc. (Banks) 109 10,113Conagra Brands, Inc. (Food Products) 728 25,305ConocoPhillips (Oil, Gas & Consumable Fuels) 1,981 175,556Consolidated Edison, Inc. (Multi-Utilities) 531 45,905Constellation Brands, Inc.—Class A (Beverages) 240 57,060Copart, Inc.* (Commercial Services & Supplies) 109 14,088Corning, Inc. (Electronic Equipment,
Instruments & Components) 1,155 48,556Corteva, Inc. (Chemicals) 1,098 52,792Costco Wholesale Corp. (Food & Staples
Retailing) 324 163,662Coterra Energy, Inc. (Oil, Gas & Consumable
Fuels) 1,220 26,718Crown Castle International Corp. (Equity Real
Estate Investment Trusts) 357 65,156CSX Corp. (Road & Rail) 3,333 114,055Cummins, Inc. (Machinery) 214 47,268CVS Health Corp. (Health Care Providers &
Services) 1,990 211,955D.R. Horton, Inc. (Household Durables) 225 20,075Danaher Corp. (Health Care Equipment &
Supplies) 305 87,166Darden Restaurants, Inc. (Hotels,
Restaurants & Leisure) 190 26,575DaVita, Inc.* (Health Care Providers & Services) 103 11,162Deere & Co. (Machinery) 225 84,690Delta Air Lines, Inc.* (Airlines) 959 38,063DENTSPLY SIRONA, Inc. (Health Care
Equipment & Supplies) 332 17,735Digital Realty Trust, Inc. (Equity Real Estate
Investment Trusts) 427 63,721Discovery, Inc.*(a) (Media) 259 7,229Discovery, Inc.*(a)—Class C (Media) 468 12,800DISH Network Corp.*—Class A (Media) 372 11,681Dollar General Corp. (Multiline Retail) 351 73,177Dollar Tree, Inc.* (Multiline Retail) 343 45,008Dominion Energy, Inc. (Multi-Utilities) 1,226 98,889Domino’s Pizza, Inc. (Hotels, Restaurants &
Leisure) 16 7,274Dover Corp. (Machinery) 116 19,710Dow, Inc. (Chemicals) 1,119 66,838DTE Energy Co. (Multi-Utilities) 291 35,045Duke Energy Corp. (Electric Utilities) 1,150 120,819Duke Realty Corp. (Equity Real Estate
Investment Trusts) 206 11,903DuPont de Nemours, Inc. (Chemicals) 781 59,825DXC Technology Co.* (IT Services) 385 11,581Eastman Chemical Co. (Chemicals) 200 23,786Eaton Corp. PLC (Electrical Equipment) 597 94,583eBay, Inc. (Internet & Direct Marketing Retail) 215 12,915
January 31, 2022 (unaudited) :: Schedule of Portfolio Investments :: Large-Cap Value ProFund :: 75
See accompanying notes to the financial statements.
Toppan Merrill - ProFunds Public Semi-Annual Report [Funds] 01-31-2022 ED [AUX] | akiesli | 29-Mar-22 08:43 | 22-1296-2.de | Sequence: 8CHKSUM Content: 51650 Layout: 54287 Graphics: 0 CLEAN
JOB: 22-1296-2 CYCLE#;BL#: 8; 0 TRIM: 8.25" x 10.75" AS: New York: 212-620-5600COLORS: ~note-color 2, Black, ~note-color 3 GRAPHICS: none V1.5
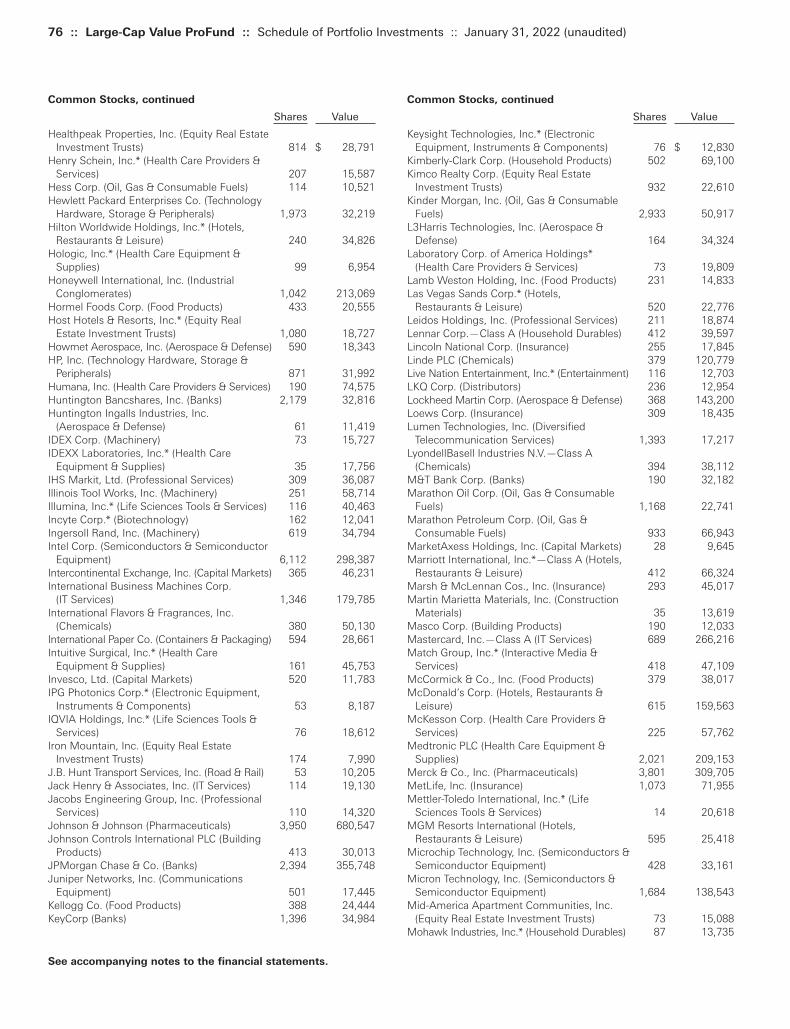
76 :: Large-Cap Value ProFund :: Schedule of Portfolio Investments :: January 31, 2022 (unaudited)
Common Stocks, continued
Shares Value
Keysight Technologies, Inc.* (Electronic Equipment, Instruments & Components) 76 $ 12,830
Kimberly-Clark Corp. (Household Products) 502 69,100Kimco Realty Corp. (Equity Real Estate
Investment Trusts) 932 22,610Kinder Morgan, Inc. (Oil, Gas & Consumable
Fuels) 2,933 50,917L3Harris Technologies, Inc. (Aerospace &
Defense) 164 34,324Laboratory Corp. of America Holdings*
(Health Care Providers & Services) 73 19,809Lamb Weston Holding, Inc. (Food Products) 231 14,833Las Vegas Sands Corp.* (Hotels,
Restaurants & Leisure) 520 22,776Leidos Holdings, Inc. (Professional Services) 211 18,874Lennar Corp.—Class A (Household Durables) 412 39,597Lincoln National Corp. (Insurance) 255 17,845Linde PLC (Chemicals) 379 120,779Live Nation Entertainment, Inc.* (Entertainment) 116 12,703LKQ Corp. (Distributors) 236 12,954Lockheed Martin Corp. (Aerospace & Defense) 368 143,200Loews Corp. (Insurance) 309 18,435Lumen Technologies, Inc. (Diversified
Telecommunication Services) 1,393 17,217LyondellBasell Industries N.V.—Class A
(Chemicals) 394 38,112M&T Bank Corp. (Banks) 190 32,182Marathon Oil Corp. (Oil, Gas & Consumable
Fuels) 1,168 22,741Marathon Petroleum Corp. (Oil, Gas &
Consumable Fuels) 933 66,943MarketAxess Holdings, Inc. (Capital Markets) 28 9,645Marriott International, Inc.*—Class A (Hotels,
Restaurants & Leisure) 412 66,324Marsh & McLennan Cos., Inc. (Insurance) 293 45,017Martin Marietta Materials, Inc. (Construction
Materials) 35 13,619Masco Corp. (Building Products) 190 12,033Mastercard, Inc.—Class A (IT Services) 689 266,216Match Group, Inc.* (Interactive Media &
Services) 418 47,109McCormick & Co., Inc. (Food Products) 379 38,017McDonald’s Corp. (Hotels, Restaurants &
Leisure) 615 159,563McKesson Corp. (Health Care Providers &
Services) 225 57,762Medtronic PLC (Health Care Equipment &
Supplies) 2,021 209,153Merck & Co., Inc. (Pharmaceuticals) 3,801 309,705MetLife, Inc. (Insurance) 1,073 71,955Mettler-Toledo International, Inc.* (Life
Sciences Tools & Services) 14 20,618MGM Resorts International (Hotels,
Restaurants & Leisure) 595 25,418Microchip Technology, Inc. (Semiconductors &
Semiconductor Equipment) 428 33,161Micron Technology, Inc. (Semiconductors &
Semiconductor Equipment) 1,684 138,543Mid-America Apartment Communities, Inc.
(Equity Real Estate Investment Trusts) 73 15,088Mohawk Industries, Inc.* (Household Durables) 87 13,735
Common Stocks, continued
Shares Value
Healthpeak Properties, Inc. (Equity Real Estate Investment Trusts) 814 $ 28,791
Henry Schein, Inc.* (Health Care Providers & Services) 207 15,587
Hess Corp. (Oil, Gas & Consumable Fuels) 114 10,521Hewlett Packard Enterprises Co. (Technology
Hardware, Storage & Peripherals) 1,973 32,219Hilton Worldwide Holdings, Inc.* (Hotels,
Restaurants & Leisure) 240 34,826Hologic, Inc.* (Health Care Equipment &
Supplies) 99 6,954Honeywell International, Inc. (Industrial
Conglomerates) 1,042 213,069Hormel Foods Corp. (Food Products) 433 20,555Host Hotels & Resorts, Inc.* (Equity Real
Estate Investment Trusts) 1,080 18,727Howmet Aerospace, Inc. (Aerospace & Defense) 590 18,343HP, Inc. (Technology Hardware, Storage &
Peripherals) 871 31,992Humana, Inc. (Health Care Providers & Services) 190 74,575Huntington Bancshares, Inc. (Banks) 2,179 32,816Huntington Ingalls Industries, Inc.
(Aerospace & Defense) 61 11,419IDEX Corp. (Machinery) 73 15,727IDEXX Laboratories, Inc.* (Health Care
Equipment & Supplies) 35 17,756IHS Markit, Ltd. (Professional Services) 309 36,087Illinois Tool Works, Inc. (Machinery) 251 58,714Illumina, Inc.* (Life Sciences Tools & Services) 116 40,463Incyte Corp.* (Biotechnology) 162 12,041Ingersoll Rand, Inc. (Machinery) 619 34,794Intel Corp. (Semiconductors & Semiconductor
Equipment) 6,112 298,387Intercontinental Exchange, Inc. (Capital Markets) 365 46,231International Business Machines Corp.
(IT Services) 1,346 179,785International Flavors & Fragrances, Inc.
(Chemicals) 380 50,130International Paper Co. (Containers & Packaging) 594 28,661Intuitive Surgical, Inc.* (Health Care
Equipment & Supplies) 161 45,753Invesco, Ltd. (Capital Markets) 520 11,783IPG Photonics Corp.* (Electronic Equipment,
Instruments & Components) 53 8,187IQVIA Holdings, Inc.* (Life Sciences Tools &
Services) 76 18,612Iron Mountain, Inc. (Equity Real Estate
Investment Trusts) 174 7,990J.B. Hunt Transport Services, Inc. (Road & Rail) 53 10,205Jack Henry & Associates, Inc. (IT Services) 114 19,130Jacobs Engineering Group, Inc. (Professional
Services) 110 14,320Johnson & Johnson (Pharmaceuticals) 3,950 680,547Johnson Controls International PLC (Building
Products) 413 30,013JPMorgan Chase & Co. (Banks) 2,394 355,748Juniper Networks, Inc. (Communications
Equipment) 501 17,445Kellogg Co. (Food Products) 388 24,444KeyCorp (Banks) 1,396 34,984
See accompanying notes to the financial statements.
Toppan Merrill - ProFunds Public Semi-Annual Report [Funds] 01-31-2022 ED [AUX] | akiesli | 29-Mar-22 08:43 | 22-1296-2.de | Sequence: 9CHKSUM Content: 47994 Layout: 44922 Graphics: 0 CLEAN
JOB: 22-1296-2 CYCLE#;BL#: 8; 0 TRIM: 8.25" x 10.75" AS: New York: 212-620-5600COLORS: ~note-color 2, Black, ~note-color 3 GRAPHICS: none V1.5
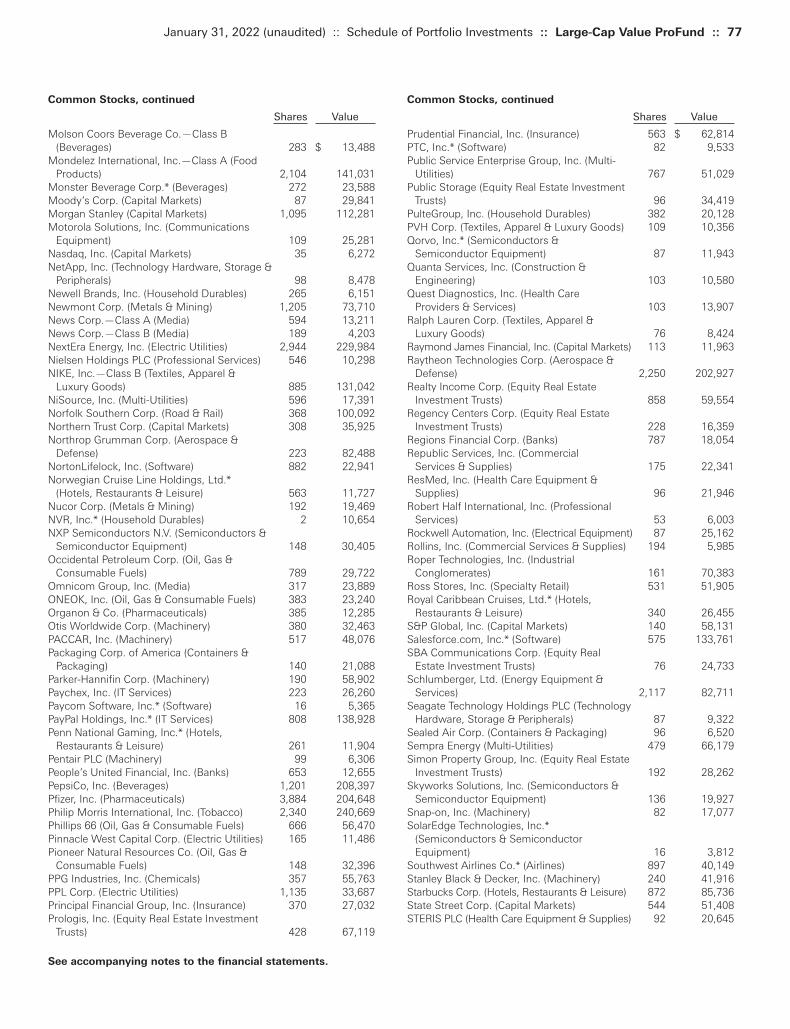
Common Stocks, continued
Shares Value
Prudential Financial, Inc. (Insurance) 563 $ 62,814PTC, Inc.* (Software) 82 9,533Public Service Enterprise Group, Inc. (Multi-
Utilities) 767 51,029Public Storage (Equity Real Estate Investment
Trusts) 96 34,419PulteGroup, Inc. (Household Durables) 382 20,128PVH Corp. (Textiles, Apparel & Luxury Goods) 109 10,356Qorvo, Inc.* (Semiconductors &
Semiconductor Equipment) 87 11,943Quanta Services, Inc. (Construction &
Engineering) 103 10,580Quest Diagnostics, Inc. (Health Care
Providers & Services) 103 13,907Ralph Lauren Corp. (Textiles, Apparel &
Luxury Goods) 76 8,424Raymond James Financial, Inc. (Capital Markets) 113 11,963Raytheon Technologies Corp. (Aerospace &
Defense) 2,250 202,927Realty Income Corp. (Equity Real Estate
Investment Trusts) 858 59,554Regency Centers Corp. (Equity Real Estate
Investment Trusts) 228 16,359Regions Financial Corp. (Banks) 787 18,054Republic Services, Inc. (Commercial
Services & Supplies) 175 22,341ResMed, Inc. (Health Care Equipment &
Supplies) 96 21,946Robert Half International, Inc. (Professional
Services) 53 6,003Rockwell Automation, Inc. (Electrical Equipment) 87 25,162Rollins, Inc. (Commercial Services & Supplies) 194 5,985Roper Technologies, Inc. (Industrial
Conglomerates) 161 70,383Ross Stores, Inc. (Specialty Retail) 531 51,905Royal Caribbean Cruises, Ltd.* (Hotels,
Restaurants & Leisure) 340 26,455S&P Global, Inc. (Capital Markets) 140 58,131Salesforce.com, Inc.* (Software) 575 133,761SBA Communications Corp. (Equity Real
Estate Investment Trusts) 76 24,733Schlumberger, Ltd. (Energy Equipment &
Services) 2,117 82,711Seagate Technology Holdings PLC (Technology
Hardware, Storage & Peripherals) 87 9,322Sealed Air Corp. (Containers & Packaging) 96 6,520Sempra Energy (Multi-Utilities) 479 66,179Simon Property Group, Inc. (Equity Real Estate
Investment Trusts) 192 28,262Skyworks Solutions, Inc. (Semiconductors &
Semiconductor Equipment) 136 19,927Snap-on, Inc. (Machinery) 82 17,077SolarEdge Technologies, Inc.*
(Semiconductors & Semiconductor Equipment) 16 3,812
Southwest Airlines Co.* (Airlines) 897 40,149Stanley Black & Decker, Inc. (Machinery) 240 41,916Starbucks Corp. (Hotels, Restaurants & Leisure) 872 85,736State Street Corp. (Capital Markets) 544 51,408STERIS PLC (Health Care Equipment & Supplies) 92 20,645
Common Stocks, continued
Shares Value
Molson Coors Beverage Co.—Class B (Beverages) 283 $ 13,488
Mondelez International, Inc.—Class A (Food Products) 2,104 141,031
Monster Beverage Corp.* (Beverages) 272 23,588Moody’s Corp. (Capital Markets) 87 29,841Morgan Stanley (Capital Markets) 1,095 112,281Motorola Solutions, Inc. (Communications
Equipment) 109 25,281Nasdaq, Inc. (Capital Markets) 35 6,272NetApp, Inc. (Technology Hardware, Storage &
Peripherals) 98 8,478Newell Brands, Inc. (Household Durables) 265 6,151Newmont Corp. (Metals & Mining) 1,205 73,710News Corp.—Class A (Media) 594 13,211News Corp.—Class B (Media) 189 4,203NextEra Energy, Inc. (Electric Utilities) 2,944 229,984Nielsen Holdings PLC (Professional Services) 546 10,298NIKE, Inc.—Class B (Textiles, Apparel &
Luxury Goods) 885 131,042NiSource, Inc. (Multi-Utilities) 596 17,391Norfolk Southern Corp. (Road & Rail) 368 100,092Northern Trust Corp. (Capital Markets) 308 35,925Northrop Grumman Corp. (Aerospace &
Defense) 223 82,488NortonLifelock, Inc. (Software) 882 22,941Norwegian Cruise Line Holdings, Ltd.*
(Hotels, Restaurants & Leisure) 563 11,727Nucor Corp. (Metals & Mining) 192 19,469NVR, Inc.* (Household Durables) 2 10,654NXP Semiconductors N.V. (Semiconductors &
Semiconductor Equipment) 148 30,405Occidental Petroleum Corp. (Oil, Gas &
Consumable Fuels) 789 29,722Omnicom Group, Inc. (Media) 317 23,889ONEOK, Inc. (Oil, Gas & Consumable Fuels) 383 23,240Organon & Co. (Pharmaceuticals) 385 12,285Otis Worldwide Corp. (Machinery) 380 32,463PACCAR, Inc. (Machinery) 517 48,076Packaging Corp. of America (Containers &
Packaging) 140 21,088Parker-Hannifin Corp. (Machinery) 190 58,902Paychex, Inc. (IT Services) 223 26,260Paycom Software, Inc.* (Software) 16 5,365PayPal Holdings, Inc.* (IT Services) 808 138,928Penn National Gaming, Inc.* (Hotels,
Restaurants & Leisure) 261 11,904Pentair PLC (Machinery) 99 6,306People’s United Financial, Inc. (Banks) 653 12,655PepsiCo, Inc. (Beverages) 1,201 208,397Pfizer, Inc. (Pharmaceuticals) 3,884 204,648Philip Morris International, Inc. (Tobacco) 2,340 240,669Phillips 66 (Oil, Gas & Consumable Fuels) 666 56,470Pinnacle West Capital Corp. (Electric Utilities) 165 11,486Pioneer Natural Resources Co. (Oil, Gas &
Consumable Fuels) 148 32,396PPG Industries, Inc. (Chemicals) 357 55,763PPL Corp. (Electric Utilities) 1,135 33,687Principal Financial Group, Inc. (Insurance) 370 27,032Prologis, Inc. (Equity Real Estate Investment
Trusts) 428 67,119
January 31, 2022 (unaudited) :: Schedule of Portfolio Investments :: Large-Cap Value ProFund :: 77
See accompanying notes to the financial statements.
Toppan Merrill - ProFunds Public Semi-Annual Report [Funds] 01-31-2022 ED [AUX] | akiesli | 29-Mar-22 08:43 | 22-1296-2.de | Sequence: 10CHKSUM Content: 44333 Layout: 54287 Graphics: 0 CLEAN
JOB: 22-1296-2 CYCLE#;BL#: 8; 0 TRIM: 8.25" x 10.75" AS: New York: 212-620-5600COLORS: ~note-color 2, Black, ~note-color 3 GRAPHICS: none V1.5

78 :: Large-Cap Value ProFund :: Schedule of Portfolio Investments :: January 31, 2022 (unaudited)
Common Stocks, continued
Shares Value
Ulta Beauty, Inc.* (Specialty Retail) 35 $ 12,731Under Armour, Inc.*—Class A (Textiles,
Apparel & Luxury Goods) 165 3,107Under Armour, Inc.*—Class C (Textiles,
Apparel & Luxury Goods) 187 2,990Union Pacific Corp. (Road & Rail) 563 137,682United Airlines Holdings , Inc.* (Airlines) 492 21,097United Parcel Service, Inc.—Class B (Air
Freight & Logistics) 627 126,786United Rentals, Inc.* (Trading Companies &
Distributors) 46 14,726UnitedHealth Group, Inc. (Health Care
Providers & Services) 817 386,091Universal Health Services, Inc.—Class B
(Health Care Providers & Services) 110 14,307Valero Energy Corp. (Oil, Gas & Consumable
Fuels) 619 51,358Ventas, Inc. (Equity Real Estate Investment
Trusts) 607 32,183VeriSign, Inc.* (IT Services) 76 16,506Verisk Analytics, Inc. (Professional Services) 116 22,751Verizon Communications, Inc. (Diversified
Telecommunication Services) 6,224 331,303Vertex Pharmaceuticals, Inc.* (Biotechnology) 148 35,971VF Corp. (Textiles, Apparel & Luxury Goods) 492 32,083ViacomCBS, Inc.—Class B (Media) 917 30,674Viatris, Inc. (Pharmaceuticals) 1,829 27,380Visa, Inc.—Class A (IT Services) 1,435 324,554Vornado Realty Trust (Equity Real Estate
Investment Trusts) 253 10,376Vulcan Materials Co. (Construction Materials) 109 20,744W.R. Berkley Corp. (Insurance) 211 17,830W.W. Grainger, Inc. (Trading Companies &
Distributors) 73 36,143Walgreens Boots Alliance, Inc. (Food &
Staples Retailing) 1,085 53,990Walmart, Inc. (Food & Staples Retailing) 2,134 298,355Waste Management, Inc. (Commercial
Services & Supplies) 283 42,574Waters Corp.* (Life Sciences Tools & Services) 21 6,723WEC Energy Group, Inc. (Multi-Utilities) 471 45,706Wells Fargo & Co. (Banks) 6,000 322,800Welltower, Inc. (Equity Real Estate Investment
Trusts) 653 56,569Western Digital Corp.* (Technology Hardware,
Storage & Peripherals) 477 24,680Westinghouse Air Brake Technologies Corp.
(Machinery) 283 25,159WestRock Co. (Containers & Packaging) 406 18,741Weyerhaeuser Co. (Equity Real Estate
Investment Trusts) 654 26,441Whirlpool Corp. (Household Durables) 92 19,337Willis Towers Watson PLC (Insurance) 187 43,751Wynn Resorts, Ltd.* (Hotels, Restaurants &
Leisure) 161 13,757Xcel Energy, Inc. (Electric Utilities) 810 56,425Xilinx, Inc. (Semiconductors & Semiconductor
Equipment) 103 19,936Xylem, Inc. (Machinery) 161 16,908Yum! Brands, Inc. (Hotels, Restaurants & Leisure) 237 29,665
Common Stocks, continued
Shares Value
Stryker Corp. (Health Care Equipment & Supplies) 293 $ 72,679
Synchrony Financial (Consumer Finance) 365 15,545Synopsys, Inc.* (Software) 76 23,598Sysco Corp. (Food & Staples Retailing) 774 60,488T. Rowe Price Group, Inc. (Capital Markets) 109 16,833Take-Two Interactive Software, Inc.*
(Entertainment) 73 11,924Tapestry, Inc. (Textiles, Apparel & Luxury Goods) 421 15,977Target Corp. (Multiline Retail) 326 71,860TE Connectivity, Ltd. (Electronic Equipment,
Instruments & Components) 488 69,789Teledyne Technologies, Inc.* (Electronic
Equipment, Instruments & Components) 76 32,029Teleflex, Inc. (Health Care Equipment & Supplies) 76 23,574Texas Instruments, Inc. (Semiconductors &
Semiconductor Equipment) 702 126,002Textron, Inc. (Aerospace & Defense) 324 22,051The AES Corp. (Independent Power and
Renewable Electricity Producers) 1,010 22,402The Allstate Corp. (Insurance) 428 51,647The Bank of New York Mellon Corp. (Capital
Markets) 1,149 68,090The Boeing Co.* (Aerospace & Defense) 819 163,996The Charles Schwab Corp. (Capital Markets) 727 63,758The Clorox Co. (Household Products) 179 30,047The Coca-Cola Co. (Beverages) 5,851 356,969The Cooper Cos., Inc. (Health Care
Equipment & Supplies) 76 30,271The Estee Lauder Co., Inc. (Personal Products) 140 43,651The Gap, Inc. (Specialty Retail) 325 5,873The Hershey Co. (Food Products) 124 24,437The Home Depot, Inc. (Specialty Retail) 380 139,452The Interpublic Group of Cos., Inc. (Media) 601 21,360The JM Smucker Co.—Class A (Food Products) 161 22,633The Kraft Heinz Co. (Food Products) 1,078 38,592The Kroger Co. (Food & Staples Retailing) 1,019 44,418The Mosaic Co. (Chemicals) 560 22,372The PNC Financial Services Group, Inc. (Banks) 634 130,598The Procter & Gamble Co. (Household
Products) 3,633 582,916The Progressive Corp. (Insurance) 877 95,294The Sherwin-Williams Co. (Chemicals) 164 46,988The Southern Co. (Electric Utilities) 1,597 110,976The TJX Cos., Inc. (Specialty Retail) 1,804 129,834The Travelers Cos., Inc. (Insurance) 373 61,985The Walt Disney Co.* (Entertainment) 2,734 390,880The Williams Cos., Inc. (Oil, Gas &
Consumable Fuels) 1,838 55,030T-Mobile U.S., Inc.* (Wireless
Telecommunication Services) 877 94,865Trane Technologies PLC (Building Products) 357 61,797TransDigm Group, Inc.* (Aerospace & Defense) 46 28,345Trimble, Inc.* (Electronic Equipment,
Instruments & Components) 162 11,690Truist Financial Corp. (Banks) 2,004 125,891Twitter, Inc.* (Interactive Media & Services) 630 23,631Tyler Technologies, Inc.* (Software) 21 9,950Tyson Foods, Inc.—Class A (Food Products) 439 39,901U.S. Bancorp (Banks) 2,032 118,242UDR, Inc. (Equity Real Estate Investment Trusts) 206 11,709
See accompanying notes to the financial statements.
Toppan Merrill - ProFunds Public Semi-Annual Report [Funds] 01-31-2022 ED [AUX] | akiesli | 29-Mar-22 08:43 | 22-1296-2.de | Sequence: 11CHKSUM Content: 37590 Layout: 39869 Graphics: 0 CLEAN
JOB: 22-1296-2 CYCLE#;BL#: 8; 0 TRIM: 8.25" x 10.75" AS: New York: 212-620-5600COLORS: ~note-color 2, Black, ~note-color 3 GRAPHICS: none V1.5
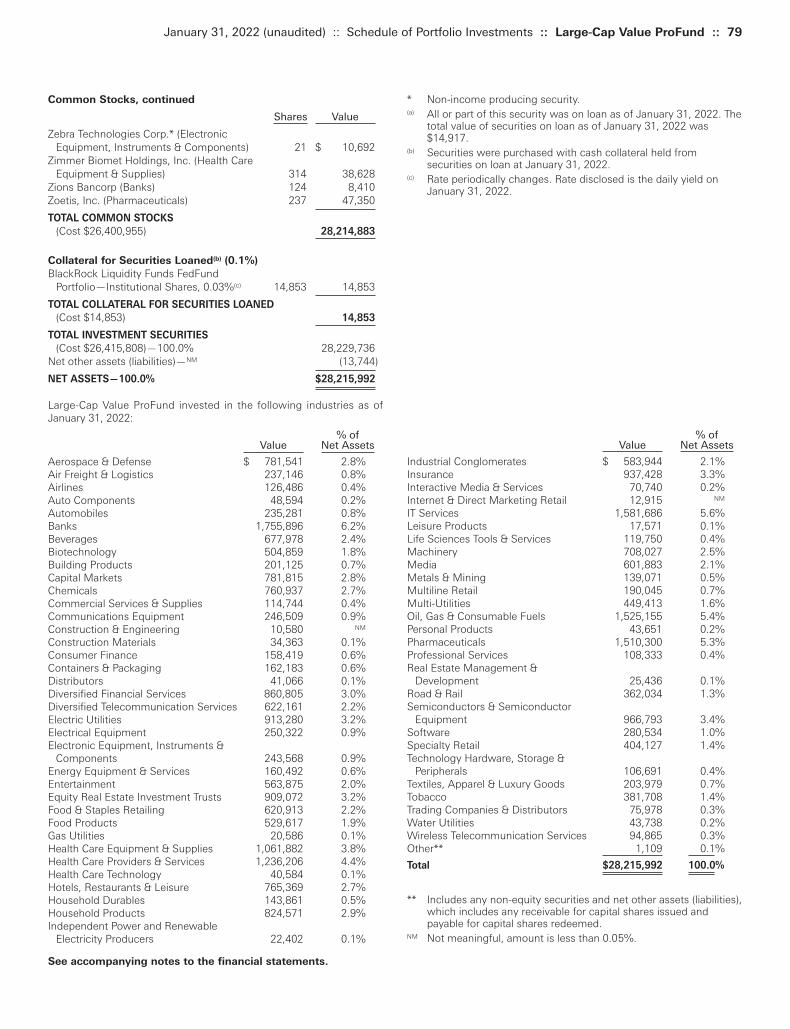
* Non-income producing security.(a) All or part of this security was on loan as of January 31, 2022. The
total value of securities on loan as of January 31, 2022 was$14,917.
(b) Securities were purchased with cash collateral held fromsecurities on loan at January 31, 2022.
(c) Rate periodically changes. Rate disclosed is the daily yield onJanuary 31, 2022.
Common Stocks, continued
Shares Value
Zebra Technologies Corp.* (Electronic Equipment, Instruments & Components) 21 $ 10,692
Zimmer Biomet Holdings, Inc. (Health Care Equipment & Supplies) 314 38,628
Zions Bancorp (Banks) 124 8,410Zoetis, Inc. (Pharmaceuticals) 237 47,350
TOTAL COMMON STOCKS
(Cost $26,400,955) 28,214,883
Collateral for Securities Loaned(b) (0.1%)
BlackRock Liquidity Funds FedFund Portfolio—Institutional Shares, 0.03%(c) 14,853 14,853
TOTAL COLLATERAL FOR SECURITIES LOANED
(Cost $14,853) 14,853
TOTAL INVESTMENT SECURITIES
(Cost $26,415,808)—100.0% 28,229,736Net other assets (liabilities)—NM (13,744)
NET ASSETS—100.0% $28,215,992
% ofValue Net Assets
Industrial Conglomerates $ 583,944 2.1%Insurance 937,428 3.3%Interactive Media & Services 70,740 0.2%Internet & Direct Marketing Retail 12,915 NM
IT Services 1,581,686 5.6%Leisure Products 17,571 0.1%Life Sciences Tools & Services 119,750 0.4%Machinery 708,027 2.5%Media 601,883 2.1%Metals & Mining 139,071 0.5%Multiline Retail 190,045 0.7%Multi-Utilities 449,413 1.6%Oil, Gas & Consumable Fuels 1,525,155 5.4%Personal Products 43,651 0.2%Pharmaceuticals 1,510,300 5.3%Professional Services 108,333 0.4%Real Estate Management &
Development 25,436 0.1%Road & Rail 362,034 1.3%Semiconductors & Semiconductor
Equipment 966,793 3.4%Software 280,534 1.0%Specialty Retail 404,127 1.4%Technology Hardware, Storage &
Peripherals 106,691 0.4%Textiles, Apparel & Luxury Goods 203,979 0.7%Tobacco 381,708 1.4%Trading Companies & Distributors 75,978 0.3%Water Utilities 43,738 0.2%Wireless Telecommunication Services 94,865 0.3%Other** 1,109 0.1%
Total $28,215,992 100.0%
** Includes any non-equity securities and net other assets (liabilities),which includes any receivable for capital shares issued andpayable for capital shares redeemed.
NM Not meaningful, amount is less than 0.05%.
Large-Cap Value ProFund invested in the following industries as ofJanuary 31, 2022:
% ofValue Net Assets
Aerospace & Defense $ 781,541 2.8%Air Freight & Logistics 237,146 0.8%Airlines 126,486 0.4%Auto Components 48,594 0.2%Automobiles 235,281 0.8%Banks 1,755,896 6.2%Beverages 677,978 2.4%Biotechnology 504,859 1.8%Building Products 201,125 0.7%Capital Markets 781,815 2.8%Chemicals 760,937 2.7%Commercial Services & Supplies 114,744 0.4%Communications Equipment 246,509 0.9%Construction & Engineering 10,580 NM
Construction Materials 34,363 0.1%Consumer Finance 158,419 0.6%Containers & Packaging 162,183 0.6%Distributors 41,066 0.1%Diversified Financial Services 860,805 3.0%Diversified Telecommunication Services 622,161 2.2%Electric Utilities 913,280 3.2%Electrical Equipment 250,322 0.9%Electronic Equipment, Instruments &
Components 243,568 0.9%Energy Equipment & Services 160,492 0.6%Entertainment 563,875 2.0%Equity Real Estate Investment Trusts 909,072 3.2%Food & Staples Retailing 620,913 2.2%Food Products 529,617 1.9%Gas Utilities 20,586 0.1%Health Care Equipment & Supplies 1,061,882 3.8%Health Care Providers & Services 1,236,206 4.4%Health Care Technology 40,584 0.1%Hotels, Restaurants & Leisure 765,369 2.7%Household Durables 143,861 0.5%Household Products 824,571 2.9%Independent Power and Renewable
Electricity Producers 22,402 0.1%
January 31, 2022 (unaudited) :: Schedule of Portfolio Investments :: Large-Cap Value ProFund :: 79
See accompanying notes to the financial statements.
Toppan Merrill - ProFunds Public Semi-Annual Report [Funds] 01-31-2022 ED [AUX] | akiesli | 29-Mar-22 08:43 | 22-1296-2.de | Sequence: 12CHKSUM Content: 29712 Layout: 25860 Graphics: 0 CLEAN
JOB: 22-1296-2 CYCLE#;BL#: 8; 0 TRIM: 8.25" x 10.75" AS: New York: 212-620-5600COLORS: ~note-color 2, Black, ~note-color 3 GRAPHICS: none V1.5
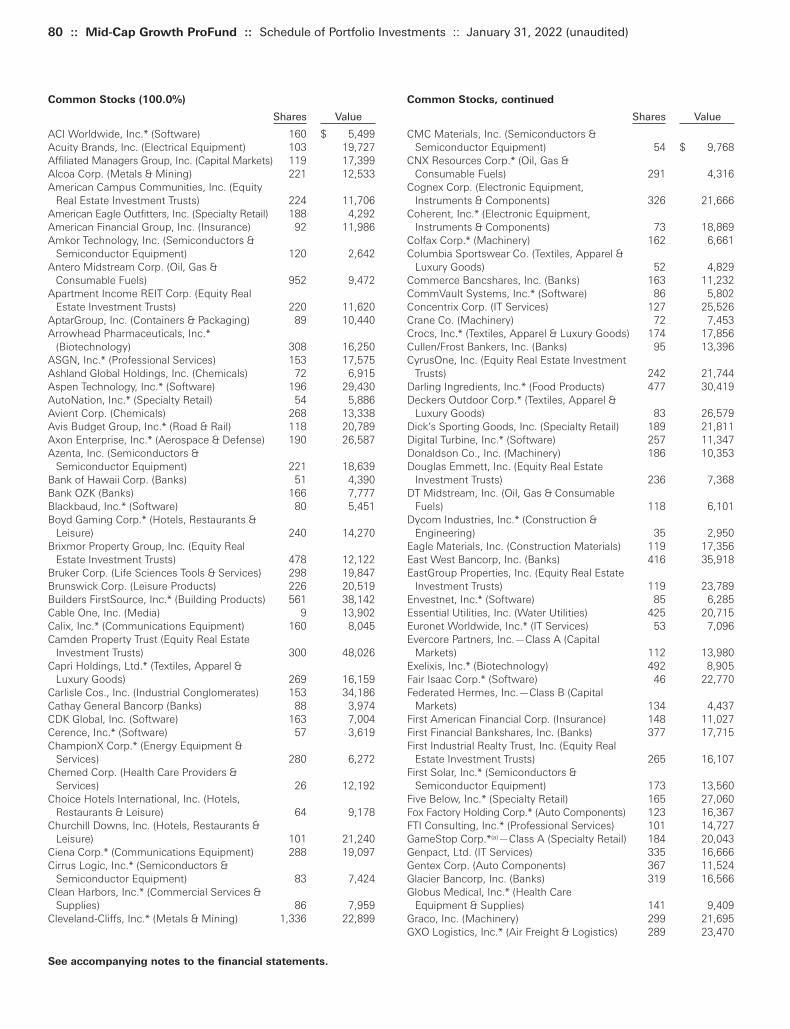
80 :: Mid-Cap Growth ProFund :: Schedule of Portfolio Investments :: January 31, 2022 (unaudited)
Common Stocks, continued
Shares Value
CMC Materials, Inc. (Semiconductors & Semiconductor Equipment) 54 $ 9,768
CNX Resources Corp.* (Oil, Gas & Consumable Fuels) 291 4,316
Cognex Corp. (Electronic Equipment, Instruments & Components) 326 21,666
Coherent, Inc.* (Electronic Equipment, Instruments & Components) 73 18,869
Colfax Corp.* (Machinery) 162 6,661Columbia Sportswear Co. (Textiles, Apparel &
Luxury Goods) 52 4,829Commerce Bancshares, Inc. (Banks) 163 11,232CommVault Systems, Inc.* (Software) 86 5,802Concentrix Corp. (IT Services) 127 25,526Crane Co. (Machinery) 72 7,453Crocs, Inc.* (Textiles, Apparel & Luxury Goods) 174 17,856Cullen/Frost Bankers, Inc. (Banks) 95 13,396CyrusOne, Inc. (Equity Real Estate Investment
Trusts) 242 21,744Darling Ingredients, Inc.* (Food Products) 477 30,419Deckers Outdoor Corp.* (Textiles, Apparel &
Luxury Goods) 83 26,579Dick’s Sporting Goods, Inc. (Specialty Retail) 189 21,811Digital Turbine, Inc.* (Software) 257 11,347Donaldson Co., Inc. (Machinery) 186 10,353Douglas Emmett, Inc. (Equity Real Estate
Investment Trusts) 236 7,368DT Midstream, Inc. (Oil, Gas & Consumable
Fuels) 118 6,101Dycom Industries, Inc.* (Construction &
Engineering) 35 2,950Eagle Materials, Inc. (Construction Materials) 119 17,356East West Bancorp, Inc. (Banks) 416 35,918EastGroup Properties, Inc. (Equity Real Estate
Investment Trusts) 119 23,789Envestnet, Inc.* (Software) 85 6,285Essential Utilities, Inc. (Water Utilities) 425 20,715Euronet Worldwide, Inc.* (IT Services) 53 7,096Evercore Partners, Inc.—Class A (Capital
Markets) 112 13,980Exelixis, Inc.* (Biotechnology) 492 8,905Fair Isaac Corp.* (Software) 46 22,770Federated Hermes, Inc.—Class B (Capital
Markets) 134 4,437First American Financial Corp. (Insurance) 148 11,027First Financial Bankshares, Inc. (Banks) 377 17,715First Industrial Realty Trust, Inc. (Equity Real
Estate Investment Trusts) 265 16,107First Solar, Inc.* (Semiconductors &
Semiconductor Equipment) 173 13,560Five Below, Inc.* (Specialty Retail) 165 27,060Fox Factory Holding Corp.* (Auto Components) 123 16,367FTI Consulting, Inc.* (Professional Services) 101 14,727GameStop Corp.*(a)—Class A (Specialty Retail) 184 20,043Genpact, Ltd. (IT Services) 335 16,666Gentex Corp. (Auto Components) 367 11,524Glacier Bancorp, Inc. (Banks) 319 16,566Globus Medical, Inc.* (Health Care
Equipment & Supplies) 141 9,409Graco, Inc. (Machinery) 299 21,695GXO Logistics, Inc.* (Air Freight & Logistics) 289 23,470
Common Stocks (100.0%)
Shares Value
ACI Worldwide, Inc.* (Software) 160 $ 5,499Acuity Brands, Inc. (Electrical Equipment) 103 19,727Affiliated Managers Group, Inc. (Capital Markets) 119 17,399Alcoa Corp. (Metals & Mining) 221 12,533American Campus Communities, Inc. (Equity
Real Estate Investment Trusts) 224 11,706American Eagle Outfitters, Inc. (Specialty Retail) 188 4,292American Financial Group, Inc. (Insurance) 92 11,986Amkor Technology, Inc. (Semiconductors &
Semiconductor Equipment) 120 2,642Antero Midstream Corp. (Oil, Gas &
Consumable Fuels) 952 9,472Apartment Income REIT Corp. (Equity Real
Estate Investment Trusts) 220 11,620AptarGroup, Inc. (Containers & Packaging) 89 10,440Arrowhead Pharmaceuticals, Inc.*
(Biotechnology) 308 16,250ASGN, Inc.* (Professional Services) 153 17,575Ashland Global Holdings, Inc. (Chemicals) 72 6,915Aspen Technology, Inc.* (Software) 196 29,430AutoNation, Inc.* (Specialty Retail) 54 5,886Avient Corp. (Chemicals) 268 13,338Avis Budget Group, Inc.* (Road & Rail) 118 20,789Axon Enterprise, Inc.* (Aerospace & Defense) 190 26,587Azenta, Inc. (Semiconductors &
Semiconductor Equipment) 221 18,639Bank of Hawaii Corp. (Banks) 51 4,390Bank OZK (Banks) 166 7,777Blackbaud, Inc.* (Software) 80 5,451Boyd Gaming Corp.* (Hotels, Restaurants &
Leisure) 240 14,270Brixmor Property Group, Inc. (Equity Real
Estate Investment Trusts) 478 12,122Bruker Corp. (Life Sciences Tools & Services) 298 19,847Brunswick Corp. (Leisure Products) 226 20,519Builders FirstSource, Inc.* (Building Products) 561 38,142Cable One, Inc. (Media) 9 13,902Calix, Inc.* (Communications Equipment) 160 8,045Camden Property Trust (Equity Real Estate
Investment Trusts) 300 48,026Capri Holdings, Ltd.* (Textiles, Apparel &
Luxury Goods) 269 16,159Carlisle Cos., Inc. (Industrial Conglomerates) 153 34,186Cathay General Bancorp (Banks) 88 3,974CDK Global, Inc. (Software) 163 7,004Cerence, Inc.* (Software) 57 3,619ChampionX Corp.* (Energy Equipment &
Services) 280 6,272Chemed Corp. (Health Care Providers &
Services) 26 12,192Choice Hotels International, Inc. (Hotels,
Restaurants & Leisure) 64 9,178Churchill Downs, Inc. (Hotels, Restaurants &
Leisure) 101 21,240Ciena Corp.* (Communications Equipment) 288 19,097Cirrus Logic, Inc.* (Semiconductors &
Semiconductor Equipment) 83 7,424Clean Harbors, Inc.* (Commercial Services &
Supplies) 86 7,959Cleveland-Cliffs, Inc.* (Metals & Mining) 1,336 22,899
See accompanying notes to the financial statements.
Toppan Merrill - ProFunds Public Semi-Annual Report [Funds] 01-31-2022 ED [AUX] | akiesli | 29-Mar-22 08:43 | 22-1296-2.de | Sequence: 13CHKSUM Content: 61493 Layout: 26139 Graphics: 0 CLEAN
JOB: 22-1296-2 CYCLE#;BL#: 8; 0 TRIM: 8.25" x 10.75" AS: New York: 212-620-5600COLORS: ~note-color 2, Black, ~note-color 3 GRAPHICS: none V1.5
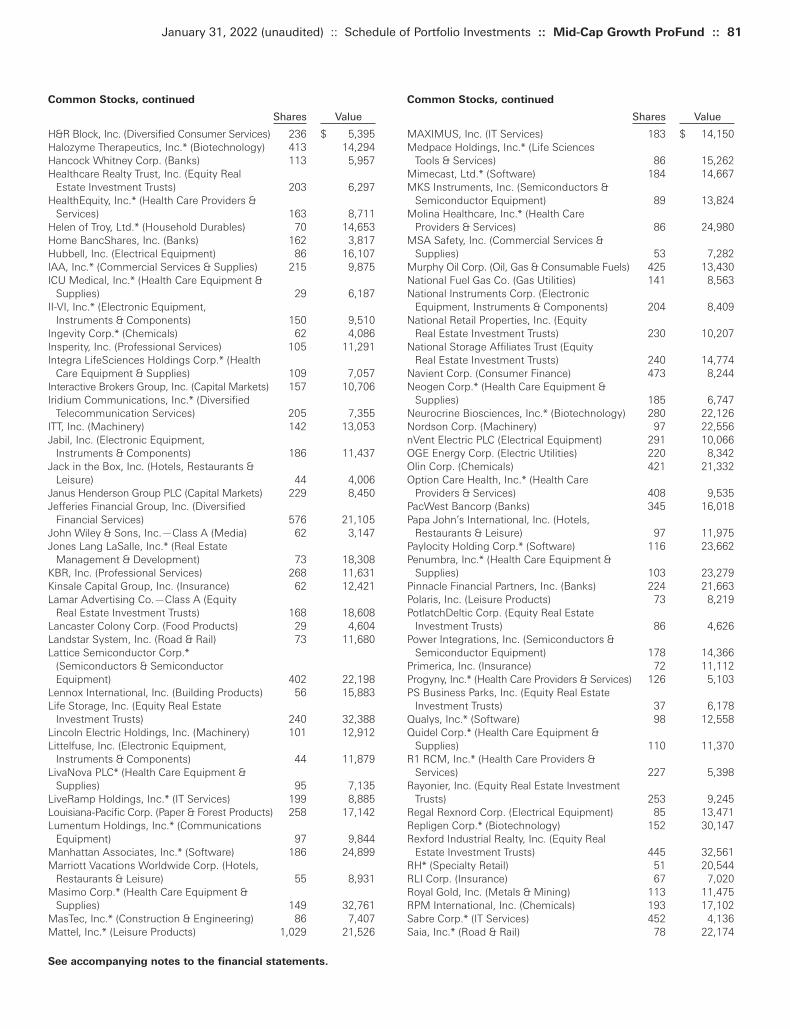
Common Stocks, continued
Shares Value
MAXIMUS, Inc. (IT Services) 183 $ 14,150Medpace Holdings, Inc.* (Life Sciences
Tools & Services) 86 15,262Mimecast, Ltd.* (Software) 184 14,667MKS Instruments, Inc. (Semiconductors &
Semiconductor Equipment) 89 13,824Molina Healthcare, Inc.* (Health Care
Providers & Services) 86 24,980MSA Safety, Inc. (Commercial Services &
Supplies) 53 7,282Murphy Oil Corp. (Oil, Gas & Consumable Fuels) 425 13,430National Fuel Gas Co. (Gas Utilities) 141 8,563National Instruments Corp. (Electronic
Equipment, Instruments & Components) 204 8,409National Retail Properties, Inc. (Equity
Real Estate Investment Trusts) 230 10,207National Storage Affiliates Trust (Equity
Real Estate Investment Trusts) 240 14,774Navient Corp. (Consumer Finance) 473 8,244Neogen Corp.* (Health Care Equipment &
Supplies) 185 6,747Neurocrine Biosciences, Inc.* (Biotechnology) 280 22,126Nordson Corp. (Machinery) 97 22,556nVent Electric PLC (Electrical Equipment) 291 10,066OGE Energy Corp. (Electric Utilities) 220 8,342Olin Corp. (Chemicals) 421 21,332Option Care Health, Inc.* (Health Care
Providers & Services) 408 9,535PacWest Bancorp (Banks) 345 16,018Papa John’s International, Inc. (Hotels,
Restaurants & Leisure) 97 11,975Paylocity Holding Corp.* (Software) 116 23,662Penumbra, Inc.* (Health Care Equipment &
Supplies) 103 23,279Pinnacle Financial Partners, Inc. (Banks) 224 21,663Polaris, Inc. (Leisure Products) 73 8,219PotlatchDeltic Corp. (Equity Real Estate
Investment Trusts) 86 4,626Power Integrations, Inc. (Semiconductors &
Semiconductor Equipment) 178 14,366Primerica, Inc. (Insurance) 72 11,112Progyny, Inc.* (Health Care Providers & Services) 126 5,103PS Business Parks, Inc. (Equity Real Estate
Investment Trusts) 37 6,178Qualys, Inc.* (Software) 98 12,558Quidel Corp.* (Health Care Equipment &
Supplies) 110 11,370R1 RCM, Inc.* (Health Care Providers &
Services) 227 5,398Rayonier, Inc. (Equity Real Estate Investment
Trusts) 253 9,245Regal Rexnord Corp. (Electrical Equipment) 85 13,471Repligen Corp.* (Biotechnology) 152 30,147Rexford Industrial Realty, Inc. (Equity Real
Estate Investment Trusts) 445 32,561RH* (Specialty Retail) 51 20,544RLI Corp. (Insurance) 67 7,020Royal Gold, Inc. (Metals & Mining) 113 11,475RPM International, Inc. (Chemicals) 193 17,102Sabre Corp.* (IT Services) 452 4,136Saia, Inc.* (Road & Rail) 78 22,174
Common Stocks, continued
Shares Value
H&R Block, Inc. (Diversified Consumer Services) 236 $ 5,395Halozyme Therapeutics, Inc.* (Biotechnology) 413 14,294Hancock Whitney Corp. (Banks) 113 5,957Healthcare Realty Trust, Inc. (Equity Real
Estate Investment Trusts) 203 6,297HealthEquity, Inc.* (Health Care Providers &
Services) 163 8,711Helen of Troy, Ltd.* (Household Durables) 70 14,653Home BancShares, Inc. (Banks) 162 3,817Hubbell, Inc. (Electrical Equipment) 86 16,107IAA, Inc.* (Commercial Services & Supplies) 215 9,875ICU Medical, Inc.* (Health Care Equipment &
Supplies) 29 6,187II-VI, Inc.* (Electronic Equipment,
Instruments & Components) 150 9,510Ingevity Corp.* (Chemicals) 62 4,086Insperity, Inc. (Professional Services) 105 11,291Integra LifeSciences Holdings Corp.* (Health
Care Equipment & Supplies) 109 7,057Interactive Brokers Group, Inc. (Capital Markets) 157 10,706Iridium Communications, Inc.* (Diversified
Telecommunication Services) 205 7,355ITT, Inc. (Machinery) 142 13,053Jabil, Inc. (Electronic Equipment,
Instruments & Components) 186 11,437Jack in the Box, Inc. (Hotels, Restaurants &
Leisure) 44 4,006Janus Henderson Group PLC (Capital Markets) 229 8,450Jefferies Financial Group, Inc. (Diversified
Financial Services) 576 21,105John Wiley & Sons, Inc.—Class A (Media) 62 3,147Jones Lang LaSalle, Inc.* (Real Estate
Management & Development) 73 18,308KBR, Inc. (Professional Services) 268 11,631Kinsale Capital Group, Inc. (Insurance) 62 12,421Lamar Advertising Co.—Class A (Equity
Real Estate Investment Trusts) 168 18,608Lancaster Colony Corp. (Food Products) 29 4,604Landstar System, Inc. (Road & Rail) 73 11,680Lattice Semiconductor Corp.*
(Semiconductors & Semiconductor Equipment) 402 22,198
Lennox International, Inc. (Building Products) 56 15,883Life Storage, Inc. (Equity Real Estate
Investment Trusts) 240 32,388Lincoln Electric Holdings, Inc. (Machinery) 101 12,912Littelfuse, Inc. (Electronic Equipment,
Instruments & Components) 44 11,879LivaNova PLC* (Health Care Equipment &
Supplies) 95 7,135LiveRamp Holdings, Inc.* (IT Services) 199 8,885Louisiana-Pacific Corp. (Paper & Forest Products) 258 17,142Lumentum Holdings, Inc.* (Communications
Equipment) 97 9,844Manhattan Associates, Inc.* (Software) 186 24,899Marriott Vacations Worldwide Corp. (Hotels,
Restaurants & Leisure) 55 8,931Masimo Corp.* (Health Care Equipment &
Supplies) 149 32,761MasTec, Inc.* (Construction & Engineering) 86 7,407Mattel, Inc.* (Leisure Products) 1,029 21,526
January 31, 2022 (unaudited) :: Schedule of Portfolio Investments :: Mid-Cap Growth ProFund :: 81
See accompanying notes to the financial statements.
Toppan Merrill - ProFunds Public Semi-Annual Report [Funds] 01-31-2022 ED [AUX] | akiesli | 29-Mar-22 08:43 | 22-1296-2.de | Sequence: 14CHKSUM Content: 31695 Layout: 28542 Graphics: 0 CLEAN
JOB: 22-1296-2 CYCLE#;BL#: 8; 0 TRIM: 8.25" x 10.75" AS: New York: 212-620-5600COLORS: ~note-color 2, Black, ~note-color 3 GRAPHICS: none V1.5
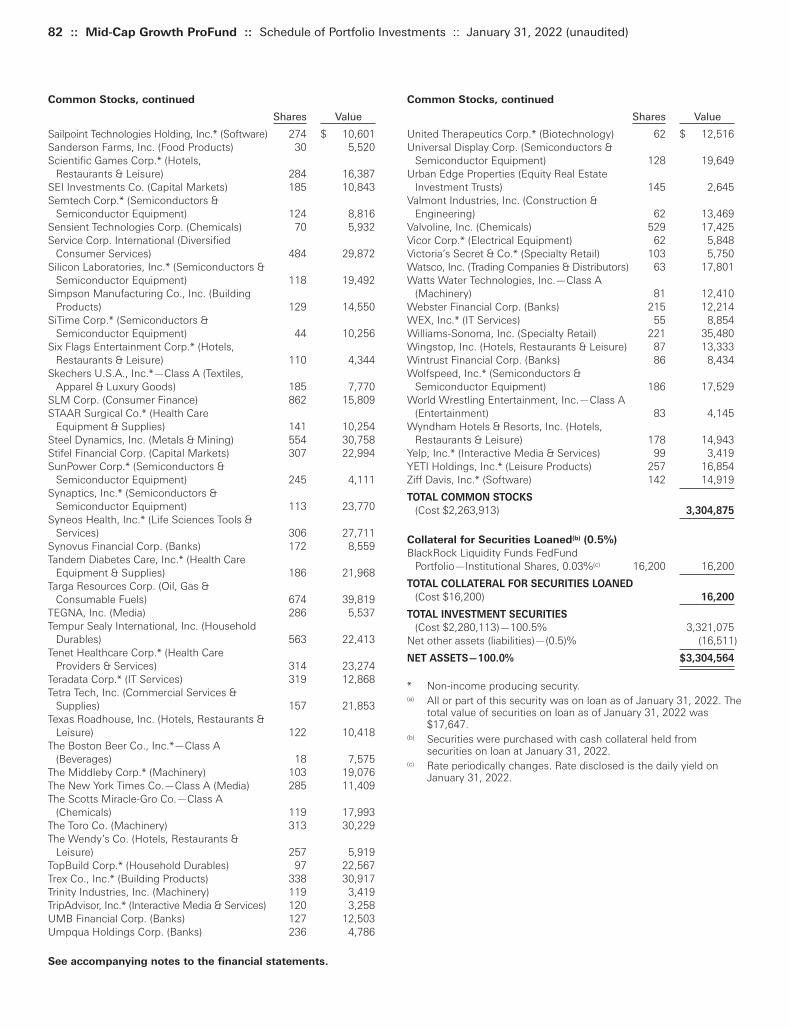
82 :: Mid-Cap Growth ProFund :: Schedule of Portfolio Investments :: January 31, 2022 (unaudited)
Common Stocks, continued
Shares Value
United Therapeutics Corp.* (Biotechnology) 62 $ 12,516Universal Display Corp. (Semiconductors &
Semiconductor Equipment) 128 19,649Urban Edge Properties (Equity Real Estate
Investment Trusts) 145 2,645Valmont Industries, Inc. (Construction &
Engineering) 62 13,469Valvoline, Inc. (Chemicals) 529 17,425Vicor Corp.* (Electrical Equipment) 62 5,848Victoria’s Secret & Co.* (Specialty Retail) 103 5,750Watsco, Inc. (Trading Companies & Distributors) 63 17,801Watts Water Technologies, Inc.—Class A
(Machinery) 81 12,410Webster Financial Corp. (Banks) 215 12,214WEX, Inc.* (IT Services) 55 8,854Williams-Sonoma, Inc. (Specialty Retail) 221 35,480Wingstop, Inc. (Hotels, Restaurants & Leisure) 87 13,333Wintrust Financial Corp. (Banks) 86 8,434Wolfspeed, Inc.* (Semiconductors &
Semiconductor Equipment) 186 17,529World Wrestling Entertainment, Inc.—Class A
(Entertainment) 83 4,145Wyndham Hotels & Resorts, Inc. (Hotels,
Restaurants & Leisure) 178 14,943Yelp, Inc.* (Interactive Media & Services) 99 3,419YETI Holdings, Inc.* (Leisure Products) 257 16,854Ziff Davis, Inc.* (Software) 142 14,919
TOTAL COMMON STOCKS
(Cost $2,263,913) 3,304,875
Collateral for Securities Loaned(b) (0.5%)
BlackRock Liquidity Funds FedFund Portfolio—Institutional Shares, 0.03%(c) 16,200 16,200
TOTAL COLLATERAL FOR SECURITIES LOANED
(Cost $16,200) 16,200
TOTAL INVESTMENT SECURITIES
(Cost $2,280,113)—100.5% 3,321,075Net other assets (liabilities)—(0.5)% (16,511)
NET ASSETS—100.0% $3,304,564
* Non-income producing security.(a) All or part of this security was on loan as of January 31, 2022. The
total value of securities on loan as of January 31, 2022 was$17,647.
(b) Securities were purchased with cash collateral held fromsecurities on loan at January 31, 2022.
(c) Rate periodically changes. Rate disclosed is the daily yield onJanuary 31, 2022.
Common Stocks, continued
Shares Value
Sailpoint Technologies Holding, Inc.* (Software) 274 $ 10,601Sanderson Farms, Inc. (Food Products) 30 5,520Scientific Games Corp.* (Hotels,
Restaurants & Leisure) 284 16,387SEI Investments Co. (Capital Markets) 185 10,843Semtech Corp.* (Semiconductors &
Semiconductor Equipment) 124 8,816Sensient Technologies Corp. (Chemicals) 70 5,932Service Corp. International (Diversified
Consumer Services) 484 29,872Silicon Laboratories, Inc.* (Semiconductors &
Semiconductor Equipment) 118 19,492Simpson Manufacturing Co., Inc. (Building
Products) 129 14,550SiTime Corp.* (Semiconductors &
Semiconductor Equipment) 44 10,256Six Flags Entertainment Corp.* (Hotels,
Restaurants & Leisure) 110 4,344Skechers U.S.A., Inc.*—Class A (Textiles,
Apparel & Luxury Goods) 185 7,770SLM Corp. (Consumer Finance) 862 15,809STAAR Surgical Co.* (Health Care
Equipment & Supplies) 141 10,254Steel Dynamics, Inc. (Metals & Mining) 554 30,758Stifel Financial Corp. (Capital Markets) 307 22,994SunPower Corp.* (Semiconductors &
Semiconductor Equipment) 245 4,111Synaptics, Inc.* (Semiconductors &
Semiconductor Equipment) 113 23,770Syneos Health, Inc.* (Life Sciences Tools &
Services) 306 27,711Synovus Financial Corp. (Banks) 172 8,559Tandem Diabetes Care, Inc.* (Health Care
Equipment & Supplies) 186 21,968Targa Resources Corp. (Oil, Gas &
Consumable Fuels) 674 39,819TEGNA, Inc. (Media) 286 5,537Tempur Sealy International, Inc. (Household
Durables) 563 22,413Tenet Healthcare Corp.* (Health Care
Providers & Services) 314 23,274Teradata Corp.* (IT Services) 319 12,868Tetra Tech, Inc. (Commercial Services &
Supplies) 157 21,853Texas Roadhouse, Inc. (Hotels, Restaurants &
Leisure) 122 10,418The Boston Beer Co., Inc.*—Class A
(Beverages) 18 7,575The Middleby Corp.* (Machinery) 103 19,076The New York Times Co.—Class A (Media) 285 11,409The Scotts Miracle-Gro Co.—Class A
(Chemicals) 119 17,993The Toro Co. (Machinery) 313 30,229The Wendy’s Co. (Hotels, Restaurants &
Leisure) 257 5,919TopBuild Corp.* (Household Durables) 97 22,567Trex Co., Inc.* (Building Products) 338 30,917Trinity Industries, Inc. (Machinery) 119 3,419TripAdvisor, Inc.* (Interactive Media & Services) 120 3,258UMB Financial Corp. (Banks) 127 12,503Umpqua Holdings Corp. (Banks) 236 4,786
See accompanying notes to the financial statements.
Toppan Merrill - ProFunds Public Semi-Annual Report [Funds] 01-31-2022 ED [AUX] | akiesli | 29-Mar-22 08:43 | 22-1296-2.de | Sequence: 15CHKSUM Content: 43717 Layout: 26139 Graphics: 0 CLEAN
JOB: 22-1296-2 CYCLE#;BL#: 8; 0 TRIM: 8.25" x 10.75" AS: New York: 212-620-5600COLORS: ~note-color 2, Black, ~note-color 3 GRAPHICS: none V1.5
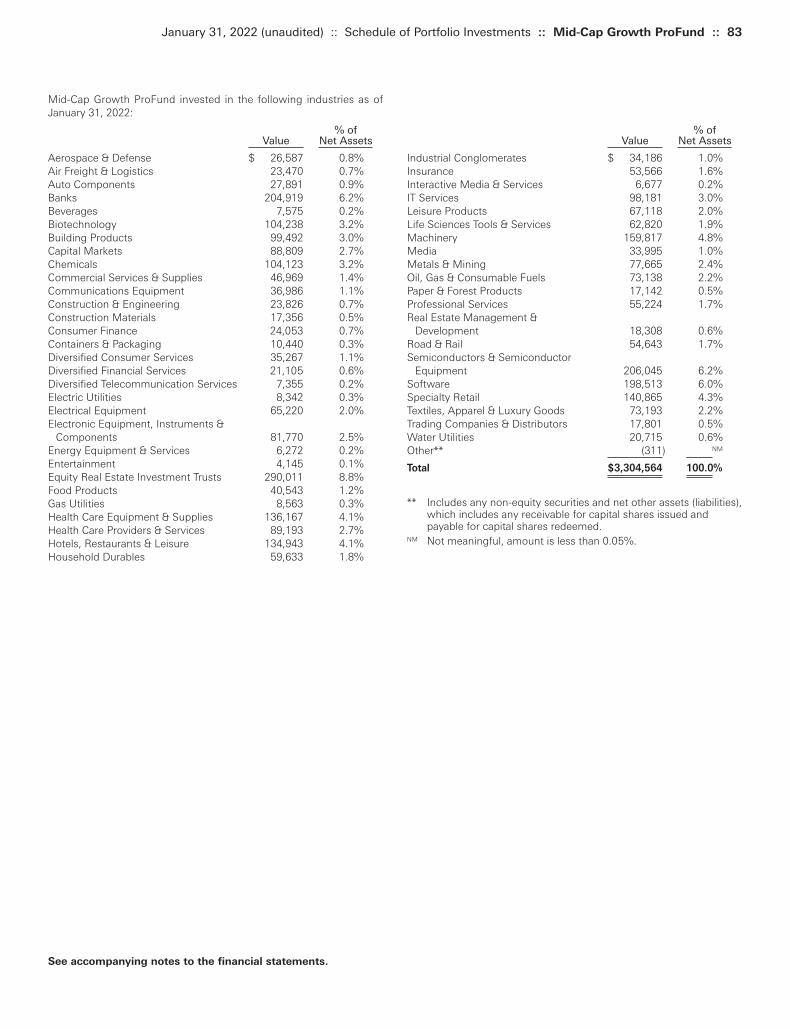
% ofValue Net Assets
Industrial Conglomerates $ 34,186 1.0%Insurance 53,566 1.6%Interactive Media & Services 6,677 0.2%IT Services 98,181 3.0%Leisure Products 67,118 2.0%Life Sciences Tools & Services 62,820 1.9%Machinery 159,817 4.8%Media 33,995 1.0%Metals & Mining 77,665 2.4%Oil, Gas & Consumable Fuels 73,138 2.2%Paper & Forest Products 17,142 0.5%Professional Services 55,224 1.7%Real Estate Management &
Development 18,308 0.6%Road & Rail 54,643 1.7%Semiconductors & Semiconductor
Equipment 206,045 6.2%Software 198,513 6.0%Specialty Retail 140,865 4.3%Textiles, Apparel & Luxury Goods 73,193 2.2%Trading Companies & Distributors 17,801 0.5%Water Utilities 20,715 0.6%Other** (311) NM
Total $3,304,564 100.0%
** Includes any non-equity securities and net other assets (liabilities),which includes any receivable for capital shares issued andpayable for capital shares redeemed.
NM Not meaningful, amount is less than 0.05%.
Mid-Cap Growth ProFund invested in the following industries as ofJanuary 31, 2022:
% ofValue Net Assets
Aerospace & Defense $ 26,587 0.8%Air Freight & Logistics 23,470 0.7%Auto Components 27,891 0.9%Banks 204,919 6.2%Beverages 7,575 0.2%Biotechnology 104,238 3.2%Building Products 99,492 3.0%Capital Markets 88,809 2.7%Chemicals 104,123 3.2%Commercial Services & Supplies 46,969 1.4%Communications Equipment 36,986 1.1%Construction & Engineering 23,826 0.7%Construction Materials 17,356 0.5%Consumer Finance 24,053 0.7%Containers & Packaging 10,440 0.3%Diversified Consumer Services 35,267 1.1%Diversified Financial Services 21,105 0.6%Diversified Telecommunication Services 7,355 0.2%Electric Utilities 8,342 0.3%Electrical Equipment 65,220 2.0%Electronic Equipment, Instruments &
Components 81,770 2.5%Energy Equipment & Services 6,272 0.2%Entertainment 4,145 0.1%Equity Real Estate Investment Trusts 290,011 8.8%Food Products 40,543 1.2%Gas Utilities 8,563 0.3%Health Care Equipment & Supplies 136,167 4.1%Health Care Providers & Services 89,193 2.7%Hotels, Restaurants & Leisure 134,943 4.1%Household Durables 59,633 1.8%
January 31, 2022 (unaudited) :: Schedule of Portfolio Investments :: Mid-Cap Growth ProFund :: 83
See accompanying notes to the financial statements.
Toppan Merrill - ProFunds Public Semi-Annual Report [Funds] 01-31-2022 ED [AUX] | akiesli | 29-Mar-22 08:43 | 22-1296-2.de | Sequence: 16CHKSUM Content: 5920 Layout: 34661 Graphics: 0 CLEAN
JOB: 22-1296-2 CYCLE#;BL#: 8; 0 TRIM: 8.25" x 10.75" AS: New York: 212-620-5600COLORS: ~note-color 2, Black, ~note-color 3 GRAPHICS: none V1.5
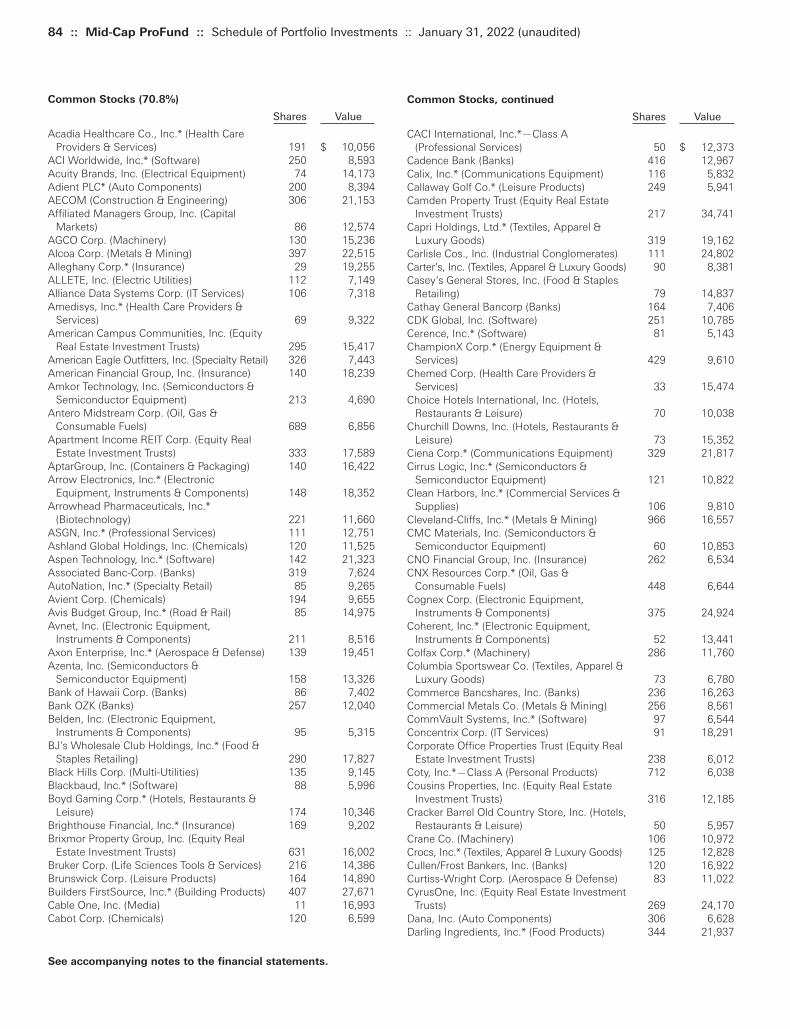
84 :: Mid-Cap ProFund :: Schedule of Portfolio Investments :: January 31, 2022 (unaudited)
Common Stocks, continued
Shares Value
CACI International, Inc.*—Class A (Professional Services) 50 $ 12,373
Cadence Bank (Banks) 416 12,967Calix, Inc.* (Communications Equipment) 116 5,832Callaway Golf Co.* (Leisure Products) 249 5,941Camden Property Trust (Equity Real Estate
Investment Trusts) 217 34,741Capri Holdings, Ltd.* (Textiles, Apparel &
Luxury Goods) 319 19,162Carlisle Cos., Inc. (Industrial Conglomerates) 111 24,802Carter’s, Inc. (Textiles, Apparel & Luxury Goods) 90 8,381Casey’s General Stores, Inc. (Food & Staples
Retailing) 79 14,837Cathay General Bancorp (Banks) 164 7,406CDK Global, Inc. (Software) 251 10,785Cerence, Inc.* (Software) 81 5,143ChampionX Corp.* (Energy Equipment &
Services) 429 9,610Chemed Corp. (Health Care Providers &
Services) 33 15,474Choice Hotels International, Inc. (Hotels,
Restaurants & Leisure) 70 10,038Churchill Downs, Inc. (Hotels, Restaurants &
Leisure) 73 15,352Ciena Corp.* (Communications Equipment) 329 21,817Cirrus Logic, Inc.* (Semiconductors &
Semiconductor Equipment) 121 10,822Clean Harbors, Inc.* (Commercial Services &
Supplies) 106 9,810Cleveland-Cliffs, Inc.* (Metals & Mining) 966 16,557CMC Materials, Inc. (Semiconductors &
Semiconductor Equipment) 60 10,853CNO Financial Group, Inc. (Insurance) 262 6,534CNX Resources Corp.* (Oil, Gas &
Consumable Fuels) 448 6,644Cognex Corp. (Electronic Equipment,
Instruments & Components) 375 24,924Coherent, Inc.* (Electronic Equipment,
Instruments & Components) 52 13,441Colfax Corp.* (Machinery) 286 11,760Columbia Sportswear Co. (Textiles, Apparel &
Luxury Goods) 73 6,780Commerce Bancshares, Inc. (Banks) 236 16,263Commercial Metals Co. (Metals & Mining) 256 8,561CommVault Systems, Inc.* (Software) 97 6,544Concentrix Corp. (IT Services) 91 18,291Corporate Office Properties Trust (Equity Real
Estate Investment Trusts) 238 6,012Coty, Inc.*—Class A (Personal Products) 712 6,038Cousins Properties, Inc. (Equity Real Estate
Investment Trusts) 316 12,185Cracker Barrel Old Country Store, Inc. (Hotels,
Restaurants & Leisure) 50 5,957Crane Co. (Machinery) 106 10,972Crocs, Inc.* (Textiles, Apparel & Luxury Goods) 125 12,828Cullen/Frost Bankers, Inc. (Banks) 120 16,922Curtiss-Wright Corp. (Aerospace & Defense) 83 11,022CyrusOne, Inc. (Equity Real Estate Investment
Trusts) 269 24,170Dana, Inc. (Auto Components) 306 6,628Darling Ingredients, Inc.* (Food Products) 344 21,937
Common Stocks (70.8%)
Shares Value
Acadia Healthcare Co., Inc.* (Health Care Providers & Services) 191 $ 10,056
ACI Worldwide, Inc.* (Software) 250 8,593Acuity Brands, Inc. (Electrical Equipment) 74 14,173Adient PLC* (Auto Components) 200 8,394AECOM (Construction & Engineering) 306 21,153Affiliated Managers Group, Inc. (Capital
Markets) 86 12,574AGCO Corp. (Machinery) 130 15,236Alcoa Corp. (Metals & Mining) 397 22,515Alleghany Corp.* (Insurance) 29 19,255ALLETE, Inc. (Electric Utilities) 112 7,149Alliance Data Systems Corp. (IT Services) 106 7,318Amedisys, Inc.* (Health Care Providers &
Services) 69 9,322American Campus Communities, Inc. (Equity
Real Estate Investment Trusts) 295 15,417American Eagle Outfitters, Inc. (Specialty Retail) 326 7,443American Financial Group, Inc. (Insurance) 140 18,239Amkor Technology, Inc. (Semiconductors &
Semiconductor Equipment) 213 4,690Antero Midstream Corp. (Oil, Gas &
Consumable Fuels) 689 6,856Apartment Income REIT Corp. (Equity Real
Estate Investment Trusts) 333 17,589AptarGroup, Inc. (Containers & Packaging) 140 16,422Arrow Electronics, Inc.* (Electronic
Equipment, Instruments & Components) 148 18,352Arrowhead Pharmaceuticals, Inc.*
(Biotechnology) 221 11,660ASGN, Inc.* (Professional Services) 111 12,751Ashland Global Holdings, Inc. (Chemicals) 120 11,525Aspen Technology, Inc.* (Software) 142 21,323Associated Banc-Corp. (Banks) 319 7,624AutoNation, Inc.* (Specialty Retail) 85 9,265Avient Corp. (Chemicals) 194 9,655Avis Budget Group, Inc.* (Road & Rail) 85 14,975Avnet, Inc. (Electronic Equipment,
Instruments & Components) 211 8,516Axon Enterprise, Inc.* (Aerospace & Defense) 139 19,451Azenta, Inc. (Semiconductors &
Semiconductor Equipment) 158 13,326Bank of Hawaii Corp. (Banks) 86 7,402Bank OZK (Banks) 257 12,040Belden, Inc. (Electronic Equipment,
Instruments & Components) 95 5,315BJ’s Wholesale Club Holdings, Inc.* (Food &
Staples Retailing) 290 17,827Black Hills Corp. (Multi-Utilities) 135 9,145Blackbaud, Inc.* (Software) 88 5,996Boyd Gaming Corp.* (Hotels, Restaurants &
Leisure) 174 10,346Brighthouse Financial, Inc.* (Insurance) 169 9,202Brixmor Property Group, Inc. (Equity Real
Estate Investment Trusts) 631 16,002Bruker Corp. (Life Sciences Tools & Services) 216 14,386Brunswick Corp. (Leisure Products) 164 14,890Builders FirstSource, Inc.* (Building Products) 407 27,671Cable One, Inc. (Media) 11 16,993Cabot Corp. (Chemicals) 120 6,599
See accompanying notes to the financial statements.
Toppan Merrill - ProFunds Public Semi-Annual Report [Funds] 01-31-2022 ED [AUX] | akiesli | 29-Mar-22 08:43 | 22-1296-2.de | Sequence: 17CHKSUM Content: 33869 Layout: 56764 Graphics: 0 CLEAN
JOB: 22-1296-2 CYCLE#;BL#: 8; 0 TRIM: 8.25" x 10.75" AS: New York: 212-620-5600COLORS: ~note-color 2, Black, ~note-color 3 GRAPHICS: none V1.5
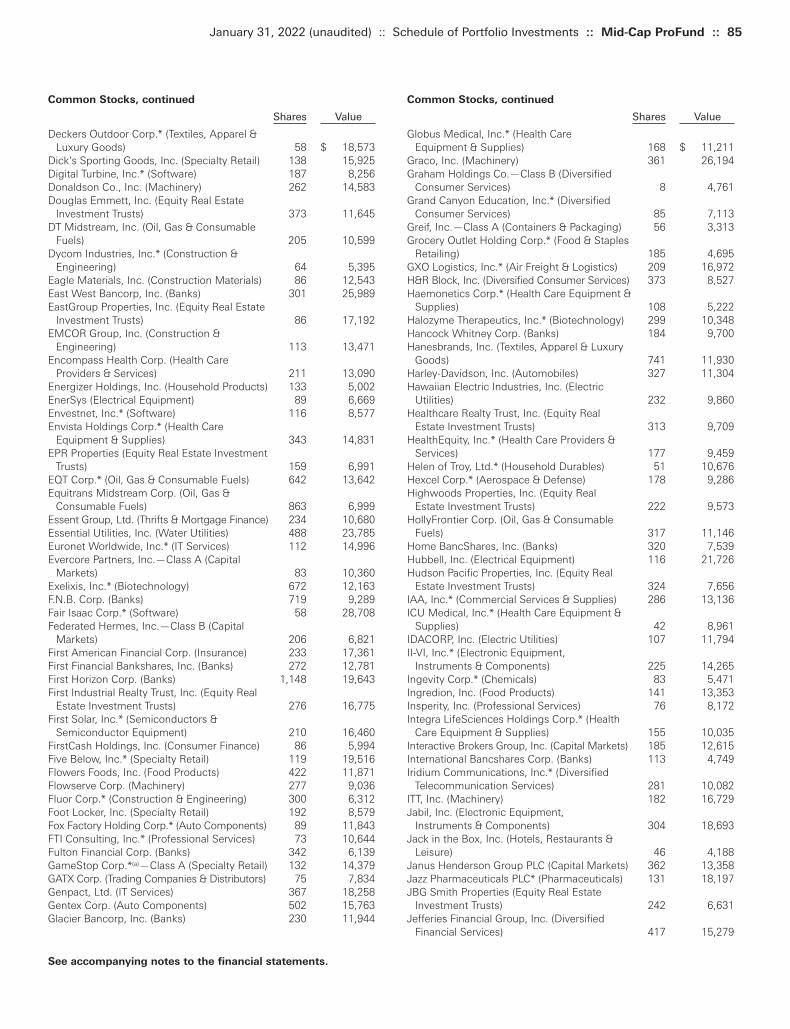
Common Stocks, continued
Shares Value
Globus Medical, Inc.* (Health Care Equipment & Supplies) 168 $ 11,211
Graco, Inc. (Machinery) 361 26,194Graham Holdings Co.—Class B (Diversified
Consumer Services) 8 4,761Grand Canyon Education, Inc.* (Diversified
Consumer Services) 85 7,113Greif, Inc.—Class A (Containers & Packaging) 56 3,313Grocery Outlet Holding Corp.* (Food & Staples
Retailing) 185 4,695GXO Logistics, Inc.* (Air Freight & Logistics) 209 16,972H&R Block, Inc. (Diversified Consumer Services) 373 8,527Haemonetics Corp.* (Health Care Equipment &
Supplies) 108 5,222Halozyme Therapeutics, Inc.* (Biotechnology) 299 10,348Hancock Whitney Corp. (Banks) 184 9,700Hanesbrands, Inc. (Textiles, Apparel & Luxury
Goods) 741 11,930Harley-Davidson, Inc. (Automobiles) 327 11,304Hawaiian Electric Industries, Inc. (Electric
Utilities) 232 9,860Healthcare Realty Trust, Inc. (Equity Real
Estate Investment Trusts) 313 9,709HealthEquity, Inc.* (Health Care Providers &
Services) 177 9,459Helen of Troy, Ltd.* (Household Durables) 51 10,676Hexcel Corp.* (Aerospace & Defense) 178 9,286Highwoods Properties, Inc. (Equity Real
Estate Investment Trusts) 222 9,573HollyFrontier Corp. (Oil, Gas & Consumable
Fuels) 317 11,146Home BancShares, Inc. (Banks) 320 7,539Hubbell, Inc. (Electrical Equipment) 116 21,726Hudson Pacific Properties, Inc. (Equity Real
Estate Investment Trusts) 324 7,656IAA, Inc.* (Commercial Services & Supplies) 286 13,136ICU Medical, Inc.* (Health Care Equipment &
Supplies) 42 8,961IDACORP, Inc. (Electric Utilities) 107 11,794II-VI, Inc.* (Electronic Equipment,
Instruments & Components) 225 14,265Ingevity Corp.* (Chemicals) 83 5,471Ingredion, Inc. (Food Products) 141 13,353Insperity, Inc. (Professional Services) 76 8,172Integra LifeSciences Holdings Corp.* (Health
Care Equipment & Supplies) 155 10,035Interactive Brokers Group, Inc. (Capital Markets) 185 12,615International Bancshares Corp. (Banks) 113 4,749Iridium Communications, Inc.* (Diversified
Telecommunication Services) 281 10,082ITT, Inc. (Machinery) 182 16,729Jabil, Inc. (Electronic Equipment,
Instruments & Components) 304 18,693Jack in the Box, Inc. (Hotels, Restaurants &
Leisure) 46 4,188Janus Henderson Group PLC (Capital Markets) 362 13,358Jazz Pharmaceuticals PLC* (Pharmaceuticals) 131 18,197JBG Smith Properties (Equity Real Estate
Investment Trusts) 242 6,631Jefferies Financial Group, Inc. (Diversified
Financial Services) 417 15,279
Common Stocks, continued
Shares Value
Deckers Outdoor Corp.* (Textiles, Apparel & Luxury Goods) 58 $ 18,573
Dick’s Sporting Goods, Inc. (Specialty Retail) 138 15,925Digital Turbine, Inc.* (Software) 187 8,256Donaldson Co., Inc. (Machinery) 262 14,583Douglas Emmett, Inc. (Equity Real Estate
Investment Trusts) 373 11,645DT Midstream, Inc. (Oil, Gas & Consumable
Fuels) 205 10,599Dycom Industries, Inc.* (Construction &
Engineering) 64 5,395Eagle Materials, Inc. (Construction Materials) 86 12,543East West Bancorp, Inc. (Banks) 301 25,989EastGroup Properties, Inc. (Equity Real Estate
Investment Trusts) 86 17,192EMCOR Group, Inc. (Construction &
Engineering) 113 13,471Encompass Health Corp. (Health Care
Providers & Services) 211 13,090Energizer Holdings, Inc. (Household Products) 133 5,002EnerSys (Electrical Equipment) 89 6,669Envestnet, Inc.* (Software) 116 8,577Envista Holdings Corp.* (Health Care
Equipment & Supplies) 343 14,831EPR Properties (Equity Real Estate Investment
Trusts) 159 6,991EQT Corp.* (Oil, Gas & Consumable Fuels) 642 13,642Equitrans Midstream Corp. (Oil, Gas &
Consumable Fuels) 863 6,999Essent Group, Ltd. (Thrifts & Mortgage Finance) 234 10,680Essential Utilities, Inc. (Water Utilities) 488 23,785Euronet Worldwide, Inc.* (IT Services) 112 14,996Evercore Partners, Inc.—Class A (Capital
Markets) 83 10,360Exelixis, Inc.* (Biotechnology) 672 12,163F.N.B. Corp. (Banks) 719 9,289Fair Isaac Corp.* (Software) 58 28,708Federated Hermes, Inc.—Class B (Capital
Markets) 206 6,821First American Financial Corp. (Insurance) 233 17,361First Financial Bankshares, Inc. (Banks) 272 12,781First Horizon Corp. (Banks) 1,148 19,643First Industrial Realty Trust, Inc. (Equity Real
Estate Investment Trusts) 276 16,775First Solar, Inc.* (Semiconductors &
Semiconductor Equipment) 210 16,460FirstCash Holdings, Inc. (Consumer Finance) 86 5,994Five Below, Inc.* (Specialty Retail) 119 19,516Flowers Foods, Inc. (Food Products) 422 11,871Flowserve Corp. (Machinery) 277 9,036Fluor Corp.* (Construction & Engineering) 300 6,312Foot Locker, Inc. (Specialty Retail) 192 8,579Fox Factory Holding Corp.* (Auto Components) 89 11,843FTI Consulting, Inc.* (Professional Services) 73 10,644Fulton Financial Corp. (Banks) 342 6,139GameStop Corp.*(a)—Class A (Specialty Retail) 132 14,379GATX Corp. (Trading Companies & Distributors) 75 7,834Genpact, Ltd. (IT Services) 367 18,258Gentex Corp. (Auto Components) 502 15,763Glacier Bancorp, Inc. (Banks) 230 11,944
January 31, 2022 (unaudited) :: Schedule of Portfolio Investments :: Mid-Cap ProFund :: 85
See accompanying notes to the financial statements.
Toppan Merrill - ProFunds Public Semi-Annual Report [Funds] 01-31-2022 ED [AUX] | akiesli | 29-Mar-22 08:43 | 22-1296-2.de | Sequence: 18CHKSUM Content: 27445 Layout: 28542 Graphics: 0 CLEAN
JOB: 22-1296-2 CYCLE#;BL#: 8; 0 TRIM: 8.25" x 10.75" AS: New York: 212-620-5600COLORS: ~note-color 2, Black, ~note-color 3 GRAPHICS: none V1.5
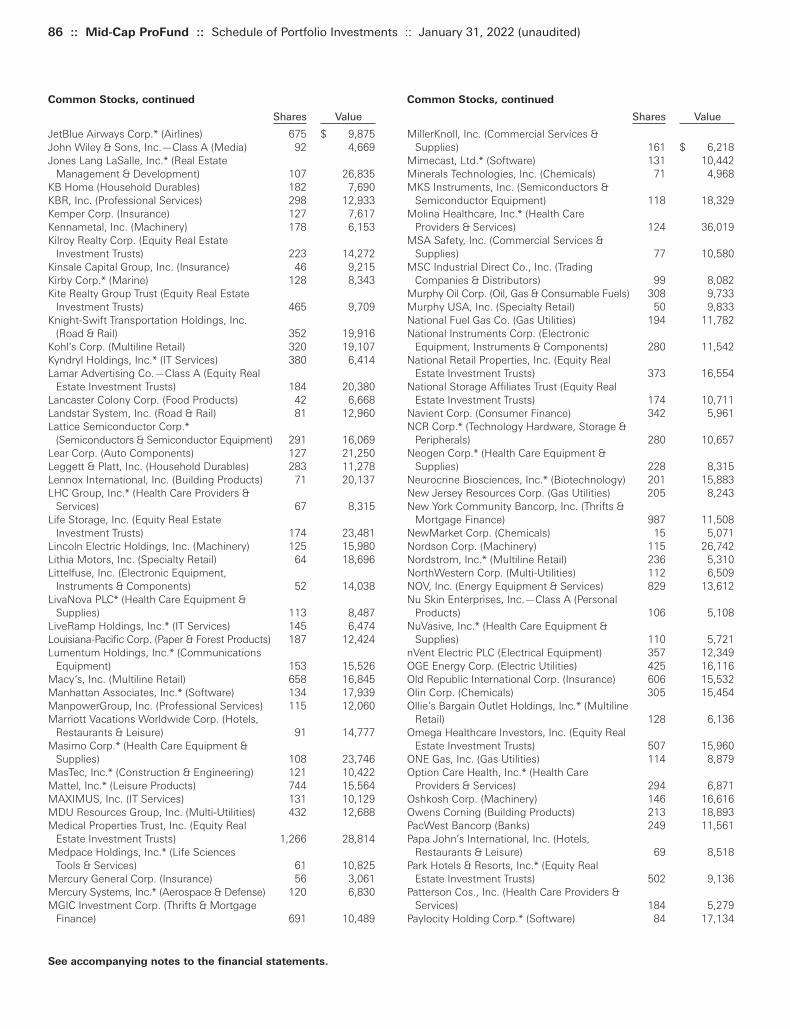
86 :: Mid-Cap ProFund :: Schedule of Portfolio Investments :: January 31, 2022 (unaudited)
Common Stocks, continued
Shares Value
MillerKnoll, Inc. (Commercial Services & Supplies) 161 $ 6,218
Mimecast, Ltd.* (Software) 131 10,442Minerals Technologies, Inc. (Chemicals) 71 4,968MKS Instruments, Inc. (Semiconductors &
Semiconductor Equipment) 118 18,329Molina Healthcare, Inc.* (Health Care
Providers & Services) 124 36,019MSA Safety, Inc. (Commercial Services &
Supplies) 77 10,580MSC Industrial Direct Co., Inc. (Trading
Companies & Distributors) 99 8,082Murphy Oil Corp. (Oil, Gas & Consumable Fuels) 308 9,733Murphy USA, Inc. (Specialty Retail) 50 9,833National Fuel Gas Co. (Gas Utilities) 194 11,782National Instruments Corp. (Electronic
Equipment, Instruments & Components) 280 11,542National Retail Properties, Inc. (Equity Real
Estate Investment Trusts) 373 16,554National Storage Affiliates Trust (Equity Real
Estate Investment Trusts) 174 10,711Navient Corp. (Consumer Finance) 342 5,961NCR Corp.* (Technology Hardware, Storage &
Peripherals) 280 10,657Neogen Corp.* (Health Care Equipment &
Supplies) 228 8,315Neurocrine Biosciences, Inc.* (Biotechnology) 201 15,883New Jersey Resources Corp. (Gas Utilities) 205 8,243New York Community Bancorp, Inc. (Thrifts &
Mortgage Finance) 987 11,508NewMarket Corp. (Chemicals) 15 5,071Nordson Corp. (Machinery) 115 26,742Nordstrom, Inc.* (Multiline Retail) 236 5,310NorthWestern Corp. (Multi-Utilities) 112 6,509NOV, Inc. (Energy Equipment & Services) 829 13,612Nu Skin Enterprises, Inc.—Class A (Personal
Products) 106 5,108NuVasive, Inc.* (Health Care Equipment &
Supplies) 110 5,721nVent Electric PLC (Electrical Equipment) 357 12,349OGE Energy Corp. (Electric Utilities) 425 16,116Old Republic International Corp. (Insurance) 606 15,532Olin Corp. (Chemicals) 305 15,454Ollie’s Bargain Outlet Holdings, Inc.* (Multiline
Retail) 128 6,136Omega Healthcare Investors, Inc. (Equity Real
Estate Investment Trusts) 507 15,960ONE Gas, Inc. (Gas Utilities) 114 8,879Option Care Health, Inc.* (Health Care
Providers & Services) 294 6,871Oshkosh Corp. (Machinery) 146 16,616Owens Corning (Building Products) 213 18,893PacWest Bancorp (Banks) 249 11,561Papa John’s International, Inc. (Hotels,
Restaurants & Leisure) 69 8,518Park Hotels & Resorts, Inc.* (Equity Real
Estate Investment Trusts) 502 9,136Patterson Cos., Inc. (Health Care Providers &
Services) 184 5,279Paylocity Holding Corp.* (Software) 84 17,134
Common Stocks, continued
Shares Value
JetBlue Airways Corp.* (Airlines) 675 $ 9,875John Wiley & Sons, Inc.—Class A (Media) 92 4,669Jones Lang LaSalle, Inc.* (Real Estate
Management & Development) 107 26,835KB Home (Household Durables) 182 7,690KBR, Inc. (Professional Services) 298 12,933Kemper Corp. (Insurance) 127 7,617Kennametal, Inc. (Machinery) 178 6,153Kilroy Realty Corp. (Equity Real Estate
Investment Trusts) 223 14,272Kinsale Capital Group, Inc. (Insurance) 46 9,215Kirby Corp.* (Marine) 128 8,343Kite Realty Group Trust (Equity Real Estate
Investment Trusts) 465 9,709Knight-Swift Transportation Holdings, Inc.
(Road & Rail) 352 19,916Kohl’s Corp. (Multiline Retail) 320 19,107Kyndryl Holdings, Inc.* (IT Services) 380 6,414Lamar Advertising Co.—Class A (Equity Real
Estate Investment Trusts) 184 20,380Lancaster Colony Corp. (Food Products) 42 6,668Landstar System, Inc. (Road & Rail) 81 12,960Lattice Semiconductor Corp.*
(Semiconductors & Semiconductor Equipment) 291 16,069Lear Corp. (Auto Components) 127 21,250Leggett & Platt, Inc. (Household Durables) 283 11,278Lennox International, Inc. (Building Products) 71 20,137LHC Group, Inc.* (Health Care Providers &
Services) 67 8,315Life Storage, Inc. (Equity Real Estate
Investment Trusts) 174 23,481Lincoln Electric Holdings, Inc. (Machinery) 125 15,980Lithia Motors, Inc. (Specialty Retail) 64 18,696Littelfuse, Inc. (Electronic Equipment,
Instruments & Components) 52 14,038LivaNova PLC* (Health Care Equipment &
Supplies) 113 8,487LiveRamp Holdings, Inc.* (IT Services) 145 6,474Louisiana-Pacific Corp. (Paper & Forest Products) 187 12,424Lumentum Holdings, Inc.* (Communications
Equipment) 153 15,526Macy’s, Inc. (Multiline Retail) 658 16,845Manhattan Associates, Inc.* (Software) 134 17,939ManpowerGroup, Inc. (Professional Services) 115 12,060Marriott Vacations Worldwide Corp. (Hotels,
Restaurants & Leisure) 91 14,777Masimo Corp.* (Health Care Equipment &
Supplies) 108 23,746MasTec, Inc.* (Construction & Engineering) 121 10,422Mattel, Inc.* (Leisure Products) 744 15,564MAXIMUS, Inc. (IT Services) 131 10,129MDU Resources Group, Inc. (Multi-Utilities) 432 12,688Medical Properties Trust, Inc. (Equity Real
Estate Investment Trusts) 1,266 28,814Medpace Holdings, Inc.* (Life Sciences
Tools & Services) 61 10,825Mercury General Corp. (Insurance) 56 3,061Mercury Systems, Inc.* (Aerospace & Defense) 120 6,830MGIC Investment Corp. (Thrifts & Mortgage
Finance) 691 10,489
See accompanying notes to the financial statements.
Toppan Merrill - ProFunds Public Semi-Annual Report [Funds] 01-31-2022 ED [AUX] | akiesli | 29-Mar-22 08:43 | 22-1296-2.de | Sequence: 19CHKSUM Content: 2757 Layout: 26139 Graphics: 0 CLEAN
JOB: 22-1296-2 CYCLE#;BL#: 8; 0 TRIM: 8.25" x 10.75" AS: New York: 212-620-5600COLORS: ~note-color 2, Black, ~note-color 3 GRAPHICS: none V1.5
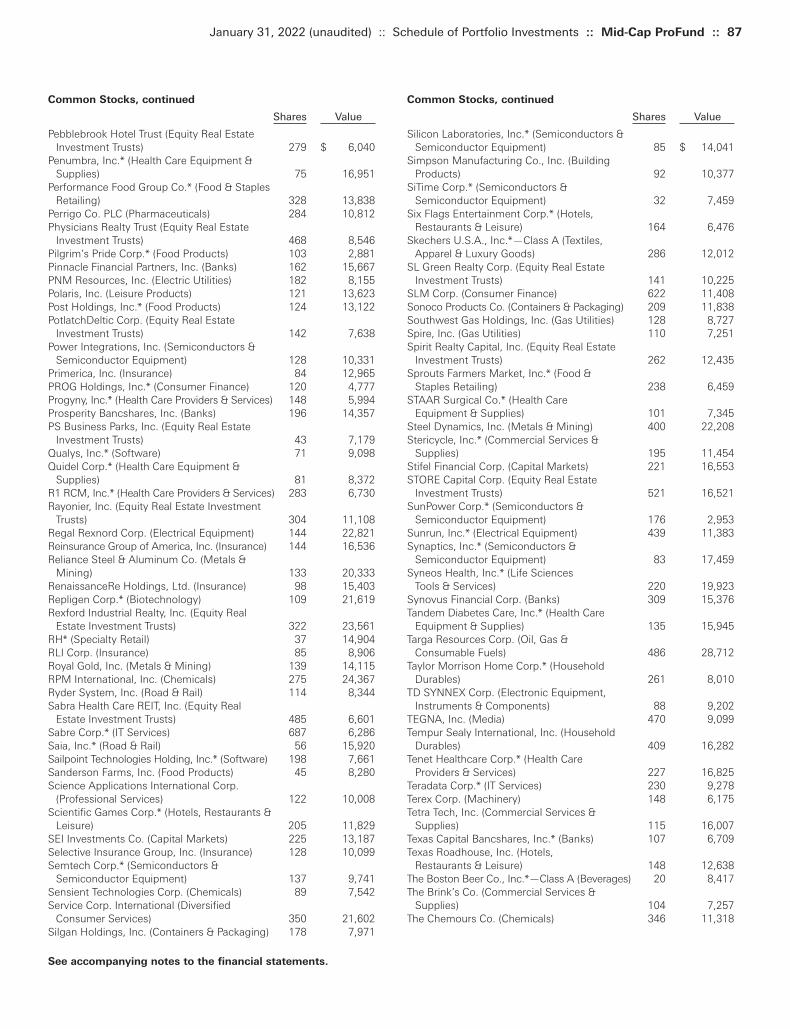
Common Stocks, continued
Shares Value
Silicon Laboratories, Inc.* (Semiconductors & Semiconductor Equipment) 85 $ 14,041
Simpson Manufacturing Co., Inc. (Building Products) 92 10,377
SiTime Corp.* (Semiconductors & Semiconductor Equipment) 32 7,459
Six Flags Entertainment Corp.* (Hotels, Restaurants & Leisure) 164 6,476
Skechers U.S.A., Inc.*—Class A (Textiles, Apparel & Luxury Goods) 286 12,012
SL Green Realty Corp. (Equity Real Estate Investment Trusts) 141 10,225
SLM Corp. (Consumer Finance) 622 11,408Sonoco Products Co. (Containers & Packaging) 209 11,838Southwest Gas Holdings, Inc. (Gas Utilities) 128 8,727Spire, Inc. (Gas Utilities) 110 7,251Spirit Realty Capital, Inc. (Equity Real Estate
Investment Trusts) 262 12,435Sprouts Farmers Market, Inc.* (Food &
Staples Retailing) 238 6,459STAAR Surgical Co.* (Health Care
Equipment & Supplies) 101 7,345Steel Dynamics, Inc. (Metals & Mining) 400 22,208Stericycle, Inc.* (Commercial Services &
Supplies) 195 11,454Stifel Financial Corp. (Capital Markets) 221 16,553STORE Capital Corp. (Equity Real Estate
Investment Trusts) 521 16,521SunPower Corp.* (Semiconductors &
Semiconductor Equipment) 176 2,953Sunrun, Inc.* (Electrical Equipment) 439 11,383Synaptics, Inc.* (Semiconductors &
Semiconductor Equipment) 83 17,459Syneos Health, Inc.* (Life Sciences
Tools & Services) 220 19,923Synovus Financial Corp. (Banks) 309 15,376Tandem Diabetes Care, Inc.* (Health Care
Equipment & Supplies) 135 15,945Targa Resources Corp. (Oil, Gas &
Consumable Fuels) 486 28,712Taylor Morrison Home Corp.* (Household
Durables) 261 8,010TD SYNNEX Corp. (Electronic Equipment,
Instruments & Components) 88 9,202TEGNA, Inc. (Media) 470 9,099Tempur Sealy International, Inc. (Household
Durables) 409 16,282Tenet Healthcare Corp.* (Health Care
Providers & Services) 227 16,825Teradata Corp.* (IT Services) 230 9,278Terex Corp. (Machinery) 148 6,175Tetra Tech, Inc. (Commercial Services &
Supplies) 115 16,007Texas Capital Bancshares, Inc.* (Banks) 107 6,709Texas Roadhouse, Inc. (Hotels,
Restaurants & Leisure) 148 12,638The Boston Beer Co., Inc.*—Class A (Beverages) 20 8,417The Brink’s Co. (Commercial Services &
Supplies) 104 7,257The Chemours Co. (Chemicals) 346 11,318
Common Stocks, continued
Shares Value
Pebblebrook Hotel Trust (Equity Real Estate Investment Trusts) 279 $ 6,040
Penumbra, Inc.* (Health Care Equipment & Supplies) 75 16,951
Performance Food Group Co.* (Food & Staples Retailing) 328 13,838
Perrigo Co. PLC (Pharmaceuticals) 284 10,812Physicians Realty Trust (Equity Real Estate
Investment Trusts) 468 8,546Pilgrim’s Pride Corp.* (Food Products) 103 2,881Pinnacle Financial Partners, Inc. (Banks) 162 15,667PNM Resources, Inc. (Electric Utilities) 182 8,155Polaris, Inc. (Leisure Products) 121 13,623Post Holdings, Inc.* (Food Products) 124 13,122PotlatchDeltic Corp. (Equity Real Estate
Investment Trusts) 142 7,638Power Integrations, Inc. (Semiconductors &
Semiconductor Equipment) 128 10,331Primerica, Inc. (Insurance) 84 12,965PROG Holdings, Inc.* (Consumer Finance) 120 4,777Progyny, Inc.* (Health Care Providers & Services) 148 5,994Prosperity Bancshares, Inc. (Banks) 196 14,357PS Business Parks, Inc. (Equity Real Estate
Investment Trusts) 43 7,179Qualys, Inc.* (Software) 71 9,098Quidel Corp.* (Health Care Equipment &
Supplies) 81 8,372R1 RCM, Inc.* (Health Care Providers & Services) 283 6,730Rayonier, Inc. (Equity Real Estate Investment
Trusts) 304 11,108Regal Rexnord Corp. (Electrical Equipment) 144 22,821Reinsurance Group of America, Inc. (Insurance) 144 16,536Reliance Steel & Aluminum Co. (Metals &
Mining) 133 20,333RenaissanceRe Holdings, Ltd. (Insurance) 98 15,403Repligen Corp.* (Biotechnology) 109 21,619Rexford Industrial Realty, Inc. (Equity Real
Estate Investment Trusts) 322 23,561RH* (Specialty Retail) 37 14,904RLI Corp. (Insurance) 85 8,906Royal Gold, Inc. (Metals & Mining) 139 14,115RPM International, Inc. (Chemicals) 275 24,367Ryder System, Inc. (Road & Rail) 114 8,344Sabra Health Care REIT, Inc. (Equity Real
Estate Investment Trusts) 485 6,601Sabre Corp.* (IT Services) 687 6,286Saia, Inc.* (Road & Rail) 56 15,920Sailpoint Technologies Holding, Inc.* (Software) 198 7,661Sanderson Farms, Inc. (Food Products) 45 8,280Science Applications International Corp.
(Professional Services) 122 10,008Scientific Games Corp.* (Hotels, Restaurants &
Leisure) 205 11,829SEI Investments Co. (Capital Markets) 225 13,187Selective Insurance Group, Inc. (Insurance) 128 10,099Semtech Corp.* (Semiconductors &
Semiconductor Equipment) 137 9,741Sensient Technologies Corp. (Chemicals) 89 7,542Service Corp. International (Diversified
Consumer Services) 350 21,602Silgan Holdings, Inc. (Containers & Packaging) 178 7,971
January 31, 2022 (unaudited) :: Schedule of Portfolio Investments :: Mid-Cap ProFund :: 87
See accompanying notes to the financial statements.
Toppan Merrill - ProFunds Public Semi-Annual Report [Funds] 01-31-2022 ED [AUX] | akiesli | 29-Mar-22 08:43 | 22-1296-2.de | Sequence: 20CHKSUM Content: 38507 Layout: 28542 Graphics: 0 CLEAN
JOB: 22-1296-2 CYCLE#;BL#: 8; 0 TRIM: 8.25" x 10.75" AS: New York: 212-620-5600COLORS: ~note-color 2, Black, ~note-color 3 GRAPHICS: none V1.5

88 :: Mid-Cap ProFund :: Schedule of Portfolio Investments :: January 31, 2022 (unaudited)
Common Stocks, continued
Shares Value
Wingstop, Inc. (Hotels, Restaurants & Leisure) 63 $ 9,655Wintrust Financial Corp. (Banks) 121 11,866Wolfspeed, Inc.* (Semiconductors &
Semiconductor Equipment) 246 23,183Woodward, Inc. (Machinery) 134 14,776World Wrestling Entertainment, Inc.—Class A
(Entertainment) 95 4,744Worthington Industries, Inc. (Metals & Mining) 69 3,738Wyndham Hotels & Resorts, Inc. (Hotels,
Restaurants & Leisure) 198 16,621Xerox Holdings Corp. (Technology Hardware,
Storage & Peripherals) 292 6,164XPO Logistics, Inc.* (Air Freight & Logistics) 209 13,830Yelp, Inc.* (Interactive Media & Services) 146 5,043YETI Holdings, Inc.* (Leisure Products) 186 12,198Ziff Davis, Inc.* (Software) 102 10,716
TOTAL COMMON STOCKS
(Cost $3,122,430) 4,870,845
Repurchase Agreements(b)(c) (28.4%)
PrincipalAmount Value
Repurchase Agreements with various counterparties, 0.00%, dated 1/31/22, due 2/1/22, total to be received $1,955,000 $1,955,000 $1,955,000
TOTAL REPURCHASE AGREEMENTS
(Cost $1,955,000) 1,955,000
Collateral for Securities Loaned(d) (0.2%)
Shares Value
BlackRock Liquidity Funds FedFund Portfolio—Institutional Shares, 0.03%(e) 11,300 $ 11,300
TOTAL COLLATERAL FOR SECURITIES LOANED
(Cost $11,300) 11,300
TOTAL INVESTMENT SECURITIES
(Cost $5,088,730)—99.4% 6,837,145Net other assets (liabilities)—0.6% 42,366
NET ASSETS—100.0% $6,879,511
* Non-income producing security.(a) All or part of this security was on loan as of January 31, 2022. The
total value of securities on loan as of January 31, 2022 was$12,309.
(b) The ProFund invests in Repurchase Agreements jointly with otherfunds in the Trust. See “Repurchase Agreements” under Note 2in the Notes to the Financial Statements to view the details ofeach individual agreement and counterparty as well as adescription of the securities subject to repurchase.
(c) A portion of these securities were held in a segregated accountfor the benefit of swap counterparties in the event of default. Asof January 31, 2022, the aggregate amount held in a segregatedaccount was $311,000.
(d) Securities were purchased with cash collateral held fromsecurities on loan at January 31, 2022.
(e) Rate periodically changes. Rate disclosed is the daily yield onJanuary 31, 2022.
Common Stocks, continued
Shares Value
The Goodyear Tire & Rubber Co.* (Auto Components) 597 $ 12,376
The Hain Celestial Group, Inc.* (Food Products) 197 7,196The Hanover Insurance Group, Inc. (Insurance) 76 10,485The Macerich Co. (Equity Real Estate
Investment Trusts) 452 7,476The Middleby Corp.* (Machinery) 118 21,854The New York Times Co.—Class A (Media) 355 14,211The Scotts Miracle-Gro Co.—Class A
(Chemicals) 86 13,003The Timken Co. (Machinery) 147 9,820The Toro Co. (Machinery) 226 21,827The Wendy’s Co. (Hotels, Restaurants &
Leisure) 375 8,636The Western Union Co. (IT Services) 853 16,130Thor Industries, Inc. (Automobiles) 118 11,162Toll Brothers, Inc. (Household Durables) 243 14,330TopBuild Corp.* (Household Durables) 70 16,285Travel + Leisure Co. (Hotels, Restaurants &
Leisure) 183 10,394Trex Co., Inc.* (Building Products) 244 22,319Tri Pointe Homes, Inc.* (Household Durables) 236 5,619Trinity Industries, Inc. (Machinery) 174 4,999TripAdvisor, Inc.* (Interactive Media & Services) 210 5,701UGI Corp. (Gas Utilities) 444 20,136UMB Financial Corp. (Banks) 91 8,959Umpqua Holdings Corp. (Banks) 460 9,329United Bankshares, Inc. (Banks) 289 10,210United States Steel Corp. (Metals & Mining) 574 11,893United Therapeutics Corp.* (Biotechnology) 96 19,380Univar Solutions, Inc.* (Trading Companies &
Distributors) 363 9,620Universal Display Corp. (Semiconductors &
Semiconductor Equipment) 92 14,123Unum Group (Insurance) 434 11,015Urban Edge Properties (Equity Real Estate
Investment Trusts) 234 4,268Urban Outfitters, Inc.* (Specialty Retail) 140 4,021Valley National Bancorp (Banks) 864 12,027Valmont Industries, Inc. (Construction &
Engineering) 45 9,775Valvoline, Inc. (Chemicals) 384 12,649ViaSat, Inc.* (Communications Equipment) 156 6,867Vicor Corp.* (Electrical Equipment) 46 4,339Victoria’s Secret & Co.* (Specialty Retail) 154 8,598Vishay Intertechnology, Inc. (Electronic
Equipment, Instruments & Components) 282 5,840Visteon Corp.* (Auto Components) 59 5,989Vontier Corp. (Electronic Equipment,
Instruments & Components) 359 10,091Voya Financial, Inc. (Diversified Financial
Services) 236 16,038Washington Federal, Inc. (Thrifts & Mortgage
Finance) 138 4,833Watsco, Inc. (Trading Companies & Distributors) 70 19,779Watts Water Technologies, Inc.—Class A
(Machinery) 58 8,886Webster Financial Corp. (Banks) 380 21,589Werner Enterprises, Inc. (Road & Rail) 129 5,752WEX, Inc.* (IT Services) 95 15,293Williams-Sonoma, Inc. (Specialty Retail) 158 25,364
See accompanying notes to the financial statements.
Toppan Merrill - ProFunds Public Semi-Annual Report [Funds] 01-31-2022 ED [AUX] | akiesli | 29-Mar-22 08:43 | 22-1296-2.de | Sequence: 21CHKSUM Content: 43877 Layout: 56786 Graphics: 0 CLEAN
JOB: 22-1296-2 CYCLE#;BL#: 8; 0 TRIM: 8.25" x 10.75" AS: New York: 212-620-5600COLORS: ~note-color 2, Black, ~note-color 3 GRAPHICS: none V1.5
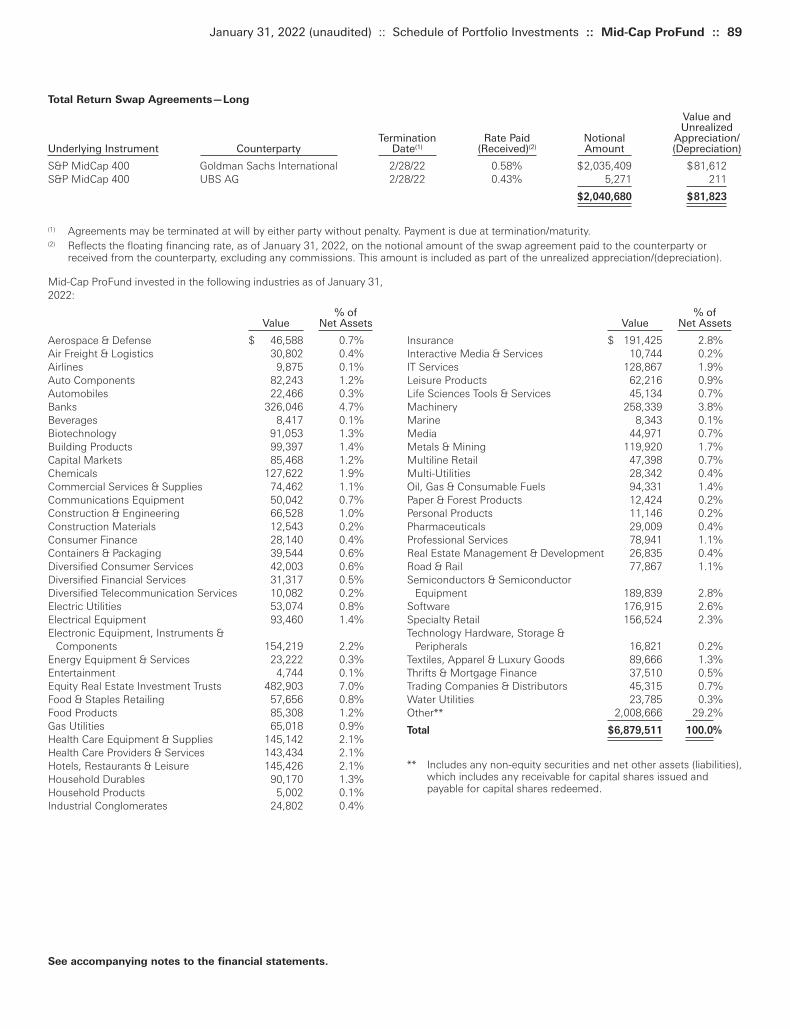
% ofValue Net Assets
Insurance $ 191,425 2.8%Interactive Media & Services 10,744 0.2%IT Services 128,867 1.9%Leisure Products 62,216 0.9%Life Sciences Tools & Services 45,134 0.7%Machinery 258,339 3.8%Marine 8,343 0.1%Media 44,971 0.7%Metals & Mining 119,920 1.7%Multiline Retail 47,398 0.7%Multi-Utilities 28,342 0.4%Oil, Gas & Consumable Fuels 94,331 1.4%Paper & Forest Products 12,424 0.2%Personal Products 11,146 0.2%Pharmaceuticals 29,009 0.4%Professional Services 78,941 1.1%Real Estate Management & Development 26,835 0.4%Road & Rail 77,867 1.1%Semiconductors & Semiconductor
Equipment 189,839 2.8%Software 176,915 2.6%Specialty Retail 156,524 2.3%Technology Hardware, Storage &
Peripherals 16,821 0.2%Textiles, Apparel & Luxury Goods 89,666 1.3%Thrifts & Mortgage Finance 37,510 0.5%Trading Companies & Distributors 45,315 0.7%Water Utilities 23,785 0.3%Other** 2,008,666 29.2%
Total $6,879,511 100.0%
** Includes any non-equity securities and net other assets (liabilities),which includes any receivable for capital shares issued andpayable for capital shares redeemed.
Mid-Cap ProFund invested in the following industries as of January 31,2022:
% ofValue Net Assets
Aerospace & Defense $ 46,588 0.7%Air Freight & Logistics 30,802 0.4%Airlines 9,875 0.1%Auto Components 82,243 1.2%Automobiles 22,466 0.3%Banks 326,046 4.7%Beverages 8,417 0.1%Biotechnology 91,053 1.3%Building Products 99,397 1.4%Capital Markets 85,468 1.2%Chemicals 127,622 1.9%Commercial Services & Supplies 74,462 1.1%Communications Equipment 50,042 0.7%Construction & Engineering 66,528 1.0%Construction Materials 12,543 0.2%Consumer Finance 28,140 0.4%Containers & Packaging 39,544 0.6%Diversified Consumer Services 42,003 0.6%Diversified Financial Services 31,317 0.5%Diversified Telecommunication Services 10,082 0.2%Electric Utilities 53,074 0.8%Electrical Equipment 93,460 1.4%Electronic Equipment, Instruments &
Components 154,219 2.2%Energy Equipment & Services 23,222 0.3%Entertainment 4,744 0.1%Equity Real Estate Investment Trusts 482,903 7.0%Food & Staples Retailing 57,656 0.8%Food Products 85,308 1.2%Gas Utilities 65,018 0.9%Health Care Equipment & Supplies 145,142 2.1%Health Care Providers & Services 143,434 2.1%Hotels, Restaurants & Leisure 145,426 2.1%Household Durables 90,170 1.3%Household Products 5,002 0.1%Industrial Conglomerates 24,802 0.4%
January 31, 2022 (unaudited) :: Schedule of Portfolio Investments :: Mid-Cap ProFund :: 89
See accompanying notes to the financial statements.
Total Return Swap Agreements—Long
Value andUnrealized
Termination Rate Paid Notional Appreciation/Underlying Instrument Counterparty Date(1) (Received)(2) Amount (Depreciation)
S&P MidCap 400 Goldman Sachs International 2/28/22 0.58% $2,035,409 $81,612S&P MidCap 400 UBS AG 2/28/22 0.43% 5,271 211
$2,040,680 $81,823
(1) Agreements may be terminated at will by either party without penalty. Payment is due at termination/maturity.(2) Reflects the floating financing rate, as of January 31, 2022, on the notional amount of the swap agreement paid to the counterparty or
received from the counterparty, excluding any commissions. This amount is included as part of the unrealized appreciation/(depreciation).
Toppan Merrill - ProFunds Public Semi-Annual Report [Funds] 01-31-2022 ED [AUX] | akiesli | 29-Mar-22 08:43 | 22-1296-2.de | Sequence: 22CHKSUM Content: 49423 Layout: 64174 Graphics: 0 CLEAN
JOB: 22-1296-2 CYCLE#;BL#: 8; 0 TRIM: 8.25" x 10.75" AS: New York: 212-620-5600COLORS: ~note-color 2, Black, ~note-color 3 GRAPHICS: none V1.5
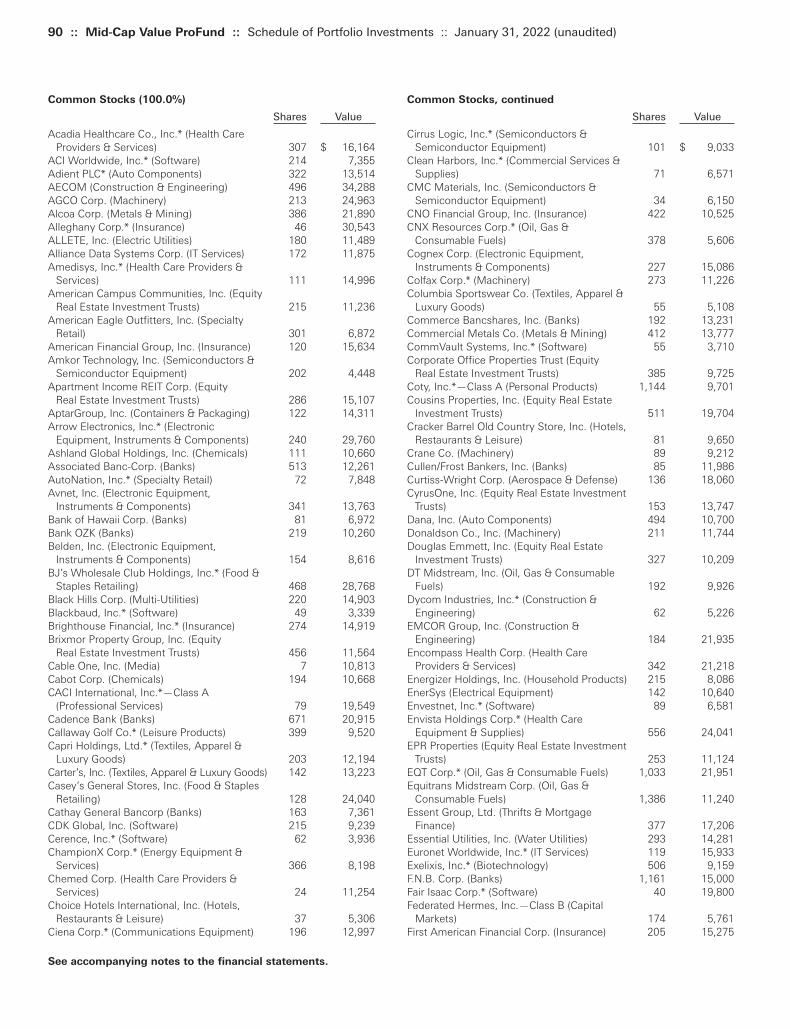
90 :: Mid-Cap Value ProFund :: Schedule of Portfolio Investments :: January 31, 2022 (unaudited)
Common Stocks, continued
Shares Value
Cirrus Logic, Inc.* (Semiconductors & Semiconductor Equipment) 101 $ 9,033
Clean Harbors, Inc.* (Commercial Services & Supplies) 71 6,571
CMC Materials, Inc. (Semiconductors & Semiconductor Equipment) 34 6,150
CNO Financial Group, Inc. (Insurance) 422 10,525CNX Resources Corp.* (Oil, Gas &
Consumable Fuels) 378 5,606Cognex Corp. (Electronic Equipment,
Instruments & Components) 227 15,086Colfax Corp.* (Machinery) 273 11,226Columbia Sportswear Co. (Textiles, Apparel &
Luxury Goods) 55 5,108Commerce Bancshares, Inc. (Banks) 192 13,231Commercial Metals Co. (Metals & Mining) 412 13,777CommVault Systems, Inc.* (Software) 55 3,710Corporate Office Properties Trust (Equity
Real Estate Investment Trusts) 385 9,725Coty, Inc.*—Class A (Personal Products) 1,144 9,701Cousins Properties, Inc. (Equity Real Estate
Investment Trusts) 511 19,704Cracker Barrel Old Country Store, Inc. (Hotels,
Restaurants & Leisure) 81 9,650Crane Co. (Machinery) 89 9,212Cullen/Frost Bankers, Inc. (Banks) 85 11,986Curtiss-Wright Corp. (Aerospace & Defense) 136 18,060CyrusOne, Inc. (Equity Real Estate Investment
Trusts) 153 13,747Dana, Inc. (Auto Components) 494 10,700Donaldson Co., Inc. (Machinery) 211 11,744Douglas Emmett, Inc. (Equity Real Estate
Investment Trusts) 327 10,209DT Midstream, Inc. (Oil, Gas & Consumable
Fuels) 192 9,926Dycom Industries, Inc.* (Construction &
Engineering) 62 5,226EMCOR Group, Inc. (Construction &
Engineering) 184 21,935Encompass Health Corp. (Health Care
Providers & Services) 342 21,218Energizer Holdings, Inc. (Household Products) 215 8,086EnerSys (Electrical Equipment) 142 10,640Envestnet, Inc.* (Software) 89 6,581Envista Holdings Corp.* (Health Care
Equipment & Supplies) 556 24,041EPR Properties (Equity Real Estate Investment
Trusts) 253 11,124EQT Corp.* (Oil, Gas & Consumable Fuels) 1,033 21,951Equitrans Midstream Corp. (Oil, Gas &
Consumable Fuels) 1,386 11,240Essent Group, Ltd. (Thrifts & Mortgage
Finance) 377 17,206Essential Utilities, Inc. (Water Utilities) 293 14,281Euronet Worldwide, Inc.* (IT Services) 119 15,933Exelixis, Inc.* (Biotechnology) 506 9,159F.N.B. Corp. (Banks) 1,161 15,000Fair Isaac Corp.* (Software) 40 19,800Federated Hermes, Inc.—Class B (Capital
Markets) 174 5,761First American Financial Corp. (Insurance) 205 15,275
Common Stocks (100.0%)
Shares Value
Acadia Healthcare Co., Inc.* (Health Care Providers & Services) 307 $ 16,164
ACI Worldwide, Inc.* (Software) 214 7,355Adient PLC* (Auto Components) 322 13,514AECOM (Construction & Engineering) 496 34,288AGCO Corp. (Machinery) 213 24,963Alcoa Corp. (Metals & Mining) 386 21,890Alleghany Corp.* (Insurance) 46 30,543ALLETE, Inc. (Electric Utilities) 180 11,489Alliance Data Systems Corp. (IT Services) 172 11,875Amedisys, Inc.* (Health Care Providers &
Services) 111 14,996American Campus Communities, Inc. (Equity
Real Estate Investment Trusts) 215 11,236American Eagle Outfitters, Inc. (Specialty
Retail) 301 6,872American Financial Group, Inc. (Insurance) 120 15,634Amkor Technology, Inc. (Semiconductors &
Semiconductor Equipment) 202 4,448Apartment Income REIT Corp. (Equity
Real Estate Investment Trusts) 286 15,107AptarGroup, Inc. (Containers & Packaging) 122 14,311Arrow Electronics, Inc.* (Electronic
Equipment, Instruments & Components) 240 29,760Ashland Global Holdings, Inc. (Chemicals) 111 10,660Associated Banc-Corp. (Banks) 513 12,261AutoNation, Inc.* (Specialty Retail) 72 7,848Avnet, Inc. (Electronic Equipment,
Instruments & Components) 341 13,763Bank of Hawaii Corp. (Banks) 81 6,972Bank OZK (Banks) 219 10,260Belden, Inc. (Electronic Equipment,
Instruments & Components) 154 8,616BJ’s Wholesale Club Holdings, Inc.* (Food &
Staples Retailing) 468 28,768Black Hills Corp. (Multi-Utilities) 220 14,903Blackbaud, Inc.* (Software) 49 3,339Brighthouse Financial, Inc.* (Insurance) 274 14,919Brixmor Property Group, Inc. (Equity
Real Estate Investment Trusts) 456 11,564Cable One, Inc. (Media) 7 10,813Cabot Corp. (Chemicals) 194 10,668CACI International, Inc.*—Class A
(Professional Services) 79 19,549Cadence Bank (Banks) 671 20,915Callaway Golf Co.* (Leisure Products) 399 9,520Capri Holdings, Ltd.* (Textiles, Apparel &
Luxury Goods) 203 12,194Carter’s, Inc. (Textiles, Apparel & Luxury Goods) 142 13,223Casey’s General Stores, Inc. (Food & Staples
Retailing) 128 24,040Cathay General Bancorp (Banks) 163 7,361CDK Global, Inc. (Software) 215 9,239Cerence, Inc.* (Software) 62 3,936ChampionX Corp.* (Energy Equipment &
Services) 366 8,198Chemed Corp. (Health Care Providers &
Services) 24 11,254Choice Hotels International, Inc. (Hotels,
Restaurants & Leisure) 37 5,306Ciena Corp.* (Communications Equipment) 196 12,997
See accompanying notes to the financial statements.
Toppan Merrill - ProFunds Public Semi-Annual Report [Funds] 01-31-2022 ED [AUX] | akiesli | 29-Mar-22 08:43 | 22-1296-2.de | Sequence: 23CHKSUM Content: 18793 Layout: 26139 Graphics: 0 CLEAN
JOB: 22-1296-2 CYCLE#;BL#: 8; 0 TRIM: 8.25" x 10.75" AS: New York: 212-620-5600COLORS: ~note-color 2, Black, ~note-color 3 GRAPHICS: none V1.5

Common Stocks, continued
Shares Value
Iridium Communications, Inc.* (Diversified Telecommunication Services) 213 $ 7,642
ITT, Inc. (Machinery) 128 11,766Jabil, Inc. (Electronic Equipment,
Instruments & Components) 277 17,033Jack in the Box, Inc. (Hotels, Restaurants &
Leisure) 24 2,185Janus Henderson Group PLC (Capital Markets) 314 11,587Jazz Pharmaceuticals PLC* (Pharmaceuticals) 214 29,727JBG Smith Properties (Equity Real Estate
Investment Trusts) 393 10,768JetBlue Airways Corp.* (Airlines) 1,086 15,888John Wiley & Sons, Inc.—Class A (Media) 74 3,756Jones Lang LaSalle, Inc.* (Real Estate
Management & Development) 89 22,320KB Home (Household Durables) 294 12,422KBR, Inc. (Professional Services) 169 7,335Kemper Corp. (Insurance) 208 12,476Kennametal, Inc. (Machinery) 287 9,922Kilroy Realty Corp. (Equity Real Estate
Investment Trusts) 361 23,104Kirby Corp.* (Marine) 208 13,557Kite Realty Group Trust (Equity Real Estate
Investment Trusts) 751 15,681Knight-Swift Transportation Holdings, Inc.
(Road & Rail) 569 32,194Kohl’s Corp. (Multiline Retail) 518 30,931Kyndryl Holdings, Inc.* (IT Services) 608 10,263Lamar Advertising Co.—Class A (Equity
Real Estate Investment Trusts) 101 11,187Lancaster Colony Corp. (Food Products) 37 5,874Landstar System, Inc. (Road & Rail) 45 7,200Lear Corp. (Auto Components) 208 34,802Leggett & Platt, Inc. (Household Durables) 458 18,251Lennox International, Inc. (Building Products) 49 13,897LHC Group, Inc.* (Health Care Providers &
Services) 109 13,527Lincoln Electric Holdings, Inc. (Machinery) 83 10,611Lithia Motors, Inc. (Specialty Retail) 103 30,089Littelfuse, Inc. (Electronic Equipment,
Instruments & Components) 34 9,179LivaNova PLC* (Health Care Equipment &
Supplies) 73 5,483Lumentum Holdings, Inc.* (Communications
Equipment) 136 13,801Macy’s, Inc. (Multiline Retail) 1,064 27,238ManpowerGroup, Inc. (Professional Services) 188 19,715Marriott Vacations Worldwide Corp. (Hotels,
Restaurants & Leisure) 81 13,153MasTec, Inc.* (Construction & Engineering) 97 8,355MDU Resources Group, Inc. (Multi-Utilities) 697 20,470Medical Properties Trust, Inc. (Equity
Real Estate Investment Trusts) 2,043 46,498Mercury General Corp. (Insurance) 92 5,029Mercury Systems, Inc.* (Aerospace & Defense) 194 11,042MGIC Investment Corp. (Thrifts & Mortgage
Finance) 1,115 16,926MillerKnoll, Inc. (Commercial Services &
Supplies) 261 10,080Minerals Technologies, Inc. (Chemicals) 115 8,047
Common Stocks, continued
Shares Value
First Horizon Corp. (Banks) 1,850 $ 31,653First Industrial Realty Trust, Inc. (Equity
Real Estate Investment Trusts) 138 8,388First Solar, Inc.* (Semiconductors &
Semiconductor Equipment) 139 10,895FirstCash Holdings, Inc. (Consumer Finance) 138 9,619Flowers Foods, Inc. (Food Products) 681 19,157Flowserve Corp. (Machinery) 446 14,549Fluor Corp.* (Construction & Engineering) 483 10,162Foot Locker, Inc. (Specialty Retail) 307 13,717Fulton Financial Corp. (Banks) 550 9,873GATX Corp. (Trading Companies & Distributors) 122 12,743Genpact, Ltd. (IT Services) 203 10,099Gentex Corp. (Auto Components) 383 12,026Globus Medical, Inc.* (Health Care
Equipment & Supplies) 109 7,274Graco, Inc. (Machinery) 234 16,979Graham Holdings Co.—Class B (Diversified
Consumer Services) 13 7,737Grand Canyon Education, Inc.* (Diversified
Consumer Services) 136 11,380Greif, Inc.—Class A (Containers & Packaging) 92 5,443Grocery Outlet Holding Corp.* (Food &
Staples Retailing) 296 7,512H&R Block, Inc. (Diversified Consumer
Services) 324 7,407Haemonetics Corp.* (Health Care
Equipment & Supplies) 175 8,461Hancock Whitney Corp. (Banks) 165 8,699Hanesbrands, Inc. (Textiles, Apparel &
Luxury Goods) 1,193 19,207Harley-Davidson, Inc. (Automobiles) 525 18,149Hawaiian Electric Industries, Inc. (Electric
Utilities) 373 15,853Healthcare Realty Trust, Inc. (Equity
Real Estate Investment Trusts) 268 8,313HealthEquity, Inc.* (Health Care Providers &
Services) 95 5,077Hexcel Corp.* (Aerospace & Defense) 288 15,025Highwoods Properties, Inc. (Equity
Real Estate Investment Trusts) 357 15,394HollyFrontier Corp. (Oil, Gas & Consumable
Fuels) 511 17,967Home BancShares, Inc. (Banks) 325 7,657Hubbell, Inc. (Electrical Equipment) 85 15,920Hudson Pacific Properties, Inc. (Equity
Real Estate Investment Trusts) 517 12,217IAA, Inc.* (Commercial Services & Supplies) 214 9,829ICU Medical, Inc.* (Health Care Equipment &
Supplies) 37 7,894IDACORP, Inc. (Electric Utilities) 174 19,178II-VI, Inc.* (Electronic Equipment,
Instruments & Components) 190 12,046Ingevity Corp.* (Chemicals) 62 4,086Ingredion, Inc. (Food Products) 230 21,781Integra LifeSciences Holdings Corp.*
(Health Care Equipment & Supplies) 123 7,963Interactive Brokers Group, Inc. (Capital
Markets) 115 7,842International Bancshares Corp. (Banks) 181 7,607
January 31, 2022 (unaudited) :: Schedule of Portfolio Investments :: Mid-Cap Value ProFund :: 91
See accompanying notes to the financial statements.
Toppan Merrill - ProFunds Public Semi-Annual Report [Funds] 01-31-2022 ED [AUX] | akiesli | 29-Mar-22 08:43 | 22-1296-2.de | Sequence: 24CHKSUM Content: 6308 Layout: 28542 Graphics: 0 CLEAN
JOB: 22-1296-2 CYCLE#;BL#: 8; 0 TRIM: 8.25" x 10.75" AS: New York: 212-620-5600COLORS: ~note-color 2, Black, ~note-color 3 GRAPHICS: none V1.5

92 :: Mid-Cap Value ProFund :: Schedule of Portfolio Investments :: January 31, 2022 (unaudited)
Common Stocks, continued
Shares Value
Prosperity Bancshares, Inc. (Banks) 316 $ 23,146PS Business Parks, Inc. (Equity Real Estate
Investment Trusts) 26 4,341R1 RCM, Inc.* (Health Care Providers &
Services) 190 4,518Rayonier, Inc. (Equity Real Estate Investment
Trusts) 195 7,125Regal Rexnord Corp. (Electrical Equipment) 136 21,554Reinsurance Group of America, Inc. (Insurance) 233 26,755Reliance Steel & Aluminum Co. (Metals &
Mining) 217 33,174RenaissanceRe Holdings, Ltd. (Insurance) 159 24,990RLI Corp. (Insurance) 55 5,763Royal Gold, Inc. (Metals & Mining) 92 9,343RPM International, Inc. (Chemicals) 219 19,405Ryder System, Inc. (Road & Rail) 184 13,467Sabra Health Care REIT, Inc. (Equity
Real Estate Investment Trusts) 779 10,602Sabre Corp.* (IT Services) 566 5,179Sanderson Farms, Inc. (Food Products) 40 7,360Science Applications International Corp.
(Professional Services) 197 16,160SEI Investments Co. (Capital Markets) 151 8,850Selective Insurance Group, Inc. (Insurance) 209 16,490Semtech Corp.* (Semiconductors &
Semiconductor Equipment) 74 5,261Sensient Technologies Corp. (Chemicals) 62 5,254Silgan Holdings, Inc. (Containers & Packaging) 288 12,897Six Flags Entertainment Corp.* (Hotels,
Restaurants & Leisure) 135 5,331Skechers U.S.A., Inc.*—Class A (Textiles,
Apparel & Luxury Goods) 243 10,206SL Green Realty Corp. (Equity Real Estate
Investment Trusts) 233 16,897Sonoco Products Co. (Containers & Packaging) 337 19,087Southwest Gas Holdings, Inc. (Gas Utilities) 211 14,386Spire, Inc. (Gas Utilities) 176 11,602Spirit Realty Capital, Inc. (Equity Real Estate
Investment Trusts) 421 19,981Sprouts Farmers Market, Inc.* (Food &
Staples Retailing) 384 10,422Stericycle, Inc.* (Commercial Services &
Supplies) 314 18,444STORE Capital Corp. (Equity Real Estate
Investment Trusts) 842 26,700Sunrun, Inc.* (Electrical Equipment) 709 18,384Synovus Financial Corp. (Banks) 298 14,828Taylor Morrison Home Corp.* (Household
Durables) 418 12,828TD SYNNEX Corp. (Electronic Equipment,
Instruments & Components) 139 14,535TEGNA, Inc. (Media) 422 8,170Terex Corp. (Machinery) 239 9,971Texas Capital Bancshares, Inc.* (Banks) 174 10,910Texas Roadhouse, Inc. (Hotels, Restaurants &
Leisure) 96 8,197The Boston Beer Co., Inc.*—Class A
(Beverages) 12 5,050The Brink’s Co. (Commercial Services &
Supplies) 170 11,863The Chemours Co. (Chemicals) 560 18,318
Common Stocks, continued
Shares Value
MKS Instruments, Inc. (Semiconductors & Semiconductor Equipment) 85 $ 13,203
Molina Healthcare, Inc.* (Health Care Providers & Services) 102 29,628
MSA Safety, Inc. (Commercial Services & Supplies) 61 8,381
MSC Industrial Direct Co., Inc. (Trading Companies & Distributors) 163 13,307
Murphy USA, Inc. (Specialty Retail) 81 15,929National Fuel Gas Co. (Gas Utilities) 152 9,231National Instruments Corp. (Electronic
Equipment, Instruments & Components) 214 8,821National Retail Properties, Inc. (Equity
Real Estate Investment Trusts) 331 14,690NCR Corp.* (Technology Hardware, Storage &
Peripherals) 455 17,317Neogen Corp.* (Health Care Equipment &
Supplies) 155 5,653New Jersey Resources Corp. (Gas Utilities) 331 13,310New York Community Bancorp, Inc. (Thrifts &
Mortgage Finance) 1,592 18,563NewMarket Corp. (Chemicals) 24 8,114Nordson Corp. (Machinery) 74 17,208Nordstrom, Inc.* (Multiline Retail) 380 8,550NorthWestern Corp. (Multi-Utilities) 180 10,462NOV, Inc. (Energy Equipment & Services) 1,334 21,905Nu Skin Enterprises, Inc.—Class A (Personal
Products) 172 8,289NuVasive, Inc.* (Health Care Equipment &
Supplies) 179 9,310nVent Electric PLC (Electrical Equipment) 236 8,163OGE Energy Corp. (Electric Utilities) 430 16,306Old Republic International Corp. (Insurance) 976 25,015Ollie’s Bargain Outlet Holdings, Inc.*
(Multiline Retail) 211 10,115Omega Healthcare Investors, Inc. (Equity
Real Estate Investment Trusts) 818 25,751ONE Gas, Inc. (Gas Utilities) 184 14,332Oshkosh Corp. (Machinery) 237 26,972Owens Corning (Building Products) 345 30,602Park Hotels & Resorts, Inc.* (Equity Real Estate
Investment Trusts) 805 14,651Patterson Cos., Inc. (Health Care Providers &
Services) 295 8,464Pebblebrook Hotel Trust (Equity Real Estate
Investment Trusts) 449 9,721Performance Food Group Co.* (Food &
Staples Retailing) 529 22,319Perrigo Co. PLC (Pharmaceuticals) 459 17,474Physicians Realty Trust (Equity Real Estate
Investment Trusts) 753 13,750Pilgrim’s Pride Corp.* (Food Products) 167 4,671PNM Resources, Inc. (Electric Utilities) 296 13,264Polaris, Inc. (Leisure Products) 111 12,498Post Holdings, Inc.* (Food Products) 203 21,481PotlatchDeltic Corp. (Equity Real Estate
Investment Trusts) 128 6,885Primerica, Inc. (Insurance) 50 7,717PROG Holdings, Inc.* (Consumer Finance) 193 7,683Progyny, Inc.* (Health Care Providers &
Services) 92 3,726
See accompanying notes to the financial statements.
Toppan Merrill - ProFunds Public Semi-Annual Report [Funds] 01-31-2022 ED [AUX] | akiesli | 29-Mar-22 08:43 | 22-1296-2.de | Sequence: 25CHKSUM Content: 13814 Layout: 26139 Graphics: 0 CLEAN
JOB: 22-1296-2 CYCLE#;BL#: 8; 0 TRIM: 8.25" x 10.75" AS: New York: 212-620-5600COLORS: ~note-color 2, Black, ~note-color 3 GRAPHICS: none V1.5
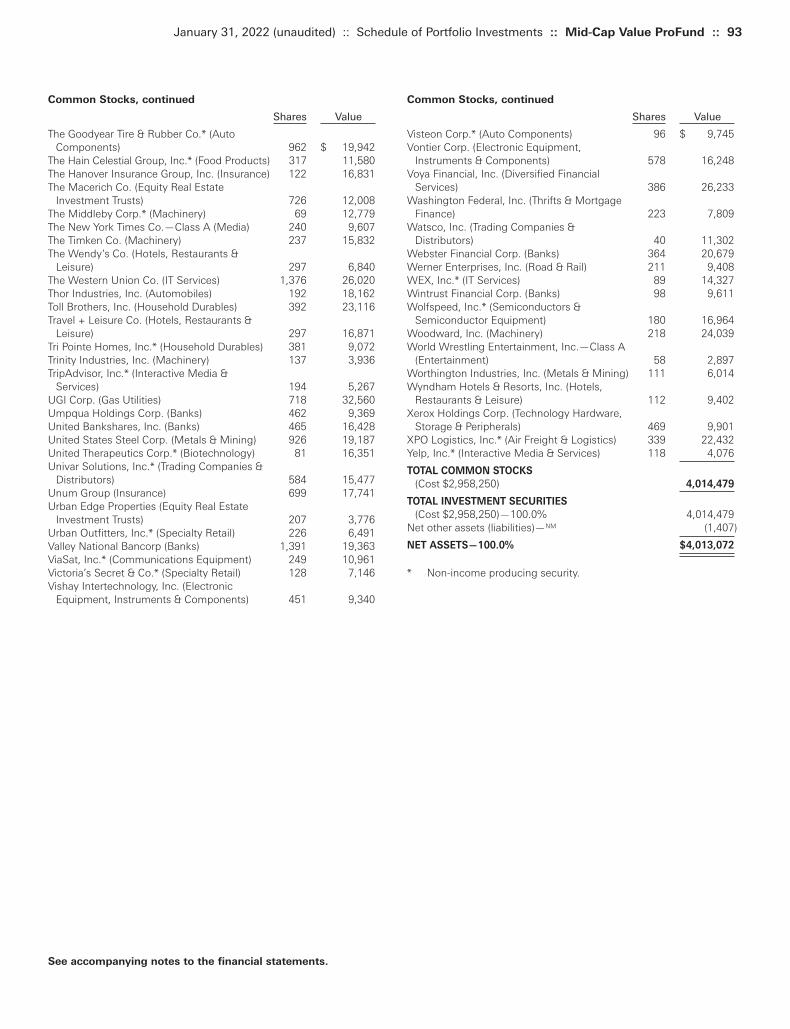
Common Stocks, continued
Shares Value
Visteon Corp.* (Auto Components) 96 $ 9,745Vontier Corp. (Electronic Equipment,
Instruments & Components) 578 16,248Voya Financial, Inc. (Diversified Financial
Services) 386 26,233Washington Federal, Inc. (Thrifts & Mortgage
Finance) 223 7,809Watsco, Inc. (Trading Companies &
Distributors) 40 11,302Webster Financial Corp. (Banks) 364 20,679Werner Enterprises, Inc. (Road & Rail) 211 9,408WEX, Inc.* (IT Services) 89 14,327Wintrust Financial Corp. (Banks) 98 9,611Wolfspeed, Inc.* (Semiconductors &
Semiconductor Equipment) 180 16,964Woodward, Inc. (Machinery) 218 24,039World Wrestling Entertainment, Inc.—Class A
(Entertainment) 58 2,897Worthington Industries, Inc. (Metals & Mining) 111 6,014Wyndham Hotels & Resorts, Inc. (Hotels,
Restaurants & Leisure) 112 9,402Xerox Holdings Corp. (Technology Hardware,
Storage & Peripherals) 469 9,901XPO Logistics, Inc.* (Air Freight & Logistics) 339 22,432Yelp, Inc.* (Interactive Media & Services) 118 4,076
TOTAL COMMON STOCKS
(Cost $2,958,250) 4,014,479
TOTAL INVESTMENT SECURITIES
(Cost $2,958,250)—100.0% 4,014,479Net other assets (liabilities)—NM (1,407)
NET ASSETS—100.0% $4,013,072
* Non-income producing security.
Common Stocks, continued
Shares Value
The Goodyear Tire & Rubber Co.* (Auto Components) 962 $ 19,942
The Hain Celestial Group, Inc.* (Food Products) 317 11,580The Hanover Insurance Group, Inc. (Insurance) 122 16,831The Macerich Co. (Equity Real Estate
Investment Trusts) 726 12,008The Middleby Corp.* (Machinery) 69 12,779The New York Times Co.—Class A (Media) 240 9,607The Timken Co. (Machinery) 237 15,832The Wendy’s Co. (Hotels, Restaurants &
Leisure) 297 6,840The Western Union Co. (IT Services) 1,376 26,020Thor Industries, Inc. (Automobiles) 192 18,162Toll Brothers, Inc. (Household Durables) 392 23,116Travel + Leisure Co. (Hotels, Restaurants &
Leisure) 297 16,871Tri Pointe Homes, Inc.* (Household Durables) 381 9,072Trinity Industries, Inc. (Machinery) 137 3,936TripAdvisor, Inc.* (Interactive Media &
Services) 194 5,267UGI Corp. (Gas Utilities) 718 32,560Umpqua Holdings Corp. (Banks) 462 9,369United Bankshares, Inc. (Banks) 465 16,428United States Steel Corp. (Metals & Mining) 926 19,187United Therapeutics Corp.* (Biotechnology) 81 16,351Univar Solutions, Inc.* (Trading Companies &
Distributors) 584 15,477Unum Group (Insurance) 699 17,741Urban Edge Properties (Equity Real Estate
Investment Trusts) 207 3,776Urban Outfitters, Inc.* (Specialty Retail) 226 6,491Valley National Bancorp (Banks) 1,391 19,363ViaSat, Inc.* (Communications Equipment) 249 10,961Victoria’s Secret & Co.* (Specialty Retail) 128 7,146Vishay Intertechnology, Inc. (Electronic
Equipment, Instruments & Components) 451 9,340
January 31, 2022 (unaudited) :: Schedule of Portfolio Investments :: Mid-Cap Value ProFund :: 93
See accompanying notes to the financial statements.
Toppan Merrill - ProFunds Public Semi-Annual Report [Funds] 01-31-2022 ED [AUX] | akiesli | 29-Mar-22 08:43 | 22-1296-2.de | Sequence: 26CHKSUM Content: 4986 Layout: 22315 Graphics: 0 CLEAN
JOB: 22-1296-2 CYCLE#;BL#: 8; 0 TRIM: 8.25" x 10.75" AS: New York: 212-620-5600COLORS: ~note-color 2, Black, ~note-color 3 GRAPHICS: none V1.5
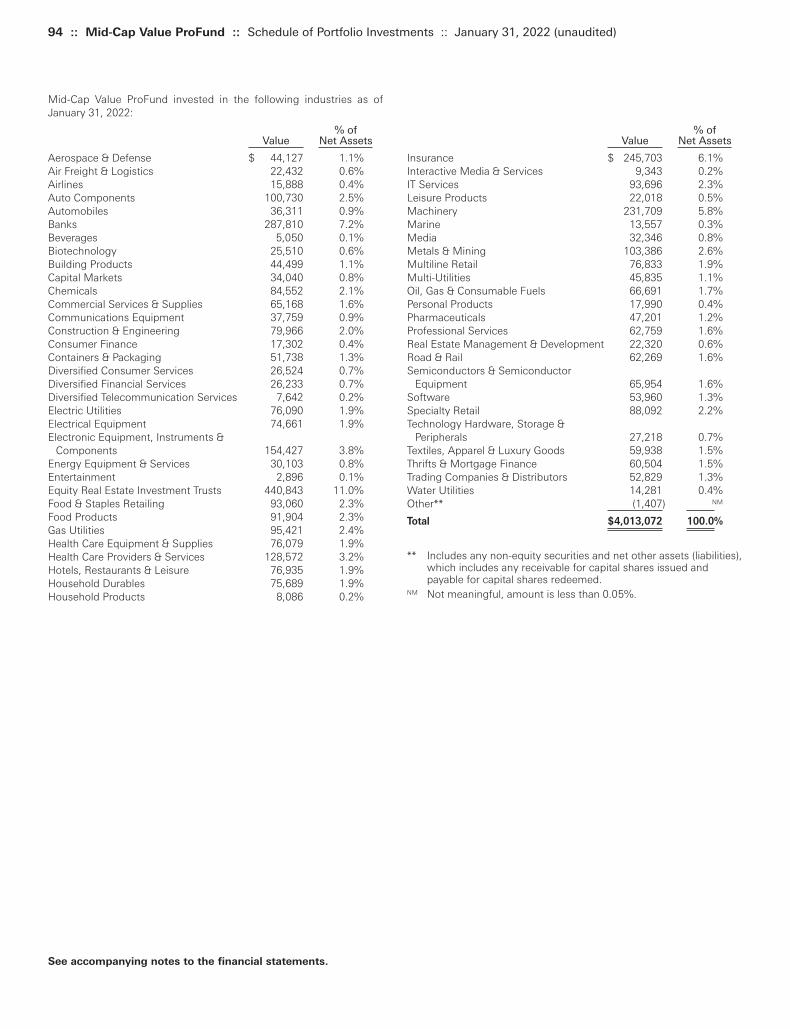
94 :: Mid-Cap Value ProFund :: Schedule of Portfolio Investments :: January 31, 2022 (unaudited)
% ofValue Net Assets
Insurance $ 245,703 6.1%Interactive Media & Services 9,343 0.2%IT Services 93,696 2.3%Leisure Products 22,018 0.5%Machinery 231,709 5.8%Marine 13,557 0.3%Media 32,346 0.8%Metals & Mining 103,386 2.6%Multiline Retail 76,833 1.9%Multi-Utilities 45,835 1.1%Oil, Gas & Consumable Fuels 66,691 1.7%Personal Products 17,990 0.4%Pharmaceuticals 47,201 1.2%Professional Services 62,759 1.6%Real Estate Management & Development 22,320 0.6%Road & Rail 62,269 1.6%Semiconductors & Semiconductor
Equipment 65,954 1.6%Software 53,960 1.3%Specialty Retail 88,092 2.2%Technology Hardware, Storage &
Peripherals 27,218 0.7%Textiles, Apparel & Luxury Goods 59,938 1.5%Thrifts & Mortgage Finance 60,504 1.5%Trading Companies & Distributors 52,829 1.3%Water Utilities 14,281 0.4%Other** (1,407) NM
Total $4,013,072 100.0%
** Includes any non-equity securities and net other assets (liabilities),which includes any receivable for capital shares issued andpayable for capital shares redeemed.
NM Not meaningful, amount is less than 0.05%.
Mid-Cap Value ProFund invested in the following industries as ofJanuary 31, 2022:
% ofValue Net Assets
Aerospace & Defense $ 44,127 1.1%Air Freight & Logistics 22,432 0.6%Airlines 15,888 0.4%Auto Components 100,730 2.5%Automobiles 36,311 0.9%Banks 287,810 7.2%Beverages 5,050 0.1%Biotechnology 25,510 0.6%Building Products 44,499 1.1%Capital Markets 34,040 0.8%Chemicals 84,552 2.1%Commercial Services & Supplies 65,168 1.6%Communications Equipment 37,759 0.9%Construction & Engineering 79,966 2.0%Consumer Finance 17,302 0.4%Containers & Packaging 51,738 1.3%Diversified Consumer Services 26,524 0.7%Diversified Financial Services 26,233 0.7%Diversified Telecommunication Services 7,642 0.2%Electric Utilities 76,090 1.9%Electrical Equipment 74,661 1.9%Electronic Equipment, Instruments &
Components 154,427 3.8%Energy Equipment & Services 30,103 0.8%Entertainment 2,896 0.1%Equity Real Estate Investment Trusts 440,843 11.0%Food & Staples Retailing 93,060 2.3%Food Products 91,904 2.3%Gas Utilities 95,421 2.4%Health Care Equipment & Supplies 76,079 1.9%Health Care Providers & Services 128,572 3.2%Hotels, Restaurants & Leisure 76,935 1.9%Household Durables 75,689 1.9%Household Products 8,086 0.2%
See accompanying notes to the financial statements.
Toppan Merrill - ProFunds Public Semi-Annual Report [Funds] 01-31-2022 ED [AUX] | akiesli | 29-Mar-22 08:43 | 22-1296-2.de | Sequence: 27CHKSUM Content: 5770 Layout: 62293 Graphics: 0 CLEAN
JOB: 22-1296-2 CYCLE#;BL#: 8; 0 TRIM: 8.25" x 10.75" AS: New York: 212-620-5600COLORS: ~note-color 2, Black, ~note-color 3 GRAPHICS: none V1.5
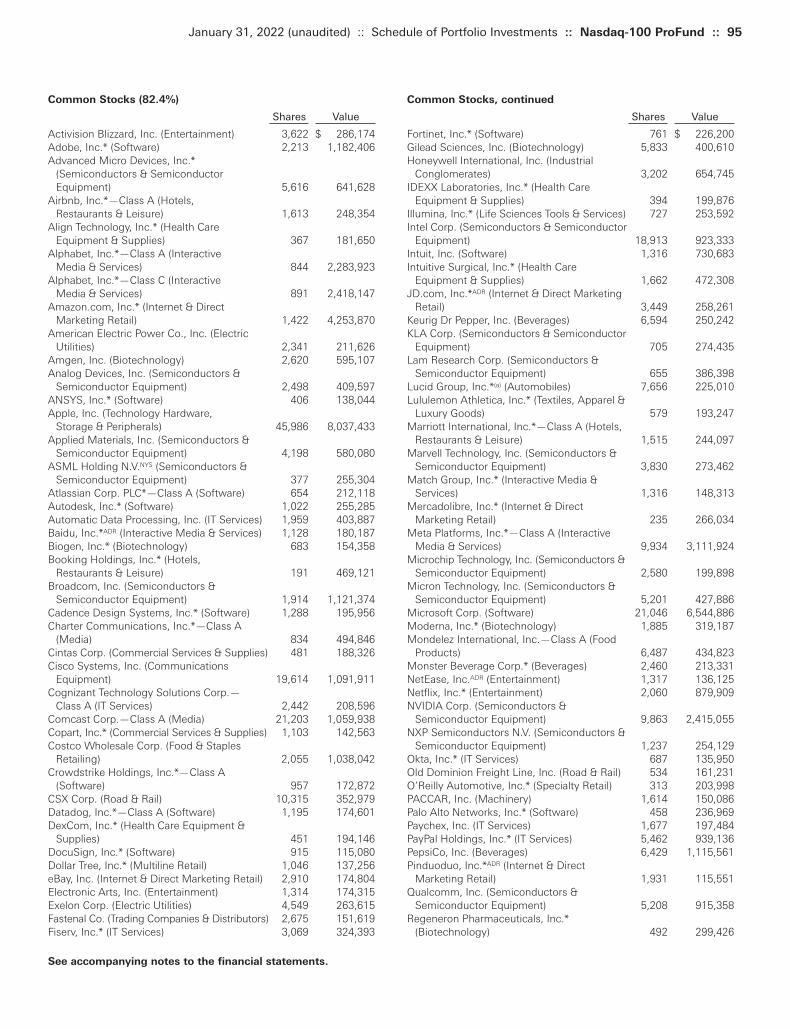
Common Stocks, continued
Shares Value
Fortinet, Inc.* (Software) 761 $ 226,200Gilead Sciences, Inc. (Biotechnology) 5,833 400,610Honeywell International, Inc. (Industrial
Conglomerates) 3,202 654,745IDEXX Laboratories, Inc.* (Health Care
Equipment & Supplies) 394 199,876Illumina, Inc.* (Life Sciences Tools & Services) 727 253,592Intel Corp. (Semiconductors & Semiconductor
Equipment) 18,913 923,333Intuit, Inc. (Software) 1,316 730,683Intuitive Surgical, Inc.* (Health Care
Equipment & Supplies) 1,662 472,308JD.com, Inc.*ADR (Internet & Direct Marketing
Retail) 3,449 258,261Keurig Dr Pepper, Inc. (Beverages) 6,594 250,242KLA Corp. (Semiconductors & Semiconductor
Equipment) 705 274,435Lam Research Corp. (Semiconductors &
Semiconductor Equipment) 655 386,398Lucid Group, Inc.*(a) (Automobiles) 7,656 225,010Lululemon Athletica, Inc.* (Textiles, Apparel &
Luxury Goods) 579 193,247Marriott International, Inc.*—Class A (Hotels,
Restaurants & Leisure) 1,515 244,097Marvell Technology, Inc. (Semiconductors &
Semiconductor Equipment) 3,830 273,462Match Group, Inc.* (Interactive Media &
Services) 1,316 148,313Mercadolibre, Inc.* (Internet & Direct
Marketing Retail) 235 266,034Meta Platforms, Inc.*—Class A (Interactive
Media & Services) 9,934 3,111,924Microchip Technology, Inc. (Semiconductors &
Semiconductor Equipment) 2,580 199,898Micron Technology, Inc. (Semiconductors &
Semiconductor Equipment) 5,201 427,886Microsoft Corp. (Software) 21,046 6,544,886Moderna, Inc.* (Biotechnology) 1,885 319,187Mondelez International, Inc.—Class A (Food
Products) 6,487 434,823Monster Beverage Corp.* (Beverages) 2,460 213,331NetEase, Inc.ADR (Entertainment) 1,317 136,125Netflix, Inc.* (Entertainment) 2,060 879,909NVIDIA Corp. (Semiconductors &
Semiconductor Equipment) 9,863 2,415,055NXP Semiconductors N.V. (Semiconductors &
Semiconductor Equipment) 1,237 254,129Okta, Inc.* (IT Services) 687 135,950Old Dominion Freight Line, Inc. (Road & Rail) 534 161,231O’Reilly Automotive, Inc.* (Specialty Retail) 313 203,998PACCAR, Inc. (Machinery) 1,614 150,086Palo Alto Networks, Inc.* (Software) 458 236,969Paychex, Inc. (IT Services) 1,677 197,484PayPal Holdings, Inc.* (IT Services) 5,462 939,136PepsiCo, Inc. (Beverages) 6,429 1,115,561Pinduoduo, Inc.*ADR (Internet & Direct
Marketing Retail) 1,931 115,551Qualcomm, Inc. (Semiconductors &
Semiconductor Equipment) 5,208 915,358Regeneron Pharmaceuticals, Inc.*
(Biotechnology) 492 299,426
Common Stocks (82.4%)
Shares Value
Activision Blizzard, Inc. (Entertainment) 3,622 $ 286,174Adobe, Inc.* (Software) 2,213 1,182,406Advanced Micro Devices, Inc.*
(Semiconductors & Semiconductor Equipment) 5,616 641,628
Airbnb, Inc.*—Class A (Hotels, Restaurants & Leisure) 1,613 248,354
Align Technology, Inc.* (Health Care Equipment & Supplies) 367 181,650
Alphabet, Inc.*—Class A (Interactive Media & Services) 844 2,283,923
Alphabet, Inc.*—Class C (Interactive Media & Services) 891 2,418,147
Amazon.com, Inc.* (Internet & Direct Marketing Retail) 1,422 4,253,870
American Electric Power Co., Inc. (Electric Utilities) 2,341 211,626
Amgen, Inc. (Biotechnology) 2,620 595,107Analog Devices, Inc. (Semiconductors &
Semiconductor Equipment) 2,498 409,597ANSYS, Inc.* (Software) 406 138,044Apple, Inc. (Technology Hardware,
Storage & Peripherals) 45,986 8,037,433Applied Materials, Inc. (Semiconductors &
Semiconductor Equipment) 4,198 580,080ASML Holding N.V.NYS (Semiconductors &
Semiconductor Equipment) 377 255,304Atlassian Corp. PLC*—Class A (Software) 654 212,118Autodesk, Inc.* (Software) 1,022 255,285Automatic Data Processing, Inc. (IT Services) 1,959 403,887Baidu, Inc.*ADR (Interactive Media & Services) 1,128 180,187Biogen, Inc.* (Biotechnology) 683 154,358Booking Holdings, Inc.* (Hotels,
Restaurants & Leisure) 191 469,121Broadcom, Inc. (Semiconductors &
Semiconductor Equipment) 1,914 1,121,374Cadence Design Systems, Inc.* (Software) 1,288 195,956Charter Communications, Inc.*—Class A
(Media) 834 494,846Cintas Corp. (Commercial Services & Supplies) 481 188,326Cisco Systems, Inc. (Communications
Equipment) 19,614 1,091,911Cognizant Technology Solutions Corp.—
Class A (IT Services) 2,442 208,596Comcast Corp.—Class A (Media) 21,203 1,059,938Copart, Inc.* (Commercial Services & Supplies) 1,103 142,563Costco Wholesale Corp. (Food & Staples
Retailing) 2,055 1,038,042Crowdstrike Holdings, Inc.*—Class A
(Software) 957 172,872CSX Corp. (Road & Rail) 10,315 352,979Datadog, Inc.*—Class A (Software) 1,195 174,601DexCom, Inc.* (Health Care Equipment &
Supplies) 451 194,146DocuSign, Inc.* (Software) 915 115,080Dollar Tree, Inc.* (Multiline Retail) 1,046 137,256eBay, Inc. (Internet & Direct Marketing Retail) 2,910 174,804Electronic Arts, Inc. (Entertainment) 1,314 174,315Exelon Corp. (Electric Utilities) 4,549 263,615Fastenal Co. (Trading Companies & Distributors) 2,675 151,619Fiserv, Inc.* (IT Services) 3,069 324,393
January 31, 2022 (unaudited) :: Schedule of Portfolio Investments :: Nasdaq-100 ProFund :: 95
See accompanying notes to the financial statements.
Toppan Merrill - ProFunds Public Semi-Annual Report [Funds] 01-31-2022 ED [AUX] | akiesli | 29-Mar-22 08:43 | 22-1296-2.de | Sequence: 28CHKSUM Content: 21901 Layout: 45016 Graphics: 0 CLEAN
JOB: 22-1296-2 CYCLE#;BL#: 8; 0 TRIM: 8.25" x 10.75" AS: New York: 212-620-5600COLORS: ~note-color 2, Black, ~note-color 3 GRAPHICS: none V1.5
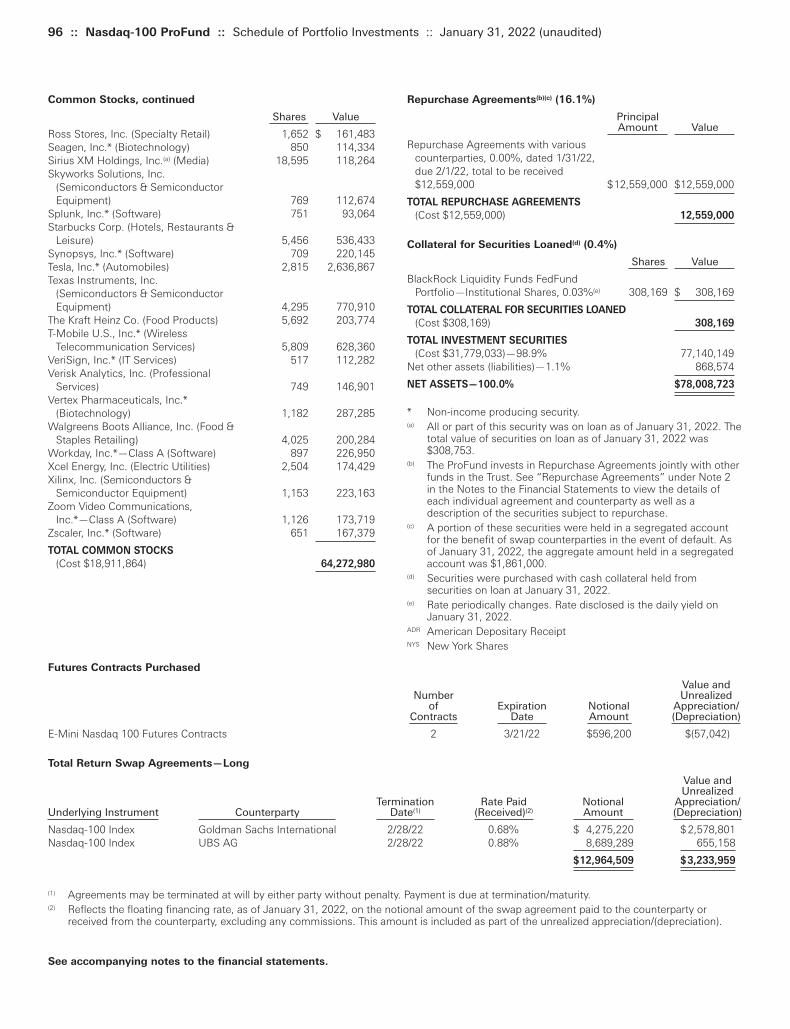
96 :: Nasdaq-100 ProFund :: Schedule of Portfolio Investments :: January 31, 2022 (unaudited)
Repurchase Agreements(b)(c) (16.1%)
PrincipalAmount Value
Repurchase Agreements with various counterparties, 0.00%, dated 1/31/22, due 2/1/22, total to be received $12,559,000 $12,559,000 $12,559,000
TOTAL REPURCHASE AGREEMENTS
(Cost $12,559,000) 12,559,000
Collateral for Securities Loaned(d) (0.4%)
Shares Value
BlackRock Liquidity Funds FedFund Portfolio—Institutional Shares, 0.03%(e) 308,169 $ 308,169
TOTAL COLLATERAL FOR SECURITIES LOANED
(Cost $308,169) 308,169
TOTAL INVESTMENT SECURITIES
(Cost $31,779,033)—98.9% 77,140,149Net other assets (liabilities)—1.1% 868,574
NET ASSETS—100.0% $78,008,723
* Non-income producing security.(a) All or part of this security was on loan as of January 31, 2022. The
total value of securities on loan as of January 31, 2022 was$308,753.
(b) The ProFund invests in Repurchase Agreements jointly with otherfunds in the Trust. See “Repurchase Agreements” under Note 2in the Notes to the Financial Statements to view the details ofeach individual agreement and counterparty as well as adescription of the securities subject to repurchase.
(c) A portion of these securities were held in a segregated accountfor the benefit of swap counterparties in the event of default. Asof January 31, 2022, the aggregate amount held in a segregatedaccount was $1,861,000.
(d) Securities were purchased with cash collateral held fromsecurities on loan at January 31, 2022.
(e) Rate periodically changes. Rate disclosed is the daily yield onJanuary 31, 2022.
ADR American Depositary ReceiptNYS New York Shares
Common Stocks, continued
Shares Value
Ross Stores, Inc. (Specialty Retail) 1,652 $ 161,483Seagen, Inc.* (Biotechnology) 850 114,334Sirius XM Holdings, Inc.(a) (Media) 18,595 118,264Skyworks Solutions, Inc.
(Semiconductors & Semiconductor Equipment) 769 112,674
Splunk, Inc.* (Software) 751 93,064Starbucks Corp. (Hotels, Restaurants &
Leisure) 5,456 536,433Synopsys, Inc.* (Software) 709 220,145Tesla, Inc.* (Automobiles) 2,815 2,636,867Texas Instruments, Inc.
(Semiconductors & Semiconductor Equipment) 4,295 770,910
The Kraft Heinz Co. (Food Products) 5,692 203,774T-Mobile U.S., Inc.* (Wireless
Telecommunication Services) 5,809 628,360VeriSign, Inc.* (IT Services) 517 112,282Verisk Analytics, Inc. (Professional
Services) 749 146,901Vertex Pharmaceuticals, Inc.*
(Biotechnology) 1,182 287,285Walgreens Boots Alliance, Inc. (Food &
Staples Retailing) 4,025 200,284Workday, Inc.*—Class A (Software) 897 226,950Xcel Energy, Inc. (Electric Utilities) 2,504 174,429Xilinx, Inc. (Semiconductors &
Semiconductor Equipment) 1,153 223,163Zoom Video Communications,
Inc.*—Class A (Software) 1,126 173,719Zscaler, Inc.* (Software) 651 167,379
TOTAL COMMON STOCKS
(Cost $18,911,864) 64,272,980
See accompanying notes to the financial statements.
Futures Contracts Purchased
Value and Number Unrealized
of Expiration Notional Appreciation/Contracts Date Amount (Depreciation)
E-Mini Nasdaq 100 Futures Contracts 2 3/21/22 $596,200 $(57,042)
Total Return Swap Agreements—Long
Value andUnrealized
Termination Rate Paid Notional Appreciation/ Underlying Instrument Counterparty Date(1) (Received)(2) Amount (Depreciation)
Nasdaq-100 Index Goldman Sachs International 2/28/22 0.68% $ 4,275,220 $ 2,578,801Nasdaq-100 Index UBS AG 2/28/22 0.88% 8,689,289 655,158
$12,964,509 $3,233,959
(1) Agreements may be terminated at will by either party without penalty. Payment is due at termination/maturity.(2) Reflects the floating financing rate, as of January 31, 2022, on the notional amount of the swap agreement paid to the counterparty or
received from the counterparty, excluding any commissions. This amount is included as part of the unrealized appreciation/(depreciation).
Toppan Merrill - ProFunds Public Semi-Annual Report [Funds] 01-31-2022 ED [AUX] | akiesli | 29-Mar-22 08:43 | 22-1296-2.de | Sequence: 29CHKSUM Content: 20073 Layout: 6810 Graphics: 0 CLEAN
JOB: 22-1296-2 CYCLE#;BL#: 8; 0 TRIM: 8.25" x 10.75" AS: New York: 212-620-5600COLORS: ~note-color 2, Black, ~note-color 3 GRAPHICS: none V1.5
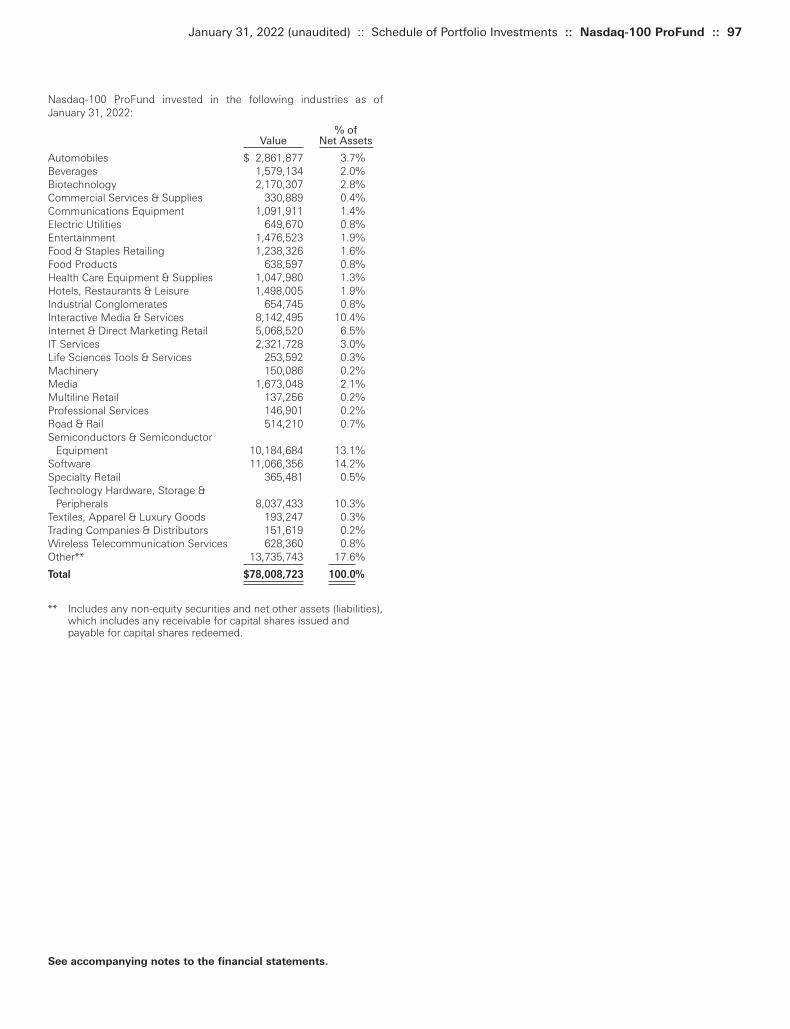
Nasdaq-100 ProFund invested in the following industries as ofJanuary 31, 2022:
% ofValue Net Assets
Automobiles $ 2,861,877 3.7%Beverages 1,579,134 2.0%Biotechnology 2,170,307 2.8%Commercial Services & Supplies 330,889 0.4%Communications Equipment 1,091,911 1.4%Electric Utilities 649,670 0.8%Entertainment 1,476,523 1.9%Food & Staples Retailing 1,238,326 1.6%Food Products 638,597 0.8%Health Care Equipment & Supplies 1,047,980 1.3%Hotels, Restaurants & Leisure 1,498,005 1.9%Industrial Conglomerates 654,745 0.8%Interactive Media & Services 8,142,495 10.4%Internet & Direct Marketing Retail 5,068,520 6.5%IT Services 2,321,728 3.0%Life Sciences Tools & Services 253,592 0.3%Machinery 150,086 0.2%Media 1,673,048 2.1%Multiline Retail 137,256 0.2%Professional Services 146,901 0.2%Road & Rail 514,210 0.7%Semiconductors & Semiconductor
Equipment 10,184,684 13.1%Software 11,066,356 14.2%Specialty Retail 365,481 0.5%Technology Hardware, Storage &
Peripherals 8,037,433 10.3%Textiles, Apparel & Luxury Goods 193,247 0.3%Trading Companies & Distributors 151,619 0.2%Wireless Telecommunication Services 628,360 0.8%Other** 13,735,743 17.6%
Total $78,008,723 100.0%
** Includes any non-equity securities and net other assets (liabilities),which includes any receivable for capital shares issued andpayable for capital shares redeemed.
January 31, 2022 (unaudited) :: Schedule of Portfolio Investments :: Nasdaq-100 ProFund :: 97
See accompanying notes to the financial statements.
Toppan Merrill - ProFunds Public Semi-Annual Report [Funds] 01-31-2022 ED [AUX] | akiesli | 29-Mar-22 08:43 | 22-1296-2.de | Sequence: 30CHKSUM Content: 1624 Layout: 15048 Graphics: 0 CLEAN
JOB: 22-1296-2 CYCLE#;BL#: 8; 0 TRIM: 8.25" x 10.75" AS: New York: 212-620-5600COLORS: ~note-color 2, Black, ~note-color 3 GRAPHICS: none V1.5
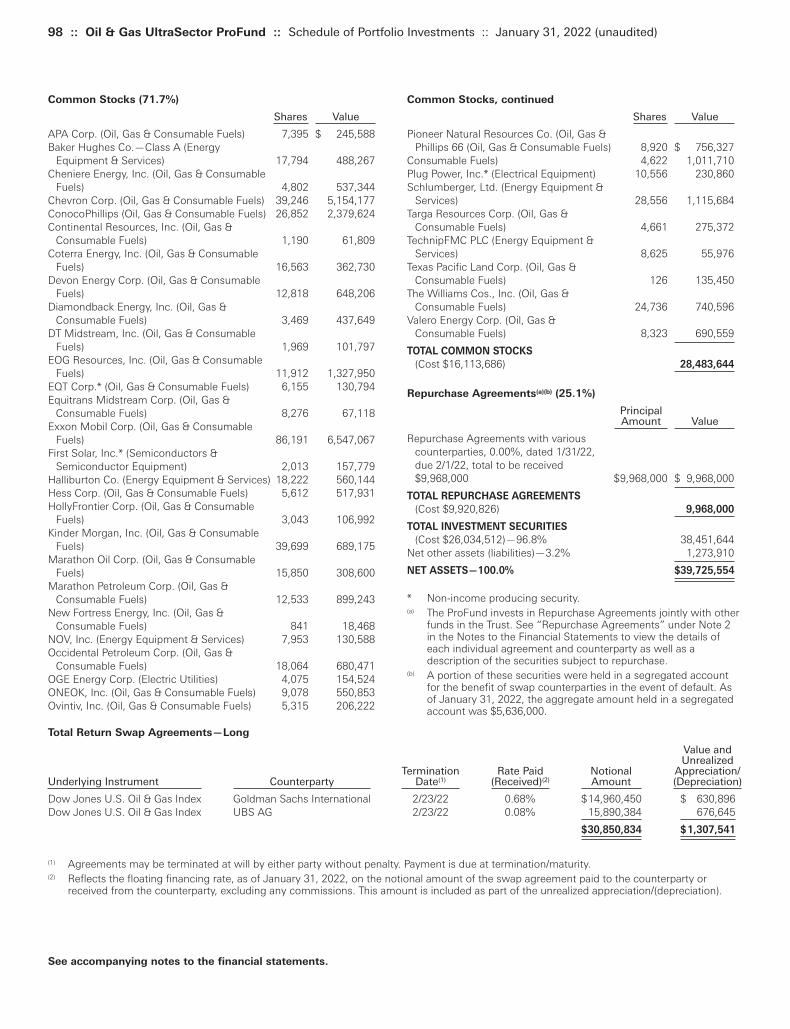
98 :: Oil & Gas UltraSector ProFund :: Schedule of Portfolio Investments :: January 31, 2022 (unaudited)
Common Stocks, continued
Shares Value
Pioneer Natural Resources Co. (Oil, Gas & Phillips 66 (Oil, Gas & Consumable Fuels) 8,920 $ 756,327
Consumable Fuels) 4,622 1,011,710Plug Power, Inc.* (Electrical Equipment) 10,556 230,860Schlumberger, Ltd. (Energy Equipment &
Services) 28,556 1,115,684Targa Resources Corp. (Oil, Gas &
Consumable Fuels) 4,661 275,372TechnipFMC PLC (Energy Equipment &
Services) 8,625 55,976Texas Pacific Land Corp. (Oil, Gas &
Consumable Fuels) 126 135,450The Williams Cos., Inc. (Oil, Gas &
Consumable Fuels) 24,736 740,596Valero Energy Corp. (Oil, Gas &
Consumable Fuels) 8,323 690,559
TOTAL COMMON STOCKS
(Cost $16,113,686) 28,483,644
Repurchase Agreements(a)(b) (25.1%)
PrincipalAmount Value
Repurchase Agreements with various counterparties, 0.00%, dated 1/31/22, due 2/1/22, total to be received $9,968,000 $9,968,000 $ 9,968,000
TOTAL REPURCHASE AGREEMENTS
(Cost $9,920,826) 9,968,000
TOTAL INVESTMENT SECURITIES
(Cost $26,034,512)—96.8% 38,451,644Net other assets (liabilities)—3.2% 1,273,910
NET ASSETS—100.0% $39,725,554
* Non-income producing security.(a) The ProFund invests in Repurchase Agreements jointly with other
funds in the Trust. See “Repurchase Agreements” under Note 2in the Notes to the Financial Statements to view the details ofeach individual agreement and counterparty as well as adescription of the securities subject to repurchase.
(b) A portion of these securities were held in a segregated accountfor the benefit of swap counterparties in the event of default. Asof January 31, 2022, the aggregate amount held in a segregatedaccount was $5,636,000.
Common Stocks (71.7%)
Shares Value
APA Corp. (Oil, Gas & Consumable Fuels) 7,395 $ 245,588Baker Hughes Co.—Class A (Energy
Equipment & Services) 17,794 488,267Cheniere Energy, Inc. (Oil, Gas & Consumable
Fuels) 4,802 537,344Chevron Corp. (Oil, Gas & Consumable Fuels) 39,246 5,154,177ConocoPhillips (Oil, Gas & Consumable Fuels) 26,852 2,379,624Continental Resources, Inc. (Oil, Gas &
Consumable Fuels) 1,190 61,809Coterra Energy, Inc. (Oil, Gas & Consumable
Fuels) 16,563 362,730Devon Energy Corp. (Oil, Gas & Consumable
Fuels) 12,818 648,206Diamondback Energy, Inc. (Oil, Gas &
Consumable Fuels) 3,469 437,649DT Midstream, Inc. (Oil, Gas & Consumable
Fuels) 1,969 101,797EOG Resources, Inc. (Oil, Gas & Consumable
Fuels) 11,912 1,327,950EQT Corp.* (Oil, Gas & Consumable Fuels) 6,155 130,794Equitrans Midstream Corp. (Oil, Gas &
Consumable Fuels) 8,276 67,118Exxon Mobil Corp. (Oil, Gas & Consumable
Fuels) 86,191 6,547,067First Solar, Inc.* (Semiconductors &
Semiconductor Equipment) 2,013 157,779Halliburton Co. (Energy Equipment & Services) 18,222 560,144Hess Corp. (Oil, Gas & Consumable Fuels) 5,612 517,931HollyFrontier Corp. (Oil, Gas & Consumable
Fuels) 3,043 106,992Kinder Morgan, Inc. (Oil, Gas & Consumable
Fuels) 39,699 689,175Marathon Oil Corp. (Oil, Gas & Consumable
Fuels) 15,850 308,600Marathon Petroleum Corp. (Oil, Gas &
Consumable Fuels) 12,533 899,243New Fortress Energy, Inc. (Oil, Gas &
Consumable Fuels) 841 18,468NOV, Inc. (Energy Equipment & Services) 7,953 130,588Occidental Petroleum Corp. (Oil, Gas &
Consumable Fuels) 18,064 680,471OGE Energy Corp. (Electric Utilities) 4,075 154,524ONEOK, Inc. (Oil, Gas & Consumable Fuels) 9,078 550,853Ovintiv, Inc. (Oil, Gas & Consumable Fuels) 5,315 206,222
See accompanying notes to the financial statements.
Total Return Swap Agreements—Long
Value and Unrealized
Termination Rate Paid Notional Appreciation/Underlying Instrument Counterparty Date(1) (Received)(2) Amount (Depreciation)
Dow Jones U.S. Oil & Gas Index Goldman Sachs International 2/23/22 0.68% $14,960,450 $ 630,896Dow Jones U.S. Oil & Gas Index UBS AG 2/23/22 0.08% 15,890,384 676,645
$30,850,834 $1,307,541
(1) Agreements may be terminated at will by either party without penalty. Payment is due at termination/maturity.(2) Reflects the floating financing rate, as of January 31, 2022, on the notional amount of the swap agreement paid to the counterparty or
received from the counterparty, excluding any commissions. This amount is included as part of the unrealized appreciation/(depreciation).
Toppan Merrill - ProFunds Public Semi-Annual Report [Funds] 01-31-2022 ED [AUX] | akiesli | 29-Mar-22 08:43 | 22-1296-2.de | Sequence: 31CHKSUM Content: 63048 Layout: 43946 Graphics: 0 CLEAN
JOB: 22-1296-2 CYCLE#;BL#: 8; 0 TRIM: 8.25" x 10.75" AS: New York: 212-620-5600COLORS: ~note-color 2, Black, ~note-color 3 GRAPHICS: none V1.5

Oil & Gas UltraSector ProFund invested in the following industries as ofJanuary 31, 2022:
% ofValue Net Assets
Electric Utilities $ 154,524 0.4%Electrical Equipment 230,860 0.6%Energy Equipment & Services 2,350,659 5.9%Oil, Gas & Consumable Fuels 25,589,822 64.4%Semiconductors & Semiconductor
Equipment 157,779 0.4%Other** 11,241,910 28.3%
Total $39,725,554 100.0%
** Includes any non-equity securities and net other assets (liabilities),which includes any receivable for capital shares issued andpayable for capital shares redeemed.
January 31, 2022 (unaudited) :: Schedule of Portfolio Investments :: Oil & Gas UltraSector ProFund :: 99
See accompanying notes to the financial statements.
Toppan Merrill - ProFunds Public Semi-Annual Report [Funds] 01-31-2022 ED [AUX] | akiesli | 29-Mar-22 08:43 | 22-1296-2.de | Sequence: 32CHKSUM Content: 9593 Layout: 57588 Graphics: 0 CLEAN
JOB: 22-1296-2 CYCLE#;BL#: 8; 0 TRIM: 8.25" x 10.75" AS: New York: 212-620-5600COLORS: ~note-color 2, Black, ~note-color 3 GRAPHICS: none V1.5
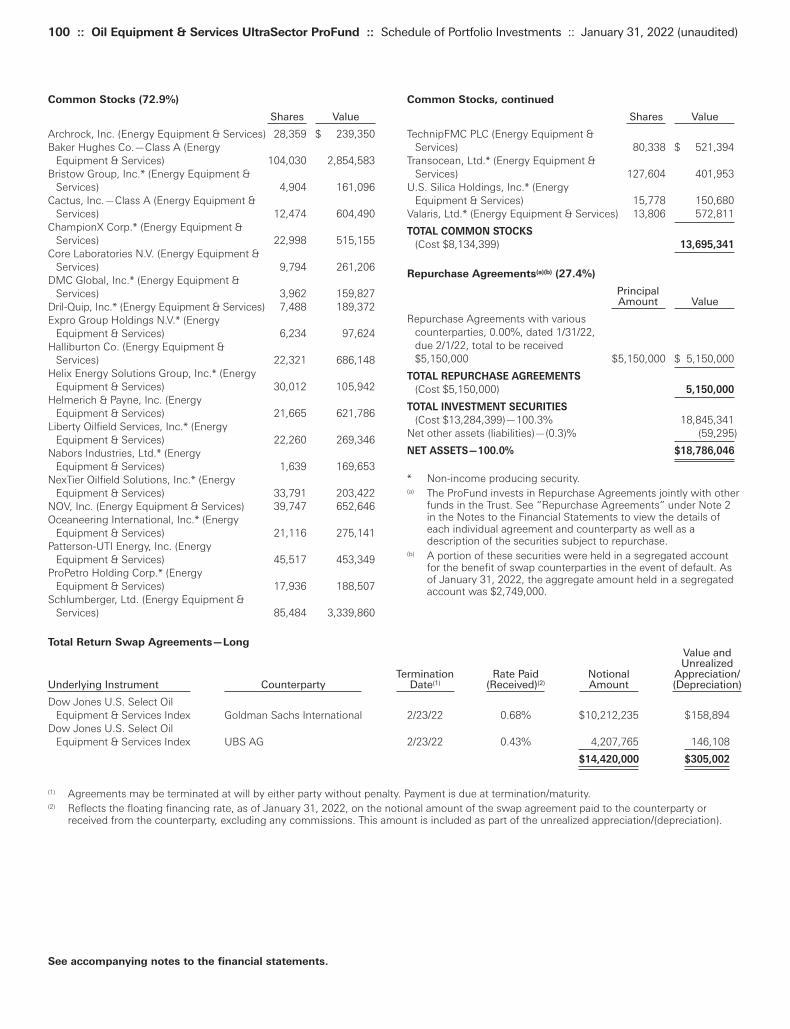
100 :: Oil Equipment & Services UltraSector ProFund :: Schedule of Portfolio Investments :: January 31, 2022 (unaudited)
Common Stocks, continued
Shares Value
TechnipFMC PLC (Energy Equipment & Services) 80,338 $ 521,394
Transocean, Ltd.* (Energy Equipment & Services) 127,604 401,953
U.S. Silica Holdings, Inc.* (Energy Equipment & Services) 15,778 150,680
Valaris, Ltd.* (Energy Equipment & Services) 13,806 572,811
TOTAL COMMON STOCKS
(Cost $8,134,399) 13,695,341
Repurchase Agreements(a)(b) (27.4%)
Principal Amount Value
Repurchase Agreements with various counterparties, 0.00%, dated 1/31/22, due 2/1/22, total to be received $5,150,000 $5,150,000 $ 5,150,000
TOTAL REPURCHASE AGREEMENTS
(Cost $5,150,000) 5,150,000
TOTAL INVESTMENT SECURITIES
(Cost $13,284,399)—100.3% 18,845,341Net other assets (liabilities)—(0.3)% (59,295)
NET ASSETS—100.0% $18,786,046
* Non-income producing security.(a) The ProFund invests in Repurchase Agreements jointly with other
funds in the Trust. See “Repurchase Agreements” under Note 2in the Notes to the Financial Statements to view the details ofeach individual agreement and counterparty as well as adescription of the securities subject to repurchase.
(b) A portion of these securities were held in a segregated accountfor the benefit of swap counterparties in the event of default. Asof January 31, 2022, the aggregate amount held in a segregatedaccount was $2,749,000.
Common Stocks (72.9%)
Shares Value
Archrock, Inc. (Energy Equipment & Services) 28,359 $ 239,350Baker Hughes Co.—Class A (Energy
Equipment & Services) 104,030 2,854,583Bristow Group, Inc.* (Energy Equipment &
Services) 4,904 161,096Cactus, Inc.—Class A (Energy Equipment &
Services) 12,474 604,490ChampionX Corp.* (Energy Equipment &
Services) 22,998 515,155Core Laboratories N.V. (Energy Equipment &
Services) 9,794 261,206DMC Global, Inc.* (Energy Equipment &
Services) 3,962 159,827Dril-Quip, Inc.* (Energy Equipment & Services) 7,488 189,372Expro Group Holdings N.V.* (Energy
Equipment & Services) 6,234 97,624Halliburton Co. (Energy Equipment &
Services) 22,321 686,148Helix Energy Solutions Group, Inc.* (Energy
Equipment & Services) 30,012 105,942Helmerich & Payne, Inc. (Energy
Equipment & Services) 21,665 621,786Liberty Oilfield Services, Inc.* (Energy
Equipment & Services) 22,260 269,346Nabors Industries, Ltd.* (Energy
Equipment & Services) 1,639 169,653NexTier Oilfield Solutions, Inc.* (Energy
Equipment & Services) 33,791 203,422NOV, Inc. (Energy Equipment & Services) 39,747 652,646Oceaneering International, Inc.* (Energy
Equipment & Services) 21,116 275,141Patterson-UTI Energy, Inc. (Energy
Equipment & Services) 45,517 453,349ProPetro Holding Corp.* (Energy
Equipment & Services) 17,936 188,507Schlumberger, Ltd. (Energy Equipment &
Services) 85,484 3,339,860
See accompanying notes to the financial statements.
Total Return Swap Agreements—LongValue and Unrealized
Termination Rate Paid Notional Appreciation/ Underlying Instrument Counterparty Date(1) (Received)(2) Amount (Depreciation)
Dow Jones U.S. Select Oil Equipment & Services Index Goldman Sachs International 2/23/22 0.68% $10,212,235 $158,894
Dow Jones U.S. Select Oil Equipment & Services Index UBS AG 2/23/22 0.43% 4,207,765 146,108
$14,420,000 $305,002
(1) Agreements may be terminated at will by either party without penalty. Payment is due at termination/maturity.(2) Reflects the floating financing rate, as of January 31, 2022, on the notional amount of the swap agreement paid to the counterparty or
received from the counterparty, excluding any commissions. This amount is included as part of the unrealized appreciation/(depreciation).
Toppan Merrill - ProFunds Public Semi-Annual Report [Funds] 01-31-2022 ED [AUX] | akiesli | 29-Mar-22 08:43 | 22-1296-2.dg | Sequence: 1CHKSUM Content: 1007 Layout: 35261 Graphics: 0 CLEAN
JOB: 22-1296-2 CYCLE#;BL#: 8; 0 TRIM: 8.25" x 10.75" AS: New York: 212-620-5600COLORS: ~note-color 2, Black, ~note-color 3 GRAPHICS: none V1.5
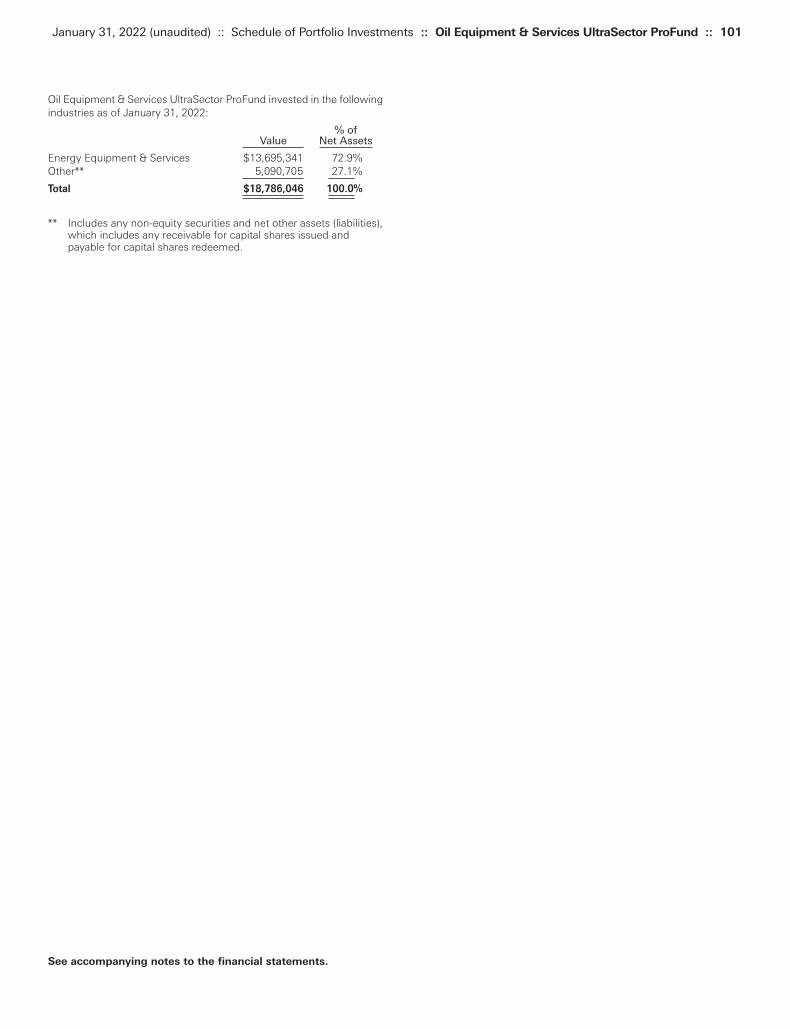
Oil Equipment & Services UltraSector ProFund invested in the followingindustries as of January 31, 2022:
% ofValue Net Assets
Energy Equipment & Services $13,695,341 72.9%Other** 5,090,705 27.1%
Total $18,786,046 100.0%
** Includes any non-equity securities and net other assets (liabilities),which includes any receivable for capital shares issued andpayable for capital shares redeemed.
January 31, 2022 (unaudited) :: Schedule of Portfolio Investments :: Oil Equipment & Services UltraSector ProFund :: 101
See accompanying notes to the financial statements.
Toppan Merrill - ProFunds Public Semi-Annual Report [Funds] 01-31-2022 ED [AUX] | akiesli | 29-Mar-22 08:43 | 22-1296-2.dg | Sequence: 2CHKSUM Content: 12 Layout: 62045 Graphics: 0 CLEAN
JOB: 22-1296-2 CYCLE#;BL#: 8; 0 TRIM: 8.25" x 10.75" AS: New York: 212-620-5600COLORS: ~note-color 2, Black, ~note-color 3 GRAPHICS: none V1.5
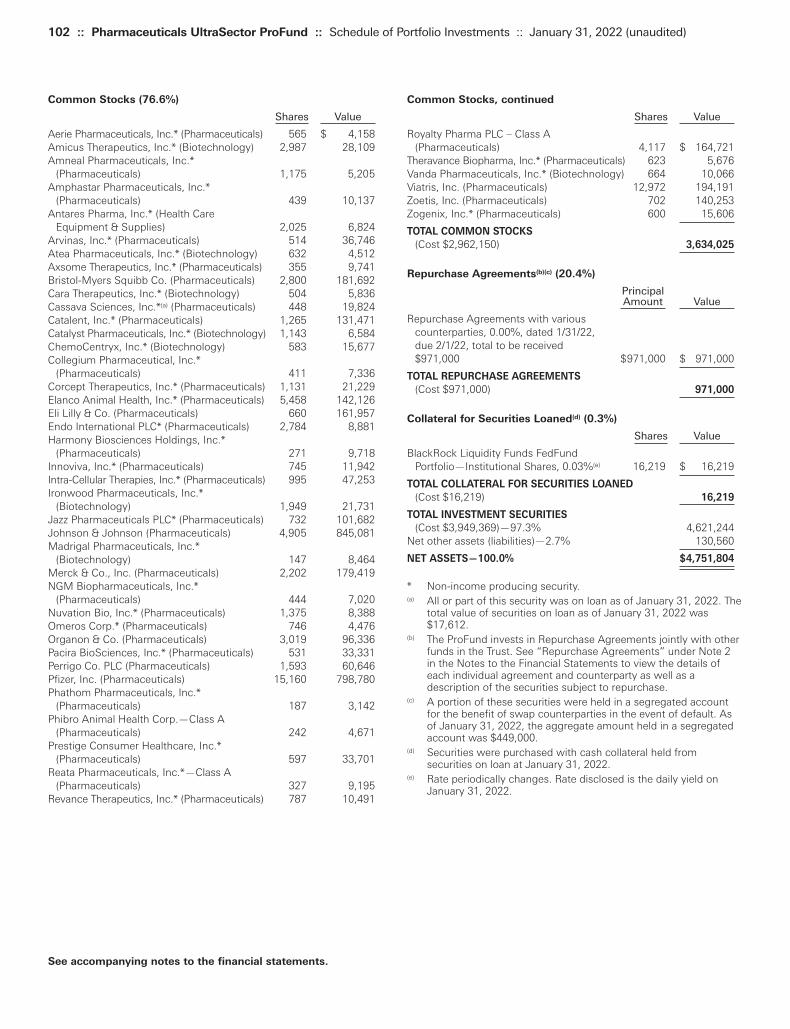
102 :: Pharmaceuticals UltraSector ProFund :: Schedule of Portfolio Investments :: January 31, 2022 (unaudited)
Common Stocks, continued
Shares Value
Royalty Pharma PLC – Class A (Pharmaceuticals) 4,117 $ 164,721
Theravance Biopharma, Inc.* (Pharmaceuticals) 623 5,676Vanda Pharmaceuticals, Inc.* (Biotechnology) 664 10,066Viatris, Inc. (Pharmaceuticals) 12,972 194,191Zoetis, Inc. (Pharmaceuticals) 702 140,253Zogenix, Inc.* (Pharmaceuticals) 600 15,606
TOTAL COMMON STOCKS
(Cost $2,962,150) 3,634,025
Repurchase Agreements(b)(c) (20.4%)
Principal Amount Value
Repurchase Agreements with various counterparties, 0.00%, dated 1/31/22, due 2/1/22, total to be received $971,000 $971,000 $ 971,000
TOTAL REPURCHASE AGREEMENTS
(Cost $971,000) 971,000
Collateral for Securities Loaned(d) (0.3%)
Shares Value
BlackRock Liquidity Funds FedFund Portfolio—Institutional Shares, 0.03%(e) 16,219 $ 16,219
TOTAL COLLATERAL FOR SECURITIES LOANED
(Cost $16,219) 16,219
TOTAL INVESTMENT SECURITIES
(Cost $3,949,369)—97.3% 4,621,244Net other assets (liabilities)—2.7% 130,560
NET ASSETS—100.0% $4,751,804
* Non-income producing security.(a) All or part of this security was on loan as of January 31, 2022. The
total value of securities on loan as of January 31, 2022 was$17,612.
(b) The ProFund invests in Repurchase Agreements jointly with otherfunds in the Trust. See “Repurchase Agreements” under Note 2in the Notes to the Financial Statements to view the details ofeach individual agreement and counterparty as well as adescription of the securities subject to repurchase.
(c) A portion of these securities were held in a segregated accountfor the benefit of swap counterparties in the event of default. Asof January 31, 2022, the aggregate amount held in a segregatedaccount was $449,000.
(d) Securities were purchased with cash collateral held fromsecurities on loan at January 31, 2022.
(e) Rate periodically changes. Rate disclosed is the daily yield onJanuary 31, 2022.
Common Stocks (76.6%)
Shares Value
Aerie Pharmaceuticals, Inc.* (Pharmaceuticals) 565 $ 4,158Amicus Therapeutics, Inc.* (Biotechnology) 2,987 28,109Amneal Pharmaceuticals, Inc.*
(Pharmaceuticals) 1,175 5,205Amphastar Pharmaceuticals, Inc.*
(Pharmaceuticals) 439 10,137Antares Pharma, Inc.* (Health Care
Equipment & Supplies) 2,025 6,824Arvinas, Inc.* (Pharmaceuticals) 514 36,746Atea Pharmaceuticals, Inc.* (Biotechnology) 632 4,512Axsome Therapeutics, Inc.* (Pharmaceuticals) 355 9,741Bristol-Myers Squibb Co. (Pharmaceuticals) 2,800 181,692Cara Therapeutics, Inc.* (Biotechnology) 504 5,836Cassava Sciences, Inc.*(a) (Pharmaceuticals) 448 19,824Catalent, Inc.* (Pharmaceuticals) 1,265 131,471Catalyst Pharmaceuticals, Inc.* (Biotechnology) 1,143 6,584ChemoCentryx, Inc.* (Biotechnology) 583 15,677Collegium Pharmaceutical, Inc.*
(Pharmaceuticals) 411 7,336Corcept Therapeutics, Inc.* (Pharmaceuticals) 1,131 21,229Elanco Animal Health, Inc.* (Pharmaceuticals) 5,458 142,126Eli Lilly & Co. (Pharmaceuticals) 660 161,957Endo International PLC* (Pharmaceuticals) 2,784 8,881Harmony Biosciences Holdings, Inc.*
(Pharmaceuticals) 271 9,718Innoviva, Inc.* (Pharmaceuticals) 745 11,942Intra-Cellular Therapies, Inc.* (Pharmaceuticals) 995 47,253Ironwood Pharmaceuticals, Inc.*
(Biotechnology) 1,949 21,731Jazz Pharmaceuticals PLC* (Pharmaceuticals) 732 101,682Johnson & Johnson (Pharmaceuticals) 4,905 845,081Madrigal Pharmaceuticals, Inc.*
(Biotechnology) 147 8,464Merck & Co., Inc. (Pharmaceuticals) 2,202 179,419NGM Biopharmaceuticals, Inc.*
(Pharmaceuticals) 444 7,020Nuvation Bio, Inc.* (Pharmaceuticals) 1,375 8,388Omeros Corp.* (Pharmaceuticals) 746 4,476Organon & Co. (Pharmaceuticals) 3,019 96,336Pacira BioSciences, Inc.* (Pharmaceuticals) 531 33,331Perrigo Co. PLC (Pharmaceuticals) 1,593 60,646Pfizer, Inc. (Pharmaceuticals) 15,160 798,780Phathom Pharmaceuticals, Inc.*
(Pharmaceuticals) 187 3,142Phibro Animal Health Corp.—Class A
(Pharmaceuticals) 242 4,671Prestige Consumer Healthcare, Inc.*
(Pharmaceuticals) 597 33,701Reata Pharmaceuticals, Inc.*—Class A
(Pharmaceuticals) 327 9,195Revance Therapeutics, Inc.* (Pharmaceuticals) 787 10,491
See accompanying notes to the financial statements.
Toppan Merrill - ProFunds Public Semi-Annual Report [Funds] 01-31-2022 ED [AUX] | akiesli | 29-Mar-22 08:43 | 22-1296-2.dg | Sequence: 3CHKSUM Content: 28279 Layout: 25237 Graphics: 0 CLEAN
JOB: 22-1296-2 CYCLE#;BL#: 8; 0 TRIM: 8.25" x 10.75" AS: New York: 212-620-5600COLORS: ~note-color 2, Black, ~note-color 3 GRAPHICS: none V1.5

Total Return Swap Agreements—Long
Value and Unrealized
Termination Rate Paid Notional Appreciation/ Underlying Instrument Counterparty Date(1) (Received)(2) Amount (Depreciation)
Dow Jones U.S. Select Pharmaceuticals Index Goldman Sachs International 2/23/22 0.68% $1,653,121 $ 52,005
Dow Jones U.S. Select Pharmaceuticals Index UBS AG 2/23/22 0.43% 1,841,451 51,521
$3,494,572 $103,526
(1) Agreements may be terminated at will by either party without penalty. Payment is due at termination/maturity.(2) Reflects the floating financing rate, as of January 31, 2022, on the notional amount of the swap agreement paid to the counterparty or
received from the counterparty, excluding any commissions. This amount is included as part of the unrealized appreciation/(depreciation).
January 31, 2022 (unaudited) :: Schedule of Portfolio Investments :: Pharmaceuticals UltraSector ProFund :: 103
See accompanying notes to the financial statements.
Pharmaceuticals UltraSector ProFund invested in the followingindustries as of January 31, 2022:
% ofValue Net Assets
Biotechnology $ 100,979 2.1%Health Care Equipment & Supplies 6,824 0.2%Pharmaceuticals 3,526,222 74.3%Other** 1,117,779 23.4%
Total $4,751,804 100.0%
** Includes any non-equity securities and net other assets (liabilities),which includes any receivable for capital shares issued andpayable for capital shares redeemed.
Toppan Merrill - ProFunds Public Semi-Annual Report [Funds] 01-31-2022 ED [AUX] | akiesli | 29-Mar-22 08:43 | 22-1296-2.dg | Sequence: 4CHKSUM Content: 6517 Layout: 39479 Graphics: 0 CLEAN
JOB: 22-1296-2 CYCLE#;BL#: 8; 0 TRIM: 8.25" x 10.75" AS: New York: 212-620-5600COLORS: ~note-color 2, Black, ~note-color 3 GRAPHICS: none V1.5
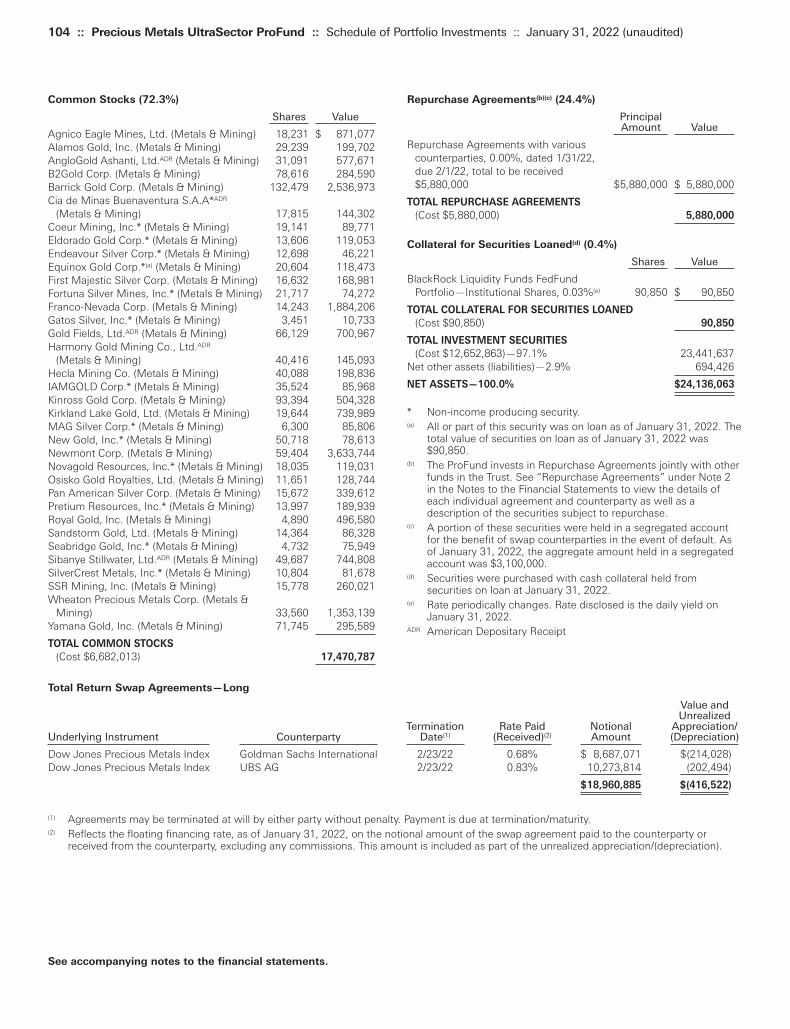
104 :: Precious Metals UltraSector ProFund :: Schedule of Portfolio Investments :: January 31, 2022 (unaudited)
Repurchase Agreements(b)(c) (24.4%)
Principal Amount Value
Repurchase Agreements with various counterparties, 0.00%, dated 1/31/22, due 2/1/22, total to be received $5,880,000 $5,880,000 $ 5,880,000
TOTAL REPURCHASE AGREEMENTS
(Cost $5,880,000) 5,880,000
Collateral for Securities Loaned(d) (0.4%)
Shares Value
BlackRock Liquidity Funds FedFund Portfolio—Institutional Shares, 0.03%(e) 90,850 $ 90,850
TOTAL COLLATERAL FOR SECURITIES LOANED
(Cost $90,850) 90,850
TOTAL INVESTMENT SECURITIES
(Cost $12,652,863)—97.1% 23,441,637Net other assets (liabilities)—2.9% 694,426
NET ASSETS—100.0% $24,136,063
* Non-income producing security.(a) All or part of this security was on loan as of January 31, 2022. The
total value of securities on loan as of January 31, 2022 was$90,850.
(b) The ProFund invests in Repurchase Agreements jointly with otherfunds in the Trust. See “Repurchase Agreements” under Note 2in the Notes to the Financial Statements to view the details ofeach individual agreement and counterparty as well as adescription of the securities subject to repurchase.
(c) A portion of these securities were held in a segregated accountfor the benefit of swap counterparties in the event of default. Asof January 31, 2022, the aggregate amount held in a segregatedaccount was $3,100,000.
(d) Securities were purchased with cash collateral held fromsecurities on loan at January 31, 2022.
(e) Rate periodically changes. Rate disclosed is the daily yield onJanuary 31, 2022.
ADR American Depositary Receipt
Common Stocks (72.3%)
Shares Value
Agnico Eagle Mines, Ltd. (Metals & Mining) 18,231 $ 871,077Alamos Gold, Inc. (Metals & Mining) 29,239 199,702AngloGold Ashanti, Ltd.ADR (Metals & Mining) 31,091 577,671B2Gold Corp. (Metals & Mining) 78,616 284,590Barrick Gold Corp. (Metals & Mining) 132,479 2,536,973Cia de Minas Buenaventura S.A.A*ADR
(Metals & Mining) 17,815 144,302Coeur Mining, Inc.* (Metals & Mining) 19,141 89,771Eldorado Gold Corp.* (Metals & Mining) 13,606 119,053Endeavour Silver Corp.* (Metals & Mining) 12,698 46,221Equinox Gold Corp.*(a) (Metals & Mining) 20,604 118,473First Majestic Silver Corp. (Metals & Mining) 16,632 168,981Fortuna Silver Mines, Inc.* (Metals & Mining) 21,717 74,272Franco-Nevada Corp. (Metals & Mining) 14,243 1,884,206Gatos Silver, Inc.* (Metals & Mining) 3,451 10,733Gold Fields, Ltd.ADR (Metals & Mining) 66,129 700,967Harmony Gold Mining Co., Ltd.ADR
(Metals & Mining) 40,416 145,093Hecla Mining Co. (Metals & Mining) 40,088 198,836IAMGOLD Corp.* (Metals & Mining) 35,524 85,968Kinross Gold Corp. (Metals & Mining) 93,394 504,328Kirkland Lake Gold, Ltd. (Metals & Mining) 19,644 739,989MAG Silver Corp.* (Metals & Mining) 6,300 85,806New Gold, Inc.* (Metals & Mining) 50,718 78,613Newmont Corp. (Metals & Mining) 59,404 3,633,744Novagold Resources, Inc.* (Metals & Mining) 18,035 119,031Osisko Gold Royalties, Ltd. (Metals & Mining) 11,651 128,744Pan American Silver Corp. (Metals & Mining) 15,672 339,612Pretium Resources, Inc.* (Metals & Mining) 13,997 189,939Royal Gold, Inc. (Metals & Mining) 4,890 496,580Sandstorm Gold, Ltd. (Metals & Mining) 14,364 86,328Seabridge Gold, Inc.* (Metals & Mining) 4,732 75,949Sibanye Stillwater, Ltd.ADR (Metals & Mining) 49,687 744,808SilverCrest Metals, Inc.* (Metals & Mining) 10,804 81,678SSR Mining, Inc. (Metals & Mining) 15,778 260,021Wheaton Precious Metals Corp. (Metals &
Mining) 33,560 1,353,139Yamana Gold, Inc. (Metals & Mining) 71,745 295,589
TOTAL COMMON STOCKS
(Cost $6,682,013) 17,470,787
See accompanying notes to the financial statements.
Total Return Swap Agreements—Long
Value and Unrealized
Termination Rate Paid Notional Appreciation/ Underlying Instrument Counterparty Date(1) (Received)(2) Amount (Depreciation)
Dow Jones Precious Metals Index Goldman Sachs International 2/23/22 0.68% $ 8,687,071 $(214,028)Dow Jones Precious Metals Index UBS AG 2/23/22 0.83% 10,273,814 (202,494)
$18,960,885 $(416,522)
(1) Agreements may be terminated at will by either party without penalty. Payment is due at termination/maturity.(2) Reflects the floating financing rate, as of January 31, 2022, on the notional amount of the swap agreement paid to the counterparty or
received from the counterparty, excluding any commissions. This amount is included as part of the unrealized appreciation/(depreciation).
Toppan Merrill - ProFunds Public Semi-Annual Report [Funds] 01-31-2022 ED [AUX] | akiesli | 29-Mar-22 08:43 | 22-1296-2.dg | Sequence: 5CHKSUM Content: 59101 Layout: 43228 Graphics: 0 CLEAN
JOB: 22-1296-2 CYCLE#;BL#: 8; 0 TRIM: 8.25" x 10.75" AS: New York: 212-620-5600COLORS: ~note-color 2, Black, ~note-color 3 GRAPHICS: none V1.5

Precious Metals UltraSector ProFund invested in the followingindustries as of January 31, 2022:
% ofValue Net Assets
Metals & Mining $17,470,787 72.3%Other** 6,665,276 27.7%
Total $24,136,063 100.0%
** Includes any non-equity securities and net other assets (liabilities),which includes any receivable for capital shares issued andpayable for capital shares redeemed.
January 31, 2022 (unaudited) :: Schedule of Portfolio Investments :: Precious Metals UltraSector ProFund :: 105
See accompanying notes to the financial statements.
Toppan Merrill - ProFunds Public Semi-Annual Report [Funds] 01-31-2022 ED [AUX] | akiesli | 29-Mar-22 08:43 | 22-1296-2.dg | Sequence: 6CHKSUM Content: 39136 Layout: 43746 Graphics: 0 CLEAN
JOB: 22-1296-2 CYCLE#;BL#: 8; 0 TRIM: 8.25" x 10.75" AS: New York: 212-620-5600COLORS: ~note-color 2, Black, ~note-color 3 GRAPHICS: none V1.5
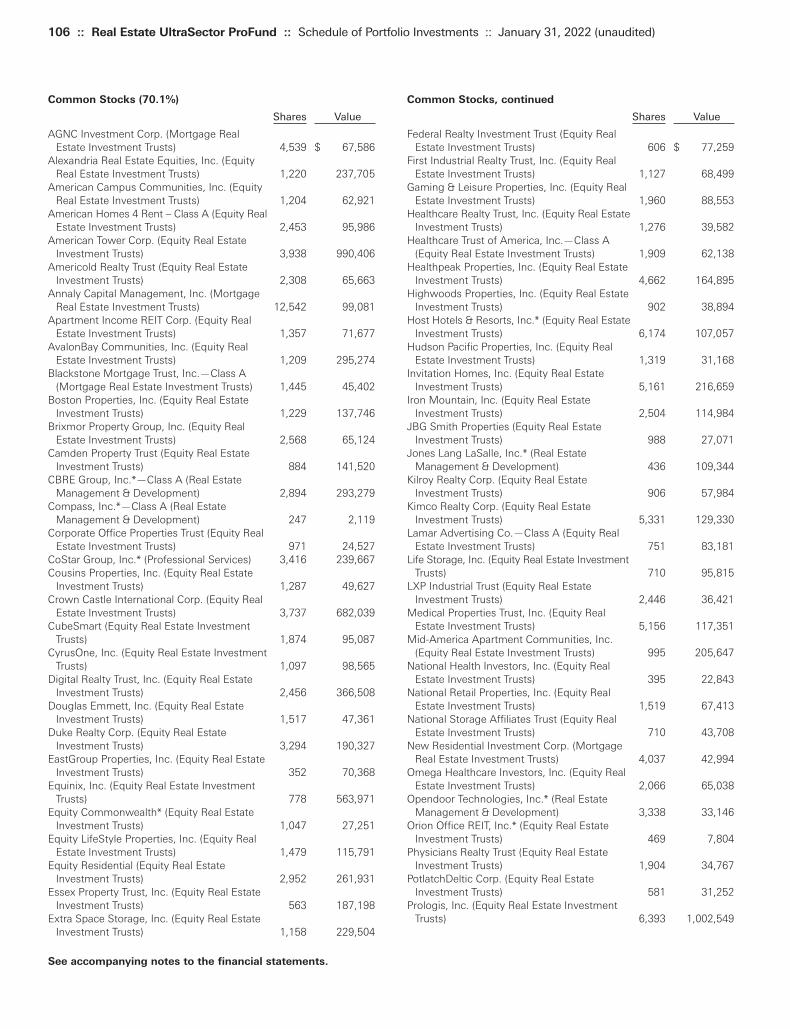
106 :: Real Estate UltraSector ProFund :: Schedule of Portfolio Investments :: January 31, 2022 (unaudited)
Common Stocks, continued
Shares Value
Federal Realty Investment Trust (Equity Real Estate Investment Trusts) 606 $ 77,259
First Industrial Realty Trust, Inc. (Equity Real Estate Investment Trusts) 1,127 68,499
Gaming & Leisure Properties, Inc. (Equity Real Estate Investment Trusts) 1,960 88,553
Healthcare Realty Trust, Inc. (Equity Real EstateInvestment Trusts) 1,276 39,582
Healthcare Trust of America, Inc.—Class A (Equity Real Estate Investment Trusts) 1,909 62,138
Healthpeak Properties, Inc. (Equity Real Estate Investment Trusts) 4,662 164,895
Highwoods Properties, Inc. (Equity Real Estate Investment Trusts) 902 38,894
Host Hotels & Resorts, Inc.* (Equity Real EstateInvestment Trusts) 6,174 107,057
Hudson Pacific Properties, Inc. (Equity Real Estate Investment Trusts) 1,319 31,168
Invitation Homes, Inc. (Equity Real Estate Investment Trusts) 5,161 216,659
Iron Mountain, Inc. (Equity Real Estate Investment Trusts) 2,504 114,984
JBG Smith Properties (Equity Real Estate Investment Trusts) 988 27,071
Jones Lang LaSalle, Inc.* (Real Estate Management & Development) 436 109,344
Kilroy Realty Corp. (Equity Real Estate Investment Trusts) 906 57,984
Kimco Realty Corp. (Equity Real Estate Investment Trusts) 5,331 129,330
Lamar Advertising Co.—Class A (Equity Real Estate Investment Trusts) 751 83,181
Life Storage, Inc. (Equity Real Estate InvestmentTrusts) 710 95,815
LXP Industrial Trust (Equity Real Estate Investment Trusts) 2,446 36,421
Medical Properties Trust, Inc. (Equity Real Estate Investment Trusts) 5,156 117,351
Mid-America Apartment Communities, Inc. (Equity Real Estate Investment Trusts) 995 205,647
National Health Investors, Inc. (Equity Real Estate Investment Trusts) 395 22,843
National Retail Properties, Inc. (Equity Real Estate Investment Trusts) 1,519 67,413
National Storage Affiliates Trust (Equity Real Estate Investment Trusts) 710 43,708
New Residential Investment Corp. (Mortgage Real Estate Investment Trusts) 4,037 42,994
Omega Healthcare Investors, Inc. (Equity Real Estate Investment Trusts) 2,066 65,038
Opendoor Technologies, Inc.* (Real Estate Management & Development) 3,338 33,146
Orion Office REIT, Inc.* (Equity Real Estate Investment Trusts) 469 7,804
Physicians Realty Trust (Equity Real Estate Investment Trusts) 1,904 34,767
PotlatchDeltic Corp. (Equity Real Estate Investment Trusts) 581 31,252
Prologis, Inc. (Equity Real Estate Investment Trusts) 6,393 1,002,549
Common Stocks (70.1%)
Shares Value
AGNC Investment Corp. (Mortgage Real Estate Investment Trusts) 4,539 $ 67,586
Alexandria Real Estate Equities, Inc. (Equity Real Estate Investment Trusts) 1,220 237,705
American Campus Communities, Inc. (Equity Real Estate Investment Trusts) 1,204 62,921
American Homes 4 Rent – Class A (Equity Real Estate Investment Trusts) 2,453 95,986
American Tower Corp. (Equity Real Estate Investment Trusts) 3,938 990,406
Americold Realty Trust (Equity Real Estate Investment Trusts) 2,308 65,663
Annaly Capital Management, Inc. (Mortgage Real Estate Investment Trusts) 12,542 99,081
Apartment Income REIT Corp. (Equity Real Estate Investment Trusts) 1,357 71,677
AvalonBay Communities, Inc. (Equity Real Estate Investment Trusts) 1,209 295,274
Blackstone Mortgage Trust, Inc.—Class A (Mortgage Real Estate Investment Trusts) 1,445 45,402
Boston Properties, Inc. (Equity Real Estate Investment Trusts) 1,229 137,746
Brixmor Property Group, Inc. (Equity Real Estate Investment Trusts) 2,568 65,124
Camden Property Trust (Equity Real Estate Investment Trusts) 884 141,520
CBRE Group, Inc.*—Class A (Real Estate Management & Development) 2,894 293,279
Compass, Inc.*—Class A (Real Estate Management & Development) 247 2,119
Corporate Office Properties Trust (Equity Real Estate Investment Trusts) 971 24,527
CoStar Group, Inc.* (Professional Services) 3,416 239,667Cousins Properties, Inc. (Equity Real Estate
Investment Trusts) 1,287 49,627Crown Castle International Corp. (Equity Real
Estate Investment Trusts) 3,737 682,039CubeSmart (Equity Real Estate Investment
Trusts) 1,874 95,087CyrusOne, Inc. (Equity Real Estate Investment
Trusts) 1,097 98,565Digital Realty Trust, Inc. (Equity Real Estate
Investment Trusts) 2,456 366,508Douglas Emmett, Inc. (Equity Real Estate
Investment Trusts) 1,517 47,361Duke Realty Corp. (Equity Real Estate
Investment Trusts) 3,294 190,327EastGroup Properties, Inc. (Equity Real Estate
Investment Trusts) 352 70,368Equinix, Inc. (Equity Real Estate Investment
Trusts) 778 563,971Equity Commonwealth* (Equity Real Estate
Investment Trusts) 1,047 27,251Equity LifeStyle Properties, Inc. (Equity Real
Estate Investment Trusts) 1,479 115,791Equity Residential (Equity Real Estate
Investment Trusts) 2,952 261,931Essex Property Trust, Inc. (Equity Real Estate
Investment Trusts) 563 187,198Extra Space Storage, Inc. (Equity Real Estate
Investment Trusts) 1,158 229,504
See accompanying notes to the financial statements.
Toppan Merrill - ProFunds Public Semi-Annual Report [Funds] 01-31-2022 ED [AUX] | akiesli | 29-Mar-22 08:43 | 22-1296-2.dg | Sequence: 7CHKSUM Content: 27269 Layout: 36840 Graphics: 0 CLEAN
JOB: 22-1296-2 CYCLE#;BL#: 8; 0 TRIM: 8.25" x 10.75" AS: New York: 212-620-5600COLORS: ~note-color 2, Black, ~note-color 3 GRAPHICS: none V1.5

Common Stocks, continued
Shares Value
Welltower, Inc. (Equity Real Estate Investment Trusts) 3,765 $ 326,162
Weyerhaeuser Co. (Equity Real Estate Investment Trusts) 6,478 261,906
WP Carey, Inc. (Equity Real Estate Investment Trusts) 1,611 125,014
Zillow Group, Inc.*—Class A (Interactive Media & Services) 318 15,855
Zillow Group, Inc.*—Class C (Interactive Media & Services) 1,474 74,408
TOTAL COMMON STOCKS
(Cost $8,976,906) 12,857,883
Repurchase Agreements(a)(b) (26.1%)
Principal Amount Value
Repurchase Agreements with various counterparties, 0.00%, dated 1/31/22, due 2/1/22, total to be received $4,775,000 $4,775,000 $ 4,775,000
TOTAL REPURCHASE AGREEMENTS
(Cost $4,775,000) 4,775,000
TOTAL INVESTMENT SECURITIES
(Cost $13,751,906)—96.2% 17,632,883Net other assets (liabilities)—3.8% 695,647
NET ASSETS—100.0% $18,328,530
* Non-income producing security.(a) The ProFund invests in Repurchase Agreements jointly with other
funds in the Trust. See “Repurchase Agreements” under Note 2in the Notes to the Financial Statements to view the details ofeach individual agreement and counterparty as well as adescription of the securities subject to repurchase.
(b) A portion of these securities were held in a segregated accountfor the benefit of swap counterparties in the event of default. Asof January 31, 2022, the aggregate amount held in a segregatedaccount was $2,918,000.
Common Stocks, continued
Shares Value
PS Business Parks, Inc. (Equity Real Estate Investment Trusts) 174 $ 29,051
Public Storage (Equity Real Estate Investment Trusts) 1,321 473,617
Rayonier, Inc. (Equity Real Estate Investment Trusts) 1,238 45,237
Realty Income Corp. (Equity Real Estate Investment Trusts) 4,893 339,623
Redfin Corp.* (Real Estate Management & Development) 912 26,968
Regency Centers Corp. (Equity Real Estate Investment Trusts) 1,333 95,643
Rexford Industrial Realty, Inc. (Equity Real Estate Investment Trusts) 1,310 95,853
Sabra Health Care REIT, Inc. (Equity Real Estate Investment Trusts) 1,979 26,934
SBA Communications Corp. (Equity Real Estate Investment Trusts) 940 305,914
Simon Property Group, Inc. (Equity Real Estate Investment Trusts) 2,843 418,489
SL Green Realty Corp. (Equity Real Estate Investment Trusts) 590 42,787
Spirit Realty Capital, Inc. (Equity Real Estate Investment Trusts) 1,067 50,640
STAG Industrial, Inc. (Equity Real Estate Investment Trusts) 1,515 64,736
Starwood Property Trust, Inc. (Mortgage Real Estate Investment Trusts) 2,633 65,167
STORE Capital Corp. (Equity Real Estate Investment Trusts) 2,122 67,289
Sun Communities, Inc. (Equity Real Estate Investment Trusts) 1,003 189,527
The Howard Hughes Corp.* (Real Estate Management & Development) 358 34,479
UDR, Inc. (Equity Real Estate Investment Trusts) 2,514 142,896Ventas, Inc. (Equity Real Estate Investment
Trusts) 3,453 183,078VICI Properties, Inc. (Equity Real Estate
Investment Trusts) 5,439 155,664Vornado Realty Trust (Equity Real Estate
Investment Trusts) 1,375 56,389
January 31, 2022 (unaudited) :: Schedule of Portfolio Investments :: Real Estate UltraSector ProFund :: 107
See accompanying notes to the financial statements.
Total Return Swap Agreements—Long
Value and Unrealized
Termination Rate Paid Notional Appreciation/ Underlying Instrument Counterparty Date(1) (Received)(2) Amount (Depreciation)
Dow Jones U.S. Real Estate Index Goldman Sachs International 2/23/22 0.68% $ 8,893,192 $ 69,163Dow Jones U.S. Real Estate Index UBS AG 2/23/22 0.43% 5,778,660 49,351
$14,671,852 $118,514
(1) Agreements may be terminated at will by either party without penalty. Payment is due at termination/maturity.(2) Reflects the floating financing rate, as of January 31, 2022, on the notional amount of the swap agreement paid to the counterparty or
received from the counterparty, excluding any commissions. This amount is included as part of the unrealized appreciation/(depreciation).
Toppan Merrill - ProFunds Public Semi-Annual Report [Funds] 01-31-2022 ED [AUX] | akiesli | 29-Mar-22 08:43 | 22-1296-2.dg | Sequence: 8CHKSUM Content: 5241 Layout: 51674 Graphics: 0 CLEAN
JOB: 22-1296-2 CYCLE#;BL#: 8; 0 TRIM: 8.25" x 10.75" AS: New York: 212-620-5600COLORS: ~note-color 2, Black, ~note-color 3 GRAPHICS: none V1.5
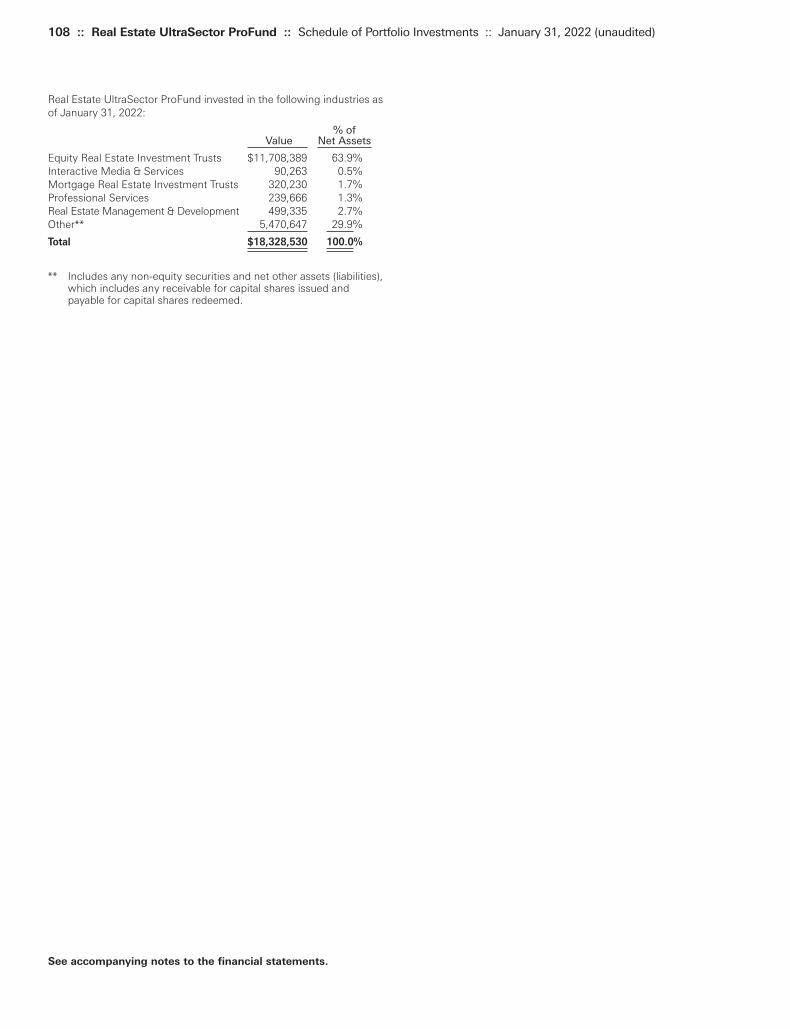
108 :: Real Estate UltraSector ProFund :: Schedule of Portfolio Investments :: January 31, 2022 (unaudited)
Real Estate UltraSector ProFund invested in the following industries asof January 31, 2022:
% ofValue Net Assets
Equity Real Estate Investment Trusts $11,708,389 63.9%Interactive Media & Services 90,263 0.5%Mortgage Real Estate Investment Trusts 320,230 1.7%Professional Services 239,666 1.3%Real Estate Management & Development 499,335 2.7%Other** 5,470,647 29.9%
Total $18,328,530 100.0%
** Includes any non-equity securities and net other assets (liabilities),which includes any receivable for capital shares issued andpayable for capital shares redeemed.
See accompanying notes to the financial statements.
Toppan Merrill - ProFunds Public Semi-Annual Report [Funds] 01-31-2022 ED [AUX] | akiesli | 29-Mar-22 08:43 | 22-1296-2.dg | Sequence: 9CHKSUM Content: 36493 Layout: 42256 Graphics: 0 CLEAN
JOB: 22-1296-2 CYCLE#;BL#: 8; 0 TRIM: 8.25" x 10.75" AS: New York: 212-620-5600COLORS: ~note-color 2, Black, ~note-color 3 GRAPHICS: none V1.5

(a) The ProFund invests in Repurchase Agreements jointly with otherfunds in the Trust. See “Repurchase Agreements” under Note 2in the Notes to the Financial Statements to view the details ofeach individual agreement and counterparty as well as adescription of the securities subject to repurchase.
(b) A portion of these securities were held in a segregated accountfor the benefit of swap counterparties in the event of default. Asof January 31, 2022, the aggregate amount held in a segregatedaccount was $520,000.
Repurchase Agreements(a)(b) (106.6%)
Principal Amount Value
Repurchase Agreements with various counterparties, 0.00%, dated 1/31/22, due 2/1/22, total to be received $12,253,000 $12,253,000 $12,253,000
TOTAL REPURCHASE AGREEMENTS
(Cost $12,253,000) 12,253,000
TOTAL INVESTMENT SECURITIES
(Cost $12,253,000)—106.6% 12,253,000Net other assets (liabilities)—(6.6)% (760,866)
NET ASSETS—100.0% $11,492,134
January 31, 2022 (unaudited) :: Schedule of Portfolio Investments :: Rising Rates Opportunity ProFund :: 109
See accompanying notes to the financial statements.
Total Return Swap Agreements—Short
Value and Unrealized
Termination Rate Paid Notional Appreciation/ Underlying Instrument Counterparty Date(1) (Received)(2) Amount (Depreciation)
30-Year U.S. Treasury Bond, 1.875%, due 11/15/51 Citibank North America 2/15/22 0.15% $(11,653,416) $(494,519)30-Year U.S. Treasury Bond, 1.875%, due 11/15/51 Societe’ Generale 2/15/22 0.20% (2,749,789) (54,032)
$(14,403,205) $(548,551)
(1) Agreements may be terminated at will by either party without penalty. Payment is due at termination/maturity.(2) Reflects the floating financing rate, as of January 31, 2022, on the notional amount of the swap agreement paid to the counterparty or
received from the counterparty, excluding any commissions. This amount is included as part of the unrealized appreciation/(depreciation).
Toppan Merrill - ProFunds Public Semi-Annual Report [Funds] 01-31-2022 ED [AUX] | akiesli | 29-Mar-22 08:43 | 22-1296-2.dg | Sequence: 10CHKSUM Content: 46497 Layout: 55031 Graphics: 0 CLEAN
JOB: 22-1296-2 CYCLE#;BL#: 8; 0 TRIM: 8.25" x 10.75" AS: New York: 212-620-5600COLORS: ~note-color 2, Black, ~note-color 3 GRAPHICS: none V1.5
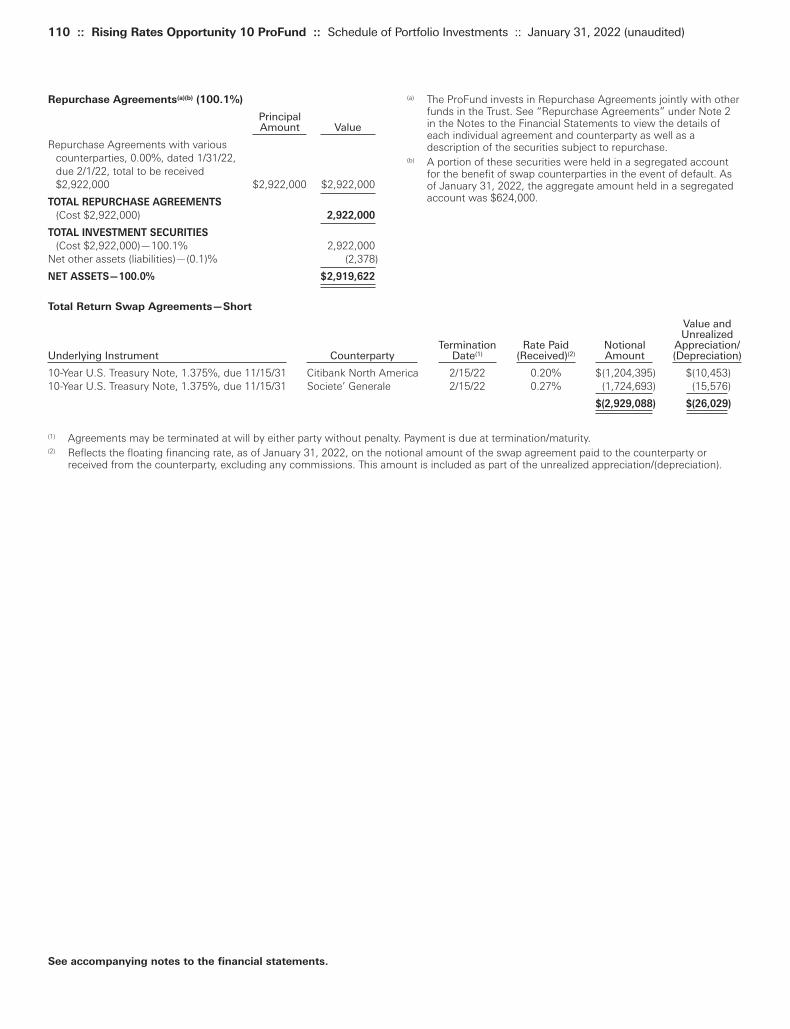
110 :: Rising Rates Opportunity 10 ProFund :: Schedule of Portfolio Investments :: January 31, 2022 (unaudited)
(a) The ProFund invests in Repurchase Agreements jointly with otherfunds in the Trust. See “Repurchase Agreements” under Note 2in the Notes to the Financial Statements to view the details ofeach individual agreement and counterparty as well as adescription of the securities subject to repurchase.
(b) A portion of these securities were held in a segregated accountfor the benefit of swap counterparties in the event of default. Asof January 31, 2022, the aggregate amount held in a segregatedaccount was $624,000.
Repurchase Agreements(a)(b) (100.1%)
Principal Amount Value
Repurchase Agreements with various counterparties, 0.00%, dated 1/31/22, due 2/1/22, total to be received $2,922,000 $2,922,000 $2,922,000
TOTAL REPURCHASE AGREEMENTS
(Cost $2,922,000) 2,922,000
TOTAL INVESTMENT SECURITIES
(Cost $2,922,000)—100.1% 2,922,000Net other assets (liabilities)—(0.1)% (2,378)
NET ASSETS—100.0% $2,919,622
See accompanying notes to the financial statements.
Total Return Swap Agreements—Short
Value and Unrealized
Termination Rate Paid Notional Appreciation/ Underlying Instrument Counterparty Date(1) (Received)(2) Amount (Depreciation)
10-Year U.S. Treasury Note, 1.375%, due 11/15/31 Citibank North America 2/15/22 0.20% $(1,204,395) $(10,453)10-Year U.S. Treasury Note, 1.375%, due 11/15/31 Societe’ Generale 2/15/22 0.27% (1,724,693) (15,576)
$(2,929,088) $(26,029)
(1) Agreements may be terminated at will by either party without penalty. Payment is due at termination/maturity.(2) Reflects the floating financing rate, as of January 31, 2022, on the notional amount of the swap agreement paid to the counterparty or
received from the counterparty, excluding any commissions. This amount is included as part of the unrealized appreciation/(depreciation).
Toppan Merrill - ProFunds Public Semi-Annual Report [Funds] 01-31-2022 ED [AUX] | akiesli | 29-Mar-22 08:43 | 22-1296-2.dg | Sequence: 11CHKSUM Content: 62561 Layout: 59454 Graphics: 0 CLEAN
JOB: 22-1296-2 CYCLE#;BL#: 8; 0 TRIM: 8.25" x 10.75" AS: New York: 212-620-5600COLORS: ~note-color 2, Black, ~note-color 3 GRAPHICS: none V1.5
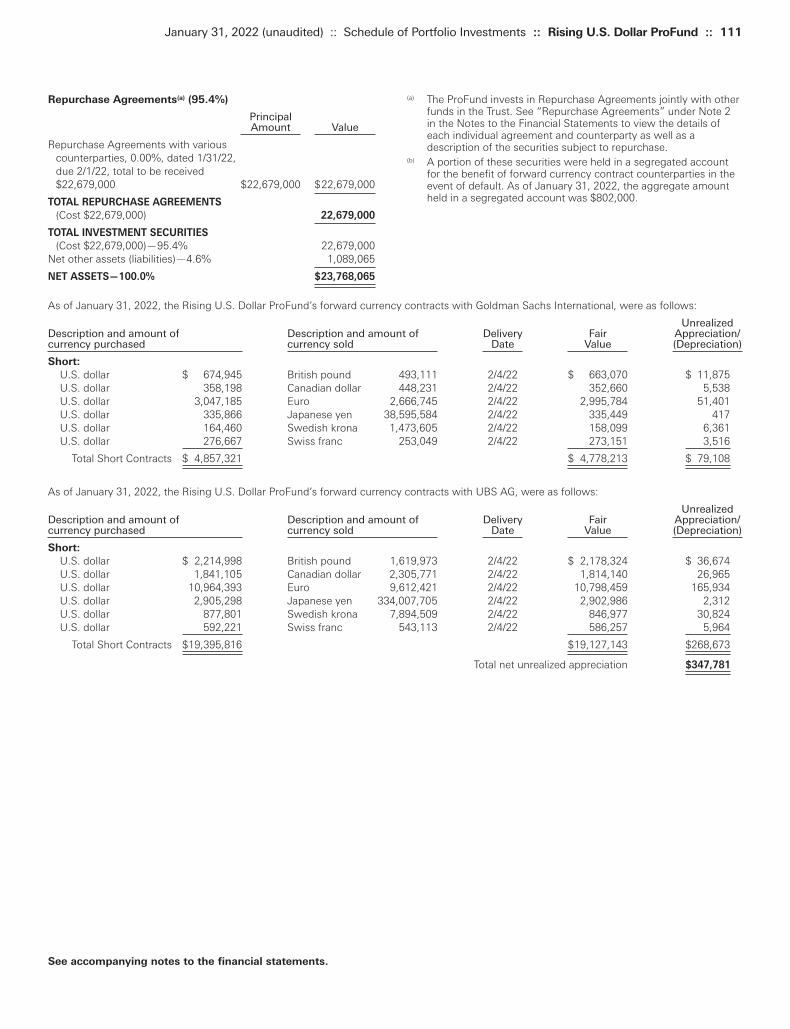
(a) The ProFund invests in Repurchase Agreements jointly with otherfunds in the Trust. See “Repurchase Agreements” under Note 2in the Notes to the Financial Statements to view the details ofeach individual agreement and counterparty as well as adescription of the securities subject to repurchase.
(b) A portion of these securities were held in a segregated accountfor the benefit of forward currency contract counterparties in theevent of default. As of January 31, 2022, the aggregate amountheld in a segregated account was $802,000.
Repurchase Agreements(a) (95.4%)
PrincipalAmount Value
Repurchase Agreements with various counterparties, 0.00%, dated 1/31/22, due 2/1/22, total to be received $22,679,000 $22,679,000 $22,679,000
TOTAL REPURCHASE AGREEMENTS
(Cost $22,679,000) 22,679,000
TOTAL INVESTMENT SECURITIES
(Cost $22,679,000)—95.4% 22,679,000Net other assets (liabilities)—4.6% 1,089,065
NET ASSETS—100.0% $23,768,065
January 31, 2022 (unaudited) :: Schedule of Portfolio Investments :: Rising U.S. Dollar ProFund :: 111
See accompanying notes to the financial statements.
As of January 31, 2022, the Rising U.S. Dollar ProFund’s forward currency contracts with Goldman Sachs International, were as follows:
UnrealizedDescription and amount of Description and amount of Delivery Fair Appreciation/currency purchased currency sold Date Value (Depreciation)
Short:
U.S. dollar $ 674,945 British pound 493,111 2/4/22 $ 663,070 $ 11,875U.S. dollar 358,198 Canadian dollar 448,231 2/4/22 352,660 5,538U.S. dollar 3,047,185 Euro 2,666,745 2/4/22 2,995,784 51,401U.S. dollar 335,866 Japanese yen 38,595,584 2/4/22 335,449 417U.S. dollar 164,460 Swedish krona 1,473,605 2/4/22 158,099 6,361U.S. dollar 276,667 Swiss franc 253,049 2/4/22 273,151 3,516
Total Short Contracts $ 4,857,321 $ 4,778,213 $ 79,108
As of January 31, 2022, the Rising U.S. Dollar ProFund’s forward currency contracts with UBS AG, were as follows:
UnrealizedDescription and amount of Description and amount of Delivery Fair Appreciation/currency purchased currency sold Date Value (Depreciation)
Short:
U.S. dollar $ 2,214,998 British pound 1,619,973 2/4/22 $ 2,178,324 $ 36,674U.S. dollar 1,841,105 Canadian dollar 2,305,771 2/4/22 1,814,140 26,965U.S. dollar 10,964,393 Euro 9,612,421 2/4/22 10,798,459 165,934U.S. dollar 2,905,298 Japanese yen 334,007,705 2/4/22 2,902,986 2,312U.S. dollar 877,801 Swedish krona 7,894,509 2/4/22 846,977 30,824U.S. dollar 592,221 Swiss franc 543,113 2/4/22 586,257 5,964
Total Short Contracts $19,395,816 $19,127,143 $268,673
Total net unrealized appreciation $347,781
Toppan Merrill - ProFunds Public Semi-Annual Report [Funds] 01-31-2022 ED [AUX] | akiesli | 29-Mar-22 08:43 | 22-1296-2.dg | Sequence: 12CHKSUM Content: 62291 Layout: 27215 Graphics: 0 CLEAN
JOB: 22-1296-2 CYCLE#;BL#: 8; 0 TRIM: 8.25" x 10.75" AS: New York: 212-620-5600COLORS: ~note-color 2, Black, ~note-color 3 GRAPHICS: none V1.5

112 :: Semiconductor UltraSector ProFund :: Schedule of Portfolio Investments :: January 31, 2022 (unaudited)
Common Stocks, continued
Shares Value
Qorvo, Inc.* (Semiconductors & Semiconductor Equipment) 3,636 $ 499,150
Qualcomm, Inc. (Semiconductors & Semiconductor Equipment) 36,952 6,494,684
Semtech Corp.* (Semiconductors & Semiconductor Equipment) 2,125 151,088
Silicon Laboratories, Inc.* (Semiconductors & Semiconductor Equipment) 1,327 219,207
Skyworks Solutions, Inc. (Semiconductors & Semiconductor Equipment) 5,448 798,241
SolarEdge Technologies, Inc.* (Semiconductors & Semiconductor Equipment) 1,732 412,597
Teradyne, Inc. (Semiconductors & Semiconductor Equipment) 5,378 631,539
Texas Instruments, Inc. (Semiconductors & Semiconductor Equipment) 30,470 5,469,060
Universal Display Corp. (Semiconductors & Semiconductor Equipment) 1,432 219,826
Wolfspeed, Inc.* (Semiconductors & Semiconductor Equipment) 3,824 360,374
Xilinx, Inc. (Semiconductors & Semiconductor Equipment) 8,178 1,582,852
TOTAL COMMON STOCKS
(Cost $32,153,216) 79,855,033
Repurchase Agreements(a)(b) (25.4%)
PrincipalAmount Value
Repurchase Agreements with various counterparties, 0.00%, dated 1/31/22, due 2/1/22, total to be received $26,251,000 $26,251,000 $ 26,251,000
TOTAL REPURCHASE AGREEMENTS
(Cost $26,251,000) 26,251,000
TOTAL INVESTMENT SECURITIES
(Cost $58,404,216)—102.8% 106,106,033Net other assets (liabilities)—(2.8)% (2,855,990)
NET ASSETS—100.0% $103,250,043
* Non-income producing security.(a) The ProFund invests in Repurchase Agreements jointly with other
funds in the Trust. See “Repurchase Agreements” under Note 2in the Notes to the Financial Statements to view the details ofeach individual agreement and counterparty as well as adescription of the securities subject to repurchase.
(b) A portion of these securities were held in a segregated accountfor the benefit of swap counterparties in the event of default. Asof January 31, 2022, the aggregate amount held in a segregatedaccount was $15,771,000.
Common Stocks (77.4%)
Shares Value
Advanced Micro Devices, Inc.* (Semiconductors & Semiconductor Equipment) 39,839 $ 4,551,606
Allegro MicroSystems, Inc.* (Semiconductors & Semiconductor Equipment) 1,812 51,425
Amkor Technology, Inc. (Semiconductors & Semiconductor Equipment) 3,307 72,820
Analog Devices, Inc. (Semiconductors & Semiconductor Equipment) 17,730 2,907,188
Applied Materials, Inc. (Semiconductors & Semiconductor Equipment) 29,789 4,116,244
Azenta, Inc. (Semiconductors & Semiconductor Equipment) 2,452 206,802
Broadcom, Inc. (Semiconductors & Semiconductor Equipment) 13,580 7,956,249
Cirrus Logic, Inc.* (Semiconductors & Semiconductor Equipment) 1,885 168,594
Enphase Energy, Inc.* (Semiconductors & Semiconductor Equipment) 4,451 625,232
Entegris, Inc. (Semiconductors & Semiconductor Equipment) 4,470 535,685
GLOBALFOUNDRIES, Inc.* (Semiconductors & Semiconductor Equipment) 1,763 86,986
Intel Corp. (Semiconductors & Semiconductor Equipment) 134,180 6,550,667
KLA Corp. (Semiconductors & Semiconductor Equipment) 5,003 1,947,518
Lam Research Corp. (Semiconductors & Semiconductor Equipment) 4,641 2,737,819
Lattice Semiconductor Corp.* (Semiconductors & Semiconductor Equipment) 4,517 249,429
Marvell Technology, Inc. (Semiconductors & Semiconductor Equipment) 27,174 1,940,224
Microchip Technology, Inc. (Semiconductors & Semiconductor Equipment) 18,305 1,418,271
Micron Technology, Inc. (Semiconductors & Semiconductor Equipment) 36,907 3,036,339
MKS Instruments, Inc. (Semiconductors & Semiconductor Equipment) 1,829 284,099
Monolithic Power Systems, Inc. (Semiconductors & Semiconductor Equipment) 1,430 576,190
NVIDIA Corp. (Semiconductors & Semiconductor Equipment) 82,477 20,195,317
NXP Semiconductors N.V. (Semiconductors & Semiconductor Equipment) 8,774 1,802,531
ON Semiconductor Corp.* (Semiconductors & Semiconductor Equipment) 14,213 838,567
Power Integrations, Inc. (Semiconductors & Semiconductor Equipment) 1,990 160,613
See accompanying notes to the financial statements.
Toppan Merrill - ProFunds Public Semi-Annual Report [Funds] 01-31-2022 ED [AUX] | akiesli | 29-Mar-22 08:43 | 22-1296-2.dg | Sequence: 13CHKSUM Content: 57555 Layout: 21442 Graphics: 0 CLEAN
JOB: 22-1296-2 CYCLE#;BL#: 8; 0 TRIM: 8.25" x 10.75" AS: New York: 212-620-5600COLORS: ~note-color 2, Black, ~note-color 3 GRAPHICS: none V1.5
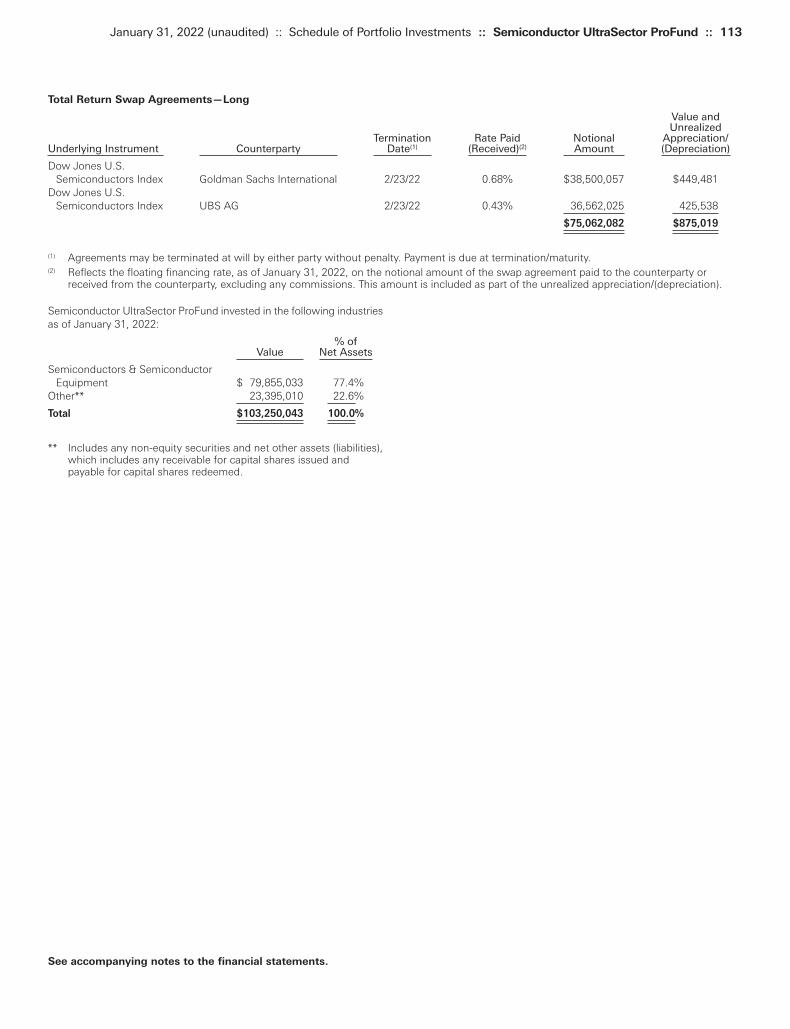
Total Return Swap Agreements—Long
Value and Unrealized
Termination Rate Paid Notional Appreciation/ Underlying Instrument Counterparty Date(1) (Received)(2) Amount (Depreciation)
Dow Jones U.S. Semiconductors Index Goldman Sachs International 2/23/22 0.68% $38,500,057 $449,481
Dow Jones U.S. Semiconductors Index UBS AG 2/23/22 0.43% 36,562,025 425,538
$75,062,082 $875,019
(1) Agreements may be terminated at will by either party without penalty. Payment is due at termination/maturity.(2) Reflects the floating financing rate, as of January 31, 2022, on the notional amount of the swap agreement paid to the counterparty or
received from the counterparty, excluding any commissions. This amount is included as part of the unrealized appreciation/(depreciation).
January 31, 2022 (unaudited) :: Schedule of Portfolio Investments :: Semiconductor UltraSector ProFund :: 113
See accompanying notes to the financial statements.
Semiconductor UltraSector ProFund invested in the following industriesas of January 31, 2022:
% ofValue Net Assets
Semiconductors & Semiconductor Equipment $ 79,855,033 77.4%
Other** 23,395,010 22.6%
Total $103,250,043 100.0%
** Includes any non-equity securities and net other assets (liabilities),which includes any receivable for capital shares issued andpayable for capital shares redeemed.
Toppan Merrill - ProFunds Public Semi-Annual Report [Funds] 01-31-2022 ED [AUX] | akiesli | 29-Mar-22 08:43 | 22-1296-2.dg | Sequence: 14CHKSUM Content: 24768 Layout: 45197 Graphics: 0 CLEAN
JOB: 22-1296-2 CYCLE#;BL#: 8; 0 TRIM: 8.25" x 10.75" AS: New York: 212-620-5600COLORS: ~note-color 2, Black, ~note-color 3 GRAPHICS: none V1.5
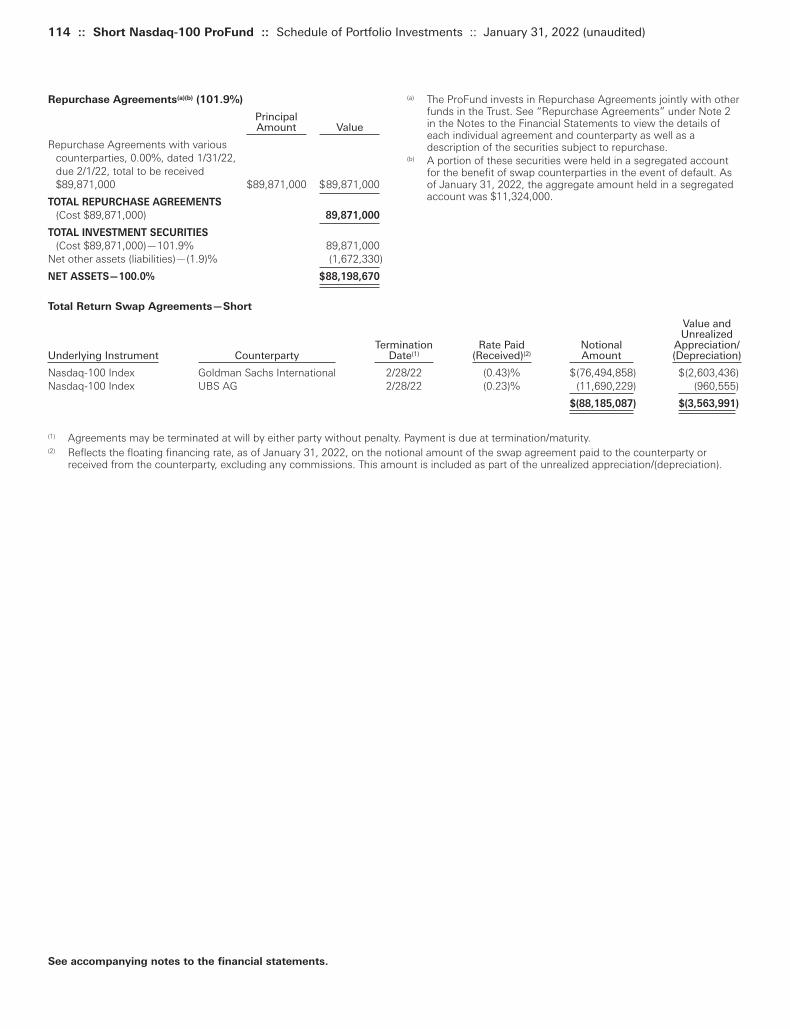
114 :: Short Nasdaq-100 ProFund :: Schedule of Portfolio Investments :: January 31, 2022 (unaudited)
(a) The ProFund invests in Repurchase Agreements jointly with otherfunds in the Trust. See “Repurchase Agreements” under Note 2in the Notes to the Financial Statements to view the details ofeach individual agreement and counterparty as well as adescription of the securities subject to repurchase.
(b) A portion of these securities were held in a segregated accountfor the benefit of swap counterparties in the event of default. Asof January 31, 2022, the aggregate amount held in a segregatedaccount was $11,324,000.
Repurchase Agreements(a)(b) (101.9%)
Principal Amount Value
Repurchase Agreements with various counterparties, 0.00%, dated 1/31/22, due 2/1/22, total to be received $89,871,000 $89,871,000 $89,871,000
TOTAL REPURCHASE AGREEMENTS
(Cost $89,871,000) 89,871,000
TOTAL INVESTMENT SECURITIES
(Cost $89,871,000)—101.9% 89,871,000Net other assets (liabilities)—(1.9)% (1,672,330)
NET ASSETS—100.0% $88,198,670
See accompanying notes to the financial statements.
Total Return Swap Agreements—Short
Value and Unrealized
Termination Rate Paid Notional Appreciation/Underlying Instrument Counterparty Date(1) (Received)(2) Amount (Depreciation)
Nasdaq-100 Index Goldman Sachs International 2/28/22 (0.43)% $(76,494,858) $(2,603,436)Nasdaq-100 Index UBS AG 2/28/22 (0.23)% (11,690,229) (960,555)
$(88,185,087) $(3,563,991)
(1) Agreements may be terminated at will by either party without penalty. Payment is due at termination/maturity.(2) Reflects the floating financing rate, as of January 31, 2022, on the notional amount of the swap agreement paid to the counterparty or
received from the counterparty, excluding any commissions. This amount is included as part of the unrealized appreciation/(depreciation).
Toppan Merrill - ProFunds Public Semi-Annual Report [Funds] 01-31-2022 ED [AUX] | akiesli | 29-Mar-22 08:43 | 22-1296-2.di | Sequence: 1CHKSUM Content: 4531 Layout: 22605 Graphics: 0 CLEAN
JOB: 22-1296-2 CYCLE#;BL#: 8; 0 TRIM: 8.25" x 10.75" AS: New York: 212-620-5600COLORS: ~note-color 2, Black, ~note-color 3 GRAPHICS: none V1.5

(a) The ProFund invests in Repurchase Agreements jointly with otherfunds in the Trust. See “Repurchase Agreements” under Note 2in the Notes to the Financial Statements to view the details ofeach individual agreement and counterparty as well as adescription of the securities subject to repurchase.
(b) A portion of these securities were held in a segregated accountfor the benefit of swap counterparties in the event of default. Asof January 31, 2022, the aggregate amount held in a segregatedaccount was $341,000.
Repurchase Agreements(a)(b) (104.6%)
PrincipalAmount Value
Repurchase Agreements with various counterparties, 0.00%, dated 1/31/22, due 2/1/22, total to be received $401,000 $401,000 $401,000
TOTAL REPURCHASE AGREEMENTS
(Cost $401,000) 401,000
TOTAL INVESTMENT SECURITIES
(Cost $401,000)—104.6% 401,000Net other assets (liabilities)—(4.6)% (17,498)
NET ASSETS—100.0% $383,502
January 31, 2022 (unaudited) :: Schedule of Portfolio Investments :: Short Oil & Gas ProFund :: 115
See accompanying notes to the financial statements.
Total Return Swap Agreements—Short
Value and Unrealized
Termination Rate Paid Notional Appreciation/Underlying Instrument Counterparty Date(1) (Received)(2) Amount (Depreciation)
Dow Jones U.S. Oil & Gas Index Goldman Sachs International 2/23/22 (0.18)% $(222,090) $(11,012)
Dow Jones U.S. Oil & Gas Index UBS AG 2/23/22 0.07% (159,730) (8,648)
$(381,820) $(19,660)
(1) Agreements may be terminated at will by either party without penalty. Payment is due at termination/maturity.(2) Reflects the floating financing rate, as of January 31, 2022, on the notional amount of the swap agreement paid to the counterparty or
received from the counterparty, excluding any commissions. This amount is included as part of the unrealized appreciation/(depreciation).
Toppan Merrill - ProFunds Public Semi-Annual Report [Funds] 01-31-2022 ED [AUX] | akiesli | 29-Mar-22 08:43 | 22-1296-2.di | Sequence: 2CHKSUM Content: 44045 Layout: 54913 Graphics: 0 CLEAN
JOB: 22-1296-2 CYCLE#;BL#: 8; 0 TRIM: 8.25" x 10.75" AS: New York: 212-620-5600COLORS: ~note-color 2, Black, ~note-color 3 GRAPHICS: none V1.5
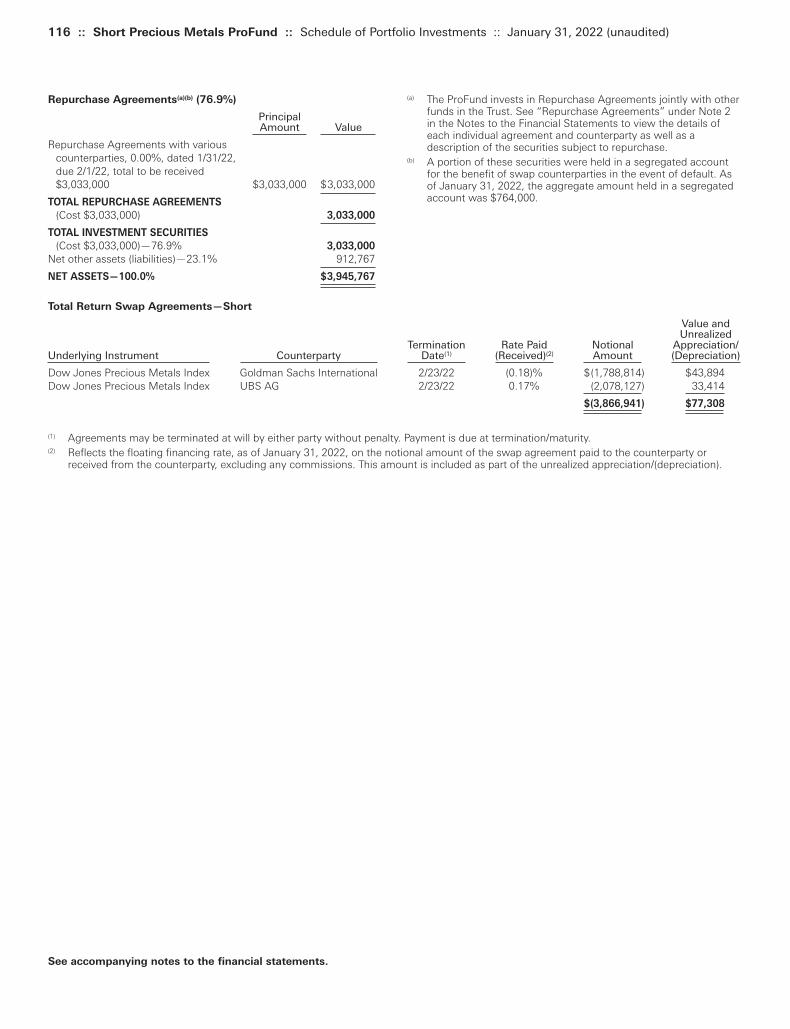
116 :: Short Precious Metals ProFund :: Schedule of Portfolio Investments :: January 31, 2022 (unaudited)
(a) The ProFund invests in Repurchase Agreements jointly with otherfunds in the Trust. See “Repurchase Agreements” under Note 2in the Notes to the Financial Statements to view the details ofeach individual agreement and counterparty as well as adescription of the securities subject to repurchase.
(b) A portion of these securities were held in a segregated accountfor the benefit of swap counterparties in the event of default. Asof January 31, 2022, the aggregate amount held in a segregatedaccount was $764,000.
Repurchase Agreements(a)(b) (76.9%)
PrincipalAmount Value
Repurchase Agreements with various counterparties, 0.00%, dated 1/31/22, due 2/1/22, total to be received $3,033,000 $3,033,000 $3,033,000
TOTAL REPURCHASE AGREEMENTS
(Cost $3,033,000) 3,033,000
TOTAL INVESTMENT SECURITIES
(Cost $3,033,000)—76.9% 3,033,000
Net other assets (liabilities)—23.1% 912,767
NET ASSETS—100.0% $3,945,767
See accompanying notes to the financial statements.
Total Return Swap Agreements—Short
Value andUnrealized
Termination Rate Paid Notional Appreciation/Underlying Instrument Counterparty Date(1) (Received)(2) Amount (Depreciation)
Dow Jones Precious Metals Index Goldman Sachs International 2/23/22 (0.18)% $(1,788,814) $43,894Dow Jones Precious Metals Index UBS AG 2/23/22 0.17% (2,078,127) 33,414
$(3,866,941) $77,308
(1) Agreements may be terminated at will by either party without penalty. Payment is due at termination/maturity.(2) Reflects the floating financing rate, as of January 31, 2022, on the notional amount of the swap agreement paid to the counterparty or
received from the counterparty, excluding any commissions. This amount is included as part of the unrealized appreciation/(depreciation).
Toppan Merrill - ProFunds Public Semi-Annual Report [Funds] 01-31-2022 ED [AUX] | akiesli | 29-Mar-22 08:43 | 22-1296-2.di | Sequence: 3CHKSUM Content: 5999 Layout: 485 Graphics: 0 CLEAN
JOB: 22-1296-2 CYCLE#;BL#: 8; 0 TRIM: 8.25" x 10.75" AS: New York: 212-620-5600COLORS: ~note-color 2, Black, ~note-color 3 GRAPHICS: none V1.5
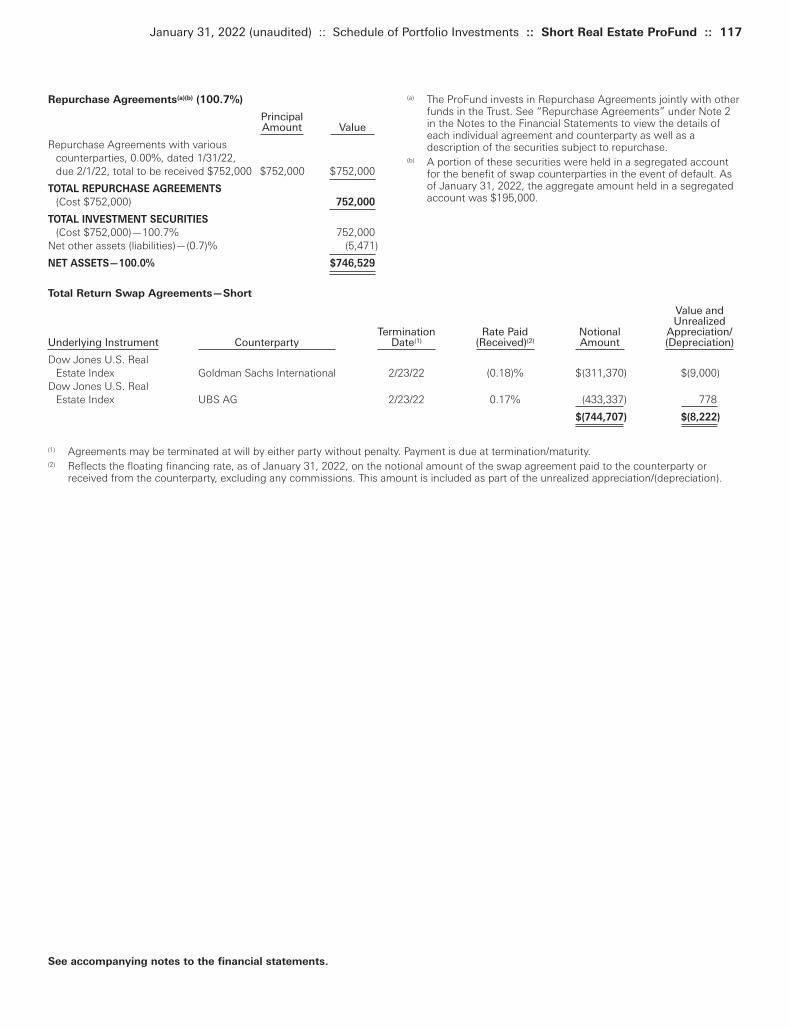
(a) The ProFund invests in Repurchase Agreements jointly with otherfunds in the Trust. See “Repurchase Agreements” under Note 2in the Notes to the Financial Statements to view the details ofeach individual agreement and counterparty as well as adescription of the securities subject to repurchase.
(b) A portion of these securities were held in a segregated accountfor the benefit of swap counterparties in the event of default. Asof January 31, 2022, the aggregate amount held in a segregatedaccount was $195,000.
Repurchase Agreements(a)(b) (100.7%)
PrincipalAmount Value
Repurchase Agreements with various counterparties, 0.00%, dated 1/31/22, due 2/1/22, total to be received $752,000 $752,000 $752,000
TOTAL REPURCHASE AGREEMENTS
(Cost $752,000) 752,000
TOTAL INVESTMENT SECURITIES
(Cost $752,000)—100.7% 752,000Net other assets (liabilities)—(0.7)% (5,471)
NET ASSETS—100.0% $746,529
January 31, 2022 (unaudited) :: Schedule of Portfolio Investments :: Short Real Estate ProFund :: 117
See accompanying notes to the financial statements.
Total Return Swap Agreements—Short
Value and Unrealized
Termination Rate Paid Notional Appreciation/Underlying Instrument Counterparty Date(1) (Received)(2) Amount (Depreciation)
Dow Jones U.S. Real Estate Index Goldman Sachs International 2/23/22 (0.18)% $(311,370) $(9,000)
Dow Jones U.S. Real Estate Index UBS AG 2/23/22 0.17% (433,337) 778
$(744,707) $(8,222)
(1) Agreements may be terminated at will by either party without penalty. Payment is due at termination/maturity.(2) Reflects the floating financing rate, as of January 31, 2022, on the notional amount of the swap agreement paid to the counterparty or
received from the counterparty, excluding any commissions. This amount is included as part of the unrealized appreciation/(depreciation).
Toppan Merrill - ProFunds Public Semi-Annual Report [Funds] 01-31-2022 ED [AUX] | akiesli | 29-Mar-22 08:43 | 22-1296-2.di | Sequence: 4CHKSUM Content: 51341 Layout: 33281 Graphics: 0 CLEAN
JOB: 22-1296-2 CYCLE#;BL#: 8; 0 TRIM: 8.25" x 10.75" AS: New York: 212-620-5600COLORS: ~note-color 2, Black, ~note-color 3 GRAPHICS: none V1.5

118 :: Short Small-Cap ProFund :: Schedule of Portfolio Investments :: January 31, 2022 (unaudited)
(a) The ProFund invests in Repurchase Agreements jointly with otherfunds in the Trust. See “Repurchase Agreements” under Note 2in the Notes to the Financial Statements to view the details ofeach individual agreement and counterparty as well as adescription of the securities subject to repurchase.
(b) A portion of these securities were held in a segregated accountfor the benefit of swap counterparties in the event of default. Asof January 31, 2022, the aggregate amount held in a segregatedaccount was $492,000.
Repurchase Agreements(a)(b) (124.6%)
PrincipalAmount Value
Repurchase Agreements with various counterparties, 0.00%, dated 1/31/22, due 2/1/22, total to be received $1,482,000 $1,482,000 $1,482,000
TOTAL REPURCHASE AGREEMENTS
(Cost $1,482,000) 1,482,000
TOTAL INVESTMENT SECURITIES
(Cost $1,482,000)—124.6% 1,482,000Net other assets (liabilities)—(24.6)% (292,967)
NET ASSETS—100.0% $1,189,033
See accompanying notes to the financial statements.
Futures Contracts Sold
Value and Number Unrealized
of Expiration Notional Appreciation/ Contracts Date Amount (Depreciation)
E-Mini Russell 2000 Index Futures Contracts 1 3/21/22 $(101,220) $9,225
Total Return Swap Agreements—Short
Value and Unrealized
Termination Rate Paid Notional Appreciation/ Underlying Instrument Counterparty Date(1) (Received)(2) Amount (Depreciation)
Russell 2000 Index Goldman Sachs International 2/28/22 (0.08)% $ (537,539) $(40,037)Russell 2000 Index UBS AG 2/28/22 0.42% (551,738) (26,485)
$(1,089,277) $(66,522)
(1) Agreements may be terminated at will by either party without penalty. Payment is due at termination/maturity.(2) Reflects the floating financing rate, as of January 31, 2022, on the notional amount of the swap agreement paid to the counterparty or
received from the counterparty, excluding any commissions. This amount is included as part of the unrealized appreciation/(depreciation).
Toppan Merrill - ProFunds Public Semi-Annual Report [Funds] 01-31-2022 ED [AUX] | akiesli | 29-Mar-22 08:43 | 22-1296-2.di | Sequence: 5CHKSUM Content: 40466 Layout: 26322 Graphics: 0 CLEAN
JOB: 22-1296-2 CYCLE#;BL#: 8; 0 TRIM: 8.25" x 10.75" AS: New York: 212-620-5600COLORS: ~note-color 2, Black, ~note-color 3 GRAPHICS: none V1.5
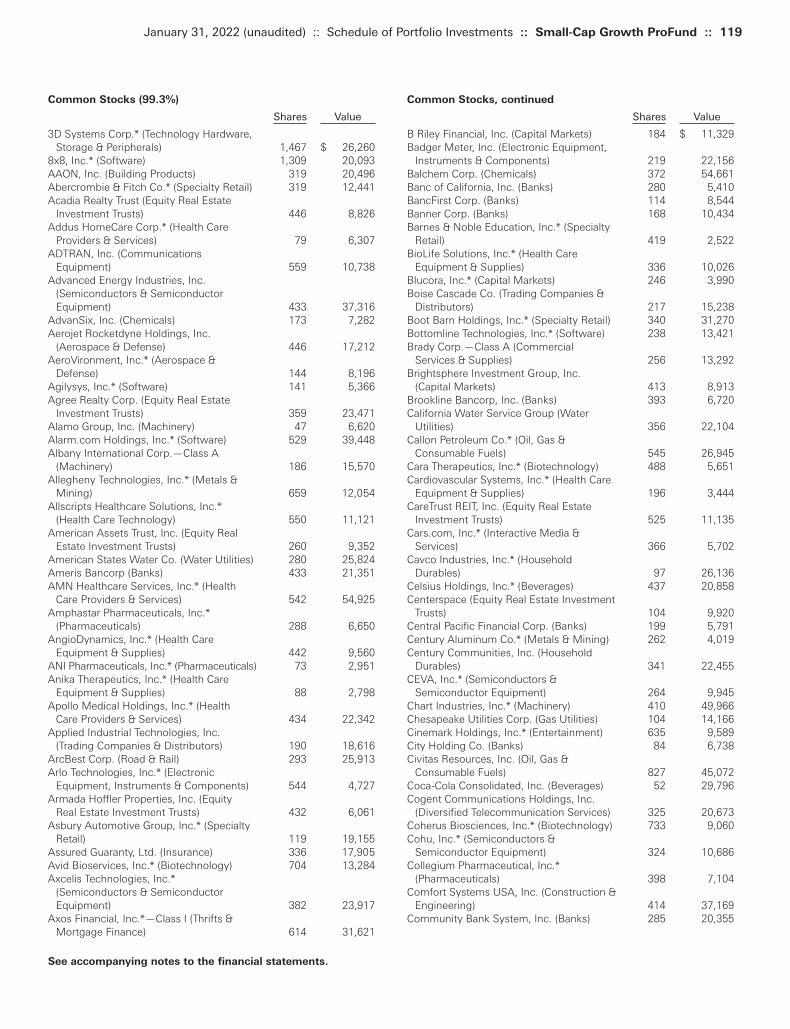
Common Stocks, continued
Shares Value
B Riley Financial, Inc. (Capital Markets) 184 $ 11,329Badger Meter, Inc. (Electronic Equipment,
Instruments & Components) 219 22,156Balchem Corp. (Chemicals) 372 54,661Banc of California, Inc. (Banks) 280 5,410BancFirst Corp. (Banks) 114 8,544Banner Corp. (Banks) 168 10,434Barnes & Noble Education, Inc.* (Specialty
Retail) 419 2,522BioLife Solutions, Inc.* (Health Care
Equipment & Supplies) 336 10,026Blucora, Inc.* (Capital Markets) 246 3,990Boise Cascade Co. (Trading Companies &
Distributors) 217 15,238Boot Barn Holdings, Inc.* (Specialty Retail) 340 31,270Bottomline Technologies, Inc.* (Software) 238 13,421Brady Corp.—Class A (Commercial
Services & Supplies) 256 13,292Brightsphere Investment Group, Inc.
(Capital Markets) 413 8,913Brookline Bancorp, Inc. (Banks) 393 6,720California Water Service Group (Water
Utilities) 356 22,104Callon Petroleum Co.* (Oil, Gas &
Consumable Fuels) 545 26,945Cara Therapeutics, Inc.* (Biotechnology) 488 5,651Cardiovascular Systems, Inc.* (Health Care
Equipment & Supplies) 196 3,444CareTrust REIT, Inc. (Equity Real Estate
Investment Trusts) 525 11,135Cars.com, Inc.* (Interactive Media &
Services) 366 5,702Cavco Industries, Inc.* (Household
Durables) 97 26,136Celsius Holdings, Inc.* (Beverages) 437 20,858Centerspace (Equity Real Estate Investment
Trusts) 104 9,920Central Pacific Financial Corp. (Banks) 199 5,791Century Aluminum Co.* (Metals & Mining) 262 4,019Century Communities, Inc. (Household
Durables) 341 22,455CEVA, Inc.* (Semiconductors &
Semiconductor Equipment) 264 9,945Chart Industries, Inc.* (Machinery) 410 49,966Chesapeake Utilities Corp. (Gas Utilities) 104 14,166Cinemark Holdings, Inc.* (Entertainment) 635 9,589City Holding Co. (Banks) 84 6,738Civitas Resources, Inc. (Oil, Gas &
Consumable Fuels) 827 45,072Coca-Cola Consolidated, Inc. (Beverages) 52 29,796Cogent Communications Holdings, Inc.
(Diversified Telecommunication Services) 325 20,673Coherus Biosciences, Inc.* (Biotechnology) 733 9,060Cohu, Inc.* (Semiconductors &
Semiconductor Equipment) 324 10,686Collegium Pharmaceutical, Inc.*
(Pharmaceuticals) 398 7,104Comfort Systems USA, Inc. (Construction &
Engineering) 414 37,169Community Bank System, Inc. (Banks) 285 20,355
Common Stocks (99.3%)
Shares Value
3D Systems Corp.* (Technology Hardware, Storage & Peripherals) 1,467 $ 26,260
8x8, Inc.* (Software) 1,309 20,093AAON, Inc. (Building Products) 319 20,496Abercrombie & Fitch Co.* (Specialty Retail) 319 12,441Acadia Realty Trust (Equity Real Estate
Investment Trusts) 446 8,826Addus HomeCare Corp.* (Health Care
Providers & Services) 79 6,307ADTRAN, Inc. (Communications
Equipment) 559 10,738Advanced Energy Industries, Inc.
(Semiconductors & Semiconductor Equipment) 433 37,316
AdvanSix, Inc. (Chemicals) 173 7,282Aerojet Rocketdyne Holdings, Inc.
(Aerospace & Defense) 446 17,212AeroVironment, Inc.* (Aerospace &
Defense) 144 8,196Agilysys, Inc.* (Software) 141 5,366Agree Realty Corp. (Equity Real Estate
Investment Trusts) 359 23,471Alamo Group, Inc. (Machinery) 47 6,620Alarm.com Holdings, Inc.* (Software) 529 39,448Albany International Corp.—Class A
(Machinery) 186 15,570Allegheny Technologies, Inc.* (Metals &
Mining) 659 12,054Allscripts Healthcare Solutions, Inc.*
(Health Care Technology) 550 11,121American Assets Trust, Inc. (Equity Real
Estate Investment Trusts) 260 9,352American States Water Co. (Water Utilities) 280 25,824Ameris Bancorp (Banks) 433 21,351AMN Healthcare Services, Inc.* (Health
Care Providers & Services) 542 54,925Amphastar Pharmaceuticals, Inc.*
(Pharmaceuticals) 288 6,650AngioDynamics, Inc.* (Health Care
Equipment & Supplies) 442 9,560ANI Pharmaceuticals, Inc.* (Pharmaceuticals) 73 2,951Anika Therapeutics, Inc.* (Health Care
Equipment & Supplies) 88 2,798Apollo Medical Holdings, Inc.* (Health
Care Providers & Services) 434 22,342Applied Industrial Technologies, Inc.
(Trading Companies & Distributors) 190 18,616ArcBest Corp. (Road & Rail) 293 25,913Arlo Technologies, Inc.* (Electronic
Equipment, Instruments & Components) 544 4,727Armada Hoffler Properties, Inc. (Equity
Real Estate Investment Trusts) 432 6,061Asbury Automotive Group, Inc.* (Specialty
Retail) 119 19,155Assured Guaranty, Ltd. (Insurance) 336 17,905Avid Bioservices, Inc.* (Biotechnology) 704 13,284Axcelis Technologies, Inc.*
(Semiconductors & Semiconductor Equipment) 382 23,917
Axos Financial, Inc.*—Class I (Thrifts & Mortgage Finance) 614 31,621
January 31, 2022 (unaudited) :: Schedule of Portfolio Investments :: Small-Cap Growth ProFund :: 119
See accompanying notes to the financial statements.
Toppan Merrill - ProFunds Public Semi-Annual Report [Funds] 01-31-2022 ED [AUX] | akiesli | 29-Mar-22 08:43 | 22-1296-2.di | Sequence: 6CHKSUM Content: 61592 Layout: 59413 Graphics: 0 CLEAN
JOB: 22-1296-2 CYCLE#;BL#: 8; 0 TRIM: 8.25" x 10.75" AS: New York: 212-620-5600COLORS: ~note-color 2, Black, ~note-color 3 GRAPHICS: none V1.5
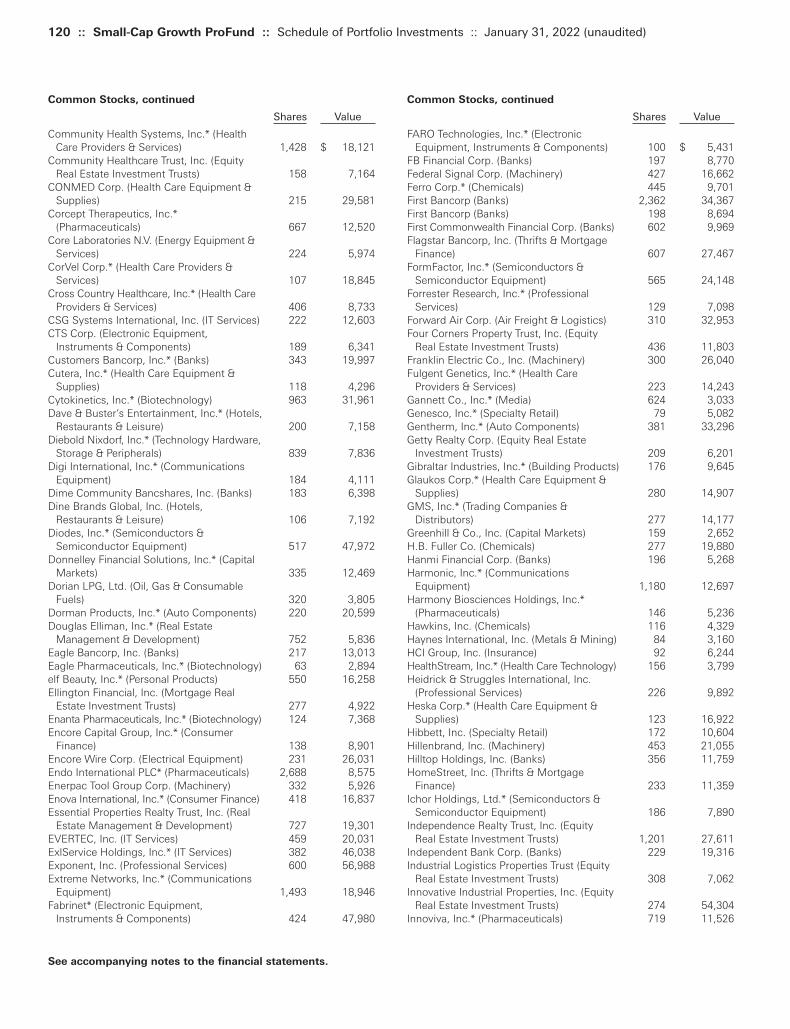
120 :: Small-Cap Growth ProFund :: Schedule of Portfolio Investments :: January 31, 2022 (unaudited)
Common Stocks, continued
Shares Value
FARO Technologies, Inc.* (Electronic Equipment, Instruments & Components) 100 $ 5,431
FB Financial Corp. (Banks) 197 8,770Federal Signal Corp. (Machinery) 427 16,662Ferro Corp.* (Chemicals) 445 9,701First Bancorp (Banks) 2,362 34,367First Bancorp (Banks) 198 8,694First Commonwealth Financial Corp. (Banks) 602 9,969Flagstar Bancorp, Inc. (Thrifts & Mortgage
Finance) 607 27,467FormFactor, Inc.* (Semiconductors &
Semiconductor Equipment) 565 24,148Forrester Research, Inc.* (Professional
Services) 129 7,098Forward Air Corp. (Air Freight & Logistics) 310 32,953Four Corners Property Trust, Inc. (Equity
Real Estate Investment Trusts) 436 11,803Franklin Electric Co., Inc. (Machinery) 300 26,040Fulgent Genetics, Inc.* (Health Care
Providers & Services) 223 14,243Gannett Co., Inc.* (Media) 624 3,033Genesco, Inc.* (Specialty Retail) 79 5,082Gentherm, Inc.* (Auto Components) 381 33,296Getty Realty Corp. (Equity Real Estate
Investment Trusts) 209 6,201Gibraltar Industries, Inc.* (Building Products) 176 9,645Glaukos Corp.* (Health Care Equipment &
Supplies) 280 14,907GMS, Inc.* (Trading Companies &
Distributors) 277 14,177Greenhill & Co., Inc. (Capital Markets) 159 2,652H.B. Fuller Co. (Chemicals) 277 19,880Hanmi Financial Corp. (Banks) 196 5,268Harmonic, Inc.* (Communications
Equipment) 1,180 12,697Harmony Biosciences Holdings, Inc.*
(Pharmaceuticals) 146 5,236Hawkins, Inc. (Chemicals) 116 4,329Haynes International, Inc. (Metals & Mining) 84 3,160HCI Group, Inc. (Insurance) 92 6,244HealthStream, Inc.* (Health Care Technology) 156 3,799Heidrick & Struggles International, Inc.
(Professional Services) 226 9,892Heska Corp.* (Health Care Equipment &
Supplies) 123 16,922Hibbett, Inc. (Specialty Retail) 172 10,604Hillenbrand, Inc. (Machinery) 453 21,055Hilltop Holdings, Inc. (Banks) 356 11,759HomeStreet, Inc. (Thrifts & Mortgage
Finance) 233 11,359Ichor Holdings, Ltd.* (Semiconductors &
Semiconductor Equipment) 186 7,890Independence Realty Trust, Inc. (Equity
Real Estate Investment Trusts) 1,201 27,611Independent Bank Corp. (Banks) 229 19,316Industrial Logistics Properties Trust (Equity
Real Estate Investment Trusts) 308 7,062Innovative Industrial Properties, Inc. (Equity
Real Estate Investment Trusts) 274 54,304Innoviva, Inc.* (Pharmaceuticals) 719 11,526
Common Stocks, continued
Shares Value
Community Health Systems, Inc.* (Health Care Providers & Services) 1,428 $ 18,121
Community Healthcare Trust, Inc. (Equity Real Estate Investment Trusts) 158 7,164
CONMED Corp. (Health Care Equipment & Supplies) 215 29,581
Corcept Therapeutics, Inc.* (Pharmaceuticals) 667 12,520
Core Laboratories N.V. (Energy Equipment & Services) 224 5,974
CorVel Corp.* (Health Care Providers & Services) 107 18,845
Cross Country Healthcare, Inc.* (Health CareProviders & Services) 406 8,733
CSG Systems International, Inc. (IT Services) 222 12,603CTS Corp. (Electronic Equipment,
Instruments & Components) 189 6,341Customers Bancorp, Inc.* (Banks) 343 19,997Cutera, Inc.* (Health Care Equipment &
Supplies) 118 4,296Cytokinetics, Inc.* (Biotechnology) 963 31,961Dave & Buster’s Entertainment, Inc.* (Hotels,
Restaurants & Leisure) 200 7,158Diebold Nixdorf, Inc.* (Technology Hardware,
Storage & Peripherals) 839 7,836Digi International, Inc.* (Communications
Equipment) 184 4,111Dime Community Bancshares, Inc. (Banks) 183 6,398Dine Brands Global, Inc. (Hotels,
Restaurants & Leisure) 106 7,192Diodes, Inc.* (Semiconductors &
Semiconductor Equipment) 517 47,972Donnelley Financial Solutions, Inc.* (Capital
Markets) 335 12,469Dorian LPG, Ltd. (Oil, Gas & Consumable
Fuels) 320 3,805Dorman Products, Inc.* (Auto Components) 220 20,599Douglas Elliman, Inc.* (Real Estate
Management & Development) 752 5,836Eagle Bancorp, Inc. (Banks) 217 13,013Eagle Pharmaceuticals, Inc.* (Biotechnology) 63 2,894elf Beauty, Inc.* (Personal Products) 550 16,258Ellington Financial, Inc. (Mortgage Real
Estate Investment Trusts) 277 4,922Enanta Pharmaceuticals, Inc.* (Biotechnology) 124 7,368Encore Capital Group, Inc.* (Consumer
Finance) 138 8,901Encore Wire Corp. (Electrical Equipment) 231 26,031Endo International PLC* (Pharmaceuticals) 2,688 8,575Enerpac Tool Group Corp. (Machinery) 332 5,926Enova International, Inc.* (Consumer Finance) 418 16,837Essential Properties Realty Trust, Inc. (Real
Estate Management & Development) 727 19,301EVERTEC, Inc. (IT Services) 459 20,031ExlService Holdings, Inc.* (IT Services) 382 46,038Exponent, Inc. (Professional Services) 600 56,988Extreme Networks, Inc.* (Communications
Equipment) 1,493 18,946Fabrinet* (Electronic Equipment,
Instruments & Components) 424 47,980
See accompanying notes to the financial statements.
Toppan Merrill - ProFunds Public Semi-Annual Report [Funds] 01-31-2022 ED [AUX] | akiesli | 29-Mar-22 08:43 | 22-1296-2.di | Sequence: 7CHKSUM Content: 19177 Layout: 24392 Graphics: 0 CLEAN
JOB: 22-1296-2 CYCLE#;BL#: 8; 0 TRIM: 8.25" x 10.75" AS: New York: 212-620-5600COLORS: ~note-color 2, Black, ~note-color 3 GRAPHICS: none V1.5
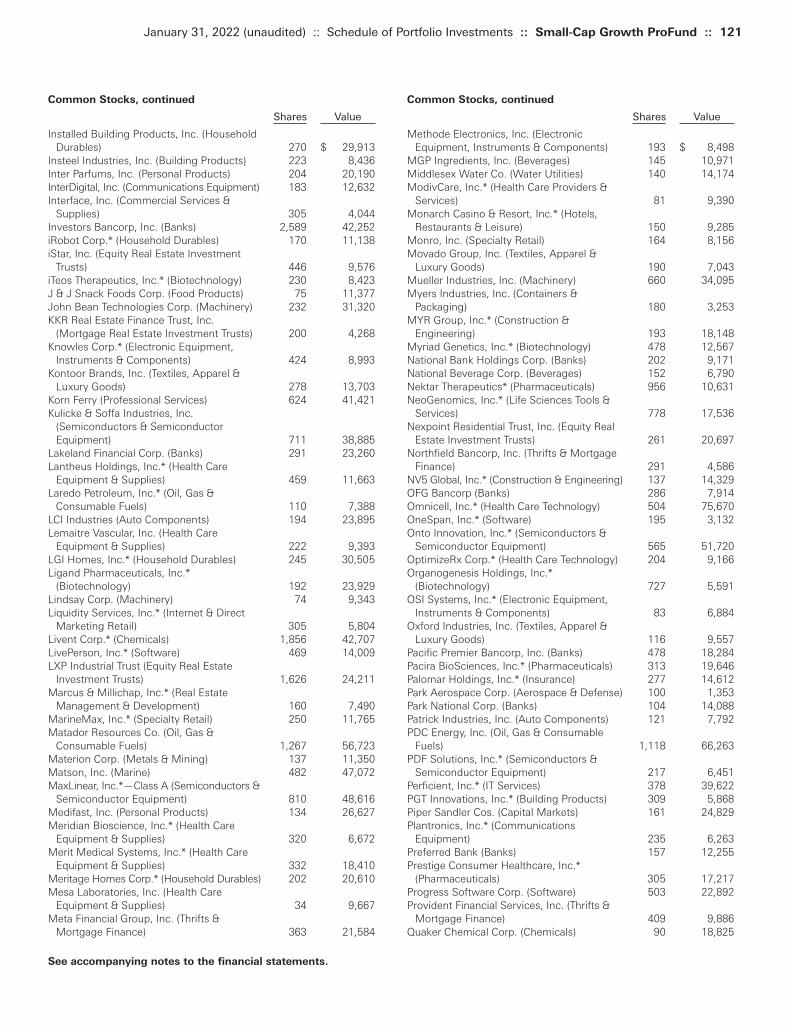
Common Stocks, continued
Shares Value
Methode Electronics, Inc. (Electronic Equipment, Instruments & Components) 193 $ 8,498
MGP Ingredients, Inc. (Beverages) 145 10,971Middlesex Water Co. (Water Utilities) 140 14,174ModivCare, Inc.* (Health Care Providers &
Services) 81 9,390Monarch Casino & Resort, Inc.* (Hotels,
Restaurants & Leisure) 150 9,285Monro, Inc. (Specialty Retail) 164 8,156Movado Group, Inc. (Textiles, Apparel &
Luxury Goods) 190 7,043Mueller Industries, Inc. (Machinery) 660 34,095Myers Industries, Inc. (Containers &
Packaging) 180 3,253MYR Group, Inc.* (Construction &
Engineering) 193 18,148Myriad Genetics, Inc.* (Biotechnology) 478 12,567National Bank Holdings Corp. (Banks) 202 9,171National Beverage Corp. (Beverages) 152 6,790Nektar Therapeutics* (Pharmaceuticals) 956 10,631NeoGenomics, Inc.* (Life Sciences Tools &
Services) 778 17,536Nexpoint Residential Trust, Inc. (Equity Real
Estate Investment Trusts) 261 20,697Northfield Bancorp, Inc. (Thrifts & Mortgage
Finance) 291 4,586NV5 Global, Inc.* (Construction & Engineering) 137 14,329OFG Bancorp (Banks) 286 7,914Omnicell, Inc.* (Health Care Technology) 504 75,670OneSpan, Inc.* (Software) 195 3,132Onto Innovation, Inc.* (Semiconductors &
Semiconductor Equipment) 565 51,720OptimizeRx Corp.* (Health Care Technology) 204 9,166Organogenesis Holdings, Inc.*
(Biotechnology) 727 5,591OSI Systems, Inc.* (Electronic Equipment,
Instruments & Components) 83 6,884Oxford Industries, Inc. (Textiles, Apparel &
Luxury Goods) 116 9,557Pacific Premier Bancorp, Inc. (Banks) 478 18,284Pacira BioSciences, Inc.* (Pharmaceuticals) 313 19,646Palomar Holdings, Inc.* (Insurance) 277 14,612Park Aerospace Corp. (Aerospace & Defense) 100 1,353Park National Corp. (Banks) 104 14,088Patrick Industries, Inc. (Auto Components) 121 7,792PDC Energy, Inc. (Oil, Gas & Consumable
Fuels) 1,118 66,263PDF Solutions, Inc.* (Semiconductors &
Semiconductor Equipment) 217 6,451Perficient, Inc.* (IT Services) 378 39,622PGT Innovations, Inc.* (Building Products) 309 5,868Piper Sandler Cos. (Capital Markets) 161 24,829Plantronics, Inc.* (Communications
Equipment) 235 6,263Preferred Bank (Banks) 157 12,255Prestige Consumer Healthcare, Inc.*
(Pharmaceuticals) 305 17,217Progress Software Corp. (Software) 503 22,892Provident Financial Services, Inc. (Thrifts &
Mortgage Finance) 409 9,886Quaker Chemical Corp. (Chemicals) 90 18,825
Common Stocks, continued
Shares Value
Installed Building Products, Inc. (Household Durables) 270 $ 29,913
Insteel Industries, Inc. (Building Products) 223 8,436Inter Parfums, Inc. (Personal Products) 204 20,190InterDigital, Inc. (Communications Equipment) 183 12,632Interface, Inc. (Commercial Services &
Supplies) 305 4,044Investors Bancorp, Inc. (Banks) 2,589 42,252iRobot Corp.* (Household Durables) 170 11,138iStar, Inc. (Equity Real Estate Investment
Trusts) 446 9,576iTeos Therapeutics, Inc.* (Biotechnology) 230 8,423J & J Snack Foods Corp. (Food Products) 75 11,377John Bean Technologies Corp. (Machinery) 232 31,320KKR Real Estate Finance Trust, Inc.
(Mortgage Real Estate Investment Trusts) 200 4,268Knowles Corp.* (Electronic Equipment,
Instruments & Components) 424 8,993Kontoor Brands, Inc. (Textiles, Apparel &
Luxury Goods) 278 13,703Korn Ferry (Professional Services) 624 41,421Kulicke & Soffa Industries, Inc.
(Semiconductors & Semiconductor Equipment) 711 38,885
Lakeland Financial Corp. (Banks) 291 23,260Lantheus Holdings, Inc.* (Health Care
Equipment & Supplies) 459 11,663Laredo Petroleum, Inc.* (Oil, Gas &
Consumable Fuels) 110 7,388LCI Industries (Auto Components) 194 23,895Lemaitre Vascular, Inc. (Health Care
Equipment & Supplies) 222 9,393LGI Homes, Inc.* (Household Durables) 245 30,505Ligand Pharmaceuticals, Inc.*
(Biotechnology) 192 23,929Lindsay Corp. (Machinery) 74 9,343Liquidity Services, Inc.* (Internet & Direct
Marketing Retail) 305 5,804Livent Corp.* (Chemicals) 1,856 42,707LivePerson, Inc.* (Software) 469 14,009LXP Industrial Trust (Equity Real Estate
Investment Trusts) 1,626 24,211Marcus & Millichap, Inc.* (Real Estate
Management & Development) 160 7,490MarineMax, Inc.* (Specialty Retail) 250 11,765Matador Resources Co. (Oil, Gas &
Consumable Fuels) 1,267 56,723Materion Corp. (Metals & Mining) 137 11,350Matson, Inc. (Marine) 482 47,072MaxLinear, Inc.*—Class A (Semiconductors &
Semiconductor Equipment) 810 48,616Medifast, Inc. (Personal Products) 134 26,627Meridian Bioscience, Inc.* (Health Care
Equipment & Supplies) 320 6,672Merit Medical Systems, Inc.* (Health Care
Equipment & Supplies) 332 18,410Meritage Homes Corp.* (Household Durables) 202 20,610Mesa Laboratories, Inc. (Health Care
Equipment & Supplies) 34 9,667Meta Financial Group, Inc. (Thrifts &
Mortgage Finance) 363 21,584
January 31, 2022 (unaudited) :: Schedule of Portfolio Investments :: Small-Cap Growth ProFund :: 121
See accompanying notes to the financial statements.
Toppan Merrill - ProFunds Public Semi-Annual Report [Funds] 01-31-2022 ED [AUX] | akiesli | 29-Mar-22 08:43 | 22-1296-2.di | Sequence: 8CHKSUM Content: 2838 Layout: 59413 Graphics: 0 CLEAN
JOB: 22-1296-2 CYCLE#;BL#: 8; 0 TRIM: 8.25" x 10.75" AS: New York: 212-620-5600COLORS: ~note-color 2, Black, ~note-color 3 GRAPHICS: none V1.5
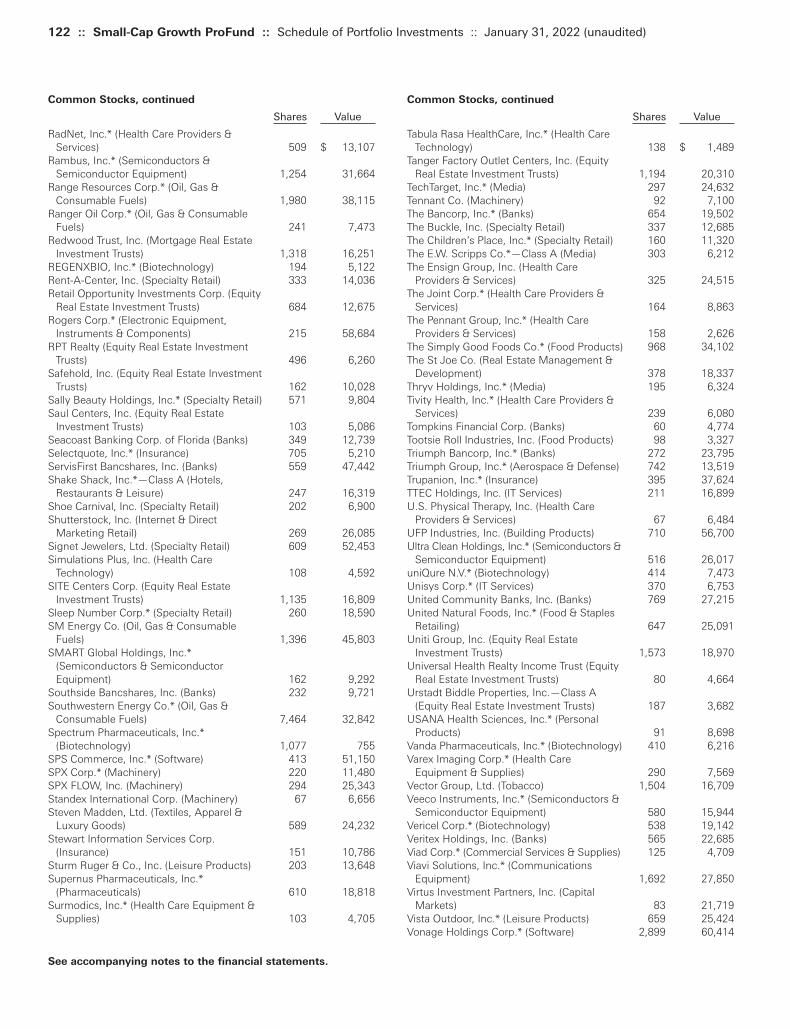
122 :: Small-Cap Growth ProFund :: Schedule of Portfolio Investments :: January 31, 2022 (unaudited)
Common Stocks, continued
Shares Value
Tabula Rasa HealthCare, Inc.* (Health Care Technology) 138 $ 1,489
Tanger Factory Outlet Centers, Inc. (Equity Real Estate Investment Trusts) 1,194 20,310
TechTarget, Inc.* (Media) 297 24,632Tennant Co. (Machinery) 92 7,100The Bancorp, Inc.* (Banks) 654 19,502The Buckle, Inc. (Specialty Retail) 337 12,685The Children’s Place, Inc.* (Specialty Retail) 160 11,320The E.W. Scripps Co.*—Class A (Media) 303 6,212The Ensign Group, Inc. (Health Care
Providers & Services) 325 24,515The Joint Corp.* (Health Care Providers &
Services) 164 8,863The Pennant Group, Inc.* (Health Care
Providers & Services) 158 2,626The Simply Good Foods Co.* (Food Products) 968 34,102The St Joe Co. (Real Estate Management &
Development) 378 18,337Thryv Holdings, Inc.* (Media) 195 6,324Tivity Health, Inc.* (Health Care Providers &
Services) 239 6,080Tompkins Financial Corp. (Banks) 60 4,774Tootsie Roll Industries, Inc. (Food Products) 98 3,327Triumph Bancorp, Inc.* (Banks) 272 23,795Triumph Group, Inc.* (Aerospace & Defense) 742 13,519Trupanion, Inc.* (Insurance) 395 37,624TTEC Holdings, Inc. (IT Services) 211 16,899U.S. Physical Therapy, Inc. (Health Care
Providers & Services) 67 6,484UFP Industries, Inc. (Building Products) 710 56,700Ultra Clean Holdings, Inc.* (Semiconductors &
Semiconductor Equipment) 516 26,017uniQure N.V.* (Biotechnology) 414 7,473Unisys Corp.* (IT Services) 370 6,753United Community Banks, Inc. (Banks) 769 27,215United Natural Foods, Inc.* (Food & Staples
Retailing) 647 25,091Uniti Group, Inc. (Equity Real Estate
Investment Trusts) 1,573 18,970Universal Health Realty Income Trust (Equity
Real Estate Investment Trusts) 80 4,664Urstadt Biddle Properties, Inc.—Class A
(Equity Real Estate Investment Trusts) 187 3,682USANA Health Sciences, Inc.* (Personal
Products) 91 8,698Vanda Pharmaceuticals, Inc.* (Biotechnology) 410 6,216Varex Imaging Corp.* (Health Care
Equipment & Supplies) 290 7,569Vector Group, Ltd. (Tobacco) 1,504 16,709Veeco Instruments, Inc.* (Semiconductors &
Semiconductor Equipment) 580 15,944Vericel Corp.* (Biotechnology) 538 19,142Veritex Holdings, Inc. (Banks) 565 22,685Viad Corp.* (Commercial Services & Supplies) 125 4,709Viavi Solutions, Inc.* (Communications
Equipment) 1,692 27,850Virtus Investment Partners, Inc. (Capital
Markets) 83 21,719Vista Outdoor, Inc.* (Leisure Products) 659 25,424Vonage Holdings Corp.* (Software) 2,899 60,414
Common Stocks, continued
Shares Value
RadNet, Inc.* (Health Care Providers & Services) 509 $ 13,107
Rambus, Inc.* (Semiconductors & Semiconductor Equipment) 1,254 31,664
Range Resources Corp.* (Oil, Gas & Consumable Fuels) 1,980 38,115
Ranger Oil Corp.* (Oil, Gas & Consumable Fuels) 241 7,473
Redwood Trust, Inc. (Mortgage Real Estate Investment Trusts) 1,318 16,251
REGENXBIO, Inc.* (Biotechnology) 194 5,122Rent-A-Center, Inc. (Specialty Retail) 333 14,036Retail Opportunity Investments Corp. (Equity
Real Estate Investment Trusts) 684 12,675Rogers Corp.* (Electronic Equipment,
Instruments & Components) 215 58,684RPT Realty (Equity Real Estate Investment
Trusts) 496 6,260Safehold, Inc. (Equity Real Estate Investment
Trusts) 162 10,028Sally Beauty Holdings, Inc.* (Specialty Retail) 571 9,804Saul Centers, Inc. (Equity Real Estate
Investment Trusts) 103 5,086Seacoast Banking Corp. of Florida (Banks) 349 12,739Selectquote, Inc.* (Insurance) 705 5,210ServisFirst Bancshares, Inc. (Banks) 559 47,442Shake Shack, Inc.*—Class A (Hotels,
Restaurants & Leisure) 247 16,319Shoe Carnival, Inc. (Specialty Retail) 202 6,900Shutterstock, Inc. (Internet & Direct
Marketing Retail) 269 26,085Signet Jewelers, Ltd. (Specialty Retail) 609 52,453Simulations Plus, Inc. (Health Care
Technology) 108 4,592SITE Centers Corp. (Equity Real Estate
Investment Trusts) 1,135 16,809Sleep Number Corp.* (Specialty Retail) 260 18,590SM Energy Co. (Oil, Gas & Consumable
Fuels) 1,396 45,803SMART Global Holdings, Inc.*
(Semiconductors & Semiconductor Equipment) 162 9,292
Southside Bancshares, Inc. (Banks) 232 9,721Southwestern Energy Co.* (Oil, Gas &
Consumable Fuels) 7,464 32,842Spectrum Pharmaceuticals, Inc.*
(Biotechnology) 1,077 755SPS Commerce, Inc.* (Software) 413 51,150SPX Corp.* (Machinery) 220 11,480SPX FLOW, Inc. (Machinery) 294 25,343Standex International Corp. (Machinery) 67 6,656Steven Madden, Ltd. (Textiles, Apparel &
Luxury Goods) 589 24,232Stewart Information Services Corp.
(Insurance) 151 10,786Sturm Ruger & Co., Inc. (Leisure Products) 203 13,648Supernus Pharmaceuticals, Inc.*
(Pharmaceuticals) 610 18,818Surmodics, Inc.* (Health Care Equipment &
Supplies) 103 4,705
See accompanying notes to the financial statements.
Toppan Merrill - ProFunds Public Semi-Annual Report [Funds] 01-31-2022 ED [AUX] | akiesli | 29-Mar-22 08:43 | 22-1296-2.di | Sequence: 9CHKSUM Content: 61916 Layout: 24392 Graphics: 0 CLEAN
JOB: 22-1296-2 CYCLE#;BL#: 8; 0 TRIM: 8.25" x 10.75" AS: New York: 212-620-5600COLORS: ~note-color 2, Black, ~note-color 3 GRAPHICS: none V1.5
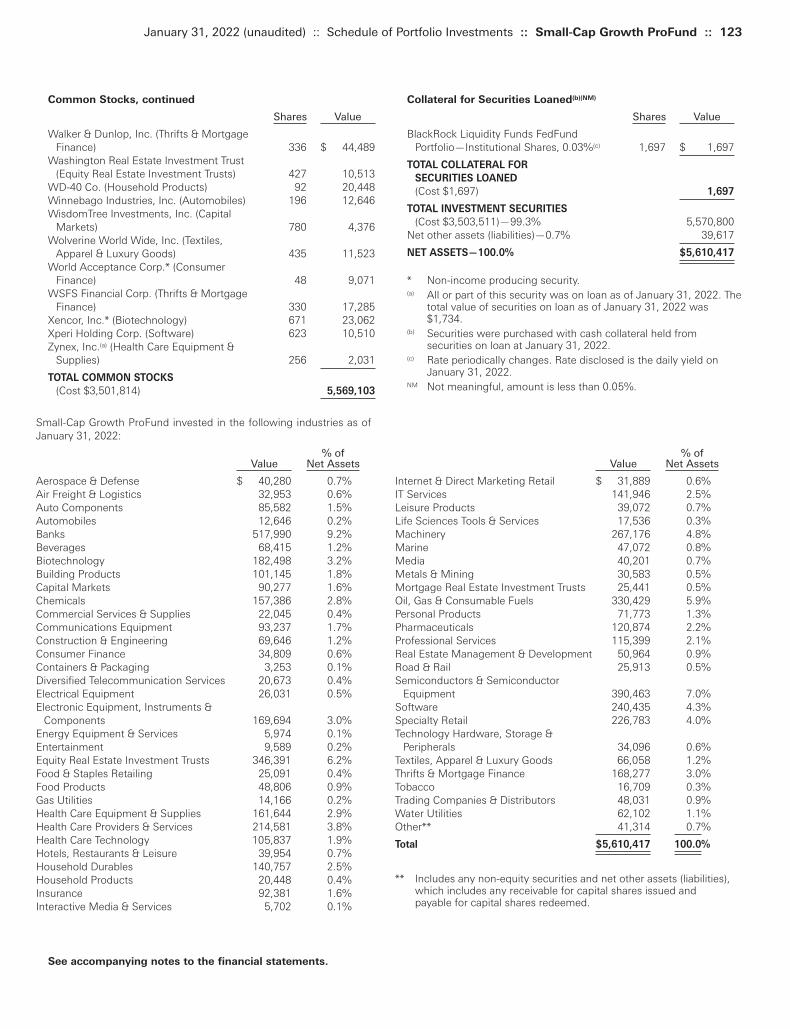
Collateral for Securities Loaned(b)(NM)
Shares Value
BlackRock Liquidity Funds FedFund Portfolio—Institutional Shares, 0.03%(c) 1,697 $ 1,697
TOTAL COLLATERAL FOR
SECURITIES LOANED
(Cost $1,697) 1,697
TOTAL INVESTMENT SECURITIES
(Cost $3,503,511)—99.3% 5,570,800Net other assets (liabilities)—0.7% 39,617
NET ASSETS—100.0% $5,610,417
* Non-income producing security.(a) All or part of this security was on loan as of January 31, 2022. The
total value of securities on loan as of January 31, 2022 was$1,734.
(b) Securities were purchased with cash collateral held fromsecurities on loan at January 31, 2022.
(c) Rate periodically changes. Rate disclosed is the daily yield onJanuary 31, 2022.
NM Not meaningful, amount is less than 0.05%.
Common Stocks, continued
Shares Value
Walker & Dunlop, Inc. (Thrifts & Mortgage Finance) 336 $ 44,489
Washington Real Estate Investment Trust (Equity Real Estate Investment Trusts) 427 10,513
WD-40 Co. (Household Products) 92 20,448Winnebago Industries, Inc. (Automobiles) 196 12,646WisdomTree Investments, Inc. (Capital
Markets) 780 4,376Wolverine World Wide, Inc. (Textiles,
Apparel & Luxury Goods) 435 11,523World Acceptance Corp.* (Consumer
Finance) 48 9,071WSFS Financial Corp. (Thrifts & Mortgage
Finance) 330 17,285Xencor, Inc.* (Biotechnology) 671 23,062Xperi Holding Corp. (Software) 623 10,510Zynex, Inc.(a) (Health Care Equipment &
Supplies) 256 2,031
TOTAL COMMON STOCKS
(Cost $3,501,814) 5,569,103
% ofValue Net Assets
Internet & Direct Marketing Retail $ 31,889 0.6%IT Services 141,946 2.5%Leisure Products 39,072 0.7%Life Sciences Tools & Services 17,536 0.3%Machinery 267,176 4.8%Marine 47,072 0.8%Media 40,201 0.7%Metals & Mining 30,583 0.5%Mortgage Real Estate Investment Trusts 25,441 0.5%Oil, Gas & Consumable Fuels 330,429 5.9%Personal Products 71,773 1.3%Pharmaceuticals 120,874 2.2%Professional Services 115,399 2.1%Real Estate Management & Development 50,964 0.9%Road & Rail 25,913 0.5%Semiconductors & Semiconductor
Equipment 390,463 7.0%Software 240,435 4.3%Specialty Retail 226,783 4.0%Technology Hardware, Storage &
Peripherals 34,096 0.6%Textiles, Apparel & Luxury Goods 66,058 1.2%Thrifts & Mortgage Finance 168,277 3.0%Tobacco 16,709 0.3%Trading Companies & Distributors 48,031 0.9%Water Utilities 62,102 1.1%Other** 41,314 0.7%
Total $5,610,417 100.0%
** Includes any non-equity securities and net other assets (liabilities),which includes any receivable for capital shares issued andpayable for capital shares redeemed.
Small-Cap Growth ProFund invested in the following industries as ofJanuary 31, 2022:
% ofValue Net Assets
Aerospace & Defense $ 40,280 0.7%Air Freight & Logistics 32,953 0.6%Auto Components 85,582 1.5%Automobiles 12,646 0.2%Banks 517,990 9.2%Beverages 68,415 1.2%Biotechnology 182,498 3.2%Building Products 101,145 1.8%Capital Markets 90,277 1.6%Chemicals 157,386 2.8%Commercial Services & Supplies 22,045 0.4%Communications Equipment 93,237 1.7%Construction & Engineering 69,646 1.2%Consumer Finance 34,809 0.6%Containers & Packaging 3,253 0.1%Diversified Telecommunication Services 20,673 0.4%Electrical Equipment 26,031 0.5%Electronic Equipment, Instruments &
Components 169,694 3.0%Energy Equipment & Services 5,974 0.1%Entertainment 9,589 0.2%Equity Real Estate Investment Trusts 346,391 6.2%Food & Staples Retailing 25,091 0.4%Food Products 48,806 0.9%Gas Utilities 14,166 0.2%Health Care Equipment & Supplies 161,644 2.9%Health Care Providers & Services 214,581 3.8%Health Care Technology 105,837 1.9%Hotels, Restaurants & Leisure 39,954 0.7%Household Durables 140,757 2.5%Household Products 20,448 0.4%Insurance 92,381 1.6%Interactive Media & Services 5,702 0.1%
January 31, 2022 (unaudited) :: Schedule of Portfolio Investments :: Small-Cap Growth ProFund :: 123
See accompanying notes to the financial statements.
Toppan Merrill - ProFunds Public Semi-Annual Report [Funds] 01-31-2022 ED [AUX] | akiesli | 29-Mar-22 08:43 | 22-1296-2.di | Sequence: 10CHKSUM Content: 24878 Layout: 62721 Graphics: 0 CLEAN
JOB: 22-1296-2 CYCLE#;BL#: 8; 0 TRIM: 8.25" x 10.75" AS: New York: 212-620-5600COLORS: ~note-color 2, Black, ~note-color 3 GRAPHICS: none V1.5
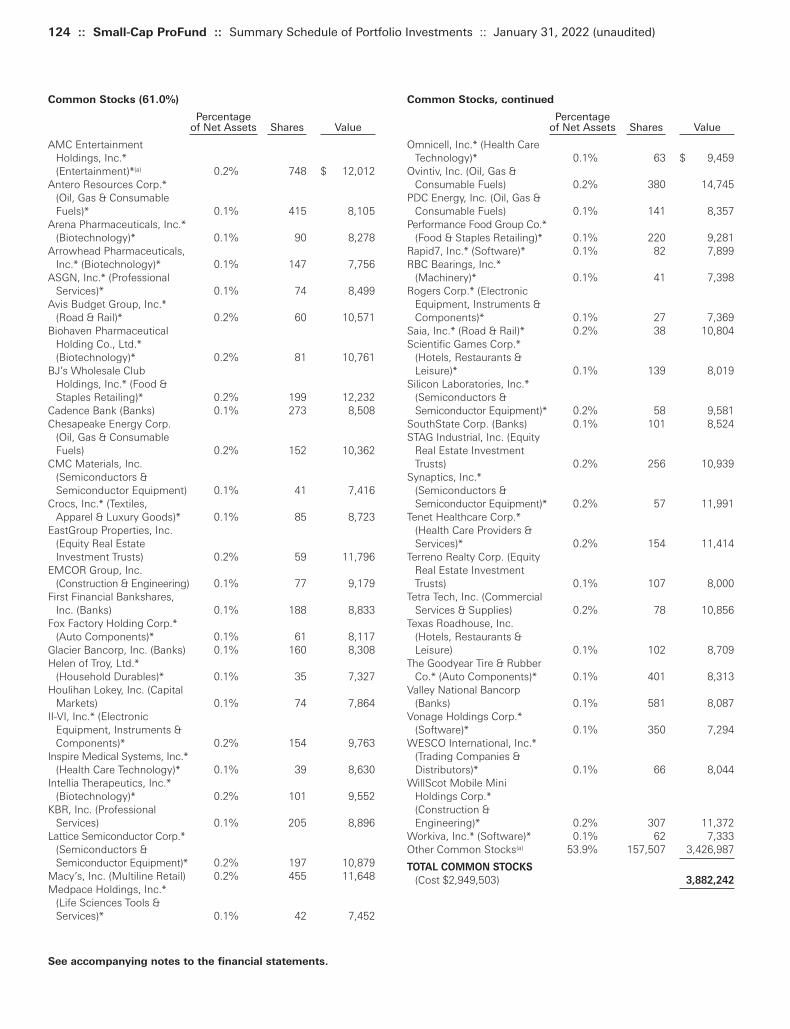
124 :: Small-Cap ProFund :: Summary Schedule of Portfolio Investments :: January 31, 2022 (unaudited)
Common Stocks, continued
Percentage of Net Assets Shares Value
Omnicell, Inc.* (Health Care Technology)* 0.1% 63 $ 9,459
Ovintiv, Inc. (Oil, Gas & Consumable Fuels) 0.2% 380 14,745
PDC Energy, Inc. (Oil, Gas & Consumable Fuels) 0.1% 141 8,357
Performance Food Group Co.* (Food & Staples Retailing)* 0.1% 220 9,281
Rapid7, Inc.* (Software)* 0.1% 82 7,899RBC Bearings, Inc.*
(Machinery)* 0.1% 41 7,398Rogers Corp.* (Electronic
Equipment, Instruments & Components)* 0.1% 27 7,369
Saia, Inc.* (Road & Rail)* 0.2% 38 10,804Scientific Games Corp.*
(Hotels, Restaurants & Leisure)* 0.1% 139 8,019
Silicon Laboratories, Inc.* (Semiconductors & Semiconductor Equipment)* 0.2% 58 9,581
SouthState Corp. (Banks) 0.1% 101 8,524STAG Industrial, Inc. (Equity
Real Estate Investment Trusts) 0.2% 256 10,939
Synaptics, Inc.* (Semiconductors & Semiconductor Equipment)* 0.2% 57 11,991
Tenet Healthcare Corp.* (Health Care Providers & Services)* 0.2% 154 11,414
Terreno Realty Corp. (Equity Real Estate Investment Trusts) 0.1% 107 8,000
Tetra Tech, Inc. (Commercial Services & Supplies) 0.2% 78 10,856
Texas Roadhouse, Inc. (Hotels, Restaurants & Leisure) 0.1% 102 8,709
The Goodyear Tire & Rubber Co.* (Auto Components)* 0.1% 401 8,313
Valley National Bancorp (Banks) 0.1% 581 8,087
Vonage Holdings Corp.* (Software)* 0.1% 350 7,294
WESCO International, Inc.* (Trading Companies & Distributors)* 0.1% 66 8,044
WillScot Mobile Mini Holdings Corp.* (Construction & Engineering)* 0.2% 307 11,372
Workiva, Inc.* (Software)* 0.1% 62 7,333Other Common Stocks(a) 53.9% 157,507 3,426,987
TOTAL COMMON STOCKS
(Cost $2,949,503) 3,882,242
Common Stocks (61.0%)
Percentage of Net Assets Shares Value
AMC Entertainment Holdings, Inc.* (Entertainment)*(a) 0.2% 748 $ 12,012
Antero Resources Corp.* (Oil, Gas & Consumable Fuels)* 0.1% 415 8,105
Arena Pharmaceuticals, Inc.*(Biotechnology)* 0.1% 90 8,278
Arrowhead Pharmaceuticals, Inc.* (Biotechnology)* 0.1% 147 7,756
ASGN, Inc.* (Professional Services)* 0.1% 74 8,499
Avis Budget Group, Inc.* (Road & Rail)* 0.2% 60 10,571
Biohaven Pharmaceutical Holding Co., Ltd.* (Biotechnology)* 0.2% 81 10,761
BJ’s Wholesale Club Holdings, Inc.* (Food & Staples Retailing)* 0.2% 199 12,232
Cadence Bank (Banks) 0.1% 273 8,508Chesapeake Energy Corp.
(Oil, Gas & Consumable Fuels) 0.2% 152 10,362
CMC Materials, Inc. (Semiconductors & Semiconductor Equipment) 0.1% 41 7,416
Crocs, Inc.* (Textiles, Apparel & Luxury Goods)* 0.1% 85 8,723
EastGroup Properties, Inc. (Equity Real Estate Investment Trusts) 0.2% 59 11,796
EMCOR Group, Inc. (Construction & Engineering) 0.1% 77 9,179
First Financial Bankshares, Inc. (Banks) 0.1% 188 8,833
Fox Factory Holding Corp.* (Auto Components)* 0.1% 61 8,117
Glacier Bancorp, Inc. (Banks) 0.1% 160 8,308Helen of Troy, Ltd.*
(Household Durables)* 0.1% 35 7,327Houlihan Lokey, Inc. (Capital
Markets) 0.1% 74 7,864II-VI, Inc.* (Electronic
Equipment, Instruments & Components)* 0.2% 154 9,763
Inspire Medical Systems, Inc.*(Health Care Technology)* 0.1% 39 8,630
Intellia Therapeutics, Inc.* (Biotechnology)* 0.2% 101 9,552
KBR, Inc. (Professional Services) 0.1% 205 8,896
Lattice Semiconductor Corp.* (Semiconductors & Semiconductor Equipment)* 0.2% 197 10,879
Macy’s, Inc. (Multiline Retail) 0.2% 455 11,648Medpace Holdings, Inc.*
(Life Sciences Tools & Services)* 0.1% 42 7,452
See accompanying notes to the financial statements.
Toppan Merrill - ProFunds Public Semi-Annual Report [Funds] 01-31-2022 ED [AUX] | akiesli | 29-Mar-22 08:43 | 22-1296-2.di | Sequence: 11CHKSUM Content: 28251 Layout: 20939 Graphics: 0 CLEAN
JOB: 22-1296-2 CYCLE#;BL#: 8; 0 TRIM: 8.25" x 10.75" AS: New York: 212-620-5600COLORS: ~note-color 2, Black, ~note-color 3 GRAPHICS: none V1.5

* Non-income producing security.+ This security was fair valued based on procedures approved by
the Board of Trustees. As of January 31, 2022, this securityrepresented 0.000% of the net assets of the Fund.
(a) All or part of this security was on loan as of January 31, 2022. Thetotal value of securities on loan as of January 31, 2022 was$12,795.
(b) A portion of these securities were held in a segregated accountfor the benefit of swap counterparties in the event of default. Asof January 31, 2022, the aggregate amount held in a segregatedaccount was $480,000.
(c) The ProFund invests in Repurchase Agreements jointly with otherfunds in the Trust. See “Repurchase Agreements” under Note 2in the Notes to the Financial Statements to view the details ofeach individual agreement and counterparty as well as adescription of the securities subject to repurchase.
(d) Securities were purchased with cash collateral held fromsecurities on loan at January 31, 2022.
(e) Rate periodically changes. Rate disclosed is the daily yield onJanuary 31, 2022.
Trust (0.0%)
InterestUnits Value
Ferroglobe Representation and Warranty Insurance*+ (Metals & Mining) 290 $ —
TOTAL TRUST
(Cost $—) —
Repurchase Agreements(b)(c) (41.1%)
PrincipalAmount Value
Repurchase Agreements with various counterparties, 0.00%, dated 1/31/22, due 2/1/22, total to be received $2,615,000 $2,615,000 $2,615,000
TOTAL REPURCHASE AGREEMENTS
(Cost $2,615,000) 2,615,000
Collateral for Securities Loaned(d) (0.2%)
Shares Value
BlackRock Liquidity Funds FedFund Portfolio—Institutional Shares, 0.03%(e) 12,484 $ 12,484
TOTAL COLLATERAL FOR SECURITIES LOANED
(Cost $12,484) 12,484
TOTAL INVESTMENT SECURITIES
(Cost $5,576,987)—102.3% 6,509,726Net other assets (liabilities)—(2.3)% (146,756)
NET ASSETS—100.0% $6,362,970
January 31, 2022 (unaudited) :: Summary Schedule of Portfolio Investments :: Small-Cap ProFund :: 125
See accompanying notes to the financial statements.
Total Return Swap Agreements—Long
Value and Unrealized
Termination Rate Paid Notional Appreciation/Underlying Instrument Counterparty Date(1) (Received)(2) Amount (Depreciation) Russell 2000 Index Goldman Sachs International 2/28/22 0.48% $ 687,645 $ 45,242Russell 2000 Index UBS AG 2/28/22 0.08% 1,770,837 84,913
$2,458,482 $130,155
(1) Agreements may be terminated at will by either party without penalty. Payment is due at termination/maturity.(2) Reflects the floating financing rate, as of January 31, 2022, on the notional amount of the swap agreement paid to the counterparty or
received from the counterparty, excluding any commissions. This amount is included as part of the unrealized appreciation/(depreciation).
Toppan Merrill - ProFunds Public Semi-Annual Report [Funds] 01-31-2022 ED [AUX] | akiesli | 29-Mar-22 08:43 | 22-1296-2.di | Sequence: 12CHKSUM Content: 50984 Layout: 58319 Graphics: 0 CLEAN
JOB: 22-1296-2 CYCLE#;BL#: 8; 0 TRIM: 8.25" x 10.75" AS: New York: 212-620-5600COLORS: ~note-color 2, Black, ~note-color 3 GRAPHICS: none V1.5

126 :: Small-Cap ProFund :: Summary Schedule of Portfolio Investments :: January 31, 2022 (unaudited)
% ofValue Net Assets
Interactive Media & Services $ 14,075 0.2%Internet & Direct Marketing Retail 19,576 0.3%IT Services 64,381 1.0%Leisure Products 23,840 0.4%Life Sciences Tools & Services 25,679 0.4%Machinery 146,203 2.3%Marine 8,538 0.1%Media 43,225 0.7%Metals & Mining 49,613 0.8%Mortgage Real Estate Investment Trusts 52,866 0.8%Multiline Retail 15,648 0.2%Multi-Utilities 16,629 0.3%Oil, Gas & Consumable Fuels 165,720 2.6%Paper & Forest Products 5,369 0.1%Personal Products 21,656 0.3%Pharmaceuticals 58,513 0.9%Professional Services 68,010 1.1%Real Estate Management & Development 34,358 0.5%Road & Rail 33,581 0.5%Semiconductors & Semiconductor
Equipment 136,770 2.1%Software 216,849 3.4%Specialty Retail 92,973 1.5%Technology Hardware, Storage &
Peripherals 10,708 0.2%Textiles, Apparel & Luxury Goods 27,744 0.4%Thrifts & Mortgage Finance 73,909 1.2%Tobacco 5,461 0.1%Trading Companies & Distributors 61,876 1.0%Water Utilities 17,056 0.3%Wireless Telecommunication Services 6,229 0.1%Other** 2,480,728 39.0%
Total $6,362,970 100.0%
** Includes any non-equity securities and net other assets (liabilities),which includes any receivable for capital shares issued andpayable for capital shares redeemed.
NM Not meaningful, amount is less than 0.05%.
Small-Cap ProFund invested in the following industries as of January 31,2022:
% ofValue Net Assets
Aerospace & Defense $ 24,379 0.4%Air Freight & Logistics 13,817 0.2%Airlines 13,149 0.2%Auto Components 53,817 0.8%Automobiles 7,705 0.1%Banks 353,538 5.6%Beverages 16,128 0.3%Biotechnology 294,166 4.6%Building Products 50,570 0.8%Capital Markets 63,170 1.0%Chemicals 78,143 1.2%Commercial Services & Supplies 67,861 1.1%Communications Equipment 33,643 0.5%Construction & Engineering 61,044 1.0%Construction Materials 7,482 0.1%Consumer Finance 30,492 0.5%Containers & Packaging 9,577 0.2%Distributors 692 NM
Diversified Consumer Services 28,810 0.5%Diversified Financial Services 5,844 0.1%Diversified Telecommunication Services 18,635 0.3%Electric Utilities 25,145 0.4%Electrical Equipment 36,884 0.6%Electronic Equipment, Instruments &
Components 85,654 1.3%Energy Equipment & Services 38,558 0.6%Entertainment 25,110 0.4%Equity Real Estate Investment Trusts 262,777 4.1%Food & Staples Retailing 40,630 0.6%Food Products 39,903 0.6%Gas Utilities 37,480 0.6%Health Care Equipment & Supplies 121,040 1.9%Health Care Providers & Services 103,822 1.6%Health Care Technology 46,045 0.7%Hotels, Restaurants & Leisure 92,699 1.5%Household Durables 73,579 1.2%Household Products 11,647 0.2%Independent Power and Renewable
Electricity Producers 12,537 0.2%Insurance 79,015 1.2%
See accompanying notes to the financial statements.
Toppan Merrill - ProFunds Public Semi-Annual Report [Funds] 01-31-2022 ED [AUX] | akiesli | 29-Mar-22 08:43 | 22-1296-2.di | Sequence: 13CHKSUM Content: 26251 Layout: 4526 Graphics: 0 CLEAN
JOB: 22-1296-2 CYCLE#;BL#: 8; 0 TRIM: 8.25" x 10.75" AS: New York: 212-620-5600COLORS: ~HTML color, ~watermark, ~note-color 2, Black, ~note-color 3 GRAPHICS: none V1.5
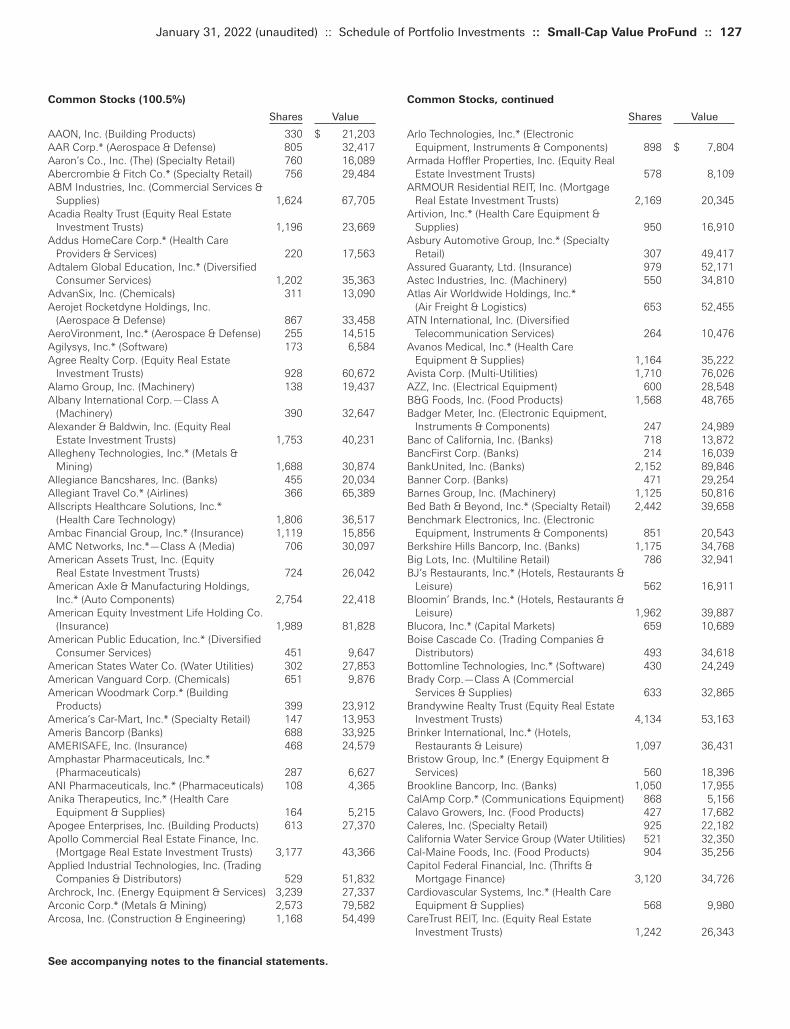
Common Stocks, continued
Shares Value Arlo Technologies, Inc.* (Electronic
Equipment, Instruments & Components) 898 $ 7,804Armada Hoffler Properties, Inc. (Equity Real
Estate Investment Trusts) 578 8,109ARMOUR Residential REIT, Inc. (Mortgage
Real Estate Investment Trusts) 2,169 20,345Artivion, Inc.* (Health Care Equipment &
Supplies) 950 16,910Asbury Automotive Group, Inc.* (Specialty
Retail) 307 49,417Assured Guaranty, Ltd. (Insurance) 979 52,171Astec Industries, Inc. (Machinery) 550 34,810Atlas Air Worldwide Holdings, Inc.*
(Air Freight & Logistics) 653 52,455ATN International, Inc. (Diversified
Telecommunication Services) 264 10,476Avanos Medical, Inc.* (Health Care
Equipment & Supplies) 1,164 35,222Avista Corp. (Multi-Utilities) 1,710 76,026AZZ, Inc. (Electrical Equipment) 600 28,548B&G Foods, Inc. (Food Products) 1,568 48,765Badger Meter, Inc. (Electronic Equipment,
Instruments & Components) 247 24,989Banc of California, Inc. (Banks) 718 13,872BancFirst Corp. (Banks) 214 16,039BankUnited, Inc. (Banks) 2,152 89,846Banner Corp. (Banks) 471 29,254Barnes Group, Inc. (Machinery) 1,125 50,816Bed Bath & Beyond, Inc.* (Specialty Retail) 2,442 39,658Benchmark Electronics, Inc. (Electronic
Equipment, Instruments & Components) 851 20,543Berkshire Hills Bancorp, Inc. (Banks) 1,175 34,768Big Lots, Inc. (Multiline Retail) 786 32,941BJ’s Restaurants, Inc.* (Hotels, Restaurants &
Leisure) 562 16,911Bloomin’ Brands, Inc.* (Hotels, Restaurants &
Leisure) 1,962 39,887Blucora, Inc.* (Capital Markets) 659 10,689Boise Cascade Co. (Trading Companies &
Distributors) 493 34,618Bottomline Technologies, Inc.* (Software) 430 24,249Brady Corp.—Class A (Commercial
Services & Supplies) 633 32,865Brandywine Realty Trust (Equity Real Estate
Investment Trusts) 4,134 53,163Brinker International, Inc.* (Hotels,
Restaurants & Leisure) 1,097 36,431Bristow Group, Inc.* (Energy Equipment &
Services) 560 18,396Brookline Bancorp, Inc. (Banks) 1,050 17,955CalAmp Corp.* (Communications Equipment) 868 5,156Calavo Growers, Inc. (Food Products) 427 17,682Caleres, Inc. (Specialty Retail) 925 22,182California Water Service Group (Water Utilities) 521 32,350Cal-Maine Foods, Inc. (Food Products) 904 35,256Capitol Federal Financial, Inc. (Thrifts &
Mortgage Finance) 3,120 34,726Cardiovascular Systems, Inc.* (Health Care
Equipment & Supplies) 568 9,980CareTrust REIT, Inc. (Equity Real Estate
Investment Trusts) 1,242 26,343
Common Stocks (100.5%)
Shares Value AAON, Inc. (Building Products) 330 $ 21,203AAR Corp.* (Aerospace & Defense) 805 32,417Aaron’s Co., Inc. (The) (Specialty Retail) 760 16,089Abercrombie & Fitch Co.* (Specialty Retail) 756 29,484ABM Industries, Inc. (Commercial Services &
Supplies) 1,624 67,705Acadia Realty Trust (Equity Real Estate
Investment Trusts) 1,196 23,669Addus HomeCare Corp.* (Health Care
Providers & Services) 220 17,563Adtalem Global Education, Inc.* (Diversified
Consumer Services) 1,202 35,363AdvanSix, Inc. (Chemicals) 311 13,090Aerojet Rocketdyne Holdings, Inc.
(Aerospace & Defense) 867 33,458AeroVironment, Inc.* (Aerospace & Defense) 255 14,515Agilysys, Inc.* (Software) 173 6,584Agree Realty Corp. (Equity Real Estate
Investment Trusts) 928 60,672Alamo Group, Inc. (Machinery) 138 19,437Albany International Corp.—Class A
(Machinery) 390 32,647Alexander & Baldwin, Inc. (Equity Real
Estate Investment Trusts) 1,753 40,231Allegheny Technologies, Inc.* (Metals &
Mining) 1,688 30,874Allegiance Bancshares, Inc. (Banks) 455 20,034Allegiant Travel Co.* (Airlines) 366 65,389Allscripts Healthcare Solutions, Inc.*
(Health Care Technology) 1,806 36,517Ambac Financial Group, Inc.* (Insurance) 1,119 15,856AMC Networks, Inc.*—Class A (Media) 706 30,097American Assets Trust, Inc. (Equity
Real Estate Investment Trusts) 724 26,042American Axle & Manufacturing Holdings,
Inc.* (Auto Components) 2,754 22,418American Equity Investment Life Holding Co.
(Insurance) 1,989 81,828American Public Education, Inc.* (Diversified
Consumer Services) 451 9,647American States Water Co. (Water Utilities) 302 27,853American Vanguard Corp. (Chemicals) 651 9,876American Woodmark Corp.* (Building
Products) 399 23,912America’s Car-Mart, Inc.* (Specialty Retail) 147 13,953Ameris Bancorp (Banks) 688 33,925AMERISAFE, Inc. (Insurance) 468 24,579Amphastar Pharmaceuticals, Inc.*
(Pharmaceuticals) 287 6,627ANI Pharmaceuticals, Inc.* (Pharmaceuticals) 108 4,365Anika Therapeutics, Inc.* (Health Care
Equipment & Supplies) 164 5,215Apogee Enterprises, Inc. (Building Products) 613 27,370Apollo Commercial Real Estate Finance, Inc.
(Mortgage Real Estate Investment Trusts) 3,177 43,366Applied Industrial Technologies, Inc. (Trading
Companies & Distributors) 529 51,832Archrock, Inc. (Energy Equipment & Services) 3,239 27,337Arconic Corp.* (Metals & Mining) 2,573 79,582Arcosa, Inc. (Construction & Engineering) 1,168 54,499
January 31, 2022 (unaudited) :: Schedule of Portfolio Investments :: Small-Cap Value ProFund :: 127
See accompanying notes to the financial statements.
Toppan Merrill - ProFunds Public Semi-Annual Report [Funds] 01-31-2022 ED [AUX] | akiesli | 29-Mar-22 08:43 | 22-1296-2.di | Sequence: 14CHKSUM Content: 32251 Layout: 46558 Graphics: 0 CLEAN
JOB: 22-1296-2 CYCLE#;BL#: 8; 0 TRIM: 8.25" x 10.75" AS: New York: 212-620-5600COLORS: ~watermark, ~note-color 2, Black, ~note-color 3 GRAPHICS: none V1.5

128 :: Small-Cap Value ProFund :: Schedule of Portfolio Investments :: January 31, 2022 (unaudited)
Common Stocks, continued
Shares Value Dave & Buster’s Entertainment, Inc.*
(Hotels, Restaurants & Leisure) 514 $ 18,396Deluxe Corp. (Commercial Services &
Supplies) 1,028 30,943Designer Brands, Inc.* (Specialty Retail) 1,482 19,518DiamondRock Hospitality Co.* (Equity
Real Estate Investment Trusts) 5,082 47,517Digi International, Inc.* (Communications
Equipment) 436 9,740Dime Community Bancshares, Inc. (Banks) 417 14,578Dine Brands Global, Inc. (Hotels,
Restaurants & Leisure) 192 13,027Diversified Healthcare Trust (Equity
Real Estate Investment Trusts) 5,775 17,614DMC Global, Inc.* (Energy Equipment &
Services) 452 18,234Dorman Products, Inc.* (Auto Components) 227 21,254Dril-Quip, Inc.* (Energy Equipment & Services) 854 21,598DXP Enterprises, Inc.* (Trading Companies &
Distributors) 413 11,791Eagle Bancorp, Inc. (Banks) 314 18,831Eagle Pharmaceuticals, Inc.* (Biotechnology) 139 6,386Easterly Government Properties, Inc. (Equity
Real Estate Investment Trusts) 2,081 43,639Ebix, Inc. (Software) 574 17,444Edgewell Personal Care Co. (Personal
Products) 1,313 60,135eHealth, Inc.* (Insurance) 574 12,542El Pollo Loco Holdings, Inc.* (Hotels,
Restaurants & Leisure) 469 6,256Ellington Financial, Inc. (Mortgage Real Estate
Investment Trusts) 738 13,114Emergent BioSolutions, Inc.* (Biotechnology) 1,156 54,100Employers Holdings, Inc. (Insurance) 675 26,393Enanta Pharmaceuticals, Inc.* (Biotechnology) 173 10,280Encore Capital Group, Inc.* (Consumer
Finance) 310 19,995Enerpac Tool Group Corp. (Machinery) 757 13,512EnPro Industries, Inc. (Machinery) 497 52,194ePlus, Inc.* (Electronic Equipment,
Instruments & Components) 653 30,018ESCO Technologies, Inc. (Machinery) 629 50,182Essential Properties Realty Trust, Inc.
(Real Estate Management & Development) 1,410 37,436Ethan Allen Interiors, Inc. (Household
Durables) 531 13,387EVERTEC, Inc. (IT Services) 477 20,816EZCORP, Inc.*—Class A (Consumer Finance) 1,285 7,671FARO Technologies, Inc.* (Electronic
Equipment, Instruments & Components) 228 12,383FB Financial Corp. (Banks) 449 19,989Federal Signal Corp. (Machinery) 574 22,397Ferro Corp.* (Chemicals) 1,060 23,108Fiesta Restaurant Group, Inc.* (Hotels,
Restaurants & Leisure) 416 3,940First Bancorp (Banks) 417 18,310First Commonwealth Financial Corp. (Banks) 1,031 17,073First Financial Bancorp (Banks) 2,265 57,101First Hawaiian, Inc. (Banks) 3,112 88,225First Midwest Bancorp, Inc. (Banks) 2,757 57,263
Common Stocks, continued
Shares Value Carpenter Technology Corp. (Metals & Mining) 1,164 $ 33,430Cars.com, Inc.* (Interactive Media & Services) 799 12,448Centerspace (Equity Real Estate Investment
Trusts) 124 11,827Central Garden & Pet Co.* (Household
Products) 235 10,902Central Garden & Pet Co.*—Class A
(Household Products) 970 42,030Central Pacific Financial Corp. (Banks) 256 7,450Century Aluminum Co.* (Metals & Mining) 670 10,278Chatham Lodging Trust* (Equity Real Estate
Investment Trusts) 1,179 15,645Chefs’ Warehouse, Inc.* (Food & Staples
Retailing) 786 23,454Chesapeake Utilities Corp. (Gas Utilities) 205 27,923Chico’s FAS, Inc.* (Specialty Retail) 2,962 13,951Chuy’s Holdings, Inc.* (Hotels, Restaurants &
Leisure) 479 12,076Cinemark Holdings, Inc.* (Entertainment) 1,235 18,648CIRCOR International, Inc.* (Machinery) 488 13,552City Holding Co. (Banks) 190 15,240Clearwater Paper Corp.* (Paper & Forest
Products) 402 12,711Cogent Communications Holdings, Inc.
(Diversified Telecommunication Services) 339 21,564Cohu, Inc.* (Semiconductors &
Semiconductor Equipment) 493 16,259Columbia Banking System, Inc. (Banks) 1,878 65,298Community Bank System, Inc. (Banks) 703 50,208Community Healthcare Trust, Inc. (Equity
Real Estate Investment Trusts) 232 10,519Compass Minerals International, Inc.
(Metals & Mining) 815 43,521Computer Programs & Systems, Inc.*
(Health Care Technology) 354 10,025Comtech Telecommunications Corp.
(Communications Equipment) 636 12,930CONMED Corp. (Health Care Equipment &
Supplies) 253 34,807Conn’s, Inc.* (Specialty Retail) 464 11,261Consensus Cloud Solutions, Inc.* (Software) 388 22,000CONSOL Energy, Inc.* (Oil, Gas &
Consumable Fuels) 767 16,675Consolidated Communications Holdings, Inc.*
(Diversified Telecommunication Services) 1,744 12,539Cooper-Standard Holding, Inc.* (Auto
Components) 410 8,442Corcept Therapeutics, Inc.* (Pharmaceuticals) 894 16,780Core Laboratories N.V. (Energy Equipment &
Services) 648 17,282CoreCivic, Inc.* (Equity Real Estate
Investment Trusts) 2,907 29,390Covetrus, Inc.* (Health Care Providers &
Services) 2,497 45,121CSG Systems International, Inc. (IT Services) 322 18,280CTS Corp. (Electronic Equipment,
Instruments & Components) 382 12,816Cutera, Inc.* (Health Care Equipment &
Supplies) 146 5,316CVB Financial Corp. (Banks) 3,076 67,764
See accompanying notes to the financial statements.
Toppan Merrill - ProFunds Public Semi-Annual Report [Funds] 01-31-2022 ED [AUX] | akiesli | 29-Mar-22 08:43 | 22-1296-2.di | Sequence: 15CHKSUM Content: 45237 Layout: 14245 Graphics: 0 CLEAN
JOB: 22-1296-2 CYCLE#;BL#: 8; 0 TRIM: 8.25" x 10.75" AS: New York: 212-620-5600COLORS: ~note-color 2, Black, ~note-color 3 GRAPHICS: none V1.5
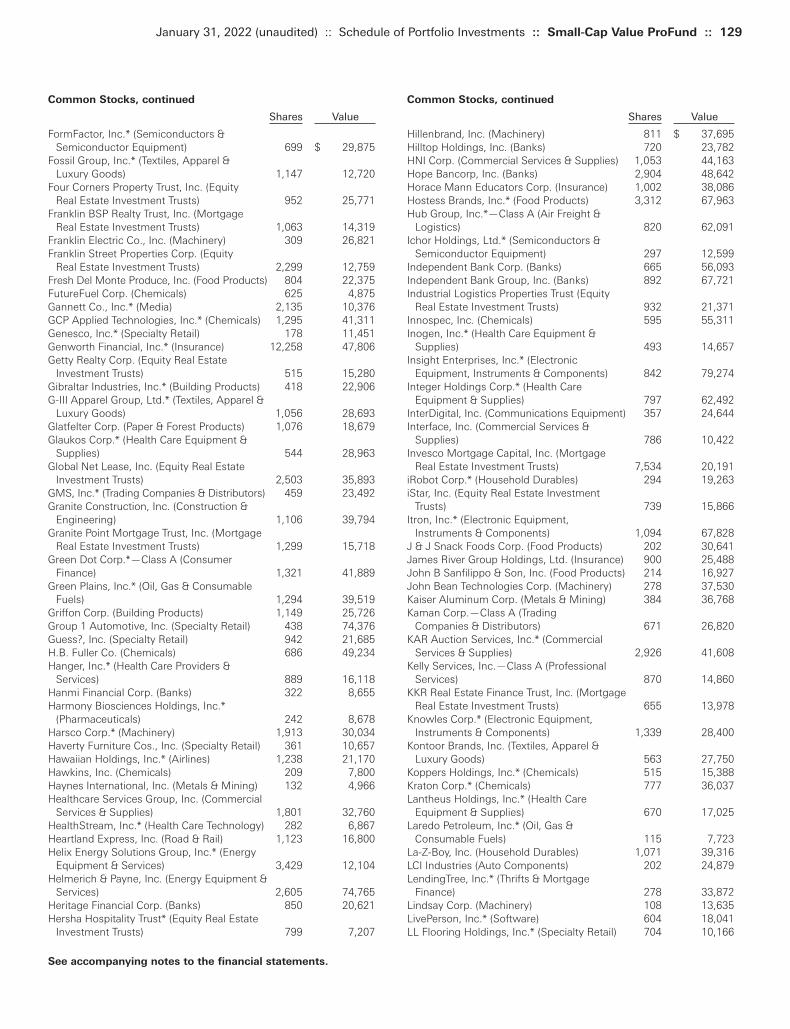
Common Stocks, continued
Shares Value Hillenbrand, Inc. (Machinery) 811 $ 37,695Hilltop Holdings, Inc. (Banks) 720 23,782HNI Corp. (Commercial Services & Supplies) 1,053 44,163Hope Bancorp, Inc. (Banks) 2,904 48,642Horace Mann Educators Corp. (Insurance) 1,002 38,086Hostess Brands, Inc.* (Food Products) 3,312 67,963Hub Group, Inc.*—Class A (Air Freight &
Logistics) 820 62,091Ichor Holdings, Ltd.* (Semiconductors &
Semiconductor Equipment) 297 12,599Independent Bank Corp. (Banks) 665 56,093Independent Bank Group, Inc. (Banks) 892 67,721Industrial Logistics Properties Trust (Equity
Real Estate Investment Trusts) 932 21,371Innospec, Inc. (Chemicals) 595 55,311Inogen, Inc.* (Health Care Equipment &
Supplies) 493 14,657Insight Enterprises, Inc.* (Electronic
Equipment, Instruments & Components) 842 79,274Integer Holdings Corp.* (Health Care
Equipment & Supplies) 797 62,492InterDigital, Inc. (Communications Equipment) 357 24,644Interface, Inc. (Commercial Services &
Supplies) 786 10,422Invesco Mortgage Capital, Inc. (Mortgage
Real Estate Investment Trusts) 7,534 20,191iRobot Corp.* (Household Durables) 294 19,263iStar, Inc. (Equity Real Estate Investment
Trusts) 739 15,866Itron, Inc.* (Electronic Equipment,
Instruments & Components) 1,094 67,828J & J Snack Foods Corp. (Food Products) 202 30,641James River Group Holdings, Ltd. (Insurance) 900 25,488John B Sanfilippo & Son, Inc. (Food Products) 214 16,927John Bean Technologies Corp. (Machinery) 278 37,530Kaiser Aluminum Corp. (Metals & Mining) 384 36,768Kaman Corp.—Class A (Trading
Companies & Distributors) 671 26,820KAR Auction Services, Inc.* (Commercial
Services & Supplies) 2,926 41,608Kelly Services, Inc.—Class A (Professional
Services) 870 14,860KKR Real Estate Finance Trust, Inc. (Mortgage
Real Estate Investment Trusts) 655 13,978Knowles Corp.* (Electronic Equipment,
Instruments & Components) 1,339 28,400Kontoor Brands, Inc. (Textiles, Apparel &
Luxury Goods) 563 27,750Koppers Holdings, Inc.* (Chemicals) 515 15,388Kraton Corp.* (Chemicals) 777 36,037Lantheus Holdings, Inc.* (Health Care
Equipment & Supplies) 670 17,025Laredo Petroleum, Inc.* (Oil, Gas &
Consumable Fuels) 115 7,723La-Z-Boy, Inc. (Household Durables) 1,071 39,316LCI Industries (Auto Components) 202 24,879LendingTree, Inc.* (Thrifts & Mortgage
Finance) 278 33,872Lindsay Corp. (Machinery) 108 13,635LivePerson, Inc.* (Software) 604 18,041LL Flooring Holdings, Inc.* (Specialty Retail) 704 10,166
Common Stocks, continued
Shares Value FormFactor, Inc.* (Semiconductors &
Semiconductor Equipment) 699 $ 29,875Fossil Group, Inc.* (Textiles, Apparel &
Luxury Goods) 1,147 12,720Four Corners Property Trust, Inc. (Equity
Real Estate Investment Trusts) 952 25,771Franklin BSP Realty Trust, Inc. (Mortgage
Real Estate Investment Trusts) 1,063 14,319Franklin Electric Co., Inc. (Machinery) 309 26,821Franklin Street Properties Corp. (Equity
Real Estate Investment Trusts) 2,299 12,759Fresh Del Monte Produce, Inc. (Food Products) 804 22,375FutureFuel Corp. (Chemicals) 625 4,875Gannett Co., Inc.* (Media) 2,135 10,376GCP Applied Technologies, Inc.* (Chemicals) 1,295 41,311Genesco, Inc.* (Specialty Retail) 178 11,451Genworth Financial, Inc.* (Insurance) 12,258 47,806Getty Realty Corp. (Equity Real Estate
Investment Trusts) 515 15,280Gibraltar Industries, Inc.* (Building Products) 418 22,906G-III Apparel Group, Ltd.* (Textiles, Apparel &
Luxury Goods) 1,056 28,693Glatfelter Corp. (Paper & Forest Products) 1,076 18,679Glaukos Corp.* (Health Care Equipment &
Supplies) 544 28,963Global Net Lease, Inc. (Equity Real Estate
Investment Trusts) 2,503 35,893GMS, Inc.* (Trading Companies & Distributors) 459 23,492Granite Construction, Inc. (Construction &
Engineering) 1,106 39,794Granite Point Mortgage Trust, Inc. (Mortgage
Real Estate Investment Trusts) 1,299 15,718Green Dot Corp.*—Class A (Consumer
Finance) 1,321 41,889Green Plains, Inc.* (Oil, Gas & Consumable
Fuels) 1,294 39,519Griffon Corp. (Building Products) 1,149 25,726Group 1 Automotive, Inc. (Specialty Retail) 438 74,376Guess?, Inc. (Specialty Retail) 942 21,685H.B. Fuller Co. (Chemicals) 686 49,234Hanger, Inc.* (Health Care Providers &
Services) 889 16,118Hanmi Financial Corp. (Banks) 322 8,655Harmony Biosciences Holdings, Inc.*
(Pharmaceuticals) 242 8,678Harsco Corp.* (Machinery) 1,913 30,034Haverty Furniture Cos., Inc. (Specialty Retail) 361 10,657Hawaiian Holdings, Inc.* (Airlines) 1,238 21,170Hawkins, Inc. (Chemicals) 209 7,800Haynes International, Inc. (Metals & Mining) 132 4,966Healthcare Services Group, Inc. (Commercial
Services & Supplies) 1,801 32,760HealthStream, Inc.* (Health Care Technology) 282 6,867Heartland Express, Inc. (Road & Rail) 1,123 16,800Helix Energy Solutions Group, Inc.* (Energy
Equipment & Services) 3,429 12,104Helmerich & Payne, Inc. (Energy Equipment &
Services) 2,605 74,765Heritage Financial Corp. (Banks) 850 20,621Hersha Hospitality Trust* (Equity Real Estate
Investment Trusts) 799 7,207
January 31, 2022 (unaudited) :: Schedule of Portfolio Investments :: Small-Cap Value ProFund :: 129
See accompanying notes to the financial statements.
Toppan Merrill - ProFunds Public Semi-Annual Report [Funds] 01-31-2022 ED [AUX] | akiesli | 29-Mar-22 08:43 | 22-1296-2.di | Sequence: 16CHKSUM Content: 11411 Layout: 22843 Graphics: 0 CLEAN
JOB: 22-1296-2 CYCLE#;BL#: 8; 0 TRIM: 8.25" x 10.75" AS: New York: 212-620-5600COLORS: ~note-color 2, Black, ~note-color 3 GRAPHICS: none V1.5
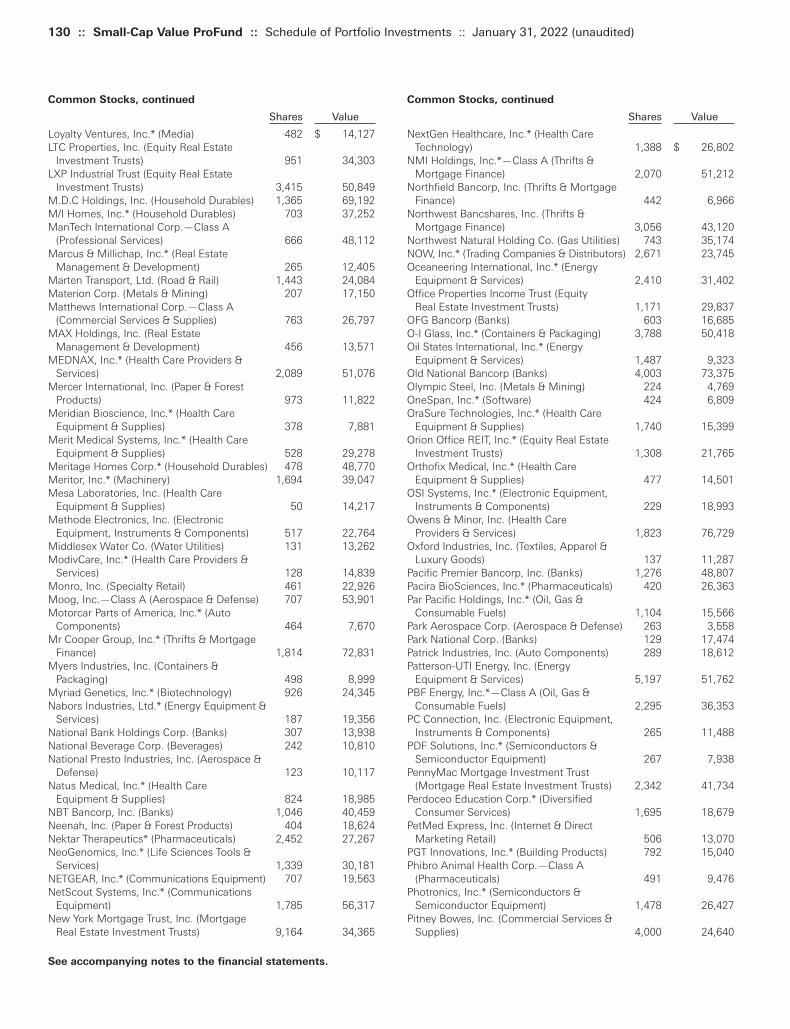
130 :: Small-Cap Value ProFund :: Schedule of Portfolio Investments :: January 31, 2022 (unaudited)
Common Stocks, continued
Shares Value NextGen Healthcare, Inc.* (Health Care
Technology) 1,388 $ 26,802NMI Holdings, Inc.*—Class A (Thrifts &
Mortgage Finance) 2,070 51,212Northfield Bancorp, Inc. (Thrifts & Mortgage
Finance) 442 6,966Northwest Bancshares, Inc. (Thrifts &
Mortgage Finance) 3,056 43,120Northwest Natural Holding Co. (Gas Utilities) 743 35,174NOW, Inc.* (Trading Companies & Distributors) 2,671 23,745Oceaneering International, Inc.* (Energy
Equipment & Services) 2,410 31,402Office Properties Income Trust (Equity
Real Estate Investment Trusts) 1,171 29,837OFG Bancorp (Banks) 603 16,685O-I Glass, Inc.* (Containers & Packaging) 3,788 50,418Oil States International, Inc.* (Energy
Equipment & Services) 1,487 9,323Old National Bancorp (Banks) 4,003 73,375Olympic Steel, Inc. (Metals & Mining) 224 4,769OneSpan, Inc.* (Software) 424 6,809OraSure Technologies, Inc.* (Health Care
Equipment & Supplies) 1,740 15,399Orion Office REIT, Inc.* (Equity Real Estate
Investment Trusts) 1,308 21,765Orthofix Medical, Inc.* (Health Care
Equipment & Supplies) 477 14,501OSI Systems, Inc.* (Electronic Equipment,
Instruments & Components) 229 18,993Owens & Minor, Inc. (Health Care
Providers & Services) 1,823 76,729Oxford Industries, Inc. (Textiles, Apparel &
Luxury Goods) 137 11,287Pacific Premier Bancorp, Inc. (Banks) 1,276 48,807Pacira BioSciences, Inc.* (Pharmaceuticals) 420 26,363Par Pacific Holdings, Inc.* (Oil, Gas &
Consumable Fuels) 1,104 15,566Park Aerospace Corp. (Aerospace & Defense) 263 3,558Park National Corp. (Banks) 129 17,474Patrick Industries, Inc. (Auto Components) 289 18,612Patterson-UTI Energy, Inc. (Energy
Equipment & Services) 5,197 51,762PBF Energy, Inc.*—Class A (Oil, Gas &
Consumable Fuels) 2,295 36,353PC Connection, Inc. (Electronic Equipment,
Instruments & Components) 265 11,488PDF Solutions, Inc.* (Semiconductors &
Semiconductor Equipment) 267 7,938PennyMac Mortgage Investment Trust
(Mortgage Real Estate Investment Trusts) 2,342 41,734Perdoceo Education Corp.* (Diversified
Consumer Services) 1,695 18,679PetMed Express, Inc. (Internet & Direct
Marketing Retail) 506 13,070PGT Innovations, Inc.* (Building Products) 792 15,040Phibro Animal Health Corp.—Class A
(Pharmaceuticals) 491 9,476Photronics, Inc.* (Semiconductors &
Semiconductor Equipment) 1,478 26,427Pitney Bowes, Inc. (Commercial Services &
Supplies) 4,000 24,640
Common Stocks, continued
Shares Value Loyalty Ventures, Inc.* (Media) 482 $ 14,127LTC Properties, Inc. (Equity Real Estate
Investment Trusts) 951 34,303LXP Industrial Trust (Equity Real Estate
Investment Trusts) 3,415 50,849M.D.C Holdings, Inc. (Household Durables) 1,365 69,192M/I Homes, Inc.* (Household Durables) 703 37,252ManTech International Corp.—Class A
(Professional Services) 666 48,112Marcus & Millichap, Inc.* (Real Estate
Management & Development) 265 12,405Marten Transport, Ltd. (Road & Rail) 1,443 24,084Materion Corp. (Metals & Mining) 207 17,150Matthews International Corp.—Class A
(Commercial Services & Supplies) 763 26,797MAX Holdings, Inc. (Real Estate
Management & Development) 456 13,571MEDNAX, Inc.* (Health Care Providers &
Services) 2,089 51,076Mercer International, Inc. (Paper & Forest
Products) 973 11,822Meridian Bioscience, Inc.* (Health Care
Equipment & Supplies) 378 7,881Merit Medical Systems, Inc.* (Health Care
Equipment & Supplies) 528 29,278Meritage Homes Corp.* (Household Durables) 478 48,770Meritor, Inc.* (Machinery) 1,694 39,047Mesa Laboratories, Inc. (Health Care
Equipment & Supplies) 50 14,217Methode Electronics, Inc. (Electronic
Equipment, Instruments & Components) 517 22,764Middlesex Water Co. (Water Utilities) 131 13,262ModivCare, Inc.* (Health Care Providers &
Services) 128 14,839Monro, Inc. (Specialty Retail) 461 22,926Moog, Inc.—Class A (Aerospace & Defense) 707 53,901Motorcar Parts of America, Inc.* (Auto
Components) 464 7,670Mr Cooper Group, Inc.* (Thrifts & Mortgage
Finance) 1,814 72,831Myers Industries, Inc. (Containers &
Packaging) 498 8,999Myriad Genetics, Inc.* (Biotechnology) 926 24,345Nabors Industries, Ltd.* (Energy Equipment &
Services) 187 19,356National Bank Holdings Corp. (Banks) 307 13,938National Beverage Corp. (Beverages) 242 10,810National Presto Industries, Inc. (Aerospace &
Defense) 123 10,117Natus Medical, Inc.* (Health Care
Equipment & Supplies) 824 18,985NBT Bancorp, Inc. (Banks) 1,046 40,459Neenah, Inc. (Paper & Forest Products) 404 18,624Nektar Therapeutics* (Pharmaceuticals) 2,452 27,267NeoGenomics, Inc.* (Life Sciences Tools &
Services) 1,339 30,181NETGEAR, Inc.* (Communications Equipment) 707 19,563NetScout Systems, Inc.* (Communications
Equipment) 1,785 56,317New York Mortgage Trust, Inc. (Mortgage
Real Estate Investment Trusts) 9,164 34,365
See accompanying notes to the financial statements.
Toppan Merrill - ProFunds Public Semi-Annual Report [Funds] 01-31-2022 ED [AUX] | akiesli | 29-Mar-22 08:43 | 22-1296-2.di | Sequence: 17CHKSUM Content: 7060 Layout: 56470 Graphics: 0 CLEAN
JOB: 22-1296-2 CYCLE#;BL#: 8; 0 TRIM: 8.25" x 10.75" AS: New York: 212-620-5600COLORS: ~note-color 2, Black, ~note-color 3 GRAPHICS: none V1.5

Common Stocks, continued
Shares Value Select Medical Holdings Corp. (Health Care
Providers & Services) 2,560 $ 59,469Selectquote, Inc.* (Insurance) 1,537 11,358Seneca Foods Corp.*—Class A
(Food Products) 151 7,059Service Properties Trust (Equity Real Estate
Investment Trusts) 3,989 34,106Shake Shack, Inc.*—Class A (Hotels,
Restaurants & Leisure) 426 28,146Shenandoah Telecommunications Co.
(Wireless Telecommunication Services) 1,207 27,483Simmons First National Corp.—Class A
(Banks) 2,774 79,336Simulations Plus, Inc. (Health Care
Technology) 151 6,421SiriusPoint, Ltd.* (Insurance) 2,115 17,914SITE Centers Corp. (Equity Real Estate
Investment Trusts) 1,950 28,880SkyWest, Inc.* (Airlines) 1,217 46,429SMART Global Holdings, Inc.*
(Semiconductors & Semiconductor Equipment) 218 12,504
Sonic Automotive, Inc.—Class A (Specialty Retail) 501 25,556
South Jersey Industries, Inc. (Gas Utilities) 2,716 67,954Southside Bancshares, Inc. (Banks) 290 12,151Southwestern Energy Co.* (Oil, Gas &
Consumable Fuels) 8,830 38,852SpartanNash Co. (Food & Staples Retailing) 867 21,302Spectrum Pharmaceuticals, Inc.*
(Biotechnology) 1,711 1,200SPX Corp.* (Machinery) 636 33,186SPX FLOW, Inc. (Machinery) 395 34,049Standard Motor Products, Inc. (Auto
Components) 463 22,164Standex International Corp. (Machinery) 153 15,201Stepan Co. (Chemicals) 515 56,732Steven Madden, Ltd. (Textiles, Apparel &
Luxury Goods) 611 25,137Stewart Information Services Corp. (Insurance) 331 23,643StoneX Group, Inc.* (Capital Markets) 406 26,637Strategic Education, Inc. (Diversified
Consumer Services) 547 32,634Summit Hotel Properties, Inc.* (Equity
Real Estate Investment Trusts) 2,574 24,247SunCoke Energy, Inc. (Metals & Mining) 2,008 13,755Surmodics, Inc.* (Health Care Equipment &
Supplies) 117 5,345Sylvamo Corp.* (Paper & Forest Products) 852 25,382Tabula Rasa HealthCare, Inc.* (Health Care
Technology) 288 3,108Tactile Systems Technology, Inc.* (Health Care
Equipment & Supplies) 479 7,554Talos Energy, Inc.* (Oil, Gas & Consumable
Fuels) 989 10,523Telephone and Data Systems, Inc. (Wireless
Telecommunication Services) 2,386 47,243Tennant Co. (Machinery) 254 19,601The Andersons, Inc. (Food & Staples Retailing) 748 28,499The Cato Corp.—Class A (Specialty Retail) 473 7,814
Common Stocks, continued
Shares Value Plantronics, Inc.* (Communications Equipment) 536 $ 14,284Plexus Corp.* (Electronic Equipment,
Instruments & Components) 682 52,869Powell Industries, Inc. (Electrical Equipment) 218 6,509PRA Group, Inc.* (Consumer Finance) 1,053 48,965Prestige Consumer Healthcare, Inc.*
(Pharmaceuticals) 569 32,121PriceSmart, Inc. (Food & Staples Retailing) 581 41,489ProAssurance Corp. (Insurance) 1,304 31,244ProPetro Holding Corp.* (Energy Equipment &
Services) 2,049 21,535Proto Labs, Inc.* (Machinery) 666 33,420Provident Financial Services, Inc. (Thrifts &
Mortgage Finance) 1,007 24,339Quaker Chemical Corp. (Chemicals) 135 28,238Quanex Building Products Corp. (Building
Products) 810 17,650QuinStreet, Inc.* (Interactive Media &
Services) 1,205 19,389Range Resources Corp.* (Oil, Gas &
Consumable Fuels) 1,871 36,017Rayonier Advanced Materials, Inc.*
(Chemicals) 1,543 9,613Ready Capital Corp. (Mortgage Real Estate
Investment Trusts) 1,422 20,249Realogy Holdings Corp.* (Real Estate
Management & Development) 2,816 46,463Red Robin Gourmet Burgers, Inc.* (Hotels,
Restaurants & Leisure) 381 5,620REGENXBIO, Inc.* (Biotechnology) 500 13,200Renasant Corp. (Banks) 1,346 49,506Renewable Energy Group, Inc.* (Oil, Gas &
Consumable Fuels) 1,214 48,875Rent-A-Center, Inc. (Specialty Retail) 759 31,992Resideo Technologies, Inc.* (Building
Products) 3,486 86,384Resources Connection, Inc. (Professional
Services) 754 13,142Retail Opportunity Investments Corp. (Equity
Real Estate Investment Trusts) 1,496 27,721REX American Resources Corp.* (Oil, Gas &
Consumable Fuels) 127 12,247RPC, Inc.* (Energy Equipment & Services) 1,728 10,212RPT Realty (Equity Real Estate Investment
Trusts) 998 12,595Ruth’s Hospitality Group, Inc.* (Hotels,
Restaurants & Leisure) 768 15,383S&T Bancorp, Inc. (Banks) 950 29,270Safety Insurance Group, Inc. (Insurance) 344 28,322Sally Beauty Holdings, Inc.* (Specialty Retail) 1,529 26,253Sanmina Corp.* (Electronic Equipment,
Instruments & Components) 1,555 58,810Saul Centers, Inc. (Equity Real Estate
Investment Trusts) 98 4,839ScanSource, Inc.* (Electronic Equipment,
Instruments & Components) 617 19,238Scholastic Corp. (Media) 736 30,191Schweitzer-Mauduit International, Inc.
(Paper & Forest Products) 759 22,975Seacoast Banking Corp. of Florida (Banks) 677 24,711
January 31, 2022 (unaudited) :: Schedule of Portfolio Investments :: Small-Cap Value ProFund :: 131
See accompanying notes to the financial statements.
Toppan Merrill - ProFunds Public Semi-Annual Report [Funds] 01-31-2022 ED [AUX] | akiesli | 29-Mar-22 08:43 | 22-1296-2.di | Sequence: 18CHKSUM Content: 25679 Layout: 22843 Graphics: 0 CLEAN
JOB: 22-1296-2 CYCLE#;BL#: 8; 0 TRIM: 8.25" x 10.75" AS: New York: 212-620-5600COLORS: ~note-color 2, Black, ~note-color 3 GRAPHICS: none V1.5

132 :: Small-Cap Value ProFund :: Schedule of Portfolio Investments :: January 31, 2022 (unaudited)
Common Stocks, continued
Shares Value Universal Insurance Holdings, Inc. (Insurance) 677 $ 11,671Urstadt Biddle Properties, Inc.—Class A
(Equity Real Estate Investment Trusts) 334 6,576USANA Health Sciences, Inc.* (Personal
Products) 94 8,985Vanda Pharmaceuticals, Inc.* (Biotechnology) 484 7,337Varex Imaging Corp.* (Health Care
Equipment & Supplies) 343 8,952Vera Bradley, Inc.* (Textiles, Apparel & Luxury
Goods) 618 5,061Veris Residential, Inc.* (Equity Real Estate
Investment Trusts) 1,932 31,878Veritiv Corp.* (Trading Companies &
Distributors) 335 31,182Viad Corp.* (Commercial Services & Supplies) 232 8,739Viavi Solutions, Inc.* (Communications
Equipment) 2,181 35,899Wabash National Corp. (Machinery) 1,195 23,446Warrior Met Coal, Inc. (Metals & Mining) 1,242 32,540Washington Real Estate Investment Trust
(Equity Real Estate Investment Trusts) 1,145 28,190WD-40 Co. (Household Products) 138 30,672Westamerica Bancorp (Banks) 650 37,752Whitestone REIT (Equity Real Estate
Investment Trusts) 1,116 11,394Winnebago Industries, Inc. (Automobiles) 395 25,485WisdomTree Investments, Inc. (Capital
Markets) 1,001 5,616Wolverine World Wide, Inc. (Textiles,
Apparel & Luxury Goods) 1,075 28,477World Fuel Services Corp. (Oil, Gas &
Consumable Fuels) 1,527 43,077WSFS Financial Corp. (Thrifts & Mortgage
Finance) 886 46,409WW International, Inc.* (Diversified
Consumer Services) 1,285 16,191Xenia Hotels & Resorts, Inc.* (Equity
Real Estate Investment Trusts) 2,759 47,841Xperi Holding Corp. (Software) 1,212 20,446Zumiez, Inc.* (Specialty Retail) 517 23,239
TOTAL COMMON STOCKS
(Cost $10,134,724) 12,330,072
TOTAL INVESTMENT SECURITIES
(Cost $10,134,724)—100.5% 12,330,072Net other assets (liabilities)—(0.5)% (56,829)
NET ASSETS—100.0% $12,273,243
* Non-income producing security.
Common Stocks, continued
Shares Value The Cheesecake Factory, Inc.* (Hotels,
Restaurants & Leisure) 1,171 $ 41,781The E.W. Scripps Co.*—Class A (Media) 747 15,314The Ensign Group, Inc. (Health Care
Providers & Services) 582 43,900The GEO Group, Inc.* (Equity Real Estate
Investment Trusts) 2,961 19,928The Greenbrier Cos., Inc. (Machinery) 786 31,723The Marcus Corp.* (Entertainment) 528 8,897The ODP Corp.* (Specialty Retail) 1,108 49,007The Pennant Group, Inc.* (Health Care
Providers & Services) 318 5,285TimkenSteel Corp.* (Metals & Mining) 994 13,946Titan International, Inc.* (Machinery) 1,237 12,061Tivity Health, Inc.* (Health Care Providers &
Services) 568 14,450Tompkins Financial Corp. (Banks) 161 12,809Tootsie Roll Industries, Inc. (Food Products) 209 7,096Tredegar Corp. (Chemicals) 620 7,285TreeHouse Foods, Inc.* (Food Products) 1,347 52,170Trinseo PLC (Chemicals) 939 50,274TrueBlue, Inc.* (Professional Services) 857 22,796TrustCo Bank Corp. (Thrifts & Mortgage
Finance) 464 15,730Trustmark Corp. (Banks) 1,511 49,228TTM Technologies, Inc.* (Electronic
Equipment, Instruments & Components) 2,520 33,919Tupperware Brands Corp.* (Household
Durables) 1,181 18,211Two Harbors Investment Corp. (Mortgage
Real Estate Investment Trusts) 8,309 47,777U.S. Ecology, Inc.* (Commercial Services &
Supplies) 760 21,721U.S. Physical Therapy, Inc. (Health Care
Providers & Services) 172 16,644U.S. Silica Holdings, Inc.* (Energy
Equipment & Services) 1,803 17,219Unifi, Inc.* (Textiles, Apparel & Luxury Goods) 336 6,387UniFirst Corp. (Commercial Services &
Supplies) 368 69,953Unisys Corp.* (IT Services) 843 15,385United Community Banks, Inc. (Banks) 910 32,205United Fire Group, Inc. (Insurance) 521 12,994Uniti Group, Inc. (Equity Real Estate
Investment Trusts) 2,396 28,896Unitil Corp. (Multi-Utilities) 386 18,119Universal Corp. (Tobacco) 594 32,331Universal Electronics, Inc.* (Household
Durables) 314 11,144Universal Health Realty Income Trust (Equity
Real Estate Investment Trusts) 142 8,279
See accompanying notes to the financial statements.
Toppan Merrill - ProFunds Public Semi-Annual Report [Funds] 01-31-2022 ED [AUX] | akiesli | 29-Mar-22 08:43 | 22-1296-2.di | Sequence: 19CHKSUM Content: 42354 Layout: 49796 Graphics: 0 CLEAN
JOB: 22-1296-2 CYCLE#;BL#: 8; 0 TRIM: 8.25" x 10.75" AS: New York: 212-620-5600COLORS: ~note-color 2, Black, ~note-color 3 GRAPHICS: none V1.5
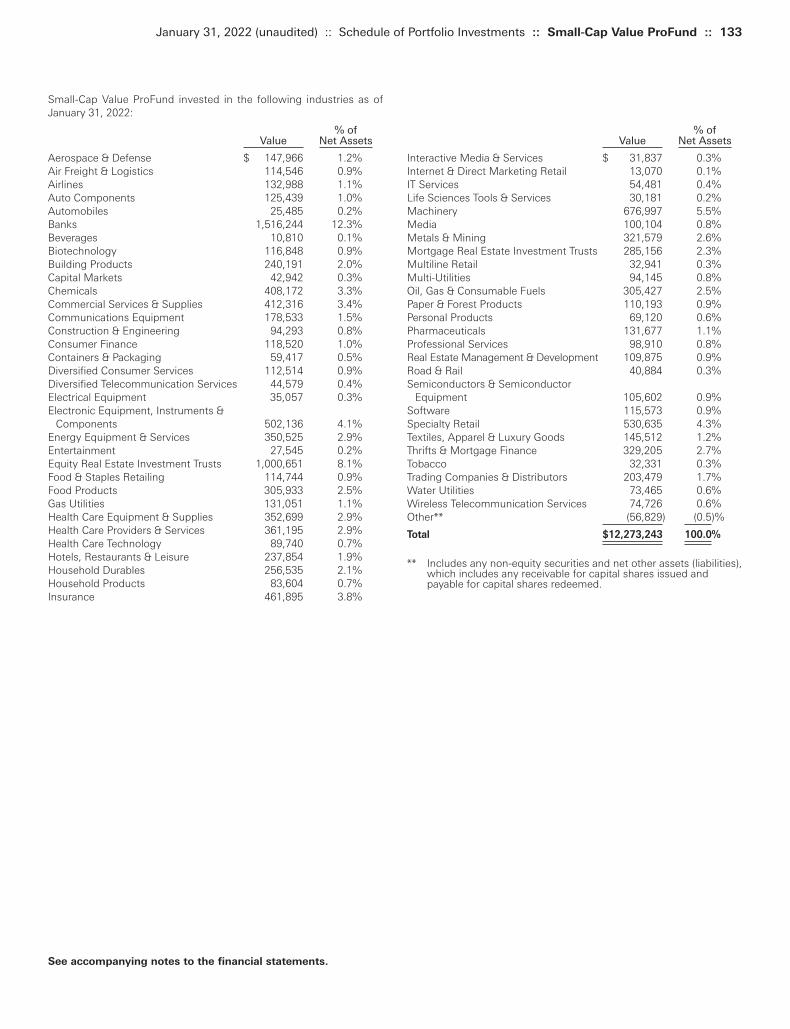
% ofValue Net Assets
Interactive Media & Services $ 31,837 0.3%Internet & Direct Marketing Retail 13,070 0.1%IT Services 54,481 0.4%Life Sciences Tools & Services 30,181 0.2%Machinery 676,997 5.5%Media 100,104 0.8%Metals & Mining 321,579 2.6%Mortgage Real Estate Investment Trusts 285,156 2.3%Multiline Retail 32,941 0.3%Multi-Utilities 94,145 0.8%Oil, Gas & Consumable Fuels 305,427 2.5%Paper & Forest Products 110,193 0.9%Personal Products 69,120 0.6%Pharmaceuticals 131,677 1.1%Professional Services 98,910 0.8%Real Estate Management & Development 109,875 0.9%Road & Rail 40,884 0.3%Semiconductors & Semiconductor
Equipment 105,602 0.9%Software 115,573 0.9%Specialty Retail 530,635 4.3%Textiles, Apparel & Luxury Goods 145,512 1.2%Thrifts & Mortgage Finance 329,205 2.7%Tobacco 32,331 0.3%Trading Companies & Distributors 203,479 1.7%Water Utilities 73,465 0.6%Wireless Telecommunication Services 74,726 0.6%Other** (56,829) (0.5)%
Total $12,273,243 100.0%
** Includes any non-equity securities and net other assets (liabilities),which includes any receivable for capital shares issued andpayable for capital shares redeemed.
Small-Cap Value ProFund invested in the following industries as ofJanuary 31, 2022:
% ofValue Net Assets
Aerospace & Defense $ 147,966 1.2%Air Freight & Logistics 114,546 0.9%Airlines 132,988 1.1%Auto Components 125,439 1.0%Automobiles 25,485 0.2%Banks 1,516,244 12.3%Beverages 10,810 0.1%Biotechnology 116,848 0.9%Building Products 240,191 2.0%Capital Markets 42,942 0.3%Chemicals 408,172 3.3%Commercial Services & Supplies 412,316 3.4%Communications Equipment 178,533 1.5%Construction & Engineering 94,293 0.8%Consumer Finance 118,520 1.0%Containers & Packaging 59,417 0.5%Diversified Consumer Services 112,514 0.9%Diversified Telecommunication Services 44,579 0.4%Electrical Equipment 35,057 0.3%Electronic Equipment, Instruments &
Components 502,136 4.1%Energy Equipment & Services 350,525 2.9%Entertainment 27,545 0.2%Equity Real Estate Investment Trusts 1,000,651 8.1%Food & Staples Retailing 114,744 0.9%Food Products 305,933 2.5%Gas Utilities 131,051 1.1%Health Care Equipment & Supplies 352,699 2.9%Health Care Providers & Services 361,195 2.9%Health Care Technology 89,740 0.7%Hotels, Restaurants & Leisure 237,854 1.9%Household Durables 256,535 2.1%Household Products 83,604 0.7%Insurance 461,895 3.8%
January 31, 2022 (unaudited) :: Schedule of Portfolio Investments :: Small-Cap Value ProFund :: 133
See accompanying notes to the financial statements.
Toppan Merrill - ProFunds Public Semi-Annual Report [Funds] 01-31-2022 ED [AUX] | akiesli | 29-Mar-22 08:43 | 22-1296-2.di | Sequence: 20CHKSUM Content: 14845 Layout: 10959 Graphics: 0 CLEAN
JOB: 22-1296-2 CYCLE#;BL#: 8; 0 TRIM: 8.25" x 10.75" AS: New York: 212-620-5600COLORS: ~note-color 2, Black, ~note-color 3 GRAPHICS: none V1.5
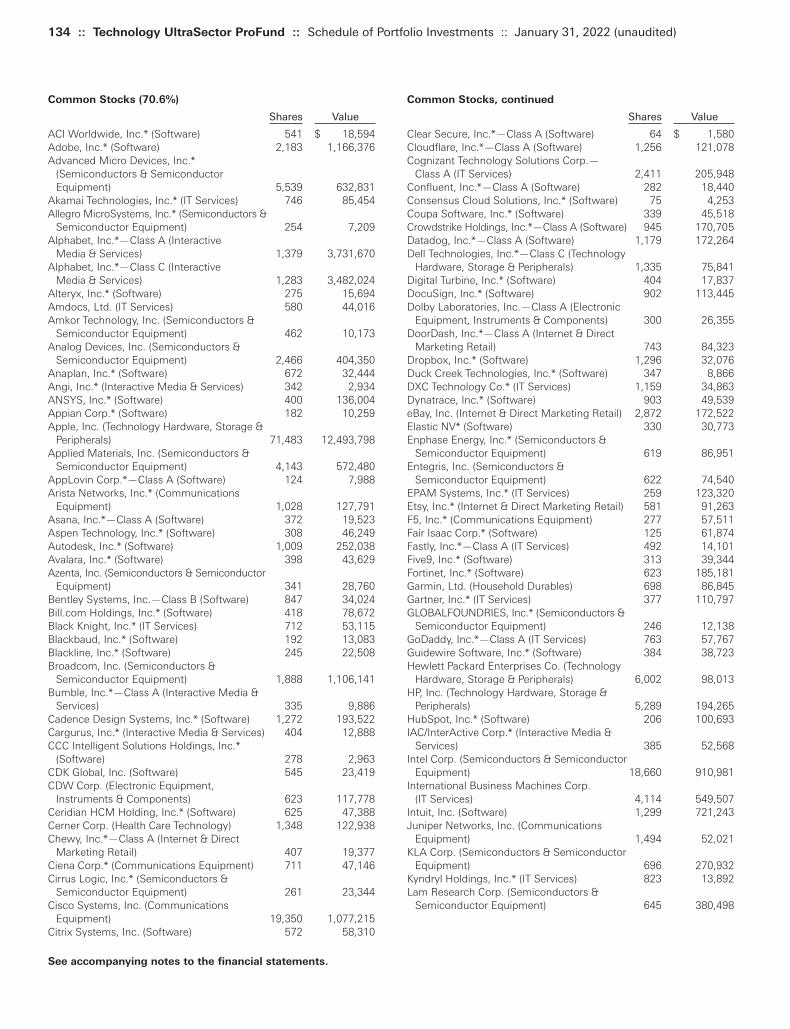
134 :: Technology UltraSector ProFund :: Schedule of Portfolio Investments :: January 31, 2022 (unaudited)
Common Stocks, continued
Shares Value Clear Secure, Inc.*—Class A (Software) 64 $ 1,580Cloudflare, Inc.*—Class A (Software) 1,256 121,078Cognizant Technology Solutions Corp.—
Class A (IT Services) 2,411 205,948Confluent, Inc.*—Class A (Software) 282 18,440Consensus Cloud Solutions, Inc.* (Software) 75 4,253Coupa Software, Inc.* (Software) 339 45,518Crowdstrike Holdings, Inc.*—Class A (Software) 945 170,705Datadog, Inc.*—Class A (Software) 1,179 172,264Dell Technologies, Inc.*—Class C (Technology
Hardware, Storage & Peripherals) 1,335 75,841Digital Turbine, Inc.* (Software) 404 17,837DocuSign, Inc.* (Software) 902 113,445Dolby Laboratories, Inc.—Class A (Electronic
Equipment, Instruments & Components) 300 26,355DoorDash, Inc.*—Class A (Internet & Direct
Marketing Retail) 743 84,323Dropbox, Inc.* (Software) 1,296 32,076Duck Creek Technologies, Inc.* (Software) 347 8,866DXC Technology Co.* (IT Services) 1,159 34,863Dynatrace, Inc.* (Software) 903 49,539eBay, Inc. (Internet & Direct Marketing Retail) 2,872 172,522Elastic NV* (Software) 330 30,773Enphase Energy, Inc.* (Semiconductors &
Semiconductor Equipment) 619 86,951Entegris, Inc. (Semiconductors &
Semiconductor Equipment) 622 74,540EPAM Systems, Inc.* (IT Services) 259 123,320Etsy, Inc.* (Internet & Direct Marketing Retail) 581 91,263F5, Inc.* (Communications Equipment) 277 57,511Fair Isaac Corp.* (Software) 125 61,874Fastly, Inc.*—Class A (IT Services) 492 14,101Five9, Inc.* (Software) 313 39,344Fortinet, Inc.* (Software) 623 185,181Garmin, Ltd. (Household Durables) 698 86,845Gartner, Inc.* (IT Services) 377 110,797GLOBALFOUNDRIES, Inc.* (Semiconductors &
Semiconductor Equipment) 246 12,138GoDaddy, Inc.*—Class A (IT Services) 763 57,767Guidewire Software, Inc.* (Software) 384 38,723Hewlett Packard Enterprises Co. (Technology
Hardware, Storage & Peripherals) 6,002 98,013HP, Inc. (Technology Hardware, Storage &
Peripherals) 5,289 194,265HubSpot, Inc.* (Software) 206 100,693IAC/InterActive Corp.* (Interactive Media &
Services) 385 52,568Intel Corp. (Semiconductors & Semiconductor
Equipment) 18,660 910,981International Business Machines Corp.
(IT Services) 4,114 549,507Intuit, Inc. (Software) 1,299 721,243Juniper Networks, Inc. (Communications
Equipment) 1,494 52,021KLA Corp. (Semiconductors & Semiconductor
Equipment) 696 270,932Kyndryl Holdings, Inc.* (IT Services) 823 13,892Lam Research Corp. (Semiconductors &
Semiconductor Equipment) 645 380,498
Common Stocks (70.6%)
Shares Value ACI Worldwide, Inc.* (Software) 541 $ 18,594Adobe, Inc.* (Software) 2,183 1,166,376Advanced Micro Devices, Inc.*
(Semiconductors & Semiconductor Equipment) 5,539 632,831
Akamai Technologies, Inc.* (IT Services) 746 85,454Allegro MicroSystems, Inc.* (Semiconductors &
Semiconductor Equipment) 254 7,209Alphabet, Inc.*—Class A (Interactive
Media & Services) 1,379 3,731,670Alphabet, Inc.*—Class C (Interactive
Media & Services) 1,283 3,482,024Alteryx, Inc.* (Software) 275 15,694Amdocs, Ltd. (IT Services) 580 44,016Amkor Technology, Inc. (Semiconductors &
Semiconductor Equipment) 462 10,173Analog Devices, Inc. (Semiconductors &
Semiconductor Equipment) 2,466 404,350Anaplan, Inc.* (Software) 672 32,444Angi, Inc.* (Interactive Media & Services) 342 2,934ANSYS, Inc.* (Software) 400 136,004Appian Corp.* (Software) 182 10,259Apple, Inc. (Technology Hardware, Storage &
Peripherals) 71,483 12,493,798Applied Materials, Inc. (Semiconductors &
Semiconductor Equipment) 4,143 572,480AppLovin Corp.*—Class A (Software) 124 7,988Arista Networks, Inc.* (Communications
Equipment) 1,028 127,791Asana, Inc.*—Class A (Software) 372 19,523Aspen Technology, Inc.* (Software) 308 46,249Autodesk, Inc.* (Software) 1,009 252,038Avalara, Inc.* (Software) 398 43,629Azenta, Inc. (Semiconductors & Semiconductor
Equipment) 341 28,760Bentley Systems, Inc.—Class B (Software) 847 34,024Bill.com Holdings, Inc.* (Software) 418 78,672Black Knight, Inc.* (IT Services) 712 53,115Blackbaud, Inc.* (Software) 192 13,083Blackline, Inc.* (Software) 245 22,508Broadcom, Inc. (Semiconductors &
Semiconductor Equipment) 1,888 1,106,141Bumble, Inc.*—Class A (Interactive Media &
Services) 335 9,886Cadence Design Systems, Inc.* (Software) 1,272 193,522Cargurus, Inc.* (Interactive Media & Services) 404 12,888CCC Intelligent Solutions Holdings, Inc.*
(Software) 278 2,963CDK Global, Inc. (Software) 545 23,419CDW Corp. (Electronic Equipment,
Instruments & Components) 623 117,778Ceridian HCM Holding, Inc.* (Software) 625 47,388Cerner Corp. (Health Care Technology) 1,348 122,938Chewy, Inc.*—Class A (Internet & Direct
Marketing Retail) 407 19,377Ciena Corp.* (Communications Equipment) 711 47,146Cirrus Logic, Inc.* (Semiconductors &
Semiconductor Equipment) 261 23,344Cisco Systems, Inc. (Communications
Equipment) 19,350 1,077,215Citrix Systems, Inc. (Software) 572 58,310
See accompanying notes to the financial statements.
Toppan Merrill - ProFunds Public Semi-Annual Report [Funds] 01-31-2022 ED [AUX] | akiesli | 29-Mar-22 08:43 | 22-1296-2.dk | Sequence: 1CHKSUM Content: 24948 Layout: 56831 Graphics: 0 CLEAN
JOB: 22-1296-2 CYCLE#;BL#: 8; 0 TRIM: 8.25" x 10.75" AS: New York: 212-620-5600COLORS: ~note-color 2, Black, ~note-color 3 GRAPHICS: none V1.5

Common Stocks, continued
Shares Value Pure Storage, Inc.*—Class A (Technology
Hardware, Storage & Peripherals) 1,232 $ 32,636Q2 Holdings, Inc.* (Software) 260 16,965Qorvo, Inc.* (Semiconductors &
Semiconductor Equipment) 507 69,601Qualcomm, Inc. (Semiconductors &
Semiconductor Equipment) 5,138 903,055Qualtrics International, Inc.*—Class A
(Software) 436 12,762Rapid7, Inc.* (Software) 258 24,853RingCentral, Inc.*—Class A (Software) 377 66,537Salesforce.com, Inc.* (Software) 4,491 1,044,740Seagate Technology Holdings PLC
(Technology Hardware, Storage & Peripherals) 941 100,828Semtech Corp.* (Semiconductors &
Semiconductor Equipment) 296 21,046SentinelOne, Inc.*—Class A (Software) 193 8,637ServiceNow, Inc.* (Software) 912 534,231Silicon Laboratories, Inc.* (Semiconductors &
Semiconductor Equipment) 185 30,560Skyworks Solutions, Inc. (Semiconductors &
Semiconductor Equipment) 758 111,062Smartsheet, Inc.* (Software) 578 35,963Snap, Inc.* (Interactive Media & Services) 4,914 159,902Snowflake, Inc.*—Class A (IT Services) 1,062 293,006SolarEdge Technologies, Inc.*
(Semiconductors & Semiconductor Equipment) 240 57,173
SolarWinds Corp. (IT Services) 205 2,788Splunk, Inc.* (Software) 741 91,825Squarespace, Inc.*—Class A (IT Services) 131 4,341SS&C Technologies Holdings, Inc. (Software) 1,016 81,148Synopsys, Inc.* (Software) 700 217,350TD SYNNEX Corp. (Electronic Equipment,
Instruments & Components) 191 19,973Teradyne, Inc. (Semiconductors &
Semiconductor Equipment) 747 87,720Texas Instruments, Inc. (Semiconductors &
Semiconductor Equipment) 4,238 760,679Trade Desk, Inc. (The)* (Software) 2,000 139,080Twilio, Inc.* (IT Services) 772 159,125Twitter, Inc.* (Interactive Media & Services) 3,669 137,624Tyler Technologies, Inc.* (Software) 189 89,548Ubiquiti, Inc. (Communications Equipment) 28 8,121UiPath, Inc.*—Class A (Software) 1,188 43,398Unity Software, Inc.* (Software) 734 77,180Universal Display Corp. (Semiconductors &
Semiconductor Equipment) 199 30,548Varonis Systems, Inc.* (Software) 496 18,481Veeva Systems, Inc.*—Class A (Health Care
Technology) 636 150,439Verint Systems, Inc.* (Software) 301 15,450VeriSign, Inc.* (IT Services) 442 95,994Viavi Solutions, Inc.* (Communications
Equipment) 1,092 17,974Vimeo, Inc.* (Interactive Media & Services) 716 10,489VMware, Inc.—Class A (Software) 924 118,716Western Digital Corp.* (Technology Hardware,
Storage & Peripherals) 1,431 74,040Wolfspeed, Inc.* (Semiconductors &
Semiconductor Equipment) 532 50,136
Common Stocks, continued
Shares Value Lattice Semiconductor Corp.*
(Semiconductors & Semiconductor Equipment) 629 $ 34,733
Liberty Global PLC*—Class A (Media) 815 22,103Liberty Global PLC*—Class C (Media) 1,526 41,263Lumen Technologies, Inc. (Diversified
Telecommunication Services) 4,229 52,270Lumentum Holdings, Inc.* (Communications
Equipment) 332 33,691Mandiant, Inc.* (Software) 1,103 16,644Manhattan Associates, Inc.* (Software) 290 38,822Marvell Technology, Inc. (Semiconductors &
Semiconductor Equipment) 3,779 269,821Match Group, Inc.* (Interactive Media &
Services) 1,299 146,397Matterport, Inc.* (Software) 846 8,232McAfee Corp.—Class A (Software) 346 8,875Meta Platforms, Inc.*—Class A (Interactive
Media & Services) 10,856 3,400,751Microchip Technology, Inc. (Semiconductors &
Semiconductor Equipment) 2,546 197,264Micron Technology, Inc. (Semiconductors &
Semiconductor Equipment) 5,132 422,210Microsoft Corp. (Software) 34,444 10,711,394MicroStrategy, Inc.* (Software) 40 14,720MKS Instruments, Inc. (Semiconductors &
Semiconductor Equipment) 253 39,298MongoDB, Inc.* (IT Services) 303 122,748Monolithic Power Systems, Inc.
(Semiconductors & Semiconductor Equipment) 199 80,183
Motorola Solutions, Inc. (Communications Equipment) 775 179,754
nCino, Inc.* (Software) 269 12,328NCR Corp.* (Technology Hardware, Storage &
Peripherals) 609 23,179NetApp, Inc. (Technology Hardware, Storage &
Peripherals) 1,026 88,759New Relic, Inc.* (Software) 271 28,493NortonLifelock, Inc. (Software) 2,672 69,499Nuance Communications, Inc.* (Software) 1,309 72,322Nutanix, Inc.*—Class A (Software) 971 26,547NVIDIA Corp. (Semiconductors &
Semiconductor Equipment) 11,469 2,808,299NXP Semiconductors N.V. (Semiconductors &
Semiconductor Equipment) 1,220 250,637Okta, Inc.* (IT Services) 678 134,169Omnicell, Inc.* (Health Care Technology) 203 30,478ON Semiconductor Corp.* (Semiconductors &
Semiconductor Equipment) 1,976 116,584Oracle Corp. (Software) 7,397 600,341Palantir Technologies, Inc.*—Class A
(Software) 7,348 100,741Palo Alto Networks, Inc.* (Software) 450 232,830Paycom Software, Inc.* (Software) 222 74,437Paylocity Holding Corp.* (Software) 182 37,124Pegasystems, Inc. (Software) 187 18,554Power Integrations, Inc. (Semiconductors &
Semiconductor Equipment) 278 22,437Procore Technologies, Inc.* (Software) 43 2,690PTC, Inc.* (Software) 485 56,386
January 31, 2022 (unaudited) :: Schedule of Portfolio Investments :: Technology UltraSector ProFund :: 135
See accompanying notes to the financial statements.
Toppan Merrill - ProFunds Public Semi-Annual Report [Funds] 01-31-2022 ED [AUX] | akiesli | 29-Mar-22 08:43 | 22-1296-2.dk | Sequence: 2CHKSUM Content: 48132 Layout: 36618 Graphics: 0 CLEAN
JOB: 22-1296-2 CYCLE#;BL#: 8; 0 TRIM: 8.25" x 10.75" AS: New York: 212-620-5600COLORS: ~note-color 2, Black, ~note-color 3 GRAPHICS: none V1.5
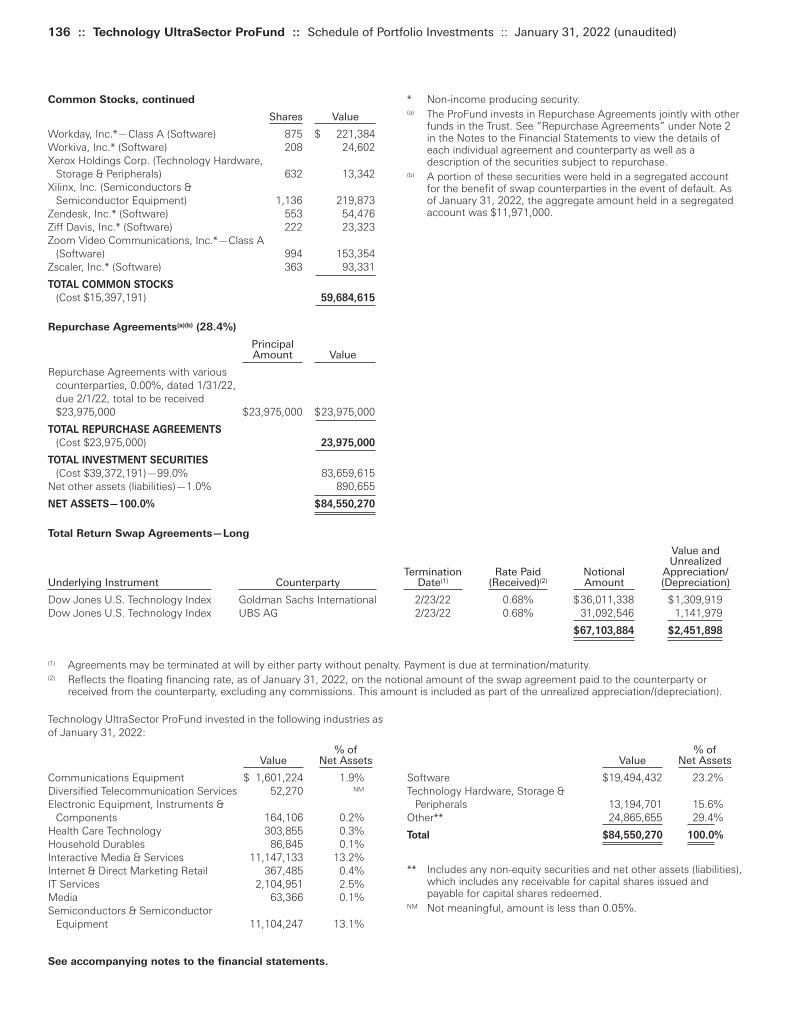
136 :: Technology UltraSector ProFund :: Schedule of Portfolio Investments :: January 31, 2022 (unaudited)
* Non-income producing security.(a) The ProFund invests in Repurchase Agreements jointly with other
funds in the Trust. See “Repurchase Agreements” under Note 2in the Notes to the Financial Statements to view the details ofeach individual agreement and counterparty as well as adescription of the securities subject to repurchase.
(b) A portion of these securities were held in a segregated accountfor the benefit of swap counterparties in the event of default. Asof January 31, 2022, the aggregate amount held in a segregatedaccount was $11,971,000.
Common Stocks, continued
Shares Value Workday, Inc.*—Class A (Software) 875 $ 221,384Workiva, Inc.* (Software) 208 24,602Xerox Holdings Corp. (Technology Hardware,
Storage & Peripherals) 632 13,342Xilinx, Inc. (Semiconductors &
Semiconductor Equipment) 1,136 219,873Zendesk, Inc.* (Software) 553 54,476Ziff Davis, Inc.* (Software) 222 23,323Zoom Video Communications, Inc.*—Class A
(Software) 994 153,354Zscaler, Inc.* (Software) 363 93,331
TOTAL COMMON STOCKS
(Cost $15,397,191) 59,684,615
Repurchase Agreements(a)(b) (28.4%)
Principal Amount Value
Repurchase Agreements with various counterparties, 0.00%, dated 1/31/22, due 2/1/22, total to be received $23,975,000 $23,975,000 $23,975,000
TOTAL REPURCHASE AGREEMENTS
(Cost $23,975,000) 23,975,000
TOTAL INVESTMENT SECURITIES
(Cost $39,372,191)—99.0% 83,659,615Net other assets (liabilities)—1.0% 890,655
NET ASSETS—100.0% $84,550,270
See accompanying notes to the financial statements.
Total Return Swap Agreements—Long
Value andUnrealized
Termination Rate Paid Notional Appreciation/Underlying Instrument Counterparty Date(1) (Received)(2) Amount (Depreciation)
Dow Jones U.S. Technology Index Goldman Sachs International 2/23/22 0.68% $36,011,338 $1,309,919Dow Jones U.S. Technology Index UBS AG 2/23/22 0.68% 31,092,546 1,141,979
$67,103,884 $2,451,898
(1) Agreements may be terminated at will by either party without penalty. Payment is due at termination/maturity.(2) Reflects the floating financing rate, as of January 31, 2022, on the notional amount of the swap agreement paid to the counterparty or
received from the counterparty, excluding any commissions. This amount is included as part of the unrealized appreciation/(depreciation).
% ofValue Net Assets
Software $19,494,432 23.2%Technology Hardware, Storage &
Peripherals 13,194,701 15.6%Other** 24,865,655 29.4%
Total $84,550,270 100.0%
** Includes any non-equity securities and net other assets (liabilities),which includes any receivable for capital shares issued andpayable for capital shares redeemed.
NM Not meaningful, amount is less than 0.05%.
Technology UltraSector ProFund invested in the following industries asof January 31, 2022:
% ofValue Net Assets
Communications Equipment $ 1,601,224 1.9%Diversified Telecommunication Services 52,270 NM
Electronic Equipment, Instruments & Components 164,106 0.2%
Health Care Technology 303,855 0.3%Household Durables 86,845 0.1%Interactive Media & Services 11,147,133 13.2%Internet & Direct Marketing Retail 367,485 0.4%IT Services 2,104,951 2.5%Media 63,366 0.1%Semiconductors & Semiconductor
Equipment 11,104,247 13.1%
Toppan Merrill - ProFunds Public Semi-Annual Report [Funds] 01-31-2022 ED [AUX] | akiesli | 29-Mar-22 08:43 | 22-1296-2.dk | Sequence: 3CHKSUM Content: 39639 Layout: 24829 Graphics: 0 CLEAN
JOB: 22-1296-2 CYCLE#;BL#: 8; 0 TRIM: 8.25" x 10.75" AS: New York: 212-620-5600COLORS: ~note-color 2, Black, ~note-color 3 GRAPHICS: none V1.5
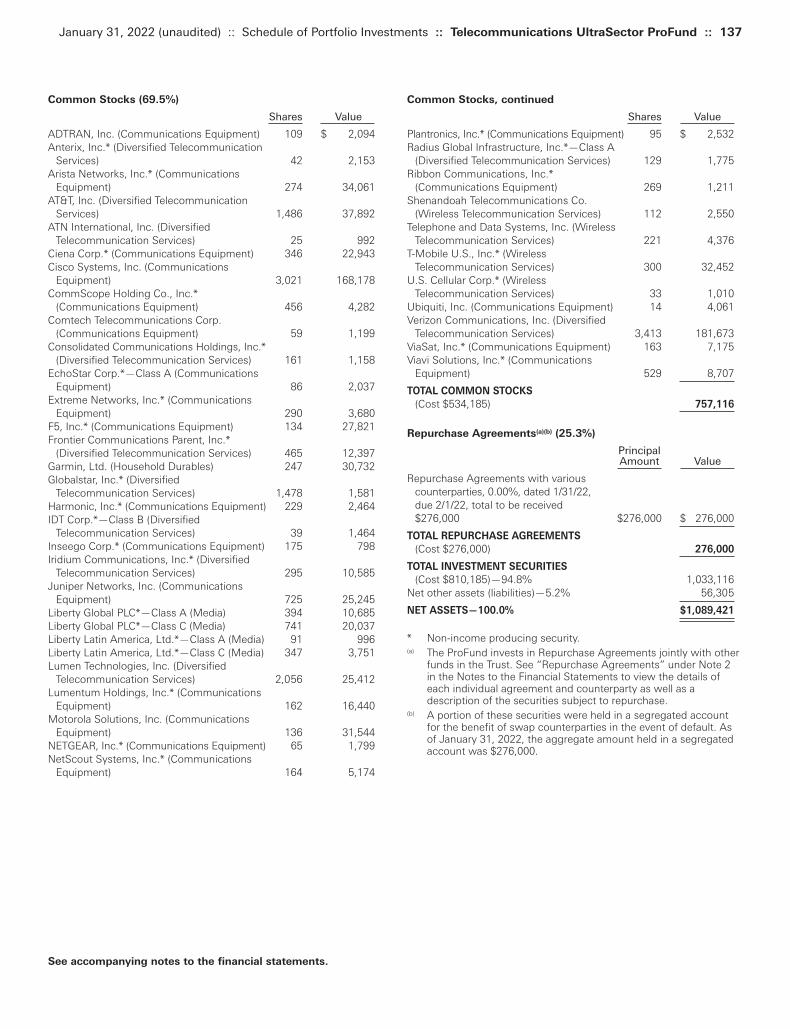
Common Stocks, continued
Shares Value Plantronics, Inc.* (Communications Equipment) 95 $ 2,532Radius Global Infrastructure, Inc.*—Class A
(Diversified Telecommunication Services) 129 1,775Ribbon Communications, Inc.*
(Communications Equipment) 269 1,211Shenandoah Telecommunications Co.
(Wireless Telecommunication Services) 112 2,550Telephone and Data Systems, Inc. (Wireless
Telecommunication Services) 221 4,376T-Mobile U.S., Inc.* (Wireless
Telecommunication Services) 300 32,452U.S. Cellular Corp.* (Wireless
Telecommunication Services) 33 1,010Ubiquiti, Inc. (Communications Equipment) 14 4,061Verizon Communications, Inc. (Diversified
Telecommunication Services) 3,413 181,673ViaSat, Inc.* (Communications Equipment) 163 7,175Viavi Solutions, Inc.* (Communications
Equipment) 529 8,707
TOTAL COMMON STOCKS
(Cost $534,185) 757,116
Repurchase Agreements(a)(b) (25.3%)
Principal Amount Value
Repurchase Agreements with various counterparties, 0.00%, dated 1/31/22, due 2/1/22, total to be received $276,000 $276,000 $ 276,000
TOTAL REPURCHASE AGREEMENTS
(Cost $276,000) 276,000
TOTAL INVESTMENT SECURITIES
(Cost $810,185)—94.8% 1,033,116Net other assets (liabilities)—5.2% 56,305
NET ASSETS—100.0% $1,089,421
* Non-income producing security.(a) The ProFund invests in Repurchase Agreements jointly with other
funds in the Trust. See “Repurchase Agreements” under Note 2in the Notes to the Financial Statements to view the details ofeach individual agreement and counterparty as well as adescription of the securities subject to repurchase.
(b) A portion of these securities were held in a segregated accountfor the benefit of swap counterparties in the event of default. Asof January 31, 2022, the aggregate amount held in a segregatedaccount was $276,000.
Common Stocks (69.5%)
Shares Value ADTRAN, Inc. (Communications Equipment) 109 $ 2,094Anterix, Inc.* (Diversified Telecommunication
Services) 42 2,153Arista Networks, Inc.* (Communications
Equipment) 274 34,061AT&T, Inc. (Diversified Telecommunication
Services) 1,486 37,892ATN International, Inc. (Diversified
Telecommunication Services) 25 992Ciena Corp.* (Communications Equipment) 346 22,943Cisco Systems, Inc. (Communications
Equipment) 3,021 168,178CommScope Holding Co., Inc.*
(Communications Equipment) 456 4,282Comtech Telecommunications Corp.
(Communications Equipment) 59 1,199Consolidated Communications Holdings, Inc.*
(Diversified Telecommunication Services) 161 1,158EchoStar Corp.*—Class A (Communications
Equipment) 86 2,037Extreme Networks, Inc.* (Communications
Equipment) 290 3,680F5, Inc.* (Communications Equipment) 134 27,821Frontier Communications Parent, Inc.*
(Diversified Telecommunication Services) 465 12,397Garmin, Ltd. (Household Durables) 247 30,732Globalstar, Inc.* (Diversified
Telecommunication Services) 1,478 1,581Harmonic, Inc.* (Communications Equipment) 229 2,464IDT Corp.*—Class B (Diversified
Telecommunication Services) 39 1,464Inseego Corp.* (Communications Equipment) 175 798Iridium Communications, Inc.* (Diversified
Telecommunication Services) 295 10,585Juniper Networks, Inc. (Communications
Equipment) 725 25,245Liberty Global PLC*—Class A (Media) 394 10,685Liberty Global PLC*—Class C (Media) 741 20,037Liberty Latin America, Ltd.*—Class A (Media) 91 996Liberty Latin America, Ltd.*—Class C (Media) 347 3,751Lumen Technologies, Inc. (Diversified
Telecommunication Services) 2,056 25,412Lumentum Holdings, Inc.* (Communications
Equipment) 162 16,440Motorola Solutions, Inc. (Communications
Equipment) 136 31,544NETGEAR, Inc.* (Communications Equipment) 65 1,799NetScout Systems, Inc.* (Communications
Equipment) 164 5,174
January 31, 2022 (unaudited) :: Schedule of Portfolio Investments :: Telecommunications UltraSector ProFund :: 137
See accompanying notes to the financial statements.
Toppan Merrill - ProFunds Public Semi-Annual Report [Funds] 01-31-2022 ED [AUX] | akiesli | 29-Mar-22 08:43 | 22-1296-2.dk | Sequence: 4CHKSUM Content: 13016 Layout: 20729 Graphics: 0 CLEAN
JOB: 22-1296-2 CYCLE#;BL#: 8; 0 TRIM: 8.25" x 10.75" AS: New York: 212-620-5600COLORS: ~note-color 2, Black, ~note-color 3 GRAPHICS: none V1.5

138 :: Telecommunications UltraSector ProFund :: Schedule of Portfolio Investments :: January 31, 2022 (unaudited)
See accompanying notes to the financial statements.
Telecommunications UltraSector ProFund invested in the followingindustries as of January 31, 2022:
% ofValue Net Assets
Communications Equipment $ 373,445 34.2%Diversified Telecommunication Services 277,083 25.5%Household Durables 30,732 2.8%Media 35,469 3.3%Wireless Telecommunication Services 40,387 3.7%Other** 332,305 30.5%
Total $1,089,421 100.0%
** Includes any non-equity securities and net other assets (liabilities),which includes any receivable for capital shares issued andpayable for capital shares redeemed.
Total Return Swap Agreements—Long
Value andUnrealized
Termination Rate Paid Notional Appreciation/Underlying Instrument Counterparty Date(1) (Received)(2) Amount (Depreciation)
Dow Jones U.S. Select Telecommunications Index Goldman Sachs International 2/23/22 0.68% $433,299 $ (8,821)
Dow Jones U.S. Select Telecommunications Index UBS AG 2/23/22 0.43% 449,055 (1,448)
$882,354 $(10,269)
(1) Agreements may be terminated at will by either party without penalty. Payment is due at termination/maturity.(2) Reflects the floating financing rate, as of January 31, 2022, on the notional amount of the swap agreement paid to the counterparty or
received from the counterparty, excluding any commissions. This amount is included as part of the unrealized appreciation/(depreciation).
Toppan Merrill - ProFunds Public Semi-Annual Report [Funds] 01-31-2022 ED [AUX] | akiesli | 29-Mar-22 08:43 | 22-1296-2.dk | Sequence: 5CHKSUM Content: 31389 Layout: 2897 Graphics: 0 CLEAN
JOB: 22-1296-2 CYCLE#;BL#: 8; 0 TRIM: 8.25" x 10.75" AS: New York: 212-620-5600COLORS: ~note-color 2, Black, ~note-color 3 GRAPHICS: none V1.5

(a) The ProFund invests in Repurchase Agreements jointly with otherfunds in the Trust. See “Repurchase Agreements” under Note 2in the Notes to the Financial Statements to view the details ofeach individual agreement and counterparty as well as adescription of the securities subject to repurchase.
(b) A portion of these securities were held in a segregated accountfor the benefit of swap counterparties in the event of default. Asof January 31, 2022, the aggregate amount held in a segregatedaccount was $2,387,000.
Repurchase Agreements(a)(b) (107.7%)
Principal Amount Value
Repurchase Agreements with various counterparties, 0.00%, dated 1/31/22, due 2/1/22, total to be received $9,874,000 $9,874,000 $9,874,000
TOTAL REPURCHASE AGREEMENTS
(Cost $9,874,000) 9,874,000
TOTAL INVESTMENT SECURITIES
(Cost $9,874,000)—107.7% 9,874,000Net other assets (liabilities)—(7.7)% (706,033)
NET ASSETS—100.0% $9,167,967
January 31, 2022 (unaudited) :: Schedule of Portfolio Investments :: UltraBear ProFund :: 139
See accompanying notes to the financial statements.
Total Return Swap Agreements—Short
Value andUnrealized
Termination Rate Paid Notional Appreciation/Underlying Instrument Counterparty Date(1) (Received)(2) Amount (Depreciation)
S&P 500 Goldman Sachs International 2/28/22 (0.43)% $(17,010,077) $(744,960)S&P 500 UBS AG 2/28/22 (0.23)% (1,341,118) (56,292)
$(18,351,195) $(801,252)
(1) Agreements may be terminated at will by either party without penalty. Payment is due at termination/maturity.(2) Reflects the floating financing rate, as of January 31, 2022, on the notional amount of the swap agreement paid to the counterparty or
received from the counterparty, excluding any commissions. This amount is included as part of the unrealized appreciation/(depreciation).
Toppan Merrill - ProFunds Public Semi-Annual Report [Funds] 01-31-2022 ED [AUX] | akiesli | 29-Mar-22 08:43 | 22-1296-2.dk | Sequence: 6CHKSUM Content: 11110 Layout: 48476 Graphics: 0 CLEAN
JOB: 22-1296-2 CYCLE#;BL#: 8; 0 TRIM: 8.25" x 10.75" AS: New York: 212-620-5600COLORS: ~note-color 2, Black, ~note-color 3 GRAPHICS: none V1.5
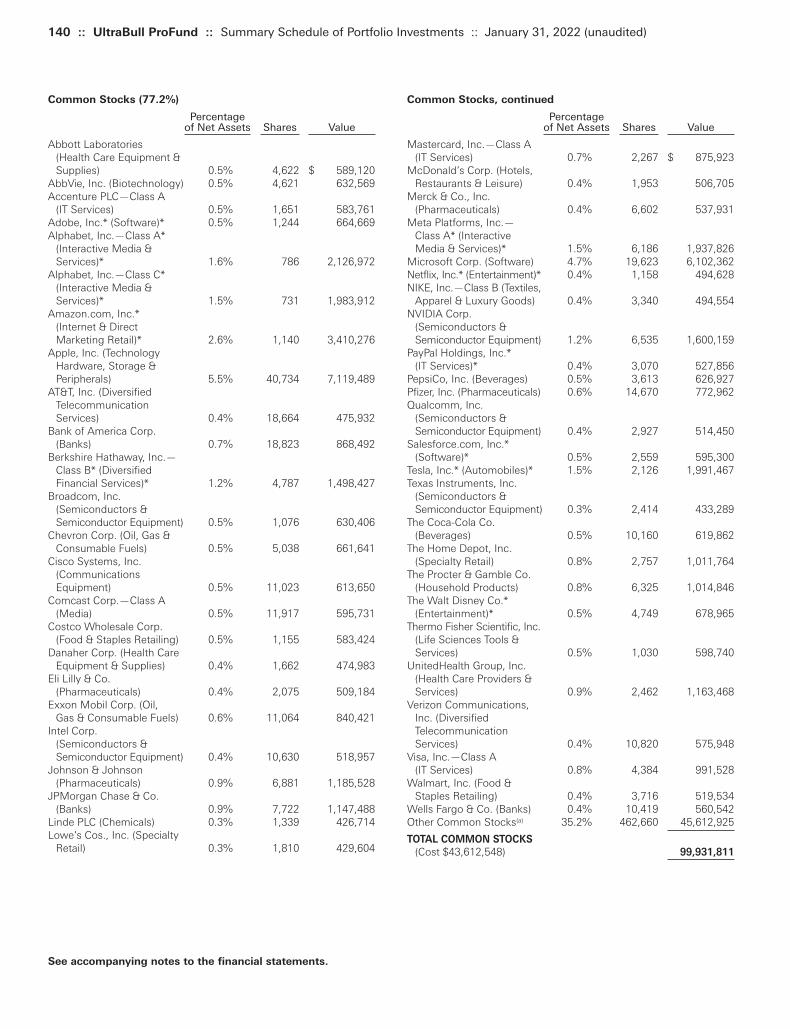
140 :: UltraBull ProFund :: Summary Schedule of Portfolio Investments :: January 31, 2022 (unaudited)
Common Stocks, continued
Percentage of Net Assets Shares Value
Mastercard, Inc.—Class A (IT Services) 0.7% 2,267 $ 875,923
McDonald’s Corp. (Hotels, Restaurants & Leisure) 0.4% 1,953 506,705
Merck & Co., Inc. (Pharmaceuticals) 0.4% 6,602 537,931
Meta Platforms, Inc.—Class A* (Interactive Media & Services)* 1.5% 6,186 1,937,826
Microsoft Corp. (Software) 4.7% 19,623 6,102,362Netflix, Inc.* (Entertainment)* 0.4% 1,158 494,628NIKE, Inc.—Class B (Textiles,
Apparel & Luxury Goods) 0.4% 3,340 494,554NVIDIA Corp.
(Semiconductors & Semiconductor Equipment) 1.2% 6,535 1,600,159
PayPal Holdings, Inc.* (IT Services)* 0.4% 3,070 527,856
PepsiCo, Inc. (Beverages) 0.5% 3,613 626,927Pfizer, Inc. (Pharmaceuticals) 0.6% 14,670 772,962Qualcomm, Inc.
(Semiconductors & Semiconductor Equipment) 0.4% 2,927 514,450
Salesforce.com, Inc.* (Software)* 0.5% 2,559 595,300
Tesla, Inc.* (Automobiles)* 1.5% 2,126 1,991,467Texas Instruments, Inc.
(Semiconductors & Semiconductor Equipment) 0.3% 2,414 433,289
The Coca-Cola Co. (Beverages) 0.5% 10,160 619,862
The Home Depot, Inc. (Specialty Retail) 0.8% 2,757 1,011,764
The Procter & Gamble Co. (Household Products) 0.8% 6,325 1,014,846
The Walt Disney Co.* (Entertainment)* 0.5% 4,749 678,965
Thermo Fisher Scientific, Inc.(Life Sciences Tools & Services) 0.5% 1,030 598,740
UnitedHealth Group, Inc. (Health Care Providers & Services) 0.9% 2,462 1,163,468
Verizon Communications, Inc. (Diversified Telecommunication Services) 0.4% 10,820 575,948
Visa, Inc.—Class A (IT Services) 0.8% 4,384 991,528
Walmart, Inc. (Food & Staples Retailing) 0.4% 3,716 519,534
Wells Fargo & Co. (Banks) 0.4% 10,419 560,542Other Common Stocks(a) 35.2% 462,660 45,612,925
TOTAL COMMON STOCKS
(Cost $43,612,548) 99,931,811
Common Stocks (77.2%)
Percentage of Net Assets Shares Value
Abbott Laboratories (Health Care Equipment & Supplies) 0.5% 4,622 $ 589,120
AbbVie, Inc. (Biotechnology) 0.5% 4,621 632,569Accenture PLC—Class A
(IT Services) 0.5% 1,651 583,761Adobe, Inc.* (Software)* 0.5% 1,244 664,669Alphabet, Inc.—Class A*
(Interactive Media & Services)* 1.6% 786 2,126,972
Alphabet, Inc.—Class C* (Interactive Media & Services)* 1.5% 731 1,983,912
Amazon.com, Inc.* (Internet & Direct Marketing Retail)* 2.6% 1,140 3,410,276
Apple, Inc. (Technology Hardware, Storage & Peripherals) 5.5% 40,734 7,119,489
AT&T, Inc. (Diversified Telecommunication Services) 0.4% 18,664 475,932
Bank of America Corp. (Banks) 0.7% 18,823 868,492
Berkshire Hathaway, Inc.—Class B* (Diversified Financial Services)* 1.2% 4,787 1,498,427
Broadcom, Inc. (Semiconductors & Semiconductor Equipment) 0.5% 1,076 630,406
Chevron Corp. (Oil, Gas & Consumable Fuels) 0.5% 5,038 661,641
Cisco Systems, Inc. (Communications Equipment) 0.5% 11,023 613,650
Comcast Corp.—Class A (Media) 0.5% 11,917 595,731
Costco Wholesale Corp. (Food & Staples Retailing) 0.5% 1,155 583,424
Danaher Corp. (Health Care Equipment & Supplies) 0.4% 1,662 474,983
Eli Lilly & Co. (Pharmaceuticals) 0.4% 2,075 509,184
Exxon Mobil Corp. (Oil, Gas & Consumable Fuels) 0.6% 11,064 840,421
Intel Corp. (Semiconductors & Semiconductor Equipment) 0.4% 10,630 518,957
Johnson & Johnson (Pharmaceuticals) 0.9% 6,881 1,185,528
JPMorgan Chase & Co. (Banks) 0.9% 7,722 1,147,488
Linde PLC (Chemicals) 0.3% 1,339 426,714Lowe’s Cos., Inc. (Specialty
Retail) 0.3% 1,810 429,604
See accompanying notes to the financial statements.
Toppan Merrill - ProFunds Public Semi-Annual Report [Funds] 01-31-2022 ED [AUX] | akiesli | 29-Mar-22 08:43 | 22-1296-2.dk | Sequence: 7CHKSUM Content: 36331 Layout: 5238 Graphics: 0 CLEAN
JOB: 22-1296-2 CYCLE#;BL#: 8; 0 TRIM: 8.25" x 10.75" AS: New York: 212-620-5600COLORS: ~note-color 2, Black, ~note-color 3 GRAPHICS: none V1.5
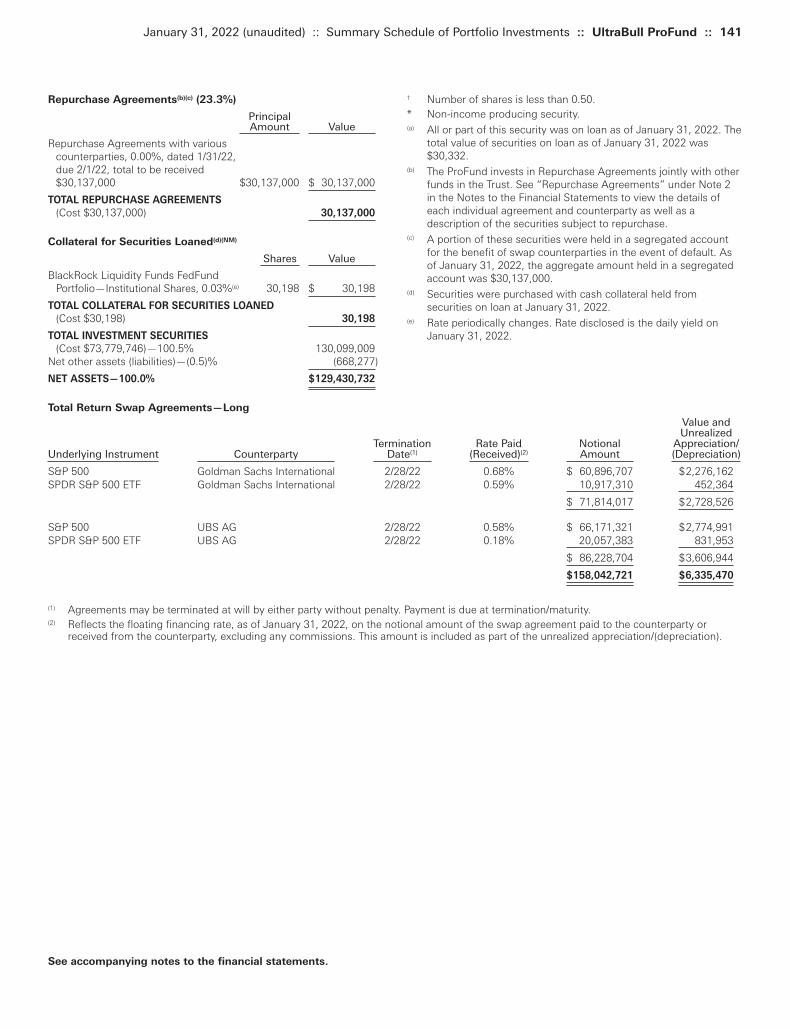
† Number of shares is less than 0.50.* Non-income producing security.(a) All or part of this security was on loan as of January 31, 2022. The
total value of securities on loan as of January 31, 2022 was$30,332.
(b) The ProFund invests in Repurchase Agreements jointly with otherfunds in the Trust. See “Repurchase Agreements” under Note 2in the Notes to the Financial Statements to view the details ofeach individual agreement and counterparty as well as adescription of the securities subject to repurchase.
(c) A portion of these securities were held in a segregated accountfor the benefit of swap counterparties in the event of default. Asof January 31, 2022, the aggregate amount held in a segregatedaccount was $30,137,000.
(d) Securities were purchased with cash collateral held fromsecurities on loan at January 31, 2022.
(e) Rate periodically changes. Rate disclosed is the daily yield onJanuary 31, 2022.
Repurchase Agreements(b)(c) (23.3%)
Principal Amount Value
Repurchase Agreements with various counterparties, 0.00%, dated 1/31/22, due 2/1/22, total to be received $30,137,000 $30,137,000 $ 30,137,000
TOTAL REPURCHASE AGREEMENTS
(Cost $30,137,000) 30,137,000
Collateral for Securities Loaned(d)(NM)
Shares Value
BlackRock Liquidity Funds FedFund Portfolio—Institutional Shares, 0.03%(e) 30,198 $ 30,198
TOTAL COLLATERAL FOR SECURITIES LOANED
(Cost $30,198) 30,198
TOTAL INVESTMENT SECURITIES
(Cost $73,779,746)—100.5% 130,099,009Net other assets (liabilities)—(0.5)% (668,277)
NET ASSETS—100.0% $129,430,732
January 31, 2022 (unaudited) :: Summary Schedule of Portfolio Investments :: UltraBull ProFund :: 141
See accompanying notes to the financial statements.
Total Return Swap Agreements—Long
Value andUnrealized
Termination Rate Paid Notional Appreciation/Underlying Instrument Counterparty Date(1) (Received)(2) Amount (Depreciation)
S&P 500 Goldman Sachs International 2/28/22 0.68% $ 60,896,707 $2,276,162SPDR S&P 500 ETF Goldman Sachs International 2/28/22 0.59% 10,917,310 452,364
$ 71,814,017 $2,728,526
S&P 500 UBS AG 2/28/22 0.58% $ 66,171,321 $2,774,991SPDR S&P 500 ETF UBS AG 2/28/22 0.18% 20,057,383 831,953
$ 86,228,704 $3,606,944
$158,042,721 $6,335,470
(1) Agreements may be terminated at will by either party without penalty. Payment is due at termination/maturity.(2) Reflects the floating financing rate, as of January 31, 2022, on the notional amount of the swap agreement paid to the counterparty or
received from the counterparty, excluding any commissions. This amount is included as part of the unrealized appreciation/(depreciation).
Toppan Merrill - ProFunds Public Semi-Annual Report [Funds] 01-31-2022 ED [AUX] | akiesli | 29-Mar-22 08:43 | 22-1296-2.dk | Sequence: 8CHKSUM Content: 751 Layout: 65033 Graphics: 0 CLEAN
JOB: 22-1296-2 CYCLE#;BL#: 8; 0 TRIM: 8.25" x 10.75" AS: New York: 212-620-5600COLORS: ~note-color 2, Black, ~note-color 3 GRAPHICS: none V1.5
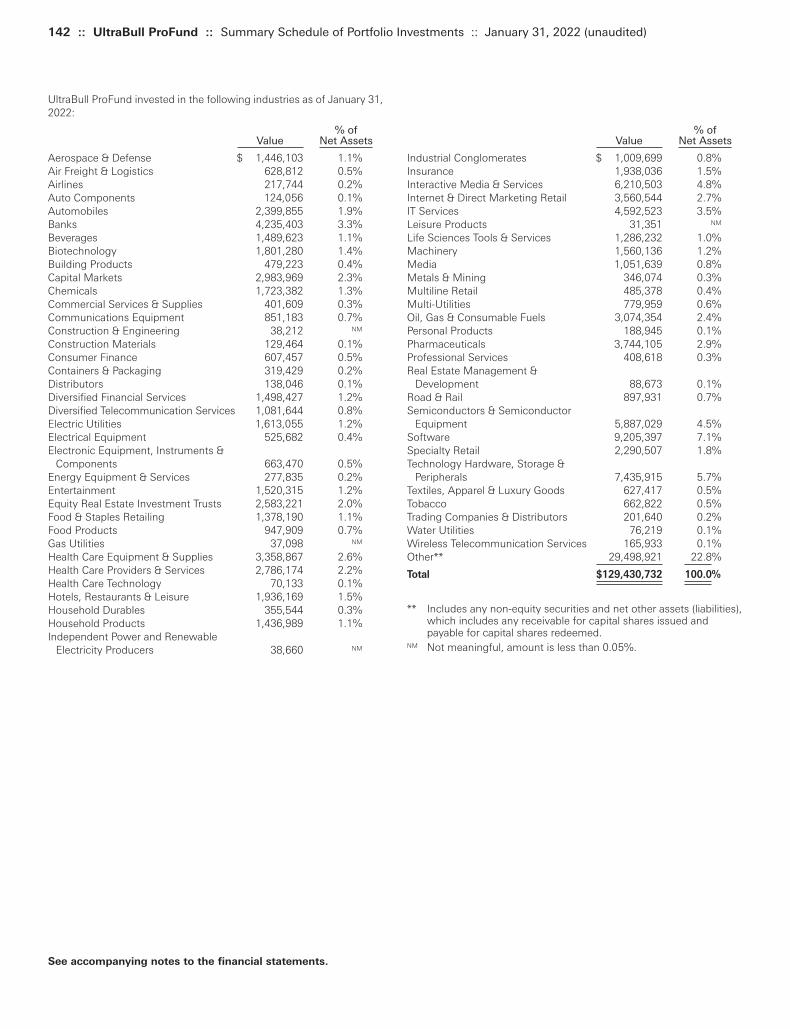
142 :: UltraBull ProFund :: Summary Schedule of Portfolio Investments :: January 31, 2022 (unaudited)
% ofValue Net Assets
Industrial Conglomerates $ 1,009,699 0.8%Insurance 1,938,036 1.5%Interactive Media & Services 6,210,503 4.8%Internet & Direct Marketing Retail 3,560,544 2.7%IT Services 4,592,523 3.5%Leisure Products 31,351 NM
Life Sciences Tools & Services 1,286,232 1.0%Machinery 1,560,136 1.2%Media 1,051,639 0.8%Metals & Mining 346,074 0.3%Multiline Retail 485,378 0.4%Multi-Utilities 779,959 0.6%Oil, Gas & Consumable Fuels 3,074,354 2.4%Personal Products 188,945 0.1%Pharmaceuticals 3,744,105 2.9%Professional Services 408,618 0.3%Real Estate Management &
Development 88,673 0.1%Road & Rail 897,931 0.7%Semiconductors & Semiconductor
Equipment 5,887,029 4.5%Software 9,205,397 7.1%Specialty Retail 2,290,507 1.8%Technology Hardware, Storage &
Peripherals 7,435,915 5.7%Textiles, Apparel & Luxury Goods 627,417 0.5%Tobacco 662,822 0.5%Trading Companies & Distributors 201,640 0.2%Water Utilities 76,219 0.1%Wireless Telecommunication Services 165,933 0.1%Other** 29,498,921 22.8%
Total $129,430,732 100.0%
** Includes any non-equity securities and net other assets (liabilities),which includes any receivable for capital shares issued andpayable for capital shares redeemed.
NM Not meaningful, amount is less than 0.05%.
UltraBull ProFund invested in the following industries as of January 31,2022:
% ofValue Net Assets
Aerospace & Defense $ 1,446,103 1.1%Air Freight & Logistics 628,812 0.5%Airlines 217,744 0.2%Auto Components 124,056 0.1%Automobiles 2,399,855 1.9%Banks 4,235,403 3.3%Beverages 1,489,623 1.1%Biotechnology 1,801,280 1.4%Building Products 479,223 0.4%Capital Markets 2,983,969 2.3%Chemicals 1,723,382 1.3%Commercial Services & Supplies 401,609 0.3%Communications Equipment 851,183 0.7%Construction & Engineering 38,212 NM
Construction Materials 129,464 0.1%Consumer Finance 607,457 0.5%Containers & Packaging 319,429 0.2%Distributors 138,046 0.1%Diversified Financial Services 1,498,427 1.2%Diversified Telecommunication Services 1,081,644 0.8%Electric Utilities 1,613,055 1.2%Electrical Equipment 525,682 0.4%Electronic Equipment, Instruments &
Components 663,470 0.5%Energy Equipment & Services 277,835 0.2%Entertainment 1,520,315 1.2%Equity Real Estate Investment Trusts 2,583,221 2.0%Food & Staples Retailing 1,378,190 1.1%Food Products 947,909 0.7%Gas Utilities 37,098 NM
Health Care Equipment & Supplies 3,358,867 2.6%Health Care Providers & Services 2,786,174 2.2%Health Care Technology 70,133 0.1%Hotels, Restaurants & Leisure 1,936,169 1.5%Household Durables 355,544 0.3%Household Products 1,436,989 1.1%Independent Power and Renewable
Electricity Producers 38,660 NM
See accompanying notes to the financial statements.
Toppan Merrill - ProFunds Public Semi-Annual Report [Funds] 01-31-2022 ED [AUX] | akiesli | 29-Mar-22 08:43 | 22-1296-2.dk | Sequence: 9CHKSUM Content: 61733 Layout: 36764 Graphics: 0 CLEAN
JOB: 22-1296-2 CYCLE#;BL#: 8; 0 TRIM: 8.25" x 10.75" AS: New York: 212-620-5600COLORS: ~note-color 2, Black, ~note-color 3 GRAPHICS: none V1.5

Common Stocks, continued
Shares Value
OneConnect Financial Technology Co., Ltd.*ADR (Software) 5,820 $ 11,640
PetroChina Co., Ltd.ADR (Oil, Gas & Consumable Fuels) 10,157 502,670
Pinduoduo, Inc.*ADR (Internet & Direct Marketing Retail) 12,744 762,601
ReneSola, Ltd.*ADR (Construction & Engineering) 2,182 11,848
Sinopec Shanghai Petrochemical Co., Ltd.ADR (Chemicals) 1,481 33,870
Sohu.com, Ltd.*ADR (Interactive Media & Services) 1,380 25,116
Sos, Ltd.*ADR (Professional Services) 8,779 5,696TAL Education Group*ADR (Diversified
Consumer Services) 19,231 55,001Tencent Music Entertainment Group*ADR
(Entertainment) 28,254 174,610Trip.com Group, Ltd.*ADR (Internet & Direct
Marketing Retail) 22,226 591,434Tuya, Inc.*ADR (Software) 2,016 11,189Up Fintech Holding, Ltd.*ADR(a) (Capital
Markets) 3,616 15,476Uxin, Ltd.*ADR (Internet & Direct Marketing
Retail) 8,629 10,355Vipshop Holdings, Ltd.*ADR (Internet & Direct
Marketing Retail) 17,572 163,595Weibo Corp.*ADR (Interactive Media &
Services) 2,641 91,511Youdao, Inc.*ADR (Diversified Consumer
Services) 1,206 16,860Zai Lab, Ltd.*ADR (Biotechnology) 3,666 182,090ZTO Express Cayman, Inc.ADR (Air
Freight & Logistics) 21,251 638,380
TOTAL COMMON STOCKS
(Cost $13,142,998) 16,504,231
Repurchase Agreements(b)(c) (14.3%)
Principal Amount Value
Repurchase Agreements with various counterparties, 0.00%, dated 1/31/22, due 2/1/22, total to be received $2,839,000 $2,839,000 $ 2,839,000
TOTAL REPURCHASE AGREEMENTS
(Cost $2,839,000) 2,839,000
Collateral for Securities Loaned(d)(NM)
Shares Value
BlackRock Liquidity Funds FedFund Portfolio—Institutional Shares, 0.03%(e) 8,000 $ 8,000
TOTAL COLLATERAL FOR SECURITIES LOANED
(Cost $8,000) 8,000
TOTAL INVESTMENT SECURITIES
(Cost $15,989,998)—97.4% 19,351,231Net other assets (liabilities)—2.6% 516,968
NET ASSETS—100.0% $19,868,199
Common Stocks (83.1%)
Shares Value
21Vianet Group, Inc.*ADR (IT Services) 4,579 $ 45,424360 DigiTech, Inc.ADR (Consumer Finance) 4,841 95,803Agora, Inc.*ADR (Software) 3,216 36,759Alibaba Group Holding, Ltd.*ADR (Internet &
Direct Marketing Retail) 28,270 3,556,084Aluminum Corp. of China, Ltd.*ADR (Metals &
Mining) 7,594 97,735Autohome, Inc.ADR (Interactive Media &
Services) 2,522 84,033Baidu, Inc.*ADR (Interactive Media & Services) 8,249 1,317,695Baozun, Inc.*ADR (Internet & Direct Marketing
Retail) 2,671 35,417Beigene, Ltd.*ADR (Biotechnology) 2,525 612,514BEST, Inc.*ADR (Air Freight & Logistics) 10,001 8,565Bilibili, Inc.*ADR (Entertainment) 10,459 369,098Canaan, Inc.*ADR (Technology Hardware &
Storage) 6,303 27,103China Life Insurance Co., Ltd.ADR (Insurance) 71,641 639,754China Petroleum & Chemical Corp.ADR (Oil,
Gas & Consumable Fuels) 12,282 639,892China Southern Airlines Co., Ltd.*ADR (Airlines) 1,646 51,767Chindata Group Holdings, Ltd.*ADR
(IT Services) 5,806 29,727Daqo New Energy Corp.*ADR
(Semiconductors & Semiconductor Equipment) 2,866 114,984
DouYu International Holdings, Ltd.*ADR
(Entertainment) 7,496 15,742FinVolution GroupADR (Consumer Finance) 6,760 26,702Gaotu Techedu, Inc.*ADR (Diversified
Consumer Services) 6,415 11,996GDS Holdings, Ltd.*ADR (IT Services) 5,498 241,252Genetron Holdings, Ltd.*ADR (Biotechnology) 2,011 8,366Hello Group, Inc.ADR (Interactive Media &
Services) 7,988 77,723Huaneng Power International, Inc.ADR
(Independent Power and Renewable Electricity Producers) 4,073 87,488
Huazhu Group, Ltd.*ADR (Hotels, Restaurants & Leisure) 7,078 279,723
HUYA, Inc.*ADR (Entertainment) 4,079 27,003iClick Interactive Asia Group, Ltd.*ADR (Media) 3,247 11,332iQIYI, Inc.*ADR (Entertainment) 15,846 64,652JD.com, Inc.*ADR (Internet & Direct Marketing
Retail) 26,102 1,954,518JinkoSolar Holding Co., Ltd.*ADR
(Semiconductors & Semiconductor Equipment) 1,951 86,098
JOYY, Inc.ADR (Interactive Media & Services) 2,600 131,456KE Holdings, Inc.*ADR (Real Estate
Management & Development) 24,148 526,185Kingsoft Cloud Holdings, Ltd.*ADR (IT Services) 4,892 41,337Lexinfintech Holdings, Ltd.*ADR (Consumer
Finance) 5,312 19,017MINISO Group Holding, Ltd.ADR (Multiline
Retail) 1,512 15,347NetEase, Inc.ADR (Entertainment) 10,853 1,121,765New Oriental Education & Technology Group,
Inc.*ADR (Diversified Consumer Services) 72,617 103,842NIO, Inc.*ADR (Automobiles) 22,699 556,352Niu Technologies*ADR (Automobiles) 2,138 30,039
January 31, 2022 (unaudited) :: Schedule of Portfolio Investments :: UltraChina ProFund :: 143
See accompanying notes to the financial statements.
Toppan Merrill - ProFunds Public Semi-Annual Report [Funds] 01-31-2022 ED [AUX] | akiesli | 29-Mar-22 08:43 | 22-1296-2.dk | Sequence: 10CHKSUM Content: 60110 Layout: 16859 Graphics: 0 CLEAN
JOB: 22-1296-2 CYCLE#;BL#: 8; 0 TRIM: 8.25" x 10.75" AS: New York: 212-620-5600COLORS: ~note-color 2, Black, ~note-color 3 GRAPHICS: none V1.5

144 :: UltraChina ProFund :: Schedule of Portfolio Investments :: January 31, 2022 (unaudited)
(c) A portion of these securities were held in a segregated accountfor the benefit of swap counterparties in the event of default. Asof January 31, 2022, the aggregate amount held in a segregatedaccount was $1,690,000.
(d) Securities were purchased with cash collateral held fromsecurities on loan at January 31, 2022.
(e) Rate periodically changes. Rate disclosed is the daily yield onJanuary 31, 2022.
ADR American Depositary Receipt
* Non-income producing security.(a) All or part of this security was on loan as of January 31, 2022. The
total value of securities on loan as of January 31, 2022 was$8,560.
(b) The ProFund invests in Repurchase Agreements jointly with otherfunds in the Trust. See “Repurchase Agreements” under Note 2in the Notes to the Financial Statements to view the details ofeach individual agreement and counterparty as well as adescription of the securities subject to repurchase.
See accompanying notes to the financial statements.
Total Return Swap Agreements—Long
Value andUnrealized
Termination Rate Paid Notional Appreciation/Underlying Instrument Counterparty Date(1) (Received)(2) Amount (Depreciation)
S&P/BNY Mellon China Select ADR Index (USD) Goldman Sachs International 2/28/22 0.68% $11,291,805 $1,122,405
S&P/BNY Mellon China Select ADR Index (USD) UBS AG 2/28/22 0.33% 12,271,327 1,080,359
$23,563,132 $2,202,764
(1) Agreements may be terminated at will by either party without penalty. Payment is due at termination/maturity.(2) Reflects the floating financing rate, as of January 31, 2022, on the notional amount of the swap agreement paid to the counterparty or
received from the counterparty, excluding any commissions. This amount is included as part of the unrealized appreciation/(depreciation).
UltraChina ProFund invested in securities with exposure to the followingcountries as of January 31, 2022:
% ofValue Net Assets
China $16,504,231 83.1%Other** 3,363,968 16.9%
Total $19,868,199 100.0%
** Includes any non-equity securities and net other assets (liabilities),which includes any receivable for capital shares issued andpayable for capital shares redeemed.
NM Not meaningful, amount is less than 0.05%.
UltraChina ProFund invested in the following industries as of January 31,2022:
% ofValue Net Assets
Air Freight & Logistics $ 646,945 3.3%Airlines 51,767 0.3%Automobiles 586,391 3.0%Biotechnology 802,971 4.0%Capital Markets 15,476 0.1%Chemicals 33,870 0.2%Construction & Engineering 11,848 0.1%Consumer Finance 141,522 0.7%Diversified Consumer Services 187,699 0.9%Entertainment 1,772,870 8.9%Hotels, Restaurants & Leisure 279,723 1.4%Independent Power and Renewable
Electricity Producers 87,488 0.4%Insurance 639,754 3.2%Interactive Media & Services 1,727,534 8.7%Internet & Direct Marketing Retail 7,074,003 35.6%IT Services 357,740 1.8%Media 11,332 0.1%Metals & Mining 97,735 0.5%Multiline Retail 15,347 0.1%Oil, Gas & Consumable Fuels 1,142,562 5.8%Professional Services 5,696 NM
Real Estate Management & Development 526,185 2.6%Semiconductors & Semiconductor
Equipment 201,082 1.0%Software 59,588 0.3%Technology Hardware & Storage 27,103 0.1%Other** 3,363,968 16.9%
Total $19,868,199 100.0%
Toppan Merrill - ProFunds Public Semi-Annual Report [Funds] 01-31-2022 ED [AUX] | akiesli | 29-Mar-22 08:43 | 22-1296-2.dk | Sequence: 11CHKSUM Content: 54415 Layout: 25582 Graphics: 0 CLEAN
JOB: 22-1296-2 CYCLE#;BL#: 8; 0 TRIM: 8.25" x 10.75" AS: New York: 212-620-5600COLORS: ~note-color 2, Black, ~note-color 3 GRAPHICS: none V1.5
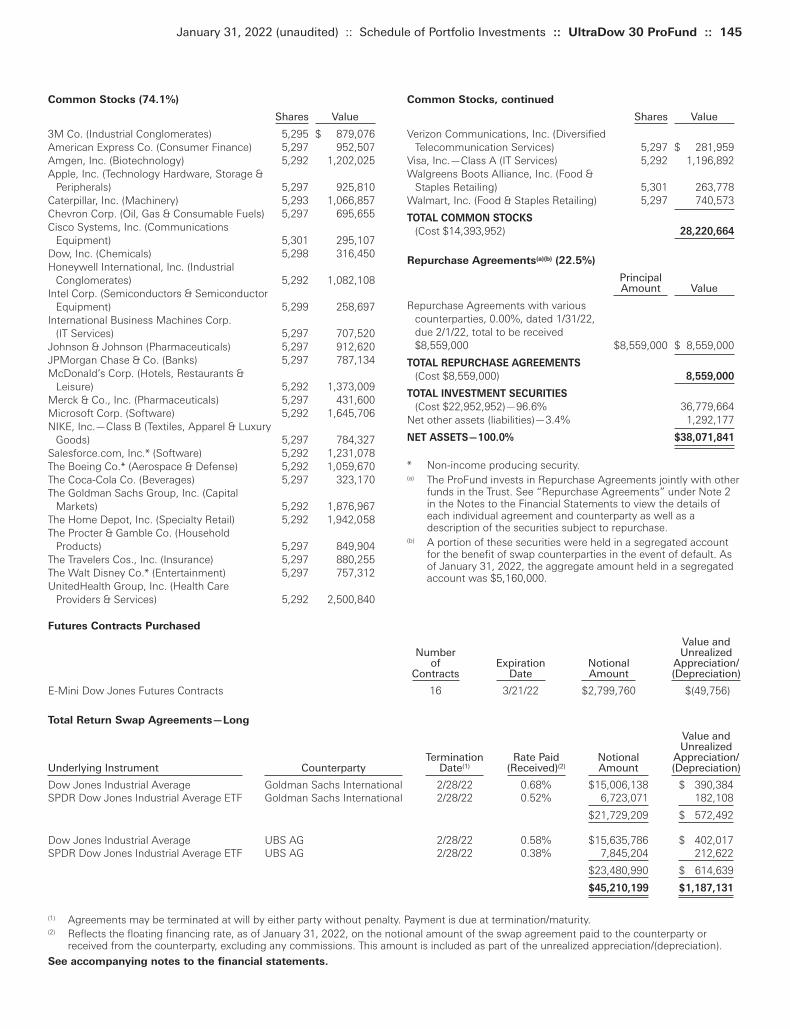
Common Stocks, continued
Shares Value
Verizon Communications, Inc. (Diversified Telecommunication Services) 5,297 $ 281,959
Visa, Inc.—Class A (IT Services) 5,292 1,196,892Walgreens Boots Alliance, Inc. (Food &
Staples Retailing) 5,301 263,778Walmart, Inc. (Food & Staples Retailing) 5,297 740,573
TOTAL COMMON STOCKS
(Cost $14,393,952) 28,220,664
Repurchase Agreements(a)(b) (22.5%)
Principal Amount Value
Repurchase Agreements with various counterparties, 0.00%, dated 1/31/22, due 2/1/22, total to be received $8,559,000 $8,559,000 $ 8,559,000
TOTAL REPURCHASE AGREEMENTS
(Cost $8,559,000) 8,559,000
TOTAL INVESTMENT SECURITIES
(Cost $22,952,952)—96.6% 36,779,664Net other assets (liabilities)—3.4% 1,292,177
NET ASSETS—100.0% $38,071,841
* Non-income producing security.(a) The ProFund invests in Repurchase Agreements jointly with other
funds in the Trust. See “Repurchase Agreements” under Note 2in the Notes to the Financial Statements to view the details ofeach individual agreement and counterparty as well as adescription of the securities subject to repurchase.
(b) A portion of these securities were held in a segregated accountfor the benefit of swap counterparties in the event of default. Asof January 31, 2022, the aggregate amount held in a segregatedaccount was $5,160,000.
Common Stocks (74.1%)
Shares Value
3M Co. (Industrial Conglomerates) 5,295 $ 879,076American Express Co. (Consumer Finance) 5,297 952,507Amgen, Inc. (Biotechnology) 5,292 1,202,025Apple, Inc. (Technology Hardware, Storage &
Peripherals) 5,297 925,810Caterpillar, Inc. (Machinery) 5,293 1,066,857Chevron Corp. (Oil, Gas & Consumable Fuels) 5,297 695,655Cisco Systems, Inc. (Communications
Equipment) 5,301 295,107Dow, Inc. (Chemicals) 5,298 316,450Honeywell International, Inc. (Industrial
Conglomerates) 5,292 1,082,108Intel Corp. (Semiconductors & Semiconductor
Equipment) 5,299 258,697International Business Machines Corp.
(IT Services) 5,297 707,520Johnson & Johnson (Pharmaceuticals) 5,297 912,620JPMorgan Chase & Co. (Banks) 5,297 787,134McDonald’s Corp. (Hotels, Restaurants &
Leisure) 5,292 1,373,009Merck & Co., Inc. (Pharmaceuticals) 5,297 431,600Microsoft Corp. (Software) 5,292 1,645,706NIKE, Inc.—Class B (Textiles, Apparel & Luxury
Goods) 5,297 784,327Salesforce.com, Inc.* (Software) 5,292 1,231,078The Boeing Co.* (Aerospace & Defense) 5,292 1,059,670The Coca-Cola Co. (Beverages) 5,297 323,170The Goldman Sachs Group, Inc. (Capital
Markets) 5,292 1,876,967The Home Depot, Inc. (Specialty Retail) 5,292 1,942,058The Procter & Gamble Co. (Household
Products) 5,297 849,904The Travelers Cos., Inc. (Insurance) 5,297 880,255The Walt Disney Co.* (Entertainment) 5,297 757,312UnitedHealth Group, Inc. (Health Care
Providers & Services) 5,292 2,500,840
January 31, 2022 (unaudited) :: Schedule of Portfolio Investments :: UltraDow 30 ProFund :: 145
See accompanying notes to the financial statements.
Futures Contracts Purchased
Value andNumber Unrealized
of Expiration Notional Appreciation/Contracts Date Amount (Depreciation)
E-Mini Dow Jones Futures Contracts 16 3/21/22 $2,799,760 $(49,756)
Total Return Swap Agreements—Long
Value andUnrealized
Termination Rate Paid Notional Appreciation/Underlying Instrument Counterparty Date(1) (Received)(2) Amount (Depreciation)
Dow Jones Industrial Average Goldman Sachs International 2/28/22 0.68% $15,006,138 $ 390,384SPDR Dow Jones Industrial Average ETF Goldman Sachs International 2/28/22 0.52% 6,723,071 182,108
$21,729,209 $ 572,492
Dow Jones Industrial Average UBS AG 2/28/22 0.58% $15,635,786 $ 402,017SPDR Dow Jones Industrial Average ETF UBS AG 2/28/22 0.38% 7,845,204 212,622
$23,480,990 $ 614,639
$45,210,199 $1,187,131
(1) Agreements may be terminated at will by either party without penalty. Payment is due at termination/maturity.(2) Reflects the floating financing rate, as of January 31, 2022, on the notional amount of the swap agreement paid to the counterparty or
received from the counterparty, excluding any commissions. This amount is included as part of the unrealized appreciation/(depreciation).
Toppan Merrill - ProFunds Public Semi-Annual Report [Funds] 01-31-2022 ED [AUX] | akiesli | 29-Mar-22 08:43 | 22-1296-2.dk | Sequence: 12CHKSUM Content: 53930 Layout: 39289 Graphics: 0 CLEAN
JOB: 22-1296-2 CYCLE#;BL#: 8; 0 TRIM: 8.25" x 10.75" AS: New York: 212-620-5600COLORS: ~note-color 2, Black, ~note-color 3 GRAPHICS: none V1.5
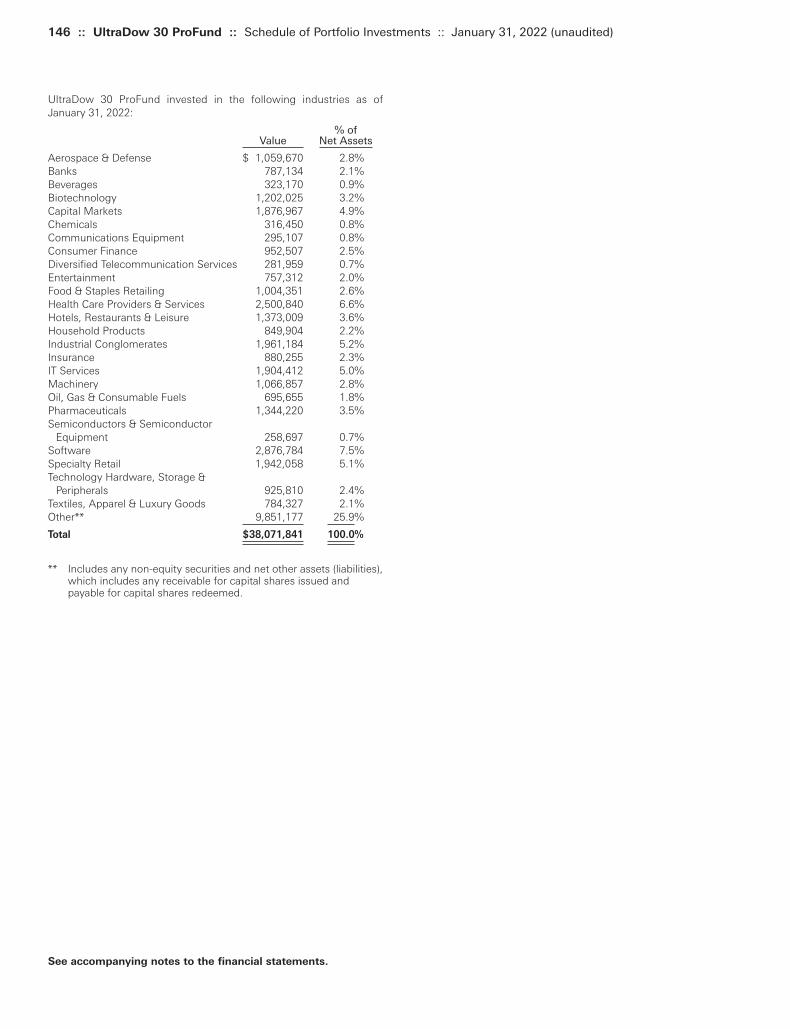
146 :: UltraDow 30 ProFund :: Schedule of Portfolio Investments :: January 31, 2022 (unaudited)
UltraDow 30 ProFund invested in the following industries as ofJanuary 31, 2022:
% ofValue Net Assets
Aerospace & Defense $ 1,059,670 2.8%Banks 787,134 2.1%Beverages 323,170 0.9%Biotechnology 1,202,025 3.2%Capital Markets 1,876,967 4.9%Chemicals 316,450 0.8%Communications Equipment 295,107 0.8%Consumer Finance 952,507 2.5%Diversified Telecommunication Services 281,959 0.7%Entertainment 757,312 2.0%Food & Staples Retailing 1,004,351 2.6%Health Care Providers & Services 2,500,840 6.6%Hotels, Restaurants & Leisure 1,373,009 3.6%Household Products 849,904 2.2%Industrial Conglomerates 1,961,184 5.2%Insurance 880,255 2.3%IT Services 1,904,412 5.0%Machinery 1,066,857 2.8%Oil, Gas & Consumable Fuels 695,655 1.8%Pharmaceuticals 1,344,220 3.5%Semiconductors & Semiconductor
Equipment 258,697 0.7%Software 2,876,784 7.5%Specialty Retail 1,942,058 5.1%Technology Hardware, Storage &
Peripherals 925,810 2.4%Textiles, Apparel & Luxury Goods 784,327 2.1%Other** 9,851,177 25.9%
Total $38,071,841 100.0%
** Includes any non-equity securities and net other assets (liabilities),which includes any receivable for capital shares issued andpayable for capital shares redeemed.
See accompanying notes to the financial statements.
Toppan Merrill - ProFunds Public Semi-Annual Report [Funds] 01-31-2022 ED [AUX] | akiesli | 29-Mar-22 08:43 | 22-1296-2.dk | Sequence: 13CHKSUM Content: 9791 Layout: 42418 Graphics: 0 CLEAN
JOB: 22-1296-2 CYCLE#;BL#: 8; 0 TRIM: 8.25" x 10.75" AS: New York: 212-620-5600COLORS: ~note-color 2, Black, ~note-color 3 GRAPHICS: none V1.5

Common Stocks, continued
Shares Value
Trip.com Group, Ltd.*ADR (Internet & Direct Marketing Retail) 2,870 $ 76,371
United Microelectronics Corp.ADR(a)
(Semiconductors & Semiconductor Equipment) 14,364 141,198
Vale S.A.ADR (Metals & Mining) 25,632 389,093Wipro, Ltd.ADR (IT Services) 9,199 70,740Zai Lab, Ltd.*ADR (Biotechnology) 473 23,494ZTO Express Cayman, Inc.ADR (Air Freight &
Logistics) 2,744 82,430
TOTAL COMMON STOCKS
(Cost $6,031,815) 9,100,342
Preferred Stock (1.6%)
Petroleo Brasileiro S.A.ADR (Oil, Gas & Consumable Fuels) 14,278 173,335
TOTAL PREFERRED STOCK
(Cost $70,418) 173,335
Repurchase Agreements(b)(c) (9.5%)
Principal Amount Value
Repurchase Agreements with various counterparties, 0.00%, dated 1/31/22, due 2/1/22, total to be received $1,052,000 $1,052,000 $ 1,052,000
TOTAL REPURCHASE AGREEMENTS
(Cost $1,052,000) 1,052,000
Collateral for Securities Loaned(d) (1.1%)
Shares Value
BlackRock Liquidity Funds FedFund Portfolio—Institutional Shares, 0.03%(e) 125,875 $ 125,875
TOTAL COLLATERAL FOR SECURITIES LOANED
(Cost $125,875) 125,875
TOTAL INVESTMENT SECURITIES
(Cost $7,280,108)—94.2% 10,451,552Net other assets (liabilities)—5.8% 641,995
NET ASSETS—100.0% $11,093,547
* Non-income producing security.(a) All or part of this security was on loan as of January 31, 2022. The
total value of securities on loan as of January 31, 2022 was$130,163.
(b) The ProFund invests in Repurchase Agreements jointly with otherfunds in the Trust. See “Repurchase Agreements” under Note 2in the Notes to the Financial Statements to view the details ofeach individual agreement and counterparty as well as adescription of the securities subject to repurchase.
(c) A portion of these securities were held in a segregated accountfor the benefit of swap counterparties in the event of default. Asof January 31, 2022, the aggregate amount held in a segregatedaccount was $929,000.
(d) Securities were purchased with cash collateral held fromsecurities on loan at January 31, 2022.
(e) Rate periodically changes. Rate disclosed is the daily yield onJanuary 31, 2022.
ADR American Depositary Receipt
Common Stocks (82.0%)
Shares Value
Alibaba Group Holding, Ltd.*ADR (Internet & Direct Marketing Retail) 10,484 $ 1,318,783
Ambev S.A.ADR (Beverages) 27,399 77,539America Movil S.A.B. de C.V.ADR (Wireless
Telecommunication Services) 7,220 136,169AngloGold Ashanti, Ltd.ADR (Metals & Mining) 2,595 48,215ASE Technology Holding Co., Ltd.ADR
(Semiconductors & Semiconductor Equipment) 10,626 75,232
Baidu, Inc.*ADR (Interactive Media & Services) 1,763 281,622Banco Bradesco S.A.ADR (Banks) 30,140 129,301Beigene, Ltd.*ADR (Biotechnology) 325 78,838Bilibili, Inc.*ADR (Entertainment) 1,352 47,712Cemex SAB de CV*ADR (Construction Materials) 9,410 57,589China Life Insurance Co., Ltd.ADR (Insurance) 9,251 82,611China Petroleum & Chemical Corp.ADR (Oil,
Gas & Consumable Fuels) 1,586 82,630Chunghwa Telecom Co., Ltd.ADR (Diversified
Telecommunication Services) 2,363 102,578Dr. Reddy’s Laboratories, Ltd.ADR
(Pharmaceuticals) 755 43,413Fomento Economico Mexicano S.A.B.
de C.V.ADR (Beverages) 1,142 85,901GDS Holdings, Ltd.*ADR (IT Services) 710 31,155Gerdau S.A.ADR (Metals & Mining) 7,124 37,259Gold Fields, Ltd.ADR (Metals & Mining) 5,518 58,491Grupo Televisa S.A.B.ADR (Media) 3,146 32,184HDFC Bank, Ltd.ADR (Banks) 7,772 533,391Huazhu Group, Ltd.*ADR (Hotels, Restaurants &
Leisure) 914 36,121ICICI Bank, Ltd.ADR (Banks) 15,960 346,811Infosys Technologies, Ltd.ADR (IT Services) 20,806 490,398Itau Unibanco Holding S.A.ADR (Banks) 30,124 142,185JD.com, Inc.*ADR (Internet & Direct Marketing
Retail) 5,341 399,934KB Financial Group, Inc.ADR (Banks) 2,430 121,014KE Holdings, Inc.*ADR (Real Estate
Management & Development) 3,118 67,941Natura & Co. Holding S.A.*ADR (Personal
Products) 2,615 22,646NetEase, Inc.ADR (Entertainment) 2,320 239,796NIO, Inc.*ADR (Automobiles) 8,465 207,477PetroChina Co., Ltd.ADR (Oil, Gas &
Consumable Fuels) 1,312 64,931Petroleo Brasileiro S.A.ADR (Oil, Gas &
Consumable Fuels) 11,566 154,406Pinduoduo, Inc.*ADR (Internet & Direct
Marketing Retail) 2,727 163,184POSCOADR (Metals & Mining) 1,886 106,634PT Telekomunikasi Indonesia TbkADR
(Diversified Telecommunication Services) 2,956 87,882Sasol, Ltd.*ADR (Chemicals) 3,598 80,307Shinhan Financial Group Co., Ltd.ADR (Banks) 3,211 103,041Sibanye Stillwater, Ltd.ADR (Metals & Mining) 4,146 62,149SK Telecom Co., Ltd.ADR (Wireless
Telecommunication Services) 1,199 31,462Sociedad Quimica y Minera de Chile S.A.ADR
(Chemicals) 888 48,085Suzano Papel e Celulose S.A.ADR (Paper &
Forest Products) 4,908 54,921Taiwan Semiconductor Manufacturing Co.,
Ltd.ADR (Semiconductors & Semiconductor Equipment) 15,259 1,871,211
Tata Motors, Ltd.*ADR(a) (Automobiles) 2,188 73,867
January 31, 2022 (unaudited) :: Schedule of Portfolio Investments :: UltraEmerging Markets ProFund :: 147
See accompanying notes to the financial statements.
Toppan Merrill - ProFunds Public Semi-Annual Report [Funds] 01-31-2022 ED [AUX] | akiesli | 29-Mar-22 08:43 | 22-1296-2.dk | Sequence: 14CHKSUM Content: 18775 Layout: 8431 Graphics: 0 CLEAN
JOB: 22-1296-2 CYCLE#;BL#: 8; 0 TRIM: 8.25" x 10.75" AS: New York: 212-620-5600COLORS: ~note-color 2, Black, ~note-color 3 GRAPHICS: none V1.5

148 :: UltraEmerging Markets ProFund :: Schedule of Portfolio Investments :: January 31, 2022 (unaudited)
See accompanying notes to the financial statements.
Total Return Swap Agreements—Long
Value andUnrealized
Termination Rate Paid Notional Appreciation/Underlying Instrument Counterparty Date(1) (Received)(2) Amount (Depreciation)
S&P/BNY Mellon Emerging 50 ADR Index (USD) Goldman Sachs International 2/27/22 0.68% $ 6,182,337 $375,147S&P/BNY Mellon Emerging 50 ADR Index (USD) UBS AG 2/27/22 0.58% 6,760,856 341,465
$12,943,193 $716,612
(1) Agreements may be terminated at will by either party without penalty. Payment is due at termination/maturity.(2) Reflects the floating financing rate, as of January 31, 2022, on the notional amount of the swap agreement paid to the counterparty or
received from the counterparty, excluding any commissions. This amount is included as part of the unrealized appreciation/(depreciation).
UltraEmerging Markets ProFund invested in securities with exposure tothe following countries as of January 31, 2022:
% ofValue Net Assets
Brazil $ 1,180,685 10.6%Chile 48,085 0.4%China 3,316,492 30.0%India 1,558,620 14.0%Indonesia 87,882 0.8%Mexico 311,843 2.8%South Africa 249,162 2.2%South Korea 330,689 3.0%Taiwan 2,190,219 19.8%Other** 1,819,870 16.4%
Total $11,093,547 100.0%
** Includes any non-equity securities and net other assets (liabilities),which includes any receivable for capital shares issued andpayable for capital shares redeemed.
UltraEmerging Markets ProFund invested in the following industries asof January 31, 2022:
% ofValue Net Assets
Air Freight & Logistics $ 82,430 0.8%Automobiles 281,344 2.5%Banks 1,375,744 12.4%Beverages 163,440 1.5%Biotechnology 102,332 0.9%Chemicals 128,393 1.2%Construction Materials 57,589 0.5%Diversified Telecommunication Services 190,460 1.7%Entertainment 287,507 2.6%Hotels, Restaurants & Leisure 36,121 0.3%Insurance 82,611 0.8%Interactive Media & Services 281,622 2.5%Internet & Direct Marketing Retail 1,958,271 17.7%IT Services 592,293 5.3%Media 32,184 0.3%Metals & Mining 701,841 6.3%Oil, Gas & Consumable Fuels 475,302 4.3%Paper & Forest Products 54,921 0.5%Personal Products 22,646 0.2%Pharmaceuticals 43,413 0.4%Real Estate Management & Development 67,941 0.6%Semiconductors & Semiconductor
Equipment 2,087,641 18.8%Wireless Telecommunication Services 167,631 1.5%Other** 1,819,870 16.4%
Total $11,093,547 100.0%
Toppan Merrill - ProFunds Public Semi-Annual Report [Funds] 01-31-2022 ED [AUX] | akiesli | 29-Mar-22 08:43 | 22-1296-2.dk | Sequence: 15CHKSUM Content: 74 Layout: 49676 Graphics: 0 CLEAN
JOB: 22-1296-2 CYCLE#;BL#: 8; 0 TRIM: 8.25" x 10.75" AS: New York: 212-620-5600COLORS: ~note-color 2, Black, ~note-color 3 GRAPHICS: none V1.5
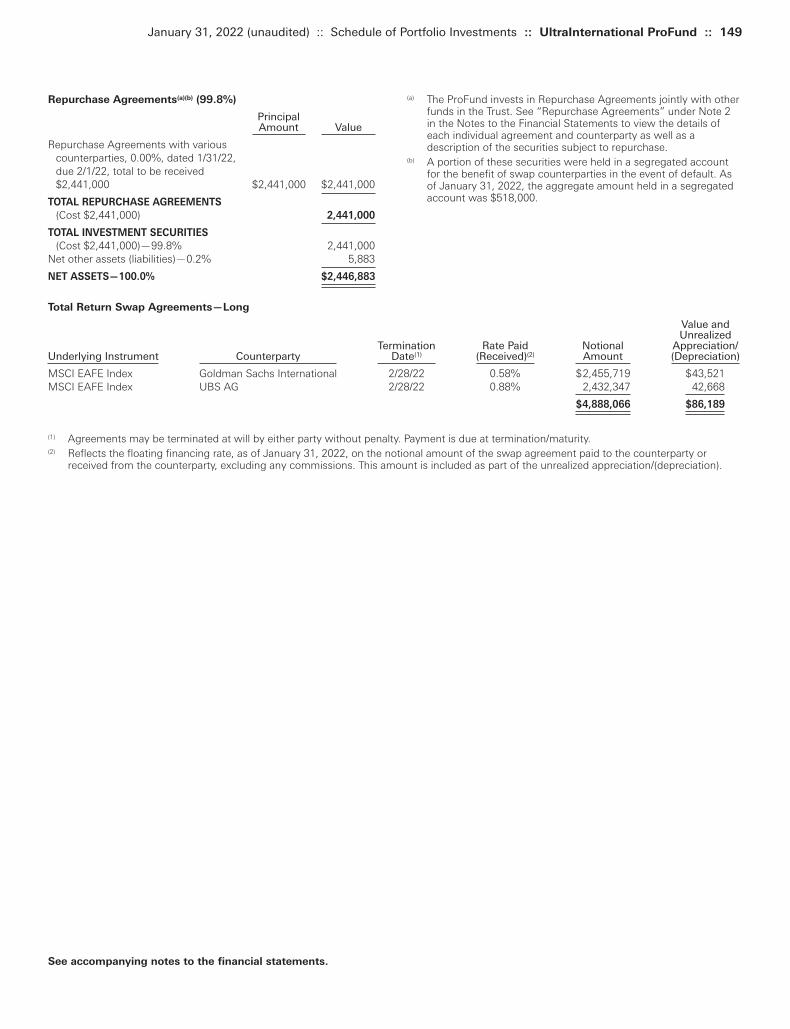
(a) The ProFund invests in Repurchase Agreements jointly with otherfunds in the Trust. See “Repurchase Agreements” under Note 2in the Notes to the Financial Statements to view the details ofeach individual agreement and counterparty as well as adescription of the securities subject to repurchase.
(b) A portion of these securities were held in a segregated accountfor the benefit of swap counterparties in the event of default. Asof January 31, 2022, the aggregate amount held in a segregatedaccount was $518,000.
Repurchase Agreements(a)(b) (99.8%)
Principal Amount Value
Repurchase Agreements with various counterparties, 0.00%, dated 1/31/22, due 2/1/22, total to be received $2,441,000 $2,441,000 $2,441,000
TOTAL REPURCHASE AGREEMENTS
(Cost $2,441,000) 2,441,000
TOTAL INVESTMENT SECURITIES
(Cost $2,441,000)—99.8% 2,441,000Net other assets (liabilities)—0.2% 5,883
NET ASSETS—100.0% $2,446,883
January 31, 2022 (unaudited) :: Schedule of Portfolio Investments :: UltraInternational ProFund :: 149
See accompanying notes to the financial statements.
Total Return Swap Agreements—Long
Value andUnrealized
Termination Rate Paid Notional Appreciation/Underlying Instrument Counterparty Date(1) (Received)(2) Amount (Depreciation)
MSCI EAFE Index Goldman Sachs International 2/28/22 0.58% $2,455,719 $43,521MSCI EAFE Index UBS AG 2/28/22 0.88% 2,432,347 42,668
$4,888,066 $86,189
(1) Agreements may be terminated at will by either party without penalty. Payment is due at termination/maturity.(2) Reflects the floating financing rate, as of January 31, 2022, on the notional amount of the swap agreement paid to the counterparty or
received from the counterparty, excluding any commissions. This amount is included as part of the unrealized appreciation/(depreciation).
Toppan Merrill - ProFunds Public Semi-Annual Report [Funds] 01-31-2022 ED [AUX] | akiesli | 29-Mar-22 08:43 | 22-1296-2.dk | Sequence: 16CHKSUM Content: 45867 Layout: 45194 Graphics: 0 CLEAN
JOB: 22-1296-2 CYCLE#;BL#: 8; 0 TRIM: 8.25" x 10.75" AS: New York: 212-620-5600COLORS: ~note-color 2, Black, ~note-color 3 GRAPHICS: none V1.5
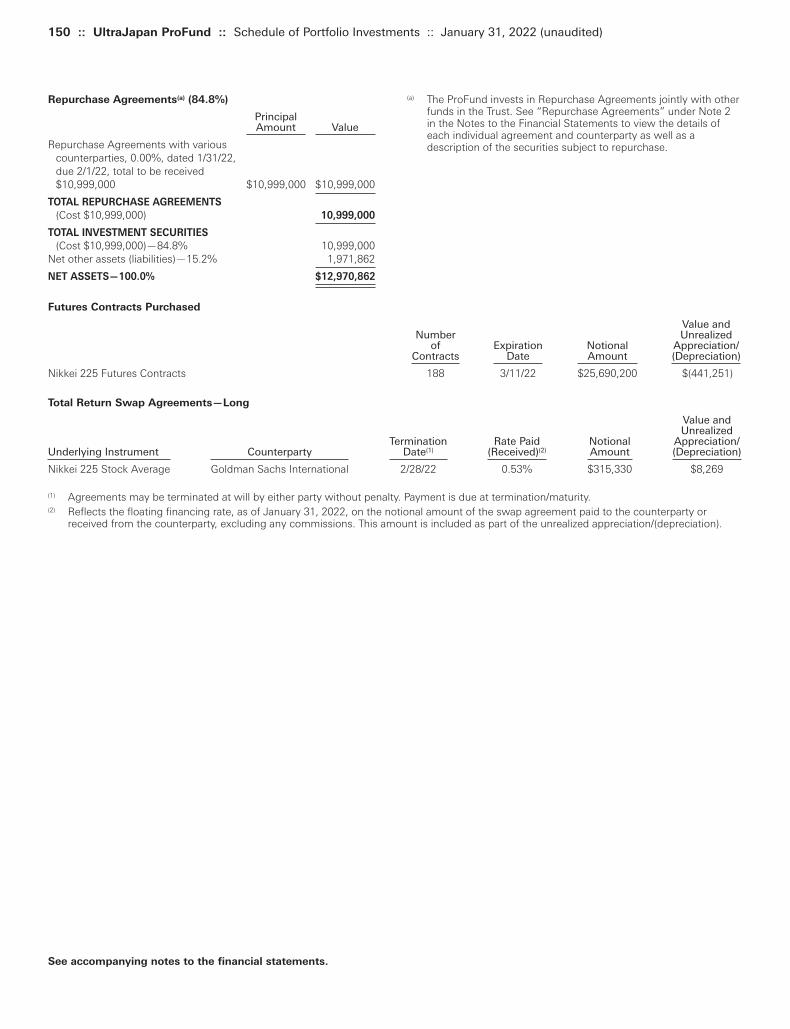
150 :: UltraJapan ProFund :: Schedule of Portfolio Investments :: January 31, 2022 (unaudited)
(a) The ProFund invests in Repurchase Agreements jointly with otherfunds in the Trust. See “Repurchase Agreements” under Note 2in the Notes to the Financial Statements to view the details ofeach individual agreement and counterparty as well as adescription of the securities subject to repurchase.
Repurchase Agreements(a) (84.8%)
Principal Amount Value
Repurchase Agreements with various counterparties, 0.00%, dated 1/31/22, due 2/1/22, total to be received $10,999,000 $10,999,000 $10,999,000
TOTAL REPURCHASE AGREEMENTS
(Cost $10,999,000) 10,999,000
TOTAL INVESTMENT SECURITIES
(Cost $10,999,000)—84.8% 10,999,000Net other assets (liabilities)—15.2% 1,971,862
NET ASSETS—100.0% $12,970,862
See accompanying notes to the financial statements.
Futures Contracts Purchased
Value and Number Unrealized
of Expiration Notional Appreciation/ Contracts Date Amount (Depreciation)
Nikkei 225 Futures Contracts 188 3/11/22 $25,690,200 $(441,251)
Total Return Swap Agreements—Long
Value and Unrealized
Termination Rate Paid Notional Appreciation/ Underlying Instrument Counterparty Date(1) (Received)(2) Amount (Depreciation) Nikkei 225 Stock Average Goldman Sachs International 2/28/22 0.53% $315,330 $8,269
(1) Agreements may be terminated at will by either party without penalty. Payment is due at termination/maturity.(2) Reflects the floating financing rate, as of January 31, 2022, on the notional amount of the swap agreement paid to the counterparty or
received from the counterparty, excluding any commissions. This amount is included as part of the unrealized appreciation/(depreciation).
Toppan Merrill - ProFunds Public Semi-Annual Report [Funds] 01-31-2022 ED [AUX] | akiesli | 29-Mar-22 08:43 | 22-1296-2.dl | Sequence: 1CHKSUM Content: 12504 Layout: 12972 Graphics: 0 CLEAN
JOB: 22-1296-2 CYCLE#;BL#: 8; 0 TRIM: 8.25" x 10.75" AS: New York: 212-620-5600COLORS: ~note-color 2, Black, ~note-color 3 GRAPHICS: none V1.5
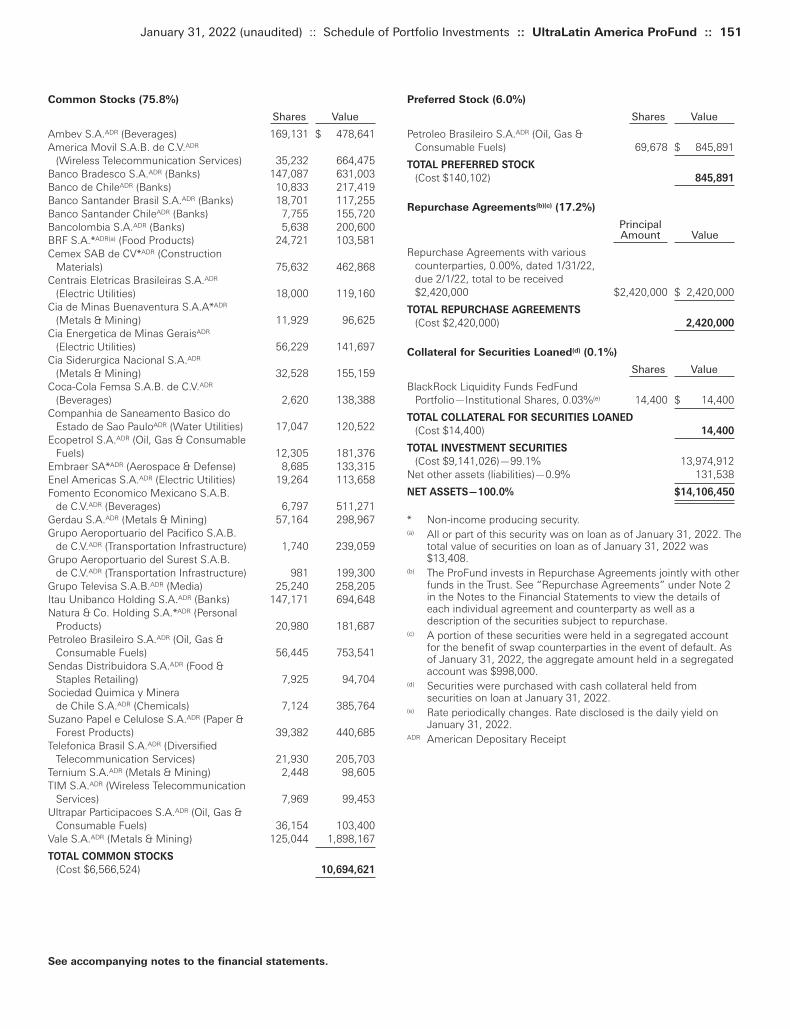
Preferred Stock (6.0%)
Shares Value
Petroleo Brasileiro S.A.ADR (Oil, Gas & Consumable Fuels) 69,678 $ 845,891
TOTAL PREFERRED STOCK
(Cost $140,102) 845,891
Repurchase Agreements(b)(c) (17.2%)
Principal Amount Value
Repurchase Agreements with various counterparties, 0.00%, dated 1/31/22, due 2/1/22, total to be received $2,420,000 $2,420,000 $ 2,420,000
TOTAL REPURCHASE AGREEMENTS
(Cost $2,420,000) 2,420,000
Collateral for Securities Loaned(d) (0.1%)
Shares Value
BlackRock Liquidity Funds FedFund Portfolio—Institutional Shares, 0.03%(e) 14,400 $ 14,400
TOTAL COLLATERAL FOR SECURITIES LOANED
(Cost $14,400) 14,400
TOTAL INVESTMENT SECURITIES
(Cost $9,141,026)—99.1% 13,974,912Net other assets (liabilities)—0.9% 131,538
NET ASSETS—100.0% $14,106,450
* Non-income producing security.(a) All or part of this security was on loan as of January 31, 2022. The
total value of securities on loan as of January 31, 2022 was$13,408.
(b) The ProFund invests in Repurchase Agreements jointly with otherfunds in the Trust. See “Repurchase Agreements” under Note 2in the Notes to the Financial Statements to view the details ofeach individual agreement and counterparty as well as adescription of the securities subject to repurchase.
(c) A portion of these securities were held in a segregated accountfor the benefit of swap counterparties in the event of default. Asof January 31, 2022, the aggregate amount held in a segregatedaccount was $998,000.
(d) Securities were purchased with cash collateral held fromsecurities on loan at January 31, 2022.
(e) Rate periodically changes. Rate disclosed is the daily yield onJanuary 31, 2022.
ADR American Depositary Receipt
Common Stocks (75.8%)
Shares Value
Ambev S.A.ADR (Beverages) 169,131 $ 478,641America Movil S.A.B. de C.V.ADR
(Wireless Telecommunication Services) 35,232 664,475Banco Bradesco S.A.ADR (Banks) 147,087 631,003Banco de ChileADR (Banks) 10,833 217,419Banco Santander Brasil S.A.ADR (Banks) 18,701 117,255Banco Santander ChileADR (Banks) 7,755 155,720Bancolombia S.A.ADR (Banks) 5,638 200,600BRF S.A.*ADR(a) (Food Products) 24,721 103,581Cemex SAB de CV*ADR (Construction
Materials) 75,632 462,868Centrais Eletricas Brasileiras S.A.ADR
(Electric Utilities) 18,000 119,160Cia de Minas Buenaventura S.A.A*ADR
(Metals & Mining) 11,929 96,625Cia Energetica de Minas GeraisADR
(Electric Utilities) 56,229 141,697Cia Siderurgica Nacional S.A.ADR
(Metals & Mining) 32,528 155,159Coca-Cola Femsa S.A.B. de C.V.ADR
(Beverages) 2,620 138,388Companhia de Saneamento Basico do
Estado de Sao PauloADR (Water Utilities) 17,047 120,522Ecopetrol S.A.ADR (Oil, Gas & Consumable
Fuels) 12,305 181,376Embraer SA*ADR (Aerospace & Defense) 8,685 133,315Enel Americas S.A.ADR (Electric Utilities) 19,264 113,658Fomento Economico Mexicano S.A.B.
de C.V.ADR (Beverages) 6,797 511,271Gerdau S.A.ADR (Metals & Mining) 57,164 298,967Grupo Aeroportuario del Pacifico S.A.B.
de C.V.ADR (Transportation Infrastructure) 1,740 239,059Grupo Aeroportuario del Surest S.A.B.
de C.V.ADR (Transportation Infrastructure) 981 199,300Grupo Televisa S.A.B.ADR (Media) 25,240 258,205Itau Unibanco Holding S.A.ADR (Banks) 147,171 694,648Natura & Co. Holding S.A.*ADR (Personal
Products) 20,980 181,687Petroleo Brasileiro S.A.ADR (Oil, Gas &
Consumable Fuels) 56,445 753,541Sendas Distribuidora S.A.ADR (Food &
Staples Retailing) 7,925 94,704Sociedad Quimica y Minera
de Chile S.A.ADR (Chemicals) 7,124 385,764Suzano Papel e Celulose S.A.ADR (Paper &
Forest Products) 39,382 440,685Telefonica Brasil S.A.ADR (Diversified
Telecommunication Services) 21,930 205,703Ternium S.A.ADR (Metals & Mining) 2,448 98,605TIM S.A.ADR (Wireless Telecommunication
Services) 7,969 99,453Ultrapar Participacoes S.A.ADR (Oil, Gas &
Consumable Fuels) 36,154 103,400Vale S.A.ADR (Metals & Mining) 125,044 1,898,167
TOTAL COMMON STOCKS
(Cost $6,566,524) 10,694,621
January 31, 2022 (unaudited) :: Schedule of Portfolio Investments :: UltraLatin America ProFund :: 151
See accompanying notes to the financial statements.
Toppan Merrill - ProFunds Public Semi-Annual Report [Funds] 01-31-2022 ED [AUX] | akiesli | 29-Mar-22 08:43 | 22-1296-2.dl | Sequence: 2CHKSUM Content: 18513 Layout: 4317 Graphics: 0 CLEAN
JOB: 22-1296-2 CYCLE#;BL#: 8; 0 TRIM: 8.25" x 10.75" AS: New York: 212-620-5600COLORS: ~note-color 2, Black, ~note-color 3 GRAPHICS: none V1.5
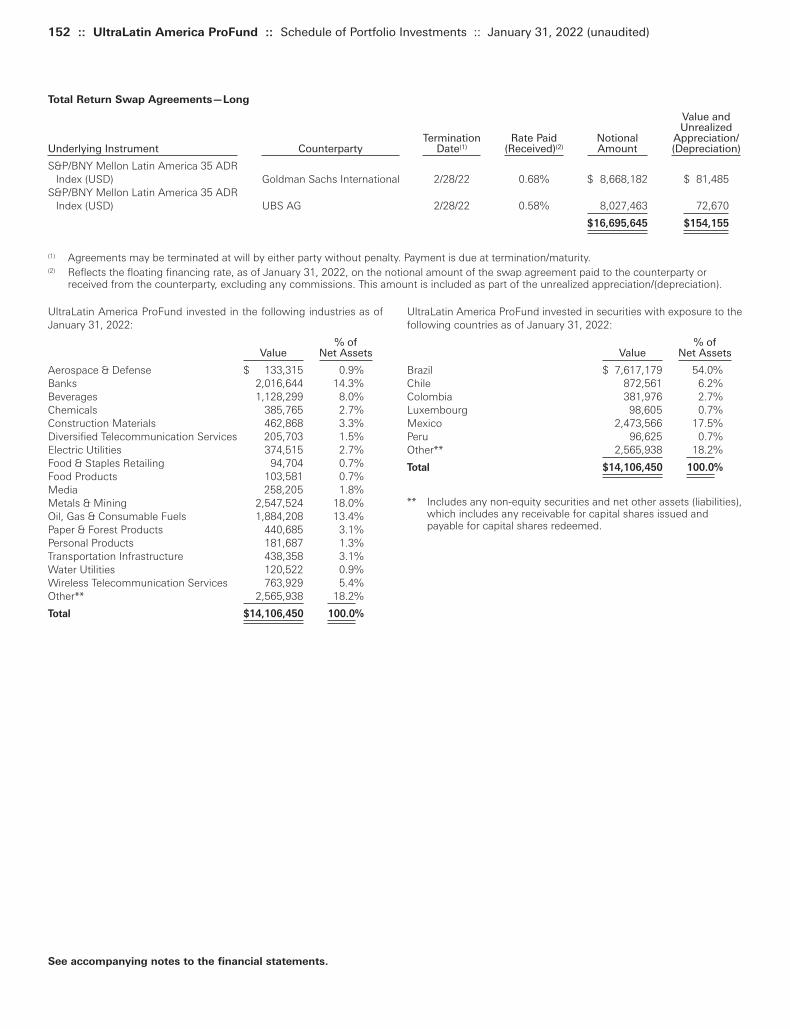
152 :: UltraLatin America ProFund :: Schedule of Portfolio Investments :: January 31, 2022 (unaudited)
UltraLatin America ProFund invested in securities with exposure to thefollowing countries as of January 31, 2022:
% ofValue Net Assets
Brazil $ 7,617,179 54.0%Chile 872,561 6.2%Colombia 381,976 2.7%Luxembourg 98,605 0.7%Mexico 2,473,566 17.5%Peru 96,625 0.7%Other** 2,565,938 18.2%
Total $14,106,450 100.0%
** Includes any non-equity securities and net other assets (liabilities),which includes any receivable for capital shares issued andpayable for capital shares redeemed.
UltraLatin America ProFund invested in the following industries as ofJanuary 31, 2022:
% ofValue Net Assets
Aerospace & Defense $ 133,315 0.9%Banks 2,016,644 14.3%Beverages 1,128,299 8.0%Chemicals 385,765 2.7%Construction Materials 462,868 3.3%Diversified Telecommunication Services 205,703 1.5%Electric Utilities 374,515 2.7%Food & Staples Retailing 94,704 0.7%Food Products 103,581 0.7%Media 258,205 1.8%Metals & Mining 2,547,524 18.0%Oil, Gas & Consumable Fuels 1,884,208 13.4%Paper & Forest Products 440,685 3.1%Personal Products 181,687 1.3%Transportation Infrastructure 438,358 3.1%Water Utilities 120,522 0.9%Wireless Telecommunication Services 763,929 5.4%Other** 2,565,938 18.2%
Total $14,106,450 100.0%
See accompanying notes to the financial statements.
Total Return Swap Agreements—Long
Value and Unrealized
Termination Rate Paid Notional Appreciation/ Underlying Instrument Counterparty Date(1) (Received)(2) Amount (Depreciation)
S&P/BNY Mellon Latin America 35 ADR Index (USD) Goldman Sachs International 2/28/22 0.68% $ 8,668,182 $ 81,485
S&P/BNY Mellon Latin America 35 ADR Index (USD) UBS AG 2/28/22 0.58% 8,027,463 72,670
$16,695,645 $154,155
(1) Agreements may be terminated at will by either party without penalty. Payment is due at termination/maturity.(2) Reflects the floating financing rate, as of January 31, 2022, on the notional amount of the swap agreement paid to the counterparty or
received from the counterparty, excluding any commissions. This amount is included as part of the unrealized appreciation/(depreciation).
Toppan Merrill - ProFunds Public Semi-Annual Report [Funds] 01-31-2022 ED [AUX] | akiesli | 29-Mar-22 08:43 | 22-1296-2.dl | Sequence: 3CHKSUM Content: 24773 Layout: 23626 Graphics: 0 CLEAN
JOB: 22-1296-2 CYCLE#;BL#: 8; 0 TRIM: 8.25" x 10.75" AS: New York: 212-620-5600COLORS: ~note-color 2, Black, ~note-color 3 GRAPHICS: none V1.5
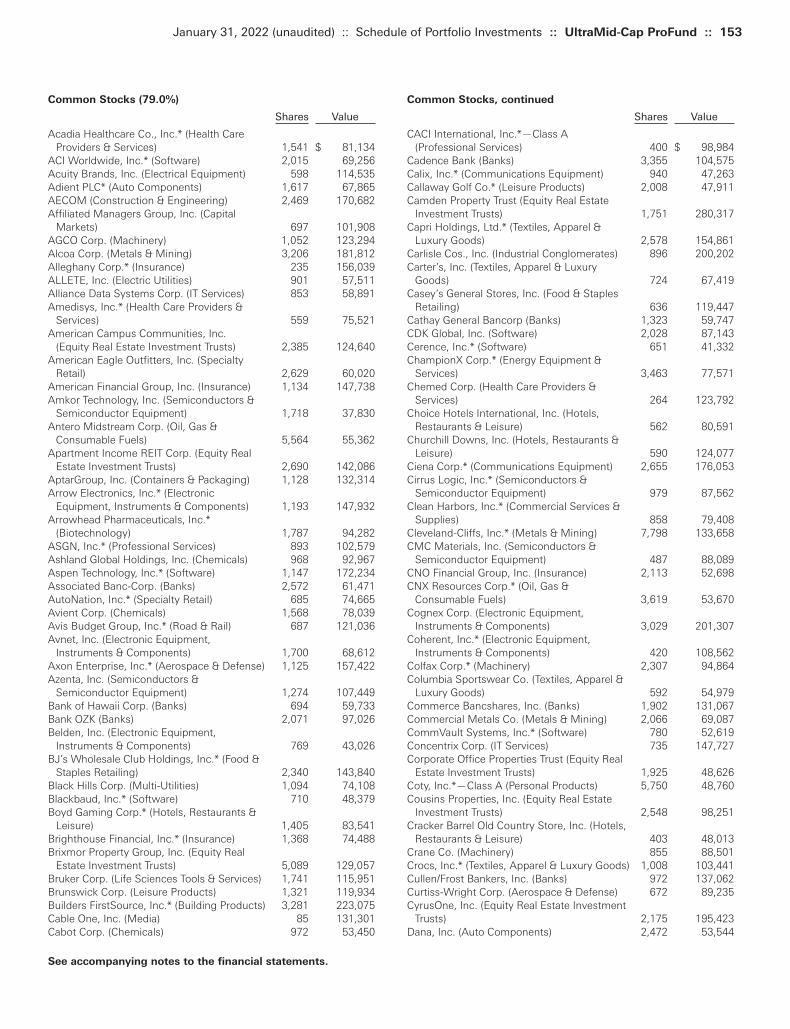
Common Stocks, continued
Shares Value
CACI International, Inc.*—Class A (Professional Services) 400 $ 98,984
Cadence Bank (Banks) 3,355 104,575Calix, Inc.* (Communications Equipment) 940 47,263Callaway Golf Co.* (Leisure Products) 2,008 47,911Camden Property Trust (Equity Real Estate
Investment Trusts) 1,751 280,317Capri Holdings, Ltd.* (Textiles, Apparel &
Luxury Goods) 2,578 154,861Carlisle Cos., Inc. (Industrial Conglomerates) 896 200,202Carter’s, Inc. (Textiles, Apparel & Luxury
Goods) 724 67,419Casey’s General Stores, Inc. (Food & Staples
Retailing) 636 119,447Cathay General Bancorp (Banks) 1,323 59,747CDK Global, Inc. (Software) 2,028 87,143Cerence, Inc.* (Software) 651 41,332ChampionX Corp.* (Energy Equipment &
Services) 3,463 77,571Chemed Corp. (Health Care Providers &
Services) 264 123,792Choice Hotels International, Inc. (Hotels,
Restaurants & Leisure) 562 80,591Churchill Downs, Inc. (Hotels, Restaurants &
Leisure) 590 124,077Ciena Corp.* (Communications Equipment) 2,655 176,053Cirrus Logic, Inc.* (Semiconductors &
Semiconductor Equipment) 979 87,562Clean Harbors, Inc.* (Commercial Services &
Supplies) 858 79,408Cleveland-Cliffs, Inc.* (Metals & Mining) 7,798 133,658CMC Materials, Inc. (Semiconductors &
Semiconductor Equipment) 487 88,089CNO Financial Group, Inc. (Insurance) 2,113 52,698CNX Resources Corp.* (Oil, Gas &
Consumable Fuels) 3,619 53,670Cognex Corp. (Electronic Equipment,
Instruments & Components) 3,029 201,307Coherent, Inc.* (Electronic Equipment,
Instruments & Components) 420 108,562Colfax Corp.* (Machinery) 2,307 94,864Columbia Sportswear Co. (Textiles, Apparel &
Luxury Goods) 592 54,979Commerce Bancshares, Inc. (Banks) 1,902 131,067Commercial Metals Co. (Metals & Mining) 2,066 69,087CommVault Systems, Inc.* (Software) 780 52,619Concentrix Corp. (IT Services) 735 147,727Corporate Office Properties Trust (Equity Real
Estate Investment Trusts) 1,925 48,626Coty, Inc.*—Class A (Personal Products) 5,750 48,760Cousins Properties, Inc. (Equity Real Estate
Investment Trusts) 2,548 98,251Cracker Barrel Old Country Store, Inc. (Hotels,
Restaurants & Leisure) 403 48,013Crane Co. (Machinery) 855 88,501Crocs, Inc.* (Textiles, Apparel & Luxury Goods) 1,008 103,441Cullen/Frost Bankers, Inc. (Banks) 972 137,062Curtiss-Wright Corp. (Aerospace & Defense) 672 89,235CyrusOne, Inc. (Equity Real Estate Investment
Trusts) 2,175 195,423Dana, Inc. (Auto Components) 2,472 53,544
Common Stocks (79.0%)
Shares Value
Acadia Healthcare Co., Inc.* (Health Care Providers & Services) 1,541 $ 81,134
ACI Worldwide, Inc.* (Software) 2,015 69,256Acuity Brands, Inc. (Electrical Equipment) 598 114,535Adient PLC* (Auto Components) 1,617 67,865AECOM (Construction & Engineering) 2,469 170,682Affiliated Managers Group, Inc. (Capital
Markets) 697 101,908AGCO Corp. (Machinery) 1,052 123,294Alcoa Corp. (Metals & Mining) 3,206 181,812Alleghany Corp.* (Insurance) 235 156,039ALLETE, Inc. (Electric Utilities) 901 57,511Alliance Data Systems Corp. (IT Services) 853 58,891Amedisys, Inc.* (Health Care Providers &
Services) 559 75,521American Campus Communities, Inc.
(Equity Real Estate Investment Trusts) 2,385 124,640American Eagle Outfitters, Inc. (Specialty
Retail) 2,629 60,020American Financial Group, Inc. (Insurance) 1,134 147,738Amkor Technology, Inc. (Semiconductors &
Semiconductor Equipment) 1,718 37,830Antero Midstream Corp. (Oil, Gas &
Consumable Fuels) 5,564 55,362Apartment Income REIT Corp. (Equity Real
Estate Investment Trusts) 2,690 142,086AptarGroup, Inc. (Containers & Packaging) 1,128 132,314Arrow Electronics, Inc.* (Electronic
Equipment, Instruments & Components) 1,193 147,932Arrowhead Pharmaceuticals, Inc.*
(Biotechnology) 1,787 94,282ASGN, Inc.* (Professional Services) 893 102,579Ashland Global Holdings, Inc. (Chemicals) 968 92,967Aspen Technology, Inc.* (Software) 1,147 172,234Associated Banc-Corp. (Banks) 2,572 61,471AutoNation, Inc.* (Specialty Retail) 685 74,665Avient Corp. (Chemicals) 1,568 78,039Avis Budget Group, Inc.* (Road & Rail) 687 121,036Avnet, Inc. (Electronic Equipment,
Instruments & Components) 1,700 68,612Axon Enterprise, Inc.* (Aerospace & Defense) 1,125 157,422Azenta, Inc. (Semiconductors &
Semiconductor Equipment) 1,274 107,449Bank of Hawaii Corp. (Banks) 694 59,733Bank OZK (Banks) 2,071 97,026Belden, Inc. (Electronic Equipment,
Instruments & Components) 769 43,026BJ’s Wholesale Club Holdings, Inc.* (Food &
Staples Retailing) 2,340 143,840Black Hills Corp. (Multi-Utilities) 1,094 74,108Blackbaud, Inc.* (Software) 710 48,379Boyd Gaming Corp.* (Hotels, Restaurants &
Leisure) 1,405 83,541Brighthouse Financial, Inc.* (Insurance) 1,368 74,488Brixmor Property Group, Inc. (Equity Real
Estate Investment Trusts) 5,089 129,057Bruker Corp. (Life Sciences Tools & Services) 1,741 115,951Brunswick Corp. (Leisure Products) 1,321 119,934Builders FirstSource, Inc.* (Building Products) 3,281 223,075Cable One, Inc. (Media) 85 131,301Cabot Corp. (Chemicals) 972 53,450
January 31, 2022 (unaudited) :: Schedule of Portfolio Investments :: UltraMid-Cap ProFund :: 153
See accompanying notes to the financial statements.
Toppan Merrill - ProFunds Public Semi-Annual Report [Funds] 01-31-2022 ED [AUX] | akiesli | 29-Mar-22 08:43 | 22-1296-2.dl | Sequence: 4CHKSUM Content: 65057 Layout: 22539 Graphics: 0 CLEAN
JOB: 22-1296-2 CYCLE#;BL#: 8; 0 TRIM: 8.25" x 10.75" AS: New York: 212-620-5600COLORS: ~note-color 2, Black, ~note-color 3 GRAPHICS: none V1.5
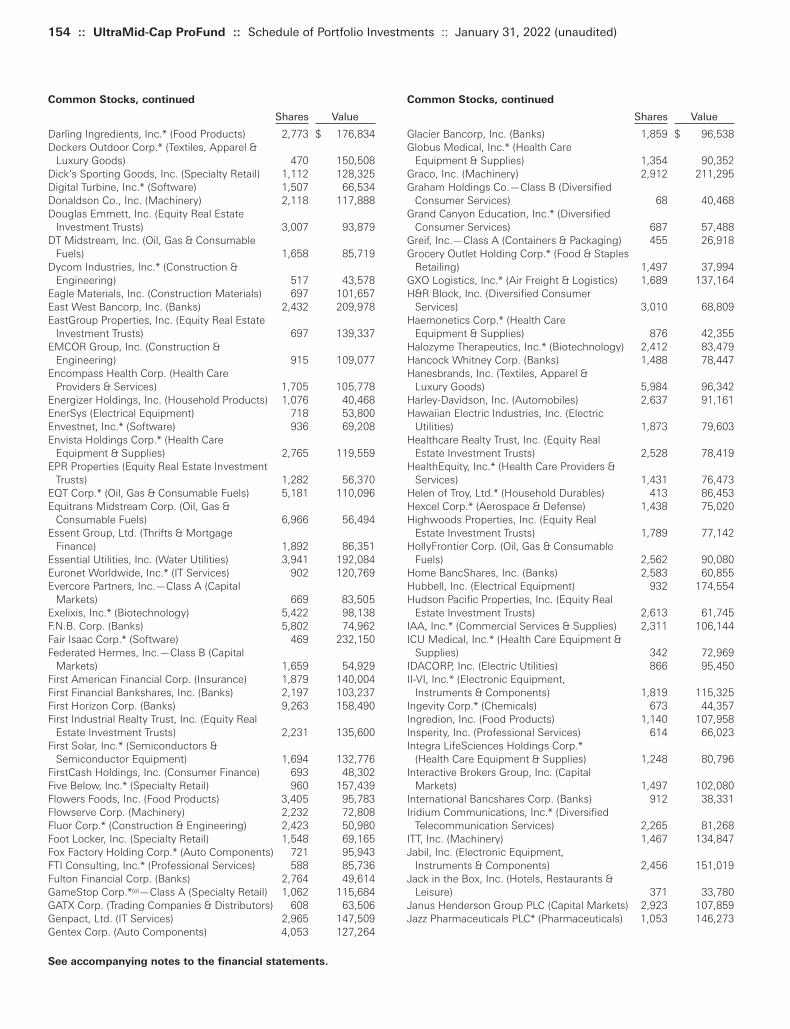
154 :: UltraMid-Cap ProFund :: Schedule of Portfolio Investments :: January 31, 2022 (unaudited)
Common Stocks, continued
Shares Value
Glacier Bancorp, Inc. (Banks) 1,859 $ 96,538Globus Medical, Inc.* (Health Care
Equipment & Supplies) 1,354 90,352Graco, Inc. (Machinery) 2,912 211,295Graham Holdings Co.—Class B (Diversified
Consumer Services) 68 40,468Grand Canyon Education, Inc.* (Diversified
Consumer Services) 687 57,488Greif, Inc.—Class A (Containers & Packaging) 455 26,918Grocery Outlet Holding Corp.* (Food & Staples
Retailing) 1,497 37,994GXO Logistics, Inc.* (Air Freight & Logistics) 1,689 137,164H&R Block, Inc. (Diversified Consumer
Services) 3,010 68,809Haemonetics Corp.* (Health Care
Equipment & Supplies) 876 42,355Halozyme Therapeutics, Inc.* (Biotechnology) 2,412 83,479Hancock Whitney Corp. (Banks) 1,488 78,447Hanesbrands, Inc. (Textiles, Apparel &
Luxury Goods) 5,984 96,342Harley-Davidson, Inc. (Automobiles) 2,637 91,161Hawaiian Electric Industries, Inc. (Electric
Utilities) 1,873 79,603Healthcare Realty Trust, Inc. (Equity Real
Estate Investment Trusts) 2,528 78,419HealthEquity, Inc.* (Health Care Providers &
Services) 1,431 76,473Helen of Troy, Ltd.* (Household Durables) 413 86,453Hexcel Corp.* (Aerospace & Defense) 1,438 75,020Highwoods Properties, Inc. (Equity Real
Estate Investment Trusts) 1,789 77,142HollyFrontier Corp. (Oil, Gas & Consumable
Fuels) 2,562 90,080Home BancShares, Inc. (Banks) 2,583 60,855Hubbell, Inc. (Electrical Equipment) 932 174,554Hudson Pacific Properties, Inc. (Equity Real
Estate Investment Trusts) 2,613 61,745IAA, Inc.* (Commercial Services & Supplies) 2,311 106,144ICU Medical, Inc.* (Health Care Equipment &
Supplies) 342 72,969IDACORP, Inc. (Electric Utilities) 866 95,450II-VI, Inc.* (Electronic Equipment,
Instruments & Components) 1,819 115,325Ingevity Corp.* (Chemicals) 673 44,357Ingredion, Inc. (Food Products) 1,140 107,958Insperity, Inc. (Professional Services) 614 66,023Integra LifeSciences Holdings Corp.*
(Health Care Equipment & Supplies) 1,248 80,796Interactive Brokers Group, Inc. (Capital
Markets) 1,497 102,080International Bancshares Corp. (Banks) 912 38,331Iridium Communications, Inc.* (Diversified
Telecommunication Services) 2,265 81,268ITT, Inc. (Machinery) 1,467 134,847Jabil, Inc. (Electronic Equipment,
Instruments & Components) 2,456 151,019Jack in the Box, Inc. (Hotels, Restaurants &
Leisure) 371 33,780Janus Henderson Group PLC (Capital Markets) 2,923 107,859Jazz Pharmaceuticals PLC* (Pharmaceuticals) 1,053 146,273
Common Stocks, continued
Shares Value
Darling Ingredients, Inc.* (Food Products) 2,773 $ 176,834Deckers Outdoor Corp.* (Textiles, Apparel &
Luxury Goods) 470 150,508Dick’s Sporting Goods, Inc. (Specialty Retail) 1,112 128,325Digital Turbine, Inc.* (Software) 1,507 66,534Donaldson Co., Inc. (Machinery) 2,118 117,888Douglas Emmett, Inc. (Equity Real Estate
Investment Trusts) 3,007 93,879DT Midstream, Inc. (Oil, Gas & Consumable
Fuels) 1,658 85,719Dycom Industries, Inc.* (Construction &
Engineering) 517 43,578Eagle Materials, Inc. (Construction Materials) 697 101,657East West Bancorp, Inc. (Banks) 2,432 209,978EastGroup Properties, Inc. (Equity Real Estate
Investment Trusts) 697 139,337EMCOR Group, Inc. (Construction &
Engineering) 915 109,077Encompass Health Corp. (Health Care
Providers & Services) 1,705 105,778Energizer Holdings, Inc. (Household Products) 1,076 40,468EnerSys (Electrical Equipment) 718 53,800Envestnet, Inc.* (Software) 936 69,208Envista Holdings Corp.* (Health Care
Equipment & Supplies) 2,765 119,559EPR Properties (Equity Real Estate Investment
Trusts) 1,282 56,370EQT Corp.* (Oil, Gas & Consumable Fuels) 5,181 110,096Equitrans Midstream Corp. (Oil, Gas &
Consumable Fuels) 6,966 56,494Essent Group, Ltd. (Thrifts & Mortgage
Finance) 1,892 86,351Essential Utilities, Inc. (Water Utilities) 3,941 192,084Euronet Worldwide, Inc.* (IT Services) 902 120,769Evercore Partners, Inc.—Class A (Capital
Markets) 669 83,505Exelixis, Inc.* (Biotechnology) 5,422 98,138F.N.B. Corp. (Banks) 5,802 74,962Fair Isaac Corp.* (Software) 469 232,150Federated Hermes, Inc.—Class B (Capital
Markets) 1,659 54,929First American Financial Corp. (Insurance) 1,879 140,004First Financial Bankshares, Inc. (Banks) 2,197 103,237First Horizon Corp. (Banks) 9,263 158,490First Industrial Realty Trust, Inc. (Equity Real
Estate Investment Trusts) 2,231 135,600First Solar, Inc.* (Semiconductors &
Semiconductor Equipment) 1,694 132,776FirstCash Holdings, Inc. (Consumer Finance) 693 48,302Five Below, Inc.* (Specialty Retail) 960 157,439Flowers Foods, Inc. (Food Products) 3,405 95,783Flowserve Corp. (Machinery) 2,232 72,808Fluor Corp.* (Construction & Engineering) 2,423 50,980Foot Locker, Inc. (Specialty Retail) 1,548 69,165Fox Factory Holding Corp.* (Auto Components) 721 95,943FTI Consulting, Inc.* (Professional Services) 588 85,736Fulton Financial Corp. (Banks) 2,764 49,614GameStop Corp.*(a)—Class A (Specialty Retail) 1,062 115,684GATX Corp. (Trading Companies & Distributors) 608 63,506Genpact, Ltd. (IT Services) 2,965 147,509Gentex Corp. (Auto Components) 4,053 127,264
See accompanying notes to the financial statements.
Toppan Merrill - ProFunds Public Semi-Annual Report [Funds] 01-31-2022 ED [AUX] | akiesli | 29-Mar-22 08:43 | 22-1296-2.dl | Sequence: 5CHKSUM Content: 50069 Layout: 59374 Graphics: 0 CLEAN
JOB: 22-1296-2 CYCLE#;BL#: 8; 0 TRIM: 8.25" x 10.75" AS: New York: 212-620-5600COLORS: ~note-color 2, Black, ~note-color 3 GRAPHICS: none V1.5
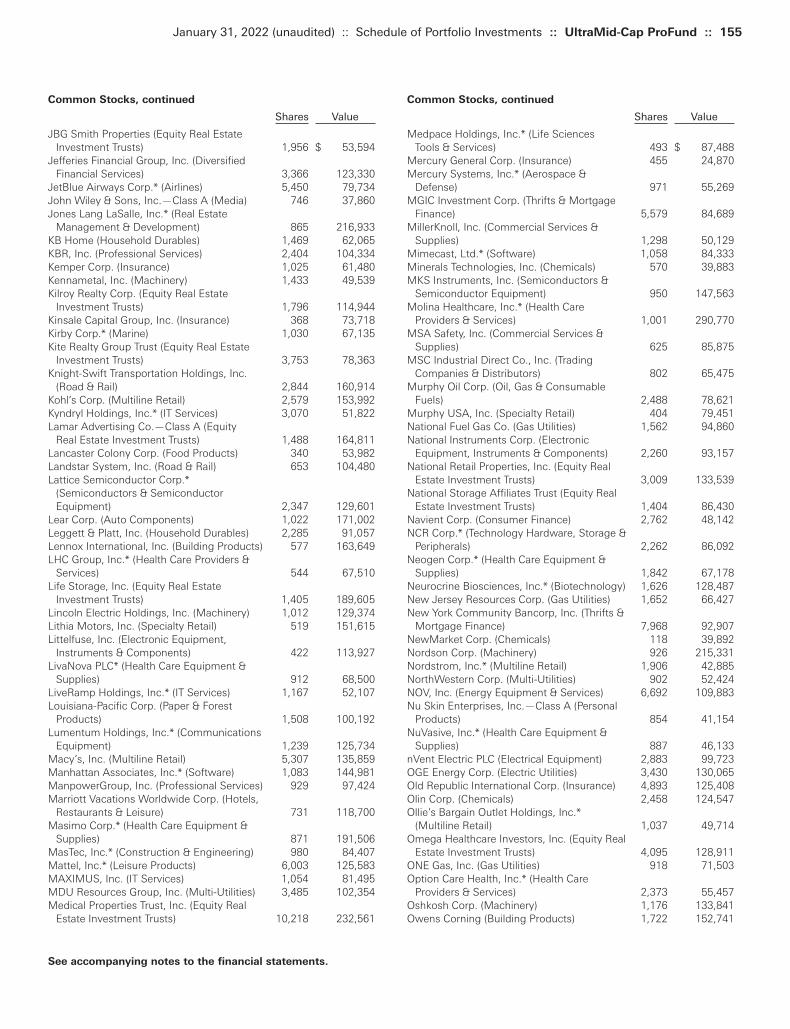
Common Stocks, continued
Shares Value
Medpace Holdings, Inc.* (Life Sciences Tools & Services) 493 $ 87,488
Mercury General Corp. (Insurance) 455 24,870Mercury Systems, Inc.* (Aerospace &
Defense) 971 55,269MGIC Investment Corp. (Thrifts & Mortgage
Finance) 5,579 84,689MillerKnoll, Inc. (Commercial Services &
Supplies) 1,298 50,129Mimecast, Ltd.* (Software) 1,058 84,333Minerals Technologies, Inc. (Chemicals) 570 39,883MKS Instruments, Inc. (Semiconductors &
Semiconductor Equipment) 950 147,563Molina Healthcare, Inc.* (Health Care
Providers & Services) 1,001 290,770MSA Safety, Inc. (Commercial Services &
Supplies) 625 85,875MSC Industrial Direct Co., Inc. (Trading
Companies & Distributors) 802 65,475Murphy Oil Corp. (Oil, Gas & Consumable
Fuels) 2,488 78,621Murphy USA, Inc. (Specialty Retail) 404 79,451National Fuel Gas Co. (Gas Utilities) 1,562 94,860National Instruments Corp. (Electronic
Equipment, Instruments & Components) 2,260 93,157National Retail Properties, Inc. (Equity Real
Estate Investment Trusts) 3,009 133,539National Storage Affiliates Trust (Equity Real
Estate Investment Trusts) 1,404 86,430Navient Corp. (Consumer Finance) 2,762 48,142NCR Corp.* (Technology Hardware, Storage &
Peripherals) 2,262 86,092Neogen Corp.* (Health Care Equipment &
Supplies) 1,842 67,178Neurocrine Biosciences, Inc.* (Biotechnology) 1,626 128,487New Jersey Resources Corp. (Gas Utilities) 1,652 66,427New York Community Bancorp, Inc. (Thrifts &
Mortgage Finance) 7,968 92,907NewMarket Corp. (Chemicals) 118 39,892Nordson Corp. (Machinery) 926 215,331Nordstrom, Inc.* (Multiline Retail) 1,906 42,885NorthWestern Corp. (Multi-Utilities) 902 52,424NOV, Inc. (Energy Equipment & Services) 6,692 109,883Nu Skin Enterprises, Inc.—Class A (Personal
Products) 854 41,154NuVasive, Inc.* (Health Care Equipment &
Supplies) 887 46,133nVent Electric PLC (Electrical Equipment) 2,883 99,723OGE Energy Corp. (Electric Utilities) 3,430 130,065Old Republic International Corp. (Insurance) 4,893 125,408Olin Corp. (Chemicals) 2,458 124,547Ollie’s Bargain Outlet Holdings, Inc.*
(Multiline Retail) 1,037 49,714Omega Healthcare Investors, Inc. (Equity Real
Estate Investment Trusts) 4,095 128,911ONE Gas, Inc. (Gas Utilities) 918 71,503Option Care Health, Inc.* (Health Care
Providers & Services) 2,373 55,457Oshkosh Corp. (Machinery) 1,176 133,841Owens Corning (Building Products) 1,722 152,741
Common Stocks, continued
Shares Value
JBG Smith Properties (Equity Real Estate Investment Trusts) 1,956 $ 53,594
Jefferies Financial Group, Inc. (Diversified Financial Services) 3,366 123,330
JetBlue Airways Corp.* (Airlines) 5,450 79,734John Wiley & Sons, Inc.—Class A (Media) 746 37,860Jones Lang LaSalle, Inc.* (Real Estate
Management & Development) 865 216,933KB Home (Household Durables) 1,469 62,065KBR, Inc. (Professional Services) 2,404 104,334Kemper Corp. (Insurance) 1,025 61,480Kennametal, Inc. (Machinery) 1,433 49,539Kilroy Realty Corp. (Equity Real Estate
Investment Trusts) 1,796 114,944Kinsale Capital Group, Inc. (Insurance) 368 73,718Kirby Corp.* (Marine) 1,030 67,135Kite Realty Group Trust (Equity Real Estate
Investment Trusts) 3,753 78,363Knight-Swift Transportation Holdings, Inc.
(Road & Rail) 2,844 160,914Kohl’s Corp. (Multiline Retail) 2,579 153,992Kyndryl Holdings, Inc.* (IT Services) 3,070 51,822Lamar Advertising Co.—Class A (Equity
Real Estate Investment Trusts) 1,488 164,811Lancaster Colony Corp. (Food Products) 340 53,982Landstar System, Inc. (Road & Rail) 653 104,480Lattice Semiconductor Corp.*
(Semiconductors & Semiconductor Equipment) 2,347 129,601
Lear Corp. (Auto Components) 1,022 171,002Leggett & Platt, Inc. (Household Durables) 2,285 91,057Lennox International, Inc. (Building Products) 577 163,649LHC Group, Inc.* (Health Care Providers &
Services) 544 67,510Life Storage, Inc. (Equity Real Estate
Investment Trusts) 1,405 189,605Lincoln Electric Holdings, Inc. (Machinery) 1,012 129,374Lithia Motors, Inc. (Specialty Retail) 519 151,615Littelfuse, Inc. (Electronic Equipment,
Instruments & Components) 422 113,927LivaNova PLC* (Health Care Equipment &
Supplies) 912 68,500LiveRamp Holdings, Inc.* (IT Services) 1,167 52,107Louisiana-Pacific Corp. (Paper & Forest
Products) 1,508 100,192Lumentum Holdings, Inc.* (Communications
Equipment) 1,239 125,734Macy’s, Inc. (Multiline Retail) 5,307 135,859Manhattan Associates, Inc.* (Software) 1,083 144,981ManpowerGroup, Inc. (Professional Services) 929 97,424Marriott Vacations Worldwide Corp. (Hotels,
Restaurants & Leisure) 731 118,700Masimo Corp.* (Health Care Equipment &
Supplies) 871 191,506MasTec, Inc.* (Construction & Engineering) 980 84,407Mattel, Inc.* (Leisure Products) 6,003 125,583MAXIMUS, Inc. (IT Services) 1,054 81,495MDU Resources Group, Inc. (Multi-Utilities) 3,485 102,354Medical Properties Trust, Inc. (Equity Real
Estate Investment Trusts) 10,218 232,561
January 31, 2022 (unaudited) :: Schedule of Portfolio Investments :: UltraMid-Cap ProFund :: 155
See accompanying notes to the financial statements.
Toppan Merrill - ProFunds Public Semi-Annual Report [Funds] 01-31-2022 ED [AUX] | akiesli | 29-Mar-22 08:43 | 22-1296-2.dl | Sequence: 6CHKSUM Content: 43767 Layout: 46617 Graphics: 0 CLEAN
JOB: 22-1296-2 CYCLE#;BL#: 8; 0 TRIM: 8.25" x 10.75" AS: New York: 212-620-5600COLORS: ~note-color 2, Black, ~note-color 3 GRAPHICS: none V1.5
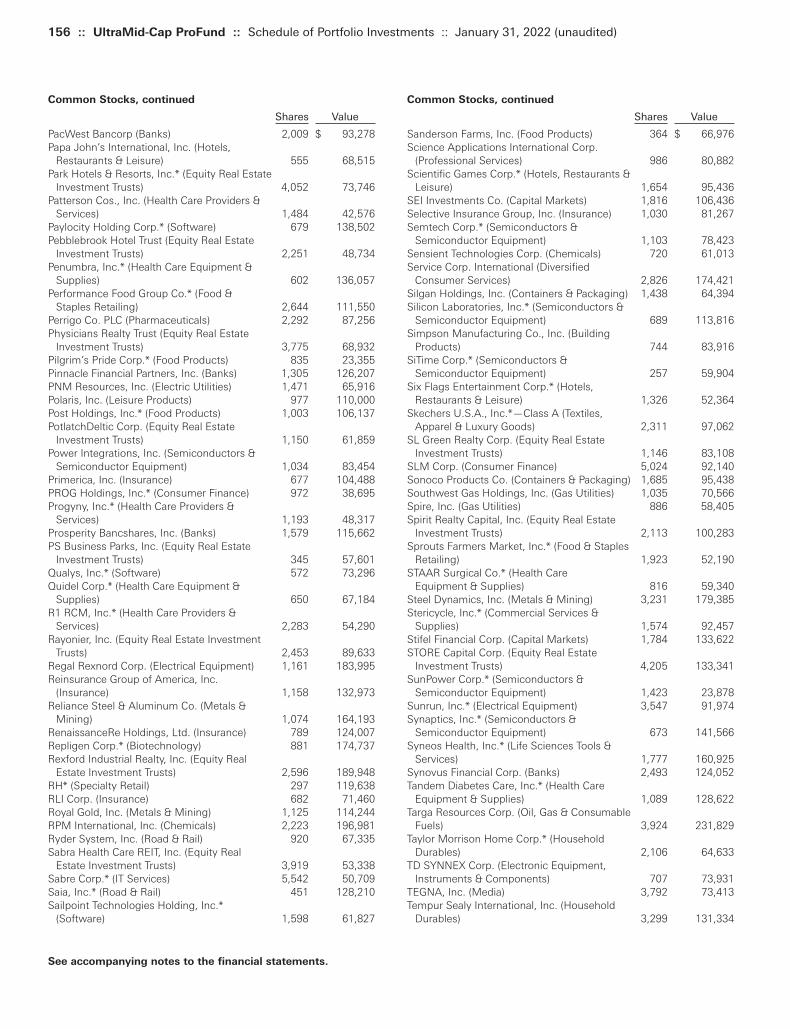
156 :: UltraMid-Cap ProFund :: Schedule of Portfolio Investments :: January 31, 2022 (unaudited)
Common Stocks, continued
Shares Value
Sanderson Farms, Inc. (Food Products) 364 $ 66,976Science Applications International Corp.
(Professional Services) 986 80,882Scientific Games Corp.* (Hotels, Restaurants &
Leisure) 1,654 95,436SEI Investments Co. (Capital Markets) 1,816 106,436Selective Insurance Group, Inc. (Insurance) 1,030 81,267Semtech Corp.* (Semiconductors &
Semiconductor Equipment) 1,103 78,423Sensient Technologies Corp. (Chemicals) 720 61,013Service Corp. International (Diversified
Consumer Services) 2,826 174,421Silgan Holdings, Inc. (Containers & Packaging) 1,438 64,394Silicon Laboratories, Inc.* (Semiconductors &
Semiconductor Equipment) 689 113,816Simpson Manufacturing Co., Inc. (Building
Products) 744 83,916SiTime Corp.* (Semiconductors &
Semiconductor Equipment) 257 59,904Six Flags Entertainment Corp.* (Hotels,
Restaurants & Leisure) 1,326 52,364Skechers U.S.A., Inc.*—Class A (Textiles,
Apparel & Luxury Goods) 2,311 97,062SL Green Realty Corp. (Equity Real Estate
Investment Trusts) 1,146 83,108SLM Corp. (Consumer Finance) 5,024 92,140Sonoco Products Co. (Containers & Packaging) 1,685 95,438Southwest Gas Holdings, Inc. (Gas Utilities) 1,035 70,566Spire, Inc. (Gas Utilities) 886 58,405Spirit Realty Capital, Inc. (Equity Real Estate
Investment Trusts) 2,113 100,283Sprouts Farmers Market, Inc.* (Food & Staples
Retailing) 1,923 52,190STAAR Surgical Co.* (Health Care
Equipment & Supplies) 816 59,340Steel Dynamics, Inc. (Metals & Mining) 3,231 179,385Stericycle, Inc.* (Commercial Services &
Supplies) 1,574 92,457Stifel Financial Corp. (Capital Markets) 1,784 133,622STORE Capital Corp. (Equity Real Estate
Investment Trusts) 4,205 133,341SunPower Corp.* (Semiconductors &
Semiconductor Equipment) 1,423 23,878Sunrun, Inc.* (Electrical Equipment) 3,547 91,974Synaptics, Inc.* (Semiconductors &
Semiconductor Equipment) 673 141,566Syneos Health, Inc.* (Life Sciences Tools &
Services) 1,777 160,925Synovus Financial Corp. (Banks) 2,493 124,052Tandem Diabetes Care, Inc.* (Health Care
Equipment & Supplies) 1,089 128,622Targa Resources Corp. (Oil, Gas & Consumable
Fuels) 3,924 231,829Taylor Morrison Home Corp.* (Household
Durables) 2,106 64,633TD SYNNEX Corp. (Electronic Equipment,
Instruments & Components) 707 73,931TEGNA, Inc. (Media) 3,792 73,413Tempur Sealy International, Inc. (Household
Durables) 3,299 131,334
Common Stocks, continued
Shares Value
PacWest Bancorp (Banks) 2,009 $ 93,278Papa John’s International, Inc. (Hotels,
Restaurants & Leisure) 555 68,515Park Hotels & Resorts, Inc.* (Equity Real Estate
Investment Trusts) 4,052 73,746Patterson Cos., Inc. (Health Care Providers &
Services) 1,484 42,576Paylocity Holding Corp.* (Software) 679 138,502Pebblebrook Hotel Trust (Equity Real Estate
Investment Trusts) 2,251 48,734Penumbra, Inc.* (Health Care Equipment &
Supplies) 602 136,057Performance Food Group Co.* (Food &
Staples Retailing) 2,644 111,550Perrigo Co. PLC (Pharmaceuticals) 2,292 87,256Physicians Realty Trust (Equity Real Estate
Investment Trusts) 3,775 68,932Pilgrim’s Pride Corp.* (Food Products) 835 23,355Pinnacle Financial Partners, Inc. (Banks) 1,305 126,207PNM Resources, Inc. (Electric Utilities) 1,471 65,916Polaris, Inc. (Leisure Products) 977 110,000Post Holdings, Inc.* (Food Products) 1,003 106,137PotlatchDeltic Corp. (Equity Real Estate
Investment Trusts) 1,150 61,859Power Integrations, Inc. (Semiconductors &
Semiconductor Equipment) 1,034 83,454Primerica, Inc. (Insurance) 677 104,488PROG Holdings, Inc.* (Consumer Finance) 972 38,695Progyny, Inc.* (Health Care Providers &
Services) 1,193 48,317Prosperity Bancshares, Inc. (Banks) 1,579 115,662PS Business Parks, Inc. (Equity Real Estate
Investment Trusts) 345 57,601Qualys, Inc.* (Software) 572 73,296Quidel Corp.* (Health Care Equipment &
Supplies) 650 67,184R1 RCM, Inc.* (Health Care Providers &
Services) 2,283 54,290Rayonier, Inc. (Equity Real Estate Investment
Trusts) 2,453 89,633Regal Rexnord Corp. (Electrical Equipment) 1,161 183,995Reinsurance Group of America, Inc.
(Insurance) 1,158 132,973Reliance Steel & Aluminum Co. (Metals &
Mining) 1,074 164,193RenaissanceRe Holdings, Ltd. (Insurance) 789 124,007Repligen Corp.* (Biotechnology) 881 174,737Rexford Industrial Realty, Inc. (Equity Real
Estate Investment Trusts) 2,596 189,948RH* (Specialty Retail) 297 119,638RLI Corp. (Insurance) 682 71,460Royal Gold, Inc. (Metals & Mining) 1,125 114,244RPM International, Inc. (Chemicals) 2,223 196,981Ryder System, Inc. (Road & Rail) 920 67,335Sabra Health Care REIT, Inc. (Equity Real
Estate Investment Trusts) 3,919 53,338Sabre Corp.* (IT Services) 5,542 50,709Saia, Inc.* (Road & Rail) 451 128,210Sailpoint Technologies Holding, Inc.*
(Software) 1,598 61,827
See accompanying notes to the financial statements.
Toppan Merrill - ProFunds Public Semi-Annual Report [Funds] 01-31-2022 ED [AUX] | akiesli | 29-Mar-22 08:43 | 22-1296-2.dl | Sequence: 7CHKSUM Content: 36818 Layout: 25761 Graphics: 0 CLEAN
JOB: 22-1296-2 CYCLE#;BL#: 8; 0 TRIM: 8.25" x 10.75" AS: New York: 212-620-5600COLORS: ~note-color 2, Black, ~note-color 3 GRAPHICS: none V1.5
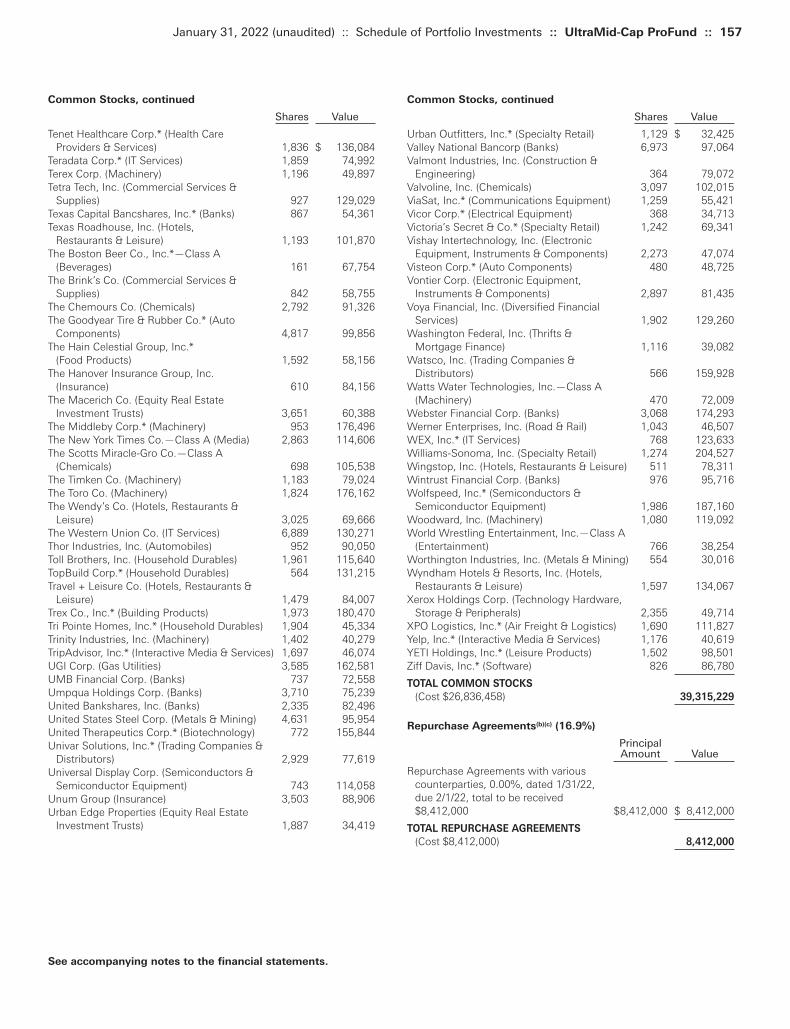
Common Stocks, continued
Shares Value
Urban Outfitters, Inc.* (Specialty Retail) 1,129 $ 32,425Valley National Bancorp (Banks) 6,973 97,064Valmont Industries, Inc. (Construction &
Engineering) 364 79,072Valvoline, Inc. (Chemicals) 3,097 102,015ViaSat, Inc.* (Communications Equipment) 1,259 55,421Vicor Corp.* (Electrical Equipment) 368 34,713Victoria’s Secret & Co.* (Specialty Retail) 1,242 69,341Vishay Intertechnology, Inc. (Electronic
Equipment, Instruments & Components) 2,273 47,074Visteon Corp.* (Auto Components) 480 48,725Vontier Corp. (Electronic Equipment,
Instruments & Components) 2,897 81,435Voya Financial, Inc. (Diversified Financial
Services) 1,902 129,260Washington Federal, Inc. (Thrifts &
Mortgage Finance) 1,116 39,082Watsco, Inc. (Trading Companies &
Distributors) 566 159,928Watts Water Technologies, Inc.—Class A
(Machinery) 470 72,009Webster Financial Corp. (Banks) 3,068 174,293Werner Enterprises, Inc. (Road & Rail) 1,043 46,507WEX, Inc.* (IT Services) 768 123,633Williams-Sonoma, Inc. (Specialty Retail) 1,274 204,527Wingstop, Inc. (Hotels, Restaurants & Leisure) 511 78,311Wintrust Financial Corp. (Banks) 976 95,716Wolfspeed, Inc.* (Semiconductors &
Semiconductor Equipment) 1,986 187,160Woodward, Inc. (Machinery) 1,080 119,092World Wrestling Entertainment, Inc.—Class A
(Entertainment) 766 38,254Worthington Industries, Inc. (Metals & Mining) 554 30,016Wyndham Hotels & Resorts, Inc. (Hotels,
Restaurants & Leisure) 1,597 134,067Xerox Holdings Corp. (Technology Hardware,
Storage & Peripherals) 2,355 49,714XPO Logistics, Inc.* (Air Freight & Logistics) 1,690 111,827Yelp, Inc.* (Interactive Media & Services) 1,176 40,619YETI Holdings, Inc.* (Leisure Products) 1,502 98,501Ziff Davis, Inc.* (Software) 826 86,780
TOTAL COMMON STOCKS
(Cost $26,836,458) 39,315,229
Repurchase Agreements(b)(c) (16.9%)
Principal Amount Value
Repurchase Agreements with various counterparties, 0.00%, dated 1/31/22, due 2/1/22, total to be received $8,412,000 $8,412,000 $ 8,412,000
TOTAL REPURCHASE AGREEMENTS
(Cost $8,412,000) 8,412,000
Common Stocks, continued
Shares Value
Tenet Healthcare Corp.* (Health Care Providers & Services) 1,836 $ 136,084
Teradata Corp.* (IT Services) 1,859 74,992Terex Corp. (Machinery) 1,196 49,897Tetra Tech, Inc. (Commercial Services &
Supplies) 927 129,029Texas Capital Bancshares, Inc.* (Banks) 867 54,361Texas Roadhouse, Inc. (Hotels,
Restaurants & Leisure) 1,193 101,870The Boston Beer Co., Inc.*—Class A
(Beverages) 161 67,754The Brink’s Co. (Commercial Services &
Supplies) 842 58,755The Chemours Co. (Chemicals) 2,792 91,326The Goodyear Tire & Rubber Co.* (Auto
Components) 4,817 99,856The Hain Celestial Group, Inc.*
(Food Products) 1,592 58,156The Hanover Insurance Group, Inc.
(Insurance) 610 84,156The Macerich Co. (Equity Real Estate
Investment Trusts) 3,651 60,388The Middleby Corp.* (Machinery) 953 176,496The New York Times Co.—Class A (Media) 2,863 114,606The Scotts Miracle-Gro Co.—Class A
(Chemicals) 698 105,538The Timken Co. (Machinery) 1,183 79,024The Toro Co. (Machinery) 1,824 176,162The Wendy’s Co. (Hotels, Restaurants &
Leisure) 3,025 69,666The Western Union Co. (IT Services) 6,889 130,271Thor Industries, Inc. (Automobiles) 952 90,050Toll Brothers, Inc. (Household Durables) 1,961 115,640TopBuild Corp.* (Household Durables) 564 131,215Travel + Leisure Co. (Hotels, Restaurants &
Leisure) 1,479 84,007Trex Co., Inc.* (Building Products) 1,973 180,470Tri Pointe Homes, Inc.* (Household Durables) 1,904 45,334Trinity Industries, Inc. (Machinery) 1,402 40,279TripAdvisor, Inc.* (Interactive Media & Services) 1,697 46,074UGI Corp. (Gas Utilities) 3,585 162,581UMB Financial Corp. (Banks) 737 72,558Umpqua Holdings Corp. (Banks) 3,710 75,239United Bankshares, Inc. (Banks) 2,335 82,496United States Steel Corp. (Metals & Mining) 4,631 95,954United Therapeutics Corp.* (Biotechnology) 772 155,844Univar Solutions, Inc.* (Trading Companies &
Distributors) 2,929 77,619Universal Display Corp. (Semiconductors &
Semiconductor Equipment) 743 114,058Unum Group (Insurance) 3,503 88,906Urban Edge Properties (Equity Real Estate
Investment Trusts) 1,887 34,419
January 31, 2022 (unaudited) :: Schedule of Portfolio Investments :: UltraMid-Cap ProFund :: 157
See accompanying notes to the financial statements.
Toppan Merrill - ProFunds Public Semi-Annual Report [Funds] 01-31-2022 ED [AUX] | akiesli | 29-Mar-22 08:43 | 22-1296-2.dl | Sequence: 8CHKSUM Content: 12978 Layout: 12542 Graphics: 0 CLEAN
JOB: 22-1296-2 CYCLE#;BL#: 8; 0 TRIM: 8.25" x 10.75" AS: New York: 212-620-5600COLORS: ~note-color 2, Black, ~note-color 3 GRAPHICS: none V1.5
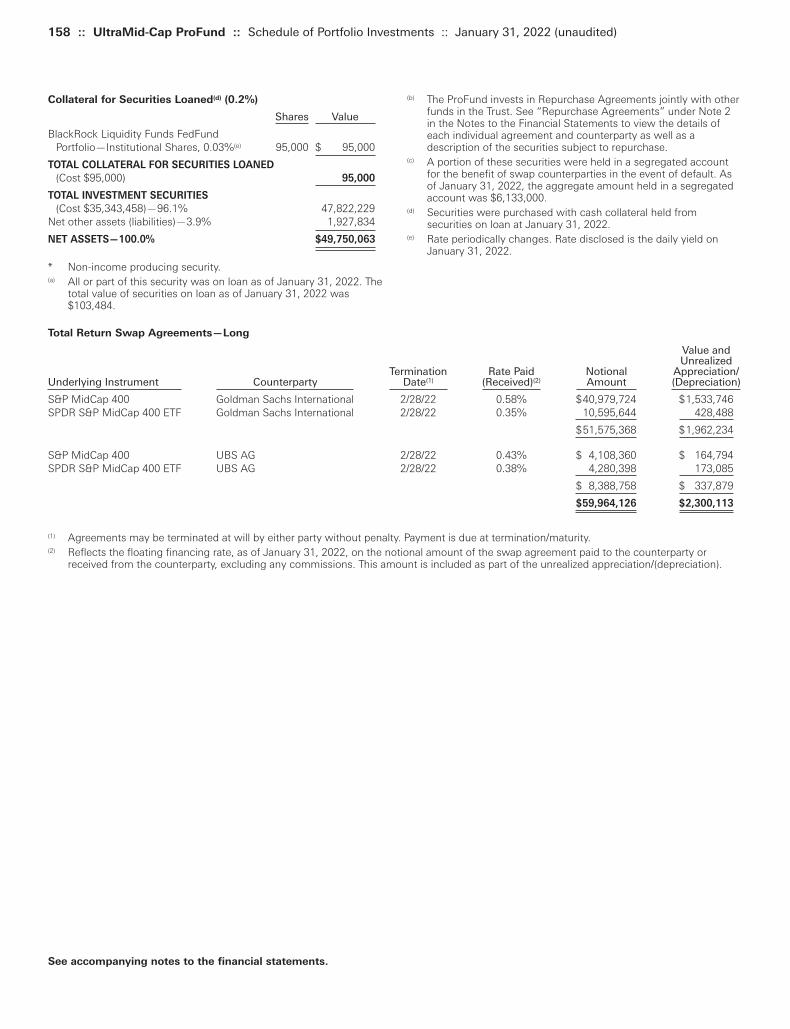
158 :: UltraMid-Cap ProFund :: Schedule of Portfolio Investments :: January 31, 2022 (unaudited)
(b) The ProFund invests in Repurchase Agreements jointly with otherfunds in the Trust. See “Repurchase Agreements” under Note 2in the Notes to the Financial Statements to view the details ofeach individual agreement and counterparty as well as adescription of the securities subject to repurchase.
(c) A portion of these securities were held in a segregated accountfor the benefit of swap counterparties in the event of default. Asof January 31, 2022, the aggregate amount held in a segregatedaccount was $6,133,000.
(d) Securities were purchased with cash collateral held fromsecurities on loan at January 31, 2022.
(e) Rate periodically changes. Rate disclosed is the daily yield onJanuary 31, 2022.
Collateral for Securities Loaned(d) (0.2%)
Shares Value
BlackRock Liquidity Funds FedFund Portfolio—Institutional Shares, 0.03%(e) 95,000 $ 95,000
TOTAL COLLATERAL FOR SECURITIES LOANED
(Cost $95,000) 95,000
TOTAL INVESTMENT SECURITIES
(Cost $35,343,458)—96.1% 47,822,229Net other assets (liabilities)—3.9% 1,927,834
NET ASSETS—100.0% $49,750,063
* Non-income producing security.(a) All or part of this security was on loan as of January 31, 2022. The
total value of securities on loan as of January 31, 2022 was$103,484.
See accompanying notes to the financial statements.
Total Return Swap Agreements—Long
Value and Unrealized
Termination Rate Paid Notional Appreciation/Underlying Instrument Counterparty Date(1) (Received)(2) Amount (Depreciation)
S&P MidCap 400 Goldman Sachs International 2/28/22 0.58% $40,979,724 $1,533,746SPDR S&P MidCap 400 ETF Goldman Sachs International 2/28/22 0.35% 10,595,644 428,488
$51,575,368 $1,962,234
S&P MidCap 400 UBS AG 2/28/22 0.43% $ 4,108,360 $ 164,794SPDR S&P MidCap 400 ETF UBS AG 2/28/22 0.38% 4,280,398 173,085
$ 8,388,758 $ 337,879 $59,964,126 $2,300,113
(1) Agreements may be terminated at will by either party without penalty. Payment is due at termination/maturity.(2) Reflects the floating financing rate, as of January 31, 2022, on the notional amount of the swap agreement paid to the counterparty or
received from the counterparty, excluding any commissions. This amount is included as part of the unrealized appreciation/(depreciation).
Toppan Merrill - ProFunds Public Semi-Annual Report [Funds] 01-31-2022 ED [AUX] | akiesli | 29-Mar-22 08:43 | 22-1296-2.dl | Sequence: 9CHKSUM Content: 17136 Layout: 14145 Graphics: 0 CLEAN
JOB: 22-1296-2 CYCLE#;BL#: 8; 0 TRIM: 8.25" x 10.75" AS: New York: 212-620-5600COLORS: ~note-color 2, Black, ~note-color 3 GRAPHICS: none V1.5
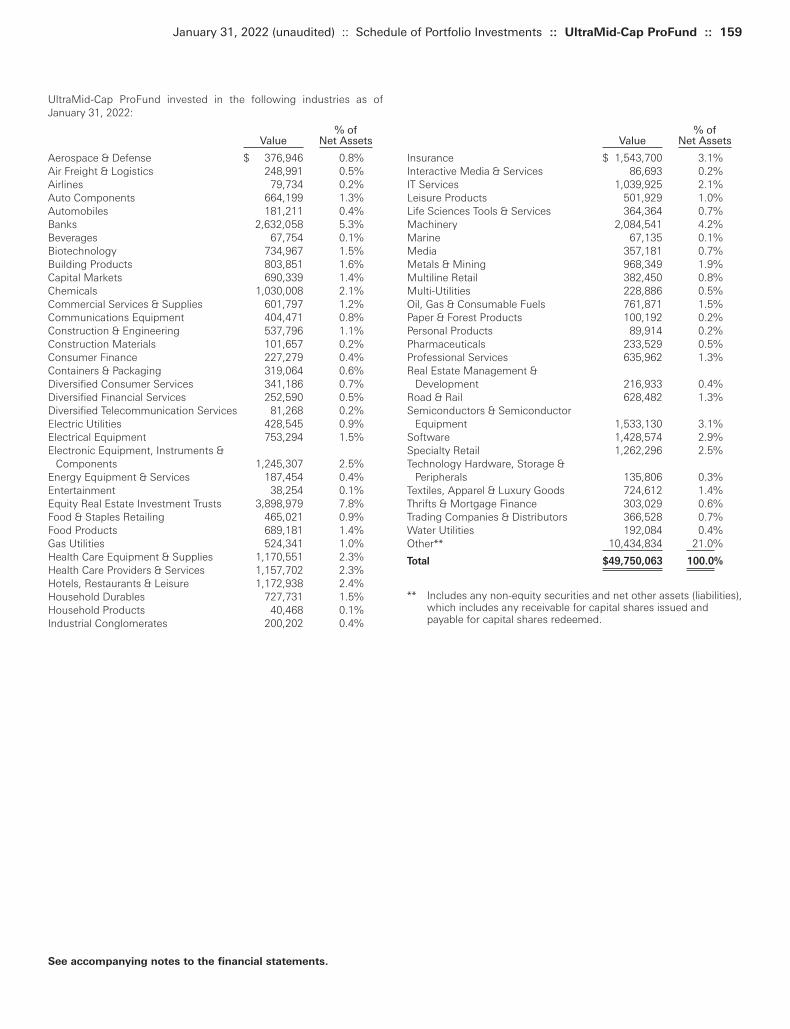
% ofValue Net Assets
Insurance $ 1,543,700 3.1%Interactive Media & Services 86,693 0.2%IT Services 1,039,925 2.1%Leisure Products 501,929 1.0%Life Sciences Tools & Services 364,364 0.7%Machinery 2,084,541 4.2%Marine 67,135 0.1%Media 357,181 0.7%Metals & Mining 968,349 1.9%Multiline Retail 382,450 0.8%Multi-Utilities 228,886 0.5%Oil, Gas & Consumable Fuels 761,871 1.5%Paper & Forest Products 100,192 0.2%Personal Products 89,914 0.2%Pharmaceuticals 233,529 0.5%Professional Services 635,962 1.3%Real Estate Management &
Development 216,933 0.4%Road & Rail 628,482 1.3%Semiconductors & Semiconductor
Equipment 1,533,130 3.1%Software 1,428,574 2.9%Specialty Retail 1,262,296 2.5%Technology Hardware, Storage &
Peripherals 135,806 0.3%Textiles, Apparel & Luxury Goods 724,612 1.4%Thrifts & Mortgage Finance 303,029 0.6%Trading Companies & Distributors 366,528 0.7%Water Utilities 192,084 0.4%Other** 10,434,834 21.0%
Total $49,750,063 100.0%
** Includes any non-equity securities and net other assets (liabilities),which includes any receivable for capital shares issued andpayable for capital shares redeemed.
UltraMid-Cap ProFund invested in the following industries as ofJanuary 31, 2022:
% ofValue Net Assets
Aerospace & Defense $ 376,946 0.8%Air Freight & Logistics 248,991 0.5%Airlines 79,734 0.2%Auto Components 664,199 1.3%Automobiles 181,211 0.4%Banks 2,632,058 5.3%Beverages 67,754 0.1%Biotechnology 734,967 1.5%Building Products 803,851 1.6%Capital Markets 690,339 1.4%Chemicals 1,030,008 2.1%Commercial Services & Supplies 601,797 1.2%Communications Equipment 404,471 0.8%Construction & Engineering 537,796 1.1%Construction Materials 101,657 0.2%Consumer Finance 227,279 0.4%Containers & Packaging 319,064 0.6%Diversified Consumer Services 341,186 0.7%Diversified Financial Services 252,590 0.5%Diversified Telecommunication Services 81,268 0.2%Electric Utilities 428,545 0.9%Electrical Equipment 753,294 1.5%Electronic Equipment, Instruments &
Components 1,245,307 2.5%Energy Equipment & Services 187,454 0.4%Entertainment 38,254 0.1%Equity Real Estate Investment Trusts 3,898,979 7.8%Food & Staples Retailing 465,021 0.9%Food Products 689,181 1.4%Gas Utilities 524,341 1.0%Health Care Equipment & Supplies 1,170,551 2.3%Health Care Providers & Services 1,157,702 2.3%Hotels, Restaurants & Leisure 1,172,938 2.4%Household Durables 727,731 1.5%Household Products 40,468 0.1%Industrial Conglomerates 200,202 0.4%
January 31, 2022 (unaudited) :: Schedule of Portfolio Investments :: UltraMid-Cap ProFund :: 159
See accompanying notes to the financial statements.
Toppan Merrill - ProFunds Public Semi-Annual Report [Funds] 01-31-2022 ED [AUX] | akiesli | 29-Mar-22 08:43 | 22-1296-2.dl | Sequence: 10CHKSUM Content: 51637 Layout: 56222 Graphics: 0 CLEAN
JOB: 22-1296-2 CYCLE#;BL#: 8; 0 TRIM: 8.25" x 10.75" AS: New York: 212-620-5600COLORS: ~note-color 2, Black, ~note-color 3 GRAPHICS: none V1.5
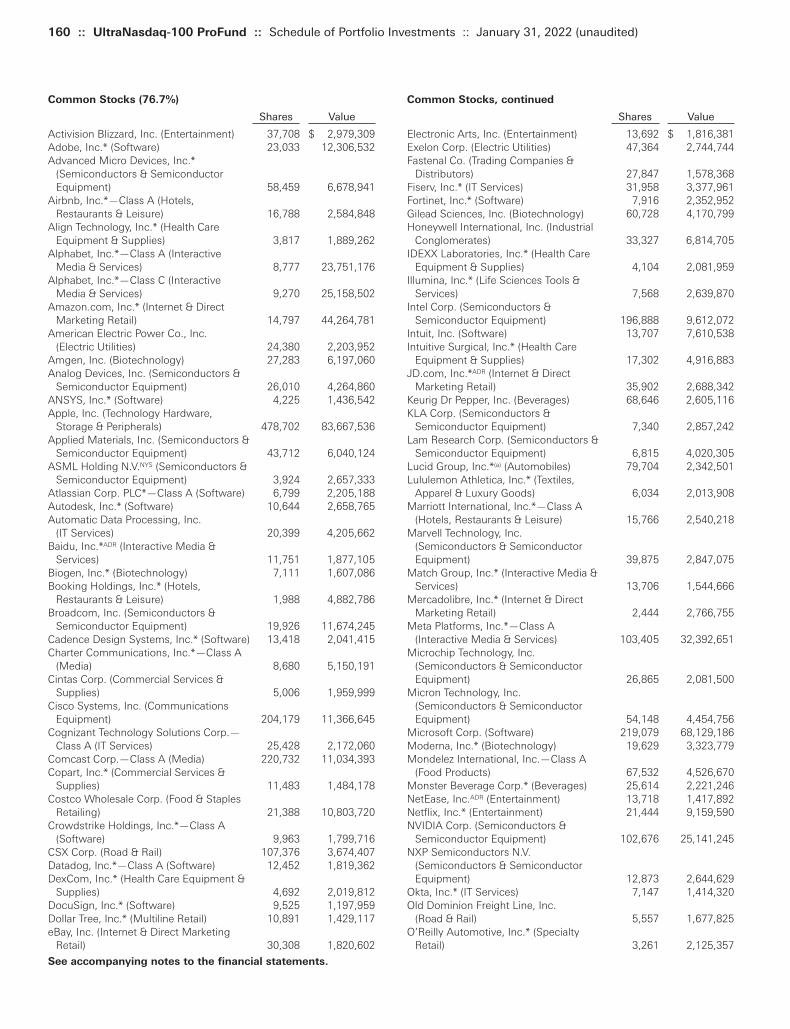
160 :: UltraNasdaq-100 ProFund :: Schedule of Portfolio Investments :: January 31, 2022 (unaudited)
Common Stocks, continued
Shares Value
Electronic Arts, Inc. (Entertainment) 13,692 $ 1,816,381Exelon Corp. (Electric Utilities) 47,364 2,744,744Fastenal Co. (Trading Companies &
Distributors) 27,847 1,578,368Fiserv, Inc.* (IT Services) 31,958 3,377,961Fortinet, Inc.* (Software) 7,916 2,352,952Gilead Sciences, Inc. (Biotechnology) 60,728 4,170,799Honeywell International, Inc. (Industrial
Conglomerates) 33,327 6,814,705IDEXX Laboratories, Inc.* (Health Care
Equipment & Supplies) 4,104 2,081,959Illumina, Inc.* (Life Sciences Tools &
Services) 7,568 2,639,870Intel Corp. (Semiconductors &
Semiconductor Equipment) 196,888 9,612,072Intuit, Inc. (Software) 13,707 7,610,538Intuitive Surgical, Inc.* (Health Care
Equipment & Supplies) 17,302 4,916,883JD.com, Inc.*ADR (Internet & Direct
Marketing Retail) 35,902 2,688,342Keurig Dr Pepper, Inc. (Beverages) 68,646 2,605,116KLA Corp. (Semiconductors &
Semiconductor Equipment) 7,340 2,857,242Lam Research Corp. (Semiconductors &
Semiconductor Equipment) 6,815 4,020,305Lucid Group, Inc.*(a) (Automobiles) 79,704 2,342,501Lululemon Athletica, Inc.* (Textiles,
Apparel & Luxury Goods) 6,034 2,013,908Marriott International, Inc.*—Class A
(Hotels, Restaurants & Leisure) 15,766 2,540,218Marvell Technology, Inc.
(Semiconductors & Semiconductor Equipment) 39,875 2,847,075
Match Group, Inc.* (Interactive Media & Services) 13,706 1,544,666
Mercadolibre, Inc.* (Internet & Direct Marketing Retail) 2,444 2,766,755
Meta Platforms, Inc.*—Class A (Interactive Media & Services) 103,405 32,392,651
Microchip Technology, Inc. (Semiconductors & Semiconductor Equipment) 26,865 2,081,500
Micron Technology, Inc. (Semiconductors & Semiconductor Equipment) 54,148 4,454,756
Microsoft Corp. (Software) 219,079 68,129,186Moderna, Inc.* (Biotechnology) 19,629 3,323,779Mondelez International, Inc.—Class A
(Food Products) 67,532 4,526,670Monster Beverage Corp.* (Beverages) 25,614 2,221,246NetEase, Inc.ADR (Entertainment) 13,718 1,417,892Netflix, Inc.* (Entertainment) 21,444 9,159,590NVIDIA Corp. (Semiconductors &
Semiconductor Equipment) 102,676 25,141,245NXP Semiconductors N.V.
(Semiconductors & Semiconductor Equipment) 12,873 2,644,629
Okta, Inc.* (IT Services) 7,147 1,414,320Old Dominion Freight Line, Inc.
(Road & Rail) 5,557 1,677,825O’Reilly Automotive, Inc.* (Specialty
Retail) 3,261 2,125,357
Common Stocks (76.7%)
Shares Value
Activision Blizzard, Inc. (Entertainment) 37,708 $ 2,979,309Adobe, Inc.* (Software) 23,033 12,306,532Advanced Micro Devices, Inc.*
(Semiconductors & Semiconductor Equipment) 58,459 6,678,941
Airbnb, Inc.*—Class A (Hotels, Restaurants & Leisure) 16,788 2,584,848
Align Technology, Inc.* (Health Care Equipment & Supplies) 3,817 1,889,262
Alphabet, Inc.*—Class A (Interactive Media & Services) 8,777 23,751,176
Alphabet, Inc.*—Class C (Interactive Media & Services) 9,270 25,158,502
Amazon.com, Inc.* (Internet & Direct Marketing Retail) 14,797 44,264,781
American Electric Power Co., Inc. (Electric Utilities) 24,380 2,203,952
Amgen, Inc. (Biotechnology) 27,283 6,197,060Analog Devices, Inc. (Semiconductors &
Semiconductor Equipment) 26,010 4,264,860ANSYS, Inc.* (Software) 4,225 1,436,542Apple, Inc. (Technology Hardware,
Storage & Peripherals) 478,702 83,667,536Applied Materials, Inc. (Semiconductors &
Semiconductor Equipment) 43,712 6,040,124ASML Holding N.V.NYS (Semiconductors &
Semiconductor Equipment) 3,924 2,657,333Atlassian Corp. PLC*—Class A (Software) 6,799 2,205,188Autodesk, Inc.* (Software) 10,644 2,658,765Automatic Data Processing, Inc.
(IT Services) 20,399 4,205,662Baidu, Inc.*ADR (Interactive Media &
Services) 11,751 1,877,105Biogen, Inc.* (Biotechnology) 7,111 1,607,086Booking Holdings, Inc.* (Hotels,
Restaurants & Leisure) 1,988 4,882,786Broadcom, Inc. (Semiconductors &
Semiconductor Equipment) 19,926 11,674,245Cadence Design Systems, Inc.* (Software) 13,418 2,041,415Charter Communications, Inc.*—Class A
(Media) 8,680 5,150,191Cintas Corp. (Commercial Services &
Supplies) 5,006 1,959,999Cisco Systems, Inc. (Communications
Equipment) 204,179 11,366,645Cognizant Technology Solutions Corp.—
Class A (IT Services) 25,428 2,172,060Comcast Corp.—Class A (Media) 220,732 11,034,393Copart, Inc.* (Commercial Services &
Supplies) 11,483 1,484,178Costco Wholesale Corp. (Food & Staples
Retailing) 21,388 10,803,720Crowdstrike Holdings, Inc.*—Class A
(Software) 9,963 1,799,716CSX Corp. (Road & Rail) 107,376 3,674,407Datadog, Inc.*—Class A (Software) 12,452 1,819,362DexCom, Inc.* (Health Care Equipment &
Supplies) 4,692 2,019,812DocuSign, Inc.* (Software) 9,525 1,197,959Dollar Tree, Inc.* (Multiline Retail) 10,891 1,429,117eBay, Inc. (Internet & Direct Marketing
Retail) 30,308 1,820,602
See accompanying notes to the financial statements.
Toppan Merrill - ProFunds Public Semi-Annual Report [Funds] 01-31-2022 ED [AUX] | akiesli | 29-Mar-22 08:43 | 22-1296-2.dl | Sequence: 11CHKSUM Content: 27482 Layout: 2395 Graphics: 0 CLEAN
JOB: 22-1296-2 CYCLE#;BL#: 8; 0 TRIM: 8.25" x 10.75" AS: New York: 212-620-5600COLORS: ~note-color 2, Black, ~note-color 3 GRAPHICS: none V1.5

Repurchase Agreements(b)(c) (15.0%)
PrincipalAmount Value
Repurchase Agreements with various counterparties, 0.00%, dated 1/31/22, due 2/1/22, total to be received $130,592,000 $130,592,000 $130,592,000
TOTAL REPURCHASE AGREEMENTS
(Cost $130,592,000) 130,592,000
Collateral for Securities Loaned(d) (0.4%)
Shares Value
BlackRock Liquidity Funds FedFund Portfolio—Institutional Shares, 0.03%(e) 3,154,935 $ 3,154,935
TOTAL COLLATERAL FOR SECURITIES LOANED
(Cost $3,154,935) 3,154,935
TOTAL INVESTMENT SECURITIES
(Cost $365,177,972)—92.1% 802,786,215Net other assets (liabilities)—7.9% 69,270,665
NET ASSETS—100.0% $872,056,880
* Non-income producing security.(a) All or part of this security was on loan as of January 31, 2022. The
total value of securities on loan as of January 31, 2022 was$3,160,985.
(b) The ProFund invests in Repurchase Agreements jointly with otherfunds in the Trust. See “Repurchase Agreements” under Note 2in the Notes to the Financial Statements to view the details ofeach individual agreement and counterparty as well as adescription of the securities subject to repurchase.
(c) A portion of these securities were held in a segregated accountfor the benefit of swap counterparties in the event of default. Asof January 31, 2022, the aggregate amount held in a segregatedaccount was $98,915,000.
(d) Securities were purchased with cash collateral held fromsecurities on loan at January 31, 2022.
(e) Rate periodically changes. Rate disclosed is the daily yield onJanuary 31, 2022.
ADR American Depositary ReceiptNYS New York Shares
Common Stocks, continued
Shares Value
PACCAR, Inc. (Machinery) 16,811 $ 1,563,255Palo Alto Networks, Inc.* (Software) 4,778 2,472,137Paychex, Inc. (IT Services) 17,458 2,055,854PayPal Holdings, Inc.* (IT Services) 56,866 9,777,539PepsiCo, Inc. (Beverages) 66,924 11,612,652Pinduoduo, Inc.*ADR (Internet & Direct
Marketing Retail) 20,119 1,203,921Qualcomm, Inc. (Semiconductors &
Semiconductor Equipment) 54,220 9,529,707Regeneron Pharmaceuticals, Inc.*
(Biotechnology) 5,119 3,115,372Ross Stores, Inc. (Specialty Retail) 17,205 1,681,789Seagen, Inc.* (Biotechnology) 8,852 1,190,683Sirius XM Holdings, Inc.(a) (Media) 193,629 1,231,480Skyworks Solutions, Inc.
(Semiconductors & Semiconductor Equipment) 8,007 1,173,186
Splunk, Inc.* (Software) 7,822 969,302Starbucks Corp. (Hotels, Restaurants &
Leisure) 56,796 5,584,183Synopsys, Inc.* (Software) 7,382 2,292,111Tesla, Inc.* (Automobiles) 29,304 27,449,642Texas Instruments, Inc.
(Semiconductors & Semiconductor Equipment) 44,709 8,024,818
The Kraft Heinz Co. (Food Products) 59,250 2,121,150T-Mobile U.S., Inc.* (Wireless
Telecommunication Services) 60,469 6,540,932VeriSign, Inc.* (IT Services) 5,377 1,167,777Verisk Analytics, Inc. (Professional
Services) 7,802 1,530,206Vertex Pharmaceuticals, Inc.*
(Biotechnology) 12,309 2,991,702Walgreens Boots Alliance, Inc. (Food &
Staples Retailing) 41,897 2,084,795Workday, Inc.*—Class A (Software) 9,343 2,363,872Xcel Energy, Inc. (Electric Utilities) 26,080 1,816,733Xilinx, Inc. (Semiconductors &
Semiconductor Equipment) 12,000 2,322,600Zoom Video Communications, Inc.*—
Class A (Software) 11,727 1,809,242Zscaler, Inc.* (Software) 6,781 1,743,463
TOTAL COMMON STOCKS
(Cost $231,431,037) 669,039,280
January 31, 2022 (unaudited) :: Schedule of Portfolio Investments :: UltraNasdaq-100 ProFund :: 161
See accompanying notes to the financial statements.
Futures Contracts Purchased
Value and Number Unrealized
of Expiration Notional Appreciation/ Contracts Date Amount (Depreciation)
E-Mini Nasdaq 100 Futures Contracts 1 3/21/22 $298,100 $(28,521)
Toppan Merrill - ProFunds Public Semi-Annual Report [Funds] 01-31-2022 ED [AUX] | akiesli | 29-Mar-22 08:43 | 22-1296-2.dl | Sequence: 12CHKSUM Content: 51867 Layout: 28542 Graphics: 0 CLEAN
JOB: 22-1296-2 CYCLE#;BL#: 8; 0 TRIM: 8.25" x 10.75" AS: New York: 212-620-5600COLORS: ~note-color 2, Black, ~note-color 3 GRAPHICS: none V1.5
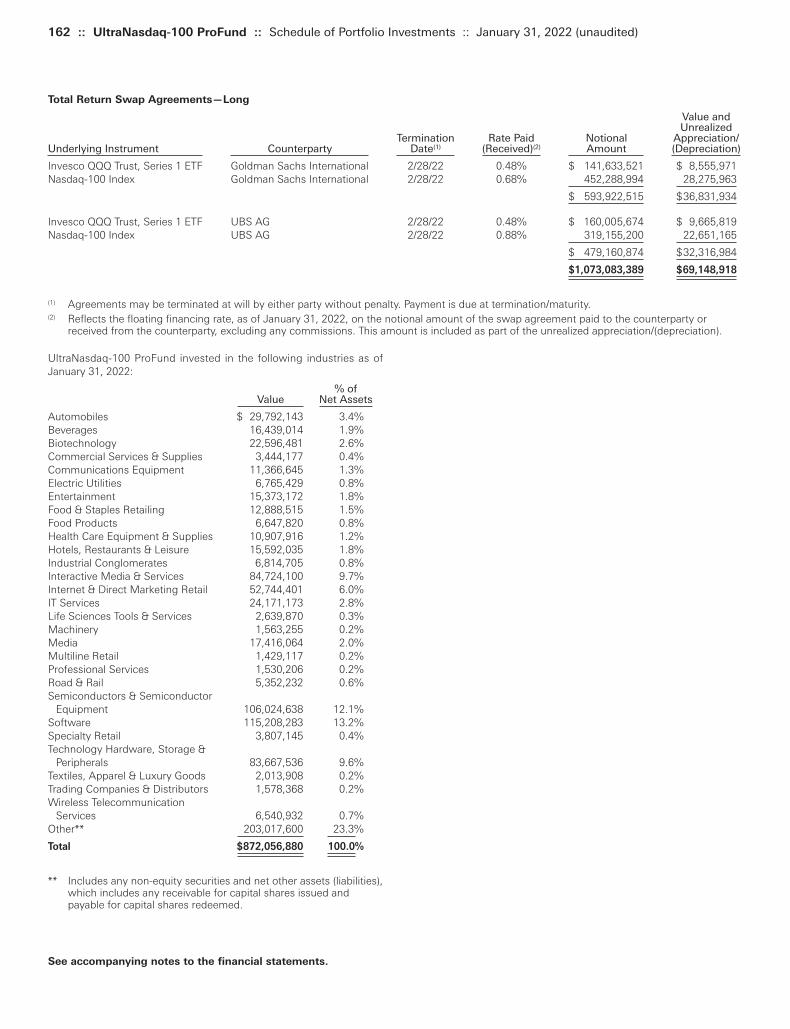
162 :: UltraNasdaq-100 ProFund :: Schedule of Portfolio Investments :: January 31, 2022 (unaudited)
See accompanying notes to the financial statements.
UltraNasdaq-100 ProFund invested in the following industries as ofJanuary 31, 2022:
% ofValue Net Assets
Automobiles $ 29,792,143 3.4%Beverages 16,439,014 1.9%Biotechnology 22,596,481 2.6%Commercial Services & Supplies 3,444,177 0.4%Communications Equipment 11,366,645 1.3%Electric Utilities 6,765,429 0.8%Entertainment 15,373,172 1.8%Food & Staples Retailing 12,888,515 1.5%Food Products 6,647,820 0.8%Health Care Equipment & Supplies 10,907,916 1.2%Hotels, Restaurants & Leisure 15,592,035 1.8%Industrial Conglomerates 6,814,705 0.8%Interactive Media & Services 84,724,100 9.7%Internet & Direct Marketing Retail 52,744,401 6.0%IT Services 24,171,173 2.8%Life Sciences Tools & Services 2,639,870 0.3%Machinery 1,563,255 0.2%Media 17,416,064 2.0%Multiline Retail 1,429,117 0.2%Professional Services 1,530,206 0.2%Road & Rail 5,352,232 0.6%Semiconductors & Semiconductor
Equipment 106,024,638 12.1%Software 115,208,283 13.2%Specialty Retail 3,807,145 0.4%Technology Hardware, Storage &
Peripherals 83,667,536 9.6%Textiles, Apparel & Luxury Goods 2,013,908 0.2%Trading Companies & Distributors 1,578,368 0.2%Wireless Telecommunication
Services 6,540,932 0.7%Other** 203,017,600 23.3%
Total $872,056,880 100.0%
** Includes any non-equity securities and net other assets (liabilities),which includes any receivable for capital shares issued andpayable for capital shares redeemed.
Total Return Swap Agreements—Long
Value and Unrealized
Termination Rate Paid Notional Appreciation/Underlying Instrument Counterparty Date(1) (Received)(2) Amount (Depreciation) Invesco QQQ Trust, Series 1 ETF Goldman Sachs International 2/28/22 0.48% $ 141,633,521 $ 8,555,971Nasdaq-100 Index Goldman Sachs International 2/28/22 0.68% 452,288,994 28,275,963
$ 593,922,515 $36,831,934
Invesco QQQ Trust, Series 1 ETF UBS AG 2/28/22 0.48% $ 160,005,674 $ 9,665,819Nasdaq-100 Index UBS AG 2/28/22 0.88% 319,155,200 22,651,165
$ 479,160,874 $32,316,984 $1,073,083,389 $69,148,918
(1) Agreements may be terminated at will by either party without penalty. Payment is due at termination/maturity.(2) Reflects the floating financing rate, as of January 31, 2022, on the notional amount of the swap agreement paid to the counterparty or
received from the counterparty, excluding any commissions. This amount is included as part of the unrealized appreciation/(depreciation).
Toppan Merrill - ProFunds Public Semi-Annual Report [Funds] 01-31-2022 ED [AUX] | akiesli | 29-Mar-22 08:43 | 22-1296-2.dl | Sequence: 13CHKSUM Content: 47561 Layout: 54287 Graphics: 0 CLEAN
JOB: 22-1296-2 CYCLE#;BL#: 8; 0 TRIM: 8.25" x 10.75" AS: New York: 212-620-5600COLORS: ~note-color 2, Black, ~note-color 3 GRAPHICS: none V1.5

(a) The ProFund invests in Repurchase Agreements jointly with otherfunds in the Trust. See “Repurchase Agreements” under Note 2in the Notes to the Financial Statements to view the details ofeach individual agreement and counterparty as well as adescription of the securities subject to repurchase.
(b) A portion of these securities were held in a segregated accountfor the benefit of swap counterparties in the event of default. Asof January 31, 2022, the aggregate amount held in a segregatedaccount was $460,000.
Repurchase Agreements(a)(b) (94.7%)
Principal Amount Value
Repurchase Agreements with various counterparties, 0.00%, dated 1/31/22, due 2/1/22, total to be received $4,036,000 $4,036,000 $4,036,000
TOTAL REPURCHASE AGREEMENTS
(Cost $4,036,000) 4,036,000
TOTAL INVESTMENT SECURITIES
(Cost $4,036,000)—94.7% 4,036,000Net other assets (liabilities)—5.3% 223,758
NET ASSETS—100.0% $4,259,758
January 31, 2022 (unaudited) :: Schedule of Portfolio Investments :: UltraShort China ProFund :: 163
See accompanying notes to the financial statements.
Total Return Swap Agreements—Short
Value and Unrealized
Termination Rate Paid Notional Appreciation/ Underlying Instrument Counterparty Date(1) (Received)(2) Amount (Depreciation) S&P/BNY Mellon China Select ADR Index (USD) Goldman Sachs International 2/28/22 0.42% $(3,917,614) $(391,558)S&P/BNY Mellon China Select ADR Index (USD) UBS AG 2/28/22 1.17% (4,382,617) (458,759)
$(8,300,231) $(850,317)
(1) Agreements may be terminated at will by either party without penalty. Payment is due at termination/maturity.(2) Reflects the floating financing rate, as of January 31, 2022, on the notional amount of the swap agreement paid to the counterparty or
received from the counterparty, excluding any commissions. This amount is included as part of the unrealized appreciation/(depreciation).
Toppan Merrill - ProFunds Public Semi-Annual Report [Funds] 01-31-2022 ED [AUX] | akiesli | 29-Mar-22 08:43 | 22-1296-2.dl | Sequence: 14CHKSUM Content: 26157 Layout: 64152 Graphics: 0 CLEAN
JOB: 22-1296-2 CYCLE#;BL#: 8; 0 TRIM: 8.25" x 10.75" AS: New York: 212-620-5600COLORS: ~note-color 2, Black, ~note-color 3 GRAPHICS: none V1.5

164 :: UltraShort Dow 30 ProFund :: Schedule of Portfolio Investments :: January 31, 2022 (unaudited)
(a) The ProFund invests in Repurchase Agreements jointly with otherfunds in the Trust. See “Repurchase Agreements” under Note 2in the Notes to the Financial Statements to view the details ofeach individual agreement and counterparty as well as adescription of the securities subject to repurchase.
(b) A portion of these securities were held in a segregated accountfor the benefit of swap counterparties in the event of default. Asof January 31, 2022, the aggregate amount held in a segregatedaccount was $733,000.
Repurchase Agreements(a)(b) (104.3%)
Principal Amount Value
Repurchase Agreements with various counterparties, 0.00%, dated 1/31/22, due 2/1/22, total to be received $2,545,000 $2,545,000 $2,545,000
TOTAL REPURCHASE AGREEMENTS
(Cost $2,545,000) 2,545,000
TOTAL INVESTMENT SECURITIES
(Cost $2,545,000)—104.3% 2,545,000Net other assets (liabilities)—(4.3)% (104,493)
NET ASSETS—100.0% $2,440,507
See accompanying notes to the financial statements.
Total Return Swap Agreements—Short
Value and Unrealized
Termination Rate Paid Notional Appreciation/ Underlying Instrument Counterparty Date(1) (Received)(2) Amount (Depreciation) Dow Jones Industrial Average Goldman Sachs International 2/28/22 (0.43)% $(2,802,679) $ (86,423)Dow Jones Industrial Average UBS AG 2/28/22 (0.28)% (2,032,800) (60,024)
$(4,835,479) $(146,447)
(1) Agreements may be terminated at will by either party without penalty. Payment is due at termination/maturity.(2) Reflects the floating financing rate, as of January 31, 2022, on the notional amount of the swap agreement paid to the counterparty or
received from the counterparty, excluding any commissions. This amount is included as part of the unrealized appreciation/(depreciation).
Toppan Merrill - ProFunds Public Semi-Annual Report [Funds] 01-31-2022 ED [AUX] | akiesli | 29-Mar-22 08:43 | 22-1296-2.dl | Sequence: 15CHKSUM Content: 64229 Layout: 7941 Graphics: 0 CLEAN
JOB: 22-1296-2 CYCLE#;BL#: 8; 0 TRIM: 8.25" x 10.75" AS: New York: 212-620-5600COLORS: ~note-color 2, Black, ~note-color 3 GRAPHICS: none V1.5
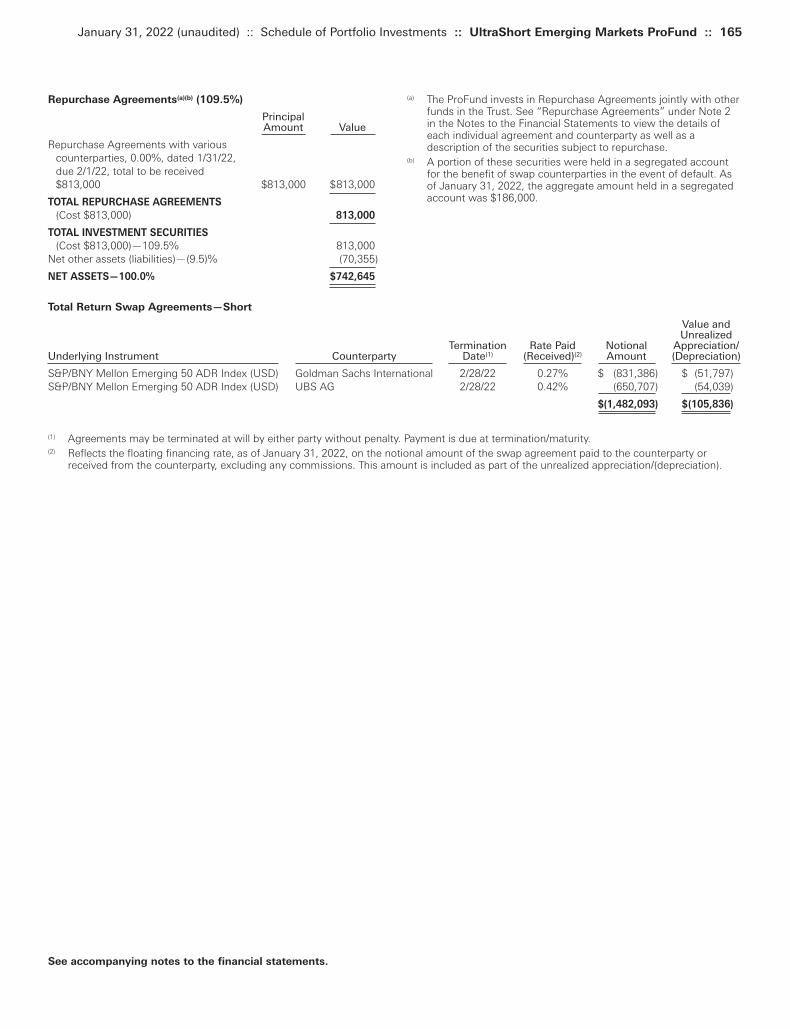
(a) The ProFund invests in Repurchase Agreements jointly with otherfunds in the Trust. See “Repurchase Agreements” under Note 2in the Notes to the Financial Statements to view the details ofeach individual agreement and counterparty as well as adescription of the securities subject to repurchase.
(b) A portion of these securities were held in a segregated accountfor the benefit of swap counterparties in the event of default. Asof January 31, 2022, the aggregate amount held in a segregatedaccount was $186,000.
Repurchase Agreements(a)(b) (109.5%)
PrincipalAmount Value
Repurchase Agreements with various counterparties, 0.00%, dated 1/31/22, due 2/1/22, total to be received $813,000 $813,000 $813,000
TOTAL REPURCHASE AGREEMENTS
(Cost $813,000) 813,000
TOTAL INVESTMENT SECURITIES
(Cost $813,000)—109.5% 813,000Net other assets (liabilities)—(9.5)% (70,355)
NET ASSETS—100.0% $742,645
January 31, 2022 (unaudited) :: Schedule of Portfolio Investments :: UltraShort Emerging Markets ProFund :: 165
See accompanying notes to the financial statements.
Total Return Swap Agreements—Short
Value and Unrealized
Termination Rate Paid Notional Appreciation/ Underlying Instrument Counterparty Date(1) (Received)(2) Amount (Depreciation) S&P/BNY Mellon Emerging 50 ADR Index (USD) Goldman Sachs International 2/28/22 0.27% $ (831,386) $ (51,797)S&P/BNY Mellon Emerging 50 ADR Index (USD) UBS AG 2/28/22 0.42% (650,707) (54,039)
$(1,482,093) $(105,836)
(1) Agreements may be terminated at will by either party without penalty. Payment is due at termination/maturity.(2) Reflects the floating financing rate, as of January 31, 2022, on the notional amount of the swap agreement paid to the counterparty or
received from the counterparty, excluding any commissions. This amount is included as part of the unrealized appreciation/(depreciation).
Toppan Merrill - ProFunds Public Semi-Annual Report [Funds] 01-31-2022 ED [AUX] | akiesli | 29-Mar-22 08:43 | 22-1296-2.dl | Sequence: 16CHKSUM Content: 45085 Layout: 55587 Graphics: 0 CLEAN
JOB: 22-1296-2 CYCLE#;BL#: 8; 0 TRIM: 8.25" x 10.75" AS: New York: 212-620-5600COLORS: ~note-color 2, Black, ~note-color 3 GRAPHICS: none V1.5

166 :: UltraShort International ProFund :: Schedule of Portfolio Investments :: January 31, 2022 (unaudited)
(a) The ProFund invests in Repurchase Agreements jointly with otherfunds in the Trust. See “Repurchase Agreements” under Note 2in the Notes to the Financial Statements to view the details ofeach individual agreement and counterparty as well as adescription of the securities subject to repurchase.
(b) A portion of these securities were held in a segregated accountfor the benefit of swap counterparties in the event of default. Asof January 31, 2022, the aggregate amount held in a segregatedaccount was $254,000.
Repurchase Agreements(a)(b) (94.2%)
Principal Amount Value
Repurchase Agreements with various counterparties, 0.00%, dated 1/31/22, due 2/1/22, total to be received $1,586,000 $1,586,000 $1,586,000
TOTAL REPURCHASE AGREEMENTS
(Cost $1,586,000) 1,586,000
TOTAL INVESTMENT SECURITIES
(Cost $1,586,000)—94.2% 1,586,000Net other assets (liabilities)—5.8% 98,171
NET ASSETS—100.0% $1,684,171
See accompanying notes to the financial statements.
Total Return Swap Agreements—Short
Value and Unrealized
Termination Rate Paid Notional Appreciation/ Underlying Instrument Counterparty Date(1) (Received)(2) Amount (Depreciation) MSCI EAFE Index Goldman Sachs International 2/28/22 0.12% $(1,086,590) $(19,340)MSCI EAFE Index UBS AG 2/28/22 0.22% (2,278,607) (39,517)
$(3,365,197) $(58,857)
(1) Agreements may be terminated at will by either party without penalty. Payment is due at termination/maturity.(2) Reflects the floating financing rate, as of January 31, 2022, on the notional amount of the swap agreement paid to the counterparty or
received from the counterparty, excluding any commissions. This amount is included as part of the unrealized appreciation/(depreciation).
Toppan Merrill - ProFunds Public Semi-Annual Report [Funds] 01-31-2022 ED [AUX] | akiesli | 29-Mar-22 08:43 | 22-1296-2.dl | Sequence: 17CHKSUM Content: 5541 Layout: 65046 Graphics: 0 CLEAN
JOB: 22-1296-2 CYCLE#;BL#: 8; 0 TRIM: 8.25" x 10.75" AS: New York: 212-620-5600COLORS: ~note-color 2, Black, ~note-color 3 GRAPHICS: none V1.5
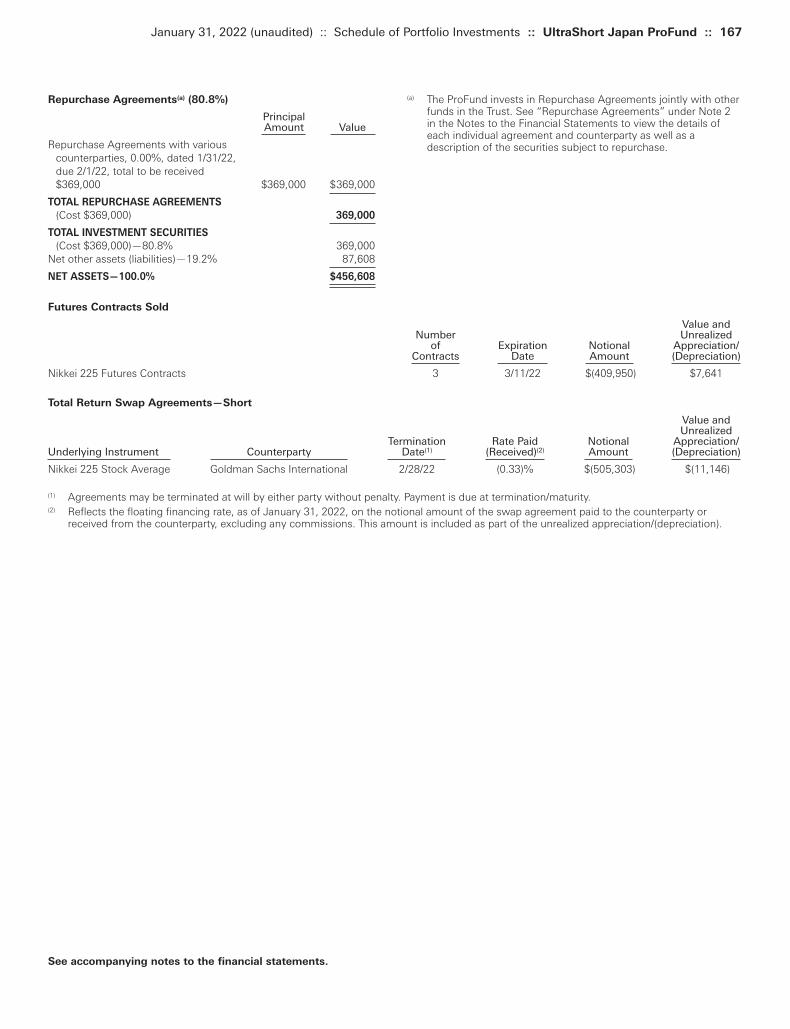
(a) The ProFund invests in Repurchase Agreements jointly with otherfunds in the Trust. See “Repurchase Agreements” under Note 2in the Notes to the Financial Statements to view the details ofeach individual agreement and counterparty as well as adescription of the securities subject to repurchase.
Repurchase Agreements(a) (80.8%)
Principal Amount Value
Repurchase Agreements with various counterparties, 0.00%, dated 1/31/22,due 2/1/22, total to be received $369,000 $369,000 $369,000
TOTAL REPURCHASE AGREEMENTS
(Cost $369,000) 369,000
TOTAL INVESTMENT SECURITIES
(Cost $369,000)—80.8% 369,000Net other assets (liabilities)—19.2% 87,608
NET ASSETS—100.0% $456,608
January 31, 2022 (unaudited) :: Schedule of Portfolio Investments :: UltraShort Japan ProFund :: 167
See accompanying notes to the financial statements.
Futures Contracts Sold
Value and Number Unrealized
of Expiration Notional Appreciation/ Contracts Date Amount (Depreciation)
Nikkei 225 Futures Contracts 3 3/11/22 $(409,950) $7,641
Total Return Swap Agreements—Short
Value and Unrealized
Termination Rate Paid Notional Appreciation/ Underlying Instrument Counterparty Date(1) (Received)(2) Amount (Depreciation) Nikkei 225 Stock Average Goldman Sachs International 2/28/22 (0.33)% $(505,303) $(11,146)
(1) Agreements may be terminated at will by either party without penalty. Payment is due at termination/maturity.(2) Reflects the floating financing rate, as of January 31, 2022, on the notional amount of the swap agreement paid to the counterparty or
received from the counterparty, excluding any commissions. This amount is included as part of the unrealized appreciation/(depreciation).
Toppan Merrill - ProFunds Public Semi-Annual Report [Funds] 01-31-2022 ED [AUX] | akiesli | 29-Mar-22 08:43 | 22-1296-2.dm | Sequence: 1CHKSUM Content: 11248 Layout: 58563 Graphics: 0 CLEAN
JOB: 22-1296-2 CYCLE#;BL#: 8; 0 TRIM: 8.25" x 10.75" AS: New York: 212-620-5600COLORS: ~note-color 2, Black, ~note-color 3 GRAPHICS: none V1.5
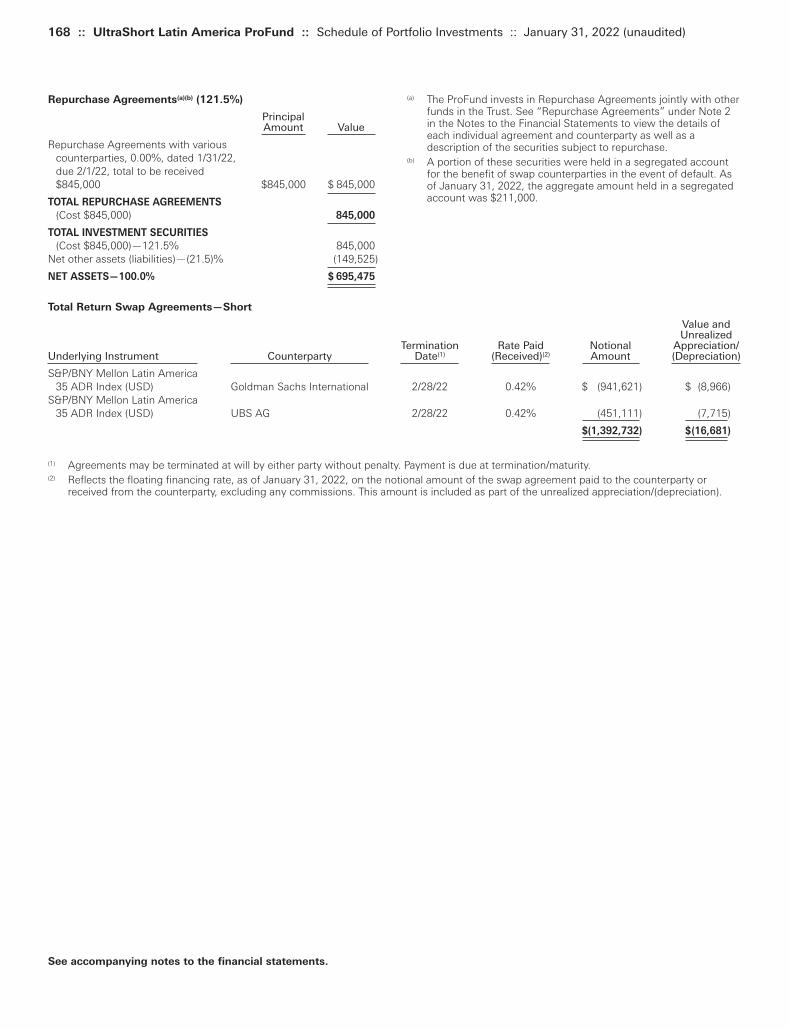
168 :: UltraShort Latin America ProFund :: Schedule of Portfolio Investments :: January 31, 2022 (unaudited)
(a) The ProFund invests in Repurchase Agreements jointly with otherfunds in the Trust. See “Repurchase Agreements” under Note 2in the Notes to the Financial Statements to view the details ofeach individual agreement and counterparty as well as adescription of the securities subject to repurchase.
(b) A portion of these securities were held in a segregated accountfor the benefit of swap counterparties in the event of default. Asof January 31, 2022, the aggregate amount held in a segregatedaccount was $211,000.
Repurchase Agreements(a)(b) (121.5%)
PrincipalAmount Value
Repurchase Agreements with various counterparties, 0.00%, dated 1/31/22, due 2/1/22, total to be received $845,000 $845,000 $ 845,000
TOTAL REPURCHASE AGREEMENTS
(Cost $845,000) 845,000
TOTAL INVESTMENT SECURITIES
(Cost $845,000)—121.5% 845,000Net other assets (liabilities)—(21.5)% (149,525)
NET ASSETS—100.0% $ 695,475
See accompanying notes to the financial statements.
Total Return Swap Agreements—Short
Value and Unrealized
Termination Rate Paid Notional Appreciation/ Underlying Instrument Counterparty Date(1) (Received)(2) Amount (Depreciation) S&P/BNY Mellon Latin America
35 ADR Index (USD) Goldman Sachs International 2/28/22 0.42% $ (941,621) $ (8,966)S&P/BNY Mellon Latin America
35 ADR Index (USD) UBS AG 2/28/22 0.42% (451,111) (7,715)
$(1,392,732) $(16,681)
(1) Agreements may be terminated at will by either party without penalty. Payment is due at termination/maturity.(2) Reflects the floating financing rate, as of January 31, 2022, on the notional amount of the swap agreement paid to the counterparty or
received from the counterparty, excluding any commissions. This amount is included as part of the unrealized appreciation/(depreciation).
Toppan Merrill - ProFunds Public Semi-Annual Report [Funds] 01-31-2022 ED [AUX] | akiesli | 29-Mar-22 08:43 | 22-1296-2.dm | Sequence: 2CHKSUM Content: 55881 Layout: 23678 Graphics: 0 CLEAN
JOB: 22-1296-2 CYCLE#;BL#: 8; 0 TRIM: 8.25" x 10.75" AS: New York: 212-620-5600COLORS: ~note-color 2, Black, ~note-color 3 GRAPHICS: none V1.5

(a) The ProFund invests in Repurchase Agreements jointly with otherfunds in the Trust. See “Repurchase Agreements” under Note 2in the Notes to the Financial Statements to view the details ofeach individual agreement and counterparty as well as adescription of the securities subject to repurchase.
(b) A portion of these securities were held in a segregated accountfor the benefit of swap counterparties in the event of default. Asof January 31, 2022, the aggregate amount held in a segregatedaccount was $467,000.
Repurchase Agreements(a)(b) (110.5%)
Principal Amount Value
Repurchase Agreements with various counterparties, 0.00%, dated 1/31/22, due 2/1/22, total to be received $1,606,000 $1,606,000 $1,606,000
TOTAL REPURCHASE AGREEMENTS
(Cost $1,606,000) 1,606,000
TOTAL INVESTMENT SECURITIES
(Cost $1,606,000)—110.5% 1,606,000Net other assets (liabilities)—(10.5)% (152,898)
NET ASSETS—100.0% $1,453,102
January 31, 2022 (unaudited) :: Schedule of Portfolio Investments :: UltraShort Mid-Cap ProFund :: 169
See accompanying notes to the financial statements.
Total Return Swap Agreements—Short
Value and Unrealized
Termination Rate Paid Notional Appreciation/ Underlying Instrument Counterparty Date(1) (Received)(2) Amount (Depreciation) S&P MidCap 400 Goldman Sachs International 2/28/22 (0.18)% $(1,902,744) $ (81,678)S&P MidCap 400 UBS AG 2/28/22 (0.08)% (1,015,939) (46,891)
$(2,918,683) $(128,569)
(1) Agreements may be terminated at will by either party without penalty. Payment is due at termination/maturity.(2) Reflects the floating financing rate, as of January 31, 2022, on the notional amount of the swap agreement paid to the counterparty or
received from the counterparty, excluding any commissions. This amount is included as part of the unrealized appreciation/(depreciation).
Toppan Merrill - ProFunds Public Semi-Annual Report [Funds] 01-31-2022 ED [AUX] | akiesli | 29-Mar-22 08:43 | 22-1296-2.dm | Sequence: 3CHKSUM Content: 43552 Layout: 4934 Graphics: 0 CLEAN
JOB: 22-1296-2 CYCLE#;BL#: 8; 0 TRIM: 8.25" x 10.75" AS: New York: 212-620-5600COLORS: ~note-color 2, Black, ~note-color 3 GRAPHICS: none V1.5

170 :: UltraShort Nasdaq-100 ProFund :: Schedule of Portfolio Investments :: January 31, 2022 (unaudited)
(a) The ProFund invests in Repurchase Agreements jointly with otherfunds in the Trust. See “Repurchase Agreements” under Note 2in the Notes to the Financial Statements to view the details ofeach individual agreement and counterparty as well as adescription of the securities subject to repurchase.
(b) A portion of these securities were held in a segregated accountfor the benefit of swap counterparties in the event of default. Asof January 31, 2022, the aggregate amount held in a segregatedaccount was $36,079,000.
Repurchase Agreements(a)(b) (102.2%)
Principal Amount Value
Repurchase Agreements with various counterparties, 0.00%, dated 1/31/22, due 2/1/22, total to be received $126,079,000 $126,079,000 $ 126,079,000
TOTAL REPURCHASE AGREEMENTS
(Cost $126,079,000) 126,079,000
TOTAL INVESTMENT SECURITIES
(Cost $126,079,000)—102.2% 126,079,000Net other assets (liabilities)—(2.2)% (2,746,429)
NET ASSETS—100.0% $123,332,571
See accompanying notes to the financial statements.
Total Return Swap Agreements—Short
Value and Unrealized
Termination Rate Paid Notional Appreciation/ Underlying Instrument Counterparty Date(1) (Received)(2) Amount (Depreciation) Nasdaq-100 Index Goldman Sachs International 2/28/22 (0.43)% $ (99,874,571) $(3,601,051)Nasdaq-100 Index UBS AG 2/28/22 (0.23)% (147,046,063) (5,316,823)
$(246,920,634) $(8,917,874)
(1) Agreements may be terminated at will by either party without penalty. Payment is due at termination/maturity.(2) Reflects the floating financing rate, as of January 31, 2022, on the notional amount of the swap agreement paid to the counterparty or
received from the counterparty, excluding any commissions. This amount is included as part of the unrealized appreciation/(depreciation).
Toppan Merrill - ProFunds Public Semi-Annual Report [Funds] 01-31-2022 ED [AUX] | akiesli | 29-Mar-22 08:43 | 22-1296-2.dm | Sequence: 4CHKSUM Content: 14921 Layout: 30954 Graphics: 0 CLEAN
JOB: 22-1296-2 CYCLE#;BL#: 8; 0 TRIM: 8.25" x 10.75" AS: New York: 212-620-5600COLORS: ~note-color 2, Black, ~note-color 3 GRAPHICS: none V1.5
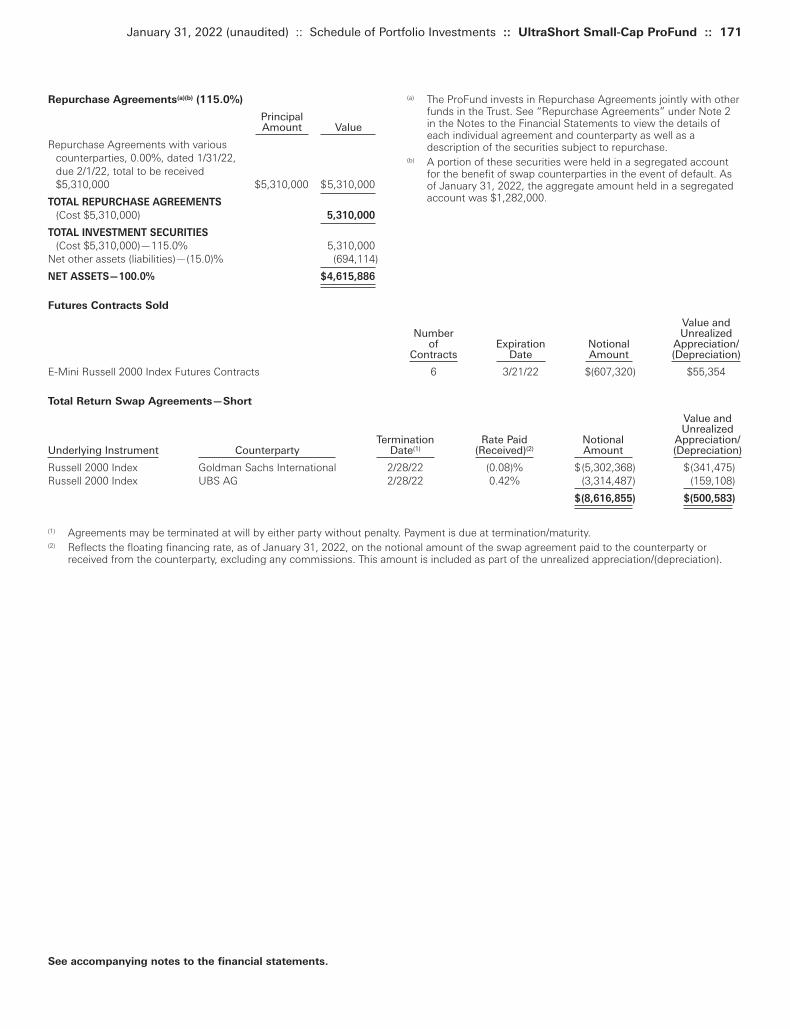
(a) The ProFund invests in Repurchase Agreements jointly with otherfunds in the Trust. See “Repurchase Agreements” under Note 2in the Notes to the Financial Statements to view the details ofeach individual agreement and counterparty as well as adescription of the securities subject to repurchase.
(b) A portion of these securities were held in a segregated accountfor the benefit of swap counterparties in the event of default. Asof January 31, 2022, the aggregate amount held in a segregatedaccount was $1,282,000.
Repurchase Agreements(a)(b) (115.0%)
PrincipalAmount Value
Repurchase Agreements with various counterparties, 0.00%, dated 1/31/22, due 2/1/22, total to be received $5,310,000 $5,310,000 $5,310,000
TOTAL REPURCHASE AGREEMENTS
(Cost $5,310,000) 5,310,000
TOTAL INVESTMENT SECURITIES
(Cost $5,310,000)—115.0% 5,310,000Net other assets (liabilities)—(15.0)% (694,114)
NET ASSETS—100.0% $4,615,886
January 31, 2022 (unaudited) :: Schedule of Portfolio Investments :: UltraShort Small-Cap ProFund :: 171
See accompanying notes to the financial statements.
Futures Contracts Sold
Value and Number Unrealized
of Expiration Notional Appreciation/Contracts Date Amount (Depreciation)
E-Mini Russell 2000 Index Futures Contracts 6 3/21/22 $(607,320) $55,354
Total Return Swap Agreements—Short
Value andUnrealized
Termination Rate Paid Notional Appreciation/Underlying Instrument Counterparty Date(1) (Received)(2) Amount (Depreciation)
Russell 2000 Index Goldman Sachs International 2/28/22 (0.08)% $(5,302,368) $(341,475)Russell 2000 Index UBS AG 2/28/22 0.42% (3,314,487) (159,108)
$(8,616,855) $(500,583)
(1) Agreements may be terminated at will by either party without penalty. Payment is due at termination/maturity.(2) Reflects the floating financing rate, as of January 31, 2022, on the notional amount of the swap agreement paid to the counterparty or
received from the counterparty, excluding any commissions. This amount is included as part of the unrealized appreciation/(depreciation).
Toppan Merrill - ProFunds Public Semi-Annual Report [Funds] 01-31-2022 ED [AUX] | akiesli | 29-Mar-22 08:43 | 22-1296-2.dm | Sequence: 5CHKSUM Content: 23979 Layout: 42888 Graphics: 0 CLEAN
JOB: 22-1296-2 CYCLE#;BL#: 8; 0 TRIM: 8.25" x 10.75" AS: New York: 212-620-5600COLORS: ~note-color 2, Black, ~note-color 3 GRAPHICS: none V1.5
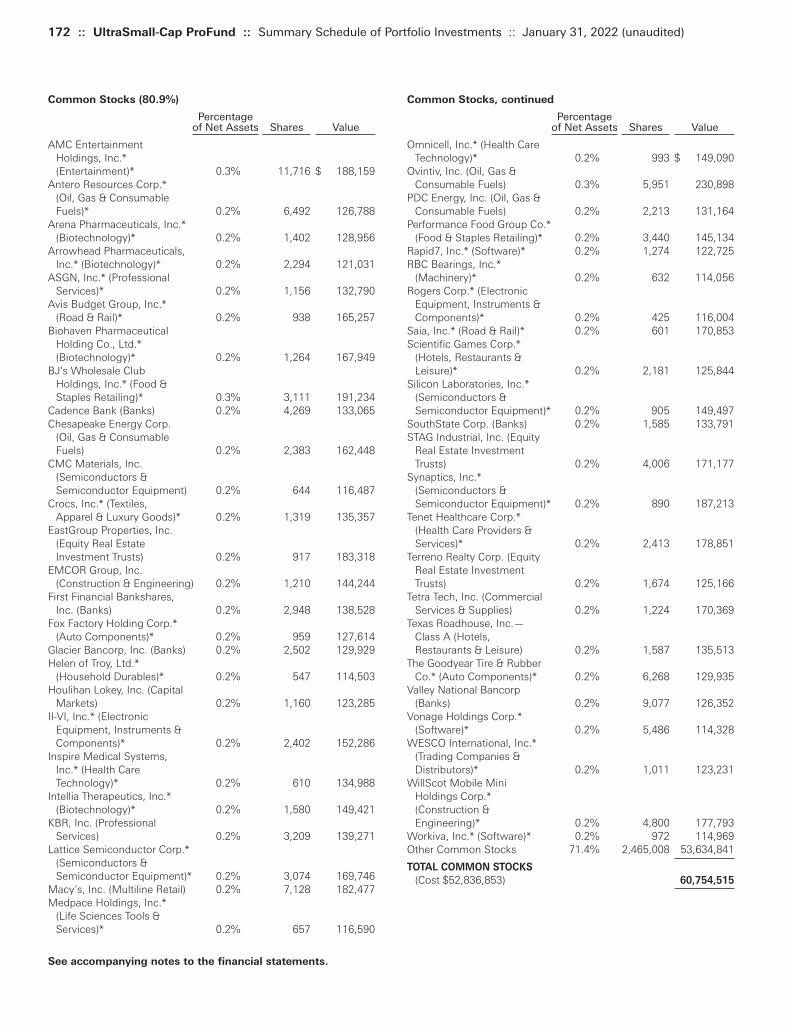
172 :: UltraSmall-Cap ProFund :: Summary Schedule of Portfolio Investments :: January 31, 2022 (unaudited)
Common Stocks, continued
Percentage of Net Assets Shares Value
Omnicell, Inc.* (Health Care Technology)* 0.2% 993 $ 149,090
Ovintiv, Inc. (Oil, Gas & Consumable Fuels) 0.3% 5,951 230,898
PDC Energy, Inc. (Oil, Gas & Consumable Fuels) 0.2% 2,213 131,164
Performance Food Group Co.* (Food & Staples Retailing)* 0.2% 3,440 145,134
Rapid7, Inc.* (Software)* 0.2% 1,274 122,725RBC Bearings, Inc.*
(Machinery)* 0.2% 632 114,056Rogers Corp.* (Electronic
Equipment, Instruments & Components)* 0.2% 425 116,004
Saia, Inc.* (Road & Rail)* 0.2% 601 170,853Scientific Games Corp.*
(Hotels, Restaurants & Leisure)* 0.2% 2,181 125,844
Silicon Laboratories, Inc.* (Semiconductors & Semiconductor Equipment)* 0.2% 905 149,497
SouthState Corp. (Banks) 0.2% 1,585 133,791STAG Industrial, Inc. (Equity
Real Estate Investment Trusts) 0.2% 4,006 171,177
Synaptics, Inc.* (Semiconductors & Semiconductor Equipment)* 0.2% 890 187,213
Tenet Healthcare Corp.* (Health Care Providers & Services)* 0.2% 2,413 178,851
Terreno Realty Corp. (Equity Real Estate Investment Trusts) 0.2% 1,674 125,166
Tetra Tech, Inc. (Commercial Services & Supplies) 0.2% 1,224 170,369
Texas Roadhouse, Inc.—Class A (Hotels, Restaurants & Leisure) 0.2% 1,587 135,513
The Goodyear Tire & Rubber Co.* (Auto Components)* 0.2% 6,268 129,935
Valley National Bancorp (Banks) 0.2% 9,077 126,352
Vonage Holdings Corp.* (Software)* 0.2% 5,486 114,328
WESCO International, Inc.* (Trading Companies & Distributors)* 0.2% 1,011 123,231
WillScot Mobile Mini Holdings Corp.* (Construction & Engineering)* 0.2% 4,800 177,793
Workiva, Inc.* (Software)* 0.2% 972 114,969Other Common Stocks 71.4% 2,465,008 53,634,841
TOTAL COMMON STOCKS
(Cost $52,836,853) 60,754,515
Common Stocks (80.9%)
Percentage of Net Assets Shares Value
AMC Entertainment Holdings, Inc.* (Entertainment)* 0.3% 11,716 $ 188,159
Antero Resources Corp.* (Oil, Gas & Consumable Fuels)* 0.2% 6,492 126,788
Arena Pharmaceuticals, Inc.* (Biotechnology)* 0.2% 1,402 128,956
Arrowhead Pharmaceuticals, Inc.* (Biotechnology)* 0.2% 2,294 121,031
ASGN, Inc.* (Professional Services)* 0.2% 1,156 132,790
Avis Budget Group, Inc.* (Road & Rail)* 0.2% 938 165,257
Biohaven Pharmaceutical Holding Co., Ltd.* (Biotechnology)* 0.2% 1,264 167,949
BJ’s Wholesale Club Holdings, Inc.* (Food & Staples Retailing)* 0.3% 3,111 191,234
Cadence Bank (Banks) 0.2% 4,269 133,065Chesapeake Energy Corp.
(Oil, Gas & Consumable Fuels) 0.2% 2,383 162,448
CMC Materials, Inc. (Semiconductors & Semiconductor Equipment) 0.2% 644 116,487
Crocs, Inc.* (Textiles, Apparel & Luxury Goods)* 0.2% 1,319 135,357
EastGroup Properties, Inc. (Equity Real Estate Investment Trusts) 0.2% 917 183,318
EMCOR Group, Inc. (Construction & Engineering) 0.2% 1,210 144,244
First Financial Bankshares, Inc. (Banks) 0.2% 2,948 138,528
Fox Factory Holding Corp.* (Auto Components)* 0.2% 959 127,614
Glacier Bancorp, Inc. (Banks) 0.2% 2,502 129,929Helen of Troy, Ltd.*
(Household Durables)* 0.2% 547 114,503Houlihan Lokey, Inc. (Capital
Markets) 0.2% 1,160 123,285II-VI, Inc.* (Electronic
Equipment, Instruments & Components)* 0.2% 2,402 152,286
Inspire Medical Systems, Inc.* (Health Care Technology)* 0.2% 610 134,988
Intellia Therapeutics, Inc.* (Biotechnology)* 0.2% 1,580 149,421
KBR, Inc. (Professional Services) 0.2% 3,209 139,271
Lattice Semiconductor Corp.* (Semiconductors & Semiconductor Equipment)* 0.2% 3,074 169,746
Macy’s, Inc. (Multiline Retail) 0.2% 7,128 182,477Medpace Holdings, Inc.*
(Life Sciences Tools & Services)* 0.2% 657 116,590
See accompanying notes to the financial statements.
Toppan Merrill - ProFunds Public Semi-Annual Report [Funds] 01-31-2022 ED [AUX] | akiesli | 29-Mar-22 08:43 | 22-1296-2.dm | Sequence: 6CHKSUM Content: 33706 Layout: 14181 Graphics: 0 CLEAN
JOB: 22-1296-2 CYCLE#;BL#: 8; 0 TRIM: 8.25" x 10.75" AS: New York: 212-620-5600COLORS: ~note-color 2, Black, ~note-color 3 GRAPHICS: none V1.5
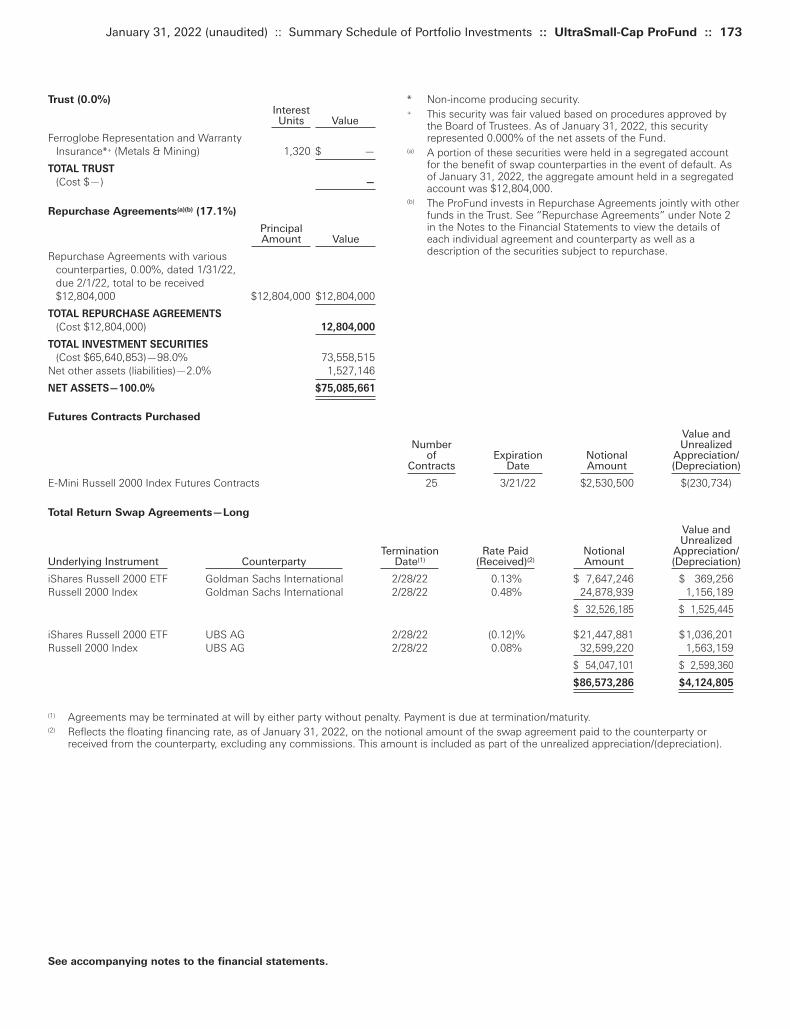
* Non-income producing security.+ This security was fair valued based on procedures approved by
the Board of Trustees. As of January 31, 2022, this securityrepresented 0.000% of the net assets of the Fund.
(a) A portion of these securities were held in a segregated accountfor the benefit of swap counterparties in the event of default. Asof January 31, 2022, the aggregate amount held in a segregatedaccount was $12,804,000.
(b) The ProFund invests in Repurchase Agreements jointly with otherfunds in the Trust. See “Repurchase Agreements” under Note 2in the Notes to the Financial Statements to view the details ofeach individual agreement and counterparty as well as adescription of the securities subject to repurchase.
Trust (0.0%)InterestUnits Value
Ferroglobe Representation and Warranty Insurance*+ (Metals & Mining) 1,320 $ —
TOTAL TRUST
(Cost $—) —
Repurchase Agreements(a)(b) (17.1%)
PrincipalAmount Value
Repurchase Agreements with various counterparties, 0.00%, dated 1/31/22, due 2/1/22, total to be received $12,804,000 $12,804,000 $12,804,000
TOTAL REPURCHASE AGREEMENTS
(Cost $12,804,000) 12,804,000
TOTAL INVESTMENT SECURITIES
(Cost $65,640,853)—98.0% 73,558,515Net other assets (liabilities)—2.0% 1,527,146
NET ASSETS—100.0% $75,085,661
January 31, 2022 (unaudited) :: Summary Schedule of Portfolio Investments :: UltraSmall-Cap ProFund :: 173
See accompanying notes to the financial statements.
Futures Contracts Purchased
Value andNumber Unrealized
of Expiration Notional Appreciation/Contracts Date Amount (Depreciation)
E-Mini Russell 2000 Index Futures Contracts 25 3/21/22 $2,530,500 $(230,734)
Total Return Swap Agreements—Long
Value and Unrealized
Termination Rate Paid Notional Appreciation/Underlying Instrument Counterparty Date(1) (Received)(2) Amount (Depreciation) iShares Russell 2000 ETF Goldman Sachs International 2/28/22 0.13% $ 7,647,246 $ 369,256Russell 2000 Index Goldman Sachs International 2/28/22 0.48% 24,878,939 1,156,189
$ 32,526,185 $ 1,525,445
iShares Russell 2000 ETF UBS AG 2/28/22 (0.12)% $21,447,881 $1,036,201Russell 2000 Index UBS AG 2/28/22 0.08% 32,599,220 1,563,159
$ 54,047,101 $ 2,599,360
$86,573,286 $4,124,805
(1) Agreements may be terminated at will by either party without penalty. Payment is due at termination/maturity.(2) Reflects the floating financing rate, as of January 31, 2022, on the notional amount of the swap agreement paid to the counterparty or
received from the counterparty, excluding any commissions. This amount is included as part of the unrealized appreciation/(depreciation).
Toppan Merrill - ProFunds Public Semi-Annual Report [Funds] 01-31-2022 ED [AUX] | akiesli | 29-Mar-22 08:43 | 22-1296-2.dm | Sequence: 7CHKSUM Content: 5473 Layout: 44327 Graphics: 0 CLEAN
JOB: 22-1296-2 CYCLE#;BL#: 8; 0 TRIM: 8.25" x 10.75" AS: New York: 212-620-5600COLORS: ~note-color 2, Black, ~note-color 3 GRAPHICS: none V1.5

174 :: UltraSmall-Cap ProFund :: Summary Schedule of Portfolio Investments :: January 31, 2022 (unaudited)
% ofValue Net Assets
Interactive Media & Services $ 221,063 0.3%Internet & Direct Marketing Retail 305,302 0.4%IT Services 1,006,315 1.3%Leisure Products 372,867 0.5%Life Sciences Tools & Services 402,353 0.5%Machinery 2,289,115 3.1%Marine 133,438 0.2%Media 674,712 0.9%Metals & Mining 775,043 1.0%Mortgage Real Estate Investment Trusts 827,767 1.1%Multiline Retail 246,858 0.3%Multi-Utilities 259,230 0.4%Oil, Gas & Consumable Fuels 2,592,116 3.5%Paper & Forest Products 84,522 0.1%Personal Products 338,200 0.5%Pharmaceuticals 916,661 1.2%Professional Services 1,065,320 1.4%Real Estate Management & Development 538,502 0.7%Road & Rail 527,330 0.7%Semiconductors & Semiconductor
Equipment 2,139,380 2.9%Software 3,394,712 4.5%Specialty Retail 1,456,237 1.9%Technology Hardware, Storage &
Peripherals 167,866 0.2%Textiles, Apparel & Luxury Goods 433,289 0.6%Thrifts & Mortgage Finance 1,158,210 1.5%Tobacco 85,656 0.1%Trading Companies & Distributors 967,443 1.3%Water Utilities 267,938 0.4%Wireless Telecommunication Services 97,730 0.1%Other** 14,331,146 19.1%
Total $75,085,661 100.0%
** Includes any non-equity securities and net other assets (liabilities),which includes any receivable for capital shares issued andpayable for capital shares redeemed.
NM Not meaningful, amount is less than 0.05%.
UltraSmall-Cap ProFund invested in the following industries as ofJanuary 31, 2022:
% ofValue Net Assets
Aerospace & Defense $ 381,512 0.5%Air Freight & Logistics 215,343 0.3%Airlines 206,502 0.3%Auto Components 844,116 1.1%Automobiles 120,435 0.2%Banks 5,532,613 7.4%Beverages 250,650 0.3%Biotechnology 4,600,685 6.1%Building Products 789,500 1.1%Capital Markets 991,208 1.3%Chemicals 1,220,593 1.6%Commercial Services & Supplies 1,062,678 1.4%Communications Equipment 525,870 0.7%Construction & Engineering 954,682 1.3%Construction Materials 117,293 0.2%Consumer Finance 477,006 0.6%Containers & Packaging 149,941 0.2%Distributors 10,826 NM
Diversified Consumer Services 447,434 0.6%Diversified Financial Services 91,147 0.1%Diversified Telecommunication Services 291,630 0.4%Electric Utilities 393,561 0.5%Electrical Equipment 575,310 0.8%Electronic Equipment, Instruments &
Components 1,340,556 1.8%Energy Equipment & Services 604,625 0.8%Entertainment 392,745 0.5%Equity Real Estate Investment Trusts 4,113,746 5.5%Food & Staples Retailing 635,344 0.9%Food Products 625,512 0.8%Gas Utilities 588,152 0.8%Health Care Equipment & Supplies 1,896,501 2.5%Health Care Providers & Services 1,625,539 2.2%Health Care Technology 721,204 1.0%Hotels, Restaurants & Leisure 1,450,502 1.9%Household Durables 1,152,438 1.5%Household Products 181,144 0.2%Independent Power and Renewable
Electricity Producers 195,608 0.3%Insurance 1,235,189 1.6%
See accompanying notes to the financial statements.
Toppan Merrill - ProFunds Public Semi-Annual Report [Funds] 01-31-2022 ED [AUX] | akiesli | 29-Mar-22 08:43 | 22-1296-2.dm | Sequence: 8CHKSUM Content: 26696 Layout: 2256 Graphics: 0 CLEAN
JOB: 22-1296-2 CYCLE#;BL#: 8; 0 TRIM: 8.25" x 10.75" AS: New York: 212-620-5600COLORS: ~HTML color, ~watermark, ~note-color 2, Black, ~note-color 3 GRAPHICS: none V1.5
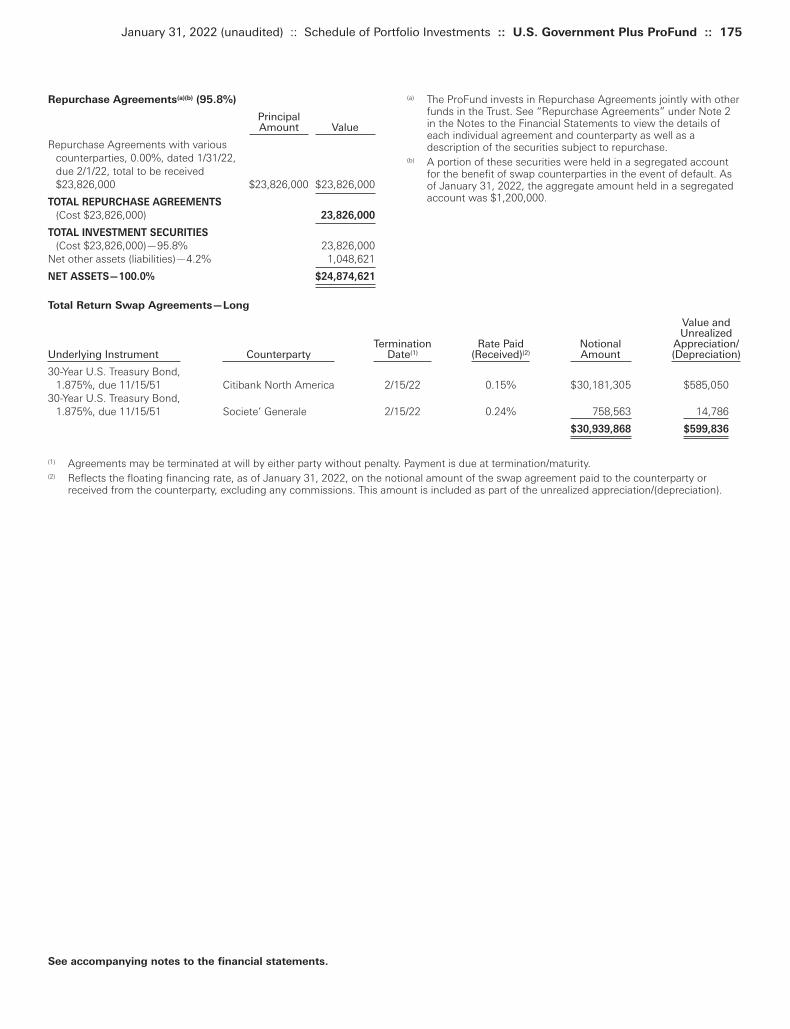
(a) The ProFund invests in Repurchase Agreements jointly with otherfunds in the Trust. See “Repurchase Agreements” under Note 2in the Notes to the Financial Statements to view the details ofeach individual agreement and counterparty as well as adescription of the securities subject to repurchase.
(b) A portion of these securities were held in a segregated accountfor the benefit of swap counterparties in the event of default. Asof January 31, 2022, the aggregate amount held in a segregatedaccount was $1,200,000.
Repurchase Agreements(a)(b) (95.8%)
Principal Amount Value
Repurchase Agreements with various counterparties, 0.00%, dated 1/31/22, due 2/1/22, total to be received $23,826,000 $23,826,000 $23,826,000
TOTAL REPURCHASE AGREEMENTS
(Cost $23,826,000) 23,826,000
TOTAL INVESTMENT SECURITIES
(Cost $23,826,000)—95.8% 23,826,000Net other assets (liabilities)—4.2% 1,048,621
NET ASSETS—100.0% $24,874,621
January 31, 2022 (unaudited) :: Schedule of Portfolio Investments :: U.S. Government Plus ProFund :: 175
See accompanying notes to the financial statements.
Total Return Swap Agreements—Long
Value and Unrealized
Termination Rate Paid Notional Appreciation/Underlying Instrument Counterparty Date(1) (Received)(2) Amount (Depreciation)
30-Year U.S. Treasury Bond, 1.875%, due 11/15/51 Citibank North America 2/15/22 0.15% $30,181,305 $585,050
30-Year U.S. Treasury Bond, 1.875%, due 11/15/51 Societe’ Generale 2/15/22 0.24% 758,563 14,786
$30,939,868 $599,836
(1) Agreements may be terminated at will by either party without penalty. Payment is due at termination/maturity.(2) Reflects the floating financing rate, as of January 31, 2022, on the notional amount of the swap agreement paid to the counterparty or
received from the counterparty, excluding any commissions. This amount is included as part of the unrealized appreciation/(depreciation).
Toppan Merrill - ProFunds Public Semi-Annual Report [Funds] 01-31-2022 ED [AUX] | akiesli | 29-Mar-22 08:43 | 22-1296-2.dm | Sequence: 9CHKSUM Content: 9179 Layout: 41749 Graphics: 0 CLEAN
JOB: 22-1296-2 CYCLE#;BL#: 8; 0 TRIM: 8.25" x 10.75" AS: New York: 212-620-5600COLORS: ~note-color 2, Black, ~note-color 3 GRAPHICS: none V1.5
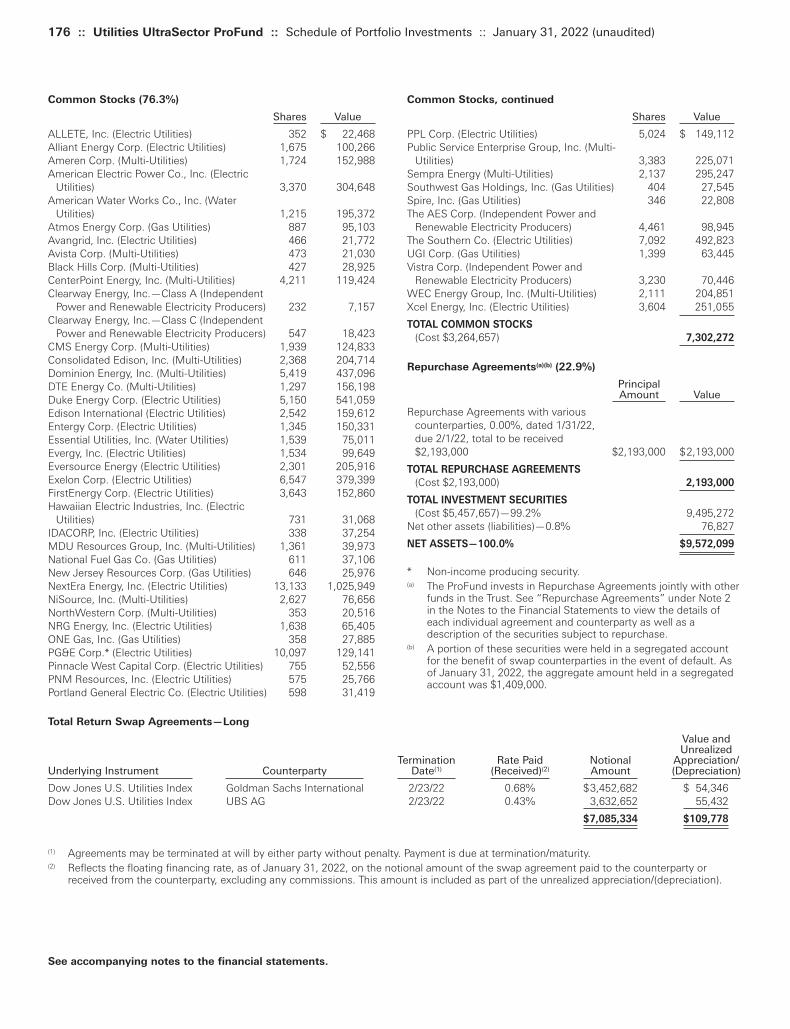
176 :: Utilities UltraSector ProFund :: Schedule of Portfolio Investments :: January 31, 2022 (unaudited)
Common Stocks, continued
Shares Value PPL Corp. (Electric Utilities) 5,024 $ 149,112Public Service Enterprise Group, Inc. (Multi-
Utilities) 3,383 225,071Sempra Energy (Multi-Utilities) 2,137 295,247Southwest Gas Holdings, Inc. (Gas Utilities) 404 27,545Spire, Inc. (Gas Utilities) 346 22,808The AES Corp. (Independent Power and
Renewable Electricity Producers) 4,461 98,945The Southern Co. (Electric Utilities) 7,092 492,823UGI Corp. (Gas Utilities) 1,399 63,445Vistra Corp. (Independent Power and
Renewable Electricity Producers) 3,230 70,446WEC Energy Group, Inc. (Multi-Utilities) 2,111 204,851Xcel Energy, Inc. (Electric Utilities) 3,604 251,055
TOTAL COMMON STOCKS
(Cost $3,264,657) 7,302,272
Repurchase Agreements(a)(b) (22.9%)
Principal Amount Value
Repurchase Agreements with various counterparties, 0.00%, dated 1/31/22, due 2/1/22, total to be received $2,193,000 $2,193,000 $2,193,000
TOTAL REPURCHASE AGREEMENTS
(Cost $2,193,000) 2,193,000
TOTAL INVESTMENT SECURITIES
(Cost $5,457,657)—99.2% 9,495,272Net other assets (liabilities)—0.8% 76,827
NET ASSETS—100.0% $9,572,099
* Non-income producing security.(a) The ProFund invests in Repurchase Agreements jointly with other
funds in the Trust. See “Repurchase Agreements” under Note 2in the Notes to the Financial Statements to view the details ofeach individual agreement and counterparty as well as adescription of the securities subject to repurchase.
(b) A portion of these securities were held in a segregated accountfor the benefit of swap counterparties in the event of default. Asof January 31, 2022, the aggregate amount held in a segregatedaccount was $1,409,000.
Common Stocks (76.3%)
Shares Value ALLETE, Inc. (Electric Utilities) 352 $ 22,468Alliant Energy Corp. (Electric Utilities) 1,675 100,266Ameren Corp. (Multi-Utilities) 1,724 152,988American Electric Power Co., Inc. (Electric
Utilities) 3,370 304,648American Water Works Co., Inc. (Water
Utilities) 1,215 195,372Atmos Energy Corp. (Gas Utilities) 887 95,103Avangrid, Inc. (Electric Utilities) 466 21,772Avista Corp. (Multi-Utilities) 473 21,030Black Hills Corp. (Multi-Utilities) 427 28,925CenterPoint Energy, Inc. (Multi-Utilities) 4,211 119,424Clearway Energy, Inc.—Class A (Independent
Power and Renewable Electricity Producers) 232 7,157Clearway Energy, Inc.—Class C (Independent
Power and Renewable Electricity Producers) 547 18,423CMS Energy Corp. (Multi-Utilities) 1,939 124,833Consolidated Edison, Inc. (Multi-Utilities) 2,368 204,714Dominion Energy, Inc. (Multi-Utilities) 5,419 437,096DTE Energy Co. (Multi-Utilities) 1,297 156,198Duke Energy Corp. (Electric Utilities) 5,150 541,059Edison International (Electric Utilities) 2,542 159,612Entergy Corp. (Electric Utilities) 1,345 150,331Essential Utilities, Inc. (Water Utilities) 1,539 75,011Evergy, Inc. (Electric Utilities) 1,534 99,649Eversource Energy (Electric Utilities) 2,301 205,916Exelon Corp. (Electric Utilities) 6,547 379,399FirstEnergy Corp. (Electric Utilities) 3,643 152,860Hawaiian Electric Industries, Inc. (Electric
Utilities) 731 31,068IDACORP, Inc. (Electric Utilities) 338 37,254MDU Resources Group, Inc. (Multi-Utilities) 1,361 39,973National Fuel Gas Co. (Gas Utilities) 611 37,106New Jersey Resources Corp. (Gas Utilities) 646 25,976NextEra Energy, Inc. (Electric Utilities) 13,133 1,025,949NiSource, Inc. (Multi-Utilities) 2,627 76,656NorthWestern Corp. (Multi-Utilities) 353 20,516NRG Energy, Inc. (Electric Utilities) 1,638 65,405ONE Gas, Inc. (Gas Utilities) 358 27,885PG&E Corp.* (Electric Utilities) 10,097 129,141Pinnacle West Capital Corp. (Electric Utilities) 755 52,556PNM Resources, Inc. (Electric Utilities) 575 25,766Portland General Electric Co. (Electric Utilities) 598 31,419
See accompanying notes to the financial statements.
Total Return Swap Agreements—Long
Value and Unrealized
Termination Rate Paid Notional Appreciation/Underlying Instrument Counterparty Date(1) (Received)(2) Amount (Depreciation) Dow Jones U.S. Utilities Index Goldman Sachs International 2/23/22 0.68% $3,452,682 $ 54,346Dow Jones U.S. Utilities Index UBS AG 2/23/22 0.43% 3,632,652 55,432
$7,085,334 $109,778
(1) Agreements may be terminated at will by either party without penalty. Payment is due at termination/maturity.(2) Reflects the floating financing rate, as of January 31, 2022, on the notional amount of the swap agreement paid to the counterparty or
received from the counterparty, excluding any commissions. This amount is included as part of the unrealized appreciation/(depreciation).
Toppan Merrill - ProFunds Public Semi-Annual Report [Funds] 01-31-2022 ED [AUX] | akiesli | 29-Mar-22 08:43 | 22-1296-2.dm | Sequence: 10CHKSUM Content: 56895 Layout: 52645 Graphics: 0 CLEAN
JOB: 22-1296-2 CYCLE#;BL#: 8; 0 TRIM: 8.25" x 10.75" AS: New York: 212-620-5600COLORS: ~note-color 2, Black, ~note-color 3 GRAPHICS: none V1.5
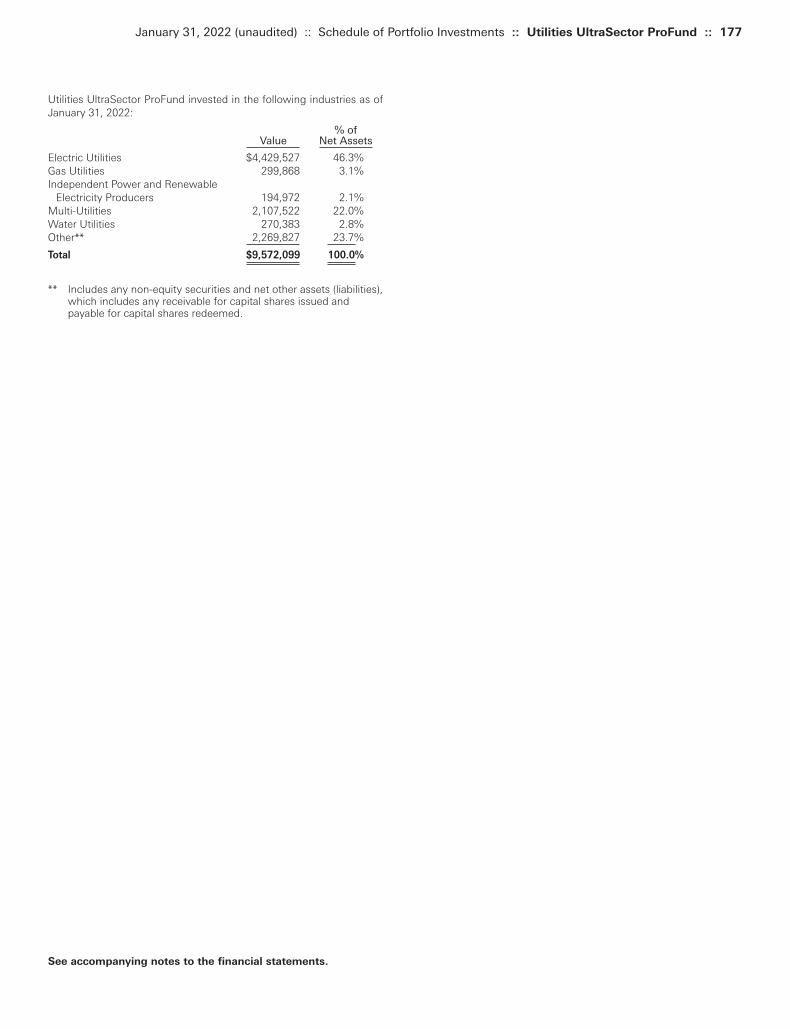
Utilities UltraSector ProFund invested in the following industries as ofJanuary 31, 2022:
% ofValue Net Assets
Electric Utilities $4,429,527 46.3%Gas Utilities 299,868 3.1%Independent Power and Renewable
Electricity Producers 194,972 2.1%Multi-Utilities 2,107,522 22.0%Water Utilities 270,383 2.8%Other** 2,269,827 23.7%
Total $9,572,099 100.0%
** Includes any non-equity securities and net other assets (liabilities),which includes any receivable for capital shares issued andpayable for capital shares redeemed.
January 31, 2022 (unaudited) :: Schedule of Portfolio Investments :: Utilities UltraSector ProFund :: 177
See accompanying notes to the financial statements.
Toppan Merrill - ProFunds Public Semi-Annual Report [Funds] 01-31-2022 ED [AUX] | akiesli | 29-Mar-22 08:43 | 22-1296-2.dm | Sequence: 11CHKSUM Content: 35031 Layout: 53112 Graphics: 0 CLEAN
JOB: 22-1296-2 CYCLE#;BL#: 8; 0 TRIM: 8.25" x 10.75" AS: New York: 212-620-5600COLORS: ~note-color 2, Black, ~note-color 3 GRAPHICS: none V1.5

This Page Intentionally Left Blank
Toppan Merrill - ProFunds Public Semi-Annual Report [Funds] 01-31-2022 ED [AUX] | akiesli | 29-Mar-22 08:43 | 22-1296-2.ea | Sequence: 1CHKSUM Content: 40530 Layout: 34000 Graphics: 0 CLEAN
JOB: 22-1296-2 CYCLE#;BL#: 8; 0 TRIM: 8.25" x 10.75" AS: New York: 212-620-5600COLORS: Black, ~note-color 2 GRAPHICS: none V1.5

Statements ofAssets and Liabilities
Toppan Merrill - ProFunds Public Semi-Annual Report [Funds] 01-31-2022 ED [AUX] | akiesli | 29-Mar-22 08:43 | 22-1296-2.ea | Sequence: 2CHKSUM Content: 26195 Layout: 44740 Graphics: 0 CLEAN
JOB: 22-1296-2 CYCLE#;BL#: 8; 0 TRIM: 8.25" x 10.75" AS: New York: 212-620-5600COLORS: Black, ~note-color 2 GRAPHICS: none V1.5

This Page Intentionally Left Blank
Toppan Merrill - ProFunds Public Semi-Annual Report [Funds] 01-31-2022 ED [AUX] | akiesli | 29-Mar-22 08:43 | 22-1296-2.ea | Sequence: 3CHKSUM Content: 40530 Layout: 34000 Graphics: 0 CLEAN
JOB: 22-1296-2 CYCLE#;BL#: 8; 0 TRIM: 8.25" x 10.75" AS: New York: 212-620-5600COLORS: Black, ~note-color 2 GRAPHICS: none V1.5

January 31, 2022 (unaudited) :: Statements of Assets and Liabilities :: 181
Access Flex Access Flex Bear High High Yield
Yield ProFund ProFund
ASSETS:Total Investment Securities, at cost $ 457,000 $ 6,951,910
Securities, at value — 4,817,695Repurchase agreements, at value 457,000 2,083,000
Total Investment Securities, at value 457,000 6,900,695Cash 84 160Segregated cash balances for futures contracts with brokers 6,105 1,018Segregated cash balances for credit default swap agreements with brokers 40,858 497,705Interest receivable — 5,414Receivable for capital shares issued 42,169 373,132Due from Advisor under a Receivables Agreement 299,294 —Due from Advisor under an expense limitation agreement 1,068 —Variation margin on futures contracts — 206Variation margin on credit default swap agreements — 15,686Prepaid expenses 4,778 24,427
TOTAL ASSETS 851,356 7,818,443
LIABILITIES:Payable for capital shares redeemed 48 15,821Variation margin on futures contracts 422 —Variation margin on credit default swap agreements 2,068 —Advisory fees payable — 8,844Management services fees payable — 1,769Administration fees payable 39 877Distribution and services fees payable—Service Class 7 2,429Transfer agency fees payable 57 1,431Fund accounting fees payable 22 487Compliance services fees payable 3 70Service fees payable 2 54Other accrued expenses 1,401 16,003
TOTAL LIABILITIES 4,069 47,785
NET ASSETS $ 847,287 $ 7,770,658
NET ASSETS CONSIST OF:Capital $ 6,239,165 $ 8,125,286Total distributable earnings (loss) (5,391,878) (354,628)
NET ASSETS $ 847,287 $ 7,770,658
NET ASSETS:Investor Class $ 839,895 $ 5,051,776Service Class 7,392 2,718,882
SHARES OF BENEFICIAL INTEREST OUTSTANDING(unlimited number of shares authorized, no par value):Investor Class 27,637 159,280Service Class 285 86,964
NET ASSET VALUE(offering and redemption price per share):Investor Class $ 30.39 $ 31.72Service Class 25.94 31.26
Amounts designated as “ – “ are $0 or have been rounded to $0.
See accompanying notes to the financial statements.
Toppan Merrill - ProFunds Public Semi-Annual Report [Funds] 01-31-2022 ED [AUX] | akiesli | 29-Mar-22 08:43 | 22-1296-2.ea | Sequence: 4CHKSUM Content: 64495 Layout: 23012 Graphics: 0 CLEAN
JOB: 22-1296-2 CYCLE#;BL#: 8; 0 TRIM: 8.25" x 10.75" AS: New York: 212-620-5600COLORS: ~note-color 2, Black, ~note-color 3 GRAPHICS: none V1.5
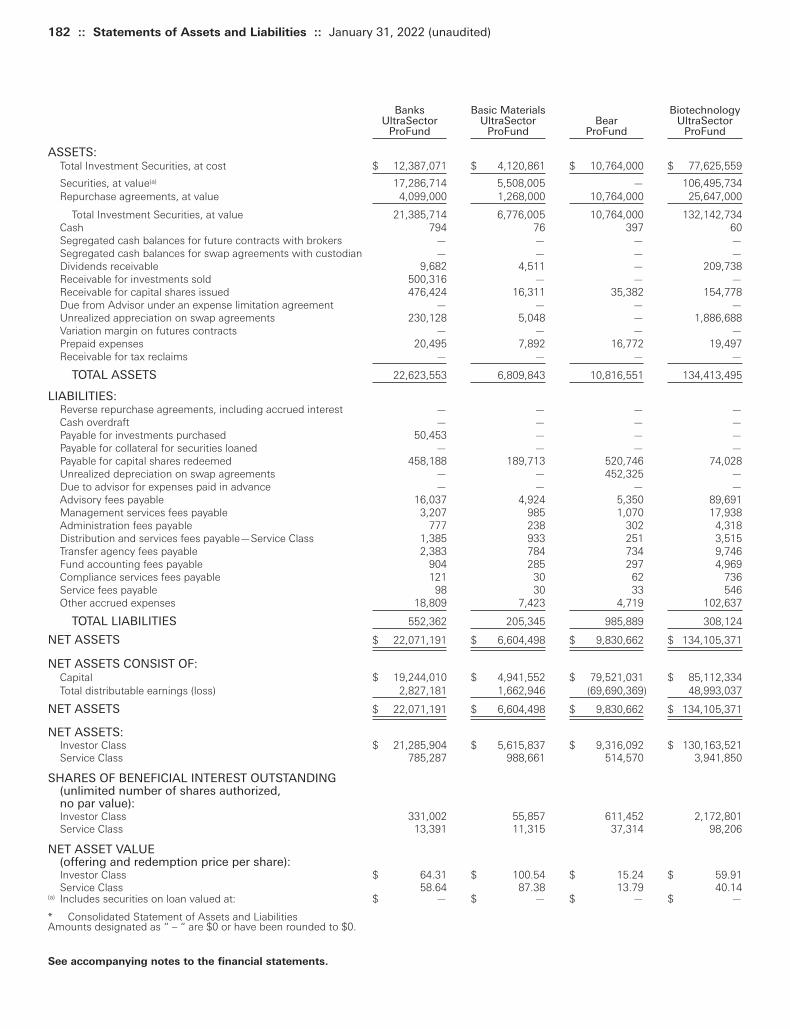
182 :: Statements of Assets and Liabilities :: January 31, 2022 (unaudited)
Banks Basic Materials Biotechnology UltraSector UltraSector Bear UltraSector
ProFund ProFund ProFund ProFund
ASSETS:Total Investment Securities, at cost $ 12,387,071 $ 4,120,861 $ 10,764,000 $ 77,625,559
Securities, at value(a) 17,286,714 5,508,005 — 106,495,734Repurchase agreements, at value 4,099,000 1,268,000 10,764,000 25,647,000
Total Investment Securities, at value 21,385,714 6,776,005 10,764,000 132,142,734Cash 794 76 397 60Segregated cash balances for future contracts with brokers — — — —Segregated cash balances for swap agreements with custodian — — — —Dividends receivable 9,682 4,511 — 209,738Receivable for investments sold 500,316 — — —Receivable for capital shares issued 476,424 16,311 35,382 154,778Due from Advisor under an expense limitation agreement — — — —Unrealized appreciation on swap agreements 230,128 5,048 — 1,886,688Variation margin on futures contracts — — — —Prepaid expenses 20,495 7,892 16,772 19,497Receivable for tax reclaims — — — —
TOTAL ASSETS 22,623,553 6,809,843 10,816,551 134,413,495
LIABILITIES:Reverse repurchase agreements, including accrued interest — — — —Cash overdraft — — — —Payable for investments purchased 50,453 — — —Payable for collateral for securities loaned — — — —Payable for capital shares redeemed 458,188 189,713 520,746 74,028Unrealized depreciation on swap agreements — — 452,325 —Due to advisor for expenses paid in advance — — — —Advisory fees payable 16,037 4,924 5,350 89,691Management services fees payable 3,207 985 1,070 17,938Administration fees payable 777 238 302 4,318Distribution and services fees payable—Service Class 1,385 933 251 3,515Transfer agency fees payable 2,383 784 734 9,746Fund accounting fees payable 904 285 297 4,969Compliance services fees payable 121 30 62 736Service fees payable 98 30 33 546Other accrued expenses 18,809 7,423 4,719 102,637
TOTAL LIABILITIES 552,362 205,345 985,889 308,124
NET ASSETS $ 22,071,191 $ 6,604,498 $ 9,830,662 $ 134,105,371
NET ASSETS CONSIST OF:Capital $ 19,244,010 $ 4,941,552 $ 79,521,031 $ 85,112,334Total distributable earnings (loss) 2,827,181 1,662,946 (69,690,369) 48,993,037
NET ASSETS $ 22,071,191 $ 6,604,498 $ 9,830,662 $ 134,105,371
NET ASSETS:Investor Class $ 21,285,904 $ 5,615,837 $ 9,316,092 $ 130,163,521Service Class 785,287 988,661 514,570 3,941,850
SHARES OF BENEFICIAL INTEREST OUTSTANDING(unlimited number of shares authorized, no par value):Investor Class 331,002 55,857 611,452 2,172,801Service Class 13,391 11,315 37,314 98,206
NET ASSET VALUE(offering and redemption price per share):Investor Class $ 64.31 $ 100.54 $ 15.24 $ 59.91Service Class 58.64 87.38 13.79 40.14
(a) Includes securities on loan valued at: $ — $ — $ — $ —
* Consolidated Statement of Assets and LiabilitiesAmounts designated as “ – “ are $0 or have been rounded to $0.
See accompanying notes to the financial statements.
Toppan Merrill - ProFunds Public Semi-Annual Report [Funds] 01-31-2022 ED [AUX] | akiesli | 29-Mar-22 08:43 | 22-1296-2.ea | Sequence: 5CHKSUM Content: 15843 Layout: 36526 Graphics: 0 CLEAN
JOB: 22-1296-2 CYCLE#;BL#: 8; 0 TRIM: 8.25" x 10.75" AS: New York: 212-620-5600COLORS: ~note-color 2, Black, ~note-color 3 GRAPHICS: none V1.5
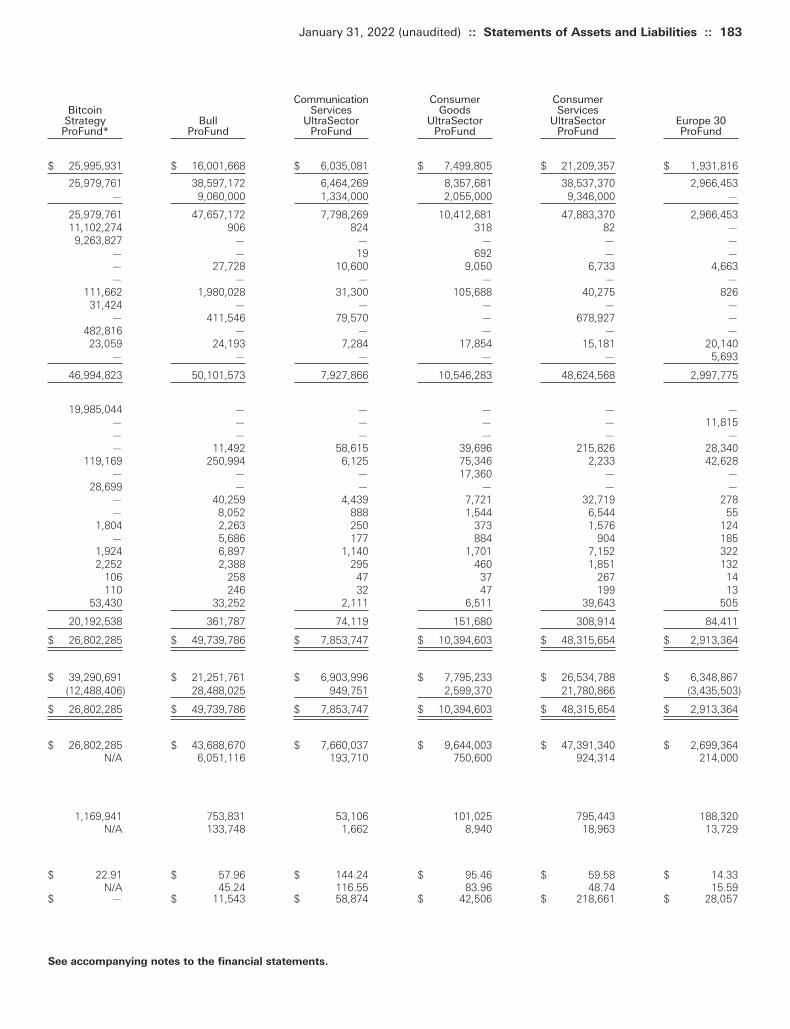
January 31, 2022 (unaudited) :: Statements of Assets and Liabilities :: 183
See accompanying notes to the financial statements.
Communication Consumer Consumer Bitcoin Services Goods Services
Strategy Bull UltraSector UltraSector UltraSector Europe 30 ProFund* ProFund ProFund ProFund ProFund ProFund
$ 25,995,931 $ 16,001,668 $ 6,035,081 $ 7,499,805 $ 21,209,357 $ 1,931,816
25,979,761 38,597,172 6,464,269 8,357,681 38,537,370 2,966,453— 9,060,000 1,334,000 2,055,000 9,346,000 —
25,979,761 47,657,172 7,798,269 10,412,681 47,883,370 2,966,45311,102,274 906 824 318 82 —
9,263,827 — — — — —— — 19 692 — —— 27,728 10,600 9,050 6,733 4,663— — — — — —
111,662 1,980,028 31,300 105,688 40,275 82631,424 — — — — —
— 411,546 79,570 — 678,927 —482,816 — — — — —23,059 24,193 7,284 17,854 15,181 20,140
— — — — — 5,693
46,994,823 50,101,573 7,927,866 10,546,283 48,624,568 2,997,775
19,985,044 — — — — —— — — — — 11,815— — — — — —— 11,492 58,615 39,696 215,826 28,340
119,169 250,994 6,125 75,346 2,233 42,628— — — 17,360 — —
28,699 — — — — —— 40,259 4,439 7,721 32,719 278— 8,052 888 1,544 6,544 55
1,804 2,263 250 373 1,576 124— 5,686 177 884 904 185
1,924 6,897 1,140 1,701 7,152 3222,252 2,388 295 460 1,851 132
106 258 47 37 267 14110 246 32 47 199 13
53,430 33,252 2,111 6,511 39,643 505
20,192,538 361,787 74,119 151,680 308,914 84,411
$ 26,802,285 $ 49,739,786 $ 7,853,747 $ 10,394,603 $ 48,315,654 $ 2,913,364
$ 39,290,691 $ 21,251,761 $ 6,903,996 $ 7,795,233 $ 26,534,788 $ 6,348,867(12,488,406) 28,488,025 949,751 2,599,370 21,780,866 (3,435,503)
$ 26,802,285 $ 49,739,786 $ 7,853,747 $ 10,394,603 $ 48,315,654 $ 2,913,364
$ 26,802,285 $ 43,688,670 $ 7,660,037 $ 9,644,003 $ 47,391,340 $ 2,699,364N/A 6,051,116 193,710 750,600 924,314 214,000
1,169,941 753,831 53,106 101,025 795,443 188,320N/A 133,748 1,662 8,940 18,963 13,729
$ 22.91 $ 57.96 $ 144.24 $ 95.46 $ 59.58 $ 14.33N/A 45.24 116.55 83.96 48.74 15.59
$ — $ 11,543 $ 58,874 $ 42,506 $ 218,661 $ 28,057
Toppan Merrill - ProFunds Public Semi-Annual Report [Funds] 01-31-2022 ED [AUX] | akiesli | 29-Mar-22 08:43 | 22-1296-2.ea | Sequence: 6CHKSUM Content: 4590 Layout: 38511 Graphics: 0 CLEAN
JOB: 22-1296-2 CYCLE#;BL#: 8; 0 TRIM: 8.25" x 10.75" AS: New York: 212-620-5600COLORS: ~HTML color, ~watermark, ~note-color 2, Black, ~note-color 3 GRAPHICS: none V1.5
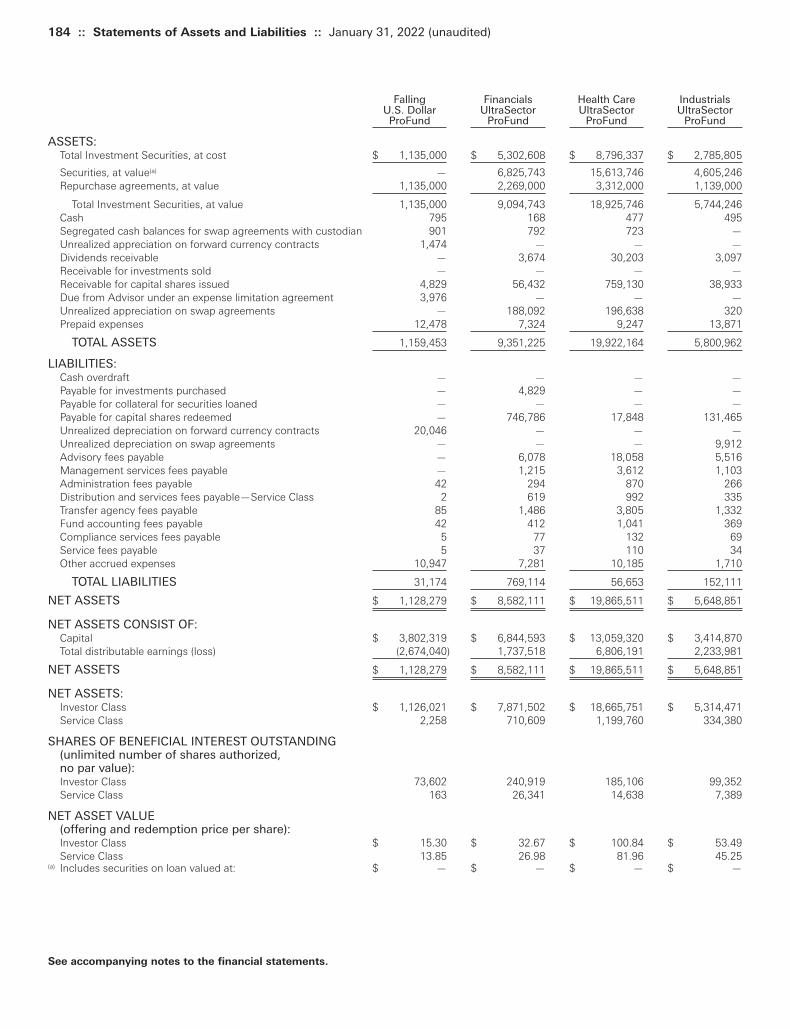
184 :: Statements of Assets and Liabilities :: January 31, 2022 (unaudited)
Falling Financials Health Care Industrials U.S. Dollar UltraSector UltraSector UltraSector ProFund ProFund ProFund ProFund
ASSETS:Total Investment Securities, at cost $ 1,135,000 $ 5,302,608 $ 8,796,337 $ 2,785,805
Securities, at value(a) — 6,825,743 15,613,746 4,605,246Repurchase agreements, at value 1,135,000 2,269,000 3,312,000 1,139,000
Total Investment Securities, at value 1,135,000 9,094,743 18,925,746 5,744,246Cash 795 168 477 495Segregated cash balances for swap agreements with custodian 901 792 723 —Unrealized appreciation on forward currency contracts 1,474 — — —Dividends receivable — 3,674 30,203 3,097Receivable for investments sold — — — —Receivable for capital shares issued 4,829 56,432 759,130 38,933Due from Advisor under an expense limitation agreement 3,976 — — —Unrealized appreciation on swap agreements — 188,092 196,638 320Prepaid expenses 12,478 7,324 9,247 13,871
TOTAL ASSETS 1,159,453 9,351,225 19,922,164 5,800,962
LIABILITIES:Cash overdraft — — — —Payable for investments purchased — 4,829 — —Payable for collateral for securities loaned — — — —Payable for capital shares redeemed — 746,786 17,848 131,465Unrealized depreciation on forward currency contracts 20,046 — — —Unrealized depreciation on swap agreements — — — 9,912Advisory fees payable — 6,078 18,058 5,516Management services fees payable — 1,215 3,612 1,103Administration fees payable 42 294 870 266Distribution and services fees payable—Service Class 2 619 992 335Transfer agency fees payable 85 1,486 3,805 1,332Fund accounting fees payable 42 412 1,041 369Compliance services fees payable 5 77 132 69Service fees payable 5 37 110 34Other accrued expenses 10,947 7,281 10,185 1,710
TOTAL LIABILITIES 31,174 769,114 56,653 152,111
NET ASSETS $ 1,128,279 $ 8,582,111 $ 19,865,511 $ 5,648,851
NET ASSETS CONSIST OF:Capital $ 3,802,319 $ 6,844,593 $ 13,059,320 $ 3,414,870Total distributable earnings (loss) (2,674,040) 1,737,518 6,806,191 2,233,981
NET ASSETS $ 1,128,279 $ 8,582,111 $ 19,865,511 $ 5,648,851
NET ASSETS:Investor Class $ 1,126,021 $ 7,871,502 $ 18,665,751 $ 5,314,471Service Class 2,258 710,609 1,199,760 334,380
SHARES OF BENEFICIAL INTEREST OUTSTANDING(unlimited number of shares authorized, no par value):Investor Class 73,602 240,919 185,106 99,352Service Class 163 26,341 14,638 7,389
NET ASSET VALUE(offering and redemption price per share):Investor Class $ 15.30 $ 32.67 $ 100.84 $ 53.49Service Class 13.85 26.98 81.96 45.25
(a) Includes securities on loan valued at: $ — $ — $ — $ —
See accompanying notes to the financial statements.
Toppan Merrill - ProFunds Public Semi-Annual Report [Funds] 01-31-2022 ED [AUX] | akiesli | 29-Mar-22 08:43 | 22-1296-2.ea | Sequence: 7CHKSUM Content: 62582 Layout: 55461 Graphics: 0 CLEAN
JOB: 22-1296-2 CYCLE#;BL#: 8; 0 TRIM: 8.25" x 10.75" AS: New York: 212-620-5600COLORS: ~note-color 2, Black, ~note-color 3 GRAPHICS: none V1.5
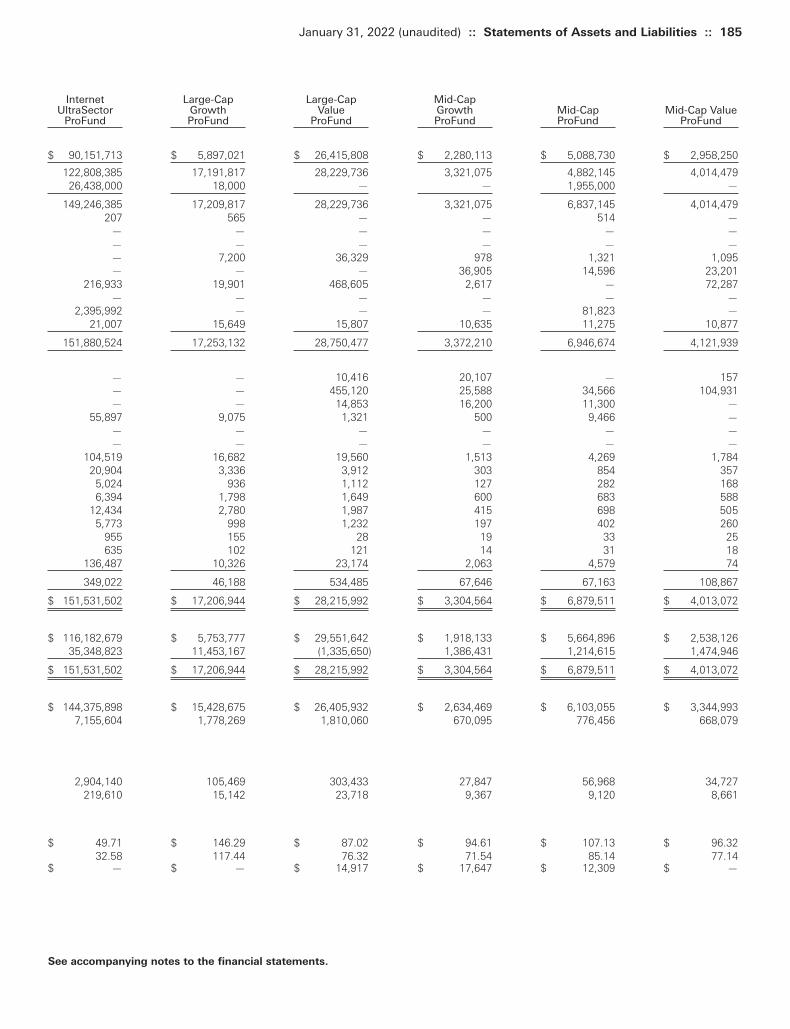
January 31, 2022 (unaudited) :: Statements of Assets and Liabilities :: 185
See accompanying notes to the financial statements.
Internet Large-Cap Large-Cap Mid-Cap UltraSector Growth Value Growth Mid-Cap Mid-Cap Value
ProFund ProFund ProFund ProFund ProFund ProFund
$ 90,151,713 $ 5,897,021 $ 26,415,808 $ 2,280,113 $ 5,088,730 $ 2,958,250
122,808,385 17,191,817 28,229,736 3,321,075 4,882,145 4,014,47926,438,000 18,000 — — 1,955,000 —
149,246,385 17,209,817 28,229,736 3,321,075 6,837,145 4,014,479207 565 — — 514 —
— — — — — —— — — — — —— 7,200 36,329 978 1,321 1,095— — — 36,905 14,596 23,201
216,933 19,901 468,605 2,617 — 72,287— — — — — —
2,395,992 — — — 81,823 —21,007 15,649 15,807 10,635 11,275 10,877
151,880,524 17,253,132 28,750,477 3,372,210 6,946,674 4,121,939
— — 10,416 20,107 — 157— — 455,120 25,588 34,566 104,931— — 14,853 16,200 11,300 —
55,897 9,075 1,321 500 9,466 —— — — — — —— — — — — —
104,519 16,682 19,560 1,513 4,269 1,78420,904 3,336 3,912 303 854 357
5,024 936 1,112 127 282 1686,394 1,798 1,649 600 683 588
12,434 2,780 1,987 415 698 5055,773 998 1,232 197 402 260
955 155 28 19 33 25635 102 121 14 31 18
136,487 10,326 23,174 2,063 4,579 74
349,022 46,188 534,485 67,646 67,163 108,867
$ 151,531,502 $ 17,206,944 $ 28,215,992 $ 3,304,564 $ 6,879,511 $ 4,013,072
$ 116,182,679 $ 5,753,777 $ 29,551,642 $ 1,918,133 $ 5,664,896 $ 2,538,12635,348,823 11,453,167 (1,335,650) 1,386,431 1,214,615 1,474,946
$ 151,531,502 $ 17,206,944 $ 28,215,992 $ 3,304,564 $ 6,879,511 $ 4,013,072
$ 144,375,898 $ 15,428,675 $ 26,405,932 $ 2,634,469 $ 6,103,055 $ 3,344,9937,155,604 1,778,269 1,810,060 670,095 776,456 668,079
2,904,140 105,469 303,433 27,847 56,968 34,727219,610 15,142 23,718 9,367 9,120 8,661
$ 49.71 $ 146.29 $ 87.02 $ 94.61 $ 107.13 $ 96.3232.58 117.44 76.32 71.54 85.14 77.14
$ — $ — $ 14,917 $ 17,647 $ 12,309 $ —
Toppan Merrill - ProFunds Public Semi-Annual Report [Funds] 01-31-2022 ED [AUX] | akiesli | 29-Mar-22 08:43 | 22-1296-2.ea | Sequence: 8CHKSUM Content: 8145 Layout: 65112 Graphics: 0 CLEAN
JOB: 22-1296-2 CYCLE#;BL#: 8; 0 TRIM: 8.25" x 10.75" AS: New York: 212-620-5600COLORS: ~HTML color, ~watermark, ~note-color 2, Black, ~note-color 3 GRAPHICS: none V1.5

186 :: Statements of Assets and Liabilities :: January 31, 2022 (unaudited)
Oil Equipment & Oil & Gas Services Pharmaceuticals
Nasdaq-100 UltraSector UltraSector UltraSector ProFund ProFund ProFund ProFund
ASSETS:Total Investment Securities, at cost $ 31,779,033 $ 26,034,512 $ 13,284,399 $ 3,949,369
Securities, at value(a) 64,581,149 28,483,644 13,695,341 3,650,244Repurchase agreements, at value 12,559,000 9,968,000 5,150,000 971,000
Total Investment Securities, at value 77,140,149 38,451,644 18,845,341 4,621,244Cash 27 87 701 605Segregated cash balances for futures contracts with brokers 33,000 — — —Segregated cash balances for swap agreements with custodian — — — —Unrealized appreciation on forward currency contracts — — — —Dividends receivable 6,927 21,762 — 7,821Receivable for investments sold — — — —Receivable for capital shares issued 264,278 907,585 179,885 33,774Due from Advisor under an expense limitation agreement — — — —Due from Advisor under a Receivables Agreement — — — —Unrealized appreciation on swap agreements 3,233,959 1,307,541 305,002 103,526Variation margin on futures contracts 18,880 — — —Prepaid expenses 19,297 10,412 12,844 9,421
TOTAL ASSETS 80,716,517 40,699,031 19,343,773 4,776,391
LIABILITIES:Payable for collateral for securities loaned 308,169 — — 16,219Payable for capital shares redeemed 2,160,506 917,556 524,338 1,067Unrealized depreciation on swap agreements — — — —Due to advisor for expenses paid in advance — — — —Advisory fees payable 88,844 22,602 11,482 2,062Management services fees payable 19,038 4,520 2,296 412Administration fees payable 5,343 1,101 560 149Distribution and services fees payable—Service Class 6,264 1,526 1,919 672Transfer agency fees payable 12,939 4,778 1,652 454Fund accounting fees payable 5,295 1,274 650 185Compliance services fees payable 697 107 68 20Service fees payable 581 139 71 19Other accrued expenses 100,118 19,874 14,691 3,328
TOTAL LIABILITIES 2,707,794 973,477 557,727 24,587
NET ASSETS $ 78,008,723 $ 39,725,554 $ 18,786,046 $ 4,751,804
NET ASSETS CONSIST OF:Capital $ 37,565,824 $ 33,731,485 $ 39,484,030 $ 4,454,281Total distributable earnings (loss) 40,442,899 5,994,069 (20,697,984) 297,523
NET ASSETS $ 78,008,723 $ 39,725,554 $ 18,786,046 $ 4,751,804
NET ASSETS:Investor Class $ 70,772,683 $ 38,085,087 $ 15,647,348 $ 3,988,232Service Class 7,236,040 1,640,467 3,138,698 763,572
SHARES OF BENEFICIAL INTEREST OUTSTANDING(unlimited number of shares authorized, no par value):Investor Class 526,669 1,296,346 210,110 137,238Service Class 68,243 65,366 47,379 31,248
NET ASSET VALUE(offering and redemption price per share):Investor Class $ 134.38 $ 29.38 $ 74.47 $ 29.06Service Class 106.03 25.10 66.25 24.44
(a) Includes securities on loan valued at: $ 308,753 $ — $ — $ 17,612
Amounts designated as “ – “ are $0 or have been rounded to $0.
See accompanying notes to the financial statements.
Toppan Merrill - ProFunds Public Semi-Annual Report [Funds] 01-31-2022 ED [AUX] | akiesli | 29-Mar-22 08:43 | 22-1296-2.ea | Sequence: 9CHKSUM Content: 16947 Layout: 23148 Graphics: 0 CLEAN
JOB: 22-1296-2 CYCLE#;BL#: 8; 0 TRIM: 8.25" x 10.75" AS: New York: 212-620-5600COLORS: ~note-color 2, Black, ~note-color 3 GRAPHICS: none V1.5
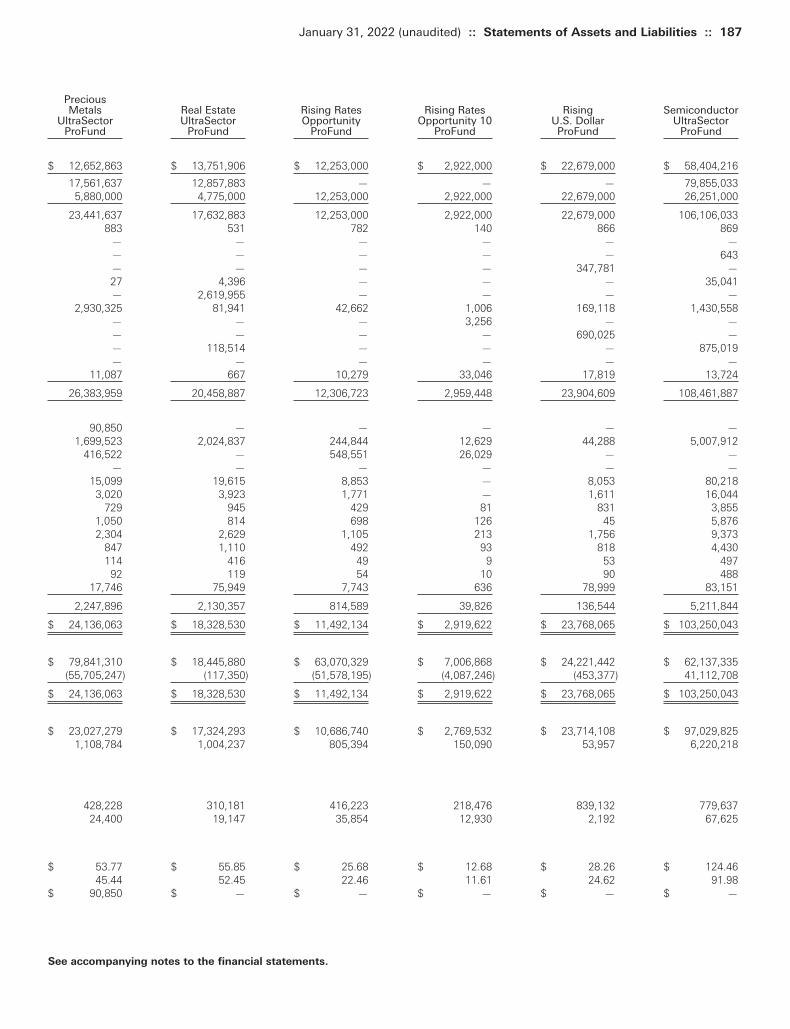
January 31, 2022 (unaudited) :: Statements of Assets and Liabilities :: 187
See accompanying notes to the financial statements.
Precious Metals Real Estate Rising Rates Rising Rates Rising Semiconductor
UltraSector UltraSector Opportunity Opportunity 10 U.S. Dollar UltraSector ProFund ProFund ProFund ProFund ProFund ProFund
$ 12,652,863 $ 13,751,906 $ 12,253,000 $ 2,922,000 $ 22,679,000 $ 58,404,216
17,561,637 12,857,883 — — — 79,855,0335,880,000 4,775,000 12,253,000 2,922,000 22,679,000 26,251,000
23,441,637 17,632,883 12,253,000 2,922,000 22,679,000 106,106,033883 531 782 140 866 869
— — — — — —— — — — — 643— — — — 347,781 —27 4,396 — — — 35,041— 2,619,955 — — — —
2,930,325 81,941 42,662 1,006 169,118 1,430,558— — — 3,256 — —— — — — 690,025 —— 118,514 — — — 875,019— — — — — —
11,087 667 10,279 33,046 17,819 13,724
26,383,959 20,458,887 12,306,723 2,959,448 23,904,609 108,461,887
90,850 — — — — —1,699,523 2,024,837 244,844 12,629 44,288 5,007,912
416,522 — 548,551 26,029 — —— — — — — —
15,099 19,615 8,853 — 8,053 80,2183,020 3,923 1,771 — 1,611 16,044
729 945 429 81 831 3,8551,050 814 698 126 45 5,8762,304 2,629 1,105 213 1,756 9,373
847 1,110 492 93 818 4,430114 416 49 9 53 497
92 119 54 10 90 48817,746 75,949 7,743 636 78,999 83,151
2,247,896 2,130,357 814,589 39,826 136,544 5,211,844
$ 24,136,063 $ 18,328,530 $ 11,492,134 $ 2,919,622 $ 23,768,065 $ 103,250,043
$ 79,841,310 $ 18,445,880 $ 63,070,329 $ 7,006,868 $ 24,221,442 $ 62,137,335(55,705,247) (117,350) (51,578,195) (4,087,246) (453,377) 41,112,708
$ 24,136,063 $ 18,328,530 $ 11,492,134 $ 2,919,622 $ 23,768,065 $ 103,250,043
$ 23,027,279 $ 17,324,293 $ 10,686,740 $ 2,769,532 $ 23,714,108 $ 97,029,8251,108,784 1,004,237 805,394 150,090 53,957 6,220,218
428,228 310,181 416,223 218,476 839,132 779,63724,400 19,147 35,854 12,930 2,192 67,625
$ 53.77 $ 55.85 $ 25.68 $ 12.68 $ 28.26 $ 124.4645.44 52.45 22.46 11.61 24.62 91.98
$ 90,850 $ — $ — $ — $ — $ —
Toppan Merrill - ProFunds Public Semi-Annual Report [Funds] 01-31-2022 ED [AUX] | akiesli | 29-Mar-22 08:43 | 22-1296-2.ea | Sequence: 10CHKSUM Content: 18997 Layout: 47931 Graphics: 0 CLEAN
JOB: 22-1296-2 CYCLE#;BL#: 8; 0 TRIM: 8.25" x 10.75" AS: New York: 212-620-5600COLORS: ~HTML color, ~watermark, ~note-color 2, Black, ~note-color 3 GRAPHICS: none V1.5
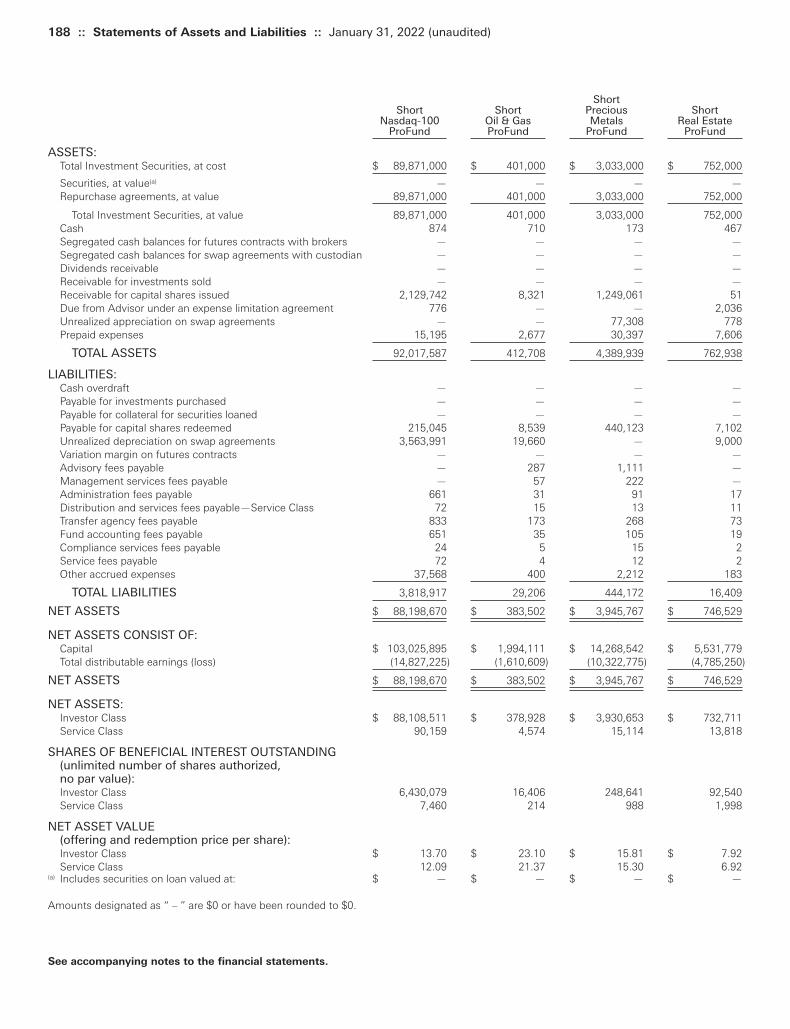
188 :: Statements of Assets and Liabilities :: January 31, 2022 (unaudited)
Short Short Short Precious Short
Nasdaq-100 Oil & Gas Metals Real Estate ProFund ProFund ProFund ProFund
ASSETS:Total Investment Securities, at cost $ 89,871,000 $ 401,000 $ 3,033,000 $ 752,000
Securities, at value(a) — — — —Repurchase agreements, at value 89,871,000 401,000 3,033,000 752,000
Total Investment Securities, at value 89,871,000 401,000 3,033,000 752,000Cash 874 710 173 467Segregated cash balances for futures contracts with brokers — — — —Segregated cash balances for swap agreements with custodian — — — —Dividends receivable — — — —Receivable for investments sold — — — —Receivable for capital shares issued 2,129,742 8,321 1,249,061 51Due from Advisor under an expense limitation agreement 776 — — 2,036Unrealized appreciation on swap agreements — — 77,308 778Prepaid expenses 15,195 2,677 30,397 7,606
TOTAL ASSETS 92,017,587 412,708 4,389,939 762,938
LIABILITIES:Cash overdraft — — — —Payable for investments purchased — — — —Payable for collateral for securities loaned — — — —Payable for capital shares redeemed 215,045 8,539 440,123 7,102Unrealized depreciation on swap agreements 3,563,991 19,660 — 9,000Variation margin on futures contracts — — — —Advisory fees payable — 287 1,111 —Management services fees payable — 57 222 —Administration fees payable 661 31 91 17Distribution and services fees payable—Service Class 72 15 13 11Transfer agency fees payable 833 173 268 73Fund accounting fees payable 651 35 105 19Compliance services fees payable 24 5 15 2Service fees payable 72 4 12 2Other accrued expenses 37,568 400 2,212 183
TOTAL LIABILITIES 3,818,917 29,206 444,172 16,409
NET ASSETS $ 88,198,670 $ 383,502 $ 3,945,767 $ 746,529
NET ASSETS CONSIST OF:Capital $ 103,025,895 $ 1,994,111 $ 14,268,542 $ 5,531,779Total distributable earnings (loss) (14,827,225) (1,610,609) (10,322,775) (4,785,250)
NET ASSETS $ 88,198,670 $ 383,502 $ 3,945,767 $ 746,529
NET ASSETS:Investor Class $ 88,108,511 $ 378,928 $ 3,930,653 $ 732,711Service Class 90,159 4,574 15,114 13,818
SHARES OF BENEFICIAL INTEREST OUTSTANDING(unlimited number of shares authorized, no par value):Investor Class 6,430,079 16,406 248,641 92,540Service Class 7,460 214 988 1,998
NET ASSET VALUE(offering and redemption price per share):Investor Class $ 13.70 $ 23.10 $ 15.81 $ 7.92Service Class 12.09 21.37 15.30 6.92
(a) Includes securities on loan valued at: $ — $ — $ — $ —
Amounts designated as “ – ” are $0 or have been rounded to $0.
See accompanying notes to the financial statements.
Toppan Merrill - ProFunds Public Semi-Annual Report [Funds] 01-31-2022 ED [AUX] | akiesli | 29-Mar-22 08:43 | 22-1296-2.ea | Sequence: 11CHKSUM Content: 41191 Layout: 59436 Graphics: 0 CLEAN
JOB: 22-1296-2 CYCLE#;BL#: 8; 0 TRIM: 8.25" x 10.75" AS: New York: 212-620-5600COLORS: ~note-color 2, Black, ~note-color 3 GRAPHICS: none V1.5

January 31, 2022 (unaudited) :: Statements of Assets and Liabilities :: 189
See accompanying notes to the financial statements.
Short Small-Cap Small-Cap Technology Telecommunications Small-Cap Growth Small-Cap Value UltraSector UltraSector ProFund ProFund ProFund ProFund ProFund ProFund
$ 1,482,000 $ 3,503,511 $ 5,576,987 $ 10,134,724 $ 39,372,191 $ 810,185
— 5,570,800 3,894,726 12,330,072 59,684,615 757,1161,482,000 — 2,615,000 — 23,975,000 276,000
1,482,000 5,570,800 6,509,726 12,330,072 83,659,615 1,033,116793 — 970 — 366 —
6,050 — — — — —958 — 159 — 729 95
— 1,097 598 4,422 4,952 3,628— 67,922 3,658 — — —
26,760 2,785 34,567 96,654 373,423 92,998— — — — — 1,671— — 130,155 — 2,451,898 —
667 9,414 13,083 12,545 16,569 11,235
1,517,228 5,652,018 6,692,916 12,443,693 86,507,552 1,142,743
— 19,825 — 25,903 — 32,152— — 2,463 111,497 — —— 1,697 12,484 — — —
237,734 8,824 306,330 10,279 1,795,077 9,95466,522 — — — — 10,269
2,940 — — — — —973 3,847 2,378 9,419 62,958 —195 769 476 1,884 12,592 —
78 216 228 530 3,032 3737 674 384 656 7,161 63
463 641 902 1,038 7,899 12977 317 852 667 3,531 5529 34 37 65 467 5
8 23 25 58 384 519,139 4,734 3,387 8,454 64,181 653
328,195 41,601 329,946 170,450 1,957,282 53,322
$ 1,189,033 $ 5,610,417 $ 6,362,970 $ 12,273,243 $ 84,550,270 $ 1,089,421
$ 16,388,407 $ 2,979,215 $ 5,761,083 $ 9,418,464 $ 44,961,211 $ 6,577,768(15,199,374) 2,631,202 601,887 2,854,779 39,589,059 (5,488,347)
$ 1,189,033 $ 5,610,417 $ 6,362,970 $ 12,273,243 $ 84,550,270 $ 1,089,421
$ 1,143,864 $ 4,859,673 $ 5,989,697 $ 11,529,579 $ 79,204,788 $ 971,99345,169 750,744 373,273 743,664 5,345,482 117,428
157,001 44,481 56,504 110,600 662,035 39,4496,570 8,835 4,320 8,872 55,888 4,965
$ 7.29 $ 109.25 $ 106.00 $ 104.25 $ 119.64 $ 24.646.88 84.97 86.41 83.82 95.65 23.65
$ — $ 1,734 $ 12,795 $ — $ — $ —
Toppan Merrill - ProFunds Public Semi-Annual Report [Funds] 01-31-2022 ED [AUX] | akiesli | 29-Mar-22 08:43 | 22-1296-2.ea | Sequence: 12CHKSUM Content: 15987 Layout: 5444 Graphics: 0 CLEAN
JOB: 22-1296-2 CYCLE#;BL#: 8; 0 TRIM: 8.25" x 10.75" AS: New York: 212-620-5600COLORS: ~HTML color, ~watermark, ~note-color 2, Black, ~note-color 3 GRAPHICS: none V1.5

190 :: Statements of Assets and Liabilities :: January 31, 2022 (unaudited)
UltraBear UltraBull UltraChina UltraDow 30 ProFund ProFund ProFund ProFund
ASSETS:Total Investment Securities, at cost $ 9,874,000 $ 73,779,746 $ 15,989,998 $ 22,952,952
Securities, at value(a) — 99,962,009 16,512,231 28,220,664Repurchase agreements, at value 9,874,000 30,137,000 2,839,000 8,559,000
Total Investment Securities, at value 9,874,000 130,099,009 19,351,231 36,779,664Cash 647 — 270 382Segregated cash balances for futures contracts with brokers — — — 140,800Segregated cash balances for swap agreements with custodian — — — 240Dividends receivable — 71,809 21 16,150Receivable for investments sold — — — —Receivable for capital shares issued 875,034 1,469,729 973,049 298,397Due from Advisor under an expense limitation agreement — — — —Unrealized appreciation on swap agreements — 6,335,470 2,202,764 1,187,131Variation margin on futures contracts — — — 32,160Prepaid expenses 31,053 38,761 25,741 11,307
TOTAL ASSETS 10,780,734 138,014,778 22,553,076 38,466,231
LIABILITIES:Cash overdraft — 7,549,810 — —Payable for investments purchased — — 1,258,248 —Payable for collateral for securities loaned — 30,198 8,000 —Payable for capital shares redeemed 799,777 800,189 1,384,428 331,823Unrealized depreciation on swap agreements 801,252 — — —Advisory fees payable 4,028 87,204 11,801 25,791Management services fees payable 806 17,441 2,360 5,158Administration fees payable 366 4,895 665 1,450Distribution and services fees payable—Service Class 11 2,719 298 854Transfer agency fees payable 645 11,760 1,380 3,528Fund accounting fees payable 361 4,980 672 1,438Compliance services fees payable 35 597 85 176Service fees payable 40 532 72 158Other accrued expenses 5,446 73,721 16,868 24,014
TOTAL LIABILITIES 1,612,767 8,584,046 2,684,877 394,390
NET ASSETS $ 9,167,967 $ 129,430,732 $ 19,868,199 $ 38,071,841
NET ASSETS CONSIST OF:Capital $ 108,112,587 $ 81,442,848 $ 49,338,733 $ 25,726,597Total distributable earnings (loss) (98,944,620) 47,987,884 (29,470,534) 12,345,244
NET ASSETS $ 9,167,967 $ 129,430,732 $ 19,868,199 $ 38,071,841
NET ASSETS:Investor Class $ 9,156,242 $ 126,774,024 $ 19,447,479 $ 37,192,767Service Class 11,725 2,656,708 420,720 879,074
SHARES OF BENEFICIAL INTEREST OUTSTANDING(unlimited number of shares authorized, no par value):Investor Class 474,706 1,143,670 3,032,377 586,065Service Class 682 30,708 74,990 16,398
NET ASSET VALUE(offering and redemption price per share):Investor Class $ 19.29 $ 110.85 $ 6.41 $ 63.46Service Class 17.19 86.52 5.61 53.61
(a) Includes securities on loan valued at: $ — $ 30,332 $ 8,560 $ —
Amounts designated as “ – “ are $0 or have been rounded to $0.
See accompanying notes to the financial statements.
Toppan Merrill - ProFunds Public Semi-Annual Report [Funds] 01-31-2022 ED [AUX] | akiesli | 29-Mar-22 08:43 | 22-1296-2.ea | Sequence: 13CHKSUM Content: 53395 Layout: 9541 Graphics: 0 CLEAN
JOB: 22-1296-2 CYCLE#;BL#: 8; 0 TRIM: 8.25" x 10.75" AS: New York: 212-620-5600COLORS: ~note-color 2, Black, ~note-color 3 GRAPHICS: none V1.5
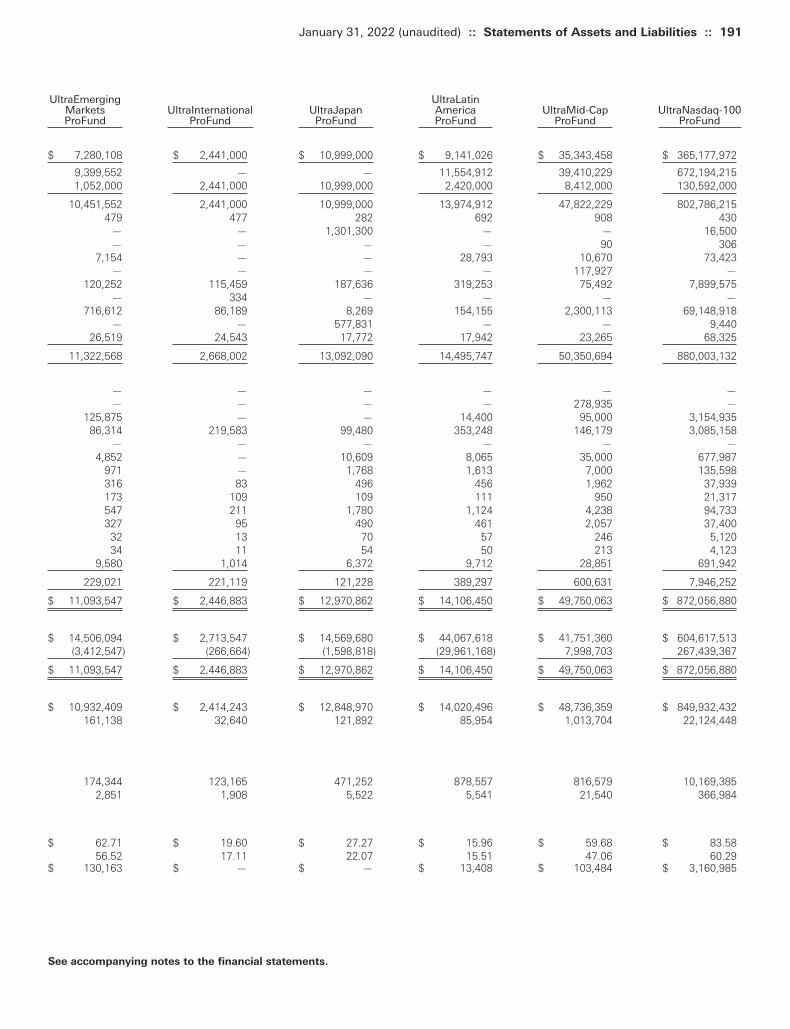
January 31, 2022 (unaudited) :: Statements of Assets and Liabilities :: 191
See accompanying notes to the financial statements.
UltraEmerging UltraLatin Markets UltraInternational UltraJapan America UltraMid-Cap UltraNasdaq-100 ProFund ProFund ProFund ProFund ProFund ProFund
$ 7,280,108 $ 2,441,000 $ 10,999,000 $ 9,141,026 $ 35,343,458 $ 365,177,972
9,399,552 — — 11,554,912 39,410,229 672,194,2151,052,000 2,441,000 10,999,000 2,420,000 8,412,000 130,592,000
10,451,552 2,441,000 10,999,000 13,974,912 47,822,229 802,786,215479 477 282 692 908 430
— — 1,301,300 — — 16,500— — — — 90 306
7,154 — — 28,793 10,670 73,423— — — — 117,927 —
120,252 115,459 187,636 319,253 75,492 7,899,575— 334 — — — —
716,612 86,189 8,269 154,155 2,300,113 69,148,918— — 577,831 — — 9,440
26,519 24,543 17,772 17,942 23,265 68,325
11,322,568 2,668,002 13,092,090 14,495,747 50,350,694 880,003,132
— — — — — —— — — — 278,935 —
125,875 — — 14,400 95,000 3,154,93586,314 219,583 99,480 353,248 146,179 3,085,158
— — — — — —4,852 — 10,609 8,065 35,000 677,987
971 — 1,768 1,613 7,000 135,598316 83 496 456 1,962 37,939173 109 109 111 950 21,317547 211 1,780 1,124 4,238 94,733327 95 490 461 2,057 37,400
32 13 70 57 246 5,12034 11 54 50 213 4,123
9,580 1,014 6,372 9,712 28,851 691,942
229,021 221,119 121,228 389,297 600,631 7,946,252
$ 11,093,547 $ 2,446,883 $ 12,970,862 $ 14,106,450 $ 49,750,063 $ 872,056,880
$ 14,506,094 $ 2,713,547 $ 14,569,680 $ 44,067,618 $ 41,751,360 $ 604,617,513(3,412,547) (266,664) (1,598,818) (29,961,168) 7,998,703 267,439,367
$ 11,093,547 $ 2,446,883 $ 12,970,862 $ 14,106,450 $ 49,750,063 $ 872,056,880
$ 10,932,409 $ 2,414,243 $ 12,848,970 $ 14,020,496 $ 48,736,359 $ 849,932,432161,138 32,640 121,892 85,954 1,013,704 22,124,448
174,344 123,165 471,252 878,557 816,579 10,169,3852,851 1,908 5,522 5,541 21,540 366,984
$ 62.71 $ 19.60 $ 27.27 $ 15.96 $ 59.68 $ 83.5856.52 17.11 22.07 15.51 47.06 60.29
$ 130,163 $ — $ — $ 13,408 $ 103,484 $ 3,160,985
Toppan Merrill - ProFunds Public Semi-Annual Report [Funds] 01-31-2022 ED [AUX] | akiesli | 29-Mar-22 08:43 | 22-1296-2.ea | Sequence: 14CHKSUM Content: 33612 Layout: 61384 Graphics: 0 CLEAN
JOB: 22-1296-2 CYCLE#;BL#: 8; 0 TRIM: 8.25" x 10.75" AS: New York: 212-620-5600COLORS: ~HTML color, ~watermark, ~note-color 2, Black, ~note-color 3 GRAPHICS: none V1.5
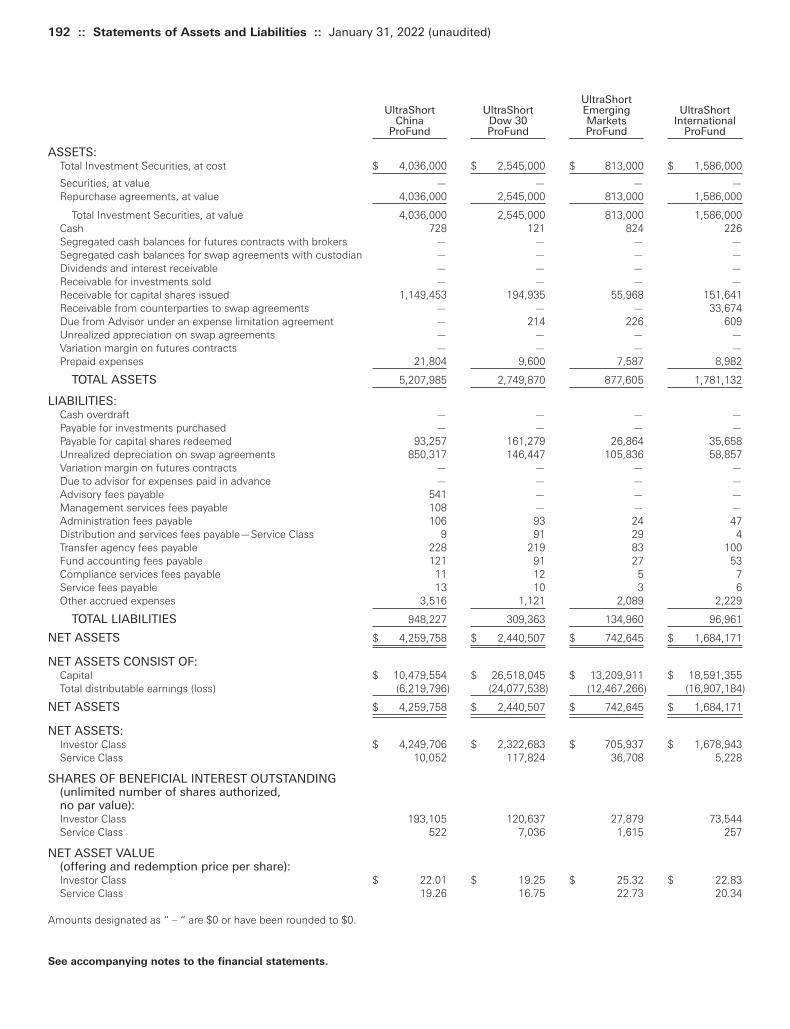
192 :: Statements of Assets and Liabilities :: January 31, 2022 (unaudited)
UltraShort UltraShort UltraShort Emerging UltraShort
China Dow 30 Markets International ProFund ProFund ProFund ProFund
ASSETS:Total Investment Securities, at cost $ 4,036,000 $ 2,545,000 $ 813,000 $ 1,586,000
Securities, at value — — — —Repurchase agreements, at value 4,036,000 2,545,000 813,000 1,586,000
Total Investment Securities, at value 4,036,000 2,545,000 813,000 1,586,000Cash 728 121 824 226Segregated cash balances for futures contracts with brokers — — — —Segregated cash balances for swap agreements with custodian — — — —Dividends and interest receivable — — — —Receivable for investments sold — — — —Receivable for capital shares issued 1,149,453 194,935 55,968 151,641Receivable from counterparties to swap agreements — — — 33,674Due from Advisor under an expense limitation agreement — 214 226 609Unrealized appreciation on swap agreements — — — —Variation margin on futures contracts — — — —Prepaid expenses 21,804 9,600 7,587 8,982
TOTAL ASSETS 5,207,985 2,749,870 877,605 1,781,132
LIABILITIES:Cash overdraft — — — —Payable for investments purchased — — — —Payable for capital shares redeemed 93,257 161,279 26,864 35,658Unrealized depreciation on swap agreements 850,317 146,447 105,836 58,857Variation margin on futures contracts — — — —Due to advisor for expenses paid in advance — — — —Advisory fees payable 541 — — —Management services fees payable 108 — — —Administration fees payable 106 93 24 47Distribution and services fees payable—Service Class 9 91 29 4Transfer agency fees payable 228 219 83 100Fund accounting fees payable 121 91 27 53Compliance services fees payable 11 12 5 7Service fees payable 13 10 3 6Other accrued expenses 3,516 1,121 2,089 2,229
TOTAL LIABILITIES 948,227 309,363 134,960 96,961
NET ASSETS $ 4,259,758 $ 2,440,507 $ 742,645 $ 1,684,171
NET ASSETS CONSIST OF:Capital $ 10,479,554 $ 26,518,045 $ 13,209,911 $ 18,591,355Total distributable earnings (loss) (6,219,796) (24,077,538) (12,467,266) (16,907,184)
NET ASSETS $ 4,259,758 $ 2,440,507 $ 742,645 $ 1,684,171
NET ASSETS:Investor Class $ 4,249,706 $ 2,322,683 $ 705,937 $ 1,678,943Service Class 10,052 117,824 36,708 5,228
SHARES OF BENEFICIAL INTEREST OUTSTANDING(unlimited number of shares authorized, no par value):Investor Class 193,105 120,637 27,879 73,544Service Class 522 7,036 1,615 257
NET ASSET VALUE(offering and redemption price per share):Investor Class $ 22.01 $ 19.25 $ 25.32 $ 22.83Service Class 19.26 16.75 22.73 20.34
Amounts designated as “ – “ are $0 or have been rounded to $0.
See accompanying notes to the financial statements.
Toppan Merrill - ProFunds Public Semi-Annual Report [Funds] 01-31-2022 ED [AUX] | akiesli | 29-Mar-22 08:43 | 22-1296-2.ea | Sequence: 15CHKSUM Content: 14278 Layout: 61791 Graphics: 0 CLEAN
JOB: 22-1296-2 CYCLE#;BL#: 8; 0 TRIM: 8.25" x 10.75" AS: New York: 212-620-5600COLORS: ~note-color 2, Black, ~note-color 3 GRAPHICS: none V1.5
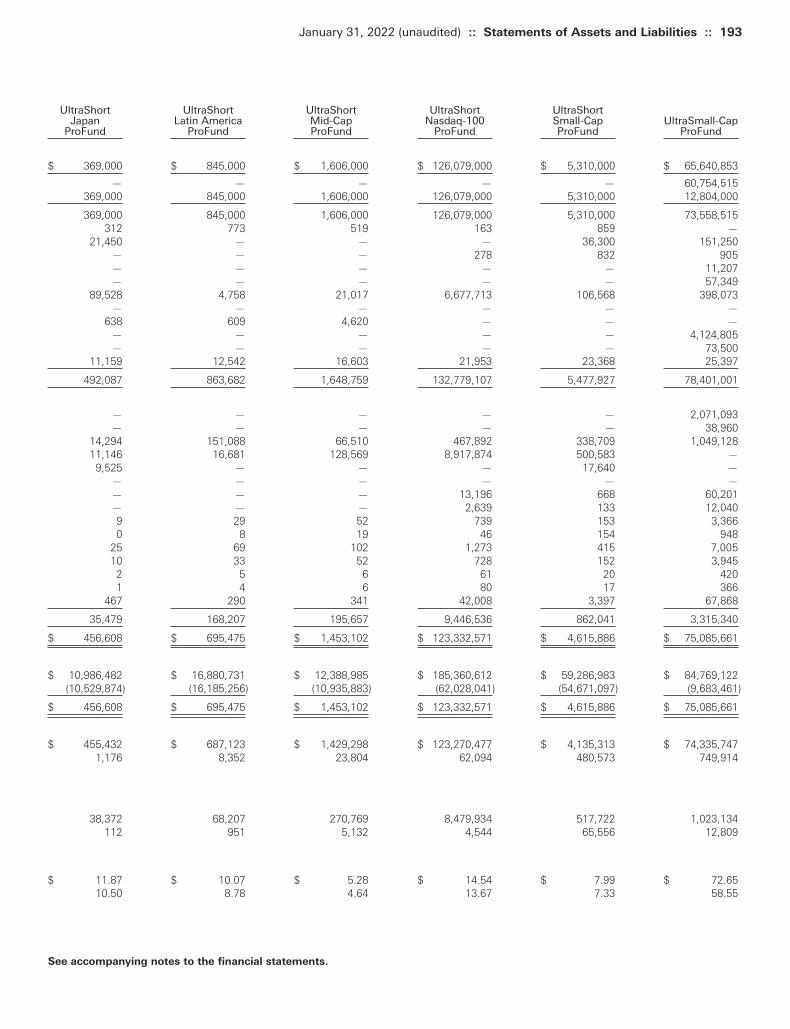
January 31, 2022 (unaudited) :: Statements of Assets and Liabilities :: 193
See accompanying notes to the financial statements.
UltraShort UltraShort UltraShort UltraShort UltraShort Japan Latin America Mid-Cap Nasdaq-100 Small-Cap UltraSmall-Cap
ProFund ProFund ProFund ProFund ProFund ProFund
$ 369,000 $ 845,000 $ 1,606,000 $ 126,079,000 $ 5,310,000 $ 65,640,853
— — — — — 60,754,515369,000 845,000 1,606,000 126,079,000 5,310,000 12,804,000
369,000 845,000 1,606,000 126,079,000 5,310,000 73,558,515312 773 519 163 859 —
21,450 — — — 36,300 151,250— — — 278 832 905— — — — — 11,207— — — — — 57,349
89,528 4,758 21,017 6,677,713 106,568 398,073— — — — — —
638 609 4,620 — — —— — — — — 4,124,805— — — — — 73,500
11,159 12,542 16,603 21,953 23,368 25,397
492,087 863,682 1,648,759 132,779,107 5,477,927 78,401,001
— — — — — 2,071,093— — — — — 38,960
14,294 151,088 66,510 467,892 338,709 1,049,12811,146 16,681 128,569 8,917,874 500,583 —
9,525 — — — 17,640 —— — — — — —— — — 13,196 668 60,201— — — 2,639 133 12,0409 29 52 739 153 3,3660 8 19 46 154 948
25 69 102 1,273 415 7,00510 33 52 728 152 3,945
2 5 6 61 20 4201 4 6 80 17 366
467 290 341 42,008 3,397 67,868
35,479 168,207 195,657 9,446,536 862,041 3,315,340
$ 456,608 $ 695,475 $ 1,453,102 $ 123,332,571 $ 4,615,886 $ 75,085,661
$ 10,986,482 $ 16,880,731 $ 12,388,985 $ 185,360,612 $ 59,286,983 $ 84,769,122(10,529,874) (16,185,256) (10,935,883) (62,028,041) (54,671,097) (9,683,461)
$ 456,608 $ 695,475 $ 1,453,102 $ 123,332,571 $ 4,615,886 $ 75,085,661
$ 455,432 $ 687,123 $ 1,429,298 $ 123,270,477 $ 4,135,313 $ 74,335,7471,176 8,352 23,804 62,094 480,573 749,914
38,372 68,207 270,769 8,479,934 517,722 1,023,134112 951 5,132 4,544 65,556 12,809
$ 11.87 $ 10.07 $ 5.28 $ 14.54 $ 7.99 $ 72.6510.50 8.78 4.64 13.67 7.33 58.55
Toppan Merrill - ProFunds Public Semi-Annual Report [Funds] 01-31-2022 ED [AUX] | akiesli | 29-Mar-22 08:43 | 22-1296-2.ea | Sequence: 16CHKSUM Content: 40964 Layout: 33481 Graphics: 0 CLEAN
JOB: 22-1296-2 CYCLE#;BL#: 8; 0 TRIM: 8.25" x 10.75" AS: New York: 212-620-5600COLORS: ~HTML color, ~watermark, ~note-color 2, Black, ~note-color 3 GRAPHICS: none V1.5
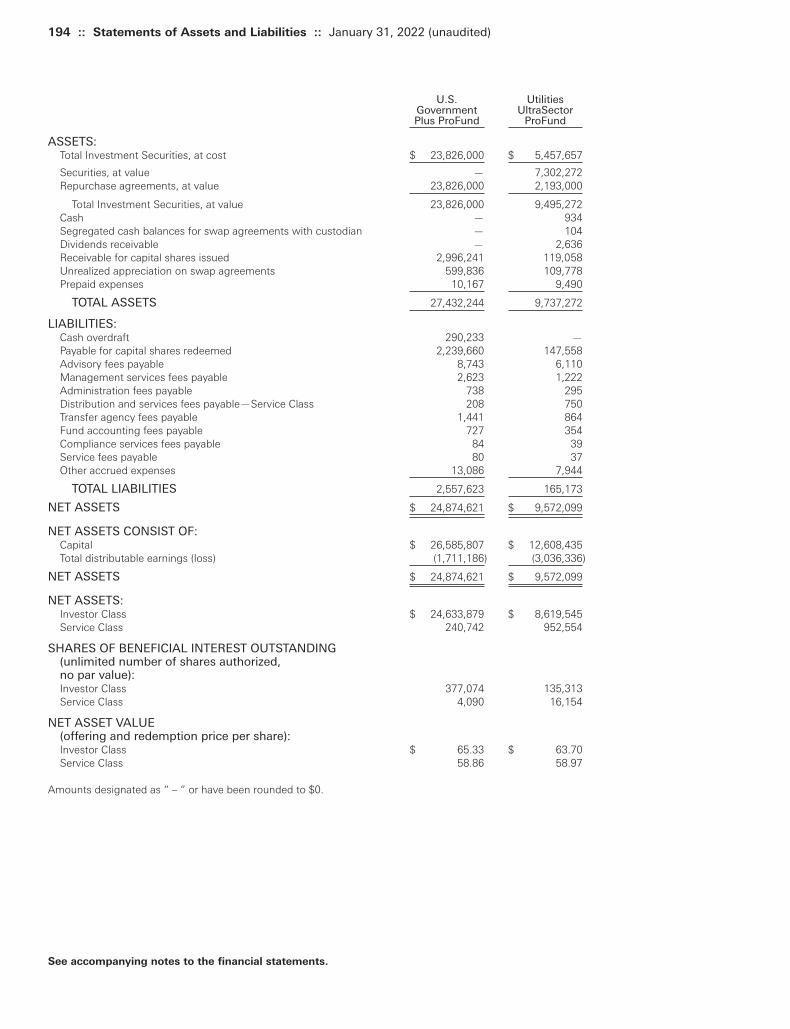
194 :: Statements of Assets and Liabilities :: January 31, 2022 (unaudited)
U.S. Utilities Government UltraSector Plus ProFund ProFund
ASSETS:Total Investment Securities, at cost $ 23,826,000 $ 5,457,657
Securities, at value — 7,302,272Repurchase agreements, at value 23,826,000 2,193,000
Total Investment Securities, at value 23,826,000 9,495,272Cash — 934Segregated cash balances for swap agreements with custodian — 104Dividends receivable — 2,636Receivable for capital shares issued 2,996,241 119,058Unrealized appreciation on swap agreements 599,836 109,778Prepaid expenses 10,167 9,490
TOTAL ASSETS 27,432,244 9,737,272
LIABILITIES:Cash overdraft 290,233 —Payable for capital shares redeemed 2,239,660 147,558Advisory fees payable 8,743 6,110Management services fees payable 2,623 1,222Administration fees payable 738 295Distribution and services fees payable—Service Class 208 750Transfer agency fees payable 1,441 864Fund accounting fees payable 727 354Compliance services fees payable 84 39Service fees payable 80 37Other accrued expenses 13,086 7,944
TOTAL LIABILITIES 2,557,623 165,173
NET ASSETS $ 24,874,621 $ 9,572,099
NET ASSETS CONSIST OF:Capital $ 26,585,807 $ 12,608,435Total distributable earnings (loss) (1,711,186) (3,036,336)
NET ASSETS $ 24,874,621 $ 9,572,099
NET ASSETS:Investor Class $ 24,633,879 $ 8,619,545Service Class 240,742 952,554
SHARES OF BENEFICIAL INTEREST OUTSTANDING(unlimited number of shares authorized, no par value):Investor Class 377,074 135,313Service Class 4,090 16,154
NET ASSET VALUE(offering and redemption price per share):Investor Class $ 65.33 $ 63.70Service Class 58.86 58.97
Amounts designated as “ – ” or have been rounded to $0.
See accompanying notes to the financial statements.
Toppan Merrill - ProFunds Public Semi-Annual Report [Funds] 01-31-2022 ED [AUX] | akiesli | 29-Mar-22 08:43 | 22-1296-2.ea | Sequence: 17CHKSUM Content: 56868 Layout: 40957 Graphics: 0 CLEAN
JOB: 22-1296-2 CYCLE#;BL#: 8; 0 TRIM: 8.25" x 10.75" AS: New York: 212-620-5600COLORS: ~note-color 2, Black, ~note-color 3 GRAPHICS: none V1.5

Statements of Operations
Toppan Merrill - ProFunds Public Semi-Annual Report [Funds] 01-31-2022 ED [AUX] | akiesli | 29-Mar-22 08:43 | 22-1296-2.ec | Sequence: 1CHKSUM Content: 38105 Layout: 44740 Graphics: 0 CLEAN
JOB: 22-1296-2 CYCLE#;BL#: 8; 0 TRIM: 8.25" x 10.75" AS: New York: 212-620-5600COLORS: Black, ~note-color 2 GRAPHICS: none V1.5

This Page Intentionally Left Blank
Toppan Merrill - ProFunds Public Semi-Annual Report [Funds] 01-31-2022 ED [AUX] | akiesli | 29-Mar-22 08:43 | 22-1296-2.ec | Sequence: 2CHKSUM Content: 40530 Layout: 34000 Graphics: 0 CLEAN
JOB: 22-1296-2 CYCLE#;BL#: 8; 0 TRIM: 8.25" x 10.75" AS: New York: 212-620-5600COLORS: Black, ~note-color 2 GRAPHICS: none V1.5

For the Periods Indicated (unaudited) :: Statements of Operations :: 197
Access FlexBear Access Flex
High Yield High Yield ProFund ProFund
Six Months Six MonthsEnded Ended
January 31, January 31,2022 2022
INVESTMENT INCOME:Interest $ — $ 50,040
TOTAL INVESTMENT INCOME — 50,040
EXPENSES:Advisory fees 2,297 58,612Management services fees 459 11,723Administration fees 362 6,344Distribution and services fees—Service Class 50 16,580Transfer agency fees 433 5,979Administrative services fees 859 17,294Registration and filing fees 11,783 28,005Custody fees 73 1,266Fund accounting fees 201 3,429Trustee fees 14 216Compliance services fees 5 73Service fees 22 380Nasdaq trading symbol fees 960 960Other fees 588 4,827
Total Gross Expenses before reductions 18,106 155,688Expenses reduced and reimbursed by the Advisor (12,605) —
TOTAL NET EXPENSES 5,501 155,688
NET INVESTMENT INCOME (LOSS) (5,501) (105,648)
REALIZED AND UNREALIZED GAINS (LOSSES) ON INVESTMENTS:Gain received from non-recurring class action settlement(s) 82 1,145Net realized gains (losses) on investment securities — (351,986)Net realized gains (losses) on futures contracts 6,125 (19,407)Net realized gains (losses) on swap agreements (18,474) 274,878Change in net unrealized appreciation/depreciation on
investment securities — (70,636)Change in net unrealized appreciation/depreciation on
futures contracts 8,954 (2,224)Change in net unrealized appreciation/depreciation on
swap agreements 17,389 (267,444)
NET REALIZED AND UNREALIZED GAINS (LOSSES) ON INVESTMENTS 14,076 (435,674)
CHANGE IN NET ASSETS RESULTING FROM OPERATIONS $ 8,575 $ (541,322)
Amounts designated as “ – “ are $0 or have been rounded to $0.
See accompanying notes to the financial statements.
Toppan Merrill - ProFunds Public Semi-Annual Report [Funds] 01-31-2022 ED [AUX] | akiesli | 29-Mar-22 08:43 | 22-1296-2.ec | Sequence: 3CHKSUM Content: 30638 Layout: 12475 Graphics: 0 CLEAN
JOB: 22-1296-2 CYCLE#;BL#: 8; 0 TRIM: 8.25" x 10.75" AS: New York: 212-620-5600COLORS: ~note-color 2, Black, ~note-color 3 GRAPHICS: none V1.5
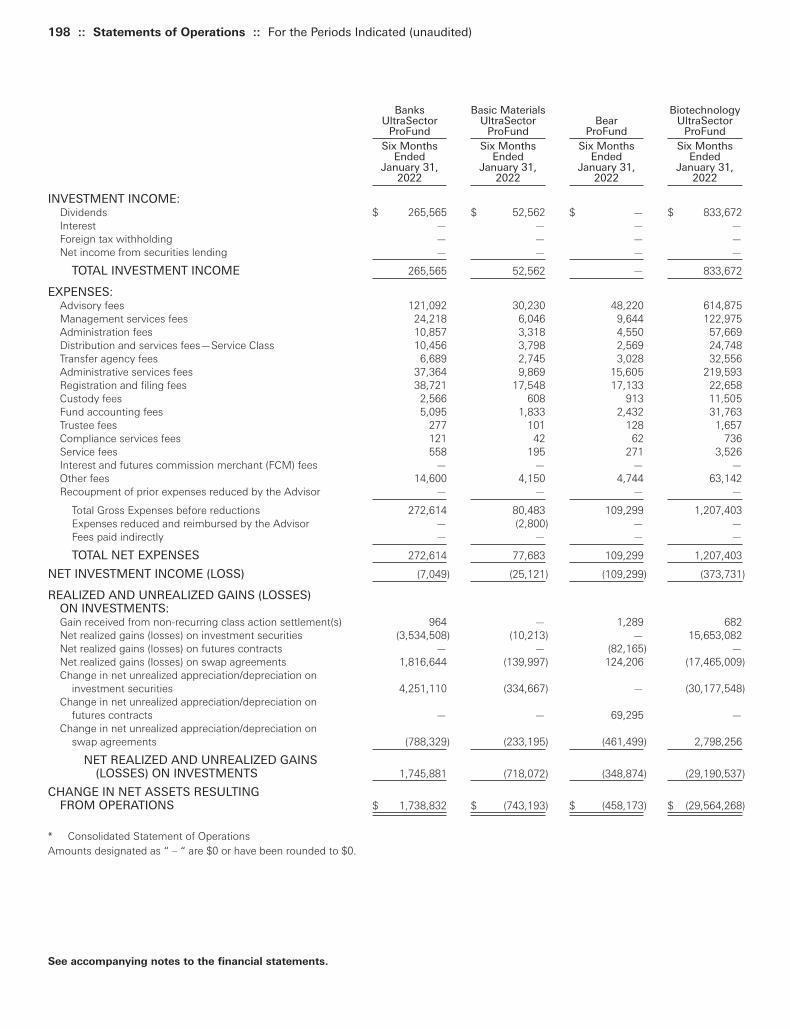
198 :: Statements of Operations :: For the Periods Indicated (unaudited)
Banks Basic Materials BiotechnologyUltraSector UltraSector Bear UltraSector
ProFund ProFund ProFund ProFundSix Months Six Months Six Months Six Months
Ended Ended Ended EndedJanuary 31, January 31, January 31, January 31,
2022 2022 2022 2022
INVESTMENT INCOME:Dividends $ 265,565 $ 52,562 $ — $ 833,672Interest — — — —Foreign tax withholding — — — —Net income from securities lending — — — —
TOTAL INVESTMENT INCOME 265,565 52,562 — 833,672
EXPENSES:Advisory fees 121,092 30,230 48,220 614,875Management services fees 24,218 6,046 9,644 122,975Administration fees 10,857 3,318 4,550 57,669Distribution and services fees—Service Class 10,456 3,798 2,569 24,748Transfer agency fees 6,689 2,745 3,028 32,556Administrative services fees 37,364 9,869 15,605 219,593Registration and filing fees 38,721 17,548 17,133 22,658Custody fees 2,566 608 913 11,505Fund accounting fees 5,095 1,833 2,432 31,763Trustee fees 277 101 128 1,657Compliance services fees 121 42 62 736Service fees 558 195 271 3,526Interest and futures commission merchant (FCM) fees — — — —Other fees 14,600 4,150 4,744 63,142Recoupment of prior expenses reduced by the Advisor — — — —
Total Gross Expenses before reductions 272,614 80,483 109,299 1,207,403Expenses reduced and reimbursed by the Advisor — (2,800) — —Fees paid indirectly — — — —
TOTAL NET EXPENSES 272,614 77,683 109,299 1,207,403
NET INVESTMENT INCOME (LOSS) (7,049) (25,121) (109,299) (373,731)
REALIZED AND UNREALIZED GAINS (LOSSES) ON INVESTMENTS:Gain received from non-recurring class action settlement(s) 964 — 1,289 682Net realized gains (losses) on investment securities (3,534,508) (10,213) — 15,653,082Net realized gains (losses) on futures contracts — — (82,165) —Net realized gains (losses) on swap agreements 1,816,644 (139,997) 124,206 (17,465,009)Change in net unrealized appreciation/depreciation on
investment securities 4,251,110 (334,667) — (30,177,548)Change in net unrealized appreciation/depreciation on
futures contracts — — 69,295 —Change in net unrealized appreciation/depreciation on
swap agreements (788,329) (233,195) (461,499) 2,798,256
NET REALIZED AND UNREALIZED GAINS (LOSSES) ON INVESTMENTS 1,745,881 (718,072) (348,874) (29,190,537)
CHANGE IN NET ASSETS RESULTING FROM OPERATIONS $ 1,738,832 $ (743,193) $ (458,173) $ (29,564,268)
* Consolidated Statement of OperationsAmounts designated as “ – “ are $0 or have been rounded to $0.
See accompanying notes to the financial statements.
Toppan Merrill - ProFunds Public Semi-Annual Report [Funds] 01-31-2022 ED [AUX] | akiesli | 29-Mar-22 08:43 | 22-1296-2.ec | Sequence: 4CHKSUM Content: 27613 Layout: 28396 Graphics: 0 CLEAN
JOB: 22-1296-2 CYCLE#;BL#: 8; 0 TRIM: 8.25" x 10.75" AS: New York: 212-620-5600COLORS: ~note-color 2, Black, ~note-color 3 GRAPHICS: none V1.5
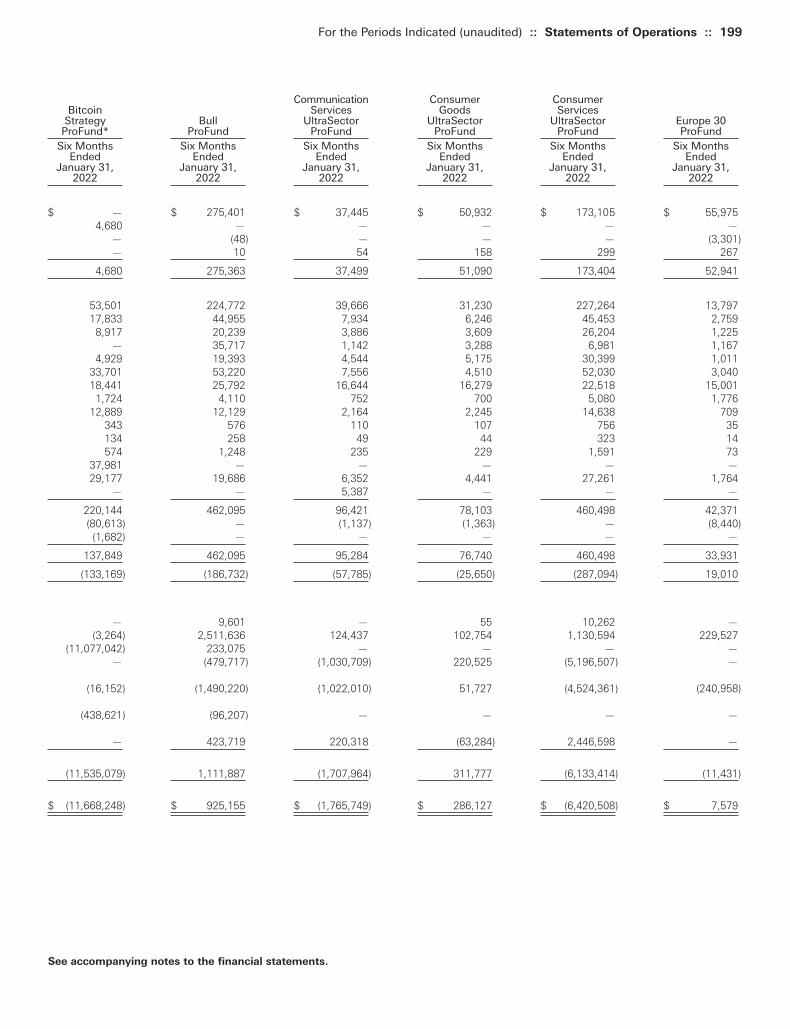
For the Periods Indicated (unaudited) :: Statements of Operations :: 199
See accompanying notes to the financial statements.
Communication Consumer ConsumerBitcoin Services Goods Services
Strategy Bull UltraSector UltraSector UltraSector Europe 30ProFund* ProFund ProFund ProFund ProFund ProFund
Six Months Six Months Six Months Six Months Six Months Six MonthsEnded Ended Ended Ended Ended Ended
January 31, January 31, January 31, January 31, January 31, January 31,2022 2022 2022 2022 2022 2022
$ — $ 275,401 $ 37,445 $ 50,932 $ 173,105 $ 55,9754,680 — — — — —
— (48) — — — (3,301)— 10 54 158 299 267
4,680 275,363 37,499 51,090 173,404 52,941
53,501 224,772 39,666 31,230 227,264 13,79717,833 44,955 7,934 6,246 45,453 2,759
8,917 20,239 3,886 3,609 26,204 1,225— 35,717 1,142 3,288 6,981 1,167
4,929 19,393 4,544 5,175 30,399 1,01133,701 53,220 7,556 4,510 52,030 3,04018,441 25,792 16,644 16,279 22,518 15,001
1,724 4,110 752 700 5,080 1,77612,889 12,129 2,164 2,245 14,638 709
343 576 110 107 756 35134 258 49 44 323 14574 1,248 235 229 1,591 73
37,981 — — — — —29,177 19,686 6,352 4,441 27,261 1,764
— — 5,387 — — —
220,144 462,095 96,421 78,103 460,498 42,371(80,613) — (1,137) (1,363) — (8,440)
(1,682) — — — — —
137,849 462,095 95,284 76,740 460,498 33,931
(133,169) (186,732) (57,785) (25,650) (287,094) 19,010
— 9,601 — 55 10,262 —(3,264) 2,511,636 124,437 102,754 1,130,594 229,527
(11,077,042) 233,075 — — — —— (479,717) (1,030,709) 220,525 (5,196,507) —
(16,152) (1,490,220) (1,022,010) 51,727 (4,524,361) (240,958)
(438,621) (96,207) — — — —
— 423,719 220,318 (63,284) 2,446,598 —
(11,535,079) 1,111,887 (1,707,964) 311,777 (6,133,414) (11,431)
$ (11,668,248) $ 925,155 $ (1,765,749) $ 286,127 $ (6,420,508) $ 7,579
Toppan Merrill - ProFunds Public Semi-Annual Report [Funds] 01-31-2022 ED [AUX] | akiesli | 29-Mar-22 08:43 | 22-1296-2.ec | Sequence: 5CHKSUM Content: 52880 Layout: 33150 Graphics: 0 CLEAN
JOB: 22-1296-2 CYCLE#;BL#: 8; 0 TRIM: 8.25" x 10.75" AS: New York: 212-620-5600COLORS: ~HTML color, ~watermark, ~note-color 2, Black, ~note-color 3 GRAPHICS: none V1.5
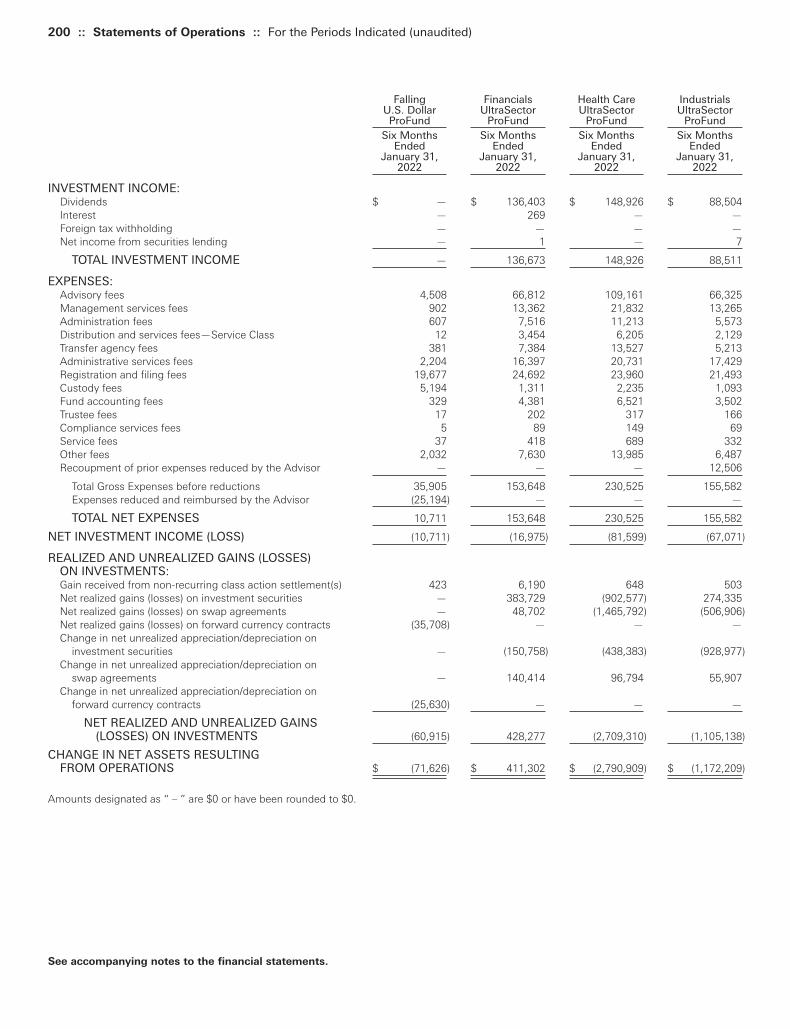
200 :: Statements of Operations :: For the Periods Indicated (unaudited)
Falling Financials Health Care IndustrialsU.S. Dollar UltraSector UltraSector UltraSectorProFund ProFund ProFund ProFund
Six Months Six Months Six Months Six MonthsEnded Ended Ended Ended
January 31, January 31, January 31, January 31,2022 2022 2022 2022
INVESTMENT INCOME:Dividends $ — $ 136,403 $ 148,926 $ 88,504Interest — 269 — —Foreign tax withholding — — — —Net income from securities lending — 1 — 7
TOTAL INVESTMENT INCOME — 136,673 148,926 88,511
EXPENSES:Advisory fees 4,508 66,812 109,161 66,325Management services fees 902 13,362 21,832 13,265Administration fees 607 7,516 11,213 5,573Distribution and services fees—Service Class 12 3,454 6,205 2,129Transfer agency fees 381 7,384 13,527 5,213Administrative services fees 2,204 16,397 20,731 17,429Registration and filing fees 19,677 24,692 23,960 21,493Custody fees 5,194 1,311 2,235 1,093Fund accounting fees 329 4,381 6,521 3,502Trustee fees 17 202 317 166Compliance services fees 5 89 149 69Service fees 37 418 689 332Other fees 2,032 7,630 13,985 6,487Recoupment of prior expenses reduced by the Advisor — — — 12,506
Total Gross Expenses before reductions 35,905 153,648 230,525 155,582Expenses reduced and reimbursed by the Advisor (25,194) — — —
TOTAL NET EXPENSES 10,711 153,648 230,525 155,582
NET INVESTMENT INCOME (LOSS) (10,711) (16,975) (81,599) (67,071)
REALIZED AND UNREALIZED GAINS (LOSSES) ON INVESTMENTS:Gain received from non-recurring class action settlement(s) 423 6,190 648 503Net realized gains (losses) on investment securities — 383,729 (902,577) 274,335Net realized gains (losses) on swap agreements — 48,702 (1,465,792) (506,906)Net realized gains (losses) on forward currency contracts (35,708) — — —Change in net unrealized appreciation/depreciation on
investment securities — (150,758) (438,383) (928,977)Change in net unrealized appreciation/depreciation on
swap agreements — 140,414 96,794 55,907Change in net unrealized appreciation/depreciation on
forward currency contracts (25,630) — — —
NET REALIZED AND UNREALIZED GAINS (LOSSES) ON INVESTMENTS (60,915) 428,277 (2,709,310) (1,105,138)
CHANGE IN NET ASSETS RESULTING FROM OPERATIONS $ (71,626) $ 411,302 $ (2,790,909) $ (1,172,209)
Amounts designated as “ – ” are $0 or have been rounded to $0.
See accompanying notes to the financial statements.
Toppan Merrill - ProFunds Public Semi-Annual Report [Funds] 01-31-2022 ED [AUX] | akiesli | 29-Mar-22 08:43 | 22-1296-2.ec | Sequence: 6CHKSUM Content: 15281 Layout: 42578 Graphics: 0 CLEAN
JOB: 22-1296-2 CYCLE#;BL#: 8; 0 TRIM: 8.25" x 10.75" AS: New York: 212-620-5600COLORS: ~note-color 2, Black, ~note-color 3 GRAPHICS: none V1.5
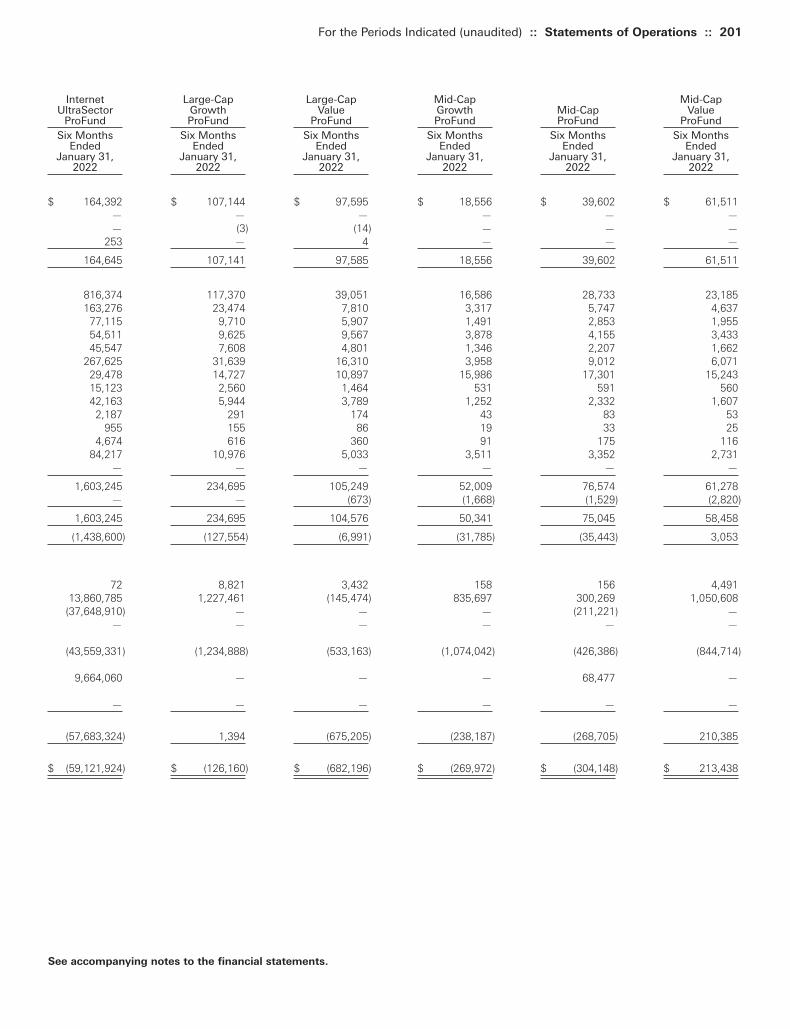
For the Periods Indicated (unaudited) :: Statements of Operations :: 201
See accompanying notes to the financial statements.
Internet Large-Cap Large-Cap Mid-Cap Mid-CapUltraSector Growth Value Growth Mid-Cap Value
ProFund ProFund ProFund ProFund ProFund ProFundSix Months Six Months Six Months Six Months Six Months Six Months
Ended Ended Ended Ended Ended EndedJanuary 31, January 31, January 31, January 31, January 31, January 31,
2022 2022 2022 2022 2022 2022
$ 164,392 $ 107,144 $ 97,595 $ 18,556 $ 39,602 $ 61,511— — — — — —— (3) (14) — — —
253 — 4 — — —
164,645 107,141 97,585 18,556 39,602 61,511
816,374 117,370 39,051 16,586 28,733 23,185163,276 23,474 7,810 3,317 5,747 4,637
77,115 9,710 5,907 1,491 2,853 1,95554,511 9,625 9,567 3,878 4,155 3,43345,547 7,608 4,801 1,346 2,207 1,662
267,625 31,639 16,310 3,958 9,012 6,07129,478 14,727 10,897 15,986 17,301 15,24315,123 2,560 1,464 531 591 56042,163 5,944 3,789 1,252 2,332 1,607
2,187 291 174 43 83 53955 155 86 19 33 25
4,674 616 360 91 175 11684,217 10,976 5,033 3,511 3,352 2,731
— — — — — —
1,603,245 234,695 105,249 52,009 76,574 61,278— — (673) (1,668) (1,529) (2,820)
1,603,245 234,695 104,576 50,341 75,045 58,458
(1,438,600) (127,554) (6,991) (31,785) (35,443) 3,053
72 8,821 3,432 158 156 4,49113,860,785 1,227,461 (145,474) 835,697 300,269 1,050,608
(37,648,910) — — — (211,221) —— — — — — —
(43,559,331) (1,234,888) (533,163) (1,074,042) (426,386) (844,714)
9,664,060 — — — 68,477 —
— — — — — —
(57,683,324) 1,394 (675,205) (238,187) (268,705) 210,385
$ (59,121,924) $ (126,160) $ (682,196) $ (269,972) $ (304,148) $ 213,438
Toppan Merrill - ProFunds Public Semi-Annual Report [Funds] 01-31-2022 ED [AUX] | akiesli | 29-Mar-22 08:43 | 22-1296-2.ec | Sequence: 7CHKSUM Content: 15754 Layout: 28156 Graphics: 0 CLEAN
JOB: 22-1296-2 CYCLE#;BL#: 8; 0 TRIM: 8.25" x 10.75" AS: New York: 212-620-5600COLORS: ~HTML color, ~watermark, ~note-color 2, Black, ~note-color 3 GRAPHICS: none V1.5
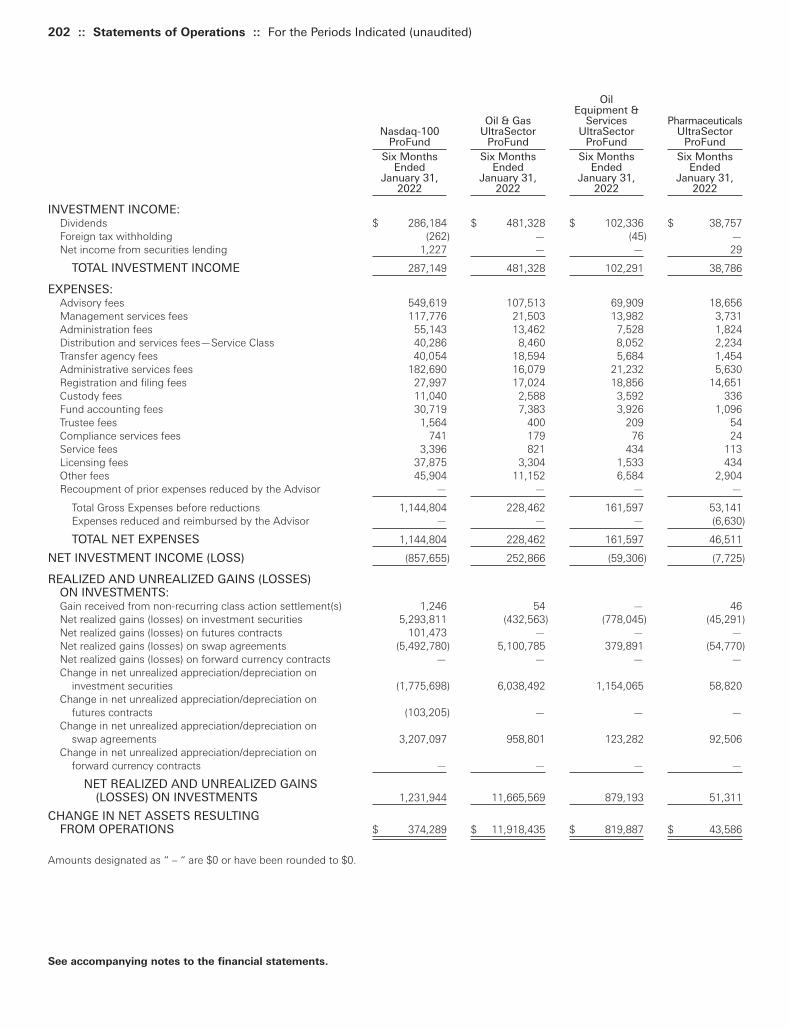
202 :: Statements of Operations :: For the Periods Indicated (unaudited)
OilEquipment &
Oil & Gas Services PharmaceuticalsNasdaq-100 UltraSector UltraSector UltraSector
ProFund ProFund ProFund ProFundSix Months Six Months Six Months Six Months
Ended Ended Ended EndedJanuary 31, January 31, January 31, January 31,
2022 2022 2022 2022
INVESTMENT INCOME:Dividends $ 286,184 $ 481,328 $ 102,336 $ 38,757Foreign tax withholding (262) — (45) —Net income from securities lending 1,227 — — 29
TOTAL INVESTMENT INCOME 287,149 481,328 102,291 38,786
EXPENSES:Advisory fees 549,619 107,513 69,909 18,656Management services fees 117,776 21,503 13,982 3,731Administration fees 55,143 13,462 7,528 1,824Distribution and services fees—Service Class 40,286 8,460 8,052 2,234Transfer agency fees 40,054 18,594 5,684 1,454Administrative services fees 182,690 16,079 21,232 5,630Registration and filing fees 27,997 17,024 18,856 14,651Custody fees 11,040 2,588 3,592 336Fund accounting fees 30,719 7,383 3,926 1,096Trustee fees 1,564 400 209 54Compliance services fees 741 179 76 24Service fees 3,396 821 434 113Licensing fees 37,875 3,304 1,533 434Other fees 45,904 11,152 6,584 2,904Recoupment of prior expenses reduced by the Advisor — — — —
Total Gross Expenses before reductions 1,144,804 228,462 161,597 53,141Expenses reduced and reimbursed by the Advisor — — — (6,630)
TOTAL NET EXPENSES 1,144,804 228,462 161,597 46,511
NET INVESTMENT INCOME (LOSS) (857,655) 252,866 (59,306) (7,725)
REALIZED AND UNREALIZED GAINS (LOSSES) ON INVESTMENTS:Gain received from non-recurring class action settlement(s) 1,246 54 — 46Net realized gains (losses) on investment securities 5,293,811 (432,563) (778,045) (45,291)Net realized gains (losses) on futures contracts 101,473 — — —Net realized gains (losses) on swap agreements (5,492,780) 5,100,785 379,891 (54,770)Net realized gains (losses) on forward currency contracts — — — —Change in net unrealized appreciation/depreciation on
investment securities (1,775,698) 6,038,492 1,154,065 58,820Change in net unrealized appreciation/depreciation on
futures contracts (103,205) — — —Change in net unrealized appreciation/depreciation on
swap agreements 3,207,097 958,801 123,282 92,506Change in net unrealized appreciation/depreciation on
forward currency contracts — — — —
NET REALIZED AND UNREALIZED GAINS (LOSSES) ON INVESTMENTS 1,231,944 11,665,569 879,193 51,311
CHANGE IN NET ASSETS RESULTING FROM OPERATIONS $ 374,289 $ 11,918,435 $ 819,887 $ 43,586
Amounts designated as “ – “ are $0 or have been rounded to $0.
See accompanying notes to the financial statements.
Toppan Merrill - ProFunds Public Semi-Annual Report [Funds] 01-31-2022 ED [AUX] | akiesli | 29-Mar-22 08:43 | 22-1296-2.ec | Sequence: 8CHKSUM Content: 36301 Layout: 14286 Graphics: 0 CLEAN
JOB: 22-1296-2 CYCLE#;BL#: 8; 0 TRIM: 8.25" x 10.75" AS: New York: 212-620-5600COLORS: ~note-color 2, Black, ~note-color 3 GRAPHICS: none V1.5

For the Periods Indicated (unaudited) :: Statements of Operations :: 203
See accompanying notes to the financial statements.
PreciousMetals Real Estate Rising Rates Rising Rates Rising Semiconductor
UltraSector UltraSector Opportunity Opportunity 10 U.S. Dollar UltraSectorProFund ProFund ProFund ProFund ProFund ProFund
Six Months Six Months Six Months Six Months Six Months Six MonthsEnded Ended Ended Ended Ended Ended
January 31, January 31, January 31, January 31, January 31, January 31,2022 2022 2022 2022 2022 2022
$ 284,310 $ 740,252 $ — $ — $ — $ 409,366(25,898) — — — — (1,501)
487 38 — — — —
258,899 740,290 — — — 407,865
101,329 408,311 49,809 8,413 42,247 405,62120,266 81,663 9,962 1,683 8,450 81,124
9,782 42,754 4,735 787 6,704 37,5346,435 5,708 3,869 813 1,549 31,3017,911 22,508 3,765 636 5,591 23,845
26,559 182,036 15,808 2,484 20,635 140,95418,172 44,280 12,927 17,630 14,713 18,280
1,867 9,173 1,025 173 4,762 7,4855,372 23,831 2,803 469 3,802 21,206
285 1,243 151 25 199 1,076116 518 63 11 109 515591 2,576 314 53 429 2,360
2,347 10,269 — — 9,819 9,7697,963 36,263 4,921 1,422 6,069 30,335
— 729 — — — —
208,995 871,862 110,152 34,599 125,078 811,405— — — (13,819) (23,263) —
208,995 871,862 110,152 20,780 101,815 811,405
49,904 (131,572) (110,152) (20,780) (101,815) (403,540)
1,077 41,978 4,791 1,183 324 —(4,142) 740,916 — — — (1,725,203)
— — — (600) — —(1,062,500) (136,030) 153,942 91,760 — (627,192)
— — — — (56) —
(2,947,260) 35,264 — — — 2,714,201
— — — — — —
(1,869,314) 24,828 (395,039) (11,944) — (538,429)
— — — — 382,498 —
(5,882,139) 706,956 (236,306) 80,399 382,766 (176,623)
$ (5,832,235) $ 575,384 $ (346,458) $ 59,619 $ 280,951 $ (580,163)
Toppan Merrill - ProFunds Public Semi-Annual Report [Funds] 01-31-2022 ED [AUX] | akiesli | 29-Mar-22 08:43 | 22-1296-2.ec | Sequence: 9CHKSUM Content: 20965 Layout: 31724 Graphics: 0 CLEAN
JOB: 22-1296-2 CYCLE#;BL#: 8; 0 TRIM: 8.25" x 10.75" AS: New York: 212-620-5600COLORS: ~HTML color, ~watermark, ~note-color 2, Black, ~note-color 3 GRAPHICS: none V1.5

204 :: Statements of Operations :: For the Periods Indicated (unaudited)
ShortShort Short Precious Short
Nasdaq-100 Oil & Gas Metals Real EstateProFund ProFund ProFund ProFund
Six Months Six Months Six Months Six MonthsEnded Ended Ended Ended
January 31, January 31, January 31, January 31,2022 2022 2022 2022
INVESTMENT INCOME:Dividends $ — $ — $ — $ —Foreign tax withholding — — — —Net income from securities lending — — — —
TOTAL INVESTMENT INCOME — — — —
EXPENSES:Advisory fees 28,854 4,921 12,882 1,970Management services fees 5,771 984 2,576 394Administration fees 5,730 414 1,123 273Distribution and services fees—Service Class 492 191 92 70Transfer agency fees 2,883 489 840 405Administrative services fees 29,211 1,235 3,867 337Registration and filing fees 7,862 23,703 20,213 18,286Custody fees 1,080 228 206 52Fund accounting fees 3,195 264 680 162Trustee fees 194 14 36 9Compliance services fees 93 5 17 4Service fees 364 29 76 18Other fees 8,369 1,788 3,288 1,414
Total Gross Expenses before reductions 94,098 34,265 45,896 23,394Expenses reduced and reimbursed by the Advisor (25,125) (22,396) (15,232) (18,648)
TOTAL NET EXPENSES 68,973 11,869 30,664 4,746
NET INVESTMENT INCOME (LOSS) (68,973) (11,869) (30,664) (4,746)
REALIZED AND UNREALIZED GAINS (LOSSES) ON INVESTMENTS:Gain received from non-recurring class action settlement(s) 60 — 25 389Net realized gains (losses) on investment securities — — — —Net realized gains (losses) on futures contracts (50,520) — — —Net realized gains (losses) on swap agreements 3,258,811 (87,216) 76,929 (1,083)Change in net unrealized appreciation/depreciation on
investment securities — — — —Change in net unrealized appreciation/depreciation on
futures contracts 23,085 — — —Change in net unrealized appreciation/depreciation on
swap agreements (3,563,961) 10,680 220,960 (6,803)
NET REALIZED AND UNREALIZED GAINS (LOSSES) ON INVESTMENTS (332,525) (76,536) 297,914 (7,497)
CHANGE IN NET ASSETS RESULTING FROM OPERATIONS $ (401,498) $ (88,405) $ 267,250 $ (12,243)
See accompanying notes to the financial statements.
Toppan Merrill - ProFunds Public Semi-Annual Report [Funds] 01-31-2022 ED [AUX] | akiesli | 29-Mar-22 08:43 | 22-1296-2.ec | Sequence: 10CHKSUM Content: 23457 Layout: 36816 Graphics: 0 CLEAN
JOB: 22-1296-2 CYCLE#;BL#: 8; 0 TRIM: 8.25" x 10.75" AS: New York: 212-620-5600COLORS: ~note-color 2, Black, ~note-color 3 GRAPHICS: none V1.5

For the Periods Indicated (unaudited) :: Statements of Operations :: 205
See accompanying notes to the financial statements.
Short Small-Cap Small-Cap Technology TelecommunicationsSmall-Cap Growth Small-Cap Value UltraSector UltraSectorProFund ProFund ProFund ProFund ProFund ProFund
Six Months Six Months Six Months Six Months Six Months Six MonthsEnded Ended Ended Ended Ended Ended
January 31, January 31, January 31, January 31, January 31, January 31,2022 2022 2022 2022 2022 2022
$ — $ 45,894 $ 27,211 $ 161,085 $ 252,725 $ 14,013— (1) (14) (2) (275) —— 172 151 55 499 —
— 46,065 27,348 161,138 252,949 14,013
17,446 29,117 29,101 61,394 394,863 4,2763,489 5,824 5,820 12,279 78,973 8551,999 2,973 2,711 5,753 36,599 446
185 4,193 2,992 3,976 34,113 2991,732 2,344 2,768 3,583 24,149 4158,094 8,375 6,407 20,617 122,997 1,187
32,669 17,785 18,228 18,410 20,714 15,797524 858 552 1,980 7,326 67
1,341 2,227 5,184 3,988 20,829 32660 81 76 156 1,059 1338 34 37 65 502 6
146 171 163 343 2,282 275,956 3,336 5,066 5,916 41,309 1,838
73,679 77,318 79,105 138,460 785,715 25,552(32,088) — (7,045) — — (15,104)
41,591 77,318 72,060 138,460 785,715 10,448
(41,591) (31,253) (44,712) 22,678 (532,766) 3,565
779 3,415 3,266 1,879 479 —— 1,773,175 (18,430) 1,905,303 (1,158,280) 8,109
3,819 — 19,752 — — —(727,292) — (131,299) — (3,160,226) (10,663)
— (2,167,558) (229,688) (2,039,353) 1,697,614 (44,686)
3,377 — 5,852 — — —
(67,523) — 74,253 — 3,037,634 (16,257)
(786,840) (390,968) (276,294) (132,171) 417,221 (63,497)
$ (828,431) $ (422,221) $ (321,006) $ (109,493) $ (115,545) $ (59,932)
Toppan Merrill - ProFunds Public Semi-Annual Report [Funds] 01-31-2022 ED [AUX] | akiesli | 29-Mar-22 08:43 | 22-1296-2.ec | Sequence: 11CHKSUM Content: 57869 Layout: 31907 Graphics: 0 CLEAN
JOB: 22-1296-2 CYCLE#;BL#: 8; 0 TRIM: 8.25" x 10.75" AS: New York: 212-620-5600COLORS: ~HTML color, ~watermark, ~note-color 2, Black, ~note-color 3 GRAPHICS: none V1.5

206 :: Statements of Operations :: For the Periods Indicated (unaudited)
UltraBear UltraBull UltraChina UltraDow 30ProFund ProFund ProFund ProFund
Six Months Six Months Six Months Six MonthsEnded Ended Ended Ended
January 31, January 31, January 31, January 31,2022 2022 2022 2022
INVESTMENT INCOME:Dividends $ — $ 696,381 $ 64,313 $ 241,316Interest — — — —Foreign tax withholding — (121) (4,270) —Net income from securities lending — 40 3,356 —
TOTAL INVESTMENT INCOME — 696,300 63,399 241,316
EXPENSES:Advisory fees 28,625 513,988 76,918 152,821Management services fees 5,725 102,798 15,384 30,564Administration fees 2,914 48,479 6,447 14,021Distribution and services fees—Service Class 117 17,468 1,907 5,695Transfer agency fees 2,008 34,829 3,964 10,391Administrative services fees 9,871 140,757 29,662 45,207Registration and filing fees 23,573 37,814 17,772 16,480Custody fees 577 9,677 7,989 2,766Fund accounting fees 1,580 27,712 3,585 7,777Trustee fees 79 1,409 183 406Compliance services fees 38 651 85 186Service fees 177 2,991 390 862Other fees 3,273 43,631 7,957 18,045Recoupment of prior expenses reduced by the Advisor — — — —
Total Gross Expenses before reductions 78,557 982,204 172,243 305,221Expenses reduced and reimbursed by the Advisor (10,494) — — —
TOTAL NET EXPENSES 68,063 982,204 172,243 305,221
NET INVESTMENT INCOME (LOSS) (68,063) (285,904) (108,844) (63,905)
REALIZED AND UNREALIZED GAINS (LOSSES) ON INVESTMENTS:Gain received from non-recurring class action settlement(s) 2,123 2,962 6,638 80Net realized gains (losses) on investment securities — 165,625 (4,529,880) 9,690Net realized gains (losses) on futures contracts (50,354) 494,208 — 121,102Net realized gains (losses) on swap agreements 489,094 (3,138,036) (7,899,366) (1,291,954)Change in net unrealized appreciation/depreciation on
investment securities — 2,318,338 (521,283) 91,881Change in net unrealized appreciation/depreciation on
futures contracts 43,310 (115,056) — (85,029)Change in net unrealized appreciation/depreciation on
swap agreements (822,746) 6,528,142 844,692 1,364,328
NET REALIZED AND UNREALIZED GAINS (LOSSES) ON INVESTMENTS (338,573) 6,256,183 (12,099,199) 210,098
CHANGE IN NET ASSETS RESULTING FROM OPERATIONS $ (406,636) $ 5,970,279 $ (12,208,043) $ 146,193
See accompanying notes to the financial statements.
Toppan Merrill - ProFunds Public Semi-Annual Report [Funds] 01-31-2022 ED [AUX] | akiesli | 29-Mar-22 08:43 | 22-1296-2.ec | Sequence: 12CHKSUM Content: 6763 Layout: 58092 Graphics: 0 CLEAN
JOB: 22-1296-2 CYCLE#;BL#: 8; 0 TRIM: 8.25" x 10.75" AS: New York: 212-620-5600COLORS: ~note-color 2, Black, ~note-color 3 GRAPHICS: none V1.5
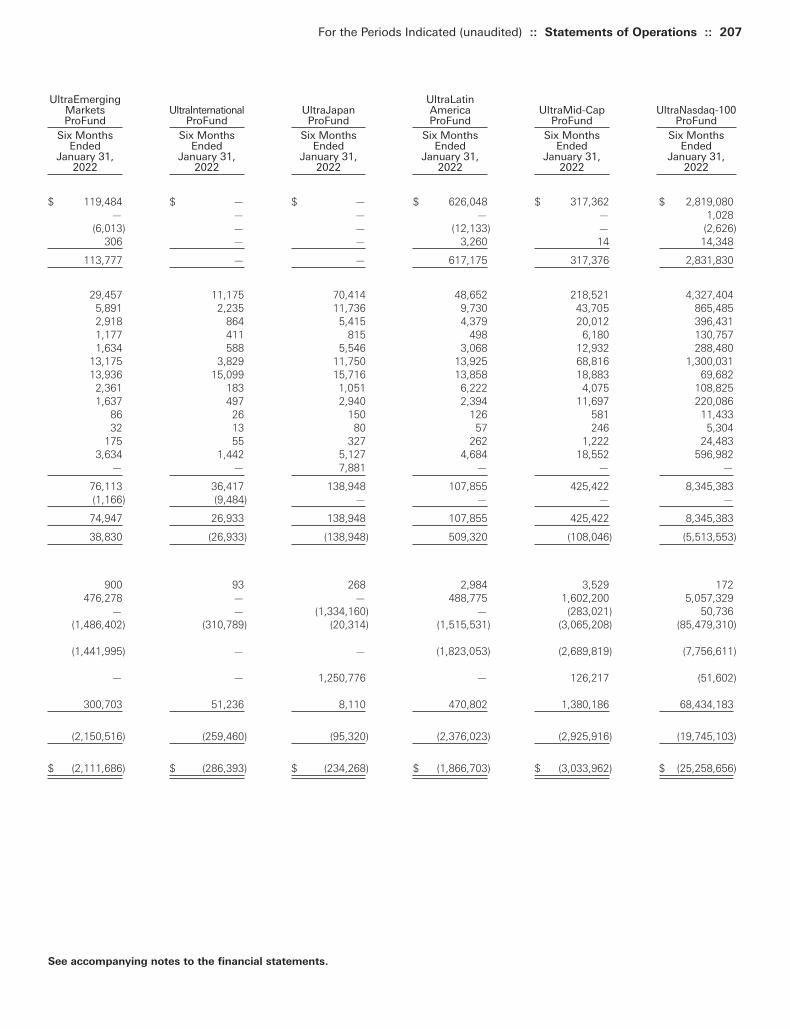
For the Periods Indicated (unaudited) :: Statements of Operations :: 207
See accompanying notes to the financial statements.
UltraEmerging UltraLatinMarkets UltraInternational UltraJapan America UltraMid-Cap UltraNasdaq-100ProFund ProFund ProFund ProFund ProFund ProFund
Six Months Six Months Six Months Six Months Six Months Six MonthsEnded Ended Ended Ended Ended Ended
January 31, January 31, January 31, January 31, January 31, January 31,2022 2022 2022 2022 2022 2022
$ 119,484 $ — $ — $ 626,048 $ 317,362 $ 2,819,080— — — — — 1,028
(6,013) — — (12,133) — (2,626)306 — — 3,260 14 14,348
113,777 — — 617,175 317,376 2,831,830
29,457 11,175 70,414 48,652 218,521 4,327,4045,891 2,235 11,736 9,730 43,705 865,4852,918 864 5,415 4,379 20,012 396,4311,177 411 815 498 6,180 130,7571,634 588 5,546 3,068 12,932 288,480
13,175 3,829 11,750 13,925 68,816 1,300,03113,936 15,099 15,716 13,858 18,883 69,682
2,361 183 1,051 6,222 4,075 108,8251,637 497 2,940 2,394 11,697 220,086
86 26 150 126 581 11,43332 13 80 57 246 5,304
175 55 327 262 1,222 24,4833,634 1,442 5,127 4,684 18,552 596,982
— — 7,881 — — —
76,113 36,417 138,948 107,855 425,422 8,345,383(1,166) (9,484) — — — —
74,947 26,933 138,948 107,855 425,422 8,345,383
38,830 (26,933) (138,948) 509,320 (108,046) (5,513,553)
900 93 268 2,984 3,529 172476,278 — — 488,775 1,602,200 5,057,329
— — (1,334,160) — (283,021) 50,736(1,486,402) (310,789) (20,314) (1,515,531) (3,065,208) (85,479,310)
(1,441,995) — — (1,823,053) (2,689,819) (7,756,611)
— — 1,250,776 — 126,217 (51,602)
300,703 51,236 8,110 470,802 1,380,186 68,434,183
(2,150,516) (259,460) (95,320) (2,376,023) (2,925,916) (19,745,103)
$ (2,111,686) $ (286,393) $ (234,268) $ (1,866,703) $ (3,033,962) $ (25,258,656)
Toppan Merrill - ProFunds Public Semi-Annual Report [Funds] 01-31-2022 ED [AUX] | akiesli | 29-Mar-22 08:43 | 22-1296-2.ec | Sequence: 13CHKSUM Content: 48416 Layout: 56022 Graphics: 0 CLEAN
JOB: 22-1296-2 CYCLE#;BL#: 8; 0 TRIM: 8.25" x 10.75" AS: New York: 212-620-5600COLORS: ~HTML color, ~watermark, ~note-color 2, Black, ~note-color 3 GRAPHICS: none V1.5
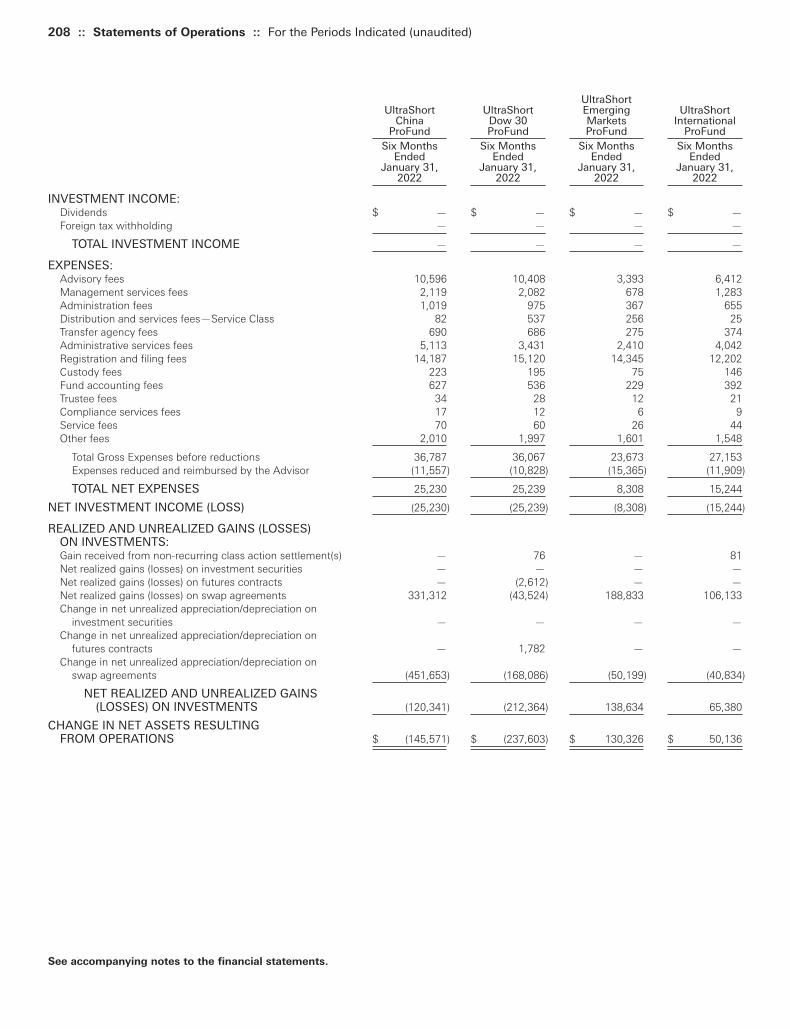
208 :: Statements of Operations :: For the Periods Indicated (unaudited)
UltraShortUltraShort UltraShort Emerging UltraShort
China Dow 30 Markets InternationalProFund ProFund ProFund ProFund
Six Months Six Months Six Months Six MonthsEnded Ended Ended Ended
January 31, January 31, January 31, January 31,2022 2022 2022 2022
INVESTMENT INCOME:Dividends $ — $ — $ — $ —Foreign tax withholding — — — —
TOTAL INVESTMENT INCOME — — — —
EXPENSES:Advisory fees 10,596 10,408 3,393 6,412Management services fees 2,119 2,082 678 1,283Administration fees 1,019 975 367 655Distribution and services fees—Service Class 82 537 256 25Transfer agency fees 690 686 275 374Administrative services fees 5,113 3,431 2,410 4,042Registration and filing fees 14,187 15,120 14,345 12,202Custody fees 223 195 75 146Fund accounting fees 627 536 229 392Trustee fees 34 28 12 21Compliance services fees 17 12 6 9Service fees 70 60 26 44Other fees 2,010 1,997 1,601 1,548
Total Gross Expenses before reductions 36,787 36,067 23,673 27,153Expenses reduced and reimbursed by the Advisor (11,557) (10,828) (15,365) (11,909)
TOTAL NET EXPENSES 25,230 25,239 8,308 15,244
NET INVESTMENT INCOME (LOSS) (25,230) (25,239) (8,308) (15,244)
REALIZED AND UNREALIZED GAINS (LOSSES) ON INVESTMENTS:Gain received from non-recurring class action settlement(s) — 76 — 81Net realized gains (losses) on investment securities — — — —Net realized gains (losses) on futures contracts — (2,612) — —Net realized gains (losses) on swap agreements 331,312 (43,524) 188,833 106,133Change in net unrealized appreciation/depreciation on
investment securities — — — —Change in net unrealized appreciation/depreciation on
futures contracts — 1,782 — —Change in net unrealized appreciation/depreciation on
swap agreements (451,653) (168,086) (50,199) (40,834)
NET REALIZED AND UNREALIZED GAINS (LOSSES) ON INVESTMENTS (120,341) (212,364) 138,634 65,380
CHANGE IN NET ASSETS RESULTING FROM OPERATIONS $ (145,571) $ (237,603) $ 130,326 $ 50,136
See accompanying notes to the financial statements.
Toppan Merrill - ProFunds Public Semi-Annual Report [Funds] 01-31-2022 ED [AUX] | akiesli | 29-Mar-22 08:43 | 22-1296-2.ec | Sequence: 14CHKSUM Content: 38248 Layout: 62469 Graphics: 0 CLEAN
JOB: 22-1296-2 CYCLE#;BL#: 8; 0 TRIM: 8.25" x 10.75" AS: New York: 212-620-5600COLORS: ~note-color 2, Black, ~note-color 3 GRAPHICS: none V1.5

For the Periods Indicated (unaudited) :: Statements of Operations :: 209
See accompanying notes to the financial statements.
UltraShort UltraShort UltraShort UltraShort UltraShortJapan Latin America Mid-Cap Nasdaq-100 Small-Cap UltraSmall-Cap
ProFund ProFund ProFund ProFund ProFund ProFundSix Months Six Months Six Months Six Months Six Months Six Months
Ended Ended Ended Ended Ended EndedJanuary 31, January 31, January 31, January 31, January 31, January 31,
2022 2022 2022 2022 2022 2022
$ — $ — $ — $ — $ — $ 406,641— — — — — (264)
— — — — — 406,377
1,297 5,196 5,656 56,256 17,741 359,542216 1,039 1,131 11,251 3,548 71,909210 392 580 8,187 1,683 32,911
53 233 100 318 819 5,439175 258 361 4,207 1,448 20,627661 2,120 2,278 40,642 4,841 125,682
22,579 15,213 14,739 12,144 17,607 22,94648 99 121 1,652 323 6,642
121 233 325 4,573 937 22,1856 12 17 275 52 9513 5 8 124 21 420
13 26 36 519 104 2,0441,228 1,281 1,029 12,140 3,138 51,140
26,610 26,107 26,381 152,288 52,262 722,438(23,992) (13,543) (12,857) (888) (9,336) —
2,618 12,564 13,524 151,400 42,926 722,438
(2,618) (12,564) (13,524) (151,400) (42,926) (316,061)
— — — 454 441 3,075— — — — — (1,167,856)
(12,102) — (4,043) (50,520) 25,867 (32,686)24,774 (42,670) 66,721 1,999,726 226,136 (12,817,610)
— — — — — (5,442,360)
(15,702) — (4,438) 23,085 31,960 (246,299)
(11,725) (41,499) (71,437) (8,923,064) (178,141) 1,749,014
(14,755) (84,169) (13,197) (6,950,319) 106,263 (17,954,722)
$ (17,373) $ (96,733) $ (26,721) $ (7,101,719) $ 63,337 $ (18,270,783)
Toppan Merrill - ProFunds Public Semi-Annual Report [Funds] 01-31-2022 ED [AUX] | akiesli | 29-Mar-22 08:43 | 22-1296-2.ec | Sequence: 15CHKSUM Content: 1059 Layout: 4228 Graphics: 0 CLEAN
JOB: 22-1296-2 CYCLE#;BL#: 8; 0 TRIM: 8.25" x 10.75" AS: New York: 212-620-5600COLORS: ~HTML color, ~watermark, ~note-color 2, Black, ~note-color 3 GRAPHICS: none V1.5
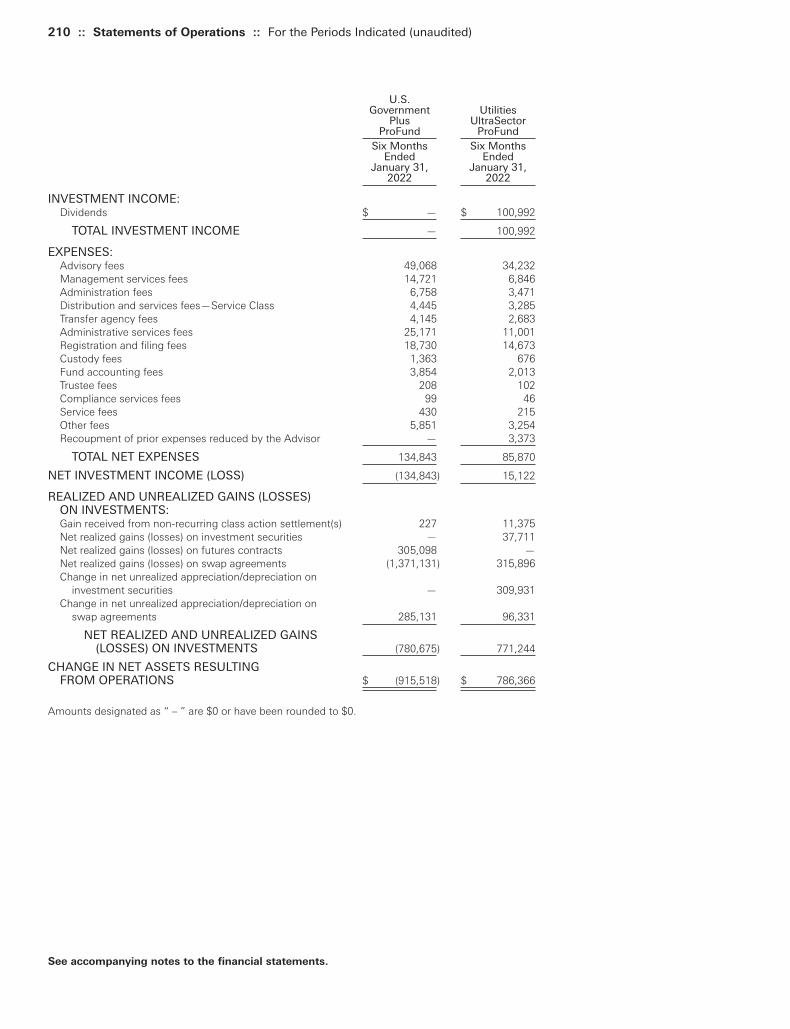
210 :: Statements of Operations :: For the Periods Indicated (unaudited)
U.S.Government Utilities
Plus UltraSectorProFund ProFund
Six Months Six MonthsEnded Ended
January 31, January 31,2022 2022
INVESTMENT INCOME:Dividends $ — $ 100,992
TOTAL INVESTMENT INCOME — 100,992
EXPENSES:Advisory fees 49,068 34,232Management services fees 14,721 6,846Administration fees 6,758 3,471Distribution and services fees—Service Class 4,445 3,285Transfer agency fees 4,145 2,683Administrative services fees 25,171 11,001Registration and filing fees 18,730 14,673Custody fees 1,363 676Fund accounting fees 3,854 2,013Trustee fees 208 102Compliance services fees 99 46Service fees 430 215Other fees 5,851 3,254Recoupment of prior expenses reduced by the Advisor — 3,373
TOTAL NET EXPENSES 134,843 85,870
NET INVESTMENT INCOME (LOSS) (134,843) 15,122
REALIZED AND UNREALIZED GAINS (LOSSES) ON INVESTMENTS:Gain received from non-recurring class action settlement(s) 227 11,375Net realized gains (losses) on investment securities — 37,711Net realized gains (losses) on futures contracts 305,098 —Net realized gains (losses) on swap agreements (1,371,131) 315,896Change in net unrealized appreciation/depreciation on
investment securities — 309,931Change in net unrealized appreciation/depreciation on
swap agreements 285,131 96,331
NET REALIZED AND UNREALIZED GAINS (LOSSES) ON INVESTMENTS (780,675) 771,244
CHANGE IN NET ASSETS RESULTING FROM OPERATIONS $ (915,518) $ 786,366
Amounts designated as “ – ” are $0 or have been rounded to $0.
See accompanying notes to the financial statements.
Toppan Merrill - ProFunds Public Semi-Annual Report [Funds] 01-31-2022 ED [AUX] | akiesli | 29-Mar-22 08:43 | 22-1296-2.ec | Sequence: 16CHKSUM Content: 33119 Layout: 12185 Graphics: 0 CLEAN
JOB: 22-1296-2 CYCLE#;BL#: 8; 0 TRIM: 8.25" x 10.75" AS: New York: 212-620-5600COLORS: ~note-color 2, Black, ~note-color 3 GRAPHICS: none V1.5

Statements of Changes in Net Assets
Toppan Merrill - ProFunds Public Semi-Annual Report [Funds] 01-31-2022 ED [AUX] | akiesli | 29-Mar-22 08:43 | 22-1296-2.ee | Sequence: 1CHKSUM Content: 50328 Layout: 44740 Graphics: 0 CLEAN
JOB: 22-1296-2 CYCLE#;BL#: 8; 0 TRIM: 8.25" x 10.75" AS: New York: 212-620-5600COLORS: Black, ~note-color 2 GRAPHICS: none V1.5

This Page Intentionally Left Blank
Toppan Merrill - ProFunds Public Semi-Annual Report [Funds] 01-31-2022 ED [AUX] | akiesli | 29-Mar-22 08:43 | 22-1296-2.ee | Sequence: 2CHKSUM Content: 40530 Layout: 34000 Graphics: 0 CLEAN
JOB: 22-1296-2 CYCLE#;BL#: 8; 0 TRIM: 8.25" x 10.75" AS: New York: 212-620-5600COLORS: Black, ~note-color 2 GRAPHICS: none V1.5

For the Periods Indicated :: Statements of Changes in Net Assets :: 213
Access Flex Access Flex Bear High Yield ProFund High Yield ProFund
Six Months Six Months Ended Nine Months Ended Nine Months
January 31, Ended Year Ended January 31, Ended Year Ended2022 July 31, October 31, 2022 July 31, October 31,
(unaudited) 2021 2020 (unaudited) 2021 2020
FROM INVESTMENT ACTIVITIES:
OPERATIONS:Net investment income (loss) $ (5,501) $ (6,766) $ (14,725) $ (105,648) $ (229,483) $ (295,418)Net realized gains (losses) on
investments (12,267) (44,954) (119,631) (95,370) 1,179,141 759,149Change in net unrealized
appreciation/depreciation on investments 26,343 (12,357) 8,535 (340,304) 347,460 (496,595)
Change in net assets resulting from operations 8,575 (64,077) (125,821) (541,322) 1,297,118 (32,864)
DISTRIBUTIONS TO SHAREHOLDERS:Total distributions
Investor Class — — — (51,036) (352,208) (473,488)Service Class — — — (5,949) (58,794) (73,610)
Return of CapitalInvestor Class — — — — — (51,279)Service Class — — — — — (7,972)
Change in net assets resulting from distributions — — — (56,985) (411,002) (606,349)
Change in net assets resulting from capital transactions 382,945 (339,063) 145,189 (8,410,632) (4,470,145) (3,640,067)
Change in net assets 391,520 (403,140) 19,368 (9,008,939) (3,584,029) (4,279,280)
NET ASSETS:Beginning of period 455,767 858,907 839,539 16,779,597 20,363,626 24,642,906 End of period $ 847,287 $ 455,767 $ 858,907 $ 7,770,658 $ 16,779,597 $ 20,363,626
CAPITAL TRANSACTIONS:
Investor ClassProceeds from shares issued $ 2,066,288 $ 1,430,464 $ 5,134,273 $ 14,643,286 $ 23,728,782 $ 100,359,693Distributions reinvested — — — 50,962 351,055 510,530Value of shares redeemed (1,679,840) (1,768,701) (4,971,541) (22,432,096) (29,153,053) (103,023,846)
Service ClassProceeds from shares issued — 29,755 712,479 934,650 2,325,033 10,267,023Distributions reinvested — — — 5,949 58,794 81,582Value of shares redeemed (3,503) (30,581) (730,022) (1,613,383) (1,780,756) (11,835,049)
Change in net assets resulting from capital transactions $ 382,945 $ (339,063) $ 145,189 $ (8,410,632) $ (4,470,145) $ (3,640,067)
SHARE TRANSACTIONS:
Investor ClassIssued 69,020 46,292 146,202 449,722 721,737 3,084,990Reinvested — — — 1,560 10,797 15,586Redeemed (56,247) (56,887) (144,619) (694,687) (884,650) (3,124,054)
Service ClassIssued — 1,104 24,676 28,697 71,651 313,888Reinvested — — — 184 1,825 2,534Redeemed (138) (1,158) (25,319) (50,335) (54,622) (369,466)
Change in shares 12,635 (10,649) 940 (264,859) (133,262) (76,522)
Amounts designated as “ – “ are $0 or have been rounded to $0.
See accompanying notes to the financial statements.
Toppan Merrill - ProFunds Public Semi-Annual Report [Funds] 01-31-2022 ED [AUX] | akiesli | 29-Mar-22 08:43 | 22-1296-2.ee | Sequence: 3CHKSUM Content: 42426 Layout: 65015 Graphics: 0 CLEAN
JOB: 22-1296-2 CYCLE#;BL#: 8; 0 TRIM: 8.25" x 10.75" AS: New York: 212-620-5600COLORS: ~note-color 2, Black, ~note-color 3 GRAPHICS: none V1.5

214 :: Statements of Changes in Net Assets :: For the Periods Indicated
Basic Materials Banks UltraSector ProFund UltraSector ProFund
Six Months Six MonthsEnded Ended
January 31, January 31,2022 Year Ended 2022 Year Ended
(unaudited) July 31, 2021 (unaudited) July 31, 2021
FROM INVESTMENT ACTIVITIES:
OPERATIONS:Net investment income (loss) $ (7,049) $ 199,223 $ (25,121) $ (31,878)Net realized gains (losses) on investments (1,716,900) (2,393,610) (150,210) 4,740,378Change in net unrealized appreciation/depreciation
on investments 3,462,781 2,972,910 (567,862) 1,784,522
Change in net assets resulting from operations 1,738,832 778,523 (743,193) 6,493,022
DISTRIBUTIONS TO SHAREHOLDERS:Total distributions
Investor Class — — — (90,892)Service Class — — — (1,014)
Change in net assets resulting from distributions — — — (91,906)
Change in net assets resulting from capital transactions (103,247,412) 115,153,415 (4,344,230) 2,115,676
Change in net assets (101,508,580) 115,931,938 (5,087,423) 8,516,792
NET ASSETS:Beginning of period 123,579,771 7,647,833 11,691,921 3,175,129
End of period $ 22,071,191 $ 123,579,771 $ 6,604,498 $ 11,691,921
CAPITAL TRANSACTIONS:Investor Class
Proceeds from shares issued $ 66,175,355 $ 280,573,254 $ 25,393,861 $ 124,798,999Distributions reinvested — — — 88,159Value of shares redeemed (169,025,228) (164,973,576) (29,786,607) (123,286,657)
Service ClassProceeds from shares issued 4,389,472 7,215,639 1,713,209 1,876,814Distributions reinvested — — — 1,014Value of shares redeemed (4,787,011) (7,661,902) (1,664,693) (1,362,653)
Change in net assets resulting from capital transactions $ (103,247,412) $ 115,153,415 $ (4,344,230) $ 2,115,676
SHARE TRANSACTIONS:Investor Class
Issued 999,099 5,333,883 245,591 1,565,960Reinvested — — — 1,108Redeemed (2,830,395) (3,429,571) (295,287) (1,507,370)
Service ClassIssued 74,196 185,428 18,572 24,047Reinvested — — — 15Redeemed (78,594) (179,001) (18,348) (17,963)
Change in shares (1,835,694) 1,910,739 (49,472) 65,797
* Consolidated Statement of Changes in Net Assets.** Period from commencement of operations.Amounts designated as “ – “ are $0 or have been rounded to $0.
See accompanying notes to the financial statements.
Toppan Merrill - ProFunds Public Semi-Annual Report [Funds] 01-31-2022 ED [AUX] | akiesli | 29-Mar-22 08:43 | 22-1296-2.ee | Sequence: 4CHKSUM Content: 33150 Layout: 50369 Graphics: 0 CLEAN
JOB: 22-1296-2 CYCLE#;BL#: 8; 0 TRIM: 8.25" x 10.75" AS: New York: 212-620-5600COLORS: ~note-color 2, Black, ~note-color 3 GRAPHICS: none V1.5
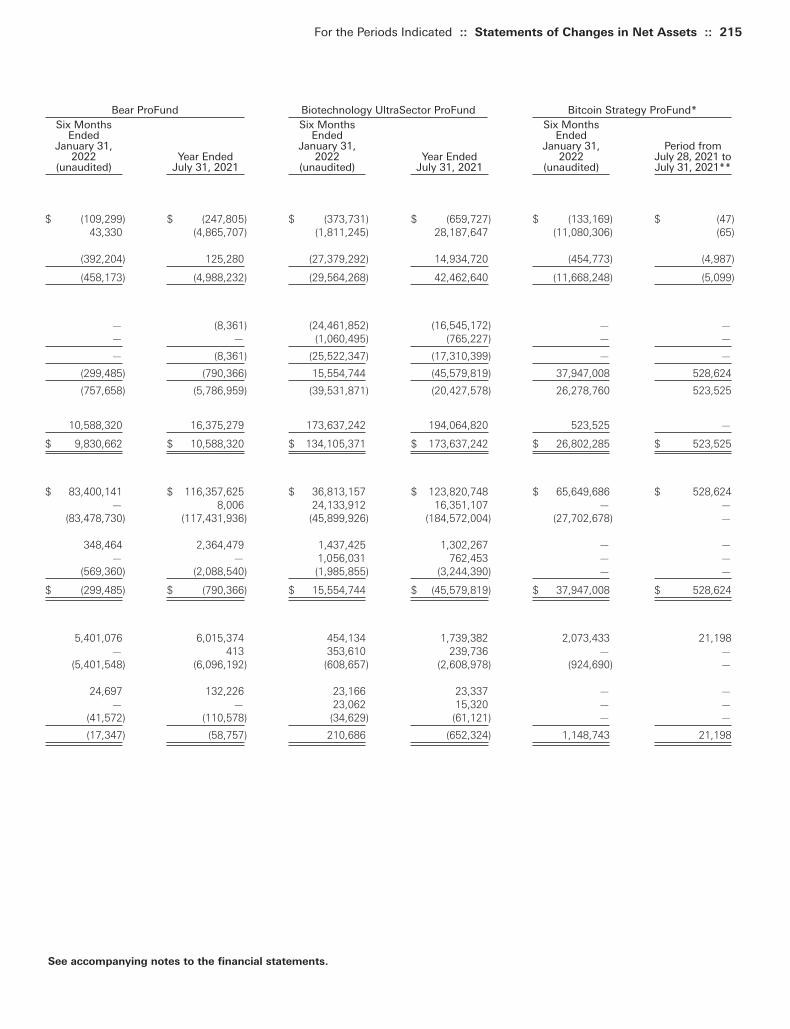
For the Periods Indicated :: Statements of Changes in Net Assets :: 215
See accompanying notes to the financial statements.
Bear ProFund Biotechnology UltraSector ProFund Bitcoin Strategy ProFund*Six Months Six Months Six Months
Ended Ended EndedJanuary 31, January 31, January 31, Period from
2022 Year Ended 2022 Year Ended 2022 July 28, 2021 to(unaudited) July 31, 2021 (unaudited) July 31, 2021 (unaudited) July 31, 2021**
$ (109,299) $ (247,805) $ (373,731) $ (659,727) $ (133,169) $ (47)43,330 (4,865,707) (1,811,245) 28,187,647 (11,080,306) (65)
(392,204) 125,280 (27,379,292) 14,934,720 (454,773) (4,987)
(458,173) (4,988,232) (29,564,268) 42,462,640 (11,668,248) (5,099)
— (8,361) (24,461,852) (16,545,172) — —— — (1,060,495) (765,227) — —
— (8,361) (25,522,347) (17,310,399) — —
(299,485) (790,366) 15,554,744 (45,579,819) 37,947,008 528,624
(757,658) (5,786,959) (39,531,871) (20,427,578) 26,278,760 523,525
10,588,320 16,375,279 173,637,242 194,064,820 523,525 —
$ 9,830,662 $ 10,588,320 $ 134,105,371 $ 173,637,242 $ 26,802,285 $ 523,525
$ 83,400,141 $ 116,357,625 $ 36,813,157 $ 123,820,748 $ 65,649,686 $ 528,624— 8,006 24,133,912 16,351,107 — —
(83,478,730) (117,431,936) (45,899,926) (184,572,004) (27,702,678) —
348,464 2,364,479 1,437,425 1,302,267 — —— — 1,056,031 762,453 — —
(569,360) (2,088,540) (1,985,855) (3,244,390) — —
$ (299,485) $ (790,366) $ 15,554,744 $ (45,579,819) $ 37,947,008 $ 528,624
5,401,076 6,015,374 454,134 1,739,382 2,073,433 21,198— 413 353,610 239,736 — —
(5,401,548) (6,096,192) (608,657) (2,608,978) (924,690) —
24,697 132,226 23,166 23,337 — —— — 23,062 15,320 — —
(41,572) (110,578) (34,629) (61,121) — —
(17,347) (58,757) 210,686 (652,324) 1,148,743 21,198
Toppan Merrill - ProFunds Public Semi-Annual Report [Funds] 01-31-2022 ED [AUX] | akiesli | 29-Mar-22 08:43 | 22-1296-2.ee | Sequence: 5CHKSUM Content: 64713 Layout: 38861 Graphics: 0 CLEAN
JOB: 22-1296-2 CYCLE#;BL#: 8; 0 TRIM: 8.25" x 10.75" AS: New York: 212-620-5600COLORS: ~HTML color, ~watermark, ~note-color 2, Black, ~note-color 3 GRAPHICS: none V1.5
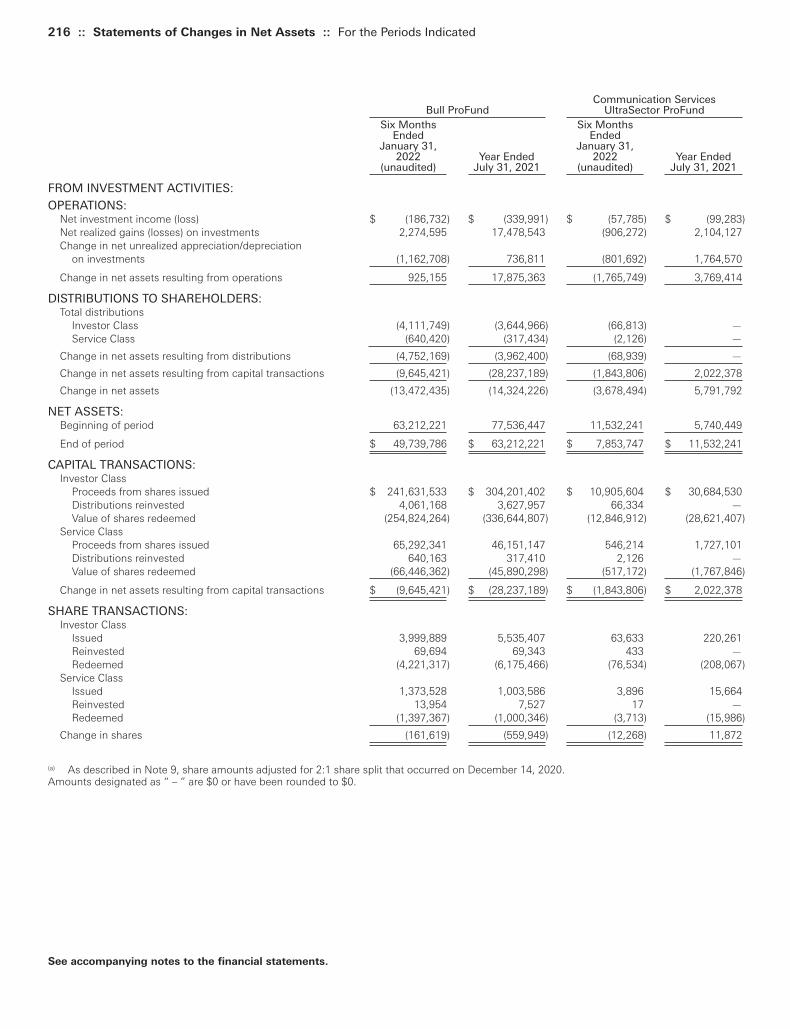
216 :: Statements of Changes in Net Assets :: For the Periods Indicated
Communication Services Bull ProFund UltraSector ProFund
Six Months Six MonthsEnded Ended
January 31, January 31,2022 Year Ended 2022 Year Ended
(unaudited) July 31, 2021 (unaudited) July 31, 2021
FROM INVESTMENT ACTIVITIES:
OPERATIONS:Net investment income (loss) $ (186,732) $ (339,991) $ (57,785) $ (99,283)Net realized gains (losses) on investments 2,274,595 17,478,543 (906,272) 2,104,127Change in net unrealized appreciation/depreciation
on investments (1,162,708) 736,811 (801,692) 1,764,570
Change in net assets resulting from operations 925,155 17,875,363 (1,765,749) 3,769,414
DISTRIBUTIONS TO SHAREHOLDERS:Total distributions
Investor Class (4,111,749) (3,644,966) (66,813) —Service Class (640,420) (317,434) (2,126) —
Change in net assets resulting from distributions (4,752,169) (3,962,400) (68,939) —
Change in net assets resulting from capital transactions (9,645,421) (28,237,189) (1,843,806) 2,022,378
Change in net assets (13,472,435) (14,324,226) (3,678,494) 5,791,792
NET ASSETS:Beginning of period 63,212,221 77,536,447 11,532,241 5,740,449
End of period $ 49,739,786 $ 63,212,221 $ 7,853,747 $ 11,532,241
CAPITAL TRANSACTIONS:Investor Class
Proceeds from shares issued $ 241,631,533 $ 304,201,402 $ 10,905,604 $ 30,684,530Distributions reinvested 4,061,168 3,627,957 66,334 —Value of shares redeemed (254,824,264) (336,644,807) (12,846,912) (28,621,407)
Service ClassProceeds from shares issued 65,292,341 46,151,147 546,214 1,727,101Distributions reinvested 640,163 317,410 2,126 —Value of shares redeemed (66,446,362) (45,890,298) (517,172) (1,767,846)
Change in net assets resulting from capital transactions $ (9,645,421) $ (28,237,189) $ (1,843,806) $ 2,022,378
SHARE TRANSACTIONS:Investor Class
Issued 3,999,889 5,535,407 63,633 220,261Reinvested 69,694 69,343 433 —Redeemed (4,221,317) (6,175,466) (76,534) (208,067)
Service ClassIssued 1,373,528 1,003,586 3,896 15,664Reinvested 13,954 7,527 17 —Redeemed (1,397,367) (1,000,346) (3,713) (15,986)
Change in shares (161,619) (559,949) (12,268) 11,872
(a) As described in Note 9, share amounts adjusted for 2:1 share split that occurred on December 14, 2020.Amounts designated as “ – ” are $0 or have been rounded to $0.
See accompanying notes to the financial statements.
Toppan Merrill - ProFunds Public Semi-Annual Report [Funds] 01-31-2022 ED [AUX] | akiesli | 29-Mar-22 08:43 | 22-1296-2.ee | Sequence: 6CHKSUM Content: 23123 Layout: 50369 Graphics: 0 CLEAN
JOB: 22-1296-2 CYCLE#;BL#: 8; 0 TRIM: 8.25" x 10.75" AS: New York: 212-620-5600COLORS: ~note-color 2, Black, ~note-color 3 GRAPHICS: none V1.5
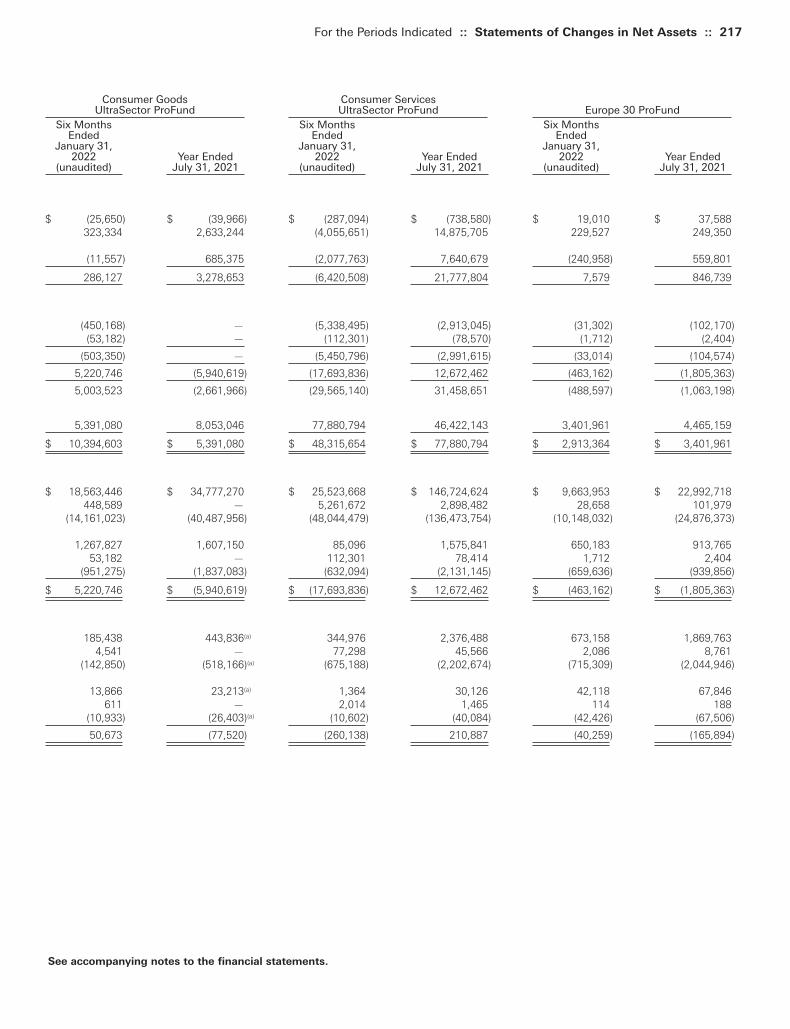
For the Periods Indicated :: Statements of Changes in Net Assets :: 217
See accompanying notes to the financial statements.
Consumer Goods Consumer ServicesUltraSector ProFund UltraSector ProFund Europe 30 ProFund
Six Months Six Months Six MonthsEnded Ended Ended
January 31, January 31, January 31,2022 Year Ended 2022 Year Ended 2022 Year Ended
(unaudited) July 31, 2021 (unaudited) July 31, 2021 (unaudited) July 31, 2021
$ (25,650) $ (39,966) $ (287,094) $ (738,580) $ 19,010 $ 37,588323,334 2,633,244 (4,055,651) 14,875,705 229,527 249,350
(11,557) 685,375 (2,077,763) 7,640,679 (240,958) 559,801
286,127 3,278,653 (6,420,508) 21,777,804 7,579 846,739
(450,168) — (5,338,495) (2,913,045) (31,302) (102,170)(53,182) — (112,301) (78,570) (1,712) (2,404)
(503,350) — (5,450,796) (2,991,615) (33,014) (104,574)
5,220,746 (5,940,619) (17,693,836) 12,672,462 (463,162) (1,805,363)
5,003,523 (2,661,966) (29,565,140) 31,458,651 (488,597) (1,063,198)
5,391,080 8,053,046 77,880,794 46,422,143 3,401,961 4,465,159
$ 10,394,603 $ 5,391,080 $ 48,315,654 $ 77,880,794 $ 2,913,364 $ 3,401,961
$ 18,563,446 $ 34,777,270 $ 25,523,668 $ 146,724,624 $ 9,663,953 $ 22,992,718448,589 — 5,261,672 2,898,482 28,658 101,979
(14,161,023) (40,487,956) (48,044,479) (136,473,754) (10,148,032) (24,876,373)
1,267,827 1,607,150 85,096 1,575,841 650,183 913,76553,182 — 112,301 78,414 1,712 2,404
(951,275) (1,837,083) (632,094) (2,131,145) (659,636) (939,856)
$ 5,220,746 $ (5,940,619) $ (17,693,836) $ 12,672,462 $ (463,162) $ (1,805,363)
185,438 443,836(a) 344,976 2,376,488 673,158 1,869,7634,541 — 77,298 45,566 2,086 8,761
(142,850) (518,166)(a) (675,188) (2,202,674) (715,309) (2,044,946)
13,866 23,213(a) 1,364 30,126 42,118 67,846611 — 2,014 1,465 114 188
(10,933) (26,403)(a) (10,602) (40,084) (42,426) (67,506)
50,673 (77,520) (260,138) 210,887 (40,259) (165,894)
Toppan Merrill - ProFunds Public Semi-Annual Report [Funds] 01-31-2022 ED [AUX] | akiesli | 29-Mar-22 08:43 | 22-1296-2.ee | Sequence: 7CHKSUM Content: 51527 Layout: 38861 Graphics: 0 CLEAN
JOB: 22-1296-2 CYCLE#;BL#: 8; 0 TRIM: 8.25" x 10.75" AS: New York: 212-620-5600COLORS: ~HTML color, ~watermark, ~note-color 2, Black, ~note-color 3 GRAPHICS: none V1.5
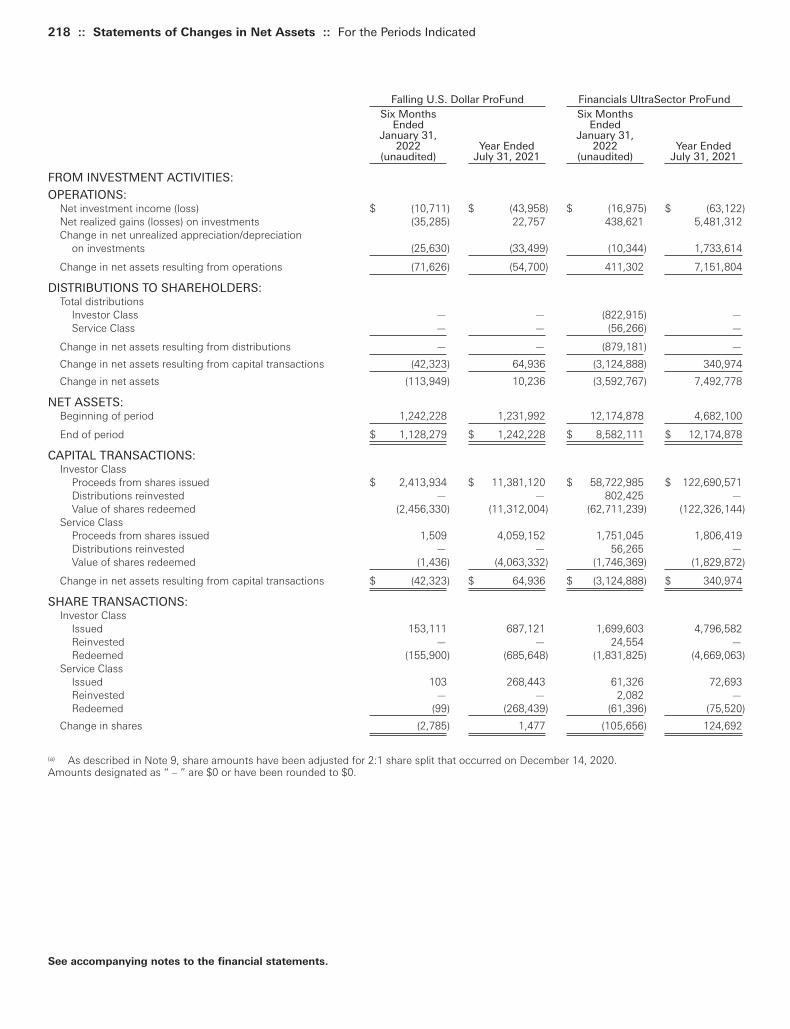
218 :: Statements of Changes in Net Assets :: For the Periods Indicated
Falling U.S. Dollar ProFund Financials UltraSector ProFundSix Months Six Months
Ended EndedJanuary 31, January 31,
2022 Year Ended 2022 Year Ended(unaudited) July 31, 2021 (unaudited) July 31, 2021
FROM INVESTMENT ACTIVITIES:
OPERATIONS:Net investment income (loss) $ (10,711) $ (43,958) $ (16,975) $ (63,122)Net realized gains (losses) on investments (35,285) 22,757 438,621 5,481,312Change in net unrealized appreciation/depreciation
on investments (25,630) (33,499) (10,344) 1,733,614
Change in net assets resulting from operations (71,626) (54,700) 411,302 7,151,804
DISTRIBUTIONS TO SHAREHOLDERS:Total distributions
Investor Class — — (822,915) —Service Class — — (56,266) —
Change in net assets resulting from distributions — — (879,181) —
Change in net assets resulting from capital transactions (42,323) 64,936 (3,124,888) 340,974
Change in net assets (113,949) 10,236 (3,592,767) 7,492,778
NET ASSETS:Beginning of period 1,242,228 1,231,992 12,174,878 4,682,100
End of period $ 1,128,279 $ 1,242,228 $ 8,582,111 $ 12,174,878
CAPITAL TRANSACTIONS:Investor Class
Proceeds from shares issued $ 2,413,934 $ 11,381,120 $ 58,722,985 $ 122,690,571Distributions reinvested — — 802,425 —Value of shares redeemed (2,456,330) (11,312,004) (62,711,239) (122,326,144)
Service ClassProceeds from shares issued 1,509 4,059,152 1,751,045 1,806,419Distributions reinvested — — 56,265 —Value of shares redeemed (1,436) (4,063,332) (1,746,369) (1,829,872)
Change in net assets resulting from capital transactions $ (42,323) $ 64,936 $ (3,124,888) $ 340,974
SHARE TRANSACTIONS:Investor Class
Issued 153,111 687,121 1,699,603 4,796,582Reinvested — — 24,554 —Redeemed (155,900) (685,648) (1,831,825) (4,669,063)
Service ClassIssued 103 268,443 61,326 72,693Reinvested — — 2,082 —Redeemed (99) (268,439) (61,396) (75,520)
Change in shares (2,785) 1,477 (105,656) 124,692
(a) As described in Note 9, share amounts have been adjusted for 2:1 share split that occurred on December 14, 2020.Amounts designated as “ – ” are $0 or have been rounded to $0.
See accompanying notes to the financial statements.
Toppan Merrill - ProFunds Public Semi-Annual Report [Funds] 01-31-2022 ED [AUX] | akiesli | 29-Mar-22 08:43 | 22-1296-2.ee | Sequence: 8CHKSUM Content: 56283 Layout: 21046 Graphics: 0 CLEAN
JOB: 22-1296-2 CYCLE#;BL#: 8; 0 TRIM: 8.25" x 10.75" AS: New York: 212-620-5600COLORS: ~note-color 2, Black, ~note-color 3 GRAPHICS: none V1.5
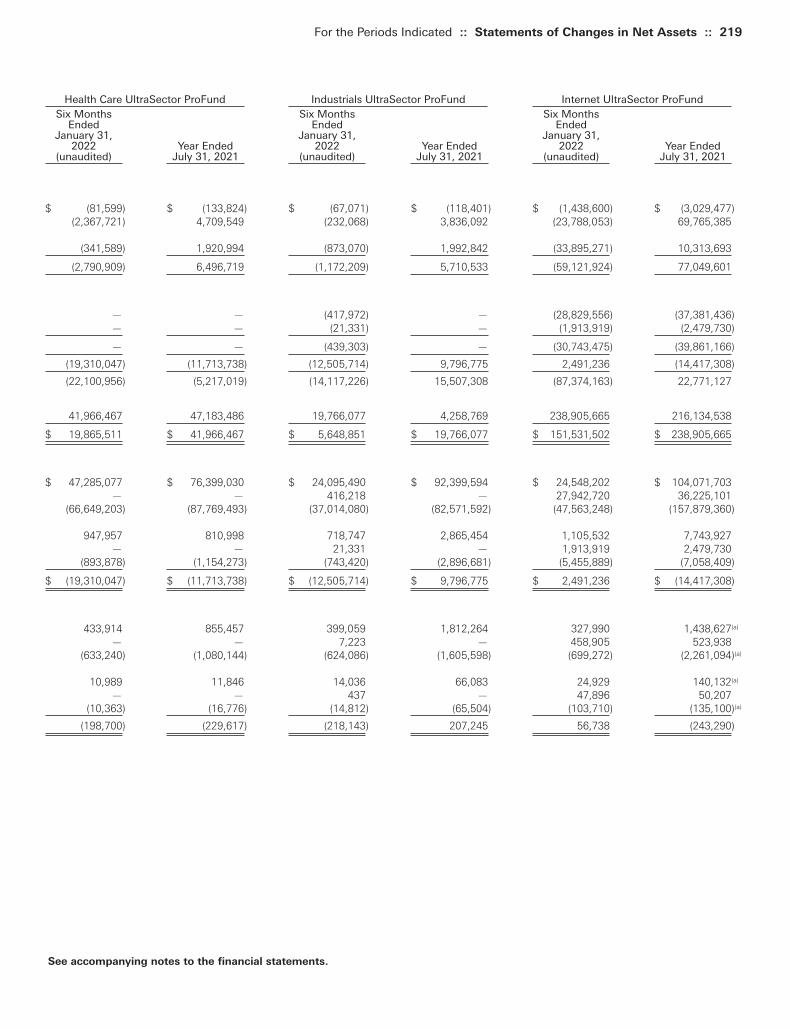
For the Periods Indicated :: Statements of Changes in Net Assets :: 219
See accompanying notes to the financial statements.
Health Care UltraSector ProFund Industrials UltraSector ProFund Internet UltraSector ProFundSix Months Six Months Six Months
Ended Ended EndedJanuary 31, January 31, January 31,
2022 Year Ended 2022 Year Ended 2022 Year Ended(unaudited) July 31, 2021 (unaudited) July 31, 2021 (unaudited) July 31, 2021
$ (81,599) $ (133,824) $ (67,071) $ (118,401) $ (1,438,600) $ (3,029,477)(2,367,721) 4,709,549 (232,068) 3,836,092 (23,788,053) 69,765,385
(341,589) 1,920,994 (873,070) 1,992,842 (33,895,271) 10,313,693
(2,790,909) 6,496,719 (1,172,209) 5,710,533 (59,121,924) 77,049,601
— — (417,972) — (28,829,556) (37,381,436)— — (21,331) — (1,913,919) (2,479,730)
— — (439,303) — (30,743,475) (39,861,166)
(19,310,047) (11,713,738) (12,505,714) 9,796,775 2,491,236 (14,417,308)
(22,100,956) (5,217,019) (14,117,226) 15,507,308 (87,374,163) 22,771,127
41,966,467 47,183,486 19,766,077 4,258,769 238,905,665 216,134,538
$ 19,865,511 $ 41,966,467 $ 5,648,851 $ 19,766,077 $ 151,531,502 $ 238,905,665
$ 47,285,077 $ 76,399,030 $ 24,095,490 $ 92,399,594 $ 24,548,202 $ 104,071,703— — 416,218 — 27,942,720 36,225,101
(66,649,203) (87,769,493) (37,014,080) (82,571,592) (47,563,248) (157,879,360)
947,957 810,998 718,747 2,865,454 1,105,532 7,743,927— — 21,331 — 1,913,919 2,479,730
(893,878) (1,154,273) (743,420) (2,896,681) (5,455,889) (7,058,409)
$ (19,310,047) $ (11,713,738) $ (12,505,714) $ 9,796,775 $ 2,491,236 $ (14,417,308)
433,914 855,457 399,059 1,812,264 327,990 1,438,627(a)
— — 7,223 — 458,905 523,938(633,240) (1,080,144) (624,086) (1,605,598) (699,272) (2,261,094)(a)
10,989 11,846 14,036 66,083 24,929 140,132(a)
— — 437 — 47,896 50,207(10,363) (16,776) (14,812) (65,504) (103,710) (135,100)(a)
(198,700) (229,617) (218,143) 207,245 56,738 (243,290)
Toppan Merrill - ProFunds Public Semi-Annual Report [Funds] 01-31-2022 ED [AUX] | akiesli | 29-Mar-22 08:43 | 22-1296-2.ee | Sequence: 9CHKSUM Content: 7523 Layout: 47628 Graphics: 0 CLEAN
JOB: 22-1296-2 CYCLE#;BL#: 8; 0 TRIM: 8.25" x 10.75" AS: New York: 212-620-5600COLORS: ~HTML color, ~watermark, ~note-color 2, Black, ~note-color 3 GRAPHICS: none V1.5
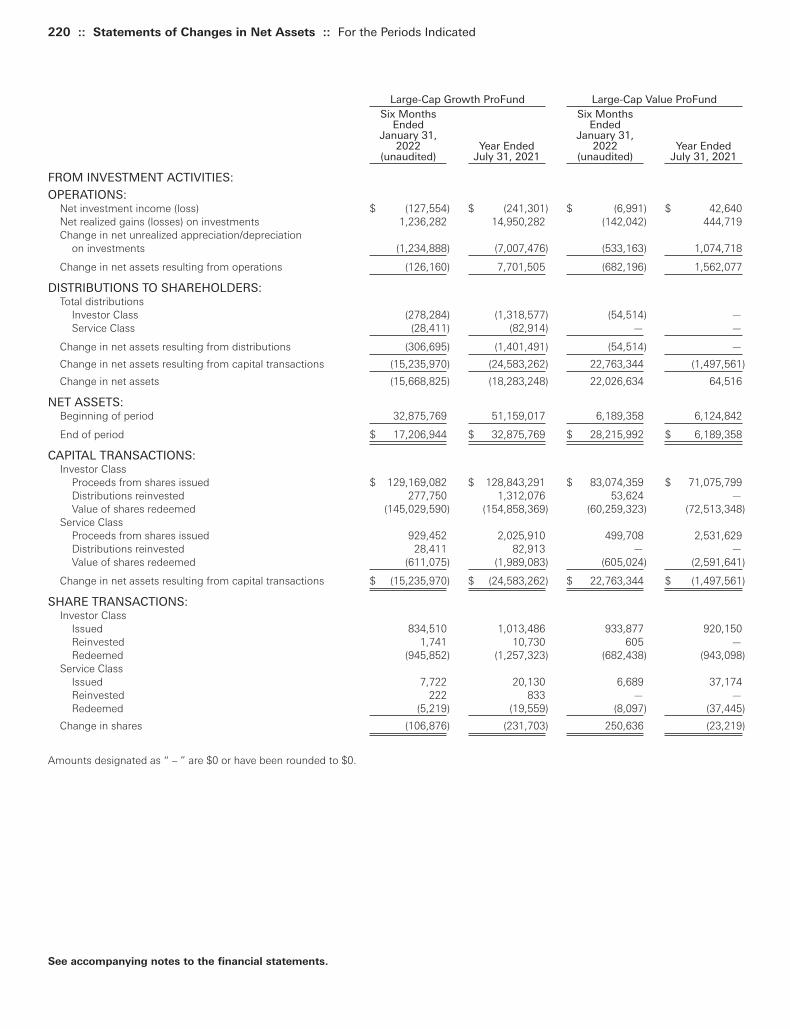
220 :: Statements of Changes in Net Assets :: For the Periods Indicated
Large-Cap Growth ProFund Large-Cap Value ProFundSix Months Six Months
Ended EndedJanuary 31, January 31,
2022 Year Ended 2022 Year Ended(unaudited) July 31, 2021 (unaudited) July 31, 2021
FROM INVESTMENT ACTIVITIES:
OPERATIONS:Net investment income (loss) $ (127,554) $ (241,301) $ (6,991) $ 42,640Net realized gains (losses) on investments 1,236,282 14,950,282 (142,042) 444,719Change in net unrealized appreciation/depreciation
on investments (1,234,888) (7,007,476) (533,163) 1,074,718
Change in net assets resulting from operations (126,160) 7,701,505 (682,196) 1,562,077
DISTRIBUTIONS TO SHAREHOLDERS:Total distributions
Investor Class (278,284) (1,318,577) (54,514) —Service Class (28,411) (82,914) — —
Change in net assets resulting from distributions (306,695) (1,401,491) (54,514) —
Change in net assets resulting from capital transactions (15,235,970) (24,583,262) 22,763,344 (1,497,561)
Change in net assets (15,668,825) (18,283,248) 22,026,634 64,516
NET ASSETS:Beginning of period 32,875,769 51,159,017 6,189,358 6,124,842
End of period $ 17,206,944 $ 32,875,769 $ 28,215,992 $ 6,189,358
CAPITAL TRANSACTIONS:Investor Class
Proceeds from shares issued $ 129,169,082 $ 128,843,291 $ 83,074,359 $ 71,075,799Distributions reinvested 277,750 1,312,076 53,624 —Value of shares redeemed (145,029,590) (154,858,369) (60,259,323) (72,513,348)
Service ClassProceeds from shares issued 929,452 2,025,910 499,708 2,531,629Distributions reinvested 28,411 82,913 — —Value of shares redeemed (611,075) (1,989,083) (605,024) (2,591,641)
Change in net assets resulting from capital transactions $ (15,235,970) $ (24,583,262) $ 22,763,344 $ (1,497,561)
SHARE TRANSACTIONS:Investor Class
Issued 834,510 1,013,486 933,877 920,150Reinvested 1,741 10,730 605 —Redeemed (945,852) (1,257,323) (682,438) (943,098)
Service ClassIssued 7,722 20,130 6,689 37,174Reinvested 222 833 — —Redeemed (5,219) (19,559) (8,097) (37,445)
Change in shares (106,876) (231,703) 250,636 (23,219)
Amounts designated as “ – ” are $0 or have been rounded to $0.
See accompanying notes to the financial statements.
Toppan Merrill - ProFunds Public Semi-Annual Report [Funds] 01-31-2022 ED [AUX] | akiesli | 29-Mar-22 08:43 | 22-1296-2.ee | Sequence: 10CHKSUM Content: 8089 Layout: 41193 Graphics: 0 CLEAN
JOB: 22-1296-2 CYCLE#;BL#: 8; 0 TRIM: 8.25" x 10.75" AS: New York: 212-620-5600COLORS: ~note-color 2, Black, ~note-color 3 GRAPHICS: none V1.5
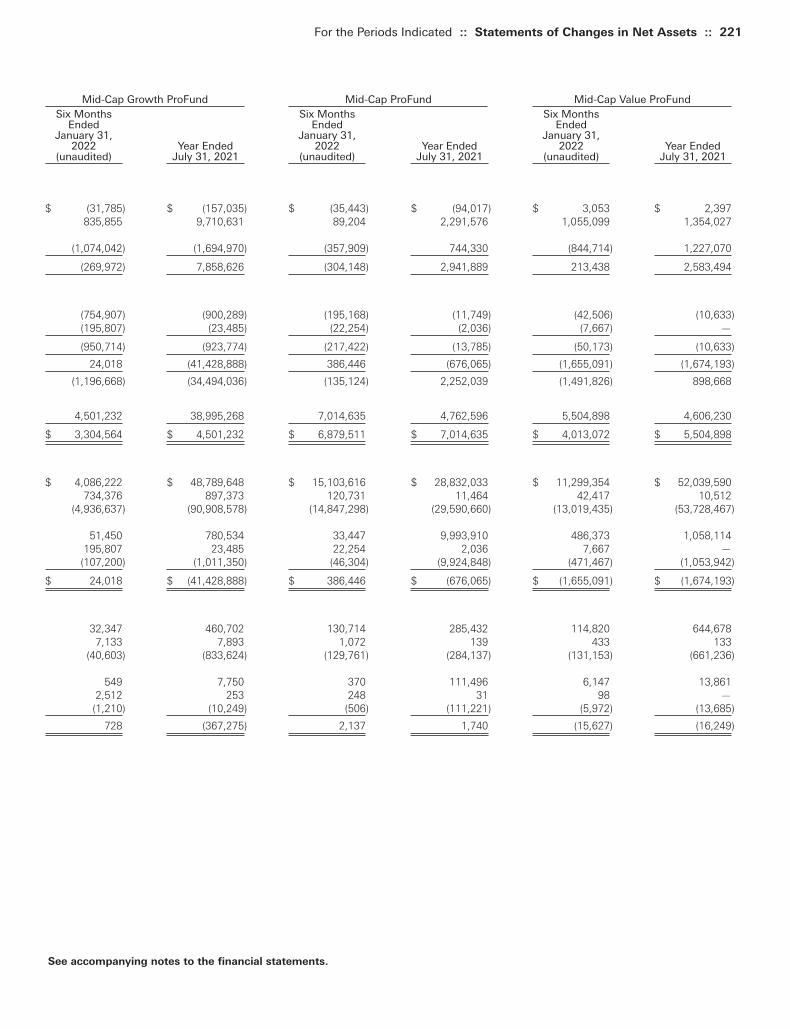
For the Periods Indicated :: Statements of Changes in Net Assets :: 221
See accompanying notes to the financial statements.
Mid-Cap Growth ProFund Mid-Cap ProFund Mid-Cap Value ProFundSix Months Six Months Six Months
Ended Ended EndedJanuary 31, January 31, January 31,
2022 Year Ended 2022 Year Ended 2022 Year Ended(unaudited) July 31, 2021 (unaudited) July 31, 2021 (unaudited) July 31, 2021
$ (31,785) $ (157,035) $ (35,443) $ (94,017) $ 3,053 $ 2,397835,855 9,710,631 89,204 2,291,576 1,055,099 1,354,027
(1,074,042) (1,694,970) (357,909) 744,330 (844,714) 1,227,070
(269,972) 7,858,626 (304,148) 2,941,889 213,438 2,583,494
(754,907) (900,289) (195,168) (11,749) (42,506) (10,633)(195,807) (23,485) (22,254) (2,036) (7,667) —
(950,714) (923,774) (217,422) (13,785) (50,173) (10,633)
24,018 (41,428,888) 386,446 (676,065) (1,655,091) (1,674,193)
(1,196,668) (34,494,036) (135,124) 2,252,039 (1,491,826) 898,668
4,501,232 38,995,268 7,014,635 4,762,596 5,504,898 4,606,230
$ 3,304,564 $ 4,501,232 $ 6,879,511 $ 7,014,635 $ 4,013,072 $ 5,504,898
$ 4,086,222 $ 48,789,648 $ 15,103,616 $ 28,832,033 $ 11,299,354 $ 52,039,590734,376 897,373 120,731 11,464 42,417 10,512
(4,936,637) (90,908,578) (14,847,298) (29,590,660) (13,019,435) (53,728,467)
51,450 780,534 33,447 9,993,910 486,373 1,058,114195,807 23,485 22,254 2,036 7,667 —
(107,200) (1,011,350) (46,304) (9,924,848) (471,467) (1,053,942)
$ 24,018 $ (41,428,888) $ 386,446 $ (676,065) $ (1,655,091) $ (1,674,193)
32,347 460,702 130,714 285,432 114,820 644,6787,133 7,893 1,072 139 433 133
(40,603) (833,624) (129,761) (284,137) (131,153) (661,236)
549 7,750 370 111,496 6,147 13,8612,512 253 248 31 98 —
(1,210) (10,249) (506) (111,221) (5,972) (13,685)
728 (367,275) 2,137 1,740 (15,627) (16,249)
Toppan Merrill - ProFunds Public Semi-Annual Report [Funds] 01-31-2022 ED [AUX] | akiesli | 29-Mar-22 08:43 | 22-1296-2.ee | Sequence: 11CHKSUM Content: 25792 Layout: 28111 Graphics: 0 CLEAN
JOB: 22-1296-2 CYCLE#;BL#: 8; 0 TRIM: 8.25" x 10.75" AS: New York: 212-620-5600COLORS: ~HTML color, ~watermark, ~note-color 2, Black, ~note-color 3 GRAPHICS: none V1.5

222 :: Statements of Changes in Net Assets :: For the Periods Indicated
Nasdaq-100 ProFund Oil & Gas UltraSector ProFundSix Months Six Months
Ended EndedJanuary 31, January 31,
2022 Year Ended 2022 Year Ended(unaudited) July 31, 2021 (unaudited) July 31, 2021
FROM INVESTMENT ACTIVITIES:
OPERATIONS:Net investment income (loss) $ (857,655) $ (1,440,710) $ 252,866 $ 283,287Net realized gains (losses) on investments (96,250) 49,548,419 4,668,276 1,997,497Change in net unrealized appreciation/depreciation
on investments 1,328,194 (1,140,246) 6,997,293 5,231,581
Change in net assets resulting from operations 374,289 46,967,463 11,918,435 7,512,365
DISTRIBUTIONS TO SHAREHOLDERS:Total distributions
Investor Class (3,999,177) (1,699,607) (414,015) (215,825)Service Class (342,037) (140,663) (13,283) (11,849)
Change in net assets resulting from distributions (4,341,214) (1,840,270) (427,298) (227,674)
Change in net assets resulting from capital transactions (78,809,590) (1,387,478) (2,913,793) 11,693,861
Change in net assets (82,776,515) 43,739,715 8,577,344 18,978,552
NET ASSETS:Beginning of period 160,785,238 117,045,523 31,148,210 12,169,658
End of period $ 78,008,723 $ 160,785,238 $ 39,725,554 $ 31,148,210
CAPITAL TRANSACTIONS:Investor Class
Proceeds from shares issued $ 1,198,318,172 $ 2,010,517,783 $ 74,377,731 $ 152,137,320Distributions reinvested 3,780,484 1,622,688 386,402 213,432Value of shares redeemed (1,281,182,144) (2,010,283,479) (77,180,214) (141,055,955)
Service ClassProceeds from shares issued 10,274,691 36,545,794 3,104,050 4,492,764Distributions reinvested 342,037 140,552 13,258 11,844Value of shares redeemed (10,342,830) (39,930,816) (3,615,020) (4,105,544)
Change in net assets resulting from capital transactions $ (78,809,590) $ (1,387,478) $ (2,913,793) $ 11,693,861
SHARE TRANSACTIONS:Investor Class
Issued 8,399,393 16,905,892 3,151,616 9,020,144Reinvested 25,728 13,605 16,727 16,317Redeemed (8,999,807) (16,860,603) (3,409,673) (8,462,784)
Service ClassIssued 89,669 370,016 165,507 318,482Reinvested 2,947 1,468 671 1,056Redeemed (91,630) (404,105) (185,395) (295,922)
Change in shares (573,700) 26,273 (260,547) 597,293
(a) As described in Note 9, share amounts have been adjusted for 1:4 reverse share split that occurred on December 14, 2020.Amounts designated as “ – “ are $0 or have been rounded to $0.
See accompanying notes to the financial statements.
Toppan Merrill - ProFunds Public Semi-Annual Report [Funds] 01-31-2022 ED [AUX] | akiesli | 29-Mar-22 08:43 | 22-1296-2.ee | Sequence: 12CHKSUM Content: 62855 Layout: 31571 Graphics: 0 CLEAN
JOB: 22-1296-2 CYCLE#;BL#: 8; 0 TRIM: 8.25" x 10.75" AS: New York: 212-620-5600COLORS: ~note-color 2, Black, ~note-color 3 GRAPHICS: none V1.5
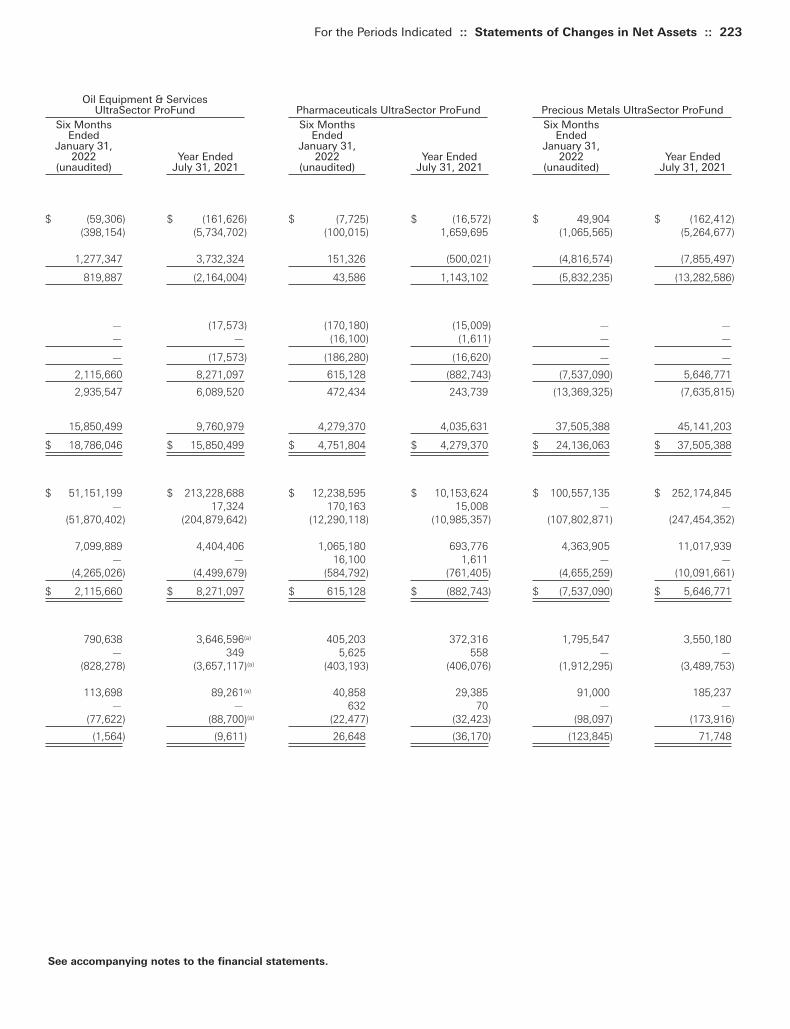
Oil Equipment & ServicesUltraSector ProFund Pharmaceuticals UltraSector ProFund Precious Metals UltraSector ProFund
Six Months Six Months Six MonthsEnded Ended Ended
January 31, January 31, January 31,2022 Year Ended 2022 Year Ended 2022 Year Ended
(unaudited) July 31, 2021 (unaudited) July 31, 2021 (unaudited) July 31, 2021
$ (59,306) $ (161,626) $ (7,725) $ (16,572) $ 49,904 $ (162,412)(398,154) (5,734,702) (100,015) 1,659,695 (1,065,565) (5,264,677)
1,277,347 3,732,324 151,326 (500,021) (4,816,574) (7,855,497)
819,887 (2,164,004) 43,586 1,143,102 (5,832,235) (13,282,586)
— (17,573) (170,180) (15,009) — —— — (16,100) (1,611) — —
— (17,573) (186,280) (16,620) — —
2,115,660 8,271,097 615,128 (882,743) (7,537,090) 5,646,771
2,935,547 6,089,520 472,434 243,739 (13,369,325) (7,635,815)
15,850,499 9,760,979 4,279,370 4,035,631 37,505,388 45,141,203
$ 18,786,046 $ 15,850,499 $ 4,751,804 $ 4,279,370 $ 24,136,063 $ 37,505,388
$ 51,151,199 $ 213,228,688 $ 12,238,595 $ 10,153,624 $ 100,557,135 $ 252,174,845— 17,324 170,163 15,008 — —
(51,870,402) (204,879,642) (12,290,118) (10,985,357) (107,802,871) (247,454,352)
7,099,889 4,404,406 1,065,180 693,776 4,363,905 11,017,939— — 16,100 1,611 — —
(4,265,026) (4,499,679) (584,792) (761,405) (4,655,259) (10,091,661)
$ 2,115,660 $ 8,271,097 $ 615,128 $ (882,743) $ (7,537,090) $ 5,646,771
790,638 3,646,596(a) 405,203 372,316 1,795,547 3,550,180— 349 5,625 558 — —
(828,278) (3,657,117)(a) (403,193) (406,076) (1,912,295) (3,489,753)
113,698 89,261(a) 40,858 29,385 91,000 185,237— — 632 70 — —
(77,622) (88,700)(a) (22,477) (32,423) (98,097) (173,916)
(1,564) (9,611) 26,648 (36,170) (123,845) 71,748
For the Periods Indicated :: Statements of Changes in Net Assets :: 223
See accompanying notes to the financial statements.
Toppan Merrill - ProFunds Public Semi-Annual Report [Funds] 01-31-2022 ED [AUX] | akiesli | 29-Mar-22 08:43 | 22-1296-2.ee | Sequence: 13CHKSUM Content: 45632 Layout: 50575 Graphics: 0 CLEAN
JOB: 22-1296-2 CYCLE#;BL#: 8; 0 TRIM: 8.25" x 10.75" AS: New York: 212-620-5600COLORS: ~HTML color, ~watermark, ~note-color 2, Black, ~note-color 3 GRAPHICS: none V1.5
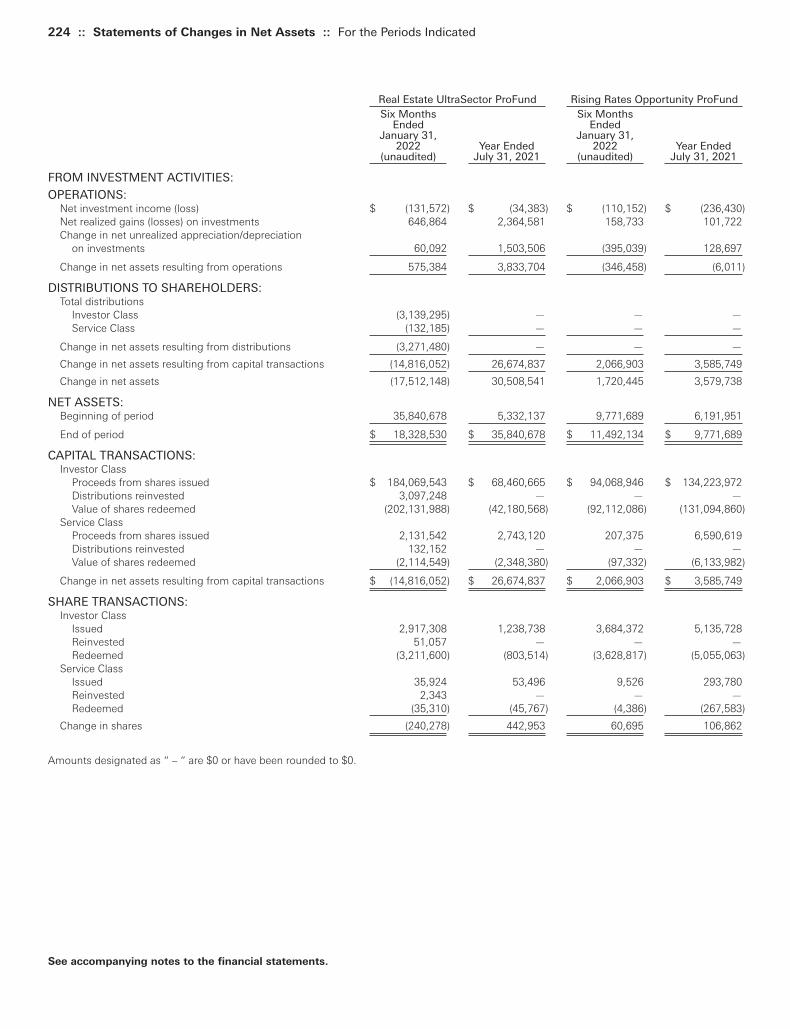
224 :: Statements of Changes in Net Assets :: For the Periods Indicated
Real Estate UltraSector ProFund Rising Rates Opportunity ProFundSix Months Six Months
Ended EndedJanuary 31, January 31,
2022 Year Ended 2022 Year Ended(unaudited) July 31, 2021 (unaudited) July 31, 2021
FROM INVESTMENT ACTIVITIES:
OPERATIONS:Net investment income (loss) $ (131,572) $ (34,383) $ (110,152) $ (236,430)Net realized gains (losses) on investments 646,864 2,364,581 158,733 101,722Change in net unrealized appreciation/depreciation
on investments 60,092 1,503,506 (395,039) 128,697
Change in net assets resulting from operations 575,384 3,833,704 (346,458) (6,011)
DISTRIBUTIONS TO SHAREHOLDERS:Total distributions
Investor Class (3,139,295) — — —Service Class (132,185) — — —
Change in net assets resulting from distributions (3,271,480) — — —
Change in net assets resulting from capital transactions (14,816,052) 26,674,837 2,066,903 3,585,749
Change in net assets (17,512,148) 30,508,541 1,720,445 3,579,738
NET ASSETS:Beginning of period 35,840,678 5,332,137 9,771,689 6,191,951
End of period $ 18,328,530 $ 35,840,678 $ 11,492,134 $ 9,771,689
CAPITAL TRANSACTIONS:Investor Class
Proceeds from shares issued $ 184,069,543 $ 68,460,665 $ 94,068,946 $ 134,223,972Distributions reinvested 3,097,248 — — —Value of shares redeemed (202,131,988) (42,180,568) (92,112,086) (131,094,860)
Service ClassProceeds from shares issued 2,131,542 2,743,120 207,375 6,590,619Distributions reinvested 132,152 — — —Value of shares redeemed (2,114,549) (2,348,380) (97,332) (6,133,982)
Change in net assets resulting from capital transactions $ (14,816,052) $ 26,674,837 $ 2,066,903 $ 3,585,749
SHARE TRANSACTIONS:Investor Class
Issued 2,917,308 1,238,738 3,684,372 5,135,728Reinvested 51,057 — — —Redeemed (3,211,600) (803,514) (3,628,817) (5,055,063)
Service ClassIssued 35,924 53,496 9,526 293,780Reinvested 2,343 — — —Redeemed (35,310) (45,767) (4,386) (267,583)
Change in shares (240,278) 442,953 60,695 106,862
Amounts designated as “ – “ are $0 or have been rounded to $0.
See accompanying notes to the financial statements.
Toppan Merrill - ProFunds Public Semi-Annual Report [Funds] 01-31-2022 ED [AUX] | akiesli | 29-Mar-22 08:43 | 22-1296-2.ee | Sequence: 14CHKSUM Content: 25353 Layout: 41193 Graphics: 0 CLEAN
JOB: 22-1296-2 CYCLE#;BL#: 8; 0 TRIM: 8.25" x 10.75" AS: New York: 212-620-5600COLORS: ~note-color 2, Black, ~note-color 3 GRAPHICS: none V1.5
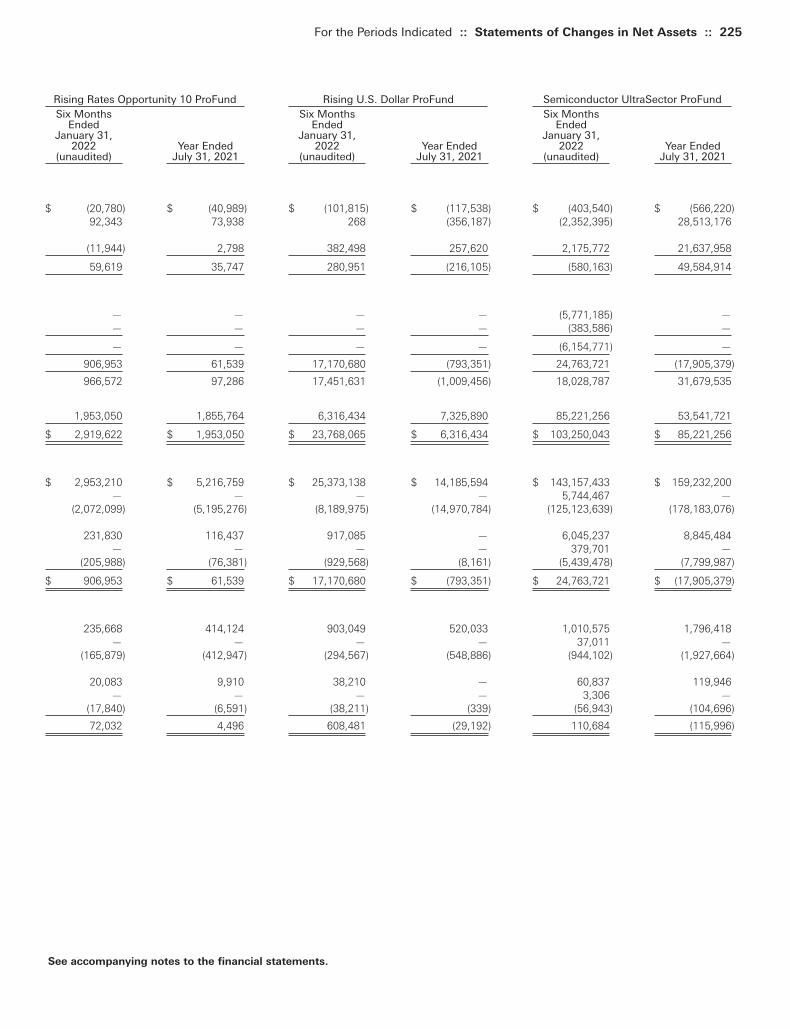
Rising Rates Opportunity 10 ProFund Rising U.S. Dollar ProFund Semiconductor UltraSector ProFundSix Months Six Months Six Months
Ended Ended EndedJanuary 31, January 31, January 31,
2022 Year Ended 2022 Year Ended 2022 Year Ended(unaudited) July 31, 2021 (unaudited) July 31, 2021 (unaudited) July 31, 2021
$ (20,780) $ (40,989) $ (101,815) $ (117,538) $ (403,540) $ (566,220)92,343 73,938 268 (356,187) (2,352,395) 28,513,176
(11,944) 2,798 382,498 257,620 2,175,772 21,637,958
59,619 35,747 280,951 (216,105) (580,163) 49,584,914
— — — — (5,771,185) —— — — — (383,586) —
— — — — (6,154,771) —
906,953 61,539 17,170,680 (793,351) 24,763,721 (17,905,379)
966,572 97,286 17,451,631 (1,009,456) 18,028,787 31,679,535
1,953,050 1,855,764 6,316,434 7,325,890 85,221,256 53,541,721
$ 2,919,622 $ 1,953,050 $ 23,768,065 $ 6,316,434 $ 103,250,043 $ 85,221,256
$ 2,953,210 $ 5,216,759 $ 25,373,138 $ 14,185,594 $ 143,157,433 $ 159,232,200— — — — 5,744,467 —
(2,072,099) (5,195,276) (8,189,975) (14,970,784) (125,123,639) (178,183,076)
231,830 116,437 917,085 — 6,045,237 8,845,484— — — — 379,701 —
(205,988) (76,381) (929,568) (8,161) (5,439,478) (7,799,987)
$ 906,953 $ 61,539 $ 17,170,680 $ (793,351) $ 24,763,721 $ (17,905,379)
235,668 414,124 903,049 520,033 1,010,575 1,796,418— — — — 37,011 —
(165,879) (412,947) (294,567) (548,886) (944,102) (1,927,664)
20,083 9,910 38,210 — 60,837 119,946— — — — 3,306 —
(17,840) (6,591) (38,211) (339) (56,943) (104,696)
72,032 4,496 608,481 (29,192) 110,684 (115,996)
For the Periods Indicated :: Statements of Changes in Net Assets :: 225
See accompanying notes to the financial statements.
Toppan Merrill - ProFunds Public Semi-Annual Report [Funds] 01-31-2022 ED [AUX] | akiesli | 29-Mar-22 08:43 | 22-1296-2.ee | Sequence: 15CHKSUM Content: 37307 Layout: 26046 Graphics: 0 CLEAN
JOB: 22-1296-2 CYCLE#;BL#: 8; 0 TRIM: 8.25" x 10.75" AS: New York: 212-620-5600COLORS: ~HTML color, ~watermark, ~note-color 2, Black, ~note-color 3 GRAPHICS: none V1.5
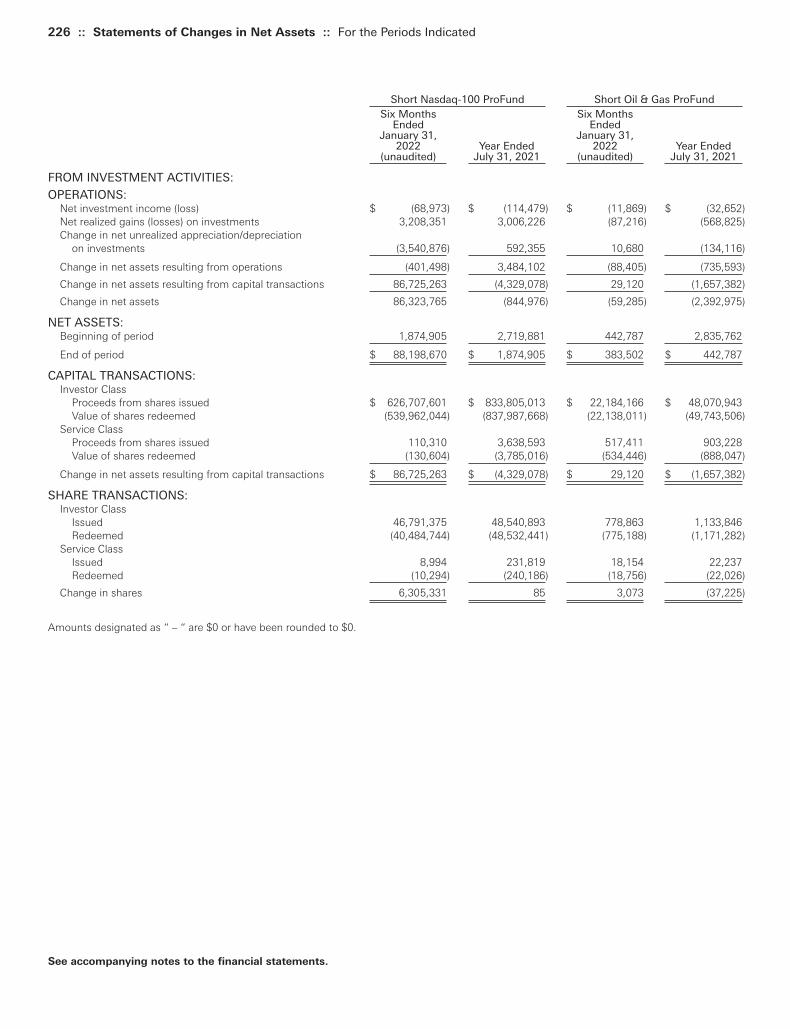
226 :: Statements of Changes in Net Assets :: For the Periods Indicated
Short Nasdaq-100 ProFund Short Oil & Gas ProFundSix Months Six Months
Ended EndedJanuary 31, January 31,
2022 Year Ended 2022 Year Ended(unaudited) July 31, 2021 (unaudited) July 31, 2021
FROM INVESTMENT ACTIVITIES:
OPERATIONS:Net investment income (loss) $ (68,973) $ (114,479) $ (11,869) $ (32,652)Net realized gains (losses) on investments 3,208,351 3,006,226 (87,216) (568,825)Change in net unrealized appreciation/depreciation
on investments (3,540,876) 592,355 10,680 (134,116)
Change in net assets resulting from operations (401,498) 3,484,102 (88,405) (735,593)
Change in net assets resulting from capital transactions 86,725,263 (4,329,078) 29,120 (1,657,382)
Change in net assets 86,323,765 (844,976) (59,285) (2,392,975)
NET ASSETS:Beginning of period 1,874,905 2,719,881 442,787 2,835,762
End of period $ 88,198,670 $ 1,874,905 $ 383,502 $ 442,787
CAPITAL TRANSACTIONS:Investor Class
Proceeds from shares issued $ 626,707,601 $ 833,805,013 $ 22,184,166 $ 48,070,943Value of shares redeemed (539,962,044) (837,987,668) (22,138,011) (49,743,506)
Service ClassProceeds from shares issued 110,310 3,638,593 517,411 903,228Value of shares redeemed (130,604) (3,785,016) (534,446) (888,047)
Change in net assets resulting from capital transactions $ 86,725,263 $ (4,329,078) $ 29,120 $ (1,657,382)
SHARE TRANSACTIONS:Investor Class
Issued 46,791,375 48,540,893 778,863 1,133,846Redeemed (40,484,744) (48,532,441) (775,188) (1,171,282)
Service ClassIssued 8,994 231,819 18,154 22,237Redeemed (10,294) (240,186) (18,756) (22,026)
Change in shares 6,305,331 85 3,073 (37,225)
Amounts designated as “ – “ are $0 or have been rounded to $0.
See accompanying notes to the financial statements.
Toppan Merrill - ProFunds Public Semi-Annual Report [Funds] 01-31-2022 ED [AUX] | akiesli | 29-Mar-22 08:43 | 22-1296-2.ee | Sequence: 16CHKSUM Content: 60476 Layout: 42506 Graphics: 0 CLEAN
JOB: 22-1296-2 CYCLE#;BL#: 8; 0 TRIM: 8.25" x 10.75" AS: New York: 212-620-5600COLORS: ~note-color 2, Black, ~note-color 3 GRAPHICS: none V1.5

Short Precious Metals ProFund Short Real Estate ProFund Short Small-Cap ProFundSix Months Six Months Six Months
Ended Ended EndedJanuary 31, January 31, January 31,
2022 Year Ended 2022 Year Ended 2022 Year Ended(unaudited) July 31, 2021 (unaudited) July 31, 2021 (unaudited) July 31, 2021
$ (30,664) $ (39,426) $ (4,746) $ (17,896) $ (41,591) $ (27,237)76,954 508,774 (694) (317,484) (722,694) (937,196)
220,960 (33,382) (6,803) 58,558 (64,146) 6,386
267,250 435,966 (12,243) (276,822) (828,431) (958,047)
1,520,126 92,950 229,293 (933,675) 904,991 235,709
1,787,376 528,916 217,050 (1,210,497) 76,560 (722,338)
2,158,391 1,629,475 529,479 1,739,976 1,112,473 1,834,811
$ 3,945,767 $ 2,158,391 $ 746,529 $ 529,479 $ 1,189,033 $ 1,112,473
$ 59,659,929 $ 76,406,693 $ 4,053,731 $ 12,975,678 $ 135,482,070 $ 70,896,851(58,139,855) (76,256,193) (3,824,441) (13,909,828) (134,596,586) (70,665,699)
173,184 204,810 5 9,000 19,881 6,638(173,132) (262,360) (2) (8,525) (374) (2,081)
$ 1,520,126 $ 92,950 $ 229,293 $ (933,675) $ 904,991 $ 235,709
3,749,083 4,972,462 502,661 1,262,562 19,713,285 8,820,499(3,644,991) (4,935,534) (473,008) (1,349,870) (19,713,112) (8,821,413)
11,132 14,100 1 948 2,967 847(11,146) (17,670) (1) (887) — (213)
104,078 33,358 29,653 (87,247) 3,140 (280)
For the Periods Indicated :: Statements of Changes in Net Assets :: 227
See accompanying notes to the financial statements.
Toppan Merrill - ProFunds Public Semi-Annual Report [Funds] 01-31-2022 ED [AUX] | akiesli | 29-Mar-22 08:43 | 22-1296-2.ee | Sequence: 17CHKSUM Content: 44507 Layout: 6065 Graphics: 0 CLEAN
JOB: 22-1296-2 CYCLE#;BL#: 8; 0 TRIM: 8.25" x 10.75" AS: New York: 212-620-5600COLORS: ~HTML color, ~watermark, ~note-color 2, Black, ~note-color 3 GRAPHICS: none V1.5

228 :: Statements of Changes in Net Assets :: For the Periods Indicated
Small-Cap Growth ProFund Small-Cap ProFundSix Months Six Months
Ended EndedJanuary 31, January 31,
2022 Year Ended 2022 Year Ended(unaudited) July 31, 2021 (unaudited) July 31, 2021
FROM INVESTMENT ACTIVITIES:
OPERATIONS:Net investment income (loss) $ (31,253) $ (126,024) $ (44,712) $ (107,241)Net realized gains (losses) on investments 1,776,590 4,759,076 (126,711) 1,722,380Change in net unrealized appreciation/depreciation
on investments (2,167,558) 1,498,090 (149,583) 744,635
Change in net assets resulting from operations (422,221) 6,131,142 (321,006) 2,359,774
DISTRIBUTIONS TO SHAREHOLDERS:Total distributions
Investor Class (474,548) — — —Service Class (82,692) — — —
Change in net assets resulting from distributions (557,240) — — —
Change in net assets resulting from capital transactions (3,305,216) (4,885,876) (3,224,254) 4,281,848
Change in net assets (4,284,677) 1,245,266 (3,545,260) 6,641,622
NET ASSETS:Beginning of period 9,895,094 8,649,828 9,908,230 3,266,608
End of period $ 5,610,417 $ 9,895,094 $ 6,362,970 $ 9,908,230
CAPITAL TRANSACTIONS:Investor Class
Proceeds from shares issued $ 3,809,467 $ 94,976,082 $ 129,962,478 $ 245,174,451Distributions reinvested 471,116 — — —Value of shares redeemed (7,641,051) (99,601,033) (132,936,241) (241,223,974)
Service ClassProceeds from shares issued 40,417 1,118,246 116,481 888,507Distributions reinvested 82,692 — — —Value of shares redeemed (67,857) (1,379,171) (366,972) (557,136)
Change in net assets resulting from capital transactions $ (3,305,216) $ (4,885,876) $ (3,224,254) $ 4,281,848
SHARE TRANSACTIONS:Investor Class
Issued 29,834 860,093 1,118,661 2,291,800Reinvested 4,002 — — —Redeemed (60,998) (879,712) (1,141,140) (2,251,374)
Service ClassIssued 411 11,578 1,186 9,653Reinvested 902 — — —Redeemed (719) (14,579) (3,830) (6,330)
Change in shares (26,568) (22,620) (25,123) 43,749
Amounts designated as “ – “ are $0 or have been rounded to $0.
See accompanying notes to the financial statements.
Toppan Merrill - ProFunds Public Semi-Annual Report [Funds] 01-31-2022 ED [AUX] | akiesli | 29-Mar-22 08:43 | 22-1296-2.ee | Sequence: 18CHKSUM Content: 49571 Layout: 59533 Graphics: 0 CLEAN
JOB: 22-1296-2 CYCLE#;BL#: 8; 0 TRIM: 8.25" x 10.75" AS: New York: 212-620-5600COLORS: ~note-color 2, Black, ~note-color 3 GRAPHICS: none V1.5
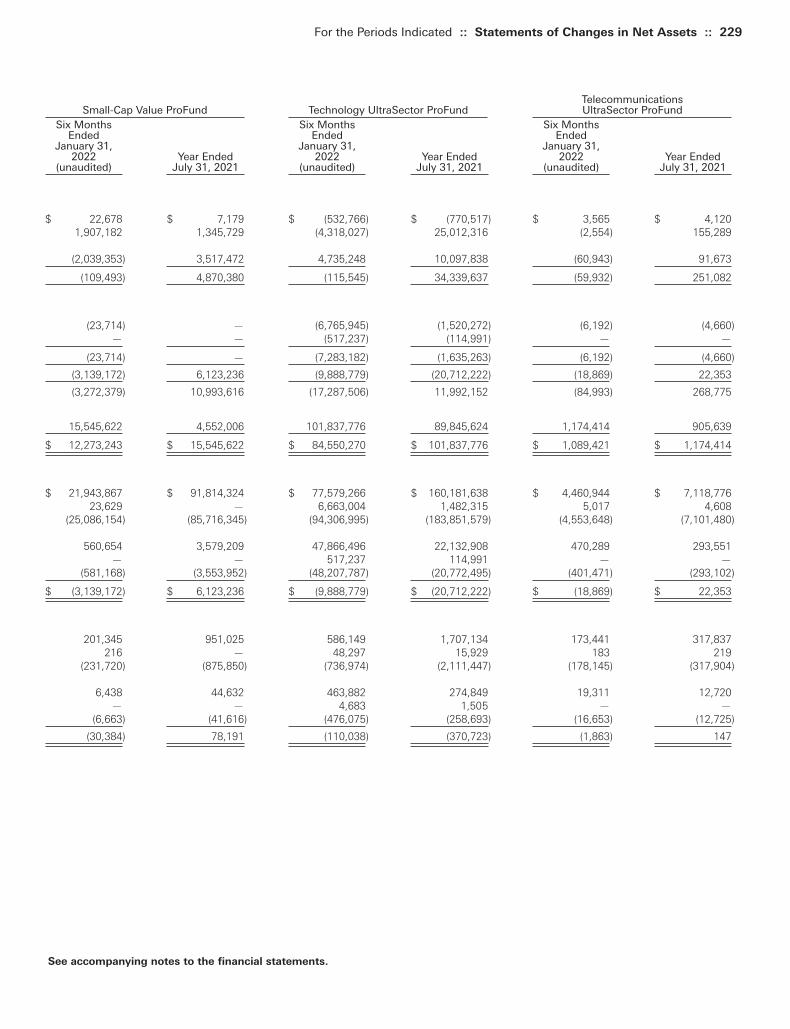
TelecommunicationsSmall-Cap Value ProFund Technology UltraSector ProFund UltraSector ProFund
Six Months Six Months Six MonthsEnded Ended Ended
January 31, January 31, January 31,2022 Year Ended 2022 Year Ended 2022 Year Ended
(unaudited) July 31, 2021 (unaudited) July 31, 2021 (unaudited) July 31, 2021
$ 22,678 $ 7,179 $ (532,766) $ (770,517) $ 3,565 $ 4,1201,907,182 1,345,729 (4,318,027) 25,012,316 (2,554) 155,289
(2,039,353) 3,517,472 4,735,248 10,097,838 (60,943) 91,673
(109,493) 4,870,380 (115,545) 34,339,637 (59,932) 251,082
(23,714) — (6,765,945) (1,520,272) (6,192) (4,660)— — (517,237) (114,991) — —
(23,714) — (7,283,182) (1,635,263) (6,192) (4,660)
(3,139,172) 6,123,236 (9,888,779) (20,712,222) (18,869) 22,353
(3,272,379) 10,993,616 (17,287,506) 11,992,152 (84,993) 268,775
15,545,622 4,552,006 101,837,776 89,845,624 1,174,414 905,639
$ 12,273,243 $ 15,545,622 $ 84,550,270 $ 101,837,776 $ 1,089,421 $ 1,174,414
$ 21,943,867 $ 91,814,324 $ 77,579,266 $ 160,181,638 $ 4,460,944 $ 7,118,77623,629 — 6,663,004 1,482,315 5,017 4,608
(25,086,154) (85,716,345) (94,306,995) (183,851,579) (4,553,648) (7,101,480)
560,654 3,579,209 47,866,496 22,132,908 470,289 293,551— — 517,237 114,991 — —
(581,168) (3,553,952) (48,207,787) (20,772,495) (401,471) (293,102)
$ (3,139,172) $ 6,123,236 $ (9,888,779) $ (20,712,222) $ (18,869) $ 22,353
201,345 951,025 586,149 1,707,134 173,441 317,837216 — 48,297 15,929 183 219
(231,720) (875,850) (736,974) (2,111,447) (178,145) (317,904)
6,438 44,632 463,882 274,849 19,311 12,720— — 4,683 1,505 — —
(6,663) (41,616) (476,075) (258,693) (16,653) (12,725)
(30,384) 78,191 (110,038) (370,723) (1,863) 147
For the Periods Indicated :: Statements of Changes in Net Assets :: 229
See accompanying notes to the financial statements.
Toppan Merrill - ProFunds Public Semi-Annual Report [Funds] 01-31-2022 ED [AUX] | akiesli | 29-Mar-22 08:43 | 22-1296-2.ee | Sequence: 19CHKSUM Content: 64667 Layout: 3782 Graphics: 0 CLEAN
JOB: 22-1296-2 CYCLE#;BL#: 8; 0 TRIM: 8.25" x 10.75" AS: New York: 212-620-5600COLORS: ~HTML color, ~watermark, ~note-color 2, Black, ~note-color 3 GRAPHICS: none V1.5

230 :: Statements of Changes in Net Assets :: For the Periods Indicated
UltraBear ProFund UltraBull ProFundSix Months Six Months
Ended EndedJanuary 31, January 31,
2022 Year Ended 2022 Year Ended(unaudited) July 31, 2021 (unaudited) July 31, 2021
FROM INVESTMENT ACTIVITIES:
OPERATIONS:Net investment income (loss) $ (68,063) $ (147,330) $ (285,904) $ (585,775)Net realized gains (losses) on investments 440,863 (6,556,416) (2,475,241) 41,024,460Change in net unrealized appreciation/depreciation
on investments (779,436) 186,989 8,731,424 18,826,358
Change in net assets resulting from operations (406,636) (6,516,757) 5,970,279 59,265,043
DISTRIBUTIONS TO SHAREHOLDERS:Total distributions
Investor Class — (37,071) (7,409,540) (13,488,142)Service Class — — (216,056) (249,797)
Change in net assets resulting from distributions — (37,071) (7,625,596) (13,737,939)
Change in net assets resulting from capital transactions 4,122,736 2,053,106 221,927 (16,346,043)
Change in net assets 3,716,100 (4,500,722) (1,433,390) 29,181,061
NET ASSETS:Beginning of period 5,451,867 9,952,589 130,864,122 101,683,061
End of period $ 9,167,967 $ 5,451,867 $ 129,430,732 $ 130,864,122
CAPITAL TRANSACTIONS:Investor Class
Proceeds from shares issued $ 80,510,757 $ 183,530,963 $ 361,186,630 $ 780,900,902Distributions reinvested — 35,894 7,312,208 13,341,141Value of shares redeemed (76,404,971) (181,492,567) (368,222,749) (810,534,382)
Service ClassProceeds from shares issued 507,834 797,199 22,459,264 13,591,204Distributions reinvested — — 216,056 249,797Value of shares redeemed (490,884) (818,383) (22,729,482) (13,894,705)
Change in net assets resulting from capital transactions $ 4,122,736 $ 2,053,106 $ 221,927 $ (16,346,043)
SHARE TRANSACTIONS:Investor Class
Issued 4,072,163 6,410,429(a) 3,137,816 8,603,573Reinvested — 1,140 70,235 165,070Redeemed (3,851,287) (6,384,436)(a) (3,198,231) (9,021,417)
Service ClassIssued 26,663 30,894(a) 252,583 181,682Reinvested — — 2,650 3,871Redeemed (26,689) (32,023)(a) (255,425) (185,084)
Change in shares 220,850 26,004 9,628 (252,305)
(a) As described in Note 9, share amounts have been adjusted for 1:4 reverse share split that occurred on December 14, 2020.Amounts designated as “ – “ are $0 or have been rounded to $0.
See accompanying notes to the financial statements.
Toppan Merrill - ProFunds Public Semi-Annual Report [Funds] 01-31-2022 ED [AUX] | akiesli | 29-Mar-22 08:43 | 22-1296-2.ee | Sequence: 20CHKSUM Content: 63422 Layout: 1790 Graphics: 0 CLEAN
JOB: 22-1296-2 CYCLE#;BL#: 8; 0 TRIM: 8.25" x 10.75" AS: New York: 212-620-5600COLORS: ~note-color 2, Black, ~note-color 3 GRAPHICS: none V1.5

UltraChina ProFund UltraDow 30 ProFund UltraEmerging Markets ProFundSix Months Six Months Six Months
Ended Ended EndedJanuary 31, January 31, January 31,
2022 Year Ended 2022 Year Ended 2022 Year Ended(unaudited) July 31, 2021 (unaudited) July 31, 2021 (unaudited) July 31, 2021
$ (108,844) $ (238,254) $ (63,905) $ (158,869) $ 38,830 $ (104,185)(12,422,608) (11,259,517) (1,161,082) 13,515,086 (1,009,224) 3,118,485
323,409 (41,839) 1,371,180 3,815,475 (1,141,292) 1,523,572
(12,208,043) (11,539,610) 146,193 17,171,692 (2,111,686) 4,537,872
— — (2,463,674) (610,071) — —— — (79,950) (26,223) — —
— — (2,543,624) (636,294) — —
14,026,938 11,962,459 56,577 (2,894,894) 3,883,451 (8,744,550)
1,818,895 422,849 (2,340,854) 13,640,504 1,771,765 (4,206,678)
18,049,304 17,626,455 40,412,695 26,772,191 9,321,782 13,528,460
$ 19,868,199 $ 18,049,304 $ 38,071,841 $ 40,412,695 $ 11,093,547 $ 9,321,782
$ 105,616,954 $ 176,467,233 $ 50,165,250 $ 119,605,718 $ 23,007,311 $ 87,581,394— — 2,443,673 598,752 — —
(91,787,541) (162,647,148) (52,316,997) (123,129,400) (18,991,692) (96,255,600)
3,647,669 8,950,334 1,780,015 1,698,870 2,449,767 8,619,737— — 76,910 25,794 — —
(3,450,144) (10,807,960) (2,092,274) (1,694,628) (2,581,935) (8,690,081)
$ 14,026,938 $ 11,962,459 $ 56,577 $ (2,894,894) $ 3,883,451 $ (8,744,550)
12,081,107 8,162,546 742,240 2,242,739 338,565 989,742— — 36,681 11,920 — —
(10,541,954) (7,534,296) (778,954) (2,332,914) (276,954) (1,088,821)
430,760 450,094 30,722 36,918 37,592 106,783— — 1,365 595 — —
(396,567) (582,082) (36,642) (35,524) (39,530) (108,196)
1,573,346 496,262 (4,588) (76,266) 59,673 (100,492)
For the Periods Indicated :: Statements of Changes in Net Assets :: 231
See accompanying notes to the financial statements.
Toppan Merrill - ProFunds Public Semi-Annual Report [Funds] 01-31-2022 ED [AUX] | akiesli | 29-Mar-22 08:43 | 22-1296-2.ee | Sequence: 21CHKSUM Content: 23869 Layout: 10397 Graphics: 0 CLEAN
JOB: 22-1296-2 CYCLE#;BL#: 8; 0 TRIM: 8.25" x 10.75" AS: New York: 212-620-5600COLORS: ~HTML color, ~watermark, ~note-color 2, Black, ~note-color 3 GRAPHICS: none V1.5

232 :: Statements of Changes in Net Assets :: For the Periods Indicated
UltraInternational ProFund UltraJapan ProFundSix Months Six Months
Ended EndedJanuary 31, January 31,
2022 Year Ended 2022 Year Ended(unaudited) July 31, 2021 (unaudited) July 31, 2021
FROM INVESTMENT ACTIVITIES:
OPERATIONS:Net investment income (loss) $ (26,933) $ (67,090) $ (138,948) $ (285,087)Net realized gains (losses) on investments (310,696) 1,652,457 (1,354,206) 6,354,446Change in net unrealized appreciation/depreciation
on investments 51,236 278,041 1,258,886 (546,935)
Change in net assets resulting from operations (286,393) 1,863,408 (234,268) 5,522,424
DISTRIBUTIONS TO SHAREHOLDERS:Total distributions
Investor Class — — (1,957,534) —Service Class — — (23,373) —
Change in net assets resulting from distributions — — (1,980,907) —
Change in net assets resulting from capital transactions (418,272) (2,859,836) 442,867 (1,444,184)
Change in net assets (704,665) (996,428) (1,772,308) 4,078,240
NET ASSETS:Beginning of period 3,151,548 4,147,976 14,743,170 10,664,930
End of period $ 2,446,883 $ 3,151,548 $ 12,970,862 $ 14,743,170
CAPITAL TRANSACTIONS:Investor Class
Proceeds from shares issued $ 9,732,631 $ 42,509,181 $ 16,302,479 $ 33,563,243Distributions reinvested — — 1,931,206 —Value of shares redeemed (10,144,354) (45,293,025) (17,778,538) (34,991,209)
Service ClassProceeds from shares issued 919,065 1,785,704 992,799 1,548,374Distributions reinvested — — 23,373 —Value of shares redeemed (925,614) (1,861,696) (1,028,452) (1,564,592)
Change in net assets resulting from capital transactions $ (418,272) $ (2,859,836) $ 442,867 $ (1,444,184)
SHARE TRANSACTIONS:Investor Class
Issued 456,785 2,396,960 518,623 1,048,723Reinvested — — 58,504 —Redeemed (479,474) (2,561,061) (565,731) (1,096,149)
Service ClassIssued 48,265 109,259 34,905 55,054Reinvested — — 871 —Redeemed (49,087) (112,527) (35,643) (55,878)
Change in shares (23,511) (167,369) 11,529 (48,250)
(a) As described in Note 9, share amounts have been adjusted for 2:1 share split that occurred on December 14, 2020.Amounts designated as “ – “ are $0 or have been rounded to $0.
See accompanying notes to the financial statements.
Toppan Merrill - ProFunds Public Semi-Annual Report [Funds] 01-31-2022 ED [AUX] | akiesli | 29-Mar-22 08:43 | 22-1296-2.ee | Sequence: 22CHKSUM Content: 31023 Layout: 6879 Graphics: 0 CLEAN
JOB: 22-1296-2 CYCLE#;BL#: 8; 0 TRIM: 8.25" x 10.75" AS: New York: 212-620-5600COLORS: ~note-color 2, Black, ~note-color 3 GRAPHICS: none V1.5

UltraLatin America ProFund UltraMid-Cap ProFund UltraNasdaq-100 ProFundSix Months Six Months Six Months
Ended Ended EndedJanuary 31, January 31, January 31,
2022 Year Ended 2022 Year Ended 2022 Year Ended(unaudited) July 31, 2021 (unaudited) July 31, 2021 (unaudited) July 31, 2021
$ 509,320 $ 202,567 $ (108,046) $ (324,008) $ (5,513,553) $ (9,218,621)(1,023,772) 5,200,289 (1,742,500) 21,553,550 (80,371,073) 385,879,527
(1,352,251) 3,518,368 (1,183,416) 9,103,349 60,625,970 128,157,884
(1,866,703) 8,921,224 (3,033,962) 30,332,891 (25,258,656) 504,818,790
(700,829) (103,295) (2,662,144) — (160,235,818) (80,801,575)(3,119) (299) (67,066) — (4,885,875) (2,373,487)
(703,948) (103,594) (2,729,210) — (165,121,693) (83,175,062)
590,459 (8,553,674) (7,367,915) 1,528,795 (57,833,256) 55,383,868
(1,980,192) 263,956 (13,131,087) 31,861,686 (248,213,605) 477,027,596
16,086,642 15,822,686 62,881,150 31,019,464 1,120,270,485 643,242,889
$ 14,106,450 $ 16,086,642 $ 49,750,063 $ 62,881,150 $ 872,056,880 $ 1,120,270,485
$ 31,161,754 $ 108,526,192 $ 61,031,915 $ 195,416,035 $ 3,039,894,133 $ 5,161,209,021695,284 103,129 2,617,245 — 155,791,807 77,131,534
(31,209,077) (117,130,692) (70,962,302) (193,740,125) (3,257,594,528) (5,182,921,512)
999,934 3,529,666 2,271,916 7,602,041 25,011,728 26,771,3083,119 299 67,066 — 4,754,067 2,359,556
(1,060,555) (3,582,268) (2,393,755) (7,749,156) (25,690,463) (29,166,039)
$ 590,459 $ (8,553,674) $ (7,367,915) $ 1,528,795 $ (57,833,256) $ 55,383,868
2,030,407 7,675,974 898,182 3,588,244 31,375,552 67,509,246(a)
50,056 6,172 39,529 — 1,657,378 1,039,926(2,037,276) (8,328,761) (1,044,240) (3,590,587) (33,845,947) (67,646,714)(a)
66,829 240,359 41,970 156,776 342,883 433,340(a)
231 18 1,283 — 68,932 41,447(69,586) (241,891) (44,695) (157,725) (354,064) (478,582)(a)
40,661 (648,129) (107,971) (3,292) (755,266) 898,663
For the Periods Indicated :: Statements of Changes in Net Assets :: 233
See accompanying notes to the financial statements.
Toppan Merrill - ProFunds Public Semi-Annual Report [Funds] 01-31-2022 ED [AUX] | akiesli | 29-Mar-22 08:43 | 22-1296-2.ee | Sequence: 23CHKSUM Content: 31782 Layout: 21697 Graphics: 0 CLEAN
JOB: 22-1296-2 CYCLE#;BL#: 8; 0 TRIM: 8.25" x 10.75" AS: New York: 212-620-5600COLORS: ~HTML color, ~watermark, ~note-color 2, Black, ~note-color 3 GRAPHICS: none V1.5
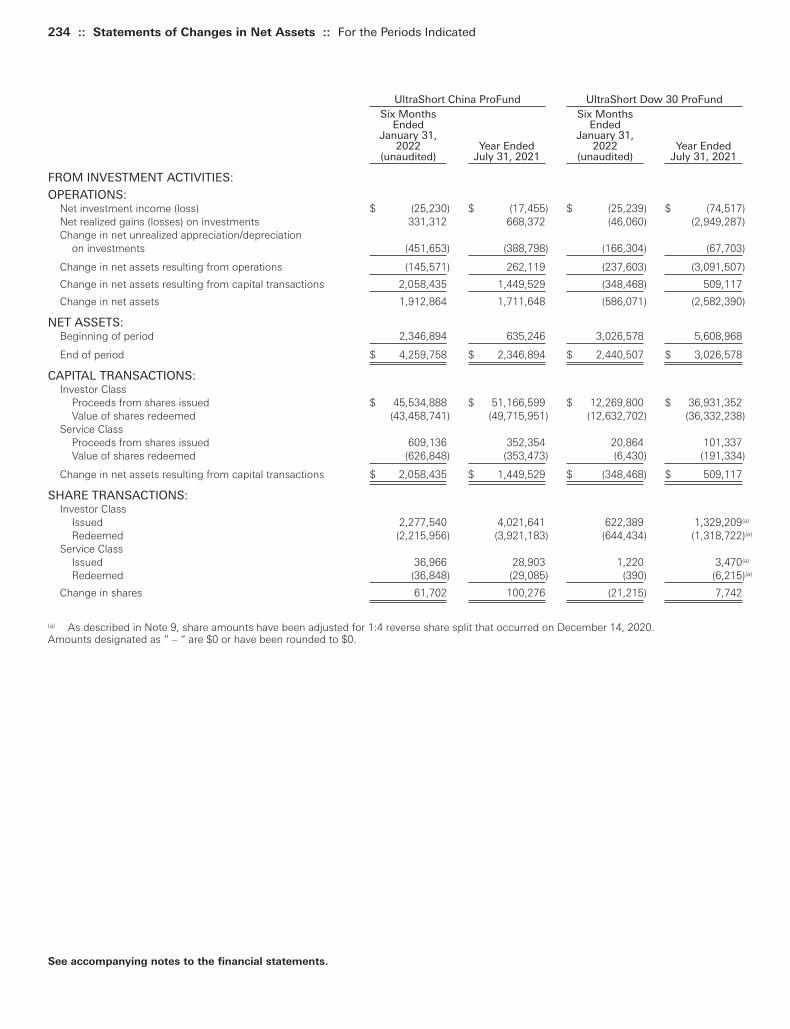
234 :: Statements of Changes in Net Assets :: For the Periods Indicated
UltraShort China ProFund UltraShort Dow 30 ProFundSix Months Six Months
Ended EndedJanuary 31, January 31,
2022 Year Ended 2022 Year Ended(unaudited) July 31, 2021 (unaudited) July 31, 2021
FROM INVESTMENT ACTIVITIES:
OPERATIONS:Net investment income (loss) $ (25,230) $ (17,455) $ (25,239) $ (74,517)Net realized gains (losses) on investments 331,312 668,372 (46,060) (2,949,287)Change in net unrealized appreciation/depreciation
on investments (451,653) (388,798) (166,304) (67,703)
Change in net assets resulting from operations (145,571) 262,119 (237,603) (3,091,507)
Change in net assets resulting from capital transactions 2,058,435 1,449,529 (348,468) 509,117
Change in net assets 1,912,864 1,711,648 (586,071) (2,582,390)
NET ASSETS:Beginning of period 2,346,894 635,246 3,026,578 5,608,968
End of period $ 4,259,758 $ 2,346,894 $ 2,440,507 $ 3,026,578
CAPITAL TRANSACTIONS:Investor Class
Proceeds from shares issued $ 45,534,888 $ 51,166,599 $ 12,269,800 $ 36,931,352Value of shares redeemed (43,458,741) (49,715,951) (12,632,702) (36,332,238)
Service ClassProceeds from shares issued 609,136 352,354 20,864 101,337Value of shares redeemed (626,848) (353,473) (6,430) (191,334)
Change in net assets resulting from capital transactions $ 2,058,435 $ 1,449,529 $ (348,468) $ 509,117
SHARE TRANSACTIONS:Investor Class
Issued 2,277,540 4,021,641 622,389 1,329,209(a)
Redeemed (2,215,956) (3,921,183) (644,434) (1,318,722)(a)
Service ClassIssued 36,966 28,903 1,220 3,470(a)
Redeemed (36,848) (29,085) (390) (6,215)(a)
Change in shares 61,702 100,276 (21,215) 7,742
(a) As described in Note 9, share amounts have been adjusted for 1:4 reverse share split that occurred on December 14, 2020.Amounts designated as “ – “ are $0 or have been rounded to $0.
See accompanying notes to the financial statements.
Toppan Merrill - ProFunds Public Semi-Annual Report [Funds] 01-31-2022 ED [AUX] | akiesli | 29-Mar-22 08:43 | 22-1296-2.ee | Sequence: 24CHKSUM Content: 30461 Layout: 11380 Graphics: 0 CLEAN
JOB: 22-1296-2 CYCLE#;BL#: 8; 0 TRIM: 8.25" x 10.75" AS: New York: 212-620-5600COLORS: ~note-color 2, Black, ~note-color 3 GRAPHICS: none V1.5
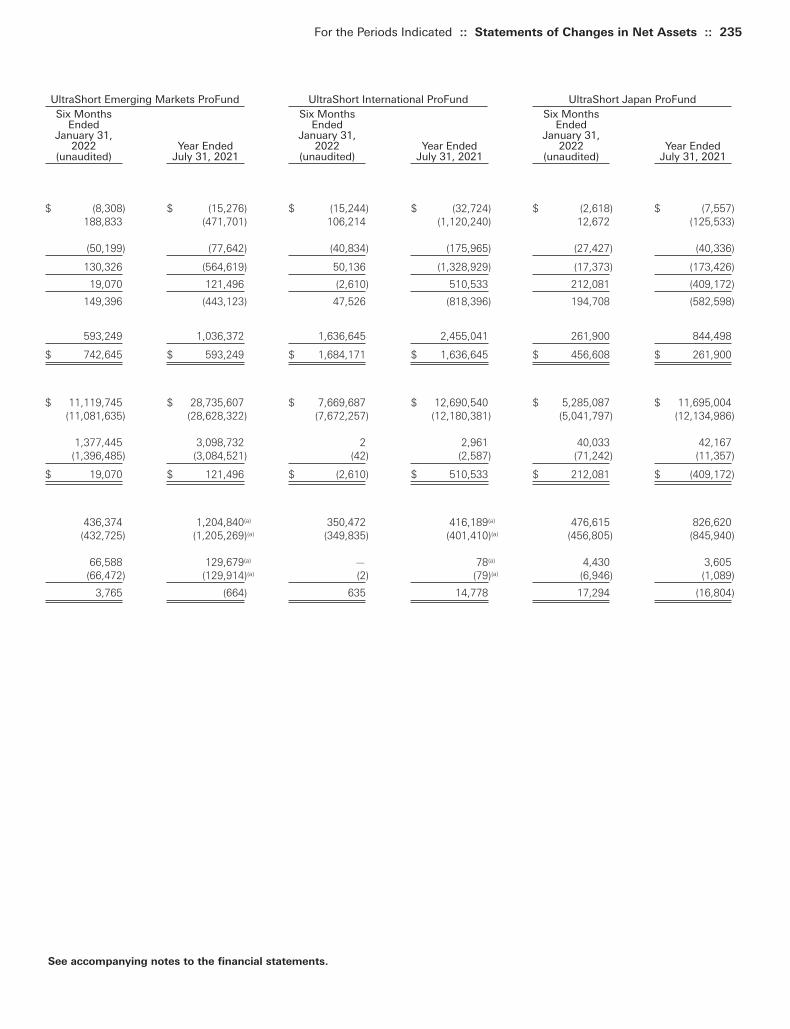
UltraShort Emerging Markets ProFund UltraShort International ProFund UltraShort Japan ProFundSix Months Six Months Six Months
Ended Ended EndedJanuary 31, January 31, January 31,
2022 Year Ended 2022 Year Ended 2022 Year Ended(unaudited) July 31, 2021 (unaudited) July 31, 2021 (unaudited) July 31, 2021
$ (8,308) $ (15,276) $ (15,244) $ (32,724) $ (2,618) $ (7,557)188,833 (471,701) 106,214 (1,120,240) 12,672 (125,533)
(50,199) (77,642) (40,834) (175,965) (27,427) (40,336)
130,326 (564,619) 50,136 (1,328,929) (17,373) (173,426)
19,070 121,496 (2,610) 510,533 212,081 (409,172)
149,396 (443,123) 47,526 (818,396) 194,708 (582,598)
593,249 1,036,372 1,636,645 2,455,041 261,900 844,498
$ 742,645 $ 593,249 $ 1,684,171 $ 1,636,645 $ 456,608 $ 261,900
$ 11,119,745 $ 28,735,607 $ 7,669,687 $ 12,690,540 $ 5,285,087 $ 11,695,004(11,081,635) (28,628,322) (7,672,257) (12,180,381) (5,041,797) (12,134,986)
1,377,445 3,098,732 2 2,961 40,033 42,167(1,396,485) (3,084,521) (42) (2,587) (71,242) (11,357)
$ 19,070 $ 121,496 $ (2,610) $ 510,533 $ 212,081 $ (409,172)
436,374 1,204,840(a) 350,472 416,189(a) 476,615 826,620(432,725) (1,205,269)(a) (349,835) (401,410)(a) (456,805) (845,940)
66,588 129,679(a) — 78(a) 4,430 3,605(66,472) (129,914)(a) (2) (79)(a) (6,946) (1,089)
3,765 (664) 635 14,778 17,294 (16,804)
For the Periods Indicated :: Statements of Changes in Net Assets :: 235
See accompanying notes to the financial statements.
Toppan Merrill - ProFunds Public Semi-Annual Report [Funds] 01-31-2022 ED [AUX] | akiesli | 29-Mar-22 08:43 | 22-1296-2.ee | Sequence: 25CHKSUM Content: 45309 Layout: 6686 Graphics: 0 CLEAN
JOB: 22-1296-2 CYCLE#;BL#: 8; 0 TRIM: 8.25" x 10.75" AS: New York: 212-620-5600COLORS: ~HTML color, ~watermark, ~note-color 2, Black, ~note-color 3 GRAPHICS: none V1.5
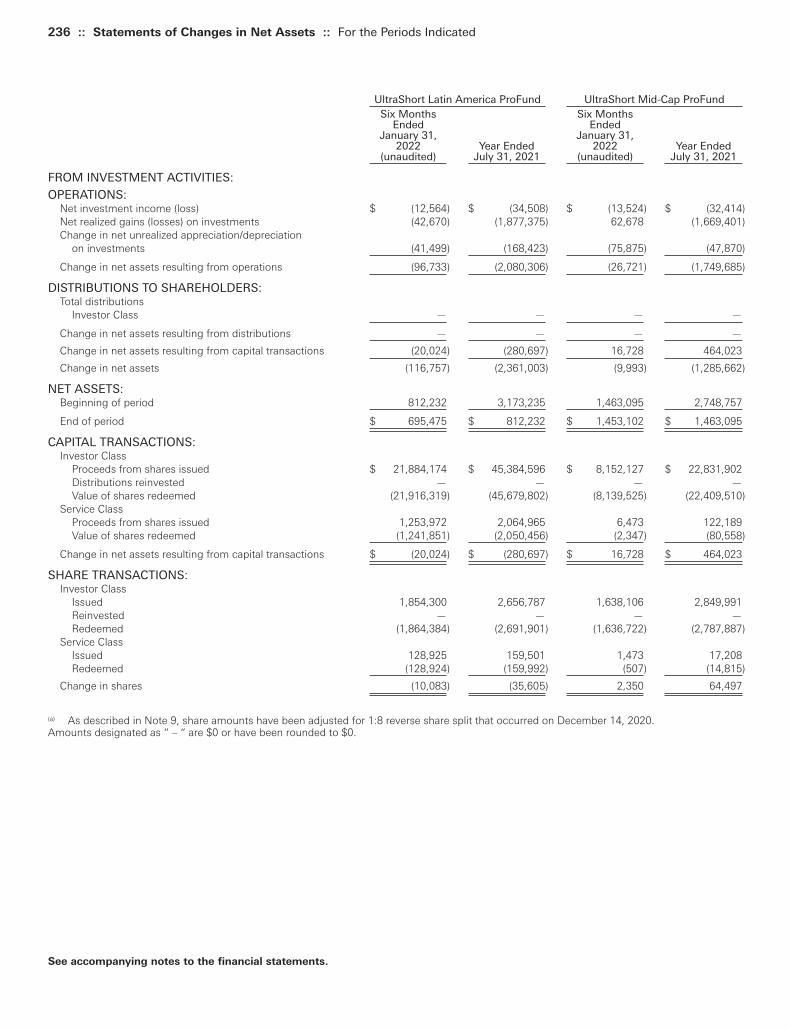
236 :: Statements of Changes in Net Assets :: For the Periods Indicated
UltraShort Latin America ProFund UltraShort Mid-Cap ProFundSix Months Six Months
Ended EndedJanuary 31, January 31,
2022 Year Ended 2022 Year Ended(unaudited) July 31, 2021 (unaudited) July 31, 2021
FROM INVESTMENT ACTIVITIES:
OPERATIONS:Net investment income (loss) $ (12,564) $ (34,508) $ (13,524) $ (32,414)Net realized gains (losses) on investments (42,670) (1,877,375) 62,678 (1,669,401)Change in net unrealized appreciation/depreciation
on investments (41,499) (168,423) (75,875) (47,870)
Change in net assets resulting from operations (96,733) (2,080,306) (26,721) (1,749,685)
DISTRIBUTIONS TO SHAREHOLDERS:Total distributions
Investor Class — — — —
Change in net assets resulting from distributions — — — —
Change in net assets resulting from capital transactions (20,024) (280,697) 16,728 464,023
Change in net assets (116,757) (2,361,003) (9,993) (1,285,662)
NET ASSETS:Beginning of period 812,232 3,173,235 1,463,095 2,748,757
End of period $ 695,475 $ 812,232 $ 1,453,102 $ 1,463,095
CAPITAL TRANSACTIONS:Investor Class
Proceeds from shares issued $ 21,884,174 $ 45,384,596 $ 8,152,127 $ 22,831,902Distributions reinvested — — — —Value of shares redeemed (21,916,319) (45,679,802) (8,139,525) (22,409,510)
Service ClassProceeds from shares issued 1,253,972 2,064,965 6,473 122,189Value of shares redeemed (1,241,851) (2,050,456) (2,347) (80,558)
Change in net assets resulting from capital transactions $ (20,024) $ (280,697) $ 16,728 $ 464,023
SHARE TRANSACTIONS:Investor Class
Issued 1,854,300 2,656,787 1,638,106 2,849,991Reinvested — — — —Redeemed (1,864,384) (2,691,901) (1,636,722) (2,787,887)
Service ClassIssued 128,925 159,501 1,473 17,208Redeemed (128,924) (159,992) (507) (14,815)
Change in shares (10,083) (35,605) 2,350 64,497
(a) As described in Note 9, share amounts have been adjusted for 1:8 reverse share split that occurred on December 14, 2020.Amounts designated as “ – “ are $0 or have been rounded to $0.
See accompanying notes to the financial statements.
Toppan Merrill - ProFunds Public Semi-Annual Report [Funds] 01-31-2022 ED [AUX] | akiesli | 29-Mar-22 08:43 | 22-1296-2.ee | Sequence: 26CHKSUM Content: 62956 Layout: 58578 Graphics: 0 CLEAN
JOB: 22-1296-2 CYCLE#;BL#: 8; 0 TRIM: 8.25" x 10.75" AS: New York: 212-620-5600COLORS: ~note-color 2, Black, ~note-color 3 GRAPHICS: none V1.5
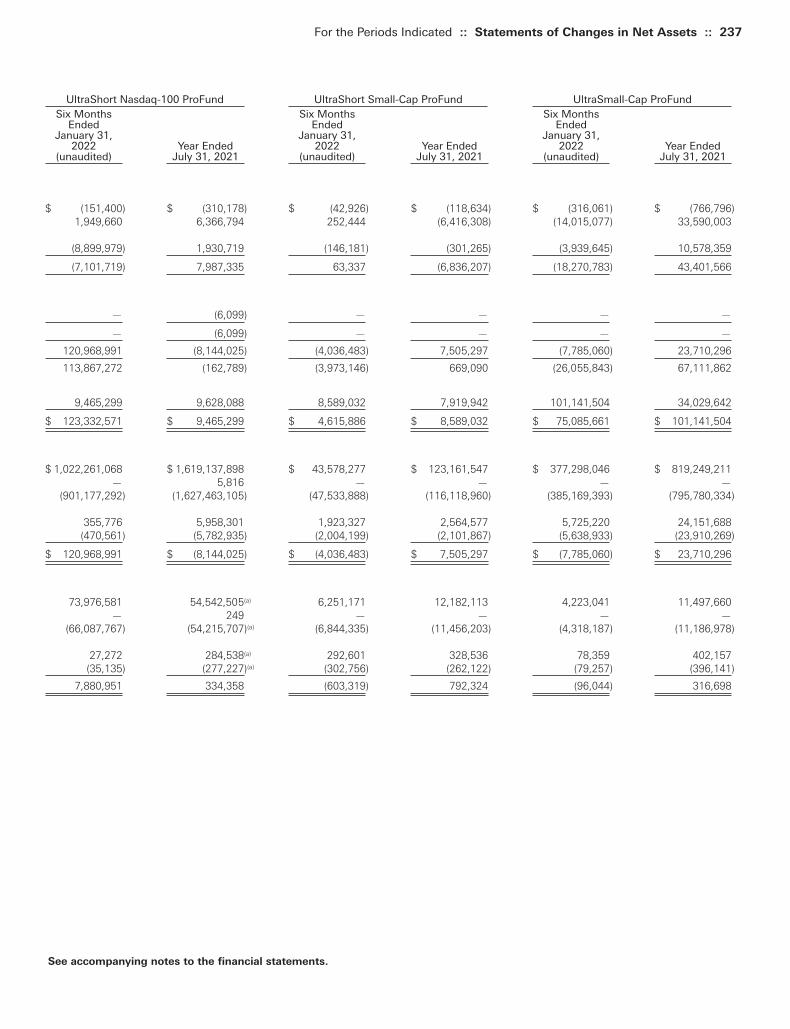
UltraShort Nasdaq-100 ProFund UltraShort Small-Cap ProFund UltraSmall-Cap ProFundSix Months Six Months Six Months
Ended Ended EndedJanuary 31, January 31, January 31,
2022 Year Ended 2022 Year Ended 2022 Year Ended(unaudited) July 31, 2021 (unaudited) July 31, 2021 (unaudited) July 31, 2021
$ (151,400) $ (310,178) $ (42,926) $ (118,634) $ (316,061) $ (766,796)1,949,660 6,366,794 252,444 (6,416,308) (14,015,077) 33,590,003
(8,899,979) 1,930,719 (146,181) (301,265) (3,939,645) 10,578,359
(7,101,719) 7,987,335 63,337 (6,836,207) (18,270,783) 43,401,566
— (6,099) — — — —
— (6,099) — — — —
120,968,991 (8,144,025) (4,036,483) 7,505,297 (7,785,060) 23,710,296
113,867,272 (162,789) (3,973,146) 669,090 (26,055,843) 67,111,862
9,465,299 9,628,088 8,589,032 7,919,942 101,141,504 34,029,642
$ 123,332,571 $ 9,465,299 $ 4,615,886 $ 8,589,032 $ 75,085,661 $ 101,141,504
$ 1,022,261,068 $ 1,619,137,898 $ 43,578,277 $ 123,161,547 $ 377,298,046 $ 819,249,211— 5,816 — — — —
(901,177,292) (1,627,463,105) (47,533,888) (116,118,960) (385,169,393) (795,780,334)
355,776 5,958,301 1,923,327 2,564,577 5,725,220 24,151,688(470,561) (5,782,935) (2,004,199) (2,101,867) (5,638,933) (23,910,269)
$ 120,968,991 $ (8,144,025) $ (4,036,483) $ 7,505,297 $ (7,785,060) $ 23,710,296
73,976,581 54,542,505(a) 6,251,171 12,182,113 4,223,041 11,497,660— 249 — — — —
(66,087,767) (54,215,707)(a) (6,844,335) (11,456,203) (4,318,187) (11,186,978)
27,272 284,538(a) 292,601 328,536 78,359 402,157(35,135) (277,227)(a) (302,756) (262,122) (79,257) (396,141)
7,880,951 334,358 (603,319) 792,324 (96,044) 316,698
For the Periods Indicated :: Statements of Changes in Net Assets :: 237
See accompanying notes to the financial statements.
Toppan Merrill - ProFunds Public Semi-Annual Report [Funds] 01-31-2022 ED [AUX] | akiesli | 29-Mar-22 08:43 | 22-1296-2.ee | Sequence: 27CHKSUM Content: 10551 Layout: 34386 Graphics: 0 CLEAN
JOB: 22-1296-2 CYCLE#;BL#: 8; 0 TRIM: 8.25" x 10.75" AS: New York: 212-620-5600COLORS: ~HTML color, ~watermark, ~note-color 2, Black, ~note-color 3 GRAPHICS: none V1.5

238 :: Statements of Changes in Net Assets :: For the Periods Indicated
U.S. Government Plus ProFund Utilities UltraSector ProFundSix Months Six Months
Ended EndedJanuary 31, January 31,
2022 Year Ended 2022 Year Ended(unaudited) July 31, 2021 (unaudited) July 31, 2021
FROM INVESTMENT ACTIVITIES:
OPERATIONS:Net investment income (loss) $ (134,843) $ (188,980) $ 15,122 $ 11,543Net realized gains (losses) on investments (1,065,806) (3,092,778) 364,982 1,226,994Change in net unrealized appreciation/depreciation
on investments 285,131 (461,278) 406,262 (155,218)
Change in net assets resulting from operations (915,518) (3,743,036) 786,366 1,083,319
DISTRIBUTIONS TO SHAREHOLDERS:Total distributions
Investor Class — — (16,661) (45,473)(a)
Change in net assets resulting from distributions — — (16,661) (45,473)
Change in net assets resulting from capital transactions (230,911) 5,452,355 16,549 (1,317,530)
Change in net assets (1,146,429) 1,709,319 786,254 (279,684)
NET ASSETS:Beginning of period 26,021,050 24,311,731 8,785,845 9,065,529
End of period $ 24,874,621 $ 26,021,050 $ 9,572,099 $ 8,785,845
CAPITAL TRANSACTIONS:Investor Class
Proceeds from shares issued $ 277,527,497 $ 249,390,358 $ 19,698,325 $ 30,768,460Distributions reinvested — — 16,614 44,822Value of shares redeemed (276,220,385) (243,841,186) (20,225,887) (32,097,834)
Service ClassProceeds from shares issued 715,130 5,676,297 1,318,115 1,357,975Value of shares redeemed (2,253,153) (5,773,114) (790,618) (1,390,953)
Change in net assets resulting from capital transactions $ (230,911) $ 5,452,355 $ 16,549 $ (1,317,530)
SHARE TRANSACTIONS:Investor Class
Issued 4,063,401 3,623,278 321,667 565,097Reinvested — — 249 843Redeemed (4,035,570) (3,529,043) (329,947) (592,049)
Service ClassIssued 11,451 86,771 23,281 26,895Redeemed (36,680) (87,768) (13,871) (27,421)
Change in shares 2,602 93,238 1,379 (26,635)
(a) Subsequent to the issuance of the July 31, 2021 financial statements, $5,508 of the distribution was determined to be a return of capital.Amounts designated as “ – “ are $0 or have been rounded to $0.
See accompanying notes to the financial statements.
Toppan Merrill - ProFunds Public Semi-Annual Report [Funds] 01-31-2022 ED [AUX] | akiesli | 29-Mar-22 08:43 | 22-1296-2.ee | Sequence: 28CHKSUM Content: 1445 Layout: 44630 Graphics: 0 CLEAN
JOB: 22-1296-2 CYCLE#;BL#: 8; 0 TRIM: 8.25" x 10.75" AS: New York: 212-620-5600COLORS: ~note-color 2, Black, ~note-color 3 GRAPHICS: none V1.5

Consolidated Statement ofCash Flows
Toppan Merrill - ProFunds Public Semi-Annual Report [Funds] 01-31-2022 ED [AUX] | akiesli | 29-Mar-22 08:44 | 22-1296-2.ef | Sequence: 1CHKSUM Content: 45201 Layout: 44740 Graphics: 0 CLEAN
JOB: 22-1296-2 CYCLE#;BL#: 8; 0 TRIM: 8.25" x 10.75" AS: New York: 212-620-5600COLORS: Black, ~note-color 2 GRAPHICS: none V1.5

BitcoinStrategyProFund
Six MonthsEnded
January 31,2022
Cash Flows from Operating Activities:Net Increase (Decrease) in Net Assets from Operations $ (11,668,248)Less: Net realized gain on investments 3,264Less: Change in net unrealized appreciation/depreciation of investments 16,152
Adjustments to reconcile the net increase (decrease) in net assets from operations to net cash provided by (used in) operating activitiesProceeds from (Purchase of) short-term investments, net (25,639,584)Amortization (Accretion) of premiums and discounts, net (4,680)(Increase) Decrease in:
Receivable From Advisor (15,342)Receivable for variation margin on futures contracts (482,816)Prepaid Expenses 5,325
Increase (Decrease) in:Interest payable (on reverse repurchase agreements) 42Futures commission merchant (FCM) fees payable 5,739Variation margin payable on futures contracts (4,969)Administration fees payable 1,803Transfer agency fees payable 1,902Fund accounting fees payable 2,251Compliance services fees payable 105Service fees payable 109Other accrued expenses 31,919
Net cash provided by (used in) operating activities $ (37,747,028)
Cash Flows from Financing Activities:Proceeds from reverse repurchase agreements 2,109,861,456(Repayments of) reverse repurchase agreements (2,090,221,376)Proceeds from capital shares issued 65,601,874Cash paid for Capital Redemtions (27,583,509)
Net cash provided by (used in) financing activities $ 57,658,445
Net Increase (Decrease) in Cash and Cash Collateral at Brokers 19,911,417Cash and cash collateral at brokers at the beginning of period 454,684
Cash and cash collateral at brokers at the end of period $ 20,366,101
The following table provides a reconciliation of cash and cash collateral at brokers to the statement of assets and liabilities:
Cash 11,102,274Cash collateral at brokers for investments in futures 9,263,827
Total cash and cash collateral at brokers $ 20,366,101
Supplemental Disclosure of Cash Flow InformationCash paid for interest (excluding costs) $ 7,020Non-cash financing activities not included herein consists of reinvestments of distributions None
See accompanying notes to the financial statements.
240 :: Consolidated Statement of Cash Flows :: For the Periods Indicated (unaudited)
Toppan Merrill - ProFunds Public Semi-Annual Report [Funds] 01-31-2022 ED [AUX] | akiesli | 29-Mar-22 08:44 | 22-1296-2.ef | Sequence: 2CHKSUM Content: 2663 Layout: 27964 Graphics: 0 CLEAN
JOB: 22-1296-2 CYCLE#;BL#: 8; 0 TRIM: 8.25" x 10.75" AS: New York: 212-620-5600COLORS: ~note-color 2, Black, ~note-color 3 GRAPHICS: none V1.5

Financial Highlights
Toppan Merrill - ProFunds Public Semi-Annual Report [Funds] 01-31-2022 ED [AUX] | akiesli | 29-Mar-22 08:44 | 22-1296-2.fa | Sequence: 1CHKSUM Content: 40765 Layout: 54343 Graphics: 0 CLEAN
JOB: 22-1296-2 CYCLE#;BL#: 8; 0 TRIM: 8.25" x 10.75" AS: New York: 212-620-5600COLORS: Black, ~note-color 2 GRAPHICS: none V1.5
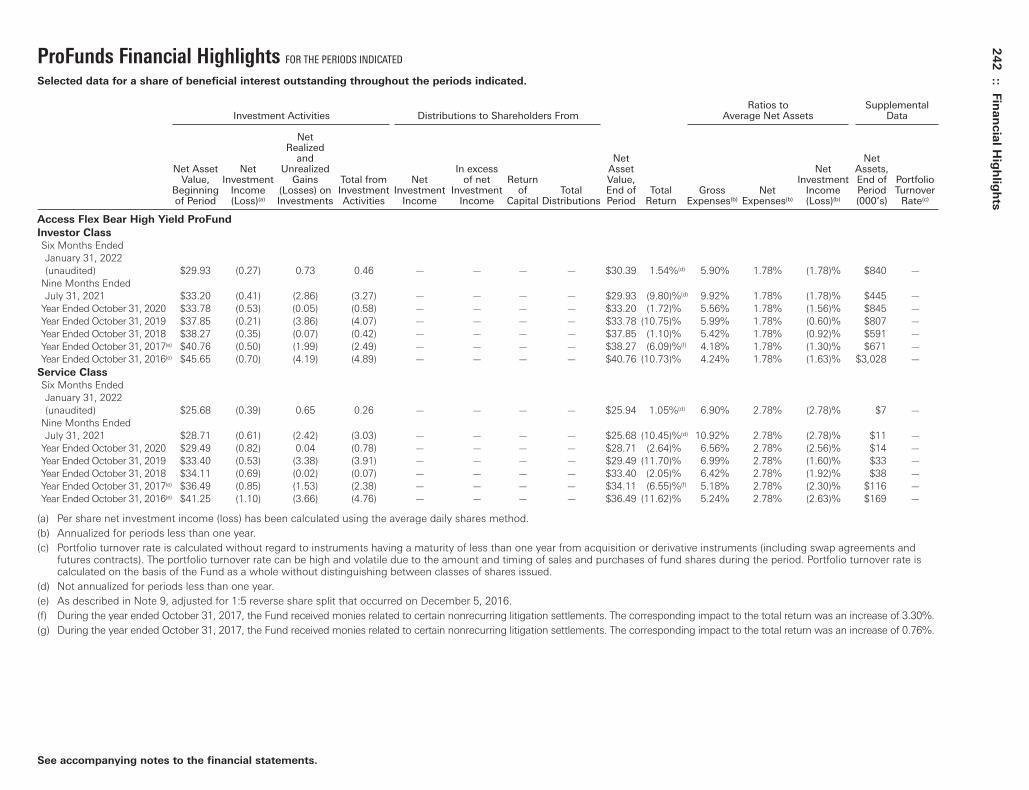
ProFunds Financial Highlights FOR THE PERIODS INDICATED
Selected data for a share of beneficial interest outstanding throughout the periods indicated.
Ratios to SupplementalInvestment Activities Distributions to Shareholders From Average Net Assets Data
Net Realized
and Net NetNet Asset Net Unrealized In excess Asset Net Assets,
Value, Investment Gains Total from Net of net Return Value, Investment End of PortfolioBeginning Income (Losses) on Investment Investment Investment of Total End of Total Gross Net Income Period Turnoverof Period (Loss)(a) Investments Activities Income Income Capital Distributions Period Return Expenses(b) Expenses(b) (Loss)(b) (000’s) Rate(c)
Access Flex Bear High Yield ProFund
Investor Class
Six Months EndedJanuary 31, 2022 (unaudited) $29.93 (0.27) 0.73 0.46 — — — — $30.39 1.54%(d) 5.90% 1.78% (1.78)% $840 —
Nine Months Ended July 31, 2021 $33.20 (0.41) (2.86) (3.27) — — — — $29.93 (9.80)%(d) 9.92% 1.78% (1.78)% $445 —
Year Ended October 31, 2020 $33.78 (0.53) (0.05) (0.58) — — — — $33.20 (1.72)% 5.56% 1.78% (1.56)% $845 —Year Ended October 31, 2019 $37.85 (0.21) (3.86) (4.07) — — — — $33.78 (10.75)% 5.99% 1.78% (0.60)% $807 —Year Ended October 31, 2018 $38.27 (0.35) (0.07) (0.42) — — — — $37.85 (1.10)% 5.42% 1.78% (0.92)% $591 —Year Ended October 31, 2017(e) $40.76 (0.50) (1.99) (2.49) — — — — $38.27 (6.09)%(f) 4.18% 1.78% (1.30)% $671 —Year Ended October 31, 2016(e) $45.65 (0.70) (4.19) (4.89) — — — — $40.76 (10.73)% 4.24% 1.78% (1.63)% $3,028 —
Service Class
Six Months EndedJanuary 31, 2022 (unaudited) $25.68 (0.39) 0.65 0.26 — — — — $25.94 1.05%(d) 6.90% 2.78% (2.78)% $7 —
Nine Months Ended July 31, 2021 $28.71 (0.61) (2.42) (3.03) — — — — $25.68 (10.45)%(d) 10.92% 2.78% (2.78)% $11 —
Year Ended October 31, 2020 $29.49 (0.82) 0.04 (0.78) — — — — $28.71 (2.64)% 6.56% 2.78% (2.56)% $14 —Year Ended October 31, 2019 $33.40 (0.53) (3.38) (3.91) — — — — $29.49 (11.70)% 6.99% 2.78% (1.60)% $33 —Year Ended October 31, 2018 $34.11 (0.69) (0.02) (0.07) — — — — $33.40 (2.05)% 6.42% 2.78% (1.92)% $38 —Year Ended October 31, 2017(e) $36.49 (0.85) (1.53) (2.38) — — — — $34.11 (6.55)%(f) 5.18% 2.78% (2.30)% $116 —Year Ended October 31, 2016(e) $41.25 (1.10) (3.66) (4.76) — — — — $36.49 (11.62)% 5.24% 2.78% (2.63)% $169 —
(a) Per share net investment income (loss) has been calculated using the average daily shares method.(b) Annualized for periods less than one year.(c) Portfolio turnover rate is calculated without regard to instruments having a maturity of less than one year from acquisition or derivative instruments (including swap agreements and
futures contracts). The portfolio turnover rate can be high and volatile due to the amount and timing of sales and purchases of fund shares during the period. Portfolio turnover rate iscalculated on the basis of the Fund as a whole without distinguishing between classes of shares issued.
(d) Not annualized for periods less than one year.(e) As described in Note 9, adjusted for 1:5 reverse share split that occurred on December 5, 2016.(f) During the year ended October 31, 2017, the Fund received monies related to certain nonrecurring litigation settlements. The corresponding impact to the total return was an increase of 3.30%.(g) During the year ended October 31, 2017, the Fund received monies related to certain nonrecurring litigation settlements. The corresponding impact to the total return was an increase of 0.76%.
See accompanying notes to the financial statements.
242
:: Fin
an
cia
l Hig
hlig
hts
Toppan Merrill - ProFunds Public Semi-Annual Report [Funds] 01-31-2022 ED [AUX] | akiesli | 29-Mar-22 08:44 | 22-1296-2.fc | Sequence: 1CHKSUM Content: 42347 Layout: 328 Graphics: 0 CLEAN
JOB: 22-1296-2 CYCLE#;BL#: 8; 0 TRIM: 10.75" x 8.25" AS: New York: 212-620-5600COLORS: ~HTML color, ~note-color 3, ~note-color 2, Black, ~HTML color 2 GRAPHICS: none V1.5

ProFunds Financial Highlights FOR THE PERIODS INDICATED
Selected data for a share of beneficial interest outstanding throughout the periods indicated.
Ratios to SupplementalInvestment Activities Distributions to Shareholders From Average Net Assets Data
Net Realized
and Net NetNet Asset Net Unrealized In excess Asset Net Assets,
Value, Investment Gains Total from Net of net Return Value, Investment End of PortfolioBeginning Income (Losses) on Investment Investment Investment of Total End of Total Gross Net Income Period Turnoverof Period (Loss)(a) Investments Activities Income Income Capital Distributions Period Return Expenses(b) Expenses(b) (Loss)(b) (000’s) Rate(c)
Access Flex High Yield ProFund
Investor Class
Six Months EndedJanuary 31, 2022 (unaudited) $32.91 (0.19) (0.87) (1.06) — (0.13) — (0.13) $31.72 (3.24)%(d) 1.78% 1.78% (1.14)% $5,052 551%(d)
Nine Months Ended July 31, 2021 $31.65 (0.34) 2.41 2.07 — (0.81) — (0.81) $32.91 6.63%(d) 1.97% 1.78% (1.39)% $13,252 944%
Year Ended October 31, 2020 $34.28 (0.39) (0.98) (1.37) — (1.14) (0.12) (1.26) $31.65 (4.05)% 2.07% 1.88% (1.17)% $17,557 1,534%Year Ended October 31, 2019 $32.40 0.06 3.20 3.26 (0.06) (1.32) — (1.38) $34.28 10.26% 1.90% 1.90% 0.19% $19,823 1,362%Year Ended October 31, 2018 $33.54 0.11 (0.18) (0.07) (0.11) (0.69) (0.27) (1.07) $32.40 (0.21)% 1.77% 1.77% 0.35% $25,909 1,334%Year Ended October 31, 2017 $32.66 (0.16) 2.27 2.11 — (1.23) — (1.23) $33.54 6.58%(g) 1.81% 1.81% (0.49)% $25,367 1,517%Year Ended October 31, 2016 $33.89 (0.26) 1.94 1.68 — (2.91) — (2.91) $32.66 5.50% 1.64% 1.64% (0.80)% $41,517 1,851%
Service Class
Six Months EndedJanuary 31, 2022 (unaudited) $32.53 (0.35) (0.87) (1.22) — (0.05) — (0.05) $31.26 (3.77)%(d) 2.78% 2.78% (2.14)% $2,719 551%(d)
Nine Months Ended July 31, 2021 $31.33 (0.59) 2.40 1.81 — (0.61) — (0.61) $32.53 5.81%(d) 2.97% 2.78% (2.39)% $3,527 944%
Year Ended October 31, 2020 $33.80 (0.71) (0.96) (1.67) — (0.72) (0.08) (0.80) $31.33 (4.98)% 3.07% 2.88% (2.17)% $2,806 1,534%Year Ended October 31, 2019 $32.03 (0.27) 3.15 2.88 — (1.11) — (1.11) $33.80 9.12% 2.90% 2.90% (0.81)% $4,820 1,362%Year Ended October 31, 2018 $32.80 (0.21) (0.17) (0.38) — (0.29) (0.10) (0.39) $32.03 (1.15)% 2.77% 2.77% (0.65)% $2,648 1,334%Year Ended October 31, 2017 $31.89 (0.48) 2.22 1.74 — (0.83) — (0.83) $32.80 5.54%(g) 2.81% 2.81% (1.49)% $5,326 1,517%Year Ended October 31, 2016 $33.15 (0.57) 1.90 1.33 — (2.59) — (2.59) $31.89 4.53% 2.64% 2.64% (1.80)% $8,834 1,851%
(a) Per share net investment income (loss) has been calculated using the average daily shares method.(b) Annualized for periods less than one year.(c) Portfolio turnover rate is calculated without regard to instruments having a maturity of less than one year from acquisition or derivative instruments (including swap agreements and
futures contracts). The portfolio turnover rate can be high and volatile due to the amount and timing of sales and purchases of fund shares during the period. Portfolio turnover rate iscalculated on the basis of the Fund as a whole without distinguishing between classes of shares issued.
(d) Not annualized for periods less than one year.(e) As described in Note 9, adjusted for 1:5 reverse share split that occurred on December 5, 2016.(f) During the year ended October 31, 2017, the Fund received monies related to certain nonrecurring litigation settlements. The corresponding impact to the total return was an increase of 3.30%.(g) During the year ended October 31, 2017, the Fund received monies related to certain nonrecurring litigation settlements. The corresponding impact to the total return was an increase of 0.76%.
See accompanying notes to the financial statements.
Fin
an
cia
l Hig
hlig
hts
:: 24
3
Toppan Merrill - ProFunds Public Semi-Annual Report [Funds] 01-31-2022 ED [AUX] | akiesli | 29-Mar-22 08:44 | 22-1296-2.fc | Sequence: 2CHKSUM Content: 38135 Layout: 58088 Graphics: 0 CLEAN
JOB: 22-1296-2 CYCLE#;BL#: 8; 0 TRIM: 10.75" x 8.25" AS: New York: 212-620-5600COLORS: ~note-color 2, Black, ~note-color 3 GRAPHICS: none V1.5
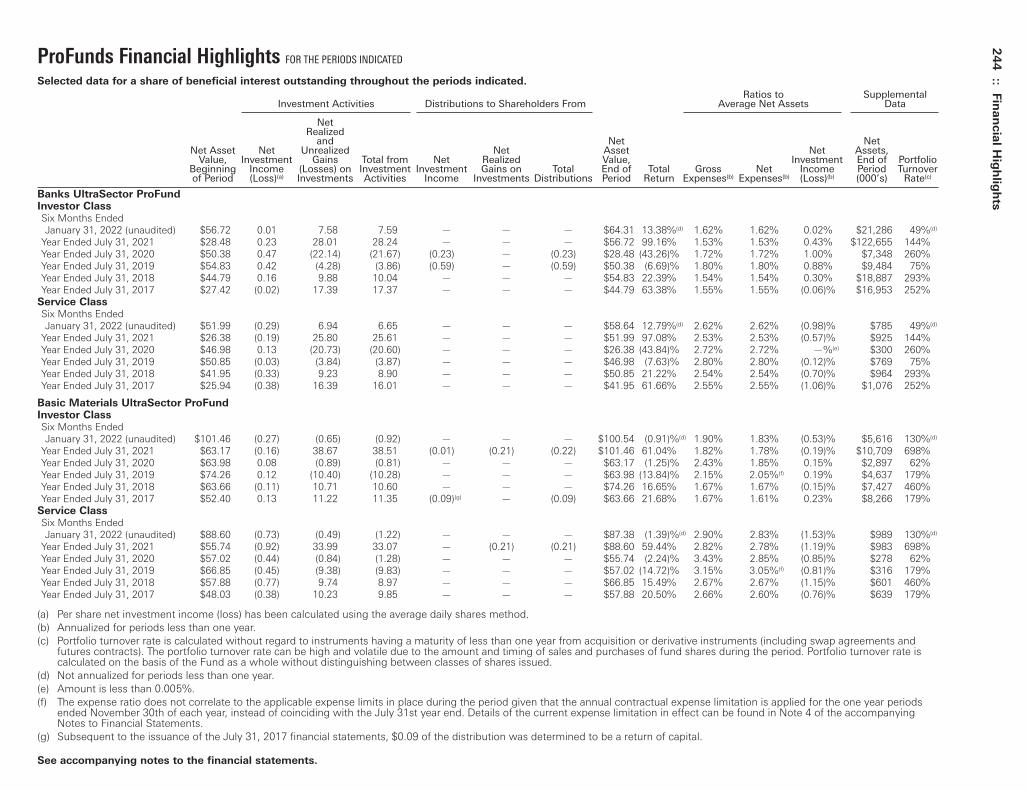
ProFunds Financial Highlights FOR THE PERIODS INDICATED
Selected data for a share of beneficial interest outstanding throughout the periods indicated.
Ratios to SupplementalInvestment Activities Distributions to Shareholders From Average Net Assets Data
NetRealized
and Net NetNet Asset Net Unrealized Net Asset Net Assets,
Value, Investment Gains Total from Net Realized Value, Investment End of PortfolioBeginning Income (Losses) on Investment Investment Gains on Total End of Total Gross Net Income Period Turnoverof Period (Loss)(a) Investments Activities Income Investments Distributions Period Return Expenses(b) Expenses(b) (Loss)(b) (000’s) Rate(c)
Banks UltraSector ProFundInvestor ClassSix Months EndedJanuary 31, 2022 (unaudited) $56.72 0.01 7.58 7.59 — — — $64.31 13.38%(d) 1.62% 1.62% 0.02% $21,286 49%(d)
Year Ended July 31, 2021 $28.48 0.23 28.01 28.24 — — — $56.72 99.16% 1.53% 1.53% 0.43% $122,655 144%Year Ended July 31, 2020 $50.38 0.47 (22.14) (21.67) (0.23) — (0.23) $28.48 (43.26)% 1.72% 1.72% 1.00% $7,348 260%Year Ended July 31, 2019 $54.83 0.42 (4.28) (3.86) (0.59) — (0.59) $50.38 (6.69)% 1.80% 1.80% 0.88% $9,484 75%Year Ended July 31, 2018 $44.79 0.16 9.88 10.04 — — — $54.83 22.39% 1.54% 1.54% 0.30% $18,887 293%Year Ended July 31, 2017 $27.42 (0.02) 17.39 17.37 — — — $44.79 63.38% 1.55% 1.55% (0.06)% $16,953 252%
Service ClassSix Months EndedJanuary 31, 2022 (unaudited) $51.99 (0.29) 6.94 6.65 — — — $58.64 12.79%(d) 2.62% 2.62% (0.98)% $785 49%(d)
Year Ended July 31, 2021 $26.38 (0.19) 25.80 25.61 — — — $51.99 97.08% 2.53% 2.53% (0.57)% $925 144%Year Ended July 31, 2020 $46.98 0.13 (20.73) (20.60) — — — $26.38 (43.84)% 2.72% 2.72% —%(e) $300 260%Year Ended July 31, 2019 $50.85 (0.03) (3.84) (3.87) — — — $46.98 (7.63)% 2.80% 2.80% (0.12)% $769 75%Year Ended July 31, 2018 $41.95 (0.33) 9.23 8.90 — — — $50.85 21.22% 2.54% 2.54% (0.70)% $964 293%Year Ended July 31, 2017 $25.94 (0.38) 16.39 16.01 — — — $41.95 61.66% 2.55% 2.55% (1.06)% $1,076 252%
Basic Materials UltraSector ProFundInvestor ClassSix Months EndedJanuary 31, 2022 (unaudited) $101.46 (0.27) (0.65) (0.92) — — — $100.54 (0.91)%(d) 1.90% 1.83% (0.53)% $5,616 130%(d)
Year Ended July 31, 2021 $63.17 (0.16) 38.67 38.51 (0.01) (0.21) (0.22) $101.46 61.04% 1.82% 1.78% (0.19)% $10,709 698%Year Ended July 31, 2020 $63.98 0.08 (0.89) (0.81) — — — $63.17 (1.25)% 2.43% 1.85% 0.15% $2,897 62%Year Ended July 31, 2019 $74.26 0.12 (10.40) (10.28) — — — $63.98 (13.84)% 2.15% 2.05%(f) 0.19% $4,637 179%Year Ended July 31, 2018 $63.66 (0.11) 10.71 10.60 — — — $74.26 16.65% 1.67% 1.67% (0.15)% $7,427 460%Year Ended July 31, 2017 $52.40 0.13 11.22 11.35 (0.09)(g) — (0.09) $63.66 21.68% 1.67% 1.61% 0.23% $8,266 179%
Service ClassSix Months EndedJanuary 31, 2022 (unaudited) $88.60 (0.73) (0.49) (1.22) — — — $87.38 (1.39)%(d) 2.90% 2.83% (1.53)% $989 130%(d)
Year Ended July 31, 2021 $55.74 (0.92) 33.99 33.07 — (0.21) (0.21) $88.60 59.44% 2.82% 2.78% (1.19)% $983 698%Year Ended July 31, 2020 $57.02 (0.44) (0.84) (1.28) — — — $55.74 (2.24)% 3.43% 2.85% (0.85)% $278 62%Year Ended July 31, 2019 $66.85 (0.45) (9.38) (9.83) — — — $57.02 (14.72)% 3.15% 3.05%(f) (0.81)% $316 179%Year Ended July 31, 2018 $57.88 (0.77) 9.74 8.97 — — — $66.85 15.49% 2.67% 2.67% (1.15)% $601 460%Year Ended July 31, 2017 $48.03 (0.38) 10.23 9.85 — — — $57.88 20.50% 2.66% 2.60% (0.76)% $639 179%
(a) Per share net investment income (loss) has been calculated using the average daily shares method.(b) Annualized for periods less than one year.(c) Portfolio turnover rate is calculated without regard to instruments having a maturity of less than one year from acquisition or derivative instruments (including swap agreements and
futures contracts). The portfolio turnover rate can be high and volatile due to the amount and timing of sales and purchases of fund shares during the period. Portfolio turnover rate iscalculated on the basis of the Fund as a whole without distinguishing between classes of shares issued.
(d) Not annualized for periods less than one year.(e) Amount is less than 0.005%.(f) The expense ratio does not correlate to the applicable expense limits in place during the period given that the annual contractual expense limitation is applied for the one year periods
ended November 30th of each year, instead of coinciding with the July 31st year end. Details of the current expense limitation in effect can be found in Note 4 of the accompanyingNotes to Financial Statements.
(g) Subsequent to the issuance of the July 31, 2017 financial statements, $0.09 of the distribution was determined to be a return of capital.
See accompanying notes to the financial statements.
244
:: Fin
an
cia
l Hig
hlig
hts
Toppan Merrill - ProFunds Public Semi-Annual Report [Funds] 01-31-2022 ED [AUX] | akiesli | 29-Mar-22 08:44 | 22-1296-2.fc | Sequence: 3CHKSUM Content: 59537 Layout: 12309 Graphics: 0 CLEAN
JOB: 22-1296-2 CYCLE#;BL#: 8; 0 TRIM: 10.75" x 8.25" AS: New York: 212-620-5600COLORS: ~note-color 2, Black, ~note-color 3 GRAPHICS: none V1.5

ProFunds Financial Highlights FOR THE PERIODS INDICATED
Selected data for a share of beneficial interest outstanding throughout the periods indicated.Ratios to Supplemental
Investment Activities Distributions to Shareholders From Average Net Assets Data
NetRealized
and Net NetNet Asset Net Unrealized Net Asset Net Assets,
Value, Investment Gains Total from Net Realized Value, Investment End of PortfolioBeginning Income (Losses) on Investment Investment Gains on Total End of Total Gross Net Income Period Turnoverof Period (Loss)(a) Investments Activities Income Investments Distributions Period Return Expenses(b) Expenses(b) (Loss)(b) (000’s) Rate(c)
Bear ProFund
Investor Class
Six Months EndedJanuary 31, 2022 (unaudited) $16.01 (0.13) (0.64) (0.77) — — — $15.24 (4.81)%(d) 1.66% 1.66% (1.66)% $9,316 —
Year Ended July 31, 2021 $22.67 (0.33) (6.32) (6.65) (0.01) — (0.01) $16.01 (29.33)% 1.74% 1.74% (1.73)% $9,799 —Year Ended July 31, 2020 $28.37 (0.25) (5.38) (5.63) (0.07) — (0.07) $22.67 (19.87)% 1.86% 1.86% (0.95)% $15,698 —Year Ended July 31, 2019 $30.45 0.14 (2.22) (2.08) — — — $28.37 (6.83)% 1.77% 1.77% 0.48% $19,388 —Year Ended July 31, 2018 $35.46 (0.11) (4.90) (5.01) — — — $30.45 (14.13)% 1.59% 1.59% (0.34)% $12,790 —Year Ended July 31, 2017(e) $41.56 (0.41) (5.69) (6.10) — — — $35.46 (14.66)% 1.63% 1.63% (1.07)% $45,370 —
Service Class
Six Months EndedJanuary 31, 2022 (unaudited) $14.56 (0.20) (0.57) (0.77) — — — $13.79 (5.29)%(d) 2.66% 2.66% (2.66)% $515 —
Year Ended July 31, 2021 $20.82 (0.51) (5.75) (6.26) — — — $14.56 (30.07)% 2.74% 2.74% (2.73)% $789 —Year Ended July 31, 2020 $26.23 (0.50) (4.91) (5.41) — — — $20.82 (20.63)% 2.86% 2.86% (1.95)% $677 —Year Ended July 31, 2019 $28.44 (0.14) (2.07) (2.21) — — — $26.23 (7.77)% 2.77% 2.77% (0.52)% $761 —Year Ended July 31, 2018 $33.46 (0.42) (4.60) (5.02) — — — $28.44 (15.00)% 2.59% 2.59% (1.34)% $659 —Year Ended July 31, 2017(e) $39.62 (0.79) (5.37) (6.16) — — — $33.46 (15.51)% 2.63% 2.63% (2.07)% $2,667 —
Biotechnology UltraSector ProFund
Investor Class
Six Months EndedJanuary 31, 2022 (unaudited) $85.26 (0.16) (12.40) (12.56) — (12.79) (12.79) $59.91 (16.56)%(d) 1.45% 1.45% (0.43)% $130,164 24%(d)
Year Ended July 31, 2021 $72.23 (0.27) 21.37 21.10 — (8.07) (8.07) $85.26 32.02% 1.55% 1.55% (0.37)% $168,280 62%Year Ended July 31, 2020 $51.90 (0.06) 22.42 22.36 — (2.03) (2.03) $72.23 43.62% 1.61% 1.61% (0.10)% $188,065 52%Year Ended July 31, 2019 $66.16 0.11 (11.50) (11.39) — (2.87) (2.87) $51.90 (17.10)% 1.52% 1.52% 0.19% $161,970 23%Year Ended July 31, 2018 $63.85 (0.05) 6.85 6.80 — (4.49) (4.49) $66.16 10.94% 1.43% 1.43% (0.08)% $246,238 11%Year Ended July 31, 2017 $56.32 (0.15) 7.68 7.53 — — — $63.85 13.37% 1.45% 1.45% (0.28)% $320,937 14%
Service Class
Six Months EndedJanuary 31, 2022 (unaudited) $61.86 (0.44) (8.49) (8.93) — (12.79) (12.79) $40.14 (17.00)%(d) 2.45% 2.45% (1.43)% $3,942 24%(d)
Year Ended July 31, 2021 $55.00 (0.80) 15.73 14.93 — (8.07) (8.07) $61.86 30.74% 2.54% 2.54% (1.36)% $5,358 62%Year Ended July 31, 2020 $40.29 (0.52) 17.26 16.74 — (2.03) (2.03) $55.00 42.20% 2.60% 2.60% (1.09)% $5,999 52%Year Ended July 31, 2019 $52.66 (0.35) (9.15) (9.50) — (2.87) (2.87) $40.29 (17.93)% 2.52% 2.52% (0.80)% $5,559 23%Year Ended July 31, 2018 $52.18 (0.58) 5.55 4.97 — (4.49) (4.49) $52.66 9.83% 2.43% 2.43% (1.08)% $9,183 11%Year Ended July 31, 2017 $46.48 (0.60) 6.30 5.70 — — — $52.18 12.26% 2.45% 2.45% (1.28)% $12,721 14%
(a) Per share net investment income (loss) has been calculated using the average daily shares method.(b) Annualized for periods less than one year.(c) Portfolio turnover rate is calculated without regard to instruments having a maturity of less than one year from acquisition or derivative instruments (including swap agreements and
futures contracts). The portfolio turnover rate can be high and volatile due to the amount and timing of sales and purchases of fund shares during the period. Portfolio turnover rate iscalculated on the basis of the Fund as a whole without distinguishing between classes of shares issued.
(d) Not annualized for periods less than one year.(e) As described in Note 9, share amounts have been adjusted for 1:5 reverse share split that occurred on December 5, 2016.
See accompanying notes to the financial statements.
Fin
an
cia
l Hig
hlig
hts
:: 24
5
Toppan Merrill - ProFunds Public Semi-Annual Report [Funds] 01-31-2022 ED [AUX] | akiesli | 29-Mar-22 08:44 | 22-1296-2.fc | Sequence: 4CHKSUM Content: 17627 Layout: 46411 Graphics: 0 CLEAN
JOB: 22-1296-2 CYCLE#;BL#: 8; 0 TRIM: 10.75" x 8.25" AS: New York: 212-620-5600COLORS: ~note-color 2, Black, ~note-color 3 GRAPHICS: none V1.5
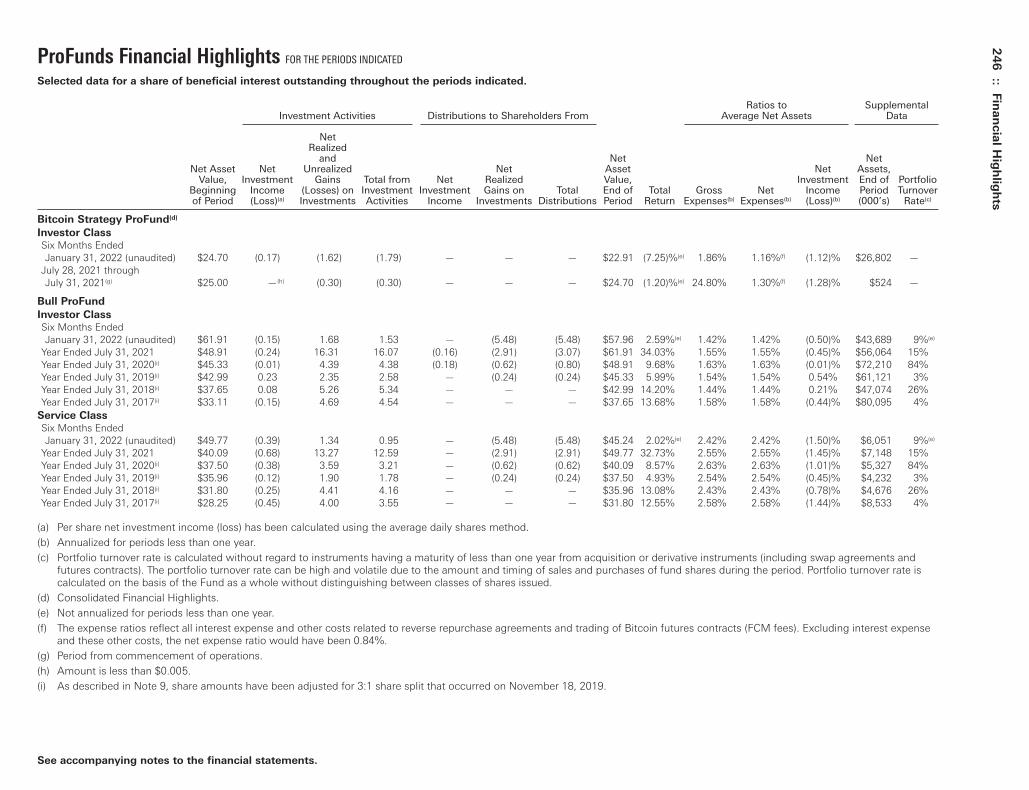
ProFunds Financial Highlights FOR THE PERIODS INDICATED
Selected data for a share of beneficial interest outstanding throughout the periods indicated.
Ratios to SupplementalInvestment Activities Distributions to Shareholders From Average Net Assets Data
NetRealized
and Net NetNet Asset Net Unrealized Net Asset Net Assets,
Value, Investment Gains Total from Net Realized Value, Investment End of PortfolioBeginning Income (Losses) on Investment Investment Gains on Total End of Total Gross Net Income Period Turnoverof Period (Loss)(a) Investments Activities Income Investments Distributions Period Return Expenses(b) Expenses(b) (Loss)(b) (000’s) Rate(c)
Bitcoin Strategy ProFund(d)
Investor Class
Six Months EndedJanuary 31, 2022 (unaudited) $24.70 (0.17) (1.62) (1.79) — — — $22.91 (7.25)%(e) 1.86% 1.16%(f) (1.12)% $26,802 —
July 28, 2021 through July 31, 2021(g) $25.00 —(h) (0.30) (0.30) — — — $24.70 (1.20)%(e) 24.80% 1.30%(f) (1.28)% $524 —
Bull ProFund
Investor Class
Six Months EndedJanuary 31, 2022 (unaudited) $61.91 (0.15) 1.68 1.53 — (5.48) (5.48) $57.96 2.59%(e) 1.42% 1.42% (0.50)% $43,689 9%(e)
Year Ended July 31, 2021 $48.91 (0.24) 16.31 16.07 (0.16) (2.91) (3.07) $61.91 34.03% 1.55% 1.55% (0.45)% $56,064 15%Year Ended July 31, 2020(i) $45.33 (0.01) 4.39 4.38 (0.18) (0.62) (0.80) $48.91 9.68% 1.63% 1.63% (0.01)% $72,210 84%Year Ended July 31, 2019(i) $42.99 0.23 2.35 2.58 — (0.24) (0.24) $45.33 5.99% 1.54% 1.54% 0.54% $61,121 3%Year Ended July 31, 2018(i) $37.65 0.08 5.26 5.34 — — — $42.99 14.20% 1.44% 1.44% 0.21% $47,074 26%Year Ended July 31, 2017(i) $33.11 (0.15) 4.69 4.54 — — — $37.65 13.68% 1.58% 1.58% (0.44)% $80,095 4%
Service Class
Six Months EndedJanuary 31, 2022 (unaudited) $49.77 (0.39) 1.34 0.95 — (5.48) (5.48) $45.24 2.02%(e) 2.42% 2.42% (1.50)% $6,051 9%(e)
Year Ended July 31, 2021 $40.09 (0.68) 13.27 12.59 — (2.91) (2.91) $49.77 32.73% 2.55% 2.55% (1.45)% $7,148 15%Year Ended July 31, 2020(i) $37.50 (0.38) 3.59 3.21 — (0.62) (0.62) $40.09 8.57% 2.63% 2.63% (1.01)% $5,327 84%Year Ended July 31, 2019(i) $35.96 (0.12) 1.90 1.78 — (0.24) (0.24) $37.50 4.93% 2.54% 2.54% (0.45)% $4,232 3%Year Ended July 31, 2018(i) $31.80 (0.25) 4.41 4.16 — — — $35.96 13.08% 2.43% 2.43% (0.78)% $4,676 26%Year Ended July 31, 2017(i) $28.25 (0.45) 4.00 3.55 — — — $31.80 12.55% 2.58% 2.58% (1.44)% $8,533 4%
(a) Per share net investment income (loss) has been calculated using the average daily shares method.(b) Annualized for periods less than one year.(c) Portfolio turnover rate is calculated without regard to instruments having a maturity of less than one year from acquisition or derivative instruments (including swap agreements and
futures contracts). The portfolio turnover rate can be high and volatile due to the amount and timing of sales and purchases of fund shares during the period. Portfolio turnover rate iscalculated on the basis of the Fund as a whole without distinguishing between classes of shares issued.
(d) Consolidated Financial Highlights.(e) Not annualized for periods less than one year.(f) The expense ratios reflect all interest expense and other costs related to reverse repurchase agreements and trading of Bitcoin futures contracts (FCM fees). Excluding interest expense
and these other costs, the net expense ratio would have been 0.84%.(g) Period from commencement of operations.(h) Amount is less than $0.005.(i) As described in Note 9, share amounts have been adjusted for 3:1 share split that occurred on November 18, 2019.
See accompanying notes to the financial statements.
246
:: Fin
an
cia
l Hig
hlig
hts
Toppan Merrill - ProFunds Public Semi-Annual Report [Funds] 01-31-2022 ED [AUX] | akiesli | 29-Mar-22 08:44 | 22-1296-2.fc | Sequence: 5CHKSUM Content: 40123 Layout: 22922 Graphics: 0 CLEAN
JOB: 22-1296-2 CYCLE#;BL#: 8; 0 TRIM: 10.75" x 8.25" AS: New York: 212-620-5600COLORS: ~note-color 2, Black, ~note-color 3 GRAPHICS: none V1.5
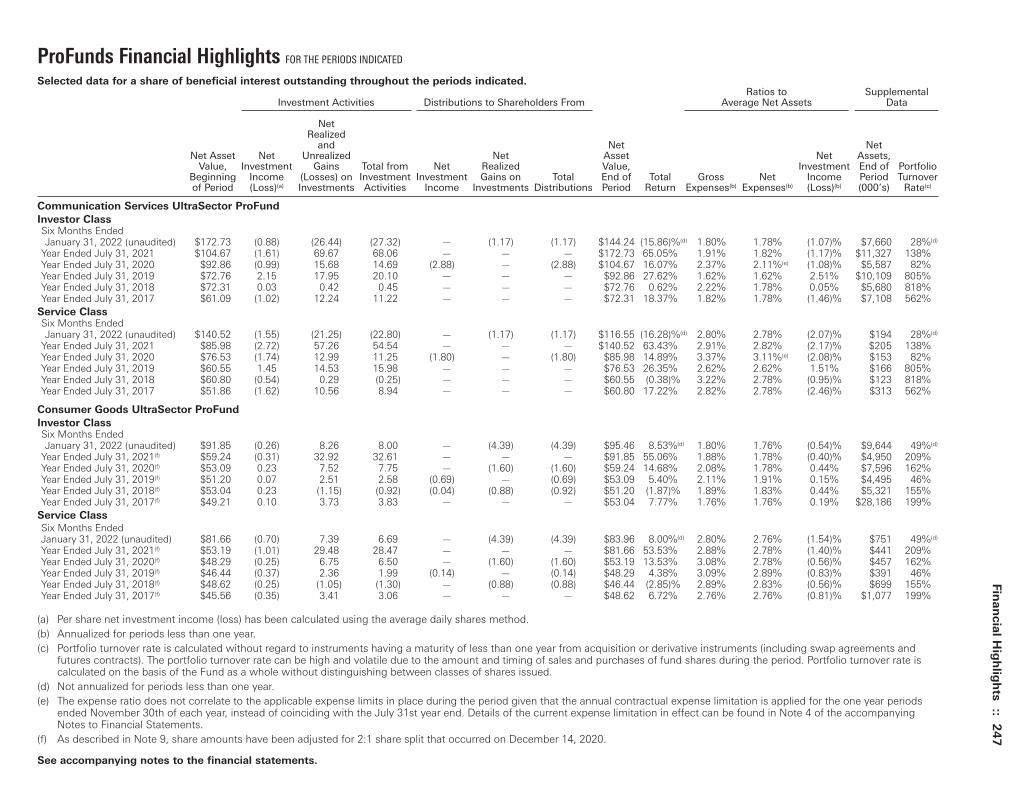
ProFunds Financial Highlights FOR THE PERIODS INDICATED
Selected data for a share of beneficial interest outstanding throughout the periods indicated.Ratios to Supplemental
Investment Activities Distributions to Shareholders From Average Net Assets Data
NetRealized
and Net NetNet Asset Net Unrealized Net Asset Net Assets,
Value, Investment Gains Total from Net Realized Value, Investment End of PortfolioBeginning Income (Losses) on Investment Investment Gains on Total End of Total Gross Net Income Period Turnoverof Period (Loss)(a) Investments Activities Income Investments Distributions Period Return Expenses(b) Expenses(b) (Loss)(b) (000’s) Rate(c)
Communication Services UltraSector ProFund
Investor ClassSix Months EndedJanuary 31, 2022 (unaudited) $172.73 (0.88) (26.44) (27.32) — (1.17) (1.17) $144.24 (15.86)%(d) 1.80% 1.78% (1.07)% $7,660 28%(d)
Year Ended July 31, 2021 $104.67 (1.61) 69.67 68.06 — — — $172.73 65.05% 1.91% 1.82% (1.17)% $11,327 138%Year Ended July 31, 2020 $92.86 (0.99) 15.68 14.69 (2.88) — (2.88) $104.67 16.07% 2.37% 2.11%(e) (1.08)% $5,587 82%Year Ended July 31, 2019 $72.76 2.15 17.95 20.10 — — — $92.86 27.62% 1.62% 1.62% 2.51% $10,109 805%Year Ended July 31, 2018 $72.31 0.03 0.42 0.45 — — — $72.76 0.62% 2.22% 1.78% 0.05% $5,680 818%Year Ended July 31, 2017 $61.09 (1.02) 12.24 11.22 — — — $72.31 18.37% 1.82% 1.78% (1.46)% $7,108 562%
Service ClassSix Months EndedJanuary 31, 2022 (unaudited) $140.52 (1.55) (21.25) (22.80) — (1.17) (1.17) $116.55 (16.28)%(d) 2.80% 2.78% (2.07)% $194 28%(d)
Year Ended July 31, 2021 $85.98 (2.72) 57.26 54.54 — — — $140.52 63.43% 2.91% 2.82% (2.17)% $205 138%Year Ended July 31, 2020 $76.53 (1.74) 12.99 11.25 (1.80) — (1.80) $85.98 14.89% 3.37% 3.11%(e) (2.08)% $153 82%Year Ended July 31, 2019 $60.55 1.45 14.53 15.98 — — — $76.53 26.35% 2.62% 2.62% 1.51% $166 805%Year Ended July 31, 2018 $60.80 (0.54) 0.29 (0.25) — — — $60.55 (0.38)% 3.22% 2.78% (0.95)% $123 818%Year Ended July 31, 2017 $51.86 (1.62) 10.56 8.94 — — — $60.80 17.22% 2.82% 2.78% (2.46)% $313 562%
Consumer Goods UltraSector ProFund
Investor ClassSix Months EndedJanuary 31, 2022 (unaudited) $91.85 (0.26) 8.26 8.00 — (4.39) (4.39) $95.46 8.53%(d) 1.80% 1.76% (0.54)% $9,644 49%(d)
Year Ended July 31, 2021(f) $59.24 (0.31) 32.92 32.61 — — — $91.85 55.06% 1.88% 1.78% (0.40)% $4,950 209%Year Ended July 31, 2020(f) $53.09 0.23 7.52 7.75 — (1.60) (1.60) $59.24 14.68% 2.08% 1.78% 0.44% $7,596 162%Year Ended July 31, 2019(f) $51.20 0.07 2.51 2.58 (0.69) — (0.69) $53.09 5.40% 2.11% 1.91% 0.15% $4,495 46%Year Ended July 31, 2018(f) $53.04 0.23 (1.15) (0.92) (0.04) (0.88) (0.92) $51.20 (1.87)% 1.89% 1.83% 0.44% $5,321 155%Year Ended July 31, 2017(f) $49.21 0.10 3.73 3.83 — — — $53.04 7.77% 1.76% 1.76% 0.19% $28,186 199%
Service Class
Six Months EndedJanuary 31, 2022 (unaudited) $81.66 (0.70) 7.39 6.69 — (4.39) (4.39) $83.96 8.00%(d) 2.80% 2.76% (1.54)% $751 49%(d)
Year Ended July 31, 2021(f) $53.19 (1.01) 29.48 28.47 — — — $81.66 53.53% 2.88% 2.78% (1.40)% $441 209%Year Ended July 31, 2020(f) $48.29 (0.25) 6.75 6.50 — (1.60) (1.60) $53.19 13.53% 3.08% 2.78% (0.56)% $457 162%Year Ended July 31, 2019(f) $46.44 (0.37) 2.36 1.99 (0.14) — (0.14) $48.29 4.38% 3.09% 2.89% (0.83)% $391 46%Year Ended July 31, 2018(f) $48.62 (0.25) (1.05) (1.30) — (0.88) (0.88) $46.44 (2.85)% 2.89% 2.83% (0.56)% $699 155%Year Ended July 31, 2017(f) $45.56 (0.35) 3.41 3.06 — — — $48.62 6.72% 2.76% 2.76% (0.81)% $1,077 199%
(a) Per share net investment income (loss) has been calculated using the average daily shares method.(b) Annualized for periods less than one year.(c) Portfolio turnover rate is calculated without regard to instruments having a maturity of less than one year from acquisition or derivative instruments (including swap agreements and
futures contracts). The portfolio turnover rate can be high and volatile due to the amount and timing of sales and purchases of fund shares during the period. Portfolio turnover rate iscalculated on the basis of the Fund as a whole without distinguishing between classes of shares issued.
(d) Not annualized for periods less than one year.(e) The expense ratio does not correlate to the applicable expense limits in place during the period given that the annual contractual expense limitation is applied for the one year periods
ended November 30th of each year, instead of coinciding with the July 31st year end. Details of the current expense limitation in effect can be found in Note 4 of the accompanyingNotes to Financial Statements.
(f) As described in Note 9, share amounts have been adjusted for 2:1 share split that occurred on December 14, 2020.
See accompanying notes to the financial statements.
Fin
an
cia
l Hig
hlig
hts
:: 24
7
Toppan Merrill - ProFunds Public Semi-Annual Report [Funds] 01-31-2022 ED [AUX] | akiesli | 29-Mar-22 08:44 | 22-1296-2.fc | Sequence: 6CHKSUM Content: 41163 Layout: 17171 Graphics: 0 CLEAN
JOB: 22-1296-2 CYCLE#;BL#: 8; 0 TRIM: 10.75" x 8.25" AS: New York: 212-620-5600COLORS: ~note-color 2, Black, ~note-color 3 GRAPHICS: none V1.5
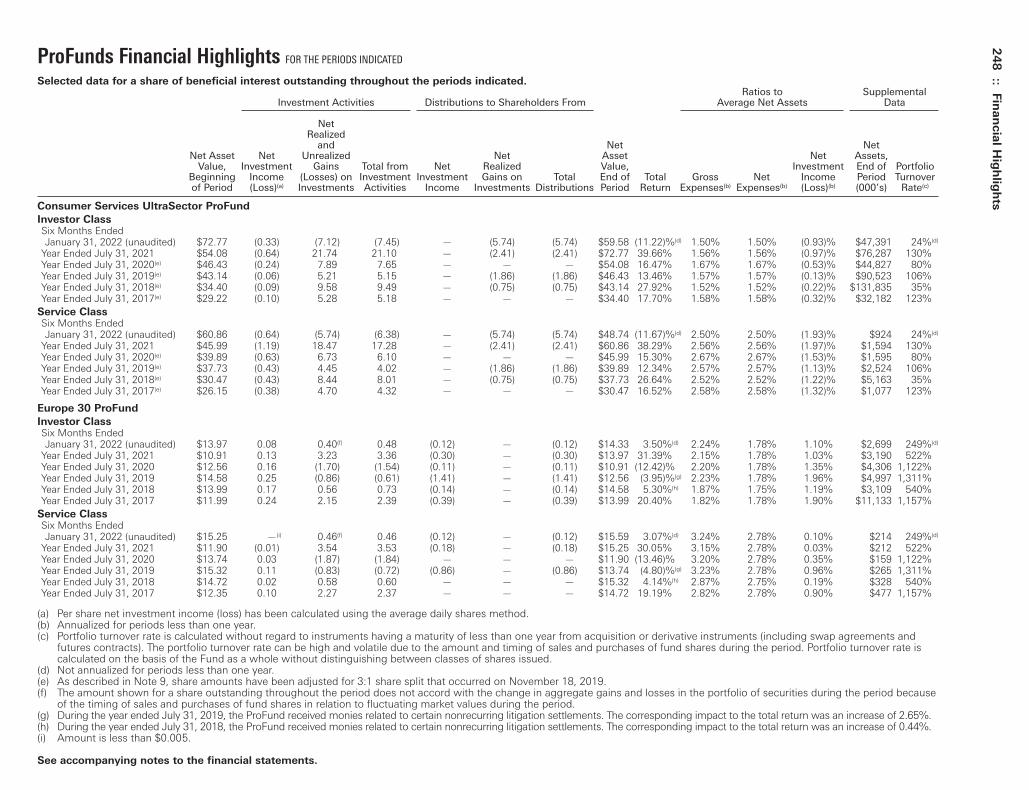
ProFunds Financial Highlights FOR THE PERIODS INDICATED
Selected data for a share of beneficial interest outstanding throughout the periods indicated.Ratios to Supplemental
Investment Activities Distributions to Shareholders From Average Net Assets Data
NetRealized
and Net NetNet Asset Net Unrealized Net Asset Net Assets,
Value, Investment Gains Total from Net Realized Value, Investment End of PortfolioBeginning Income (Losses) on Investment Investment Gains on Total End of Total Gross Net Income Period Turnoverof Period (Loss)(a) Investments Activities Income Investments Distributions Period Return Expenses(b) Expenses(b) (Loss)(b) (000’s) Rate(c)
Consumer Services UltraSector ProFund
Investor ClassSix Months EndedJanuary 31, 2022 (unaudited) $72.77 (0.33) (7.12) (7.45) — (5.74) (5.74) $59.58 (11.22)%(d) 1.50% 1.50% (0.93)% $47,391 24%(d)
Year Ended July 31, 2021 $54.08 (0.64) 21.74 21.10 — (2.41) (2.41) $72.77 39.66% 1.56% 1.56% (0.97)% $76,287 130%Year Ended July 31, 2020(e) $46.43 (0.24) 7.89 7.65 — — — $54.08 16.47% 1.67% 1.67% (0.53)% $44,827 80%Year Ended July 31, 2019(e) $43.14 (0.06) 5.21 5.15 — (1.86) (1.86) $46.43 13.46% 1.57% 1.57% (0.13)% $90,523 106%Year Ended July 31, 2018(e) $34.40 (0.09) 9.58 9.49 — (0.75) (0.75) $43.14 27.92% 1.52% 1.52% (0.22)% $131,835 35%Year Ended July 31, 2017(e) $29.22 (0.10) 5.28 5.18 — — — $34.40 17.70% 1.58% 1.58% (0.32)% $32,182 123%
Service ClassSix Months EndedJanuary 31, 2022 (unaudited) $60.86 (0.64) (5.74) (6.38) — (5.74) (5.74) $48.74 (11.67)%(d) 2.50% 2.50% (1.93)% $924 24%(d)
Year Ended July 31, 2021 $45.99 (1.19) 18.47 17.28 — (2.41) (2.41) $60.86 38.29% 2.56% 2.56% (1.97)% $1,594 130%Year Ended July 31, 2020(e) $39.89 (0.63) 6.73 6.10 — — — $45.99 15.30% 2.67% 2.67% (1.53)% $1,595 80%Year Ended July 31, 2019(e) $37.73 (0.43) 4.45 4.02 — (1.86) (1.86) $39.89 12.34% 2.57% 2.57% (1.13)% $2,524 106%Year Ended July 31, 2018(e) $30.47 (0.43) 8.44 8.01 — (0.75) (0.75) $37.73 26.64% 2.52% 2.52% (1.22)% $5,163 35%Year Ended July 31, 2017(e) $26.15 (0.38) 4.70 4.32 — — — $30.47 16.52% 2.58% 2.58% (1.32)% $1,077 123%
Europe 30 ProFund
Investor ClassSix Months EndedJanuary 31, 2022 (unaudited) $13.97 0.08 0.40(f) 0.48 (0.12) — (0.12) $14.33 3.50%(d) 2.24% 1.78% 1.10% $2,699 249%(d)
Year Ended July 31, 2021 $10.91 0.13 3.23 3.36 (0.30) — (0.30) $13.97 31.39% 2.15% 1.78% 1.03% $3,190 522%Year Ended July 31, 2020 $12.56 0.16 (1.70) (1.54) (0.11) — (0.11) $10.91 (12.42)% 2.20% 1.78% 1.35% $4,306 1,122%Year Ended July 31, 2019 $14.58 0.25 (0.86) (0.61) (1.41) — (1.41) $12.56 (3.95)%(g) 2.23% 1.78% 1.96% $4,997 1,311%Year Ended July 31, 2018 $13.99 0.17 0.56 0.73 (0.14) — (0.14) $14.58 5.30%(h) 1.87% 1.75% 1.19% $3,109 540%Year Ended July 31, 2017 $11.99 0.24 2.15 2.39 (0.39) — (0.39) $13.99 20.40% 1.82% 1.78% 1.90% $11,133 1,157%
Service ClassSix Months EndedJanuary 31, 2022 (unaudited) $15.25 —(i) 0.46(f) 0.46 (0.12) — (0.12) $15.59 3.07%(d) 3.24% 2.78% 0.10% $214 249%(d)
Year Ended July 31, 2021 $11.90 (0.01) 3.54 3.53 (0.18) — (0.18) $15.25 30.05% 3.15% 2.78% 0.03% $212 522%Year Ended July 31, 2020 $13.74 0.03 (1.87) (1.84) — — — $11.90 (13.46)% 3.20% 2.78% 0.35% $159 1,122%Year Ended July 31, 2019 $15.32 0.11 (0.83) (0.72) (0.86) — (0.86) $13.74 (4.80)%(g) 3.23% 2.78% 0.96% $265 1,311%Year Ended July 31, 2018 $14.72 0.02 0.58 0.60 — — — $15.32 4.14%(h) 2.87% 2.75% 0.19% $328 540%Year Ended July 31, 2017 $12.35 0.10 2.27 2.37 — — — $14.72 19.19% 2.82% 2.78% 0.90% $477 1,157%
(a) Per share net investment income (loss) has been calculated using the average daily shares method.(b) Annualized for periods less than one year.(c) Portfolio turnover rate is calculated without regard to instruments having a maturity of less than one year from acquisition or derivative instruments (including swap agreements and
futures contracts). The portfolio turnover rate can be high and volatile due to the amount and timing of sales and purchases of fund shares during the period. Portfolio turnover rate iscalculated on the basis of the Fund as a whole without distinguishing between classes of shares issued.
(d) Not annualized for periods less than one year.(e) As described in Note 9, share amounts have been adjusted for 3:1 share split that occurred on November 18, 2019.(f) The amount shown for a share outstanding throughout the period does not accord with the change in aggregate gains and losses in the portfolio of securities during the period because
of the timing of sales and purchases of fund shares in relation to fluctuating market values during the period.(g) During the year ended July 31, 2019, the ProFund received monies related to certain nonrecurring litigation settlements. The corresponding impact to the total return was an increase of 2.65%.(h) During the year ended July 31, 2018, the ProFund received monies related to certain nonrecurring litigation settlements. The corresponding impact to the total return was an increase of 0.44%.(i) Amount is less than $0.005.
See accompanying notes to the financial statements.
248
:: Fin
an
cia
l Hig
hlig
hts
Toppan Merrill - ProFunds Public Semi-Annual Report [Funds] 01-31-2022 ED [AUX] | akiesli | 29-Mar-22 08:44 | 22-1296-2.fc | Sequence: 7CHKSUM Content: 29732 Layout: 13238 Graphics: 0 CLEAN
JOB: 22-1296-2 CYCLE#;BL#: 8; 0 TRIM: 10.75" x 8.25" AS: New York: 212-620-5600COLORS: ~note-color 2, Black, ~note-color 3 GRAPHICS: none V1.5
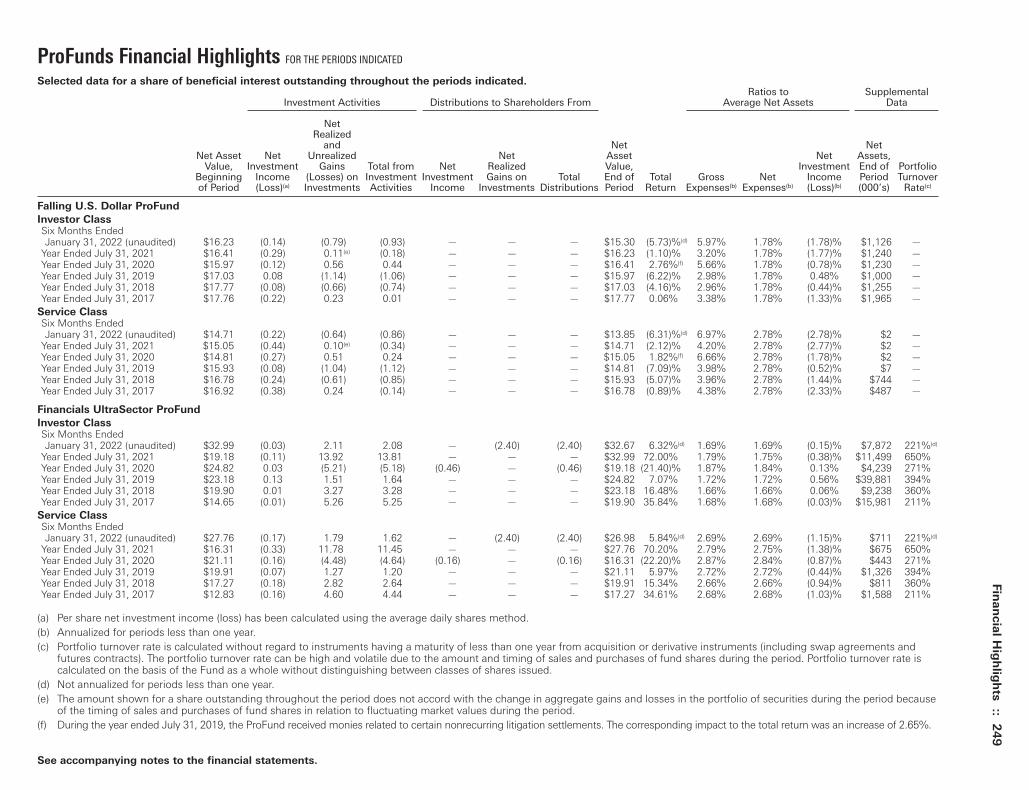
ProFunds Financial Highlights FOR THE PERIODS INDICATED
Selected data for a share of beneficial interest outstanding throughout the periods indicated.Ratios to Supplemental
Investment Activities Distributions to Shareholders From Average Net Assets Data
NetRealized
and Net NetNet Asset Net Unrealized Net Asset Net Assets,
Value, Investment Gains Total from Net Realized Value, Investment End of PortfolioBeginning Income (Losses) on Investment Investment Gains on Total End of Total Gross Net Income Period Turnoverof Period (Loss)(a) Investments Activities Income Investments Distributions Period Return Expenses(b) Expenses(b) (Loss)(b) (000’s) Rate(c)
Falling U.S. Dollar ProFund
Investor ClassSix Months EndedJanuary 31, 2022 (unaudited) $16.23 (0.14) (0.79) (0.93) — — — $15.30 (5.73)%(d) 5.97% 1.78% (1.78)% $1,126 —
Year Ended July 31, 2021 $16.41 (0.29) 0.11(e) (0.18) — — — $16.23 (1.10)% 3.20% 1.78% (1.77)% $1,240 —Year Ended July 31, 2020 $15.97 (0.12) 0.56 0.44 — — — $16.41 2.76%(f) 5.66% 1.78% (0.78)% $1,230 —Year Ended July 31, 2019 $17.03 0.08 (1.14) (1.06) — — — $15.97 (6.22)% 2.98% 1.78% 0.48% $1,000 —Year Ended July 31, 2018 $17.77 (0.08) (0.66) (0.74) — — — $17.03 (4.16)% 2.96% 1.78% (0.44)% $1,255 —Year Ended July 31, 2017 $17.76 (0.22) 0.23 0.01 — — — $17.77 0.06% 3.38% 1.78% (1.33)% $1,965 —
Service ClassSix Months EndedJanuary 31, 2022 (unaudited) $14.71 (0.22) (0.64) (0.86) — — — $13.85 (6.31)%(d) 6.97% 2.78% (2.78)% $2 —
Year Ended July 31, 2021 $15.05 (0.44) 0.10(e) (0.34) — — — $14.71 (2.12)% 4.20% 2.78% (2.77)% $2 —Year Ended July 31, 2020 $14.81 (0.27) 0.51 0.24 — — — $15.05 1.82%(f) 6.66% 2.78% (1.78)% $2 —Year Ended July 31, 2019 $15.93 (0.08) (1.04) (1.12) — — — $14.81 (7.09)% 3.98% 2.78% (0.52)% $7 —Year Ended July 31, 2018 $16.78 (0.24) (0.61) (0.85) — — — $15.93 (5.07)% 3.96% 2.78% (1.44)% $744 —Year Ended July 31, 2017 $16.92 (0.38) 0.24 (0.14) — — — $16.78 (0.89)% 4.38% 2.78% (2.33)% $487 —
Financials UltraSector ProFund
Investor ClassSix Months EndedJanuary 31, 2022 (unaudited) $32.99 (0.03) 2.11 2.08 — (2.40) (2.40) $32.67 6.32%(d) 1.69% 1.69% (0.15)% $7,872 221%(d)
Year Ended July 31, 2021 $19.18 (0.11) 13.92 13.81 — — — $32.99 72.00% 1.79% 1.75% (0.38)% $11,499 650%Year Ended July 31, 2020 $24.82 0.03 (5.21) (5.18) (0.46) — (0.46) $19.18 (21.40)% 1.87% 1.84% 0.13% $4,239 271%Year Ended July 31, 2019 $23.18 0.13 1.51 1.64 — — — $24.82 7.07% 1.72% 1.72% 0.56% $39,881 394%Year Ended July 31, 2018 $19.90 0.01 3.27 3.28 — — — $23.18 16.48% 1.66% 1.66% 0.06% $9,238 360%Year Ended July 31, 2017 $14.65 (0.01) 5.26 5.25 — — — $19.90 35.84% 1.68% 1.68% (0.03)% $15,981 211%
Service ClassSix Months EndedJanuary 31, 2022 (unaudited) $27.76 (0.17) 1.79 1.62 — (2.40) (2.40) $26.98 5.84%(d) 2.69% 2.69% (1.15)% $711 221%(d)
Year Ended July 31, 2021 $16.31 (0.33) 11.78 11.45 — — — $27.76 70.20% 2.79% 2.75% (1.38)% $675 650%Year Ended July 31, 2020 $21.11 (0.16) (4.48) (4.64) (0.16) — (0.16) $16.31 (22.20)% 2.87% 2.84% (0.87)% $443 271%Year Ended July 31, 2019 $19.91 (0.07) 1.27 1.20 — — — $21.11 5.97% 2.72% 2.72% (0.44)% $1,326 394%Year Ended July 31, 2018 $17.27 (0.18) 2.82 2.64 — — — $19.91 15.34% 2.66% 2.66% (0.94)% $811 360%Year Ended July 31, 2017 $12.83 (0.16) 4.60 4.44 — — — $17.27 34.61% 2.68% 2.68% (1.03)% $1,588 211%
(a) Per share net investment income (loss) has been calculated using the average daily shares method.(b) Annualized for periods less than one year.(c) Portfolio turnover rate is calculated without regard to instruments having a maturity of less than one year from acquisition or derivative instruments (including swap agreements and
futures contracts). The portfolio turnover rate can be high and volatile due to the amount and timing of sales and purchases of fund shares during the period. Portfolio turnover rate iscalculated on the basis of the Fund as a whole without distinguishing between classes of shares issued.
(d) Not annualized for periods less than one year.(e) The amount shown for a share outstanding throughout the period does not accord with the change in aggregate gains and losses in the portfolio of securities during the period because
of the timing of sales and purchases of fund shares in relation to fluctuating market values during the period.(f) During the year ended July 31, 2019, the ProFund received monies related to certain nonrecurring litigation settlements. The corresponding impact to the total return was an increase of 2.65%.
See accompanying notes to the financial statements.
Fin
an
cia
l Hig
hlig
hts
:: 24
9
Toppan Merrill - ProFunds Public Semi-Annual Report [Funds] 01-31-2022 ED [AUX] | akiesli | 29-Mar-22 08:44 | 22-1296-2.fc | Sequence: 8CHKSUM Content: 52238 Layout: 49437 Graphics: 0 CLEAN
JOB: 22-1296-2 CYCLE#;BL#: 8; 0 TRIM: 10.75" x 8.25" AS: New York: 212-620-5600COLORS: ~note-color 2, Black, ~note-color 3 GRAPHICS: none V1.5
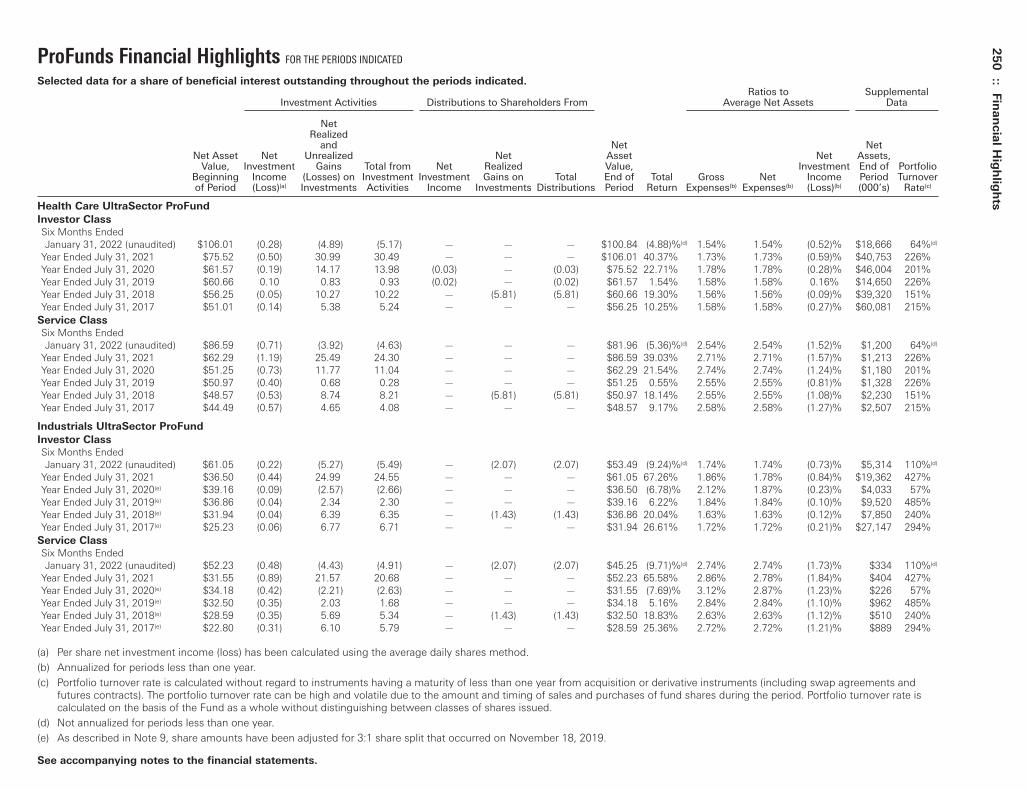
ProFunds Financial Highlights FOR THE PERIODS INDICATED
Selected data for a share of beneficial interest outstanding throughout the periods indicated.Ratios to Supplemental
Investment Activities Distributions to Shareholders From Average Net Assets Data
NetRealized
and Net NetNet Asset Net Unrealized Net Asset Net Assets,
Value, Investment Gains Total from Net Realized Value, Investment End of PortfolioBeginning Income (Losses) on Investment Investment Gains on Total End of Total Gross Net Income Period Turnoverof Period (Loss)(a) Investments Activities Income Investments Distributions Period Return Expenses(b) Expenses(b) (Loss)(b) (000’s) Rate(c)
Health Care UltraSector ProFund
Investor Class
Six Months EndedJanuary 31, 2022 (unaudited) $106.01 (0.28) (4.89) (5.17) — — — $100.84 (4.88)%(d) 1.54% 1.54% (0.52)% $18,666 64%(d)
Year Ended July 31, 2021 $75.52 (0.50) 30.99 30.49 — — — $106.01 40.37% 1.73% 1.73% (0.59)% $40,753 226%Year Ended July 31, 2020 $61.57 (0.19) 14.17 13.98 (0.03) — (0.03) $75.52 22.71% 1.78% 1.78% (0.28)% $46,004 201%Year Ended July 31, 2019 $60.66 0.10 0.83 0.93 (0.02) — (0.02) $61.57 1.54% 1.58% 1.58% 0.16% $14,650 226%Year Ended July 31, 2018 $56.25 (0.05) 10.27 10.22 — (5.81) (5.81) $60.66 19.30% 1.56% 1.56% (0.09)% $39,320 151%Year Ended July 31, 2017 $51.01 (0.14) 5.38 5.24 — — — $56.25 10.25% 1.58% 1.58% (0.27)% $60,081 215%
Service Class
Six Months EndedJanuary 31, 2022 (unaudited) $86.59 (0.71) (3.92) (4.63) — — — $81.96 (5.36)%(d) 2.54% 2.54% (1.52)% $1,200 64%(d)
Year Ended July 31, 2021 $62.29 (1.19) 25.49 24.30 — — — $86.59 39.03% 2.71% 2.71% (1.57)% $1,213 226%Year Ended July 31, 2020 $51.25 (0.73) 11.77 11.04 — — — $62.29 21.54% 2.74% 2.74% (1.24)% $1,180 201%Year Ended July 31, 2019 $50.97 (0.40) 0.68 0.28 — — — $51.25 0.55% 2.55% 2.55% (0.81)% $1,328 226%Year Ended July 31, 2018 $48.57 (0.53) 8.74 8.21 — (5.81) (5.81) $50.97 18.14% 2.55% 2.55% (1.08)% $2,230 151%Year Ended July 31, 2017 $44.49 (0.57) 4.65 4.08 — — — $48.57 9.17% 2.58% 2.58% (1.27)% $2,507 215%
Industrials UltraSector ProFund
Investor Class
Six Months EndedJanuary 31, 2022 (unaudited) $61.05 (0.22) (5.27) (5.49) — (2.07) (2.07) $53.49 (9.24)%(d) 1.74% 1.74% (0.73)% $5,314 110%(d)
Year Ended July 31, 2021 $36.50 (0.44) 24.99 24.55 — — — $61.05 67.26% 1.86% 1.78% (0.84)% $19,362 427%Year Ended July 31, 2020(e) $39.16 (0.09) (2.57) (2.66) — — — $36.50 (6.78)% 2.12% 1.87% (0.23)% $4,033 57%Year Ended July 31, 2019(e) $36.86 (0.04) 2.34 2.30 — — — $39.16 6.22% 1.84% 1.84% (0.10)% $9,520 485%Year Ended July 31, 2018(e) $31.94 (0.04) 6.39 6.35 — (1.43) (1.43) $36.86 20.04% 1.63% 1.63% (0.12)% $7,850 240%Year Ended July 31, 2017(e) $25.23 (0.06) 6.77 6.71 — — — $31.94 26.61% 1.72% 1.72% (0.21)% $27,147 294%
Service Class
Six Months EndedJanuary 31, 2022 (unaudited) $52.23 (0.48) (4.43) (4.91) — (2.07) (2.07) $45.25 (9.71)%(d) 2.74% 2.74% (1.73)% $334 110%(d)
Year Ended July 31, 2021 $31.55 (0.89) 21.57 20.68 — — — $52.23 65.58% 2.86% 2.78% (1.84)% $404 427%Year Ended July 31, 2020(e) $34.18 (0.42) (2.21) (2.63) — — — $31.55 (7.69)% 3.12% 2.87% (1.23)% $226 57%Year Ended July 31, 2019(e) $32.50 (0.35) 2.03 1.68 — — — $34.18 5.16% 2.84% 2.84% (1.10)% $962 485%Year Ended July 31, 2018(e) $28.59 (0.35) 5.69 5.34 — (1.43) (1.43) $32.50 18.83% 2.63% 2.63% (1.12)% $510 240%Year Ended July 31, 2017(e) $22.80 (0.31) 6.10 5.79 — — — $28.59 25.36% 2.72% 2.72% (1.21)% $889 294%
(a) Per share net investment income (loss) has been calculated using the average daily shares method.(b) Annualized for periods less than one year.(c) Portfolio turnover rate is calculated without regard to instruments having a maturity of less than one year from acquisition or derivative instruments (including swap agreements and
futures contracts). The portfolio turnover rate can be high and volatile due to the amount and timing of sales and purchases of fund shares during the period. Portfolio turnover rate iscalculated on the basis of the Fund as a whole without distinguishing between classes of shares issued.
(d) Not annualized for periods less than one year.(e) As described in Note 9, share amounts have been adjusted for 3:1 share split that occurred on November 18, 2019.
See accompanying notes to the financial statements.
250
:: Fin
an
cia
l Hig
hlig
hts
Toppan Merrill - ProFunds Public Semi-Annual Report [Funds] 01-31-2022 ED [AUX] | akiesli | 29-Mar-22 08:44 | 22-1296-2.fc | Sequence: 9CHKSUM Content: 46403 Layout: 49995 Graphics: 0 CLEAN
JOB: 22-1296-2 CYCLE#;BL#: 8; 0 TRIM: 10.75" x 8.25" AS: New York: 212-620-5600COLORS: ~HTML color, ~note-color 3, ~note-color 2, Black, ~HTML color 2 GRAPHICS: none V1.5
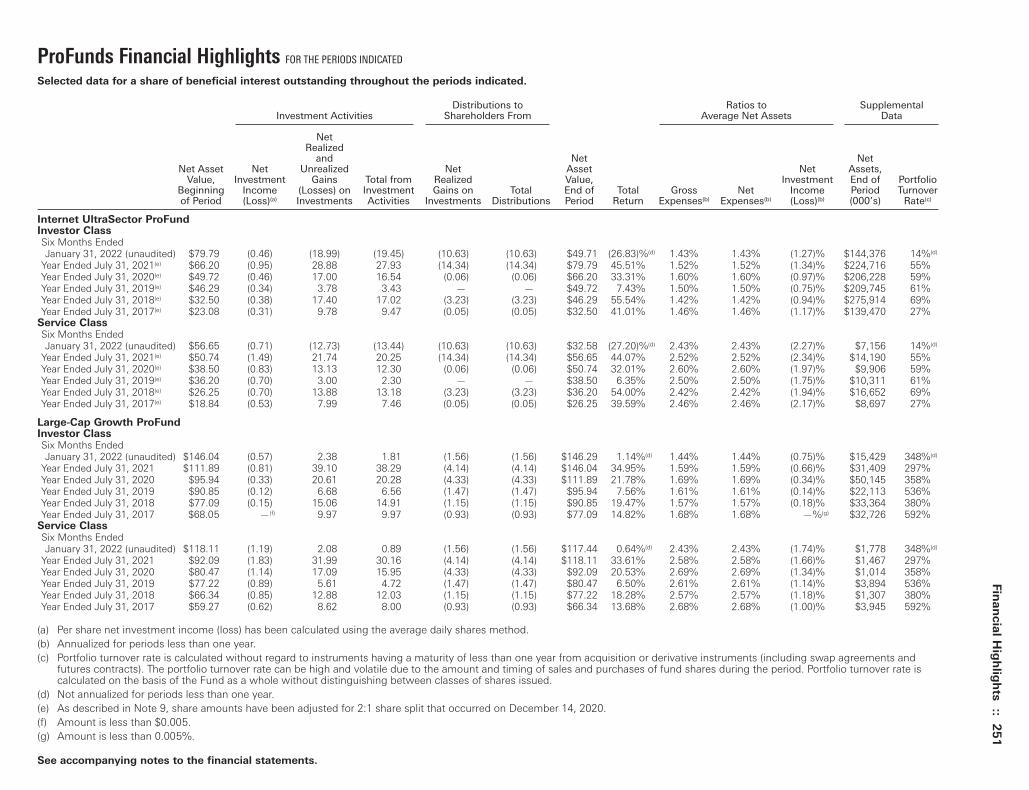
ProFunds Financial Highlights FOR THE PERIODS INDICATED
Selected data for a share of beneficial interest outstanding throughout the periods indicated.
Distributions to Ratios to SupplementalInvestment Activities Shareholders From Average Net Assets Data
NetRealized
and Net NetNet Asset Net Unrealized Net Asset Net Assets,
Value, Investment Gains Total from Realized Value, Investment End of PortfolioBeginning Income (Losses) on Investment Gains on Total End of Total Gross Net Income Period Turnoverof Period (Loss)(a) Investments Activities Investments Distributions Period Return Expenses(b) Expenses(b) (Loss)(b) (000’s) Rate(c)
Internet UltraSector ProFundInvestor ClassSix Months EndedJanuary 31, 2022 (unaudited) $79.79 (0.46) (18.99) (19.45) (10.63) (10.63) $49.71 (26.83)%(d) 1.43% 1.43% (1.27)% $144,376 14%(d)
Year Ended July 31, 2021(e) $66.20 (0.95) 28.88 27.93 (14.34) (14.34) $79.79 45.51% 1.52% 1.52% (1.34)% $224,716 55%Year Ended July 31, 2020(e) $49.72 (0.46) 17.00 16.54 (0.06) (0.06) $66.20 33.31% 1.60% 1.60% (0.97)% $206,228 59%Year Ended July 31, 2019(e) $46.29 (0.34) 3.78 3.43 — — $49.72 7.43% 1.50% 1.50% (0.75)% $209,745 61%Year Ended July 31, 2018(e) $32.50 (0.38) 17.40 17.02 (3.23) (3.23) $46.29 55.54% 1.42% 1.42% (0.94)% $275,914 69%Year Ended July 31, 2017(e) $23.08 (0.31) 9.78 9.47 (0.05) (0.05) $32.50 41.01% 1.46% 1.46% (1.17)% $139,470 27%
Service ClassSix Months EndedJanuary 31, 2022 (unaudited) $56.65 (0.71) (12.73) (13.44) (10.63) (10.63) $32.58 (27.20)%(d) 2.43% 2.43% (2.27)% $7,156 14%(d)
Year Ended July 31, 2021(e) $50.74 (1.49) 21.74 20.25 (14.34) (14.34) $56.65 44.07% 2.52% 2.52% (2.34)% $14,190 55%Year Ended July 31, 2020(e) $38.50 (0.83) 13.13 12.30 (0.06) (0.06) $50.74 32.01% 2.60% 2.60% (1.97)% $9,906 59%Year Ended July 31, 2019(e) $36.20 (0.70) 3.00 2.30 — — $38.50 6.35% 2.50% 2.50% (1.75)% $10,311 61%Year Ended July 31, 2018(e) $26.25 (0.70) 13.88 13.18 (3.23) (3.23) $36.20 54.00% 2.42% 2.42% (1.94)% $16,652 69%Year Ended July 31, 2017(e) $18.84 (0.53) 7.99 7.46 (0.05) (0.05) $26.25 39.59% 2.46% 2.46% (2.17)% $8,697 27%
Large-Cap Growth ProFundInvestor ClassSix Months EndedJanuary 31, 2022 (unaudited) $146.04 (0.57) 2.38 1.81 (1.56) (1.56) $146.29 1.14%(d) 1.44% 1.44% (0.75)% $15,429 348%(d)
Year Ended July 31, 2021 $111.89 (0.81) 39.10 38.29 (4.14) (4.14) $146.04 34.95% 1.59% 1.59% (0.66)% $31,409 297%Year Ended July 31, 2020 $95.94 (0.33) 20.61 20.28 (4.33) (4.33) $111.89 21.78% 1.69% 1.69% (0.34)% $50,145 358%Year Ended July 31, 2019 $90.85 (0.12) 6.68 6.56 (1.47) (1.47) $95.94 7.56% 1.61% 1.61% (0.14)% $22,113 536%Year Ended July 31, 2018 $77.09 (0.15) 15.06 14.91 (1.15) (1.15) $90.85 19.47% 1.57% 1.57% (0.18)% $33,364 380%Year Ended July 31, 2017 $68.05 —(f) 9.97 9.97 (0.93) (0.93) $77.09 14.82% 1.68% 1.68% —%(g) $32,726 592%
Service ClassSix Months EndedJanuary 31, 2022 (unaudited) $118.11 (1.19) 2.08 0.89 (1.56) (1.56) $117.44 0.64%(d) 2.43% 2.43% (1.74)% $1,778 348%(d)
Year Ended July 31, 2021 $92.09 (1.83) 31.99 30.16 (4.14) (4.14) $118.11 33.61% 2.58% 2.58% (1.66)% $1,467 297%Year Ended July 31, 2020 $80.47 (1.14) 17.09 15.95 (4.33) (4.33) $92.09 20.53% 2.69% 2.69% (1.34)% $1,014 358%Year Ended July 31, 2019 $77.22 (0.89) 5.61 4.72 (1.47) (1.47) $80.47 6.50% 2.61% 2.61% (1.14)% $3,894 536%Year Ended July 31, 2018 $66.34 (0.85) 12.88 12.03 (1.15) (1.15) $77.22 18.28% 2.57% 2.57% (1.18)% $1,307 380%Year Ended July 31, 2017 $59.27 (0.62) 8.62 8.00 (0.93) (0.93) $66.34 13.68% 2.68% 2.68% (1.00)% $3,945 592%
(a) Per share net investment income (loss) has been calculated using the average daily shares method.(b) Annualized for periods less than one year.(c) Portfolio turnover rate is calculated without regard to instruments having a maturity of less than one year from acquisition or derivative instruments (including swap agreements and
futures contracts). The portfolio turnover rate can be high and volatile due to the amount and timing of sales and purchases of fund shares during the period. Portfolio turnover rate iscalculated on the basis of the Fund as a whole without distinguishing between classes of shares issued.
(d) Not annualized for periods less than one year.(e) As described in Note 9, share amounts have been adjusted for 2:1 share split that occurred on December 14, 2020.(f) Amount is less than $0.005.(g) Amount is less than 0.005%.
See accompanying notes to the financial statements.
Fin
an
cia
l Hig
hlig
hts
:: 25
1
Toppan Merrill - ProFunds Public Semi-Annual Report [Funds] 01-31-2022 ED [AUX] | akiesli | 29-Mar-22 08:44 | 22-1296-2.fc | Sequence: 10CHKSUM Content: 21858 Layout: 38583 Graphics: 0 CLEAN
JOB: 22-1296-2 CYCLE#;BL#: 8; 0 TRIM: 10.75" x 8.25" AS: New York: 212-620-5600COLORS: ~note-color 2, Black, ~note-color 3 GRAPHICS: none V1.5
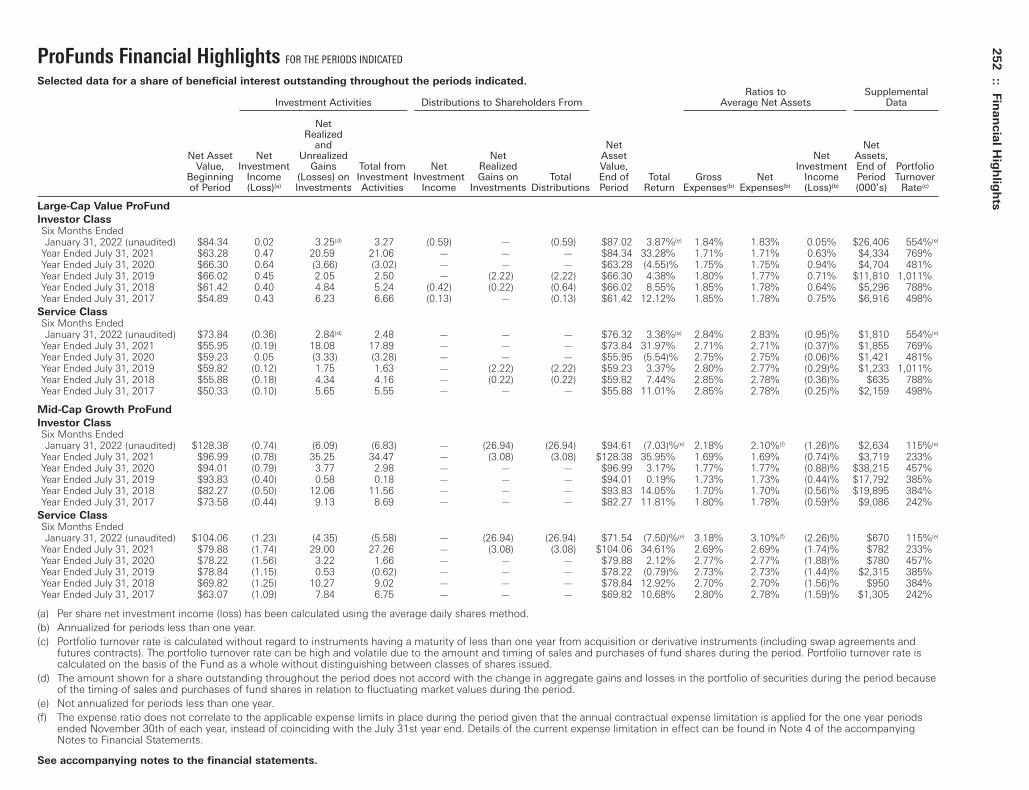
ProFunds Financial Highlights FOR THE PERIODS INDICATED
Selected data for a share of beneficial interest outstanding throughout the periods indicated.Ratios to Supplemental
Investment Activities Distributions to Shareholders From Average Net Assets Data
NetRealized
and Net NetNet Asset Net Unrealized Net Asset Net Assets,
Value, Investment Gains Total from Net Realized Value, Investment End of PortfolioBeginning Income (Losses) on Investment Investment Gains on Total End of Total Gross Net Income Period Turnoverof Period (Loss)(a) Investments Activities Income Investments Distributions Period Return Expenses(b) Expenses(b) (Loss)(b) (000’s) Rate(c)
Large-Cap Value ProFund
Investor ClassSix Months EndedJanuary 31, 2022 (unaudited) $84.34 0.02 3.25(d) 3.27 (0.59) — (0.59) $87.02 3.87%(e) 1.84% 1.83% 0.05% $26,406 554%(e)
Year Ended July 31, 2021 $63.28 0.47 20.59 21.06 — — — $84.34 33.28% 1.71% 1.71% 0.63% $4,334 769%Year Ended July 31, 2020 $66.30 0.64 (3.66) (3.02) — — — $63.28 (4.55)% 1.75% 1.75% 0.94% $4,704 481%Year Ended July 31, 2019 $66.02 0.45 2.05 2.50 — (2.22) (2.22) $66.30 4.38% 1.80% 1.77% 0.71% $11,810 1,011%Year Ended July 31, 2018 $61.42 0.40 4.84 5.24 (0.42) (0.22) (0.64) $66.02 8.55% 1.85% 1.78% 0.64% $5,296 788%Year Ended July 31, 2017 $54.89 0.43 6.23 6.66 (0.13) — (0.13) $61.42 12.12% 1.85% 1.78% 0.75% $6,916 498%
Service ClassSix Months EndedJanuary 31, 2022 (unaudited) $73.84 (0.36) 2.84(d) 2.48 — — — $76.32 3.36%(e) 2.84% 2.83% (0.95)% $1,810 554%(e)
Year Ended July 31, 2021 $55.95 (0.19) 18.08 17.89 — — — $73.84 31.97% 2.71% 2.71% (0.37)% $1,855 769%Year Ended July 31, 2020 $59.23 0.05 (3.33) (3.28) — — — $55.95 (5.54)% 2.75% 2.75% (0.06)% $1,421 481%Year Ended July 31, 2019 $59.82 (0.12) 1.75 1.63 — (2.22) (2.22) $59.23 3.37% 2.80% 2.77% (0.29)% $1,233 1,011%Year Ended July 31, 2018 $55.88 (0.18) 4.34 4.16 — (0.22) (0.22) $59.82 7.44% 2.85% 2.78% (0.36)% $635 788%Year Ended July 31, 2017 $50.33 (0.10) 5.65 5.55 — — — $55.88 11.01% 2.85% 2.78% (0.25)% $2,159 498%
Mid-Cap Growth ProFund
Investor ClassSix Months EndedJanuary 31, 2022 (unaudited) $128.38 (0.74) (6.09) (6.83) — (26.94) (26.94) $94.61 (7.03)%(e) 2.18% 2.10%(f) (1.26)% $2,634 115%(e)
Year Ended July 31, 2021 $96.99 (0.78) 35.25 34.47 — (3.08) (3.08) $128.38 35.95% 1.69% 1.69% (0.74)% $3,719 233%Year Ended July 31, 2020 $94.01 (0.79) 3.77 2.98 — — — $96.99 3.17% 1.77% 1.77% (0.88)% $38,215 457%Year Ended July 31, 2019 $93.83 (0.40) 0.58 0.18 — — — $94.01 0.19% 1.73% 1.73% (0.44)% $17,792 385%Year Ended July 31, 2018 $82.27 (0.50) 12.06 11.56 — — — $93.83 14.05% 1.70% 1.70% (0.56)% $19,895 384%Year Ended July 31, 2017 $73.58 (0.44) 9.13 8.69 — — — $82.27 11.81% 1.80% 1.78% (0.59)% $9,086 242%
Service ClassSix Months EndedJanuary 31, 2022 (unaudited) $104.06 (1.23) (4.35) (5.58) — (26.94) (26.94) $71.54 (7.50)%(e) 3.18% 3.10%(f) (2.26)% $670 115%(e)
Year Ended July 31, 2021 $79.88 (1.74) 29.00 27.26 — (3.08) (3.08) $104.06 34.61% 2.69% 2.69% (1.74)% $782 233%Year Ended July 31, 2020 $78.22 (1.56) 3.22 1.66 — — — $79.88 2.12% 2.77% 2.77% (1.88)% $780 457%Year Ended July 31, 2019 $78.84 (1.15) 0.53 (0.62) — — — $78.22 (0.79)% 2.73% 2.73% (1.44)% $2,315 385%Year Ended July 31, 2018 $69.82 (1.25) 10.27 9.02 — — — $78.84 12.92% 2.70% 2.70% (1.56)% $950 384%Year Ended July 31, 2017 $63.07 (1.09) 7.84 6.75 — — — $69.82 10.68% 2.80% 2.78% (1.59)% $1,305 242%
(a) Per share net investment income (loss) has been calculated using the average daily shares method.(b) Annualized for periods less than one year.(c) Portfolio turnover rate is calculated without regard to instruments having a maturity of less than one year from acquisition or derivative instruments (including swap agreements and
futures contracts). The portfolio turnover rate can be high and volatile due to the amount and timing of sales and purchases of fund shares during the period. Portfolio turnover rate iscalculated on the basis of the Fund as a whole without distinguishing between classes of shares issued.
(d) The amount shown for a share outstanding throughout the period does not accord with the change in aggregate gains and losses in the portfolio of securities during the period becauseof the timing of sales and purchases of fund shares in relation to fluctuating market values during the period.
(e) Not annualized for periods less than one year.(f) The expense ratio does not correlate to the applicable expense limits in place during the period given that the annual contractual expense limitation is applied for the one year periods
ended November 30th of each year, instead of coinciding with the July 31st year end. Details of the current expense limitation in effect can be found in Note 4 of the accompanyingNotes to Financial Statements.
See accompanying notes to the financial statements.
252
:: Fin
an
cia
l Hig
hlig
hts
Toppan Merrill - ProFunds Public Semi-Annual Report [Funds] 01-31-2022 ED [AUX] | akiesli | 29-Mar-22 08:44 | 22-1296-2.fc | Sequence: 11CHKSUM Content: 3832 Layout: 63462 Graphics: 0 CLEAN
JOB: 22-1296-2 CYCLE#;BL#: 8; 0 TRIM: 10.75" x 8.25" AS: New York: 212-620-5600COLORS: ~note-color 2, Black, ~note-color 3 GRAPHICS: none V1.5

ProFunds Financial Highlights FOR THE PERIODS INDICATED
Selected data for a share of beneficial interest outstanding throughout the periods indicated.
Ratios to SupplementalInvestment Activities Distributions to Shareholders From Average Net Assets Data
Net Realized
and Net Net Net Asset Net Unrealized Net Asset Net Assets,
Value, Investment Gains Total from Net Realized Value, Investment End of PortfolioBeginning Income (Losses) on Investment Investment Gains on Total End of Total Gross Net Income Period Turnoverof Period (Loss)(a) Investments Activities Income Investments Distributions Period Return Expenses(b) Expenses(b) (Loss)(b) (000’s) Rate(c)
Mid-Cap ProFundInvestor ClassSix Months EndedJanuary 31, 2022 (unaudited) $112.82 (0.46) (2.72) (3.18) — (2.51) (2.51) $107.13 (2.93)%(d) 1.89% 1.85% (0.82)% $6,103 9%(d)
Year Ended July 31, 2021 $78.62 (1.05) 35.48 34.43 — (0.23) (0.23) $112.82 43.91% 1.83% 1.83% (1.06)% $6,198 107%Year Ended July 31, 2020 $87.39 (0.41) (4.01) (4.42) (0.08) (4.27) (4.35) $78.62 (5.52)% 1.97% 1.97%(e) (0.52)% $4,207 238%Year Ended July 31, 2019 $91.18 0.02 (1.59) (1.57) (0.05) (2.17) (2.22) $87.39 (1.25)% 1.67% 1.67% 0.03% $7,025 43%Year Ended July 31, 2018 $87.31 (0.20) 10.73 10.53 — (6.66) (6.66) $91.18 12.38% 1.54% 1.54% (0.23)% $19,933 21%Year Ended July 31, 2017 $77.58 (0.42) 10.15 9.73 — — — $87.31 12.54% 1.57% 1.57% (0.51)% $47,686 603%
Service ClassSix Months EndedJanuary 31, 2022 (unaudited) $90.61 (0.92) (2.04) (2.96) — (2.51) (2.51) $85.14 (3.42)%(d) 2.89% 2.85% (1.82)% $776 9%(d)
Year Ended July 31, 2021 $63.84 (1.86) 28.86 27.00 — (0.23) (0.23) $90.61 42.47% 2.83% 2.83% (2.06)% $816 107%Year Ended July 31, 2020 $72.34 (1.07) (3.16) (4.23) — (4.27) (4.27) $63.84 (6.45)% 2.97% 2.97%(e) (1.52)% $556 238%Year Ended July 31, 2019 $76.62 (0.69) (1.42) (2.11) — (2.17) (2.17) $72.34 (2.23)% 2.67% 2.67% (0.97)% $2,655 43%Year Ended July 31, 2018 $75.06 (0.96) 9.18 8.22 — (6.66) (6.66) $76.62 11.26% 2.54% 2.54% (1.23)% $783 21%Year Ended July 31, 2017 $67.36 (1.13) 8.83 7.70 — — — $75.06 11.41% 2.57% 2.57% (1.51)% $952 603%
Mid-Cap Value ProFundInvestor ClassSix Months EndedJanuary 31, 2022 (unaudited) $95.91 0.10 1.20 1.30 — (0.89) (0.89) $96.32 1.33%(d) 1.87% 1.78% 0.21% $3,345 187%(d)
Year Ended July 31, 2021 $62.48 0.10 33.50 33.60 (0.17) — (0.17) $95.91 53.86% 1.86% 1.78% 0.13% $4,856 772%Year Ended July 31, 2020 $73.65 0.20 (11.06) (10.86) (0.31)(f) — (0.31) $62.48 (14.82)%(g) 2.10% 1.78% 0.29% $4,189 322%Year Ended July 31, 2019 $78.08 0.08 (2.04) (1.96) (0.11) (2.36) (2.47) $73.65 (1.94)% 1.78% 1.78% 0.11% $5,554 708%Year Ended July 31, 2018 $78.19 (0.11) 8.25 8.14 — (8.25) (8.25) $78.08 10.85% 1.94% 1.78% (0.15)% $7,731 312%Year Ended July 31, 2017 $69.63 (0.01) 8.99 8.98 (0.18) (0.24) (0.42) $78.19 12.90% 1.85% 1.78% (0.01)% $7,609 281%
Service ClassSix Months EndedJanuary 31, 2022 (unaudited) $77.37 (0.30) 0.96 0.66 — (0.89) (0.89) $77.14 0.82%(d) 2.87% 2.78% (0.79)% $668 187%(d)
Year Ended July 31, 2021 $50.79 (0.57) 27.15 26.58 — — — $77.37 52.35% 2.86% 2.78% (0.87)% $649 772%Year Ended July 31, 2020 $60.23 (0.36) (9.08) (9.44) — — — $50.79 (15.67)%(g) 3.10% 2.78% (0.71)% $417 322%Year Ended July 31, 2019 $64.88 (0.52) (1.77) (2.29) — (2.36) (2.36) $60.23 (2.89)% 2.78% 2.78% (0.89)% $587 708%Year Ended July 31, 2018 $66.90 (0.76) 6.99 6.23 — (8.25) (8.25) $64.88 9.73% 2.94% 2.78% (1.15)% $562 312%Year Ended July 31, 2017 $60.06 (0.64) 7.72 7.08 — (0.24) (0.24) $66.90 11.78% 2.85% 2.78% (1.01)% $626 281%
(a) Per share net investment income (loss) has been calculated using the average daily shares method.(b) Annualized for periods less than one year.(c) Portfolio turnover rate is calculated without regard to instruments having a maturity of less than one year from acquisition or derivative instruments (including swap agreements and
futures contracts). The portfolio turnover rate can be high and volatile due to the amount and timing of sales and purchases of fund shares during the period. Portfolio turnover rate iscalculated on the basis of the Fund as a whole without distinguishing between classes of shares issued.
(d) Not annualized for periods less than one year.(e) The expense ratio does not correlate to the applicable expense limits in place during the period given that the annual contractual expense limitation is applied for the one year periods
ended November 30th of each year, instead of coinciding with the July 31st year end. Details of the current expense limitation in effect can be found in Note 4 of the accompanyingNotes to Financial Statements.
(f) Subsequent to the issuance of the July 31, 2020 financial statements, $0.05 of the distribution was determined to be a return of capital.(g) During the year ended July 31, 2020, the ProFund received monies related to certain nonrecurring litigation settlements. The corresponding impact to the total return was 0.22%.
See accompanying notes to the financial statements.
Fin
an
cia
l Hig
hlig
hts
:: 25
3
Toppan Merrill - ProFunds Public Semi-Annual Report [Funds] 01-31-2022 ED [AUX] | akiesli | 29-Mar-22 08:44 | 22-1296-2.fc | Sequence: 12CHKSUM Content: 24717 Layout: 29528 Graphics: 0 CLEAN
JOB: 22-1296-2 CYCLE#;BL#: 8; 0 TRIM: 10.75" x 8.25" AS: New York: 212-620-5600COLORS: ~note-color 2, Black, ~note-color 3 GRAPHICS: none V1.5

ProFunds Financial Highlights FOR THE PERIODS INDICATED
Selected data for a share of beneficial interest outstanding throughout the periods indicated.
Ratios to SupplementalInvestment Activities Distributions to Shareholders From Average Net Assets Data
Net Realized
and Net Net Net Asset Net Unrealized Net Asset Net Assets,
Value, Investment Gains Total from Net Realized Value, Investment End of PortfolioBeginning Income (Losses) on Investment Investment Gains on Total End of Total Gross Net Income Period Turnoverof Period (Loss)(a) Investments Activities Income Investments Distributions Period Return Expenses(b) Expenses(b) (Loss)(b) (000’s) Rate(c)
Nasdaq-100 ProFund
Investor Class
Six Months EndedJanuary 31, 2022 (unaudited) $139.20 (0.74) (0.39)(d) (1.13) — (3.69) (3.69) $134.38 (1.04)%(e) 1.41% 1.41% (1.04)% $70,773 189%(e)
Year Ended July 31, 2021 $104.21 (1.20) 37.52 36.32 — (1.33) (1.33) $139.20 35.07% 1.48% 1.48% (1.01)% $153,313 440%Year Ended July 31, 2020 $76.83 (0.54) 28.66 28.12 — (0.74) (0.74) $104.21 36.83% 1.56% 1.56% (0.65)% $108,633 39%Year Ended July 31, 2019 $71.37 0.02 5.44 5.46 — — — $76.83 7.65% 1.52% 1.52% 0.03% $101,799 15%Year Ended July 31, 2018 $58.96 (0.19) 13.07 12.88 — (0.47) (0.47) $71.37 21.94% 1.44% 1.44% (0.30)% $83,056 3%Year Ended July 31, 2017 $47.81 (0.33) 11.48 11.15 — — — $58.96 23.32% 1.49% 1.49% (0.64)% $99,069 4%
Service Class
Six Months EndedJanuary 31, 2022 (unaudited) $111.10 (1.32) (0.06)(d) (1.38) — (3.69) (3.69) $106.03 (1.54)%(e) 2.41% 2.41% (2.04)% $7,236 189%(e)
Year Ended July 31, 2021 $84.23 (2.15) 30.35 28.20 — (1.33) (1.33) $111.10 33.74% 2.48% 2.48% (2.01)% $7,473 440%Year Ended July 31, 2020 $62.84 (1.22) 23.35 22.13 — (0.74) (0.74) $84.23 35.48% 2.55% 2.55% (1.64)% $8,412 39%Year Ended July 31, 2019 $58.96 (0.56) 4.44 3.88 — — — $62.84 6.58% 2.51% 2.51% (0.96)% $5,884 15%Year Ended July 31, 2018 $49.27 (0.74) 10.90 10.16 — (0.47) (0.47) $58.96 20.75% 2.44% 2.44% (1.30)% $8,137 3%Year Ended July 31, 2017 $40.36 (0.78) 9.69 8.91 — — — $49.27 22.05% 2.49% 2.49% (1.64)% $5,022 4%
Oil & Gas UltraSector ProFund
Investor Class
Six Months EndedJanuary 31, 2022 (unaudited) $19.35 0.21 10.19 10.40 (0.37) — (0.37) $29.38 54.25%(e) 1.53% 1.53% 1.82% $38,085 55%(e)
Year Ended July 31, 2021 $11.97 0.23 7.38 7.61 (0.23) — (0.23) $19.35 64.47% 1.64% 1.64% 1.36% $29,753 239%Year Ended July 31, 2020 $29.28 0.29 (17.22) (16.93) (0.38) — (0.38) $11.97 (58.57)% 1.87% 1.87% 1.61% $11,544 40%Year Ended July 31, 2019 $42.24 0.37 (12.87) (12.50) (0.46) — (0.46) $29.28 (29.45)% 1.74% 1.74% 1.11% $13,402 53%Year Ended July 31, 2018 $33.39 0.29 8.88 9.17 (0.32) — (0.32) $42.24 27.56% 1.56% 1.56% 0.78% $43,157 152%Year Ended July 31, 2017 $35.19 0.28 (1.85) (1.57) (0.23) — (0.23) $33.39 (4.58)% 1.60% 1.60% 0.79% $20,228 110%
Service Class
Six Months EndedJanuary 31, 2022 (unaudited) $16.49 0.11 8.67 8.78 (0.17) — (0.17) $25.10 53.45%(e) 2.53% 2.53% 0.82% $1,640 55%(e)
Year Ended July 31, 2021 $10.27 0.09 6.27 6.36 (0.14) — (0.14) $16.49 62.71% 2.64% 2.64% 0.36% $1,395 239%Year Ended July 31, 2020 $25.07 0.14 (14.88) (14.74) (0.06) — (0.06) $10.27 (58.92)% 2.87% 2.87% 0.61% $626 40%Year Ended July 31, 2019 $36.03 0.08 (10.96) (10.88) (0.08) — (0.08) $25.07 (30.16)% 2.74% 2.74% 0.11% $730 53%Year Ended July 31, 2018 $28.53 (0.02) 7.52 7.50 — — — $36.03 26.29% 2.56% 2.56% (0.22)% $1,651 152%Year Ended July 31, 2017 $30.19 (0.03) (1.63) (1.66) — — — $28.53 (5.50)% 2.60% 2.60% (0.21)% $1,929 110%
(a) Per share net investment income (loss) has been calculated using the average daily shares method.(b) Annualized for periods less than one year.(c) Portfolio turnover rate is calculated without regard to instruments having a maturity of less than one year from acquisition or derivative instruments (including swap agreements and
futures contracts). The portfolio turnover rate can be high and volatile due to the amount and timing of sales and purchases of fund shares during the period. Portfolio turnover rate iscalculated on the basis of the Fund as a whole without distinguishing between classes of shares issued.
(d) The amount shown for a share outstanding throughout the period does not accord with the change in aggregate gains and losses in the portfolio of securities during the period becauseof the timing of sales and purchases of fund shares in relation to fluctuating market values during the period.
(e) Not annualized for periods less than one year.
See accompanying notes to the financial statements.
254
:: Fin
an
cia
l Hig
hlig
hts
Toppan Merrill - ProFunds Public Semi-Annual Report [Funds] 01-31-2022 ED [AUX] | akiesli | 29-Mar-22 08:44 | 22-1296-2.fc | Sequence: 13CHKSUM Content: 25278 Layout: 50039 Graphics: 0 CLEAN
JOB: 22-1296-2 CYCLE#;BL#: 8; 0 TRIM: 10.75" x 8.25" AS: New York: 212-620-5600COLORS: ~note-color 2, Black, ~note-color 3 GRAPHICS: none V1.5
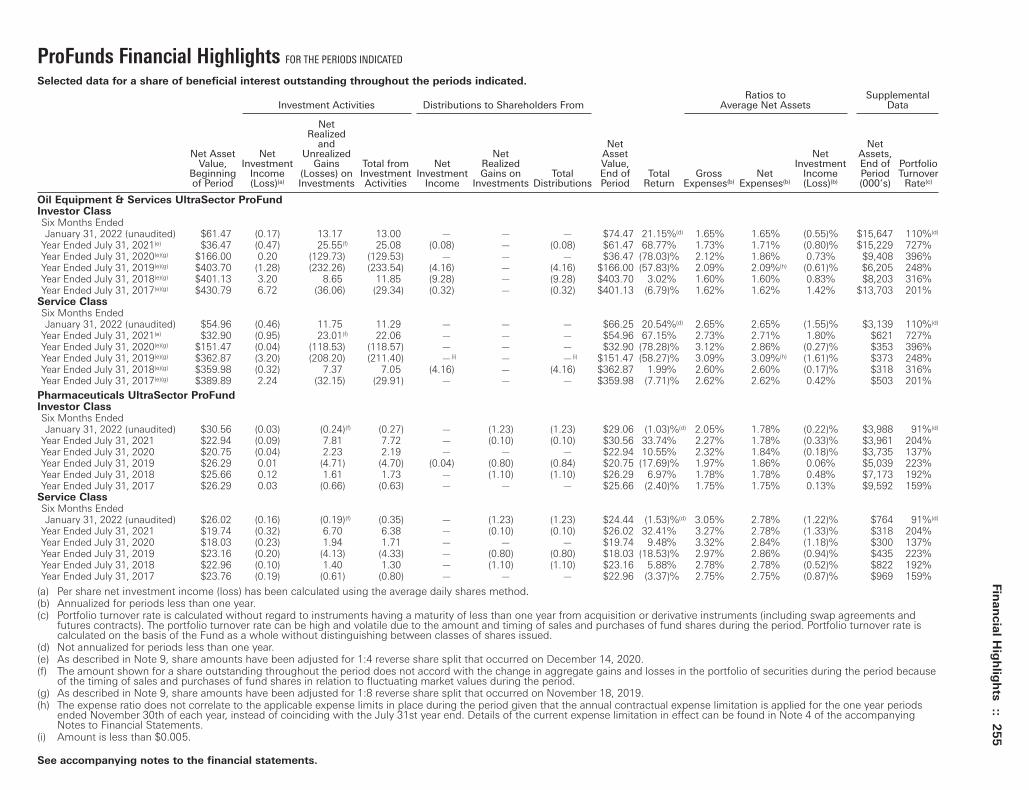
ProFunds Financial Highlights FOR THE PERIODS INDICATED
Selected data for a share of beneficial interest outstanding throughout the periods indicated.
Ratios to SupplementalInvestment Activities Distributions to Shareholders From Average Net Assets Data
Net Realized
and Net Net Net Asset Net Unrealized Net Asset Net Assets,
Value, Investment Gains Total from Net Realized Value, Investment End of PortfolioBeginning Income (Losses) on Investment Investment Gains on Total End of Total Gross Net Income Period Turnoverof Period (Loss)(a) Investments Activities Income Investments Distributions Period Return Expenses(b) Expenses(b) (Loss)(b) (000’s) Rate(c)
Oil Equipment & Services UltraSector ProFundInvestor ClassSix Months EndedJanuary 31, 2022 (unaudited) $61.47 (0.17) 13.17 13.00 — — — $74.47 21.15%(d) 1.65% 1.65% (0.55)% $15,647 110%(d)
Year Ended July 31, 2021(e) $36.47 (0.47) 25.55(f) 25.08 (0.08) — (0.08) $61.47 68.77% 1.73% 1.71% (0.80)% $15,229 727%Year Ended July 31, 2020(e)(g) $166.00 0.20 (129.73) (129.53) — — — $36.47 (78.03)% 2.12% 1.86% 0.73% $9,408 396%Year Ended July 31, 2019(e)(g) $403.70 (1.28) (232.26) (233.54) (4.16) — (4.16) $166.00 (57.83)% 2.09% 2.09%(h) (0.61)% $6,205 248%Year Ended July 31, 2018(e)(g) $401.13 3.20 8.65 11.85 (9.28) — (9.28) $403.70 3.02% 1.60% 1.60% 0.83% $8,203 316%Year Ended July 31, 2017(e)(g) $430.79 6.72 (36.06) (29.34) (0.32) — (0.32) $401.13 (6.79)% 1.62% 1.62% 1.42% $13,703 201%
Service ClassSix Months EndedJanuary 31, 2022 (unaudited) $54.96 (0.46) 11.75 11.29 — — — $66.25 20.54%(d) 2.65% 2.65% (1.55)% $3,139 110%(d)
Year Ended July 31, 2021(e) $32.90 (0.95) 23.01(f) 22.06 — — — $54.96 67.15% 2.73% 2.71% 1.80% $621 727%Year Ended July 31, 2020(e)(g) $151.47 (0.04) (118.53) (118.57) — — — $32.90 (78.28)% 3.12% 2.86% (0.27)% $353 396%Year Ended July 31, 2019(e)(g) $362.87 (3.20) (208.20) (211.40) —(i) — —(i) $151.47 (58.27)% 3.09% 3.09%(h) (1.61)% $373 248%Year Ended July 31, 2018(e)(g) $359.98 (0.32) 7.37 7.05 (4.16) — (4.16) $362.87 1.99% 2.60% 2.60% (0.17)% $318 316%Year Ended July 31, 2017(e)(g) $389.89 2.24 (32.15) (29.91) — — — $359.98 (7.71)% 2.62% 2.62% 0.42% $503 201%
Pharmaceuticals UltraSector ProFundInvestor ClassSix Months EndedJanuary 31, 2022 (unaudited) $30.56 (0.03) (0.24)(f) (0.27) — (1.23) (1.23) $29.06 (1.03)%(d) 2.05% 1.78% (0.22)% $3,988 91%(d)
Year Ended July 31, 2021 $22.94 (0.09) 7.81 7.72 — (0.10) (0.10) $30.56 33.74% 2.27% 1.78% (0.33)% $3,961 204%Year Ended July 31, 2020 $20.75 (0.04) 2.23 2.19 — — — $22.94 10.55% 2.32% 1.84% (0.18)% $3,735 137%Year Ended July 31, 2019 $26.29 0.01 (4.71) (4.70) (0.04) (0.80) (0.84) $20.75 (17.69)% 1.97% 1.86% 0.06% $5,039 223%Year Ended July 31, 2018 $25.66 0.12 1.61 1.73 — (1.10) (1.10) $26.29 6.97% 1.78% 1.78% 0.48% $7,173 192%Year Ended July 31, 2017 $26.29 0.03 (0.66) (0.63) — — — $25.66 (2.40)% 1.75% 1.75% 0.13% $9,592 159%
Service ClassSix Months EndedJanuary 31, 2022 (unaudited) $26.02 (0.16) (0.19)(f) (0.35) — (1.23) (1.23) $24.44 (1.53)%(d) 3.05% 2.78% (1.22)% $764 91%(d)
Year Ended July 31, 2021 $19.74 (0.32) 6.70 6.38 — (0.10) (0.10) $26.02 32.41% 3.27% 2.78% (1.33)% $318 204%Year Ended July 31, 2020 $18.03 (0.23) 1.94 1.71 — — — $19.74 9.48% 3.32% 2.84% (1.18)% $300 137%Year Ended July 31, 2019 $23.16 (0.20) (4.13) (4.33) — (0.80) (0.80) $18.03 (18.53)% 2.97% 2.86% (0.94)% $435 223%Year Ended July 31, 2018 $22.96 (0.10) 1.40 1.30 — (1.10) (1.10) $23.16 5.88% 2.78% 2.78% (0.52)% $822 192%Year Ended July 31, 2017 $23.76 (0.19) (0.61) (0.80) — — — $22.96 (3.37)% 2.75% 2.75% (0.87)% $969 159%
(a) Per share net investment income (loss) has been calculated using the average daily shares method.(b) Annualized for periods less than one year.(c) Portfolio turnover rate is calculated without regard to instruments having a maturity of less than one year from acquisition or derivative instruments (including swap agreements and
futures contracts). The portfolio turnover rate can be high and volatile due to the amount and timing of sales and purchases of fund shares during the period. Portfolio turnover rate iscalculated on the basis of the Fund as a whole without distinguishing between classes of shares issued.
(d) Not annualized for periods less than one year.(e) As described in Note 9, share amounts have been adjusted for 1:4 reverse share split that occurred on December 14, 2020.(f) The amount shown for a share outstanding throughout the period does not accord with the change in aggregate gains and losses in the portfolio of securities during the period because
of the timing of sales and purchases of fund shares in relation to fluctuating market values during the period.(g) As described in Note 9, share amounts have been adjusted for 1:8 reverse share split that occurred on November 18, 2019.(h) The expense ratio does not correlate to the applicable expense limits in place during the period given that the annual contractual expense limitation is applied for the one year periods
ended November 30th of each year, instead of coinciding with the July 31st year end. Details of the current expense limitation in effect can be found in Note 4 of the accompanyingNotes to Financial Statements.
(i) Amount is less than $0.005.
See accompanying notes to the financial statements.
Fin
an
cia
l Hig
hlig
hts
:: 25
5
Toppan Merrill - ProFunds Public Semi-Annual Report [Funds] 01-31-2022 ED [AUX] | akiesli | 29-Mar-22 08:44 | 22-1296-2.fc | Sequence: 14CHKSUM Content: 28768 Layout: 40311 Graphics: 0 CLEAN
JOB: 22-1296-2 CYCLE#;BL#: 8; 0 TRIM: 10.75" x 8.25" AS: New York: 212-620-5600COLORS: ~note-color 2, Black, ~note-color 3 GRAPHICS: none V1.5
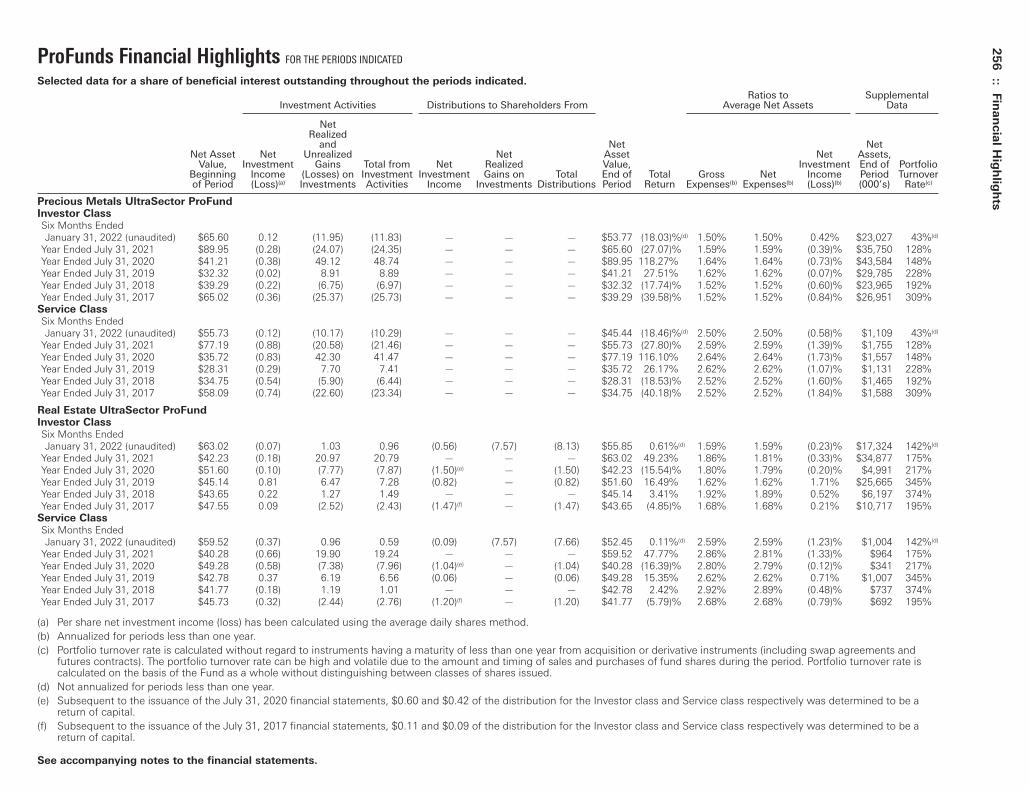
ProFunds Financial Highlights FOR THE PERIODS INDICATED
Selected data for a share of beneficial interest outstanding throughout the periods indicated.
Ratios to SupplementalInvestment Activities Distributions to Shareholders From Average Net Assets Data
Net Realized
and Net Net Net Asset Net Unrealized Net Asset Net Assets,
Value, Investment Gains Total from Net Realized Value, Investment End of PortfolioBeginning Income (Losses) on Investment Investment Gains on Total End of Total Gross Net Income Period Turnoverof Period (Loss)(a) Investments Activities Income Investments Distributions Period Return Expenses(b) Expenses(b) (Loss)(b) (000’s) Rate(c)
Precious Metals UltraSector ProFundInvestor ClassSix Months EndedJanuary 31, 2022 (unaudited) $65.60 0.12 (11.95) (11.83) — — — $53.77 (18.03)%(d) 1.50% 1.50% 0.42% $23,027 43%(d)
Year Ended July 31, 2021 $89.95 (0.28) (24.07) (24.35) — — — $65.60 (27.07)% 1.59% 1.59% (0.39)% $35,750 128%Year Ended July 31, 2020 $41.21 (0.38) 49.12 48.74 — — — $89.95 118.27% 1.64% 1.64% (0.73)% $43,584 148%Year Ended July 31, 2019 $32.32 (0.02) 8.91 8.89 — — — $41.21 27.51% 1.62% 1.62% (0.07)% $29,785 228%Year Ended July 31, 2018 $39.29 (0.22) (6.75) (6.97) — — — $32.32 (17.74)% 1.52% 1.52% (0.60)% $23,965 192%Year Ended July 31, 2017 $65.02 (0.36) (25.37) (25.73) — — — $39.29 (39.58)% 1.52% 1.52% (0.84)% $26,951 309%
Service ClassSix Months EndedJanuary 31, 2022 (unaudited) $55.73 (0.12) (10.17) (10.29) — — — $45.44 (18.46)%(d) 2.50% 2.50% (0.58)% $1,109 43%(d)
Year Ended July 31, 2021 $77.19 (0.88) (20.58) (21.46) — — — $55.73 (27.80)% 2.59% 2.59% (1.39)% $1,755 128%Year Ended July 31, 2020 $35.72 (0.83) 42.30 41.47 — — — $77.19 116.10% 2.64% 2.64% (1.73)% $1,557 148%Year Ended July 31, 2019 $28.31 (0.29) 7.70 7.41 — — — $35.72 26.17% 2.62% 2.62% (1.07)% $1,131 228%Year Ended July 31, 2018 $34.75 (0.54) (5.90) (6.44) — — — $28.31 (18.53)% 2.52% 2.52% (1.60)% $1,465 192%Year Ended July 31, 2017 $58.09 (0.74) (22.60) (23.34) — — — $34.75 (40.18)% 2.52% 2.52% (1.84)% $1,588 309%
Real Estate UltraSector ProFundInvestor ClassSix Months EndedJanuary 31, 2022 (unaudited) $63.02 (0.07) 1.03 0.96 (0.56) (7.57) (8.13) $55.85 0.61%(d) 1.59% 1.59% (0.23)% $17,324 142%(d)
Year Ended July 31, 2021 $42.23 (0.18) 20.97 20.79 — — — $63.02 49.23% 1.86% 1.81% (0.33)% $34,877 175%Year Ended July 31, 2020 $51.60 (0.10) (7.77) (7.87) (1.50)(e) — (1.50) $42.23 (15.54)% 1.80% 1.79% (0.20)% $4,991 217%Year Ended July 31, 2019 $45.14 0.81 6.47 7.28 (0.82) — (0.82) $51.60 16.49% 1.62% 1.62% 1.71% $25,665 345%Year Ended July 31, 2018 $43.65 0.22 1.27 1.49 — — — $45.14 3.41% 1.92% 1.89% 0.52% $6,197 374%Year Ended July 31, 2017 $47.55 0.09 (2.52) (2.43) (1.47)(f) — (1.47) $43.65 (4.85)% 1.68% 1.68% 0.21% $10,717 195%
Service ClassSix Months EndedJanuary 31, 2022 (unaudited) $59.52 (0.37) 0.96 0.59 (0.09) (7.57) (7.66) $52.45 0.11%(d) 2.59% 2.59% (1.23)% $1,004 142%(d)
Year Ended July 31, 2021 $40.28 (0.66) 19.90 19.24 — — — $59.52 47.77% 2.86% 2.81% (1.33)% $964 175%Year Ended July 31, 2020 $49.28 (0.58) (7.38) (7.96) (1.04)(e) — (1.04) $40.28 (16.39)% 2.80% 2.79% (0.12)% $341 217%Year Ended July 31, 2019 $42.78 0.37 6.19 6.56 (0.06) — (0.06) $49.28 15.35% 2.62% 2.62% 0.71% $1,007 345%Year Ended July 31, 2018 $41.77 (0.18) 1.19 1.01 — — — $42.78 2.42% 2.92% 2.89% (0.48)% $737 374%Year Ended July 31, 2017 $45.73 (0.32) (2.44) (2.76) (1.20)(f) — (1.20) $41.77 (5.79)% 2.68% 2.68% (0.79)% $692 195%
(a) Per share net investment income (loss) has been calculated using the average daily shares method.(b) Annualized for periods less than one year.(c) Portfolio turnover rate is calculated without regard to instruments having a maturity of less than one year from acquisition or derivative instruments (including swap agreements and
futures contracts). The portfolio turnover rate can be high and volatile due to the amount and timing of sales and purchases of fund shares during the period. Portfolio turnover rate iscalculated on the basis of the Fund as a whole without distinguishing between classes of shares issued.
(d) Not annualized for periods less than one year.(e) Subsequent to the issuance of the July 31, 2020 financial statements, $0.60 and $0.42 of the distribution for the Investor class and Service class respectively was determined to be a
return of capital.(f) Subsequent to the issuance of the July 31, 2017 financial statements, $0.11 and $0.09 of the distribution for the Investor class and Service class respectively was determined to be a
return of capital.
See accompanying notes to the financial statements.
256
:: Fin
an
cia
l Hig
hlig
hts
Toppan Merrill - ProFunds Public Semi-Annual Report [Funds] 01-31-2022 ED [AUX] | akiesli | 29-Mar-22 08:44 | 22-1296-2.fc | Sequence: 15CHKSUM Content: 5520 Layout: 58685 Graphics: 0 CLEAN
JOB: 22-1296-2 CYCLE#;BL#: 8; 0 TRIM: 10.75" x 8.25" AS: New York: 212-620-5600COLORS: ~note-color 2, Black, ~note-color 3 GRAPHICS: none V1.5
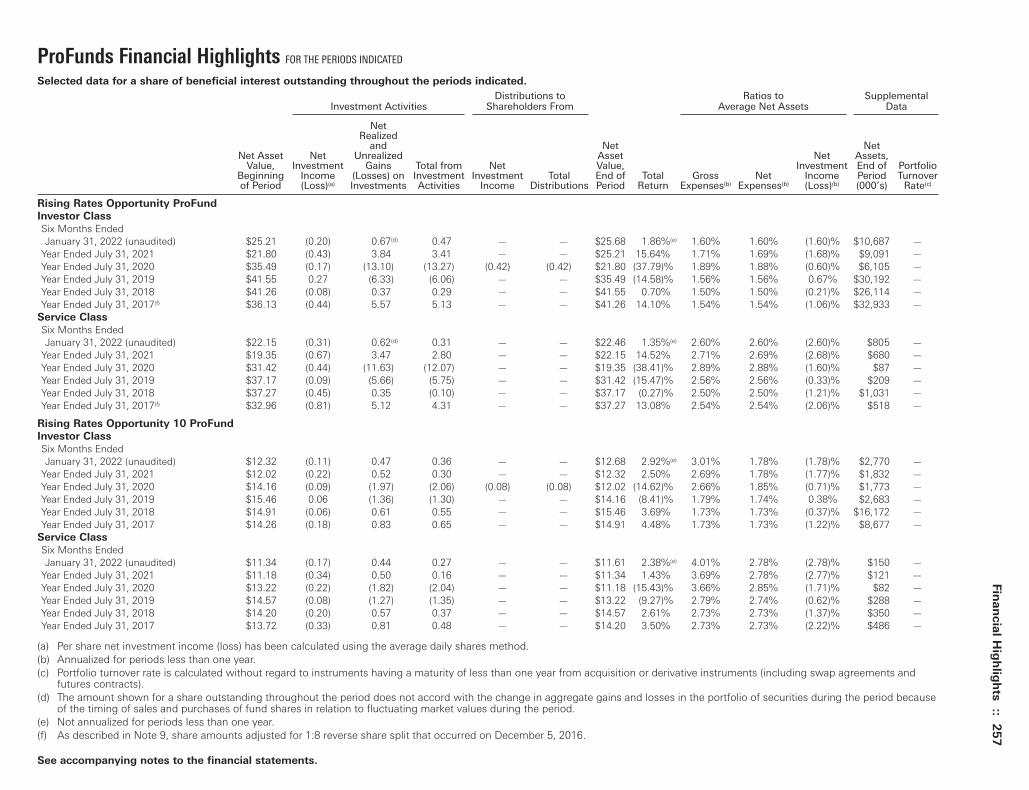
ProFunds Financial Highlights FOR THE PERIODS INDICATED
Selected data for a share of beneficial interest outstanding throughout the periods indicated.
Distributions to Ratios to SupplementalInvestment Activities Shareholders From Average Net Assets Data
NetRealized
and Net NetNet Asset Net Unrealized Asset Net Assets,
Value, Investment Gains Total from Net Value, Investment End of PortfolioBeginning Income (Losses) on Investment Investment Total End of Total Gross Net Income Period Turnoverof Period (Loss)(a) Investments Activities Income Distributions Period Return Expenses(b) Expenses(b) (Loss)(b) (000’s) Rate(c)
Rising Rates Opportunity ProFund
Investor Class
Six Months EndedJanuary 31, 2022 (unaudited) $25.21 (0.20) 0.67(d) 0.47 — — $25.68 1.86%(e) 1.60% 1.60% (1.60)% $10,687 —
Year Ended July 31, 2021 $21.80 (0.43) 3.84 3.41 — — $25.21 15.64% 1.71% 1.69% (1.68)% $9,091 —Year Ended July 31, 2020 $35.49 (0.17) (13.10) (13.27) (0.42) (0.42) $21.80 (37.79)% 1.89% 1.88% (0.60)% $6,105 —Year Ended July 31, 2019 $41.55 0.27 (6.33) (6.06) — — $35.49 (14.58)% 1.56% 1.56% 0.67% $30,192 —Year Ended July 31, 2018 $41.26 (0.08) 0.37 0.29 — — $41.55 0.70% 1.50% 1.50% (0.21)% $26,114 —Year Ended July 31, 2017(f) $36.13 (0.44) 5.57 5.13 — — $41.26 14.10% 1.54% 1.54% (1.06)% $32,933 —
Service Class
Six Months EndedJanuary 31, 2022 (unaudited) $22.15 (0.31) 0.62(d) 0.31 — — $22.46 1.35%(e) 2.60% 2.60% (2.60)% $805 —
Year Ended July 31, 2021 $19.35 (0.67) 3.47 2.80 — — $22.15 14.52% 2.71% 2.69% (2.68)% $680 —Year Ended July 31, 2020 $31.42 (0.44) (11.63) (12.07) — — $19.35 (38.41)% 2.89% 2.88% (1.60)% $87 —Year Ended July 31, 2019 $37.17 (0.09) (5.66) (5.75) — — $31.42 (15.47)% 2.56% 2.56% (0.33)% $209 —Year Ended July 31, 2018 $37.27 (0.45) 0.35 (0.10) — — $37.17 (0.27)% 2.50% 2.50% (1.21)% $1,031 —Year Ended July 31, 2017(f) $32.96 (0.81) 5.12 4.31 — — $37.27 13.08% 2.54% 2.54% (2.06)% $518 —
Rising Rates Opportunity 10 ProFund
Investor Class
Six Months EndedJanuary 31, 2022 (unaudited) $12.32 (0.11) 0.47 0.36 — — $12.68 2.92%(e) 3.01% 1.78% (1.78)% $2,770 —
Year Ended July 31, 2021 $12.02 (0.22) 0.52 0.30 — — $12.32 2.50% 2.69% 1.78% (1.77)% $1,832 —Year Ended July 31, 2020 $14.16 (0.09) (1.97) (2.06) (0.08) (0.08) $12.02 (14.62)% 2.66% 1.85% (0.71)% $1,773 —Year Ended July 31, 2019 $15.46 0.06 (1.36) (1.30) — — $14.16 (8.41)% 1.79% 1.74% 0.38% $2,683 —Year Ended July 31, 2018 $14.91 (0.06) 0.61 0.55 — — $15.46 3.69% 1.73% 1.73% (0.37)% $16,172 —Year Ended July 31, 2017 $14.26 (0.18) 0.83 0.65 — — $14.91 4.48% 1.73% 1.73% (1.22)% $8,677 —
Service Class
Six Months EndedJanuary 31, 2022 (unaudited) $11.34 (0.17) 0.44 0.27 — — $11.61 2.38%(e) 4.01% 2.78% (2.78)% $150 —
Year Ended July 31, 2021 $11.18 (0.34) 0.50 0.16 — — $11.34 1.43% 3.69% 2.78% (2.77)% $121 —Year Ended July 31, 2020 $13.22 (0.22) (1.82) (2.04) — — $11.18 (15.43)% 3.66% 2.85% (1.71)% $82 —Year Ended July 31, 2019 $14.57 (0.08) (1.27) (1.35) — — $13.22 (9.27)% 2.79% 2.74% (0.62)% $288 —Year Ended July 31, 2018 $14.20 (0.20) 0.57 0.37 — — $14.57 2.61% 2.73% 2.73% (1.37)% $350 —Year Ended July 31, 2017 $13.72 (0.33) 0.81 0.48 — — $14.20 3.50% 2.73% 2.73% (2.22)% $486 —
(a) Per share net investment income (loss) has been calculated using the average daily shares method.(b) Annualized for periods less than one year.(c) Portfolio turnover rate is calculated without regard to instruments having a maturity of less than one year from acquisition or derivative instruments (including swap agreements and
futures contracts).(d) The amount shown for a share outstanding throughout the period does not accord with the change in aggregate gains and losses in the portfolio of securities during the period because
of the timing of sales and purchases of fund shares in relation to fluctuating market values during the period.(e) Not annualized for periods less than one year.(f) As described in Note 9, share amounts adjusted for 1:8 reverse share split that occurred on December 5, 2016.
See accompanying notes to the financial statements.
Fin
an
cia
l Hig
hlig
hts
:: 25
7
Toppan Merrill - ProFunds Public Semi-Annual Report [Funds] 01-31-2022 ED [AUX] | akiesli | 29-Mar-22 08:44 | 22-1296-2.fc | Sequence: 16CHKSUM Content: 40312 Layout: 54504 Graphics: 0 CLEAN
JOB: 22-1296-2 CYCLE#;BL#: 8; 0 TRIM: 10.75" x 8.25" AS: New York: 212-620-5600COLORS: ~note-color 2, Black, ~note-color 3 GRAPHICS: none V1.5
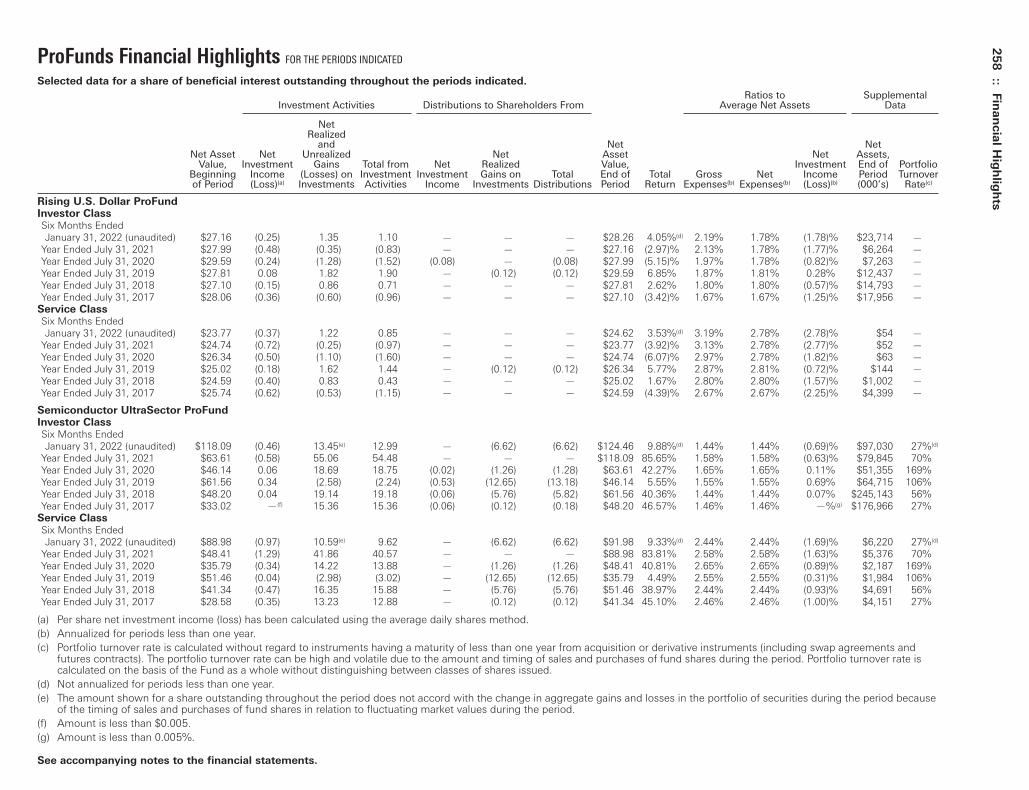
ProFunds Financial Highlights FOR THE PERIODS INDICATED
Selected data for a share of beneficial interest outstanding throughout the periods indicated.
Ratios to SupplementalInvestment Activities Distributions to Shareholders From Average Net Assets Data
Net Realized
and Net Net Net Asset Net Unrealized Net Asset Net Assets,
Value, Investment Gains Total from Net Realized Value, Investment End of PortfolioBeginning Income (Losses) on Investment Investment Gains on Total End of Total Gross Net Income Period Turnoverof Period (Loss)(a) Investments Activities Income Investments Distributions Period Return Expenses(b) Expenses(b) (Loss)(b) (000’s) Rate(c)
Rising U.S. Dollar ProFundInvestor ClassSix Months EndedJanuary 31, 2022 (unaudited) $27.16 (0.25) 1.35 1.10 — — — $28.26 4.05%(d) 2.19% 1.78% (1.78)% $23,714 —
Year Ended July 31, 2021 $27.99 (0.48) (0.35) (0.83) — — — $27.16 (2.97)% 2.13% 1.78% (1.77)% $6,264 —Year Ended July 31, 2020 $29.59 (0.24) (1.28) (1.52) (0.08) — (0.08) $27.99 (5.15)% 1.97% 1.78% (0.82)% $7,263 —Year Ended July 31, 2019 $27.81 0.08 1.82 1.90 — (0.12) (0.12) $29.59 6.85% 1.87% 1.81% 0.28% $12,437 —Year Ended July 31, 2018 $27.10 (0.15) 0.86 0.71 — — — $27.81 2.62% 1.80% 1.80% (0.57)% $14,793 —Year Ended July 31, 2017 $28.06 (0.36) (0.60) (0.96) — — — $27.10 (3.42)% 1.67% 1.67% (1.25)% $17,956 —
Service ClassSix Months EndedJanuary 31, 2022 (unaudited) $23.77 (0.37) 1.22 0.85 — — — $24.62 3.53%(d) 3.19% 2.78% (2.78)% $54 —
Year Ended July 31, 2021 $24.74 (0.72) (0.25) (0.97) — — — $23.77 (3.92)% 3.13% 2.78% (2.77)% $52 —Year Ended July 31, 2020 $26.34 (0.50) (1.10) (1.60) — — — $24.74 (6.07)% 2.97% 2.78% (1.82)% $63 —Year Ended July 31, 2019 $25.02 (0.18) 1.62 1.44 — (0.12) (0.12) $26.34 5.77% 2.87% 2.81% (0.72)% $144 —Year Ended July 31, 2018 $24.59 (0.40) 0.83 0.43 — — — $25.02 1.67% 2.80% 2.80% (1.57)% $1,002 —Year Ended July 31, 2017 $25.74 (0.62) (0.53) (1.15) — — — $24.59 (4.39)% 2.67% 2.67% (2.25)% $4,399 —
Semiconductor UltraSector ProFundInvestor ClassSix Months EndedJanuary 31, 2022 (unaudited) $118.09 (0.46) 13.45(e) 12.99 — (6.62) (6.62) $124.46 9.88%(d) 1.44% 1.44% (0.69)% $97,030 27%(d)
Year Ended July 31, 2021 $63.61 (0.58) 55.06 54.48 — — — $118.09 85.65% 1.58% 1.58% (0.63)% $79,845 70%Year Ended July 31, 2020 $46.14 0.06 18.69 18.75 (0.02) (1.26) (1.28) $63.61 42.27% 1.65% 1.65% 0.11% $51,355 169%Year Ended July 31, 2019 $61.56 0.34 (2.58) (2.24) (0.53) (12.65) (13.18) $46.14 5.55% 1.55% 1.55% 0.69% $64,715 106%Year Ended July 31, 2018 $48.20 0.04 19.14 19.18 (0.06) (5.76) (5.82) $61.56 40.36% 1.44% 1.44% 0.07% $245,143 56%Year Ended July 31, 2017 $33.02 —(f) 15.36 15.36 (0.06) (0.12) (0.18) $48.20 46.57% 1.46% 1.46% —%(g) $176,966 27%
Service ClassSix Months EndedJanuary 31, 2022 (unaudited) $88.98 (0.97) 10.59(e) 9.62 — (6.62) (6.62) $91.98 9.33%(d) 2.44% 2.44% (1.69)% $6,220 27%(d)
Year Ended July 31, 2021 $48.41 (1.29) 41.86 40.57 — — — $88.98 83.81% 2.58% 2.58% (1.63)% $5,376 70%Year Ended July 31, 2020 $35.79 (0.34) 14.22 13.88 — (1.26) (1.26) $48.41 40.81% 2.65% 2.65% (0.89)% $2,187 169%Year Ended July 31, 2019 $51.46 (0.04) (2.98) (3.02) — (12.65) (12.65) $35.79 4.49% 2.55% 2.55% (0.31)% $1,984 106%Year Ended July 31, 2018 $41.34 (0.47) 16.35 15.88 — (5.76) (5.76) $51.46 38.97% 2.44% 2.44% (0.93)% $4,691 56%Year Ended July 31, 2017 $28.58 (0.35) 13.23 12.88 — (0.12) (0.12) $41.34 45.10% 2.46% 2.46% (1.00)% $4,151 27%
(a) Per share net investment income (loss) has been calculated using the average daily shares method.(b) Annualized for periods less than one year.(c) Portfolio turnover rate is calculated without regard to instruments having a maturity of less than one year from acquisition or derivative instruments (including swap agreements and
futures contracts). The portfolio turnover rate can be high and volatile due to the amount and timing of sales and purchases of fund shares during the period. Portfolio turnover rate iscalculated on the basis of the Fund as a whole without distinguishing between classes of shares issued.
(d) Not annualized for periods less than one year.(e) The amount shown for a share outstanding throughout the period does not accord with the change in aggregate gains and losses in the portfolio of securities during the period because
of the timing of sales and purchases of fund shares in relation to fluctuating market values during the period.(f) Amount is less than $0.005.(g) Amount is less than 0.005%.
See accompanying notes to the financial statements.
258
:: Fin
an
cia
l Hig
hlig
hts
Toppan Merrill - ProFunds Public Semi-Annual Report [Funds] 01-31-2022 ED [AUX] | akiesli | 29-Mar-22 08:44 | 22-1296-2.fc | Sequence: 17CHKSUM Content: 58998 Layout: 25605 Graphics: 0 CLEAN
JOB: 22-1296-2 CYCLE#;BL#: 8; 0 TRIM: 10.75" x 8.25" AS: New York: 212-620-5600COLORS: ~note-color 2, Black, ~note-color 3 GRAPHICS: none V1.5

ProFunds Financial Highlights FOR THE PERIODS INDICATED
Selected data for a share of beneficial interest outstanding throughout the periods indicated.
Distributions to Ratios to Supplemental Investment Activities Shareholders From Average Net Assets Data
NetRealized
and Net NetNet Asset Net Unrealized Asset Net Assets,
Value, Investment Gains Total from Net Value, Investment End of PortfolioBeginning Income (Losses) on Investment Investment Total End of Total Gross Net Income Period Turnoverof Period (Loss)(a) Investments Activities Income Distributions Period Return Expenses(b) Expenses(b) (Loss)(b) (000’s) Rate(c)
Short Nasdaq-100 ProFundInvestor ClassSix Months EndedJanuary 31, 2022 (unaudited) $14.29 (0.12) (0.47) (0.59) — — $13.70 (4.13)%(d) 2.43% 1.78% (1.78)% $88,109 —
Year Ended July 31, 2021 $20.87 (0.31) (6.27)(e) (6.58) — — $14.29 (31.63)% 2.02% 1.78% (1.76)% $1,764 —Year Ended July 31, 2020(f) $33.46 (0.18) (12.32) (12.50) (0.09) (0.09) $20.87 (37.32)% 2.01% 1.78% (1.00)% $2,400 —Year Ended July 31, 2019(f) $37.30 0.16 (4.00) (3.84) — — $33.46 (10.40)% 2.37% 1.78% 0.46% $4,429 —Year Ended July 31, 2018(f) $47.10 (0.20) (9.60) (9.80) — — $37.30 (20.66)% 2.42% 1.78% (0.44)% $2,572 —Year Ended July 31, 2017(f) $60.02 (0.76) (12.16) (12.92) — — $47.10 (21.65)% 2.24% 1.77% (1.37)% $2,444 —
Service ClassSix Months EndedJanuary 31, 2022 (unaudited) $12.68 (0.18) (0.41) (0.59) — — $12.09 (4.65)%(d) 3.43% 2.78% (2.78)% $90 —
Year Ended July 31, 2021 $18.67 (0.46) (5.53)(e) (5.99) — — $12.68 (32.26)% 3.02% 2.78% (2.76)% $111 —Year Ended July 31, 2020(f) $30.15 (0.33) (11.15) (11.48) — — $18.67 (37.93)% 3.01% 2.78% (2.00)% $320 —Year Ended July 31, 2019(f) $33.96 (0.16) (3.65) (3.81) — — $30.15 (11.19)% 3.37% 2.78% (0.54)% $788 —Year Ended July 31, 2018(f) $43.27 (0.56) (8.75) (9.31) — — $33.96 (21.46)% 3.42% 2.78% (1.44)% $360 —Year Ended July 31, 2017(f) $55.70 (1.28) (11.15) (12.43) — — $43.27 (22.40)% 3.24% 2.77% (2.37)% $141 —
Short Oil & Gas ProFundInvestor ClassSix Months EndedJanuary 31, 2022 (unaudited) $32.82 (0.25) (9.47) (9.72) — — $23.10 (29.62)%(d) 5.20% 1.78% (1.78)% $379 —
Year Ended July 31, 2021 $55.89 (0.85) (22.22) (23.07) — — $32.82 (41.28)% 3.16% 1.78% (1.76)% $418 —Year Ended July 31, 2020 $46.83 (0.46) 9.65 9.19 (0.13) (0.13) $55.89 19.69% 2.84% 1.78% (0.84)% $2,804 —Year Ended July 31, 2019 $39.19 0.19 7.45 7.64 — — $46.83 19.49% 3.34% 1.78% 0.43% $2,115 —Year Ended July 31, 2018 $48.45 (0.21) (9.05) (9.26) — — $39.19 (19.11)% 2.62% 1.78% (0.48)% $1,636 —Year Ended July 31, 2017(g) $50.10 (0.61) (1.04) (1.65) — — $48.45 (3.25)% 2.76% 1.77% (1.30)% $2,491 —
Service ClassSix Months EndedJanuary 31, 2022 (unaudited) $30.52 (0.39) (8.76) (9.15) — — $21.37 (30.00)%(d) 6.20% 2.78% (2.78)% $5 —
Year Ended July 31, 2021 $52.45 (1.25) (20.68) (21.93) — — $30.52 (41.81)% 4.15% 2.77% (2.75)% $25 —Year Ended July 31, 2020 $44.39 (0.99) 9.05 8.06 — — $52.45 18.63% 3.84% 2.78% (1.84)% $32 —Year Ended July 31, 2019 $37.27 (0.24) 7.36 7.12 — — $44.39 18.39% 4.34% 2.78% (0.57)% $3 —Year Ended July 31, 2018 $46.66 (0.68) (8.71) (9.39) — — $37.27 (19.95)% 3.62% 2.78% (1.48)% $3 —Year Ended July 31, 2017(g) $48.73 (1.06) (1.01) (2.07) — — $46.66 (4.21)% 3.76% 2.77% (2.30)% $139 —
(a) Per share net investment income (loss) has been calculated using the average daily shares method.(b) Annualized for periods less than one year.(c) Portfolio turnover rate is calculated without regard to instruments having a maturity of less than one year from acquisition or derivative instruments (including swap agreements and
futures contracts).(d) Not annualized for periods less than one year.(e) The amount shown for a share outstanding throughout the period does not accord with the change in aggregate gains and losses in the portfolio of securities during the period because
of the timing of sales and purchases of fund shares in relation to fluctuating market values during the period.(f) As described in Note 9, share amounts have been adjusted for 1:4 reverse share split that occurred on November 18, 2019.(g) As described in Note 9, share amounts have been adjusted for 1:8 reverse share split that occurred on December 5, 2016.
See accompanying notes to the financial statements.
Fin
an
cia
l Hig
hlig
hts
:: 25
9
Toppan Merrill - ProFunds Public Semi-Annual Report [Funds] 01-31-2022 ED [AUX] | akiesli | 29-Mar-22 08:44 | 22-1296-2.fc | Sequence: 18CHKSUM Content: 47354 Layout: 64541 Graphics: 0 CLEAN
JOB: 22-1296-2 CYCLE#;BL#: 8; 0 TRIM: 10.75" x 8.25" AS: New York: 212-620-5600COLORS: ~note-color 2, Black, ~note-color 3 GRAPHICS: none V1.5

ProFunds Financial Highlights FOR THE PERIODS INDICATED
Selected data for a share of beneficial interest outstanding throughout the periods indicated.
Distributions to Ratios to SupplementalInvestment Activities Shareholders From Average Net Assets Data
NetRealized
and Net NetNet Asset Net Unrealized Asset Net Assets,
Value, Investment Gains Total from Net Value, Investment End of PortfolioBeginning Income (Losses) on Investment Investment Total End of Total Gross Net Income Period Turnoverof Period (Loss)(a) Investments Activities Income Distributions Period Return Expenses(b) Expenses(b) (Loss)(b) (000’s) Rate(c)
Short Precious Metals ProFund
Investor Class
Six Months EndedJanuary 31, 2022 (unaudited) $14.83 (0.14) 1.12 0.98 — — $15.81 6.61%(d) 2.67% 1.78% (1.78)% $3,931 —
Year Ended July 31, 2021 $14.53 (0.27) 0.57 0.30 — — $14.83 2.06% 2.86% 1.78% (1.76)% $2,144 —Year Ended July 31, 2020 $32.94 (0.12) (18.02) (18.14) (0.27) (0.27) $14.53 (55.43)% 2.97% 1.78% (0.47)% $1,564 —Year Ended July 31, 2019 $42.91 0.20 (10.17) (9.97) — — $32.94 (23.23)% 2.13% 1.78% 0.47% $4,649 —Year Ended July 31, 2018 $40.33 (0.21) 2.79 2.58 — — $42.91 6.40% 2.18% 1.78% (0.53)% $6,552 —Year Ended July 31, 2017(e) $35.17 (0.57) 5.73 5.16 — — $40.33 14.57% 2.00% 1.85% (1.39)% $3,432 —
Service Class
Six Months EndedJanuary 31, 2022 (unaudited) $14.43 (0.22) 1.09 0.87 — — $15.30 5.96%(d) 3.67% 2.78% (2.78)% $15 —
Year Ended July 31, 2021 $14.31 (0.42) 0.54 0.12 — — $14.43 0.84% 3.86% 2.78% (2.76)% $14 —Year Ended July 31, 2020 $32.41 (0.36) (17.74) (18.10) — — $14.31 (55.85)% 3.97% 2.78% (1.47)% $65 —Year Ended July 31, 2019 $42.65 (0.22) (10.02) (10.24) — — $32.41 (24.01)% 3.13% 2.78% (0.53)% $26 —Year Ended July 31, 2018 $40.48 (0.61) 2.78 2.17 — — $42.65 5.36% 3.18% 2.78% (1.53)% $42 —Year Ended July 31, 2017(e) $35.70 (0.97) 5.75 4.78 — — $40.48 13.45% 3.00% 2.85% (2.39)% $336 —
Short Real Estate ProFund
Investor Class
Six Months EndedJanuary 31, 2022 (unaudited) $8.19 (0.07) (0.20) (0.27) — — $7.92 (3.30)%(d) 8.88% 1.78% (1.78)% $733 —
Year Ended July 31, 2021 $11.45 (0.19) (3.07) (3.26) — — $8.19 (28.47)% 4.69% 1.78% (1.76)% $515 —Year Ended July 31, 2020 $12.89 (0.14) (1.30) (1.44) — — $11.45 (11.17)% 4.05% 1.78% (1.09)% $1,720 —Year Ended July 31, 2019 $14.61 0.06 (1.78) (1.72) — — $12.89 (11.77)% 3.76% 1.78% 0.40% $1,199 —Year Ended July 31, 2018 $15.43 (0.06) (0.76) (0.82) — — $14.61 (5.31)% 3.16% 1.78% (0.38)% $1,453 —Year Ended July 31, 2017 $15.67 (0.23) (0.01) (0.24) — — $15.43 (1.53)% 3.33% 1.78% (1.39)% $772 —
Service Class
Six Months EndedJanuary 31, 2022 (unaudited) $7.19 (0.11) (0.16) (0.27) — — $6.92 (3.76)%(d) 9.88% 2.78% (2.78)% $14 —
Year Ended July 31, 2021 $10.15 (0.28) (2.68) (2.96) — — $7.19 (29.16)% 5.69% 2.78% (2.76)% $14 —Year Ended July 31, 2020 $11.53 (0.25) (1.13) (1.38) — — $10.15 (12.05)% 5.05% 2.78% (2.09)% $20 —Year Ended July 31, 2019 $13.20 (0.07) (1.60) (1.67) — — $11.53 (12.58)% 4.76% 2.78% (0.60)% $15 —Year Ended July 31, 2018 $14.08 (0.20) (0.68) (0.88) — — $13.20 (6.25)% 4.16% 2.78% (1.38)% $364 —Year Ended July 31, 2017 $14.45 (0.39) 0.02 (0.37) — — $14.08 (2.56)% 4.33% 2.78% (2.39)% $10 —
(a) Per share net investment income (loss) has been calculated using the average daily shares method.(b) Annualized for periods less than one year.(c) Portfolio turnover rate is calculated without regard to instruments having a maturity of less than one year from acquisition or derivative instruments (including swap agreements and
futures contracts).(d) Not annualized for periods less than one year.(e) As described in Note 9, share amounts adjusted for 1:8 reverse share split that occurred on December 5, 2016.
See accompanying notes to the financial statements.
260
:: Fin
an
cia
l Hig
hlig
hts
Toppan Merrill - ProFunds Public Semi-Annual Report [Funds] 01-31-2022 ED [AUX] | akiesli | 29-Mar-22 08:44 | 22-1296-2.fc | Sequence: 19CHKSUM Content: 60410 Layout: 48531 Graphics: 0 CLEAN
JOB: 22-1296-2 CYCLE#;BL#: 8; 0 TRIM: 10.75" x 8.25" AS: New York: 212-620-5600COLORS: ~note-color 2, Black, ~note-color 3 GRAPHICS: none V1.5
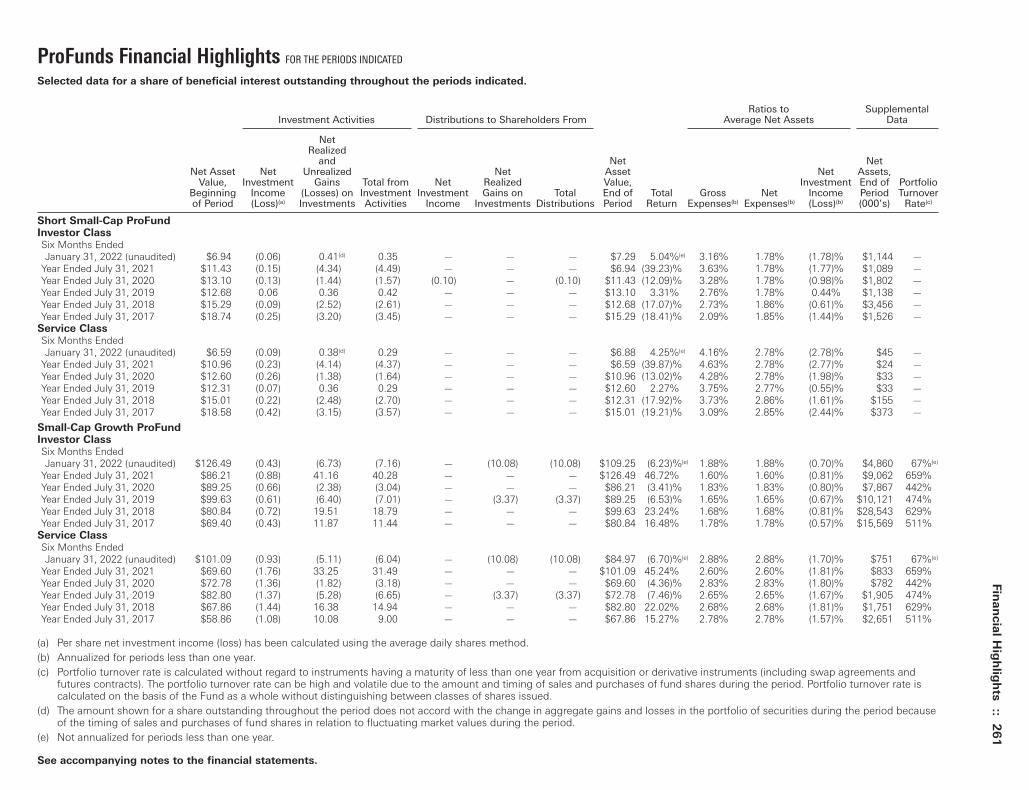
ProFunds Financial Highlights FOR THE PERIODS INDICATED
Selected data for a share of beneficial interest outstanding throughout the periods indicated.
Ratios to SupplementalInvestment Activities Distributions to Shareholders From Average Net Assets Data
Net Realized
and Net Net Net Asset Net Unrealized Net Asset Net Assets,
Value, Investment Gains Total from Net Realized Value, Investment End of PortfolioBeginning Income (Losses) on Investment Investment Gains on Total End of Total Gross Net Income Period Turnoverof Period (Loss)(a) Investments Activities Income Investments Distributions Period Return Expenses(b) Expenses(b) (Loss)(b) (000’s) Rate(c)
Short Small-Cap ProFundInvestor ClassSix Months EndedJanuary 31, 2022 (unaudited) $6.94 (0.06) 0.41(d) 0.35 — — — $7.29 5.04%(e) 3.16% 1.78% (1.78)% $1,144 —
Year Ended July 31, 2021 $11.43 (0.15) (4.34) (4.49) — — — $6.94 (39.23)% 3.63% 1.78% (1.77)% $1,089 —Year Ended July 31, 2020 $13.10 (0.13) (1.44) (1.57) (0.10) — (0.10) $11.43 (12.09)% 3.28% 1.78% (0.98)% $1,802 —Year Ended July 31, 2019 $12.68 0.06 0.36 0.42 — — — $13.10 3.31% 2.76% 1.78% 0.44% $1,138 —Year Ended July 31, 2018 $15.29 (0.09) (2.52) (2.61) — — — $12.68 (17.07)% 2.73% 1.86% (0.61)% $3,456 —Year Ended July 31, 2017 $18.74 (0.25) (3.20) (3.45) — — — $15.29 (18.41)% 2.09% 1.85% (1.44)% $1,526 —
Service ClassSix Months EndedJanuary 31, 2022 (unaudited) $6.59 (0.09) 0.38(d) 0.29 — — — $6.88 4.25%(e) 4.16% 2.78% (2.78)% $45 —
Year Ended July 31, 2021 $10.96 (0.23) (4.14) (4.37) — — — $6.59 (39.87)% 4.63% 2.78% (2.77)% $24 —Year Ended July 31, 2020 $12.60 (0.26) (1.38) (1.64) — — — $10.96 (13.02)% 4.28% 2.78% (1.98)% $33 —Year Ended July 31, 2019 $12.31 (0.07) 0.36 0.29 — — — $12.60 2.27% 3.75% 2.77% (0.55)% $33 —Year Ended July 31, 2018 $15.01 (0.22) (2.48) (2.70) — — — $12.31 (17.92)% 3.73% 2.86% (1.61)% $155 —Year Ended July 31, 2017 $18.58 (0.42) (3.15) (3.57) — — — $15.01 (19.21)% 3.09% 2.85% (2.44)% $373 —
Small-Cap Growth ProFundInvestor ClassSix Months EndedJanuary 31, 2022 (unaudited) $126.49 (0.43) (6.73) (7.16) — (10.08) (10.08) $109.25 (6.23)%(e) 1.88% 1.88% (0.70)% $4,860 67%(e)
Year Ended July 31, 2021 $86.21 (0.88) 41.16 40.28 — — — $126.49 46.72% 1.60% 1.60% (0.81)% $9,062 659%Year Ended July 31, 2020 $89.25 (0.66) (2.38) (3.04) — — — $86.21 (3.41)% 1.83% 1.83% (0.80)% $7,867 442%Year Ended July 31, 2019 $99.63 (0.61) (6.40) (7.01) — (3.37) (3.37) $89.25 (6.53)% 1.65% 1.65% (0.67)% $10,121 474%Year Ended July 31, 2018 $80.84 (0.72) 19.51 18.79 — — — $99.63 23.24% 1.68% 1.68% (0.81)% $28,543 629%Year Ended July 31, 2017 $69.40 (0.43) 11.87 11.44 — — — $80.84 16.48% 1.78% 1.78% (0.57)% $15,569 511%
Service ClassSix Months EndedJanuary 31, 2022 (unaudited) $101.09 (0.93) (5.11) (6.04) — (10.08) (10.08) $84.97 (6.70)%(e) 2.88% 2.88% (1.70)% $751 67%(e)
Year Ended July 31, 2021 $69.60 (1.76) 33.25 31.49 — — — $101.09 45.24% 2.60% 2.60% (1.81)% $833 659%Year Ended July 31, 2020 $72.78 (1.36) (1.82) (3.18) — — — $69.60 (4.36)% 2.83% 2.83% (1.80)% $782 442%Year Ended July 31, 2019 $82.80 (1.37) (5.28) (6.65) — (3.37) (3.37) $72.78 (7.46)% 2.65% 2.65% (1.67)% $1,905 474%Year Ended July 31, 2018 $67.86 (1.44) 16.38 14.94 — — — $82.80 22.02% 2.68% 2.68% (1.81)% $1,751 629%Year Ended July 31, 2017 $58.86 (1.08) 10.08 9.00 — — — $67.86 15.27% 2.78% 2.78% (1.57)% $2,651 511%
(a) Per share net investment income (loss) has been calculated using the average daily shares method.(b) Annualized for periods less than one year.(c) Portfolio turnover rate is calculated without regard to instruments having a maturity of less than one year from acquisition or derivative instruments (including swap agreements and
futures contracts). The portfolio turnover rate can be high and volatile due to the amount and timing of sales and purchases of fund shares during the period. Portfolio turnover rate iscalculated on the basis of the Fund as a whole without distinguishing between classes of shares issued.
(d) The amount shown for a share outstanding throughout the period does not accord with the change in aggregate gains and losses in the portfolio of securities during the period becauseof the timing of sales and purchases of fund shares in relation to fluctuating market values during the period.
(e) Not annualized for periods less than one year.
See accompanying notes to the financial statements.
Fin
an
cia
l Hig
hlig
hts
:: 26
1
Toppan Merrill - ProFunds Public Semi-Annual Report [Funds] 01-31-2022 ED [AUX] | akiesli | 29-Mar-22 08:44 | 22-1296-2.fc | Sequence: 20CHKSUM Content: 12638 Layout: 15856 Graphics: 0 CLEAN
JOB: 22-1296-2 CYCLE#;BL#: 8; 0 TRIM: 10.75" x 8.25" AS: New York: 212-620-5600COLORS: ~note-color 2, Black, ~note-color 3 GRAPHICS: none V1.5
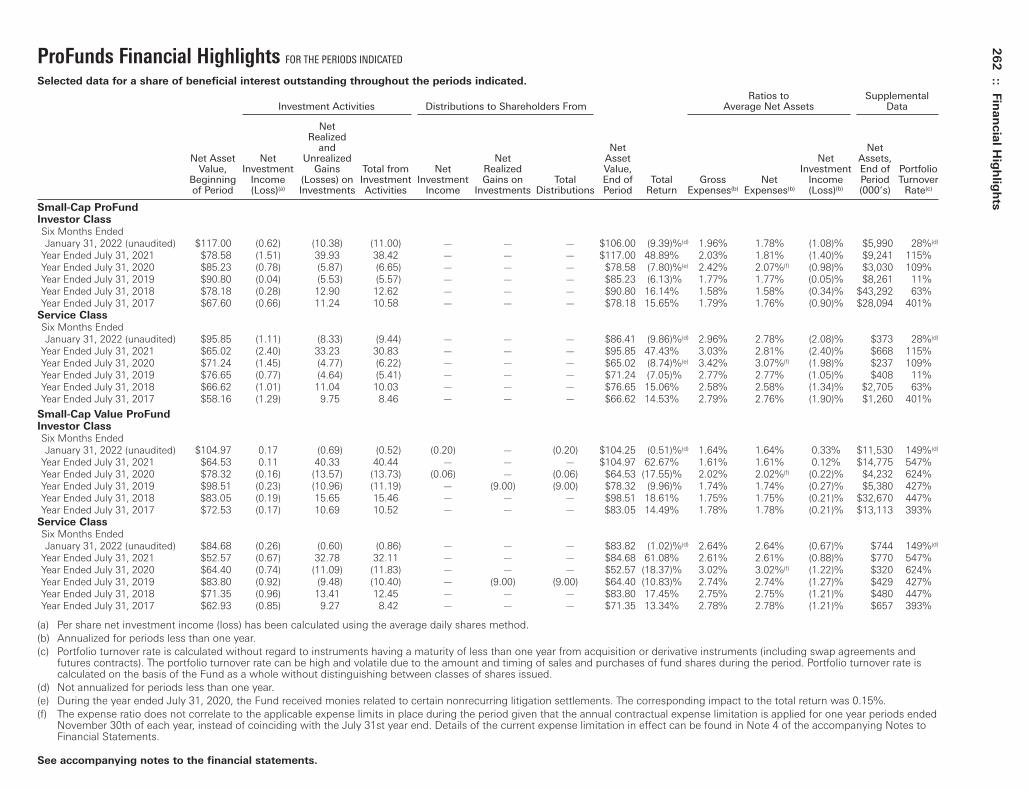
ProFunds Financial Highlights FOR THE PERIODS INDICATED
Selected data for a share of beneficial interest outstanding throughout the periods indicated.
Ratios to SupplementalInvestment Activities Distributions to Shareholders From Average Net Assets Data
Net Realized
and Net Net Net Asset Net Unrealized Net Asset Net Assets,
Value, Investment Gains Total from Net Realized Value, Investment End of PortfolioBeginning Income (Losses) on Investment Investment Gains on Total End of Total Gross Net Income Period Turnoverof Period (Loss)(a) Investments Activities Income Investments Distributions Period Return Expenses(b) Expenses(b) (Loss)(b) (000’s) Rate(c)
Small-Cap ProFundInvestor ClassSix Months EndedJanuary 31, 2022 (unaudited) $117.00 (0.62) (10.38) (11.00) — — — $106.00 (9.39)%(d) 1.96% 1.78% (1.08)% $5,990 28%(d)
Year Ended July 31, 2021 $78.58 (1.51) 39.93 38.42 — — — $117.00 48.89% 2.03% 1.81% (1.40)% $9,241 115%Year Ended July 31, 2020 $85.23 (0.78) (5.87) (6.65) — — — $78.58 (7.80)%(e) 2.42% 2.07%(f) (0.98)% $3,030 109%Year Ended July 31, 2019 $90.80 (0.04) (5.53) (5.57) — — — $85.23 (6.13)% 1.77% 1.77% (0.05)% $8,261 11%Year Ended July 31, 2018 $78.18 (0.28) 12.90 12.62 — — — $90.80 16.14% 1.58% 1.58% (0.34)% $43,292 63%Year Ended July 31, 2017 $67.60 (0.66) 11.24 10.58 — — — $78.18 15.65% 1.79% 1.76% (0.90)% $28,094 401%
Service ClassSix Months EndedJanuary 31, 2022 (unaudited) $95.85 (1.11) (8.33) (9.44) — — — $86.41 (9.86)%(d) 2.96% 2.78% (2.08)% $373 28%(d)
Year Ended July 31, 2021 $65.02 (2.40) 33.23 30.83 — — — $95.85 47.43% 3.03% 2.81% (2.40)% $668 115%Year Ended July 31, 2020 $71.24 (1.45) (4.77) (6.22) — — — $65.02 (8.74)%(e) 3.42% 3.07%(f) (1.98)% $237 109%Year Ended July 31, 2019 $76.65 (0.77) (4.64) (5.41) — — — $71.24 (7.05)% 2.77% 2.77% (1.05)% $408 11%Year Ended July 31, 2018 $66.62 (1.01) 11.04 10.03 — — — $76.65 15.06% 2.58% 2.58% (1.34)% $2,705 63%Year Ended July 31, 2017 $58.16 (1.29) 9.75 8.46 — — — $66.62 14.53% 2.79% 2.76% (1.90)% $1,260 401%
Small-Cap Value ProFundInvestor ClassSix Months EndedJanuary 31, 2022 (unaudited) $104.97 0.17 (0.69) (0.52) (0.20) — (0.20) $104.25 (0.51)%(d) 1.64% 1.64% 0.33% $11,530 149%(d)
Year Ended July 31, 2021 $64.53 0.11 40.33 40.44 — — — $104.97 62.67% 1.61% 1.61% 0.12% $14,775 547%Year Ended July 31, 2020 $78.32 (0.16) (13.57) (13.73) (0.06) — (0.06) $64.53 (17.55)% 2.02% 2.02%(f) (0.22)% $4,232 624%Year Ended July 31, 2019 $98.51 (0.23) (10.96) (11.19) — (9.00) (9.00) $78.32 (9.96)% 1.74% 1.74% (0.27)% $5,380 427%Year Ended July 31, 2018 $83.05 (0.19) 15.65 15.46 — — — $98.51 18.61% 1.75% 1.75% (0.21)% $32,670 447%Year Ended July 31, 2017 $72.53 (0.17) 10.69 10.52 — — — $83.05 14.49% 1.78% 1.78% (0.21)% $13,113 393%
Service ClassSix Months EndedJanuary 31, 2022 (unaudited) $84.68 (0.26) (0.60) (0.86) — — — $83.82 (1.02)%(d) 2.64% 2.64% (0.67)% $744 149%(d)
Year Ended July 31, 2021 $52.57 (0.67) 32.78 32.11 — — — $84.68 61.08% 2.61% 2.61% (0.88)% $770 547%Year Ended July 31, 2020 $64.40 (0.74) (11.09) (11.83) — — — $52.57 (18.37)% 3.02% 3.02%(f) (1.22)% $320 624%Year Ended July 31, 2019 $83.80 (0.92) (9.48) (10.40) — (9.00) (9.00) $64.40 (10.83)% 2.74% 2.74% (1.27)% $429 427%Year Ended July 31, 2018 $71.35 (0.96) 13.41 12.45 — — — $83.80 17.45% 2.75% 2.75% (1.21)% $480 447%Year Ended July 31, 2017 $62.93 (0.85) 9.27 8.42 — — — $71.35 13.34% 2.78% 2.78% (1.21)% $657 393%
(a) Per share net investment income (loss) has been calculated using the average daily shares method.(b) Annualized for periods less than one year.(c) Portfolio turnover rate is calculated without regard to instruments having a maturity of less than one year from acquisition or derivative instruments (including swap agreements and
futures contracts). The portfolio turnover rate can be high and volatile due to the amount and timing of sales and purchases of fund shares during the period. Portfolio turnover rate iscalculated on the basis of the Fund as a whole without distinguishing between classes of shares issued.
(d) Not annualized for periods less than one year.(e) During the year ended July 31, 2020, the Fund received monies related to certain nonrecurring litigation settlements. The corresponding impact to the total return was 0.15%.(f) The expense ratio does not correlate to the applicable expense limits in place during the period given that the annual contractual expense limitation is applied for one year periods ended
November 30th of each year, instead of coinciding with the July 31st year end. Details of the current expense limitation in effect can be found in Note 4 of the accompanying Notes toFinancial Statements.
See accompanying notes to the financial statements.
262
:: Fin
an
cia
l Hig
hlig
hts
Toppan Merrill - ProFunds Public Semi-Annual Report [Funds] 01-31-2022 ED [AUX] | akiesli | 29-Mar-22 08:44 | 22-1296-2.fc | Sequence: 21CHKSUM Content: 32593 Layout: 2132 Graphics: 0 CLEAN
JOB: 22-1296-2 CYCLE#;BL#: 8; 0 TRIM: 10.75" x 8.25" AS: New York: 212-620-5600COLORS: ~note-color 2, Black, ~note-color 3 GRAPHICS: none V1.5

ProFunds Financial Highlights FOR THE PERIODS INDICATED
Selected data for a share of beneficial interest outstanding throughout the periods indicated.
Ratios to SupplementalInvestment Activities Distributions to Shareholders From Average Net Assets Data
Net Realized
and Net Net Net Asset Net Unrealized Net Asset Net Assets,
Value, Investment Gains Total from Net Realized Value, Investment End of PortfolioBeginning Income (Losses) on Investment Investment Gains on Total End of Total Gross Net Income Period Turnoverof Period (Loss)(a) Investments Activities Income Investments Distributions Period Return Expenses(b) Expenses(b) (Loss)(b) (000’s) Rate(c)
Technology UltraSector ProFundInvestor ClassSix Months EndedJanuary 31, 2022 (unaudited) $124.76 (0.62) 4.64 4.02 — (9.14) (9.14) $119.64 2.25%(d) 1.43% 1.43% (0.95)% $79,205 23%(d)
Year Ended July 31, 2021 $75.45 (0.90) 52.38 51.48 — (2.17) (2.17) $124.76 69.21% 1.55% 1.55% (0.97)% $95,384 114%Year Ended July 31, 2020(e) $49.47 (0.29) 26.27 25.98 — — — $75.45 52.51% 1.65% 1.65% (0.51)% $86,988 177%Year Ended July 31, 2019(e) $42.49 0.03 7.03 7.06 — (0.08) (0.08) $49.47 16.70% 1.58% 1.58% 0.06% $83,112 332%Year Ended July 31, 2018(e) $32.01 (0.07) 12.23 12.16 — (1.68) (1.68) $42.49 38.70% 1.49% 1.49% (0.19)% $96,683 174%Year Ended July 31, 2017(e) $22.57 (0.10) 9.54 9.44 — — — $32.01 41.84% 1.55% 1.55% (0.35)% $76,225 107%
Service ClassSix Months EndedJanuary 31, 2022 (unaudited) $101.80 (1.16) 4.15 2.99 — (9.14) (9.14) $95.65 1.72%(d) 2.43% 2.43% (1.95)% $5,345 23%(d)
Year Ended July 31, 2021 $62.48 (1.70) 43.19 41.49 — (2.17) (2.17) $101.80 67.57% 2.55% 2.55% (1.97)% $6,454 114%Year Ended July 31, 2020(e) $41.38 (0.75) 21.85 21.10 — — — $62.48 50.97% 2.65% 2.65% (1.51)% $2,858 177%Year Ended July 31, 2019(e) $35.92 (0.34) 5.88 5.54 — (0.08) (0.08) $41.38 15.53% 2.58% 2.58% (0.94)% $3,082 332%Year Ended July 31, 2018(e) $27.54 (0.40) 10.46 10.06 — (1.68) (1.68) $35.92 37.31% 2.49% 2.49% (1.19)% $5,780 174%Year Ended July 31, 2017(e) $19.61 (0.34) 8.27 7.93 — — — $27.54 40.43% 2.55% 2.55% (1.35)% $3,631 107%
Telecommunications UltraSector ProFundInvestor ClassSix Months EndedJanuary 31, 2022 (unaudited) $25.43 0.09 (0.75) (0.66) (0.13) — (0.13) $24.64 (2.64)%(d) 4.43% 1.78% 0.68% $972 76%(d)
Year Ended July 31, 2021 $19.67 0.10 5.78 5.88 (0.12) — (0.12) $25.43 30.01% 4.54% 1.78% 0.47% $1,118 286%Year Ended July 31, 2020 $21.80 0.12 (1.88) (1.76) (0.37) — (0.37) $19.67 (8.22)% 5.13% 1.78% 0.63% $862 132%Year Ended July 31, 2019 $21.33 0.07 0.92 0.99 (0.52) — (0.52) $21.80 5.18% 2.16% 1.80% 0.36% $1,468 1,449%Year Ended July 31, 2018 $24.17 0.39 (2.30) (1.91) (0.93) — (0.93) $21.33 (8.45)% 2.64% 1.95% 1.74% $1,900 412%Year Ended July 31, 2017 $27.53 0.20 (3.56) (3.36) — — — $24.17 (12.20)% 1.78% 1.65% 0.78% $3,146 194%
Service ClassSix Months EndedJanuary 31, 2022 (unaudited) $24.41 (0.04) (0.72) (0.76) — — — $23.65 (3.11)%(d) 5.43% 2.78% (0.32)% $117 76%(d)
Year Ended July 31, 2021 $18.96 (0.11) 5.56 5.45 — — — $24.41 28.74% 5.54% 2.78% (0.53)% $56 286%Year Ended July 31, 2020 $20.99 (0.07) (1.86) (1.93) (0.10) — (0.10) $18.96 (9.22)% 6.13% 2.78% (0.37)% $44 132%Year Ended July 31, 2019 $20.24 (0.13) 0.96 0.83 (0.08) — (0.08) $20.99 4.17% 3.16% 2.80% (0.64)% $75 1,449%Year Ended July 31, 2018 $22.78 0.18 (2.26) (2.08) (0.46) — (0.46) $20.24 (9.41)% 3.64% 2.95% 0.74% $91 412%Year Ended July 31, 2017 $26.20 (0.04) (3.38) (3.42) — — — $22.78 (13.09)% 2.78% 2.65% (0.22)% $109 194%
(a) Per share net investment income (loss) has been calculated using the average daily shares method.(b) Annualized for periods less than one year.(c) Portfolio turnover rate is calculated without regard to instruments having a maturity of less than one year from acquisition or derivative instruments (including swap agreements and
futures contracts). The portfolio turnover rate can be high and volatile due to the amount and timing of sales and purchases of fund shares during the period. Portfolio turnover rate iscalculated on the basis of the Fund as a whole without distinguishing between classes of shares issued.
(d) Not annualized for periods less than one year.(e) As described in Note 9, share amounts have been adjusted for 3:1 share split that occurred on November 18, 2019.
See accompanying notes to the financial statements.
Fin
an
cia
l Hig
hlig
hts
:: 26
3
Toppan Merrill - ProFunds Public Semi-Annual Report [Funds] 01-31-2022 ED [AUX] | akiesli | 29-Mar-22 08:44 | 22-1296-2.fc | Sequence: 22CHKSUM Content: 28761 Layout: 10927 Graphics: 0 CLEAN
JOB: 22-1296-2 CYCLE#;BL#: 8; 0 TRIM: 10.75" x 8.25" AS: New York: 212-620-5600COLORS: ~note-color 2, Black, ~note-color 3 GRAPHICS: none V1.5
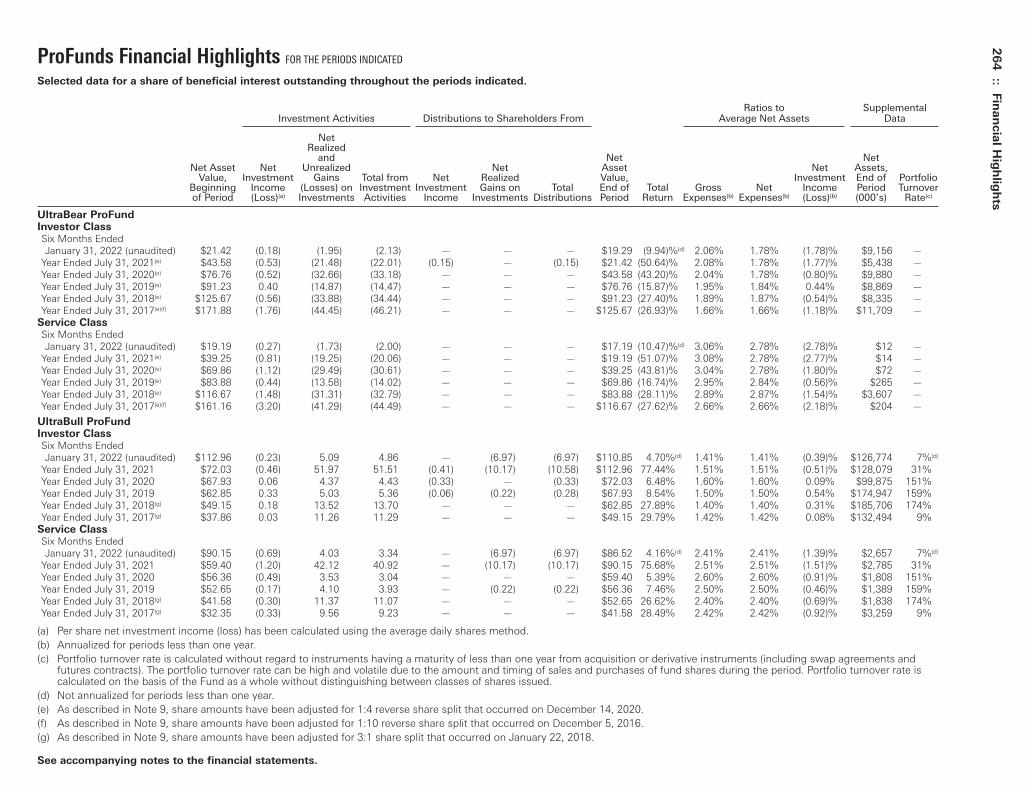
ProFunds Financial Highlights FOR THE PERIODS INDICATED
Selected data for a share of beneficial interest outstanding throughout the periods indicated.
Ratios to SupplementalInvestment Activities Distributions to Shareholders From Average Net Assets Data
Net Realized
and Net Net Net Asset Net Unrealized Net Asset Net Assets,
Value, Investment Gains Total from Net Realized Value, Investment End of PortfolioBeginning Income (Losses) on Investment Investment Gains on Total End of Total Gross Net Income Period Turnoverof Period (Loss)(a) Investments Activities Income Investments Distributions Period Return Expenses(b) Expenses(b) (Loss)(b) (000’s) Rate(c)
UltraBear ProFundInvestor ClassSix Months EndedJanuary 31, 2022 (unaudited) $21.42 (0.18) (1.95) (2.13) — — — $19.29 (9.94)%(d) 2.06% 1.78% (1.78)% $9,156 —
Year Ended July 31, 2021(e) $43.58 (0.53) (21.48) (22.01) (0.15) — (0.15) $21.42 (50.64)% 2.08% 1.78% (1.77)% $5,438 —Year Ended July 31, 2020(e) $76.76 (0.52) (32.66) (33.18) — — — $43.58 (43.20)% 2.04% 1.78% (0.80)% $9,880 —Year Ended July 31, 2019(e) $91.23 0.40 (14.87) (14.47) — — — $76.76 (15.87)% 1.95% 1.84% 0.44% $8,869 —Year Ended July 31, 2018(e) $125.67 (0.56) (33.88) (34.44) — — — $91.23 (27.40)% 1.89% 1.87% (0.54)% $8,335 —Year Ended July 31, 2017(e)(f) $171.88 (1.76) (44.45) (46.21) — — — $125.67 (26.93)% 1.66% 1.66% (1.18)% $11,709 —
Service ClassSix Months EndedJanuary 31, 2022 (unaudited) $19.19 (0.27) (1.73) (2.00) — — — $17.19 (10.47)%(d) 3.06% 2.78% (2.78)% $12 —
Year Ended July 31, 2021(e) $39.25 (0.81) (19.25) (20.06) — — — $19.19 (51.07)% 3.08% 2.78% (2.77)% $14 —Year Ended July 31, 2020(e) $69.86 (1.12) (29.49) (30.61) — — — $39.25 (43.81)% 3.04% 2.78% (1.80)% $72 —Year Ended July 31, 2019(e) $83.88 (0.44) (13.58) (14.02) — — — $69.86 (16.74)% 2.95% 2.84% (0.56)% $265 —Year Ended July 31, 2018(e) $116.67 (1.48) (31.31) (32.79) — — — $83.88 (28.11)% 2.89% 2.87% (1.54)% $3,607 —Year Ended July 31, 2017(e)(f) $161.16 (3.20) (41.29) (44.49) — — — $116.67 (27.62)% 2.66% 2.66% (2.18)% $204 —
UltraBull ProFundInvestor ClassSix Months EndedJanuary 31, 2022 (unaudited) $112.96 (0.23) 5.09 4.86 — (6.97) (6.97) $110.85 4.70%(d) 1.41% 1.41% (0.39)% $126,774 7%(d)
Year Ended July 31, 2021 $72.03 (0.46) 51.97 51.51 (0.41) (10.17) (10.58) $112.96 77.44% 1.51% 1.51% (0.51)% $128,079 31%Year Ended July 31, 2020 $67.93 0.06 4.37 4.43 (0.33) — (0.33) $72.03 6.48% 1.60% 1.60% 0.09% $99,875 151%Year Ended July 31, 2019 $62.85 0.33 5.03 5.36 (0.06) (0.22) (0.28) $67.93 8.54% 1.50% 1.50% 0.54% $174,947 159%Year Ended July 31, 2018(g) $49.15 0.18 13.52 13.70 — — — $62.85 27.89% 1.40% 1.40% 0.31% $185,706 174%Year Ended July 31, 2017(g) $37.86 0.03 11.26 11.29 — — — $49.15 29.79% 1.42% 1.42% 0.08% $132,494 9%
Service ClassSix Months EndedJanuary 31, 2022 (unaudited) $90.15 (0.69) 4.03 3.34 — (6.97) (6.97) $86.52 4.16%(d) 2.41% 2.41% (1.39)% $2,657 7%(d)
Year Ended July 31, 2021 $59.40 (1.20) 42.12 40.92 — (10.17) (10.17) $90.15 75.68% 2.51% 2.51% (1.51)% $2,785 31%Year Ended July 31, 2020 $56.36 (0.49) 3.53 3.04 — — — $59.40 5.39% 2.60% 2.60% (0.91)% $1,808 151%Year Ended July 31, 2019 $52.65 (0.17) 4.10 3.93 — (0.22) (0.22) $56.36 7.46% 2.50% 2.50% (0.46)% $1,389 159%Year Ended July 31, 2018(g) $41.58 (0.30) 11.37 11.07 — — — $52.65 26.62% 2.40% 2.40% (0.69)% $1,838 174%Year Ended July 31, 2017(g) $32.35 (0.33) 9.56 9.23 — — — $41.58 28.49% 2.42% 2.42% (0.92)% $3,259 9%
(a) Per share net investment income (loss) has been calculated using the average daily shares method.(b) Annualized for periods less than one year.(c) Portfolio turnover rate is calculated without regard to instruments having a maturity of less than one year from acquisition or derivative instruments (including swap agreements and
futures contracts). The portfolio turnover rate can be high and volatile due to the amount and timing of sales and purchases of fund shares during the period. Portfolio turnover rate iscalculated on the basis of the Fund as a whole without distinguishing between classes of shares issued.
(d) Not annualized for periods less than one year.(e) As described in Note 9, share amounts have been adjusted for 1:4 reverse share split that occurred on December 14, 2020.(f) As described in Note 9, share amounts have been adjusted for 1:10 reverse share split that occurred on December 5, 2016.(g) As described in Note 9, share amounts have been adjusted for 3:1 share split that occurred on January 22, 2018.
See accompanying notes to the financial statements.
264
:: Fin
an
cia
l Hig
hlig
hts
Toppan Merrill - ProFunds Public Semi-Annual Report [Funds] 01-31-2022 ED [AUX] | akiesli | 29-Mar-22 08:44 | 22-1296-2.fc | Sequence: 23CHKSUM Content: 6549 Layout: 48025 Graphics: 0 CLEAN
JOB: 22-1296-2 CYCLE#;BL#: 8; 0 TRIM: 10.75" x 8.25" AS: New York: 212-620-5600COLORS: ~note-color 2, Black, ~note-color 3 GRAPHICS: none V1.5

ProFunds Financial Highlights FOR THE PERIODS INDICATED
Selected data for a share of beneficial interest outstanding throughout the periods indicated.
Ratios to SupplementalInvestment Activities Distributions to Shareholders From Average Net Assets Data
Net Realized
and Net Net Net Asset Net Unrealized Net Asset Net Assets,
Value, Investment Gains Total from Net Realized Value, Investment End of PortfolioBeginning Income (Losses) on Investment Investment Gains on Total End of Total Gross Net Income Period Turnoverof Period (Loss)(a) Investments Activities Income Investments Distributions Period Return Expenses(b) Expenses(b) (Loss)(b) (000’s) Rate(c)
UltraChina ProFundInvestor ClassSix Months EndedJanuary 31, 2022 (unaudited) $11.80 (0.05) (5.34) (5.39) — — — $6.41 (45.68)%(d) 1.67% 1.67% (1.05)% $19,447 105%(d)
Year Ended July 31, 2021 $17.31 (0.23) (5.28) (5.51) — — — $11.80 (31.83)% 1.67% 1.67% (1.05)% $17,626 255%Year Ended July 31, 2020 $11.42 (0.05) 5.95 5.90 (0.01) — (0.01) $17.31 51.69% 1.79% 1.79% (0.42)% $14,973 314%Year Ended July 31, 2019 $17.79 (0.01) (6.36) (6.37) — — — $11.42 (35.81)% 1.70% 1.70% (0.05)% $21,723 360%Year Ended July 31, 2018 $16.41 (0.01) 1.53 1.52 (0.14) — (0.14) $17.79 9.24% 1.51% 1.51% (0.07)% $27,453 312%Year Ended July 31, 2017 $9.22 (0.08) 7.27 7.19 — — — $16.41 77.98% 1.80% 1.80% (0.68)% $33,637 513%
Service ClassSix Months EndedJanuary 31, 2022 (unaudited) $10.37 (0.09) (4.67) (4.76) — — — $5.61 (45.90)%(d) 2.67% 2.67% (2.05)% $421 105%(d)
Year Ended July 31, 2021 $15.36 (0.42) (4.57) (4.99) — — — $10.37 (32.49)% 2.67% 2.67% (2.05)% $423 255%Year Ended July 31, 2020 $10.23 (0.17) 5.30 5.13 — — — $15.36 50.15% 2.79% 2.79% (1.42)% $2,654 314%Year Ended July 31, 2019 $16.11 (0.12) (5.76) (5.88) — — — $10.23 (36.50)% 2.70% 2.70% (1.05)% $405 360%Year Ended July 31, 2018 $14.97 (0.19) 1.41 1.22 (0.08) — (0.08) $16.11 8.10% 2.51% 2.51% (1.07)% $1,006 312%Year Ended July 31, 2017 $8.49 (0.19) 6.67 6.48 — — — $14.97 76.33% 2.80% 2.80% (1.68)% $2,434 513%
UltraDow 30 ProFundInvestor ClassSix Months EndedJanuary 31, 2022 (unaudited) $66.90 (0.10) 0.93 0.83 — (4.27) (4.27) $63.46 0.94%(d) 1.47% 1.47% (0.29)% $37,193 —(d)(e)
Year Ended July 31, 2021 $39.32 (0.24) 28.83 28.59 — (1.01) (1.01) $66.90 73.58% 1.59% 1.59% (0.45)% $39,210 16%Year Ended July 31, 2020(f) $47.25 0.11 (7.02) (6.91) (0.30) (0.72) (1.02) $39.32 (15.15)% 1.72% 1.72% 0.26% $26,124 6%Year Ended July 31, 2019(f) $43.77 0.30 3.52 3.82 (0.34) — (0.34) $47.25 8.97% 1.62% 1.62% 0.68% $38,924 1%Year Ended July 31, 2018(f) $33.52 0.12 10.90 11.02 (0.01) (0.76) (0.77) $43.77 32.94% 1.51% 1.51% 0.29% $37,484 59%Year Ended July 31, 2017(f) $23.50 0.03 9.99 10.02 — — — $33.52 42.63% 1.71% 1.71% 0.10% $29,931 —(e)
Service ClassSix Months EndedJanuary 31, 2022 (unaudited) $57.42 (0.39) 0.85 0.46 — (4.27) (4.27) $53.61 0.43%(d) 2.47% 2.47% (1.29)% $879 —(d)(e)
Year Ended July 31, 2021 $34.20 (0.71) 24.94 24.23 — (1.01) (1.01) $57.42 71.85% 2.59% 2.59% (1.45)% $1,203 16%Year Ended July 31, 2020(f) $41.33 (0.27) (6.14) (6.41) — (0.72) (0.72) $34.20 (15.95)% 2.72% 2.72% (0.74)% $648 6%Year Ended July 31, 2019(f) $38.31 (0.09) 3.11 3.02 — — — $41.33 7.87% 2.62% 2.62% (0.32)% $732 1%Year Ended July 31, 2018(f) $29.70 (0.24) 9.61 9.37 — (0.76) (0.76) $38.31 31.62% 2.51% 2.51% (0.71)% $1,584 59%Year Ended July 31, 2017(f) $21.02 (0.23) 8.91 8.68 — — — $29.70 41.27% 2.71% 2.71% (0.90)% $1,291 —(e)
(a) Per share net investment income (loss) has been calculated using the average daily shares method.(b) Annualized for periods less than one year.(c) Portfolio turnover rate is calculated without regard to instruments having a maturity of less than one year from acquisition or derivative instruments (including swap agreements and
futures contracts). The portfolio turnover rate can be high and volatile due to the amount and timing of sales and purchases of fund shares during the period. Portfolio turnover rate iscalculated on the basis of the Fund as a whole without distinguishing between classes of shares issued.
(d) Not annualized for periods less than one year.(e) Amount is less than 0.5%.(f) As described in Note 9, share amounts have been adjusted for 3:1 share split that occurred on November 18, 2019.
See accompanying notes to the financial statements.
Fin
an
cia
l Hig
hlig
hts
:: 26
5
Toppan Merrill - ProFunds Public Semi-Annual Report [Funds] 01-31-2022 ED [AUX] | akiesli | 29-Mar-22 08:44 | 22-1296-2.fc | Sequence: 24CHKSUM Content: 22258 Layout: 9179 Graphics: 0 CLEAN
JOB: 22-1296-2 CYCLE#;BL#: 8; 0 TRIM: 10.75" x 8.25" AS: New York: 212-620-5600COLORS: ~note-color 2, Black, ~note-color 3 GRAPHICS: none V1.5
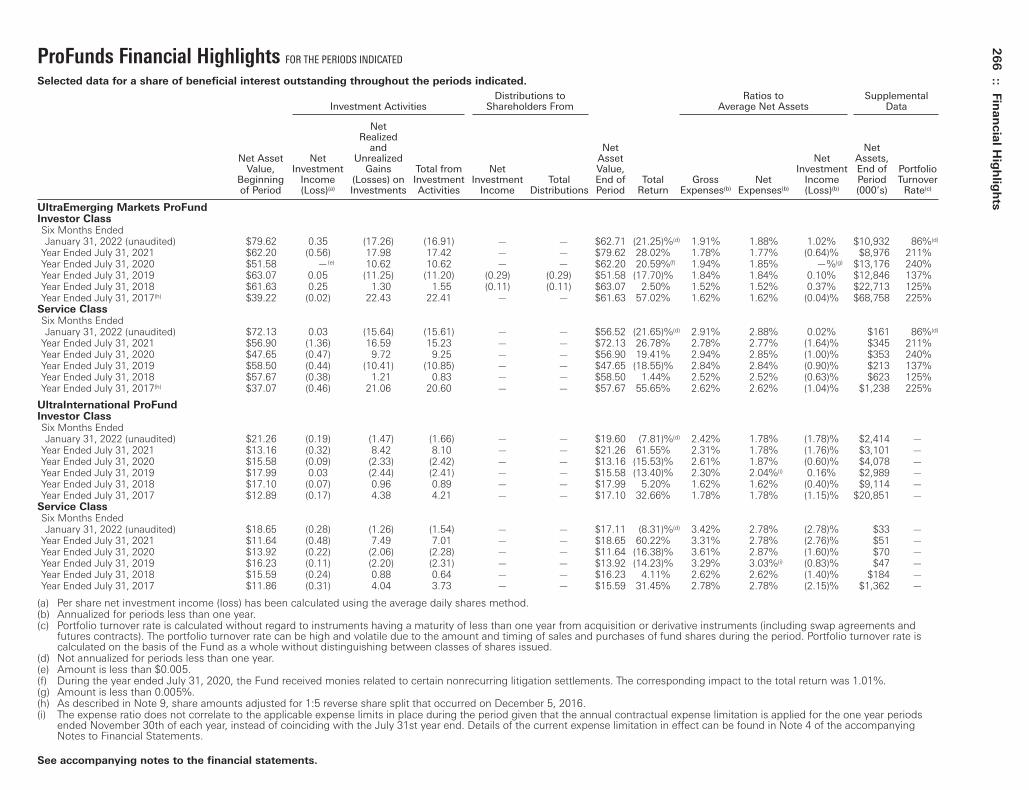
ProFunds Financial Highlights FOR THE PERIODS INDICATED
Selected data for a share of beneficial interest outstanding throughout the periods indicated.
Distributions to Ratios to SupplementalInvestment Activities Shareholders From Average Net Assets Data
NetRealized
and Net NetNet Asset Net Unrealized Asset Net Assets,
Value, Investment Gains Total from Net Value, Investment End of PortfolioBeginning Income (Losses) on Investment Investment Total End of Total Gross Net Income Period Turnoverof Period (Loss)(a) Investments Activities Income Distributions Period Return Expenses(b) Expenses(b) (Loss)(b) (000’s) Rate(c)
UltraEmerging Markets ProFundInvestor ClassSix Months EndedJanuary 31, 2022 (unaudited) $79.62 0.35 (17.26) (16.91) — — $62.71 (21.25)%(d) 1.91% 1.88% 1.02% $10,932 86%(d)
Year Ended July 31, 2021 $62.20 (0.56) 17.98 17.42 — — $79.62 28.02% 1.78% 1.77% (0.64)% $8,976 211%Year Ended July 31, 2020 $51.58 —(e) 10.62 10.62 — — $62.20 20.59%(f) 1.94% 1.85% —%(g) $13,176 240%Year Ended July 31, 2019 $63.07 0.05 (11.25) (11.20) (0.29) (0.29) $51.58 (17.70)% 1.84% 1.84% 0.10% $12,846 137%Year Ended July 31, 2018 $61.63 0.25 1.30 1.55 (0.11) (0.11) $63.07 2.50% 1.52% 1.52% 0.37% $22,713 125%Year Ended July 31, 2017(h) $39.22 (0.02) 22.43 22.41 — — $61.63 57.02% 1.62% 1.62% (0.04)% $68,758 225%
Service ClassSix Months EndedJanuary 31, 2022 (unaudited) $72.13 0.03 (15.64) (15.61) — — $56.52 (21.65)%(d) 2.91% 2.88% 0.02% $161 86%(d)
Year Ended July 31, 2021 $56.90 (1.36) 16.59 15.23 — — $72.13 26.78% 2.78% 2.77% (1.64)% $345 211%Year Ended July 31, 2020 $47.65 (0.47) 9.72 9.25 — — $56.90 19.41% 2.94% 2.85% (1.00)% $353 240%Year Ended July 31, 2019 $58.50 (0.44) (10.41) (10.85) — — $47.65 (18.55)% 2.84% 2.84% (0.90)% $213 137%Year Ended July 31, 2018 $57.67 (0.38) 1.21 0.83 — — $58.50 1.44% 2.52% 2.52% (0.63)% $623 125%Year Ended July 31, 2017(h) $37.07 (0.46) 21.06 20.60 — — $57.67 55.65% 2.62% 2.62% (1.04)% $1,238 225%
UltraInternational ProFundInvestor ClassSix Months EndedJanuary 31, 2022 (unaudited) $21.26 (0.19) (1.47) (1.66) — — $19.60 (7.81)%(d) 2.42% 1.78% (1.78)% $2,414 —
Year Ended July 31, 2021 $13.16 (0.32) 8.42 8.10 — — $21.26 61.55% 2.31% 1.78% (1.76)% $3,101 —Year Ended July 31, 2020 $15.58 (0.09) (2.33) (2.42) — — $13.16 (15.53)% 2.61% 1.87% (0.60)% $4,078 —Year Ended July 31, 2019 $17.99 0.03 (2.44) (2.41) — — $15.58 (13.40)% 2.30% 2.04%(i) 0.16% $2,989 —Year Ended July 31, 2018 $17.10 (0.07) 0.96 0.89 — — $17.99 5.20% 1.62% 1.62% (0.40)% $9,114 —Year Ended July 31, 2017 $12.89 (0.17) 4.38 4.21 — — $17.10 32.66% 1.78% 1.78% (1.15)% $20,851 —
Service ClassSix Months EndedJanuary 31, 2022 (unaudited) $18.65 (0.28) (1.26) (1.54) — — $17.11 (8.31)%(d) 3.42% 2.78% (2.78)% $33 —
Year Ended July 31, 2021 $11.64 (0.48) 7.49 7.01 — — $18.65 60.22% 3.31% 2.78% (2.76)% $51 —Year Ended July 31, 2020 $13.92 (0.22) (2.06) (2.28) — — $11.64 (16.38)% 3.61% 2.87% (1.60)% $70 —Year Ended July 31, 2019 $16.23 (0.11) (2.20) (2.31) — — $13.92 (14.23)% 3.29% 3.03%(i) (0.83)% $47 —Year Ended July 31, 2018 $15.59 (0.24) 0.88 0.64 — — $16.23 4.11% 2.62% 2.62% (1.40)% $184 —Year Ended July 31, 2017 $11.86 (0.31) 4.04 3.73 — — $15.59 31.45% 2.78% 2.78% (2.15)% $1,362 —
(a) Per share net investment income (loss) has been calculated using the average daily shares method.(b) Annualized for periods less than one year.(c) Portfolio turnover rate is calculated without regard to instruments having a maturity of less than one year from acquisition or derivative instruments (including swap agreements and
futures contracts). The portfolio turnover rate can be high and volatile due to the amount and timing of sales and purchases of fund shares during the period. Portfolio turnover rate iscalculated on the basis of the Fund as a whole without distinguishing between classes of shares issued.
(d) Not annualized for periods less than one year.(e) Amount is less than $0.005.(f) During the year ended July 31, 2020, the Fund received monies related to certain nonrecurring litigation settlements. The corresponding impact to the total return was 1.01%.(g) Amount is less than 0.005%.(h) As described in Note 9, share amounts adjusted for 1:5 reverse share split that occurred on December 5, 2016.(i) The expense ratio does not correlate to the applicable expense limits in place during the period given that the annual contractual expense limitation is applied for the one year periods
ended November 30th of each year, instead of coinciding with the July 31st year end. Details of the current expense limitation in effect can be found in Note 4 of the accompanyingNotes to Financial Statements.
See accompanying notes to the financial statements.
266
:: Fin
an
cia
l Hig
hlig
hts
Toppan Merrill - ProFunds Public Semi-Annual Report [Funds] 01-31-2022 ED [AUX] | akiesli | 29-Mar-22 08:44 | 22-1296-2.fc | Sequence: 25CHKSUM Content: 40609 Layout: 49827 Graphics: 0 CLEAN
JOB: 22-1296-2 CYCLE#;BL#: 8; 0 TRIM: 10.75" x 8.25" AS: New York: 212-620-5600COLORS: ~note-color 2, Black, ~note-color 3 GRAPHICS: none V1.5

ProFunds Financial Highlights FOR THE PERIODS INDICATED
Selected data for a share of beneficial interest outstanding throughout the periods indicated.
Ratios to SupplementalInvestment Activities Distributions to Shareholders From Average Net Assets Data
Net Realized
and Net Net Net Asset Net Unrealized Net Asset Net Assets,
Value, Investment Gains Total from Net Realized Value, Investment End of PortfolioBeginning Income (Losses) on Investment Investment Gains on Total End of Total Gross Net Income Period Turnoverof Period (Loss)(a) Investments Activities Income Investments Distributions Period Return Expenses(b) Expenses(b) (Loss)(b) (000’s) Rate(c)
UltraJapan ProFundInvestor ClassSix Months EndedJanuary 31, 2022 (unaudited) $31.75 (0.28) 0.14(d) (0.14) — (4.34) (4.34) $27.27 (2.83)%(e) 1.77% 1.77% (1.77)% $12,849 —
Year Ended July 31, 2021 $20.81 (0.56) 11.50 10.94 — — — $31.75 52.57% 1.80% 1.78% (1.77)% $14,600 —Year Ended July 31, 2020 $21.87 (0.17) (0.89) (1.06) — — — $20.81 (4.85)% 1.94% 1.86% (0.77)% $10,556 —Year Ended July 31, 2019 $24.93 0.04 (2.61) (2.57) — (0.49) (0.49) $21.87 (10.75)% 1.83% 1.83% 0.16% $13,423 —Year Ended July 31, 2018 $19.76 (0.11) 5.28 5.17 — — — $24.93 26.16% 1.66% 1.66% (0.45)% $20,993 —Year Ended July 31, 2017 $13.62 (0.22) 6.36 6.14 — — — $19.76 44.97% 1.70% 1.70% (1.26)% $19,565 —
Service ClassSix Months EndedJanuary 31, 2022 (unaudited) $26.53 (0.41) 0.29(d) (0.12) — (4.34) (4.34) $22.07 (3.31)%(e) 2.77% 2.77% (2.77)% $122 —
Year Ended July 31, 2021 $17.56 (0.82) 9.79 8.97 — — — $26.53 51.08% 2.80% 2.78% (2.77)% $143 —Year Ended July 31, 2020 $18.64 (0.36) (0.72) (1.08) — — — $17.56 (5.79)% 2.94% 2.86% (1.77)% $109 —Year Ended July 31, 2019 $21.52 (0.16) (2.23) (2.39) — (0.49) (0.49) $18.64 (11.63)% 2.83% 2.83% (0.84)% $258 —Year Ended July 31, 2018 $17.23 (0.31) 4.60 4.29 — — — $21.52 24.90% 2.66% 2.66% (1.45)% $237 —Year Ended July 31, 2017 $11.99 (0.37) 5.61 5.24 — — — $17.23 43.70% 2.70% 2.70% (2.26)% $243 —
UltraLatin America ProFundInvestor ClassSix Months EndedJanuary 31, 2022 (unaudited) $19.08 0.62 (2.91) (2.29) (0.83) — (0.83) $15.96 (11.33)%(e) 1.66% 1.66% 7.87% $14,020 61%(e)
Year Ended July 31, 2021 $10.61 0.18 8.38 8.56 (0.09) — (0.09) $19.08 80.78% 1.72% 1.72% 1.22% $15,939 163%Year Ended July 31, 2020 $31.86 0.28 (21.10) (20.82) (0.43) — (0.43) $10.61 (66.27)%(f) 1.71% 1.71% 1.46% $15,724 237%Year Ended July 31, 2019 $33.55 0.44 (1.66) (1.22) (0.47) — (0.47) $31.86 (3.51)% 1.69% 1.69% 1.34% $31,560 132%Year Ended July 31, 2018 $35.83 0.28 (2.47) (2.19) (0.09) — (0.09) $33.55 (6.15)% 1.53% 1.53% 0.72% $37,611 315%Year Ended July 31, 2017 $26.71 0.10 9.10 9.20 (0.08) — (0.08) $35.83 34.56% 1.67% 1.67% 0.31% $32,233 228%
Service ClassSix Months EndedJanuary 31, 2022 (unaudited) $18.34 0.54 (2.80) (2.26) (0.57) — (0.57) $15.51 (11.82)%(e) 2.66% 2.66% 6.87% $86 61%(e)
Year Ended July 31, 2021 $10.26 0.04 8.06 8.10 (0.02) — (0.02) $18.34 78.96% 2.72% 2.72% 0.22% $148 163%Year Ended July 31, 2020 $30.71 0.12 (20.57) (20.45) — — — $10.26 (66.59)%(f) 2.70% 2.70% 0.47% $98 237%Year Ended July 31, 2019 $32.16 0.13 (1.58) (1.45) — — — $30.71 (4.51)% 2.69% 2.69% 0.34% $81 132%Year Ended July 31, 2018 $34.61 (0.10) (2.35) (2.45) — — — $32.16 (7.08)% 2.53% 2.53% (0.28)% $436 315%Year Ended July 31, 2017 $25.98 (0.21) 8.84 8.63 — — — $34.61 33.17% 2.67% 2.67% (0.69)% $419 228%
(a) Per share net investment income (loss) has been calculated using the average daily shares method.(b) Annualized for periods less than one year.(c) Portfolio turnover rate is calculated without regard to instruments having a maturity of less than one year from acquisition or derivative instruments (including swap agreements and
futures contracts). The portfolio turnover rate can be high and volatile due to the amount and timing of sales and purchases of fund shares during the period. Portfolio turnover rate iscalculated on the basis of the Fund as a whole without distinguishing between classes of shares issued.
(d) The amount shown for a share outstanding throughout the period does not accord with the change in aggregate gains and losses in the portfolio of securities during the period becauseof the timing of sales and purchases of fund shares in relation to fluctuating market values during the period.
(e) Not annualized for periods less than one year.(f) During the year ended July 31, 2020, the Fund received monies related to certain nonrecurring litigation settlements. The corresponding impact to the total return was 0.68%.
See accompanying notes to the financial statements.
Fin
an
cia
l Hig
hlig
hts
:: 26
7
Toppan Merrill - ProFunds Public Semi-Annual Report [Funds] 01-31-2022 ED [AUX] | akiesli | 29-Mar-22 08:44 | 22-1296-2.fc | Sequence: 26CHKSUM Content: 39923 Layout: 40644 Graphics: 0 CLEAN
JOB: 22-1296-2 CYCLE#;BL#: 8; 0 TRIM: 10.75" x 8.25" AS: New York: 212-620-5600COLORS: ~note-color 2, Black, ~note-color 3 GRAPHICS: none V1.5
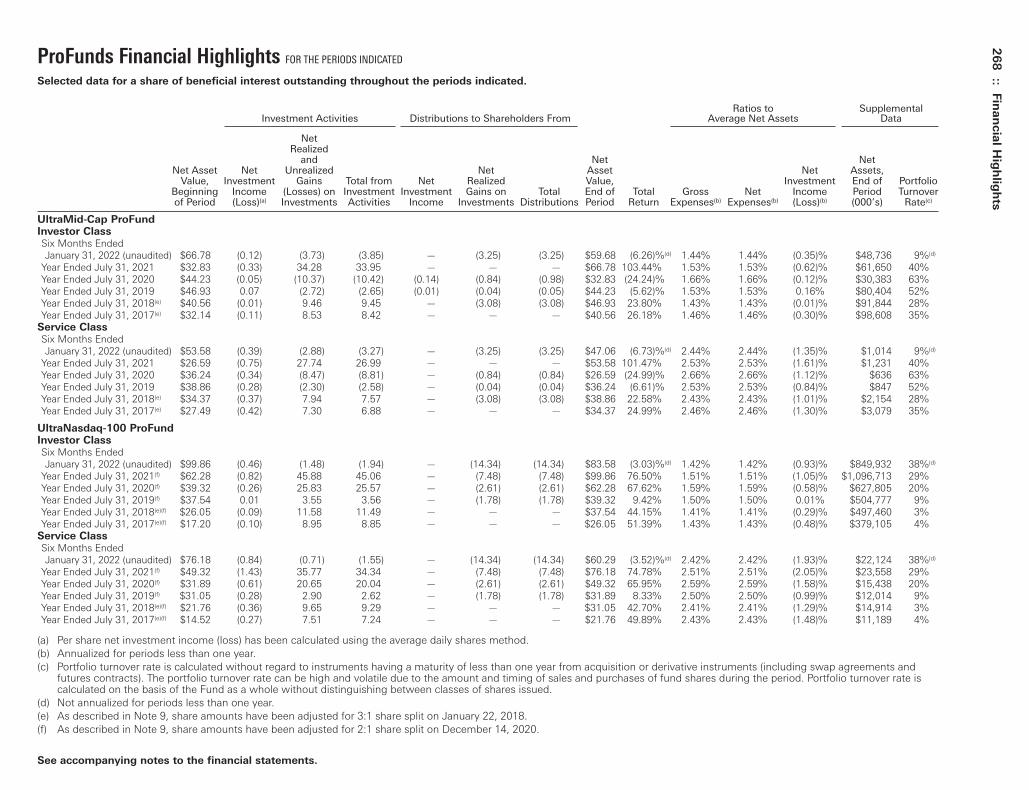
ProFunds Financial Highlights FOR THE PERIODS INDICATED
Selected data for a share of beneficial interest outstanding throughout the periods indicated.
Ratios to SupplementalInvestment Activities Distributions to Shareholders From Average Net Assets Data
Net Realized
and Net Net Net Asset Net Unrealized Net Asset Net Assets,
Value, Investment Gains Total from Net Realized Value, Investment End of PortfolioBeginning Income (Losses) on Investment Investment Gains on Total End of Total Gross Net Income Period Turnoverof Period (Loss)(a) Investments Activities Income Investments Distributions Period Return Expenses(b) Expenses(b) (Loss)(b) (000’s) Rate(c)
UltraMid-Cap ProFundInvestor ClassSix Months EndedJanuary 31, 2022 (unaudited) $66.78 (0.12) (3.73) (3.85) — (3.25) (3.25) $59.68 (6.26)%(d) 1.44% 1.44% (0.35)% $48,736 9%(d)
Year Ended July 31, 2021 $32.83 (0.33) 34.28 33.95 — — — $66.78 103.44% 1.53% 1.53% (0.62)% $61,650 40%Year Ended July 31, 2020 $44.23 (0.05) (10.37) (10.42) (0.14) (0.84) (0.98) $32.83 (24.24)% 1.66% 1.66% (0.12)% $30,383 63%Year Ended July 31, 2019 $46.93 0.07 (2.72) (2.65) (0.01) (0.04) (0.05) $44.23 (5.62)% 1.53% 1.53% 0.16% $80,404 52%Year Ended July 31, 2018(e) $40.56 (0.01) 9.46 9.45 — (3.08) (3.08) $46.93 23.80% 1.43% 1.43% (0.01)% $91,844 28%Year Ended July 31, 2017(e) $32.14 (0.11) 8.53 8.42 — — — $40.56 26.18% 1.46% 1.46% (0.30)% $98,608 35%
Service ClassSix Months EndedJanuary 31, 2022 (unaudited) $53.58 (0.39) (2.88) (3.27) — (3.25) (3.25) $47.06 (6.73)%(d) 2.44% 2.44% (1.35)% $1,014 9%(d)
Year Ended July 31, 2021 $26.59 (0.75) 27.74 26.99 — — — $53.58 101.47% 2.53% 2.53% (1.61)% $1,231 40%Year Ended July 31, 2020 $36.24 (0.34) (8.47) (8.81) — (0.84) (0.84) $26.59 (24.99)% 2.66% 2.66% (1.12)% $636 63%Year Ended July 31, 2019 $38.86 (0.28) (2.30) (2.58) — (0.04) (0.04) $36.24 (6.61)% 2.53% 2.53% (0.84)% $847 52%Year Ended July 31, 2018(e) $34.37 (0.37) 7.94 7.57 — (3.08) (3.08) $38.86 22.58% 2.43% 2.43% (1.01)% $2,154 28%Year Ended July 31, 2017(e) $27.49 (0.42) 7.30 6.88 — — — $34.37 24.99% 2.46% 2.46% (1.30)% $3,079 35%
UltraNasdaq-100 ProFundInvestor ClassSix Months EndedJanuary 31, 2022 (unaudited) $99.86 (0.46) (1.48) (1.94) — (14.34) (14.34) $83.58 (3.03)%(d) 1.42% 1.42% (0.93)% $849,932 38%(d)
Year Ended July 31, 2021(f) $62.28 (0.82) 45.88 45.06 — (7.48) (7.48) $99.86 76.50% 1.51% 1.51% (1.05)% $1,096,713 29%Year Ended July 31, 2020(f) $39.32 (0.26) 25.83 25.57 — (2.61) (2.61) $62.28 67.62% 1.59% 1.59% (0.58)% $627,805 20%Year Ended July 31, 2019(f) $37.54 0.01 3.55 3.56 — (1.78) (1.78) $39.32 9.42% 1.50% 1.50% 0.01% $504,777 9%Year Ended July 31, 2018(e)(f) $26.05 (0.09) 11.58 11.49 — — — $37.54 44.15% 1.41% 1.41% (0.29)% $497,460 3%Year Ended July 31, 2017(e)(f) $17.20 (0.10) 8.95 8.85 — — — $26.05 51.39% 1.43% 1.43% (0.48)% $379,105 4%
Service ClassSix Months EndedJanuary 31, 2022 (unaudited) $76.18 (0.84) (0.71) (1.55) — (14.34) (14.34) $60.29 (3.52)%(d) 2.42% 2.42% (1.93)% $22,124 38%(d)
Year Ended July 31, 2021(f) $49.32 (1.43) 35.77 34.34 — (7.48) (7.48) $76.18 74.78% 2.51% 2.51% (2.05)% $23,558 29%Year Ended July 31, 2020(f) $31.89 (0.61) 20.65 20.04 — (2.61) (2.61) $49.32 65.95% 2.59% 2.59% (1.58)% $15,438 20%Year Ended July 31, 2019(f) $31.05 (0.28) 2.90 2.62 — (1.78) (1.78) $31.89 8.33% 2.50% 2.50% (0.99)% $12,014 9%Year Ended July 31, 2018(e)(f) $21.76 (0.36) 9.65 9.29 — — — $31.05 42.70% 2.41% 2.41% (1.29)% $14,914 3%Year Ended July 31, 2017(e)(f) $14.52 (0.27) 7.51 7.24 — — — $21.76 49.89% 2.43% 2.43% (1.48)% $11,189 4%
(a) Per share net investment income (loss) has been calculated using the average daily shares method.(b) Annualized for periods less than one year.(c) Portfolio turnover rate is calculated without regard to instruments having a maturity of less than one year from acquisition or derivative instruments (including swap agreements and
futures contracts). The portfolio turnover rate can be high and volatile due to the amount and timing of sales and purchases of fund shares during the period. Portfolio turnover rate iscalculated on the basis of the Fund as a whole without distinguishing between classes of shares issued.
(d) Not annualized for periods less than one year.(e) As described in Note 9, share amounts have been adjusted for 3:1 share split on January 22, 2018.(f) As described in Note 9, share amounts have been adjusted for 2:1 share split on December 14, 2020.
See accompanying notes to the financial statements.
268
:: Fin
an
cia
l Hig
hlig
hts
Toppan Merrill - ProFunds Public Semi-Annual Report [Funds] 01-31-2022 ED [AUX] | akiesli | 29-Mar-22 08:44 | 22-1296-2.fc | Sequence: 27CHKSUM Content: 9842 Layout: 39976 Graphics: 0 CLEAN
JOB: 22-1296-2 CYCLE#;BL#: 8; 0 TRIM: 10.75" x 8.25" AS: New York: 212-620-5600COLORS: ~note-color 2, Black, ~note-color 3 GRAPHICS: none V1.5
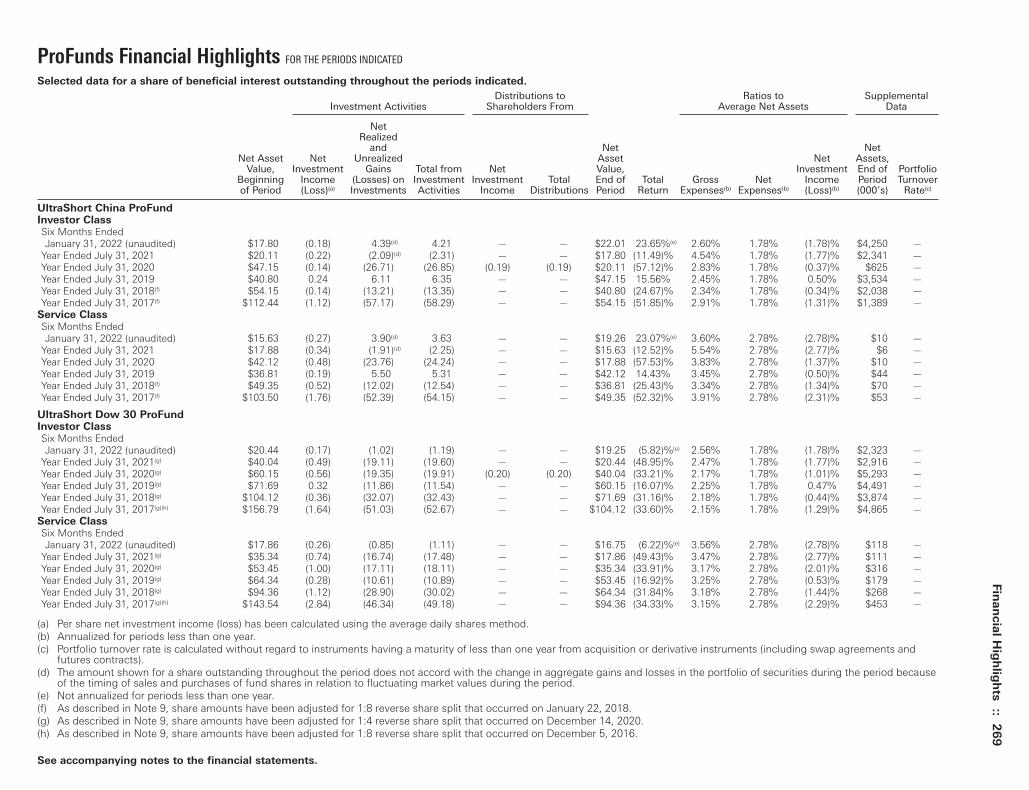
ProFunds Financial Highlights FOR THE PERIODS INDICATED
Selected data for a share of beneficial interest outstanding throughout the periods indicated.
Distributions to Ratios to SupplementalInvestment Activities Shareholders From Average Net Assets Data
NetRealized
and Net NetNet Asset Net Unrealized Asset Net Assets,
Value, Investment Gains Total from Net Value, Investment End of PortfolioBeginning Income (Losses) on Investment Investment Total End of Total Gross Net Income Period Turnoverof Period (Loss)(a) Investments Activities Income Distributions Period Return Expenses(b) Expenses(b) (Loss)(b) (000’s) Rate(c)
UltraShort China ProFundInvestor ClassSix Months EndedJanuary 31, 2022 (unaudited) $17.80 (0.18) 4.39(d) 4.21 — — $22.01 23.65%(e) 2.60% 1.78% (1.78)% $4,250 —
Year Ended July 31, 2021 $20.11 (0.22) (2.09)(d) (2.31) — — $17.80 (11.49)% 4.54% 1.78% (1.77)% $2,341 —Year Ended July 31, 2020 $47.15 (0.14) (26.71) (26.85) (0.19) (0.19) $20.11 (57.12)% 2.83% 1.78% (0.37)% $625 —Year Ended July 31, 2019 $40.80 0.24 6.11 6.35 — — $47.15 15.56% 2.45% 1.78% 0.50% $3,534 —Year Ended July 31, 2018(f) $54.15 (0.14) (13.21) (13.35) — — $40.80 (24.67)% 2.34% 1.78% (0.34)% $2,038 —Year Ended July 31, 2017(f) $112.44 (1.12) (57.17) (58.29) — — $54.15 (51.85)% 2.91% 1.78% (1.31)% $1,389 —
Service ClassSix Months EndedJanuary 31, 2022 (unaudited) $15.63 (0.27) 3.90(d) 3.63 — — $19.26 23.07%(e) 3.60% 2.78% (2.78)% $10 —
Year Ended July 31, 2021 $17.88 (0.34) (1.91)(d) (2.25) — — $15.63 (12.52)% 5.54% 2.78% (2.77)% $6 —Year Ended July 31, 2020 $42.12 (0.48) (23.76) (24.24) — — $17.88 (57.53)% 3.83% 2.78% (1.37)% $10 —Year Ended July 31, 2019 $36.81 (0.19) 5.50 5.31 — — $42.12 14.43% 3.45% 2.78% (0.50)% $44 —Year Ended July 31, 2018(f) $49.35 (0.52) (12.02) (12.54) — — $36.81 (25.43)% 3.34% 2.78% (1.34)% $70 —Year Ended July 31, 2017(f) $103.50 (1.76) (52.39) (54.15) — — $49.35 (52.32)% 3.91% 2.78% (2.31)% $53 —
UltraShort Dow 30 ProFundInvestor ClassSix Months EndedJanuary 31, 2022 (unaudited) $20.44 (0.17) (1.02) (1.19) — — $19.25 (5.82)%(e) 2.56% 1.78% (1.78)% $2,323 —
Year Ended July 31, 2021(g) $40.04 (0.49) (19.11) (19.60) — — $20.44 (48.95)% 2.47% 1.78% (1.77)% $2,916 —Year Ended July 31, 2020(g) $60.15 (0.56) (19.35) (19.91) (0.20) (0.20) $40.04 (33.21)% 2.17% 1.78% (1.01)% $5,293 —Year Ended July 31, 2019(g) $71.69 0.32 (11.86) (11.54) — — $60.15 (16.07)% 2.25% 1.78% 0.47% $4,491 —Year Ended July 31, 2018(g) $104.12 (0.36) (32.07) (32.43) — — $71.69 (31.16)% 2.18% 1.78% (0.44)% $3,874 —Year Ended July 31, 2017(g)(h) $156.79 (1.64) (51.03) (52.67) — — $104.12 (33.60)% 2.15% 1.78% (1.29)% $4,865 —
Service ClassSix Months EndedJanuary 31, 2022 (unaudited) $17.86 (0.26) (0.85) (1.11) — — $16.75 (6.22)%(e) 3.56% 2.78% (2.78)% $118 —
Year Ended July 31, 2021(g) $35.34 (0.74) (16.74) (17.48) — — $17.86 (49.43)% 3.47% 2.78% (2.77)% $111 —Year Ended July 31, 2020(g) $53.45 (1.00) (17.11) (18.11) — — $35.34 (33.91)% 3.17% 2.78% (2.01)% $316 —Year Ended July 31, 2019(g) $64.34 (0.28) (10.61) (10.89) — — $53.45 (16.92)% 3.25% 2.78% (0.53)% $179 —Year Ended July 31, 2018(g) $94.36 (1.12) (28.90) (30.02) — — $64.34 (31.84)% 3.18% 2.78% (1.44)% $268 —Year Ended July 31, 2017(g)(h) $143.54 (2.84) (46.34) (49.18) — — $94.36 (34.33)% 3.15% 2.78% (2.29)% $453 —
(a) Per share net investment income (loss) has been calculated using the average daily shares method.(b) Annualized for periods less than one year.(c) Portfolio turnover rate is calculated without regard to instruments having a maturity of less than one year from acquisition or derivative instruments (including swap agreements and
futures contracts).(d) The amount shown for a share outstanding throughout the period does not accord with the change in aggregate gains and losses in the portfolio of securities during the period because
of the timing of sales and purchases of fund shares in relation to fluctuating market values during the period.(e) Not annualized for periods less than one year.(f) As described in Note 9, share amounts have been adjusted for 1:8 reverse share split that occurred on January 22, 2018.(g) As described in Note 9, share amounts have been adjusted for 1:4 reverse share split that occurred on December 14, 2020.(h) As described in Note 9, share amounts have been adjusted for 1:8 reverse share split that occurred on December 5, 2016.
See accompanying notes to the financial statements.
Fin
an
cia
l Hig
hlig
hts
:: 26
9
Toppan Merrill - ProFunds Public Semi-Annual Report [Funds] 01-31-2022 ED [AUX] | akiesli | 29-Mar-22 08:44 | 22-1296-2.fc | Sequence: 28CHKSUM Content: 35821 Layout: 1710 Graphics: 0 CLEAN
JOB: 22-1296-2 CYCLE#;BL#: 8; 0 TRIM: 10.75" x 8.25" AS: New York: 212-620-5600COLORS: ~note-color 2, Black, ~note-color 3 GRAPHICS: none V1.5
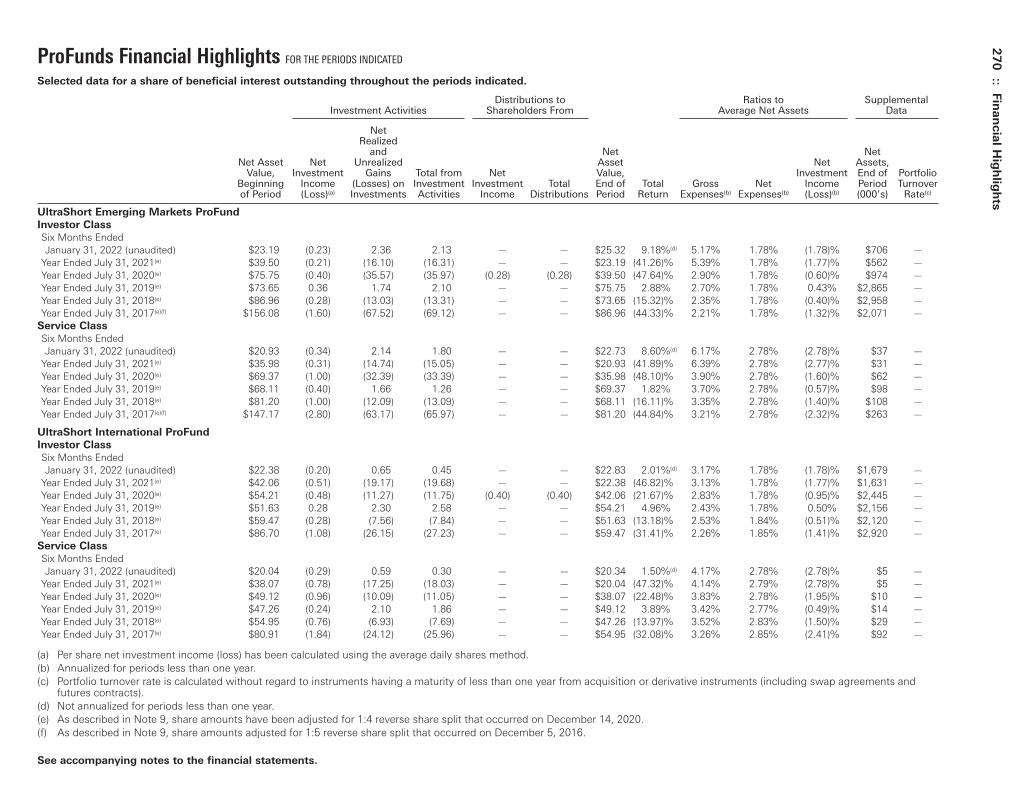
ProFunds Financial Highlights FOR THE PERIODS INDICATED
Selected data for a share of beneficial interest outstanding throughout the periods indicated.
Distributions to Ratios to SupplementalInvestment Activities Shareholders From Average Net Assets Data
NetRealized
and Net NetNet Asset Net Unrealized Asset Net Assets,
Value, Investment Gains Total from Net Value, Investment End of PortfolioBeginning Income (Losses) on Investment Investment Total End of Total Gross Net Income Period Turnoverof Period (Loss)(a) Investments Activities Income Distributions Period Return Expenses(b) Expenses(b) (Loss)(b) (000’s) Rate(c)
UltraShort Emerging Markets ProFund
Investor Class
Six Months EndedJanuary 31, 2022 (unaudited) $23.19 (0.23) 2.36 2.13 — — $25.32 9.18%(d) 5.17% 1.78% (1.78)% $706 —
Year Ended July 31, 2021(e) $39.50 (0.21) (16.10) (16.31) — — $23.19 (41.26)% 5.39% 1.78% (1.77)% $562 —Year Ended July 31, 2020(e) $75.75 (0.40) (35.57) (35.97) (0.28) (0.28) $39.50 (47.64)% 2.90% 1.78% (0.60)% $974 —Year Ended July 31, 2019(e) $73.65 0.36 1.74 2.10 — — $75.75 2.88% 2.70% 1.78% 0.43% $2,865 —Year Ended July 31, 2018(e) $86.96 (0.28) (13.03) (13.31) — — $73.65 (15.32)% 2.35% 1.78% (0.40)% $2,958 —Year Ended July 31, 2017(e)(f) $156.08 (1.60) (67.52) (69.12) — — $86.96 (44.33)% 2.21% 1.78% (1.32)% $2,071 —
Service Class
Six Months EndedJanuary 31, 2022 (unaudited) $20.93 (0.34) 2.14 1.80 — — $22.73 8.60%(d) 6.17% 2.78% (2.78)% $37 —
Year Ended July 31, 2021(e) $35.98 (0.31) (14.74) (15.05) — — $20.93 (41.89)% 6.39% 2.78% (2.77)% $31 —Year Ended July 31, 2020(e) $69.37 (1.00) (32.39) (33.39) — — $35.98 (48.10)% 3.90% 2.78% (1.60)% $62 —Year Ended July 31, 2019(e) $68.11 (0.40) 1.66 1.26 — — $69.37 1.82% 3.70% 2.78% (0.57)% $98 —Year Ended July 31, 2018(e) $81.20 (1.00) (12.09) (13.09) — — $68.11 (16.11)% 3.35% 2.78% (1.40)% $108 —Year Ended July 31, 2017(e)(f) $147.17 (2.80) (63.17) (65.97) — — $81.20 (44.84)% 3.21% 2.78% (2.32)% $263 —
UltraShort International ProFund
Investor Class
Six Months EndedJanuary 31, 2022 (unaudited) $22.38 (0.20) 0.65 0.45 — — $22.83 2.01%(d) 3.17% 1.78% (1.78)% $1,679 —
Year Ended July 31, 2021(e) $42.06 (0.51) (19.17) (19.68) — — $22.38 (46.82)% 3.13% 1.78% (1.77)% $1,631 —Year Ended July 31, 2020(e) $54.21 (0.48) (11.27) (11.75) (0.40) (0.40) $42.06 (21.67)% 2.83% 1.78% (0.95)% $2,445 —Year Ended July 31, 2019(e) $51.63 0.28 2.30 2.58 — — $54.21 4.96% 2.43% 1.78% 0.50% $2,156 —Year Ended July 31, 2018(e) $59.47 (0.28) (7.56) (7.84) — — $51.63 (13.18)% 2.53% 1.84% (0.51)% $2,120 —Year Ended July 31, 2017(e) $86.70 (1.08) (26.15) (27.23) — — $59.47 (31.41)% 2.26% 1.85% (1.41)% $2,920 —
Service Class
Six Months EndedJanuary 31, 2022 (unaudited) $20.04 (0.29) 0.59 0.30 — — $20.34 1.50%(d) 4.17% 2.78% (2.78)% $5 —
Year Ended July 31, 2021(e) $38.07 (0.78) (17.25) (18.03) — — $20.04 (47.32)% 4.14% 2.79% (2.78)% $5 —Year Ended July 31, 2020(e) $49.12 (0.96) (10.09) (11.05) — — $38.07 (22.48)% 3.83% 2.78% (1.95)% $10 —Year Ended July 31, 2019(e) $47.26 (0.24) 2.10 1.86 — — $49.12 3.89% 3.42% 2.77% (0.49)% $14 —Year Ended July 31, 2018(e) $54.95 (0.76) (6.93) (7.69) — — $47.26 (13.97)% 3.52% 2.83% (1.50)% $29 —Year Ended July 31, 2017(e) $80.91 (1.84) (24.12) (25.96) — — $54.95 (32.08)% 3.26% 2.85% (2.41)% $92 —
(a) Per share net investment income (loss) has been calculated using the average daily shares method.(b) Annualized for periods less than one year.(c) Portfolio turnover rate is calculated without regard to instruments having a maturity of less than one year from acquisition or derivative instruments (including swap agreements and
futures contracts).(d) Not annualized for periods less than one year.(e) As described in Note 9, share amounts have been adjusted for 1:4 reverse share split that occurred on December 14, 2020.(f) As described in Note 9, share amounts adjusted for 1:5 reverse share split that occurred on December 5, 2016.
See accompanying notes to the financial statements.
270
:: Fin
an
cia
l Hig
hlig
hts
Toppan Merrill - ProFunds Public Semi-Annual Report [Funds] 01-31-2022 ED [AUX] | akiesli | 29-Mar-22 08:44 | 22-1296-2.fc | Sequence: 29CHKSUM Content: 13323 Layout: 63172 Graphics: 0 CLEAN
JOB: 22-1296-2 CYCLE#;BL#: 8; 0 TRIM: 10.75" x 8.25" AS: New York: 212-620-5600COLORS: ~note-color 2, Black, ~note-color 3 GRAPHICS: none V1.5

ProFunds Financial Highlights FOR THE PERIODS INDICATED
Selected data for a share of beneficial interest outstanding throughout the periods indicated.
Distributions to Ratios to SupplementalInvestment Activities Shareholders From Average Net Assets Data
NetRealized
and Net NetNet Asset Net Unrealized Asset Net Assets,
Value, Investment Gains Total from Net Value, Investment End of PortfolioBeginning Income (Losses) on Investment Investment Total End of Total Gross Net Income Period Turnoverof Period (Loss)(a) Investments Activities Income Distributions Period Return Expenses(b) Expenses(b) (Loss)(b) (000’s) Rate(c)
UltraShort Japan ProFund
Investor Class
Six Months EndedJanuary 31, 2022 (unaudited) $12.53 (0.10) (0.56) (0.66) — — $11.87 (5.27)%(d) 18.44% 1.78% (1.78)% $455 —
Year Ended July 31, 2021 $22.23 (0.26) (9.44) (9.70) — — $12.53 (43.63)% 8.91% 1.78% (1.77)% $233 —Year Ended July 31, 2020 $32.34 (0.18) (9.93) (10.11) — — $22.23 (31.26)% 4.87% 1.78% (0.64)% $842 —Year Ended July 31, 2019 $32.76 0.06 (0.48) (0.42) — — $32.34 (1.28)% 5.49% 1.78% 0.18% $1,010 —Year Ended July 31, 2018(e) $47.18 (0.23) (14.19) (14.42) — — $32.76 (30.59)% 3.66% 1.78% (0.60)% $709 —Year Ended July 31, 2017(e) $75.55 (0.75) (27.62) (28.37) — — $47.18 (37.52)% 3.16% 1.78% (1.37)% $1,249 —
Service Class
Six Months EndedJanuary 31, 2022 (unaudited) $11.16 (0.15) (0.51) (0.66) — — $10.50 (5.82)%(d) 19.44% 2.78% (2.78)% $1 —
Year Ended July 31, 2021 $19.96 (0.37) (8.43) (8.80) — — $11.16 (44.23)% 9.91% 2.78% (2.77)% $29 —Year Ended July 31, 2020 $29.45 (0.44) (9.05) (9.49) — — $19.96 (31.87)% 5.87% 2.78% (1.64)% $2 —Year Ended July 31, 2019 $30.00 (0.23) (0.32) (0.55) — — $29.45 (2.26)% 6.49% 2.78% (0.82)% $4 —Year Ended July 31, 2018(e) $43.73 (0.61) (13.12) (13.73) — — $30.00 (31.31)% 4.66% 2.78% (1.60)% $5 —Year Ended July 31, 2017(e) $70.74 (1.25) (25.76) (27.01) — — $43.73 (38.16)% 4.16% 2.78% (2.37)% $47 —
UltraShort Latin America ProFund
Investor Class
Six Months EndedJanuary 31, 2022 (unaudited) $10.27 (0.11) (0.09) (0.20) — — $10.07 (1.85)%(d) 3.74% 1.78% (1.78)% $687 —
Year Ended July 31, 2021 $27.67 (0.32) (17.08) (17.40) — — $10.27 (62.88)% 3.28% 1.78% (1.77)% $804 —Year Ended July 31, 2020 $27.71 (0.30) 0.35 0.05 (0.09) (0.09) $27.67 0.22% 2.31% 1.78% (0.87)% $3,138 —Year Ended July 31, 2019 $35.01 0.16 (7.46) (7.30) — — $27.71 (20.85)% 2.42% 1.78% 0.53% $4,681 —Year Ended July 31, 2018(e) $40.03 (0.21) (4.81) (5.02) — — $35.01 (12.58)% 2.05% 1.78% (0.60)% $3,711 —Year Ended July 31, 2017(e) $74.09 (0.70) (33.36) (34.06) — — $40.03 (45.95)% 2.29% 1.78% (1.28)% $4,476 —
Service Class
Six Months EndedJanuary 31, 2022 (unaudited) $9.00 (0.16) (0.06) (0.22) — — $8.78 (2.44)%(d) 4.74% 2.78% (2.78)% $8 —
Year Ended July 31, 2021 $24.48 (0.47) (15.01) (15.48) — — $9.00 (63.24)% 4.28% 2.78% (2.77)% $9 —Year Ended July 31, 2020 $24.69 (0.69) 0.48 (0.21) — — $24.48 (0.85)% 3.31% 2.78% (1.87)% $35 —Year Ended July 31, 2019 $31.51 (0.12) (6.70) (6.82) — — $24.69 (21.67)% 3.42% 2.78% (0.47)% $61 —Year Ended July 31, 2018(e) $36.45 (0.55) (4.39) (4.94) — — $31.51 (13.53)% 3.05% 2.78% (1.60)% $74 —Year Ended July 31, 2017(e) $68.13 (1.15) (30.53) (31.68) — — $36.45 (46.52)% 3.29% 2.78% (2.28)% $6,981 —
(a) Per share net investment income (loss) has been calculated using the average daily shares method.(b) Annualized for periods less than one year.(c) Portfolio turnover rate is calculated without regard to instruments having a maturity of less than one year from acquisition or derivative instruments (including swap agreements and
futures contracts).(d) Not annualized for periods less than one year.(e) As described in Note 9, share amounts have been adjusted for 1:5 reverse share split that occurred on January 22, 2018.
See accompanying notes to the financial statements.
Fin
an
cia
l Hig
hlig
hts
:: 27
1
Toppan Merrill - ProFunds Public Semi-Annual Report [Funds] 01-31-2022 ED [AUX] | akiesli | 29-Mar-22 08:44 | 22-1296-2.fc | Sequence: 30CHKSUM Content: 34507 Layout: 5889 Graphics: 0 CLEAN
JOB: 22-1296-2 CYCLE#;BL#: 8; 0 TRIM: 10.75" x 8.25" AS: New York: 212-620-5600COLORS: ~note-color 2, Black, ~note-color 3 GRAPHICS: none V1.5
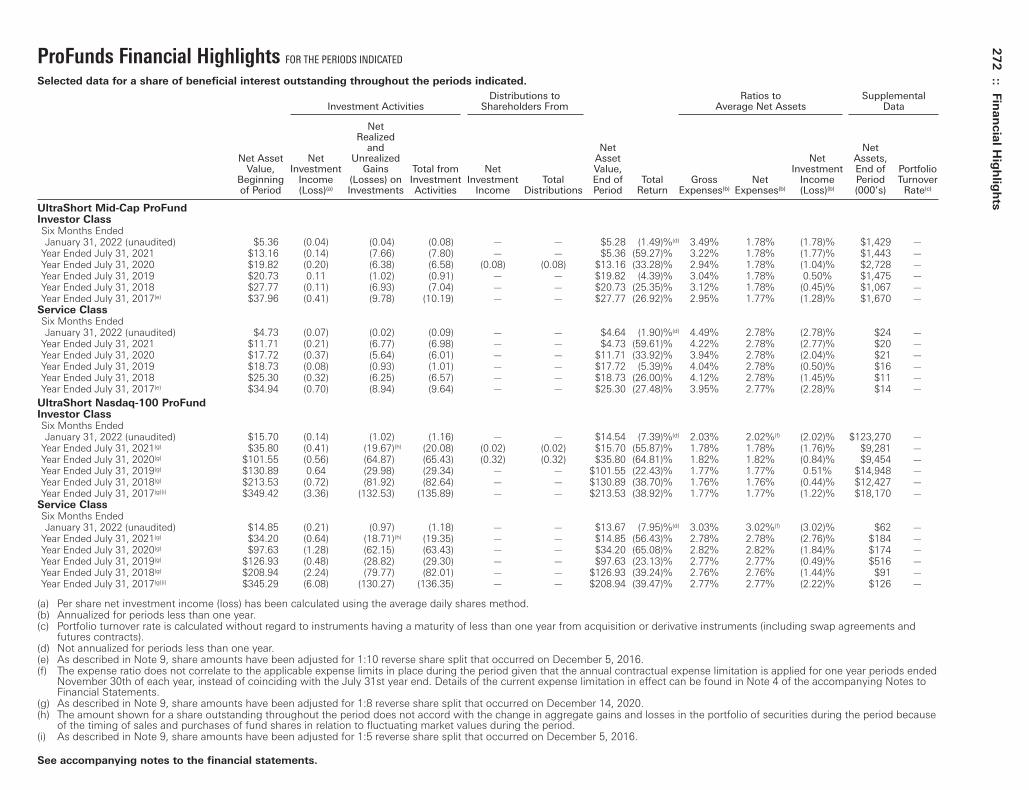
ProFunds Financial Highlights FOR THE PERIODS INDICATED
Selected data for a share of beneficial interest outstanding throughout the periods indicated.
Distributions to Ratios to SupplementalInvestment Activities Shareholders From Average Net Assets Data
NetRealized
and Net NetNet Asset Net Unrealized Asset Net Assets,
Value, Investment Gains Total from Net Value, Investment End of PortfolioBeginning Income (Losses) on Investment Investment Total End of Total Gross Net Income Period Turnoverof Period (Loss)(a) Investments Activities Income Distributions Period Return Expenses(b) Expenses(b) (Loss)(b) (000’s) Rate(c)
UltraShort Mid-Cap ProFundInvestor ClassSix Months EndedJanuary 31, 2022 (unaudited) $5.36 (0.04) (0.04) (0.08) — — $5.28 (1.49)%(d) 3.49% 1.78% (1.78)% $1,429 —
Year Ended July 31, 2021 $13.16 (0.14) (7.66) (7.80) — — $5.36 (59.27)% 3.22% 1.78% (1.77)% $1,443 —Year Ended July 31, 2020 $19.82 (0.20) (6.38) (6.58) (0.08) (0.08) $13.16 (33.28)% 2.94% 1.78% (1.04)% $2,728 —Year Ended July 31, 2019 $20.73 0.11 (1.02) (0.91) — — $19.82 (4.39)% 3.04% 1.78% 0.50% $1,475 —Year Ended July 31, 2018 $27.77 (0.11) (6.93) (7.04) — — $20.73 (25.35)% 3.12% 1.78% (0.45)% $1,067 —Year Ended July 31, 2017(e) $37.96 (0.41) (9.78) (10.19) — — $27.77 (26.92)% 2.95% 1.77% (1.28)% $1,670 —
Service ClassSix Months EndedJanuary 31, 2022 (unaudited) $4.73 (0.07) (0.02) (0.09) — — $4.64 (1.90)%(d) 4.49% 2.78% (2.78)% $24 —
Year Ended July 31, 2021 $11.71 (0.21) (6.77) (6.98) — — $4.73 (59.61)% 4.22% 2.78% (2.77)% $20 —Year Ended July 31, 2020 $17.72 (0.37) (5.64) (6.01) — — $11.71 (33.92)% 3.94% 2.78% (2.04)% $21 —Year Ended July 31, 2019 $18.73 (0.08) (0.93) (1.01) — — $17.72 (5.39)% 4.04% 2.78% (0.50)% $16 —Year Ended July 31, 2018 $25.30 (0.32) (6.25) (6.57) — — $18.73 (26.00)% 4.12% 2.78% (1.45)% $11 —Year Ended July 31, 2017(e) $34.94 (0.70) (8.94) (9.64) — — $25.30 (27.48)% 3.95% 2.77% (2.28)% $14 —
UltraShort Nasdaq-100 ProFundInvestor ClassSix Months EndedJanuary 31, 2022 (unaudited) $15.70 (0.14) (1.02) (1.16) — — $14.54 (7.39)%(d) 2.03% 2.02%(f) (2.02)% $123,270 —
Year Ended July 31, 2021(g) $35.80 (0.41) (19.67)(h) (20.08) (0.02) (0.02) $15.70 (55.87)% 1.78% 1.78% (1.76)% $9,281 —Year Ended July 31, 2020(g) $101.55 (0.56) (64.87) (65.43) (0.32) (0.32) $35.80 (64.81)% 1.82% 1.82% (0.84)% $9,454 —Year Ended July 31, 2019(g) $130.89 0.64 (29.98) (29.34) — — $101.55 (22.43)% 1.77% 1.77% 0.51% $14,948 —Year Ended July 31, 2018(g) $213.53 (0.72) (81.92) (82.64) — — $130.89 (38.70)% 1.76% 1.76% (0.44)% $12,427 —Year Ended July 31, 2017(g)(i) $349.42 (3.36) (132.53) (135.89) — — $213.53 (38.92)% 1.77% 1.77% (1.22)% $18,170 —
Service ClassSix Months EndedJanuary 31, 2022 (unaudited) $14.85 (0.21) (0.97) (1.18) — — $13.67 (7.95)%(d) 3.03% 3.02%(f) (3.02)% $62 —
Year Ended July 31, 2021(g) $34.20 (0.64) (18.71)(h) (19.35) — — $14.85 (56.43)% 2.78% 2.78% (2.76)% $184 —Year Ended July 31, 2020(g) $97.63 (1.28) (62.15) (63.43) — — $34.20 (65.08)% 2.82% 2.82% (1.84)% $174 —Year Ended July 31, 2019(g) $126.93 (0.48) (28.82) (29.30) — — $97.63 (23.13)% 2.77% 2.77% (0.49)% $516 —Year Ended July 31, 2018(g) $208.94 (2.24) (79.77) (82.01) — — $126.93 (39.24)% 2.76% 2.76% (1.44)% $91 —Year Ended July 31, 2017(g)(i) $345.29 (6.08) (130.27) (136.35) — — $208.94 (39.47)% 2.77% 2.77% (2.22)% $126 —
(a) Per share net investment income (loss) has been calculated using the average daily shares method.(b) Annualized for periods less than one year.(c) Portfolio turnover rate is calculated without regard to instruments having a maturity of less than one year from acquisition or derivative instruments (including swap agreements and
futures contracts).(d) Not annualized for periods less than one year.(e) As described in Note 9, share amounts have been adjusted for 1:10 reverse share split that occurred on December 5, 2016.(f) The expense ratio does not correlate to the applicable expense limits in place during the period given that the annual contractual expense limitation is applied for one year periods ended
November 30th of each year, instead of coinciding with the July 31st year end. Details of the current expense limitation in effect can be found in Note 4 of the accompanying Notes toFinancial Statements.
(g) As described in Note 9, share amounts have been adjusted for 1:8 reverse share split that occurred on December 14, 2020.(h) The amount shown for a share outstanding throughout the period does not accord with the change in aggregate gains and losses in the portfolio of securities during the period because
of the timing of sales and purchases of fund shares in relation to fluctuating market values during the period.(i) As described in Note 9, share amounts have been adjusted for 1:5 reverse share split that occurred on December 5, 2016.
See accompanying notes to the financial statements.
272
:: Fin
an
cia
l Hig
hlig
hts
Toppan Merrill - ProFunds Public Semi-Annual Report [Funds] 01-31-2022 ED [AUX] | akiesli | 29-Mar-22 08:44 | 22-1296-2.fc | Sequence: 31CHKSUM Content: 51706 Layout: 51903 Graphics: 0 CLEAN
JOB: 22-1296-2 CYCLE#;BL#: 8; 0 TRIM: 10.75" x 8.25" AS: New York: 212-620-5600COLORS: ~note-color 2, Black, ~note-color 3 GRAPHICS: none V1.5
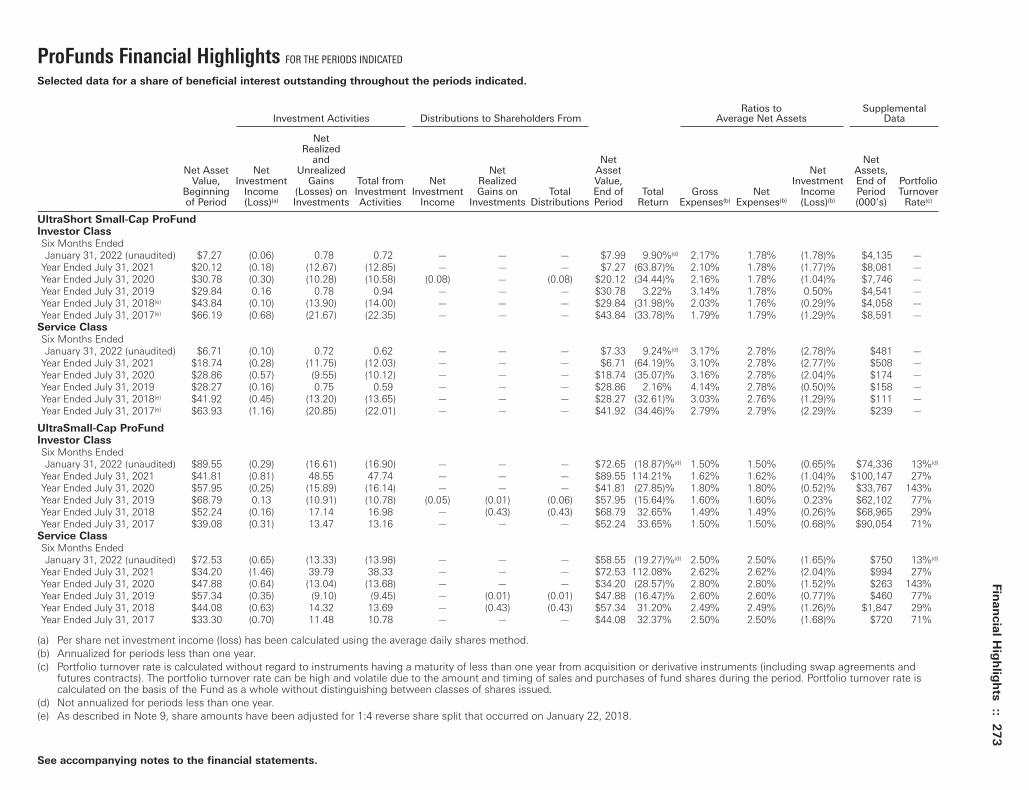
ProFunds Financial Highlights FOR THE PERIODS INDICATED
Selected data for a share of beneficial interest outstanding throughout the periods indicated.
Ratios to SupplementalInvestment Activities Distributions to Shareholders From Average Net Assets Data
Net Realized
and Net Net Net Asset Net Unrealized Net Asset Net Assets,
Value, Investment Gains Total from Net Realized Value, Investment End of PortfolioBeginning Income (Losses) on Investment Investment Gains on Total End of Total Gross Net Income Period Turnoverof Period (Loss)(a) Investments Activities Income Investments Distributions Period Return Expenses(b) Expenses(b) (Loss)(b) (000’s) Rate(c)
UltraShort Small-Cap ProFundInvestor ClassSix Months EndedJanuary 31, 2022 (unaudited) $7.27 (0.06) 0.78 0.72 — — — $7.99 9.90%(d) 2.17% 1.78% (1.78)% $4,135 —
Year Ended July 31, 2021 $20.12 (0.18) (12.67) (12.85) — — — $7.27 (63.87)% 2.10% 1.78% (1.77)% $8,081 —Year Ended July 31, 2020 $30.78 (0.30) (10.28) (10.58) (0.08) — (0.08) $20.12 (34.44)% 2.16% 1.78% (1.04)% $7,746 —Year Ended July 31, 2019 $29.84 0.16 0.78 0.94 — — — $30.78 3.22% 3.14% 1.78% 0.50% $4,541 —Year Ended July 31, 2018(e) $43.84 (0.10) (13.90) (14.00) — — — $29.84 (31.98)% 2.03% 1.76% (0.29)% $4,058 —Year Ended July 31, 2017(e) $66.19 (0.68) (21.67) (22.35) — — — $43.84 (33.78)% 1.79% 1.79% (1.29)% $8,591 —
Service ClassSix Months EndedJanuary 31, 2022 (unaudited) $6.71 (0.10) 0.72 0.62 — — — $7.33 9.24%(d) 3.17% 2.78% (2.78)% $481 —
Year Ended July 31, 2021 $18.74 (0.28) (11.75) (12.03) — — — $6.71 (64.19)% 3.10% 2.78% (2.77)% $508 —Year Ended July 31, 2020 $28.86 (0.57) (9.55) (10.12) — — — $18.74 (35.07)% 3.16% 2.78% (2.04)% $174 —Year Ended July 31, 2019 $28.27 (0.16) 0.75 0.59 — — — $28.86 2.16% 4.14% 2.78% (0.50)% $158 —Year Ended July 31, 2018(e) $41.92 (0.45) (13.20) (13.65) — — — $28.27 (32.61)% 3.03% 2.76% (1.29)% $111 —Year Ended July 31, 2017(e) $63.93 (1.16) (20.85) (22.01) — — — $41.92 (34.46)% 2.79% 2.79% (2.29)% $239 —
UltraSmall-Cap ProFundInvestor ClassSix Months EndedJanuary 31, 2022 (unaudited) $89.55 (0.29) (16.61) (16.90) — — — $72.65 (18.87)%(d) 1.50% 1.50% (0.65)% $74,336 13%(d)
Year Ended July 31, 2021 $41.81 (0.81) 48.55 47.74 — — — $89.55 114.21% 1.62% 1.62% (1.04)% $100,147 27%Year Ended July 31, 2020 $57.95 (0.25) (15.89) (16.14) — — — $41.81 (27.85)% 1.80% 1.80% (0.52)% $33,767 143%Year Ended July 31, 2019 $68.79 0.13 (10.91) (10.78) (0.05) (0.01) (0.06) $57.95 (15.64)% 1.60% 1.60% 0.23% $62,102 77%Year Ended July 31, 2018 $52.24 (0.16) 17.14 16.98 — (0.43) (0.43) $68.79 32.65% 1.49% 1.49% (0.26)% $68,965 29%Year Ended July 31, 2017 $39.08 (0.31) 13.47 13.16 — — — $52.24 33.65% 1.50% 1.50% (0.68)% $90,054 71%
Service ClassSix Months EndedJanuary 31, 2022 (unaudited) $72.53 (0.65) (13.33) (13.98) — — — $58.55 (19.27)%(d) 2.50% 2.50% (1.65)% $750 13%(d)
Year Ended July 31, 2021 $34.20 (1.46) 39.79 38.33 — — — $72.53 112.08% 2.62% 2.62% (2.04)% $994 27%Year Ended July 31, 2020 $47.88 (0.64) (13.04) (13.68) — — — $34.20 (28.57)% 2.80% 2.80% (1.52)% $263 143%Year Ended July 31, 2019 $57.34 (0.35) (9.10) (9.45) — (0.01) (0.01) $47.88 (16.47)% 2.60% 2.60% (0.77)% $460 77%Year Ended July 31, 2018 $44.08 (0.63) 14.32 13.69 — (0.43) (0.43) $57.34 31.20% 2.49% 2.49% (1.26)% $1,847 29%Year Ended July 31, 2017 $33.30 (0.70) 11.48 10.78 — — — $44.08 32.37% 2.50% 2.50% (1.68)% $720 71%
(a) Per share net investment income (loss) has been calculated using the average daily shares method.(b) Annualized for periods less than one year.(c) Portfolio turnover rate is calculated without regard to instruments having a maturity of less than one year from acquisition or derivative instruments (including swap agreements and
futures contracts). The portfolio turnover rate can be high and volatile due to the amount and timing of sales and purchases of fund shares during the period. Portfolio turnover rate iscalculated on the basis of the Fund as a whole without distinguishing between classes of shares issued.
(d) Not annualized for periods less than one year.(e) As described in Note 9, share amounts have been adjusted for 1:4 reverse share split that occurred on January 22, 2018.
See accompanying notes to the financial statements.
Fin
an
cia
l Hig
hlig
hts
:: 27
3
Toppan Merrill - ProFunds Public Semi-Annual Report [Funds] 01-31-2022 ED [AUX] | akiesli | 29-Mar-22 08:44 | 22-1296-2.fc | Sequence: 32CHKSUM Content: 47864 Layout: 41471 Graphics: 0 CLEAN
JOB: 22-1296-2 CYCLE#;BL#: 8; 0 TRIM: 10.75" x 8.25" AS: New York: 212-620-5600COLORS: ~note-color 2, Black, ~note-color 3 GRAPHICS: none V1.5
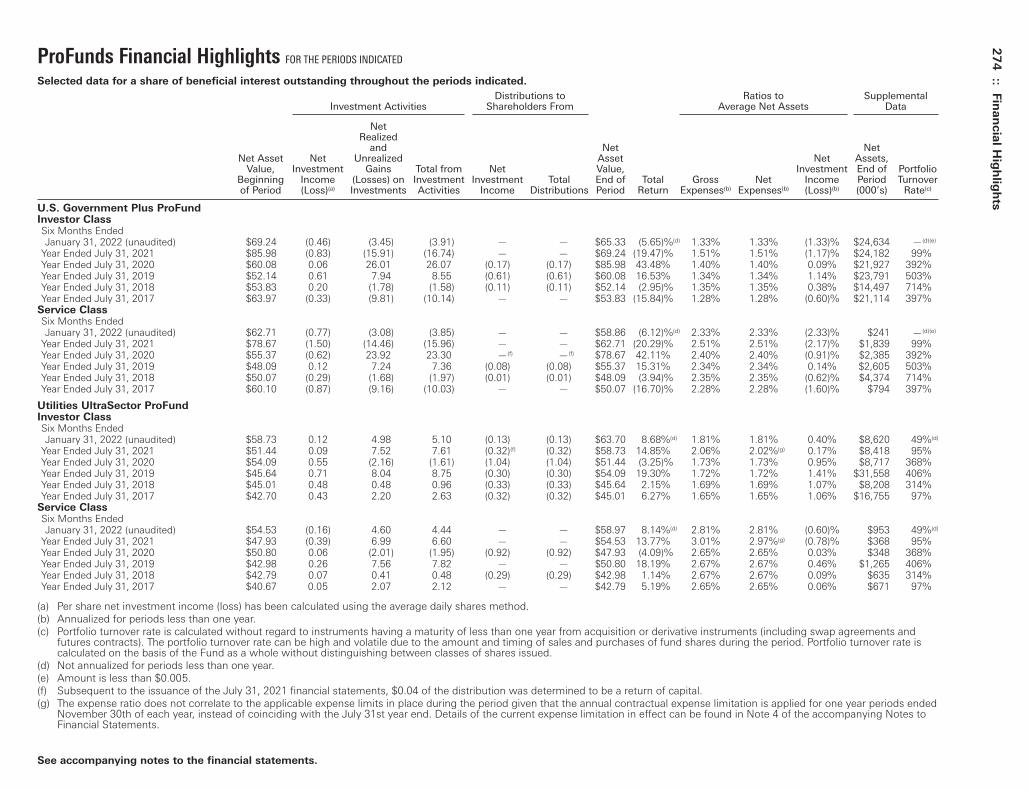
ProFunds Financial Highlights FOR THE PERIODS INDICATED
Selected data for a share of beneficial interest outstanding throughout the periods indicated.
Distributions to Ratios to SupplementalInvestment Activities Shareholders From Average Net Assets Data
NetRealized
and Net NetNet Asset Net Unrealized Asset Net Assets,
Value, Investment Gains Total from Net Value, Investment End of PortfolioBeginning Income (Losses) on Investment Investment Total End of Total Gross Net Income Period Turnoverof Period (Loss)(a) Investments Activities Income Distributions Period Return Expenses(b) Expenses(b) (Loss)(b) (000’s) Rate(c)
U.S. Government Plus ProFundInvestor ClassSix Months EndedJanuary 31, 2022 (unaudited) $69.24 (0.46) (3.45) (3.91) — — $65.33 (5.65)%(d) 1.33% 1.33% (1.33)% $24,634 —(d)(e)
Year Ended July 31, 2021 $85.98 (0.83) (15.91) (16.74) — — $69.24 (19.47)% 1.51% 1.51% (1.17)% $24,182 99%Year Ended July 31, 2020 $60.08 0.06 26.01 26.07 (0.17) (0.17) $85.98 43.48% 1.40% 1.40% 0.09% $21,927 392%Year Ended July 31, 2019 $52.14 0.61 7.94 8.55 (0.61) (0.61) $60.08 16.53% 1.34% 1.34% 1.14% $23,791 503%Year Ended July 31, 2018 $53.83 0.20 (1.78) (1.58) (0.11) (0.11) $52.14 (2.95)% 1.35% 1.35% 0.38% $14,497 714%Year Ended July 31, 2017 $63.97 (0.33) (9.81) (10.14) — — $53.83 (15.84)% 1.28% 1.28% (0.60)% $21,114 397%
Service ClassSix Months EndedJanuary 31, 2022 (unaudited) $62.71 (0.77) (3.08) (3.85) — — $58.86 (6.12)%(d) 2.33% 2.33% (2.33)% $241 —(d)(e)
Year Ended July 31, 2021 $78.67 (1.50) (14.46) (15.96) — — $62.71 (20.29)% 2.51% 2.51% (2.17)% $1,839 99%Year Ended July 31, 2020 $55.37 (0.62) 23.92 23.30 —(f) —(f) $78.67 42.11% 2.40% 2.40% (0.91)% $2,385 392%Year Ended July 31, 2019 $48.09 0.12 7.24 7.36 (0.08) (0.08) $55.37 15.31% 2.34% 2.34% 0.14% $2,605 503%Year Ended July 31, 2018 $50.07 (0.29) (1.68) (1.97) (0.01) (0.01) $48.09 (3.94)% 2.35% 2.35% (0.62)% $4,374 714%Year Ended July 31, 2017 $60.10 (0.87) (9.16) (10.03) — — $50.07 (16.70)% 2.28% 2.28% (1.60)% $794 397%
Utilities UltraSector ProFundInvestor ClassSix Months EndedJanuary 31, 2022 (unaudited) $58.73 0.12 4.98 5.10 (0.13) (0.13) $63.70 8.68%(d) 1.81% 1.81% 0.40% $8,620 49%(d)
Year Ended July 31, 2021 $51.44 0.09 7.52 7.61 (0.32)(f) (0.32) $58.73 14.85% 2.06% 2.02%(g) 0.17% $8,418 95%Year Ended July 31, 2020 $54.09 0.55 (2.16) (1.61) (1.04) (1.04) $51.44 (3.25)% 1.73% 1.73% 0.95% $8,717 368%Year Ended July 31, 2019 $45.64 0.71 8.04 8.75 (0.30) (0.30) $54.09 19.30% 1.72% 1.72% 1.41% $31,558 406%Year Ended July 31, 2018 $45.01 0.48 0.48 0.96 (0.33) (0.33) $45.64 2.15% 1.69% 1.69% 1.07% $8,208 314%Year Ended July 31, 2017 $42.70 0.43 2.20 2.63 (0.32) (0.32) $45.01 6.27% 1.65% 1.65% 1.06% $16,755 97%
Service ClassSix Months EndedJanuary 31, 2022 (unaudited) $54.53 (0.16) 4.60 4.44 — — $58.97 8.14%(d) 2.81% 2.81% (0.60)% $953 49%(d)
Year Ended July 31, 2021 $47.93 (0.39) 6.99 6.60 — — $54.53 13.77% 3.01% 2.97%(g) (0.78)% $368 95%Year Ended July 31, 2020 $50.80 0.06 (2.01) (1.95) (0.92) (0.92) $47.93 (4.09)% 2.65% 2.65% 0.03% $348 368%Year Ended July 31, 2019 $42.98 0.26 7.56 7.82 — — $50.80 18.19% 2.67% 2.67% 0.46% $1,265 406%Year Ended July 31, 2018 $42.79 0.07 0.41 0.48 (0.29) (0.29) $42.98 1.14% 2.67% 2.67% 0.09% $635 314%Year Ended July 31, 2017 $40.67 0.05 2.07 2.12 — — $42.79 5.19% 2.65% 2.65% 0.06% $671 97%
(a) Per share net investment income (loss) has been calculated using the average daily shares method.(b) Annualized for periods less than one year.(c) Portfolio turnover rate is calculated without regard to instruments having a maturity of less than one year from acquisition or derivative instruments (including swap agreements and
futures contracts). The portfolio turnover rate can be high and volatile due to the amount and timing of sales and purchases of fund shares during the period. Portfolio turnover rate iscalculated on the basis of the Fund as a whole without distinguishing between classes of shares issued.
(d) Not annualized for periods less than one year.(e) Amount is less than $0.005.(f) Subsequent to the issuance of the July 31, 2021 financial statements, $0.04 of the distribution was determined to be a return of capital.(g) The expense ratio does not correlate to the applicable expense limits in place during the period given that the annual contractual expense limitation is applied for one year periods ended
November 30th of each year, instead of coinciding with the July 31st year end. Details of the current expense limitation in effect can be found in Note 4 of the accompanying Notes toFinancial Statements.
See accompanying notes to the financial statements.
274
:: Fin
an
cia
l Hig
hlig
hts
Toppan Merrill - ProFunds Public Semi-Annual Report [Funds] 01-31-2022 ED [AUX] | akiesli | 29-Mar-22 08:44 | 22-1296-2.fc | Sequence: 33CHKSUM Content: 10068 Layout: 8414 Graphics: 0 CLEAN
JOB: 22-1296-2 CYCLE#;BL#: 8; 0 TRIM: 10.75" x 8.25" AS: New York: 212-620-5600COLORS: ~note-color 2, Black, ~note-color 3 GRAPHICS: none V1.5

Notes to Financial Statements
Toppan Merrill - ProFunds Public Semi-Annual Report [Funds] 01-31-2022 ED [AUX] | akiesli | 29-Mar-22 08:44 | 22-1296-2.ga | Sequence: 1CHKSUM Content: 62843 Layout: 34553 Graphics: 0 CLEAN
JOB: 22-1296-2 CYCLE#;BL#: 8; 0 TRIM: 8.25" x 10.75" AS: New York: 212-620-5600COLORS: Black, ~note-color 2 GRAPHICS: none V1.5

1. Organization
ProFunds (the “Trust”) consists of 116 separate investment portfolios and is registered as an open-end management investment companyunder the Investment Company Act of 1940 (the “1940 Act”) and thus follows accounting and reporting guidance for investmentcompanies. The Trust is organized as a Delaware statutory trust and is authorized to issue an unlimited number of shares of beneficialinterest of no par value which may be issued in more than one class or series.
These accompanying financial statements relate to the following portfolios of the Trust included in this report (collectively, the“ProFunds” and individually, a “ProFund”):
Classic ProFunds:
Bull ProFund Mid-Cap Value ProFundEurope 30 ProFund Nasdaq-100 ProFundLarge-Cap Growth ProFund Small-Cap Growth ProFundLarge-Cap Value ProFund Small-Cap ProFundMid-Cap Growth ProFund Small-Cap Value ProFundMid-Cap ProFund
Ultra ProFunds:
UltraBull ProFund UltraJapan ProFundUltraChina ProFund UltraLatin America ProFundUltraDow 30 ProFund UltraMid-Cap ProFundUltraEmerging Markets ProFund UltraNasdaq-100 ProFundUltraInternational ProFund UltraSmall-Cap ProFund
Inverse ProFunds:
Bear ProFund UltraShort International ProFundShort Nasdaq-100 ProFund UltraShort Japan ProFundShort Small-Cap ProFund UltraShort Latin America ProFundUltraBear ProFund UltraShort Mid-Cap ProFundUltraShort China ProFund UltraShort Nasdaq-100 ProFundUltraShort Dow 30 ProFund UltraShort Small-Cap ProFundUltraShort Emerging Markets ProFund
UltraSector ProFunds:
Banks UltraSector ProFund Oil & Gas UltraSector ProFundBasic Materials UltraSector ProFund Oil Equipment & Services UltraSector ProFundBiotechnology UltraSector ProFund Pharmaceuticals UltraSector ProFundCommunication Services UltraSector ProFund Precious Metals UltraSector ProFundConsumer Goods UltraSector ProFund Real Estate UltraSector ProFundConsumer Services UltraSector ProFund Semiconductor UltraSector ProFundFinancials UltraSector ProFund Technology UltraSector ProFundHealth Care UltraSector ProFund Telecommunications UltraSector ProFundIndustrials UltraSector ProFund Utilities UltraSector ProFundInternet UltraSector ProFund
Inverse Sector ProFunds:
Short Oil & Gas ProFund Short Real Estate ProFundShort Precious Metals ProFund
Digital Assets ProFund:
Bitcoin Strategy ProFund
Non-Equity ProFunds:
Access Flex Bear High Yield ProFund Rising Rates Opportunity 10 ProFundAccess Flex High Yield ProFund Rising U.S. Dollar ProFundFalling U.S. Dollar ProFund U.S. Government Plus ProFundRising Rates Opportunity ProFund
276 :: Notes to Financial Statements :: January 31, 2022 (unaudited)
Toppan Merrill - ProFunds Public Semi-Annual Report [Funds] 01-31-2022 ED [AUX] | akiesli | 29-Mar-22 08:44 | 22-1296-2.ga | Sequence: 2CHKSUM Content: 26999 Layout: 34194 Graphics: 0 CLEAN
JOB: 22-1296-2 CYCLE#;BL#: 8; 0 TRIM: 8.25" x 10.75" AS: New York: 212-620-5600COLORS: ~note-color 2, Black, ~note-color 3 GRAPHICS: none V1.5
Each ProFund, other than Europe 30 ProFund, Large-Cap GrowthProFund, Large-Cap Value ProFund, Mid-Cap Growth ProFund, Mid-Cap Value ProFund, Small-Cap Growth ProFund, and Small-Cap ValueProFund is classified as non-diversified under the 1940 Act. EachProFund, with the exception of Bitcoin Strategy ProFund, has twoclasses of shares outstanding: an Investor Class and a Service Class.The Bitcoin Strategy ProFund, has one class: an Investor Class.
The Large-Cap Growth ProFund may operate as “non-diversified”,as defined under the 1940 Act, to the extent necessary toapproximate the composition of its index.
Each class of shares has identical rights and privileges except withrespect to fees paid under the Distribution and ShareholderServices Plan and voting rights on matters affecting a single classof shares.
Under the Trust’s organizational documents, its Officers andTrustees are indemnified against certain liabilities arising out ofthe performance of their duties to the Trust. In addition, in thenormal course of business, the Trust enters into contracts with itsvendors and others that provide for general indemnifications. TheTrust and ProFunds’ maximum exposure under thesearrangements is unknown as this would involve future claims thatmay be made against the ProFunds.
2. Significant Accounting Policies
The following is a summary of significant accounting policiesfollowed by each ProFund in the preparation of its financialstatements. These policies are in conformity with U.S. generallyaccepted accounting principles (“GAAP”). The preparation offinancial statements in accordance with GAAP requiresmanagement to make estimates and assumptions that affect thereported amounts of assets and liabilities and disclosure ofcontingent assets and liabilities at the date of the financialstatements and the reported amounts of income and expensesduring the reporting period. The actual results could differ fromthose estimates.
Basis of Consolidation
The accompanying Consolidated Schedule of PortfolioInvestments, Consolidated Statement of Assets and Liabilities,Consolidated Statement of Operations, Consolidated Statement ofChanges in Net Assets, Consolidated Statement of Cash Flows, andConsolidated Financial Highlights of Bitcoin Strategy ProFundinclude the accounts of the ProFunds Bitcoin Strategy Portfolio, awholly-owned subsidiary of the ProFund (the “Subsidiary”)organized under the laws of the Cayman Islands, which primarilyinvests in Bitcoin related instruments. The Subsidiary enables theProFund to hold these Bitcoin-related instruments and satisfy“regulated investment company” (“RIC”) tax requirements. TheProFund will invest a significant portion of its total assets in itsSubsidiary. As of January 31, 2022, the net assets of ProFundsBitcoin Strategy Portfolio were 22.3% of the adjusted net assets ofBitcoin Strategy ProFund (as adjusted for reverse repurchaseagreements). Intercompany accounts and transactions, if any, havebeen eliminated. The Subsidiary is subject to the same investmentpolicies and restrictions that apply to Bitcoin Strategy ProFund,except that the Subsidiary may invest without limitation in Bitcoin-related instruments.
Investment in a Subsidiary
The Bitcoin Strategy ProFund intends to achieve commodityexposure through investment in the Subsidiary. The BitcoinStrategy ProFund’s investment in its Subsidiary is intended toprovide the ProFund with exposure to commodity and financialmarkets in accordance with applicable rules and regulations. TheSubsidiary may invest in derivatives, including futures, forwards,options and other investments intended to serve as margin orcollateral or otherwise support the Subsidiary’s derivativespositions. The Subsidiary is not registered under the 1940 Act, andwill not have all of the protections offered to investors in RICs. TheBoard, however, has oversight responsibility for the investmentactivities of the ProFund, including its investment in its Subsidiary,and the ProFund’s role as the sole shareholder of the Subsidiary.Changes in the laws of the United States and/or the CaymanIslands, under which the ProFund and the Subsidiary areorganized, respectively, could result in the inability of the ProFundand/or its Subsidiary to operate as described in the ProFund’sStatement of Additional Information and could negatively affectthe ProFund and its shareholders. For example, the Cayman Islandsdoes not currently impose any income, corporate or capital gainstax, estate duty, inheritance tax, gift tax or withholding tax on theSubsidiary. If Cayman Islands law changes such that the Subsidiarymust pay Cayman Islands taxes, ProFund shareholders would likelysuffer decreased investment returns. The financial statements of theSubsidiary have been consolidated with the ProFund’s financialstatements in this report.
Investment Valuation
The ProFunds record their investments at fair value. Fair value isdefined as the price that would be received to sell an asset or paidto transfer a liability in an orderly transaction between marketparticipants at the measurement date. The valuation techniquesused to determine fair value are further described in Note 3.
Repurchase Agreements
Each ProFund may enter into repurchase agreements with financialinstitutions in pursuit of its investment objective, as “cover” forthe investment techniques it employs, or for liquidity purposes.Repurchase agreements are primarily used by the ProFunds asshort-term investments for cash positions. Under a repurchaseagreement, a ProFund purchases a debt security andsimultaneously agrees to sell the security back to the seller at amutually agreed-upon future price and date, normally onebusiness day. The resale price is typically greater than the purchaseprice, reflecting an agreed-upon market interest rate during thepurchaser’s holding period. While the maturities of the underlyingsecurities in repurchase transactions may be more than one year,the term of each repurchase agreement will always be less thanone year.
The ProFunds follow certain procedures designed to minimize therisks inherent in such agreements. These procedures includeeffecting repurchase transactions generally with major, globalfinancial institutions whose creditworthiness is continuouslymonitored by ProFund Advisors LLC (the “Advisor”). In addition,the value of the collateral underlying the repurchase agreementwill always be at least equal to the repurchase price, including anyaccrued interest earned on the repurchase agreement. Funds
January 31, 2022 (unaudited) :: Notes to Financial Statements :: 277
Toppan Merrill - ProFunds Public Semi-Annual Report [Funds] 01-31-2022 ED [AUX] | akiesli | 29-Mar-22 08:44 | 22-1296-2.ga | Sequence: 3CHKSUM Content: 35490 Layout: 17462 Graphics: 0 CLEAN
JOB: 22-1296-2 CYCLE#;BL#: 8; 0 TRIM: 8.25" x 10.75" AS: New York: 212-620-5600COLORS: ~note-color 2, Black, ~note-color 3 GRAPHICS: none V1.5

within the Trust invest in repurchase agreements jointly. Each ProFund, therefore, holds a pro rata share of the collateral and interestincome based upon the dollar amount of the repurchase agreements entered into by each ProFund. The collateral underlying therepurchase agreement is held by the ProFund’s custodian. In the event of a default or bankruptcy by a selling financial institution, aProFund will seek to liquidate such collateral which could involve certain costs or delays and, to the extent that proceeds from any saleupon a default of the obligation to repurchase were less than the repurchase price, the ProFund could suffer a loss. A ProFund also mayexperience difficulties and incur certain costs in exercising its rights to the collateral and may lose the interest the ProFund expectedto receive under the repurchase agreement. Repurchase agreements usually are for short periods, such as one week or less, but may belonger. It is the current policy of the ProFunds not to invest in repurchase agreements that do not mature within seven days if any suchinvestment, together with any other illiquid assets held by the ProFund, amounts to more than 15% of the ProFund’s total net assets.The investments of each of the ProFunds in repurchase agreements at times may be substantial when, in the view of the Advisor,liquidity, investment, regulatory, or other considerations so warrant. During periods of high demand for repurchase agreements, theProFunds may be unable to invest available cash in these instruments to the extent desired by the Advisor.
Information concerning the counterparties, value of, collateralization and amounts due under repurchase agreement transactions maybe found in the table below.
As of January 31, 2022, the ProFunds had undivided interest in joint repurchase agreements with the following counterparties, for thetime periods and rates indicated. Amounts shown in the table below represent principal amount, cost and value for each respectiverepurchase agreement.
Canadian Imperial Bank Credit Agricole HSBC Securities RBC Capital Societe’ UMB Bank of Canada CIB, (USA), Inc., Markets, LLC, Generale, N.A., 0.00% 0.00% 0.00% 0.00% 0.00% 0.00% dated 7/31/21, dated 7/31/21, dated 7/31/21, dated 7/31/21, dated 7/31/21, dated 7/31/21,Fund Name due 2/1/22(1) due 2/1/22(2) due 0(3) due 2/1/22(4) due 2/1/22(5) due 2/1/22(6)
Access Flex Bear High Yield
ProFund $ 18,000 $ 35,000 $ 234,000 $ 35,000 $ 122,000 $ 13,000Access Flex High Yield ProFund 85,000 160,000 1,070,000 160,000 556,000 52,000Banks UltraSector ProFund 167,000 314,000 2,106,000 314,000 1,094,000 104,000Basic Materials UltraSector
ProFund 50,000 97,000 650,000 97,000 337,000 37,000Bear ProFund 441,000 829,000 5,532,000 829,000 2,876,000 257,000Biotechnology UltraSector
ProFund 1,054,000 1,976,000 13,183,000 1,976,000 6,854,000 604,000Bull ProFund 371,000 698,000 4,656,000 698,000 2,421,000 216,000Communication Services
UltraSector ProFund 54,000 102,000 684,000 102,000 356,000 36,000Consumer Goods UltraSector
ProFund 84,000 157,000 1,056,000 157,000 548,000 53,000Consumer Services UltraSector
ProFund 383,000 719,000 4,803,000 719,000 2,497,000 225,000Falling U.S. Dollar ProFund 45,000 86,000 582,000 86,000 303,000 33,000Financials UltraSector ProFund 92,000 173,000 1,164,000 173,000 604,000 63,000Health Care UltraSector ProFund 134,000 253,000 1,700,000 253,000 883,000 89,000Industrials UltraSector ProFund 46,000 87,000 584,000 87,000 303,000 32,000Internet UltraSector ProFund 1,087,000 2,037,000 13,590,000 2,037,000 7,066,000 621,000Large Cap Growth ProFund — 1,000 9,000 1,000 4,000 3,000Mid Cap ProFund 79,000 149,000 1,004,000 149,000 521,000 53,000Nasdaq 100 ProFund 514,000 967,000 6,454,000 967,000 3,356,000 301,000Oil & Gas UltraSector ProFund 408,000 767,000 5,121,000 767,000 2,663,000 242,000Oil Equipment & Services
UltraSector 210,000 396,000 2,646,000 396,000 1,375,000 127,000Pharmaceuticals UltraSector
ProFund 38,000 74,000 498,000 74,000 258,000 29,000Precious Metals UltraSector
ProFund 240,000 452,000 3,021,000 452,000 1,570,000 145,000Real Estate UltraSector ProFund 195,000 367,000 2,453,000 367,000 1,275,000 118,000Rising Rates Opportunity
ProFund 503,000 943,000 6,297,000 943,000 3,274,000 293,000Rising Rates Opportunity 10
ProFund 118,000 224,000 1,501,000 224,000 780,000 75,000Rising U.S. Dollar ProFund 931,000 1,747,000 11,657,000 1,747,000 6,061,000 536,000
278 :: Notes to Financial Statements :: January 31, 2022 (unaudited)
Toppan Merrill - ProFunds Public Semi-Annual Report [Funds] 01-31-2022 ED [AUX] | akiesli | 29-Mar-22 08:44 | 22-1296-2.ga | Sequence: 4CHKSUM Content: 38485 Layout: 7987 Graphics: 0 CLEAN
JOB: 22-1296-2 CYCLE#;BL#: 8; 0 TRIM: 8.25" x 10.75" AS: New York: 212-620-5600COLORS: ~note-color 2, Black, ~note-color 3 GRAPHICS: none V1.5
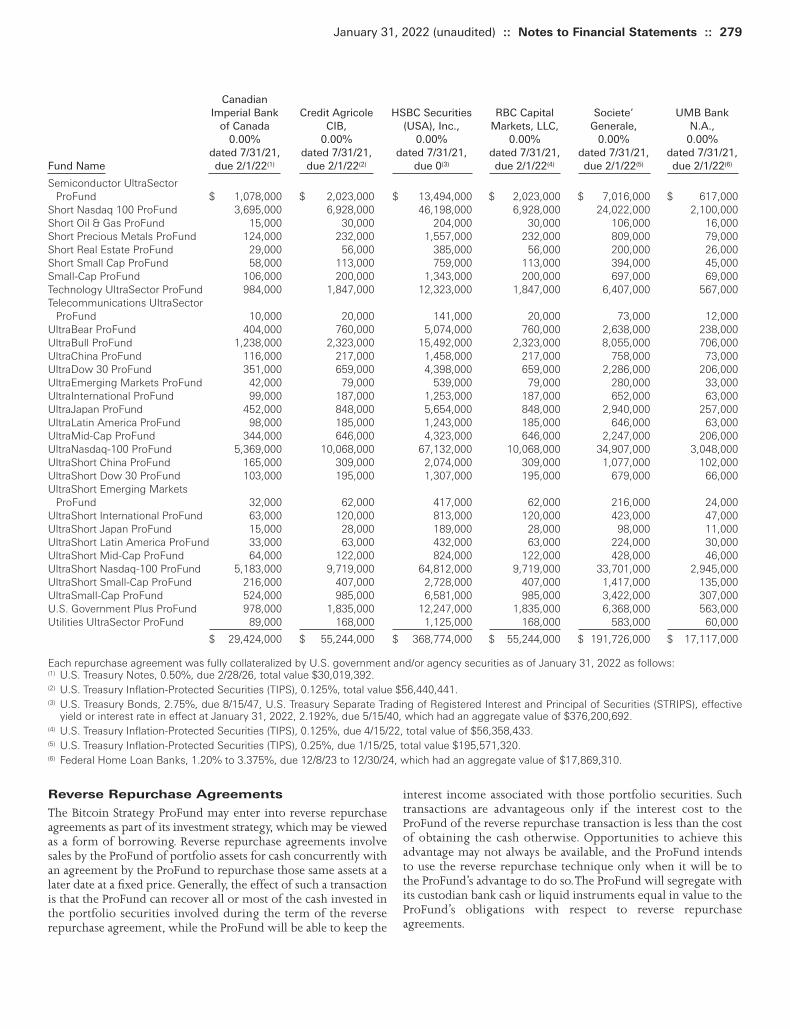
Canadian Imperial Bank Credit Agricole HSBC Securities RBC Capital Societe’ UMB Bank of Canada CIB, (USA), Inc., Markets, LLC, Generale, N.A., 0.00% 0.00% 0.00% 0.00% 0.00% 0.00% dated 7/31/21, dated 7/31/21, dated 7/31/21, dated 7/31/21, dated 7/31/21, dated 7/31/21,Fund Name due 2/1/22(1) due 2/1/22(2) due 0(3) due 2/1/22(4) due 2/1/22(5) due 2/1/22(6)
Semiconductor UltraSector
ProFund $ 1,078,000 $ 2,023,000 $ 13,494,000 $ 2,023,000 $ 7,016,000 $ 617,000Short Nasdaq 100 ProFund 3,695,000 6,928,000 46,198,000 6,928,000 24,022,000 2,100,000Short Oil & Gas ProFund 15,000 30,000 204,000 30,000 106,000 16,000Short Precious Metals ProFund 124,000 232,000 1,557,000 232,000 809,000 79,000Short Real Estate ProFund 29,000 56,000 385,000 56,000 200,000 26,000Short Small Cap ProFund 58,000 113,000 759,000 113,000 394,000 45,000Small-Cap ProFund 106,000 200,000 1,343,000 200,000 697,000 69,000Technology UltraSector ProFund 984,000 1,847,000 12,323,000 1,847,000 6,407,000 567,000Telecommunications UltraSector
ProFund 10,000 20,000 141,000 20,000 73,000 12,000UltraBear ProFund 404,000 760,000 5,074,000 760,000 2,638,000 238,000UltraBull ProFund 1,238,000 2,323,000 15,492,000 2,323,000 8,055,000 706,000UltraChina ProFund 116,000 217,000 1,458,000 217,000 758,000 73,000UltraDow 30 ProFund 351,000 659,000 4,398,000 659,000 2,286,000 206,000UltraEmerging Markets ProFund 42,000 79,000 539,000 79,000 280,000 33,000UltraInternational ProFund 99,000 187,000 1,253,000 187,000 652,000 63,000UltraJapan ProFund 452,000 848,000 5,654,000 848,000 2,940,000 257,000UltraLatin America ProFund 98,000 185,000 1,243,000 185,000 646,000 63,000UltraMid-Cap ProFund 344,000 646,000 4,323,000 646,000 2,247,000 206,000UltraNasdaq-100 ProFund 5,369,000 10,068,000 67,132,000 10,068,000 34,907,000 3,048,000UltraShort China ProFund 165,000 309,000 2,074,000 309,000 1,077,000 102,000UltraShort Dow 30 ProFund 103,000 195,000 1,307,000 195,000 679,000 66,000UltraShort Emerging Markets
ProFund 32,000 62,000 417,000 62,000 216,000 24,000UltraShort International ProFund 63,000 120,000 813,000 120,000 423,000 47,000UltraShort Japan ProFund 15,000 28,000 189,000 28,000 98,000 11,000UltraShort Latin America ProFund 33,000 63,000 432,000 63,000 224,000 30,000UltraShort Mid-Cap ProFund 64,000 122,000 824,000 122,000 428,000 46,000UltraShort Nasdaq-100 ProFund 5,183,000 9,719,000 64,812,000 9,719,000 33,701,000 2,945,000UltraShort Small-Cap ProFund 216,000 407,000 2,728,000 407,000 1,417,000 135,000UltraSmall-Cap ProFund 524,000 985,000 6,581,000 985,000 3,422,000 307,000U.S. Government Plus ProFund 978,000 1,835,000 12,247,000 1,835,000 6,368,000 563,000Utilities UltraSector ProFund 89,000 168,000 1,125,000 168,000 583,000 60,000
$ 29,424,000 $ 55,244,000 $ 368,774,000 $ 55,244,000 $ 191,726,000 $ 17,117,000
Each repurchase agreement was fully collateralized by U.S. government and/or agency securities as of January 31, 2022 as follows:(1) U.S. Treasury Notes, 0.50%, due 2/28/26, total value $30,019,392.(2) U.S. Treasury Inflation-Protected Securities (TIPS), 0.125%, total value $56,440,441.(3) U.S. Treasury Bonds, 2.75%, due 8/15/47, U.S. Treasury Separate Trading of Registered Interest and Principal of Securities (STRIPS), effective
yield or interest rate in effect at January 31, 2022, 2.192%, due 5/15/40, which had an aggregate value of $376,200,692.(4) U.S. Treasury Inflation-Protected Securities (TIPS), 0.125%, due 4/15/22, total value of $56,358,433.(5) U.S. Treasury Inflation-Protected Securities (TIPS), 0.25%, due 1/15/25, total value $195,571,320.(6) Federal Home Loan Banks, 1.20% to 3.375%, due 12/8/23 to 12/30/24, which had an aggregate value of $17,869,310.
January 31, 2022 (unaudited) :: Notes to Financial Statements :: 279
Reverse Repurchase Agreements
The Bitcoin Strategy ProFund may enter into reverse repurchaseagreements as part of its investment strategy, which may be viewedas a form of borrowing. Reverse repurchase agreements involvesales by the ProFund of portfolio assets for cash concurrently withan agreement by the ProFund to repurchase those same assets at alater date at a fixed price. Generally, the effect of such a transactionis that the ProFund can recover all or most of the cash invested inthe portfolio securities involved during the term of the reverserepurchase agreement, while the ProFund will be able to keep the
interest income associated with those portfolio securities. Suchtransactions are advantageous only if the interest cost to theProFund of the reverse repurchase transaction is less than the costof obtaining the cash otherwise. Opportunities to achieve thisadvantage may not always be available, and the ProFund intendsto use the reverse repurchase technique only when it will be tothe ProFund’s advantage to do so. The ProFund will segregate withits custodian bank cash or liquid instruments equal in value to theProFund’s obligations with respect to reverse repurchaseagreements.
Toppan Merrill - ProFunds Public Semi-Annual Report [Funds] 01-31-2022 ED [AUX] | akiesli | 29-Mar-22 08:44 | 22-1296-2.ga | Sequence: 5CHKSUM Content: 46154 Layout: 33480 Graphics: 0 CLEAN
JOB: 22-1296-2 CYCLE#;BL#: 8; 0 TRIM: 8.25" x 10.75" AS: New York: 212-620-5600COLORS: ~note-color 2, Black, ~note-color 3 GRAPHICS: none V1.5

As of January 31, 2022, the ProFunds’ outstanding balances on reverse repurchase agreements were as follows:
Value & Principal Accrued Counterparty Interest Rate Amount Maturity Value Interest Bitcoin Strategy ProFund UMB Bank N.A. 0.08% $(19,985,000) 2/1/2022 $(19,985,000) $(19,985,044)
For the period ended January 31, 2022, the average daily balance outstanding and average interest rate on the ProFunds’ reverserepurchase agreements were as follows:
Bitcoin Strategy ProFundAverage daily balance outstanding $ 16,744,932Average interest rate 0.08%
The following table presents the reverse repurchase agreements subject to netting agreements and the collateral delivered related tothose reverse repurchase agreements.
Reverse CollateralRepurchase Pledged to
Counterparty Agreements(1) Counterparty(1)
Bitcoin Strategy ProFund UMB Bank N.A. $ (19,985,044) $ 19,985,044
(1) Represents gross value and accrued interest for the counterparty as reported in the preceding table.
280 :: Notes to Financial Statements :: January 31, 2022 (unaudited)
Investments in Other Investment Companies
Each ProFund may invest in other investment companies,including exchange-traded funds (“ETFs”) and unit investmenttrusts (“UITs”), to the extent that such an investment would beconsistent with the requirements of the 1940 Act or any exemptiveorder issued by the SEC. If the ProFund invests in, and thus, is ashareholder of, another investment company, the ProFund’sshareholders will indirectly bear the ProFund’s proportionate shareof the fees and expenses paid by such other investment company,including advisory fees, in addition to both the management feespayable directly by the Fund to the Fund’s own investment adviserand the other expenses that the Fund bears directly in connectionwith the Fund’s own operations. Because most ETFs are investmentcompanies, absent exemptive relief or reliance on an applicableexemptive statute or rule, the ProFund’s investments in suchinvestment companies generally would be limited under applicablefederal statutory provisions. Those provisions typically restrict theProFund’s investment in the shares of another investment companyto up to 5% of its assets (which may represent no more than 3%of the securities of such other investment company) and limitaggregate investments in all investment companies to 10% ofassets. The Fund may invest in certain ETFs in excess of thestatutory limit in reliance on an exemptive order issued by the SECto those entities or pursuant to statutory or exemptive relief andpursuant to procedures approved by the Board provided that theProFund complies with the conditions of the exemptive relief, asthey may be amended from time to time, and any other applicableinvestment limitations.
Depositary Receipts
Each ProFund may invest in American Depositary Receipts(“ADRs”), New York Shares (“NYSs”) and Global DepositaryReceipts (“GDRs”). ADRs represent the right to receive securities offoreign issuers deposited in a bank or corresponding bank. ADRsare an alternative to purchasing the underlying securities in theirnational markets and currencies. For many foreign securities, U.S.dollar-denominated ADRs, which are traded in the United States onexchanges or over-the-counter (“OTC”), are issued by domesticbanks. NYSs (or “direct shares”) are foreign stocks denominated in
U.S. dollars that trade on American exchanges without beingconverted to ADRs. GDRs are receipts for shares in a foreign-basedcorporation traded in capital markets around the world.
The ProFunds may invest in both sponsored and unsponsoreddepositary receipts. Certain depositary receipts, typically thosedesignated as “unsponsored”, require the holders thereof to bearmost of the costs of such facilities, while issuers of “sponsored”facilities normally pay more of the cost thereof. The depositary ofan unsponsored facility frequently is under no obligation todistribute shareholder communications received from the issuerof the deposited securities or to pass through the voting rights tofacility holders with respect to the deposited securities, whereasthe depository of a sponsored facility typically distributesshareholder communications and passes through the voting rights.
Real Estate Investment Trusts
Each ProFund (other than the Non-Equity ProFunds) may investin real estate investment trusts (“REITs”) which reportinformation on the source of their distributions annually. EquityREITs invest primarily in real property while mortgage REITs investin constructions, development and long-term mortgage loans.Their value may be affected by changes in the value of theunderlying property of the REITs, the creditworthiness of theissuer, property taxes, interest rates, and tax regulatoryrequirements, such as those relating to the environment. REITs aredependent upon management skill, are not diversified and aresubject to heavy cash flow dependency, default by borrowers, self-liquidation, the possibility of failing to qualify for tax-freepass-through of income under the Internal Revenue Code of 1986,as amended, and the possibility of failing to maintain exemptstatus under the 1940 Act. Certain distributions received fromREITs during the year are recorded as realized gains or return ofcapital when such information becomes known.
Derivative Instruments
In seeking to achieve each ProFund’s investment objective, theAdvisor uses a mathematical approach to investing. Using thisapproach, the Advisor determines the type, quantity and mix of
Toppan Merrill - ProFunds Public Semi-Annual Report [Funds] 01-31-2022 ED [AUX] | akiesli | 29-Mar-22 08:44 | 22-1296-2.ga | Sequence: 6CHKSUM Content: 27037 Layout: 4242 Graphics: 0 CLEAN
JOB: 22-1296-2 CYCLE#;BL#: 8; 0 TRIM: 8.25" x 10.75" AS: New York: 212-620-5600COLORS: ~note-color 2, Black, ~note-color 3 GRAPHICS: none V1.5
investment positions. Certain ProFunds may obtain investmentexposure through derivative instruments such as futures contracts,forward currency contracts and swap agreements, that a ProFundshould hold to approximate the daily performance, inverseperformance, or multiple thereof, as applicable, of its benchmark.All derivative instruments held during the period endedJanuary 31, 2022, were utilized to gain exposure or inverseexposure to each ProFund’s benchmark (e.g., index, etc.) to meetits investment objective.
The Access Flex Bear High Yield ProFund and Access Flex HighYield ProFund maintain exposure to the high yield market(i.e., U.S. corporate high yield debt market), regardless of marketconditions. This means these ProFunds do not adopt defensivepositions in cash or other instruments in anticipation of an adversemarket climate. The Access Flex Bear High Yield ProFund investsprimarily in derivatives, money market instruments, and U.S.Treasury obligations that the Advisor believes, in combination,should provide investment results that correspond to the high yieldmarket. The Access Flex High Yield ProFund invests primarily inderivatives, money market instruments, and U.S. Treasuryobligations that the Advisor believes, in combination, shouldprovide investment results that correspond to the high yieldmarket. During the period ended January 31, 2022, the ProFundsheld credit default swap agreements for credit exposure to the highyield market and futures contracts and/or treasury notes forinterest rate exposure to meet the ProFunds investment objective.
Each ProFund, other than the Classic ProFunds and the Falling U.S.Dollar ProFund, does not seek to achieve its investment objectiveover a period of time greater than a single day.
All open derivative positions at period end are reflected on eachrespective ProFund’s Schedule of Portfolio Investments. Thevolume associated with derivative positions varies on a daily basisas each ProFund transacts in derivative contracts in order toachieve the appropriate exposure, as expressed in notional amount(contract value for forward currency contracts), in comparison tonet assets consistent with each ProFund’s investment objective.
Certain ProFunds utilized a varying level of derivative instrumentsin conjunction with the investment securities to meet theirinvestment objective during the period ended January 31, 2022.With the exception of the ProFunds listed below, the notionalamount of open derivative positions relative to each ProFund’s netassets at year end is generally representative of the notional amountof open positions to net assets throughout the year. The volumeassociated with derivative positions in the Bull ProFund,Nasdaq-100 ProFund, UltraSmall-Cap ProFund and U.S.Government Plus ProFund was 32%, 41%, 130% and 113%,respectively, based on average monthly notional amounts incomparison to net assets during the period ended January 31, 2022.
In connection with its management of certain series of the Trustincluded in this report (Bitcoin Strategy ProFund, UltraBearProFund, UltraJapan ProFund, UltraShort Dow 30 ProFund,UltraShort Japan ProFund, UltraShort Mid-Cap ProFund,UltraShort Nasdaq-100 ProFund and UltraShort Small-CapProFund (the “Commodity Pools”)), the Advisor is registered as acommodity pool operator (a “CPO”) and the Commodity Poolsare commodity pools under the Commodity Exchange Act (the“CEA”). The Advisor also registered as a commodity tradingadvisor (a “CTA”) under the CEA as a result of its role as subadvisor
to funds outside the Trust. Accordingly, the Advisor is subject toregistration and regulation as a CPO and CTA under the CEA, andmust comply with various regulatory requirements under the CEAand the rules and regulations of the Commodity Futures TradingCommission (“CFTC”) and the National Futures Association(“NFA”), including investor protection requirements, antifraudprovisions, disclosure requirements and reporting andrecordkeeping requirements. The Advisor is also subject to periodicinspections and audits by the CFTC and NFA. Compliance withthese regulatory requirements could adversely affect theCommodity Pools’ total return. In this regard, any furtheramendment to the CEA or its related regulations that subject theAdvisor or the Commodity Pools to additional regulation may haveadverse impacts on the Commodity Pools’ operations andexpenses.
The following is a description of the derivative instrumentsutilized by the ProFunds, including certain risks related to eachinstrument type.
Futures Contracts
Each ProFund may purchase or sell futures contracts as a substitutefor a comparable market position in the underlying securities orto satisfy regulatory requirements. A cash-settled futures contractobligates the seller to deliver (and the purchaser to accept) anamount of cash equal to a specific dollar amount (the contractmultiplier) multiplied by the difference between the finalsettlement price of a specific futures contract and the price atwhich the agreement is made. No physical delivery of theunderlying asset is made.
Each ProFund generally engages in closing or offsettingtransactions before final settlement of a futures contract, whereina second identical futures contract is sold to offset a long position(or bought to offset a short position). In such cases, the obligationis to deliver (or take delivery of) cash equal to a specific dollaramount (the contract multiplier) multiplied by the differencebetween the price of the offsetting transaction and the price atwhich the original contract was entered into. If the originalposition entered into is a long position (futures contractpurchased), there will be a gain (loss) if the offsetting selltransaction is carried out at a higher (lower) price, inclusive ofcommissions. If the original position entered into is a shortposition (futures contract sold), there will be a gain (loss) if theoffsetting buy transaction is carried out at a lower (higher) price,inclusive of commissions.
Whether a ProFund realizes a gain or loss from futures activitiesdepends generally upon movements in the underlying currency,commodity, security or index. The extent of a ProFund’s loss froman unhedged short position in futures contracts is potentiallyunlimited and investors may lose the amount that they invest plusany profits recognized on that investment. Each ProFund willengage in transactions in futures contracts that are traded on a U.S.exchange or board of trade or that have been approved for sale inthe U.S. by the CFTC.
Upon entering into a futures contract, each ProFund will berequired to deposit with the broker an amount of cash or cashequivalents in the range of approximately 5% to 10% of thecontract amount for equity index futures and in the range ofapproximately 1% to 3% of the contract amount for treasury
January 31, 2022 (unaudited) :: Notes to Financial Statements :: 281
Toppan Merrill - ProFunds Public Semi-Annual Report [Funds] 01-31-2022 ED [AUX] | akiesli | 29-Mar-22 08:44 | 22-1296-2.ga | Sequence: 7CHKSUM Content: 45639 Layout: 13960 Graphics: 0 CLEAN
JOB: 22-1296-2 CYCLE#;BL#: 8; 0 TRIM: 8.25" x 10.75" AS: New York: 212-620-5600COLORS: ~note-color 2, Black, ~note-color 3 GRAPHICS: none V1.5

futures (this amount is subject to change by the exchange onwhich the contract is traded). This amount, known as “initialmargin,” is in the nature of a performance bond or good faithdeposit on the contract and is returned to the ProFund upontermination of the futures contract, assuming all contractualobligations have been satisfied. Subsequent payments, known as“variation margin,” to and from the broker will be made daily asthe price of the asset underlying the futures contract fluctuates,making the long and short positions in the futures contract moreor less valuable, a process known as “marking-to-market.” At anytime prior to expiration of a futures contract, a ProFund may electto close its position by taking an opposite position, which willoperate to terminate the ProFund’s existing position in thecontract.
The primary risks associated with the use of futures contracts areimperfect correlation between movements in the price of futuresand the market value of the underlying assets, and the possibilityof an illiquid market for a futures contract. Although each ProFundintends to sell futures contracts only if there is an active marketfor such contracts, no assurance can be given that a liquid marketwill exist for any particular contract at any particular time. Manyfutures exchanges and boards of trade limit the amount offluctuation permitted in futures contract prices during a singletrading day. Once the daily limit has been reached in a particularcontract, no trades may be made that day at a price beyond thatlimit or trading may be suspended for specified periods duringthe day. Futures contract prices could move to the limit for severalconsecutive trading days with little or no trading, therebypreventing prompt liquidation of futures positions and potentiallysubjecting a ProFund to substantial losses. If trading is not possible,or if a ProFund determines not to close a futures position inanticipation of adverse price movements, the ProFund will berequired to make daily cash payments of variation margin. The riskthat the ProFund will be unable to close out a futures position willbe minimized by entering into such transactions on a nationalexchange with an active and liquid secondary market. In addition,although the counterparty to a futures contract is often a clearingorganization, backed by a group of financial institutions, there maybe instances in which the counterparty could fail to perform itsobligations, causing significant losses to a ProFund.
Forward Currency Contracts
The Falling U.S. Dollar and Rising U.S. Dollar ProFunds may investin forward currency contracts for investment or risk managementpurposes. A forward currency contract is an obligation to buy orsell a specific currency at a future date, which may be any fixednumber of days from the date of the contract agreed upon by theparties, at a price set at the time of the contract. These contractsare entered into on the interbank market conducted directlybetween currency traders (usually large commercial banks) andtheir customers.
It is possible that, under certain circumstances, these ProFundsmay have to limit its currency transactions to qualify as a RICunder the Internal Revenue Code. The Falling U.S. Dollar and RisingU.S. Dollar ProFunds do not intend to enter into a forwardcurrency contract with a term of more than one year, or to engagein position hedging with respect to the currency of a particularcountry to more than the aggregate market value (at the time the
hedging transaction is entered into) of their portfolio securitiesdenominated in (or quoted in or currently convertible into ordirectly related through the use of forward currency contracts inconjunction with money market instruments to) that particularcurrency.
At or before the maturity of a forward currency contract, theFalling U.S. Dollar and Rising U.S. Dollar ProFunds may either sella portfolio security and make delivery of the currency, or retainthe security and terminate its contractual obligation to deliver thecurrency by buying an “offsetting” contract obligating it to buy,on the same maturity date, the same amount of the currency. Ifone of these ProFunds engages in an offsetting transaction, it maylater enter into a new forward currency contract to sell thecurrency.
If the Falling U.S. Dollar and Rising U.S. Dollar ProFunds engagein offsetting transactions it will incur a gain or loss, to the extentthat there has been movement in forward currency contract prices.If forward prices go down during the period between the date theFalling U.S. Dollar and Rising U.S. Dollar ProFunds enter into aforward currency contract for the sale of a currency and the dateit enters into an offsetting contract for the purchase of thecurrency, the ProFund will realize a gain to the extent that the priceof ProFund currency it has agreed to sell exceeds the price of thecurrency it has agreed to buy. If forward prices go up, the ProFundwill suffer a loss to the extent the price of the currency it hasagreed to buy exceeds the price of the currency it has agreedto sell.
The Falling U.S. Dollar and Rising U.S. Dollar ProFunds collateralizeforward currency contracts with cash and certain securities asindicated on the Statement of Assets and Liabilities and theSchedule of Portfolio Investments, respectively. Such collateral isheld for the benefit of the counterparty in a segregated tri-partyaccount at the custodian, to protect the counterparty against non-payment by the respective ProFund. Similarly, the Falling U.S.Dollar and Rising U.S. Dollar ProFunds have sought to mitigatecredit risk by generally requiring that the counterparties to theProFund post collateral for the benefit of the ProFund in asegregated account at the custodian, marked to market daily, in anamount equal to what the counterparty owes the ProFund, subjectto certain minimum thresholds. In the event of a default by thecounterparty, each ProFund will seek withdrawal of this collateralfrom the segregated account and may incur certain costs exercisingits right with respect to the collateral. If a counterparty becomesbankrupt or fails to perform its obligations, the Falling U.S. Dollarand Rising U.S. Dollar ProFunds may experience significant delaysin obtaining any recovery in a bankruptcy or other reorganizationproceeding. The ProFunds may obtain only limited recovery or mayobtain no recovery in such circumstances. The Falling U.S. Dollarand Rising U.S. Dollar ProFunds will enter into forward currencycontracts only with financial institutions that meet the creditquality standards and monitoring policies established by theAdvisor. As of January 31, 2022, the collateral posted bycounterparties consisted of U.S. Treasury securities and cash.
Credit Default Swap (“CDS”) Agreements
As of January 31, 2022, the Access Flex Bear High Yield ProFundinvested in centrally cleared credit default swaps as a substitute for
282 :: Notes to Financial Statements :: January 31, 2022 (unaudited)
Toppan Merrill - ProFunds Public Semi-Annual Report [Funds] 01-31-2022 ED [AUX] | akiesli | 29-Mar-22 08:44 | 22-1296-2.ga | Sequence: 8CHKSUM Content: 23288 Layout: 10413 Graphics: 0 CLEAN
JOB: 22-1296-2 CYCLE#;BL#: 8; 0 TRIM: 8.25" x 10.75" AS: New York: 212-620-5600COLORS: ~note-color 2, Black, ~note-color 3 GRAPHICS: none V1.5
shorting notes in order to gain inverse credit exposure to the highyield market. As of July 31, 2021, the Access Flex High YieldProFund invested in centrally cleared credit default swaps as asubstitute for investing directly in notes in order to gain creditexposure to the high yield market.
In a CDS, the agreement will reference one or more debt securitiesor reference entities. The protection “buyer” in a credit defaultcontract is generally obligated to pay the protection “seller” aperiodic stream of payments over the term of the contract until acredit event, such as a default, on a reference entity has occurred.If a credit event occurs, the seller generally must pay the buyer:a) the full notional value of the swap; or b) the difference betweenthe notional value of the defaulted reference entity and therecovery price/rate for the defaulted reference entity. CDS aredesigned to reflect changes in credit quality, including events ofdefault. A CDS may require premium (discount) payments as wellas daily payments (receipts) related to the interest leg of the swapor to the default or change in price of a reference entity.
The counterparty risk for cleared swap agreements is generallylower than for uncleared over-the-counter swap agreementsbecause, generally, a clearing organization becomes substituted foreach counterparty to a cleared swap agreement and, in effect,guarantees each party’s performance under the contract as eachparty to a trade looks only to the clearing organization forperformance of financial obligations. However, there can be noassurance that the clearing organization, or its members, willsatisfy its obligations to a ProFund.
If a ProFund is a seller of a CDS contract (also referred to as a sellerof protection or as a buyer of risk), the ProFund would be requiredto pay the par (or other agreed upon) value of a referencedobligation to the counterparty in the event of a default or othercredit event. In return, the ProFund would receive from thecounterparty a daily stream of payments over the term of thecontract provided that no event of default has occurred. If nodefault occurs, the ProFund would keep the stream of paymentsand would have no payment obligations. As the seller, the ProFundwould be subject to investment exposure on the notional amountof the swap.
If a ProFund is a buyer of a CDS contract (also referred to as abuyer of protection or a seller of risk), the ProFund would havethe right to deliver a reference obligation and receive the par (orother agreed-upon) value of such obligation from thecounterparty in the event of a default or other credit event (suchas a credit downgrade). In return, the ProFund would pay thecounterparty a daily stream of payments over the term of thecontract provided that no event of default has occurred. If nodefault occurs, the counterparty would keep the stream ofpayments and would have no further obligations to the ProFund.
The ProFunds enter into a CDS with multiple reference entities, inwhich case payments and settlements in respect of any defaultingreference entity would typically be dealt with separately from theother reference entities.
Upon entering into a centrally cleared CDS, a ProFund may berequired to deposit with the broker an amount of cash or cashequivalents in the range of approximately 3% to 6% of thenotional amount for CDS on high yield debt issuers (this amount
is subject to change by the clearing organization that clears thetrade). This amount, known as “initial margin,” is in the nature ofa performance bond or good faith deposit on the CDS and isreturned to a ProFund upon termination of the CDS, assuming allcontractual obligations have been satisfied. Subsequent payments,known as “variation margin,” to and from the broker will be madedaily as the price of the CDS fluctuates, making the long and shortpositions in the CDS contract more or less valuable, a processknown as “marking-to-market.” The premium (discount)payments are built into the daily price of the CDS and thus areamortized through the variation margin. The variation marginpayment also includes the daily portion of the periodic paymentstream.
Swap Agreements (other than CDS)
Each ProFund may enter into swap agreements to gain exposureto an underlying asset without actually purchasing such asset (orshorting such asset), or to hedge a position, including incircumstances in which direct investment is restricted for legalreasons or is otherwise impracticable. Swap agreements are two-party contracts entered into primarily by institutional investors forperiods ranging from a day to more than one year. In a standard“swap” transaction, two parties agree to exchange the return (ordifferentials in rates of return) earned or realized on particularpre-determined investments or instruments. The gross return tobe exchanged or “swapped” between the parties is calculated withrespect to a “notional amount,” e.g., the return on or increase invalue of a particular dollar amount invested in a “basket” ofsecurities or an ETF representing a particular index or group ofsecurities.
On a typical long swap, the counterparty will generally agree topay the ProFund the amount, if any, by which the notional amountof the swap agreement would have increased in value had it beeninvested in the particular underlying assets (e.g., securitiescomprising the relevant benchmark index), plus the dividends orinterest that would have been received on those assets. The ProFundwill agree to pay to the counterparty a floating rate of interest onthe notional amount of the swap agreement plus the amount, ifany, by which the notional amount would have decreased in valuehad it been invested in such assets, plus, in certain circumstances,commissions or trading spreads on the notional amount.Therefore, the return to the ProFund on any swap agreementshould be the gain or loss on the notional amount plus dividendsor interest on the assets less the interest paid by the ProFund onthe notional amount. As a trading technique, the Advisor maysubstitute physical securities with a swap agreement havinginvestment characteristics substantially similar to the underlyingsecurities. Some ProFunds may also enter into swap agreementsthat provide the opposite return of their benchmark or security(“short” the benchmark or security). Their operations are similarto that of the swaps disclosed above except that the counterpartypays interest to each ProFund on the notional amount outstandingand that dividends or interest on the underlying instrumentsreduce the value of the swap, plus, in certain instances, eachProFund will agree to pay to the counterparty commissions ortrading spreads on the notional amount.
Most swap agreements entered into by a ProFund calculate andsettle the obligations of the parties to the agreement on a “net
January 31, 2022 (unaudited) :: Notes to Financial Statements :: 283
Toppan Merrill - ProFunds Public Semi-Annual Report [Funds] 01-31-2022 ED [AUX] | akiesli | 29-Mar-22 08:44 | 22-1296-2.ga | Sequence: 9CHKSUM Content: 6130 Layout: 1667 Graphics: 0 CLEAN
JOB: 22-1296-2 CYCLE#;BL#: 8; 0 TRIM: 8.25" x 10.75" AS: New York: 212-620-5600COLORS: ~note-color 2, Black, ~note-color 3 GRAPHICS: none V1.5
basis” with a single payment. Consequently, a ProFund’s currentobligations (or rights) under a swap agreement will generally beequal only to the net amount to be paid or received under theagreement based on the relative values of the positions held byeach party to the agreement (the “net amount”). When investingin index swap agreements, the ProFunds may hold or gainexposure to only a representative sample of securities in the index,or to a component of the index.
A ProFund’s current obligations under a swap agreement, will beaccrued daily (offset against any amounts owed to the ProFund)and any accrued but unpaid net amounts owed to a swapcounterparty will be covered by segregating or earmarking cashand/or securities determined to be liquid, but typically nopayments will be made until the settlement date. Each ProFundreserves the right to modify its asset segregation policies in thefuture, including modifications to comply with any changes in thepositions articulated by the SEC or its staff regarding assetsegregation. Swap agreements that cannot be terminated of in theordinary course of business within seven days at approximatelythe amount a ProFund has valued the asset may be considered tobe illiquid for purposes of a ProFund illiquid investmentlimitations.
A ProFund bears the risk of loss of the amount expected to bereceived under a swap agreement in the event of the default orbankruptcy of a swap agreement counterparty. If such a defaultoccurs, a ProFund will have contractual remedies pursuant to theswap agreements, but such remedies may be subject to bankruptcyand insolvency laws that could affect the ProFund’s rights as acreditor. A ProFund will only enter into swap agreements withcounterparties that meet the ProFund’s standard ofcreditworthiness (generally, such counterparties would have to beeligible counterparties under the terms of the ProFund’srepurchase agreement guidelines). The counterparty to anuncleared swap agreement will typically be a major, globalfinancial institution.
Payments may be made at the conclusion of a swap agreement.Swap agreements do not involve the delivery of securities or otherunderlying assets. Accordingly, the risk of loss with respect to swapagreements is limited to the net amount of payments that aProFund is contractually obligated to make. If the other party to aswap agreement defaults, a ProFund’s risk of loss consists of thenet amount of payments that such ProFund is contractually entitledto receive, if any. The net amount of the excess, if any, of aProFund’s obligations over its entitlements with respect to eachequity swap will be accrued on a daily basis and an amount ofcash or liquid assets, having an aggregate NAV at least equal tosuch accrued excess will be earmarked or segregated by aProFund’s custodian.
In the normal course of business, a ProFund enters intoInternational Swap Dealers Association, Inc. (“ISDA”) agreementswith certain counterparties for derivative transactions. Theseagreements contain, among other conditions, events of default andtermination events, and various covenants and representations.
Certain of the ProFund’s ISDA agreements contain provisions thatrequire the ProFund to maintain a pre-determined level of netassets, and/or provide limits regarding the decline of theProFund’s NAV over specific periods of time, which may or maynot be exclusive of redemptions. If the ProFund were to triggersuch provisions and have open derivative positions, at that timecounterparties to the ISDA agreements could elect to terminatesuch ISDA agreements and request immediate payment in anamount equal to the net liability positions, if any, under therelevant ISDA agreement. Pursuant to the terms of its ISDAagreements, the ProFund will have already collateralized its liabilityunder such agreements, in some cases only in excess of certainthreshold amounts. Such collateral is held for the benefit of thecounterparty in a segregated tri-party account at the custodian, toprotect the counterparty against non-payment by the respectiveProFund. The ProFunds seek to mitigate risks by generallyrequiring that the counterparties for each ProFund agree to postcollateral for the benefit of the ProFund, marked to market daily,in an amount approximately equal to what the counterparty owesthe ProFund, subject to certain minimum thresholds, although theProFunds may not always be successful. To the extent any suchcollateral is insufficient or there are delays in accessing thecollateral, the ProFunds will be exposed to the risks describedabove, including possible delays in recovering amounts as a resultof bankruptcy proceedings. As of January 31, 2022, the collateralposted by counterparties consisted of U.S. Treasury securities andcash.
The use of swaps, including CDS, is a highly specialized activitywhich involves investment techniques and risks in addition to andin some cases different from those associated with ordinaryportfolio securities transactions. The primary risks associated withthe use of swap agreements are mispricing or improper valuation,imperfect correlation between movements in the notional amountand the price of the underlying investments, and the inability ofthe counterparties to perform. If a counterparty’s creditworthinessfor an over-the-counter swap declines, the value of the swap wouldlikely decline. The Advisor, under the supervision of the Trust’sBoard of Trustees, is responsible for determining and monitoringthe liquidity of a ProFund’s transactions in swap agreements.
Offsetting Assets and Liabilities
The ProFunds are subject to master netting agreements for swapagreements (other than centrally cleared CDS) and forwardcurrency contracts that allow for amounts owed between theProFund and the counterparty to be netted upon early termination.The party that has the larger payable pays the excess of the largeramount over the smaller amount to the other party. The masternetting agreements do not apply to amounts owed to/fromdifferent counterparties.
As described above, the ProFunds utilize derivative instruments toachieve their investment objective during the period. The amountsshown in the Statements of Assets and Liabilities generally do nottake into consideration the effects of legally enforceable masternetting agreements.
284 :: Notes to Financial Statements :: January 31, 2022 (unaudited)
Toppan Merrill - ProFunds Public Semi-Annual Report [Funds] 01-31-2022 ED [AUX] | akiesli | 29-Mar-22 08:44 | 22-1296-2.ga | Sequence: 10CHKSUM Content: 46966 Layout: 28802 Graphics: 0 CLEAN
JOB: 22-1296-2 CYCLE#;BL#: 8; 0 TRIM: 8.25" x 10.75" AS: New York: 212-620-5600COLORS: ~note-color 2, Black, ~note-color 3 GRAPHICS: none V1.5

Summary of Derivative Instruments
The following table summarizes the fair values of derivative instruments on the ProFund’s Statement of Assets and Liabilities, categorizedby risk exposure, as of January 31, 2022.
Assets Liabilities
Unrealized UnrealizedVariation Unrealized Appreciation Variation Unrealized Depreciation
Margin on Appreciation on Forward Margin on Depreciation on ForwardFutures on Swap Currency Futures on Swap Currency
Fund Contracts* Agreements* Contracts Contracts* Agreements* Contracts Commodity Risk Exposure:Bitcoin Strategy ProFund $ 501,496 $ — $ — $ 945,087 $ — $ —
Credit Risk Exposure:Access Flex Bear High Yield ProFund — 14,111 — — — —Access Flex High Yield ProFund — — — — 168,307 —
Equity Risk Exposure:Banks UltraSector ProFund — 230,128 — — — —Basic Materials UltraSector ProFund — 5,048 — — — —Bear ProFund — — — — 452,325 —Biotechnology UltraSector ProFund — 1,886,688 — — — —Bull ProFund — 411,546 — — — —Communication Services UltraSector ProFund — 79,570 — — — —Consumer Goods UltraSector ProFund — — — — 17,360 —Consumer Services UltraSector ProFund — 678,927 — — — —Financials UltraSector ProFund — 188,092 — — — —Health Care UltraSector ProFund — 196,638 — — — —Industrials UltraSector ProFund — 320 — — 9,912 —Internet UltraSector ProFund — 2,395,992 — — — —Mid-Cap ProFund — 81,823 — — — —Nasdaq-100 ProFund — 3,233,959 — 57,042 — —Oil & Gas UltraSector ProFund — 1,307,541 — — — —Oil Equipment & Services UltraSector ProFund — 305,002 — — — —Pharmaceuticals UltraSector ProFund — 103,526 — — — —Precious Metals UltraSector ProFund — — — — 416,522 —Real Estate UltraSector ProFund — 118,514 — — — —Semiconductor UltraSector ProFund — 875,019 — — — —Short Nasdaq-100 ProFund — — — — 3,563,991 —Short Oil & Gas ProFund — — — — 19,660 —Short Precious Metals ProFund — 77,308 — — — —Short Real Estate ProFund — 778 — — 9,000 —Short Small-Cap ProFund 9,225 — — — 66,522 —Small-Cap ProFund — 130,155 — — — —Technology UltraSector ProFund — 2,451,898 — — — —Telecommunications UltraSector ProFund — — — — 10,269 —UltraBear ProFund — — — — 801,252 —UltraBull ProFund — 6,335,470 — — — —UltraChina ProFund — 2,202,764 — — — —UltraDow 30 ProFund — 1,187,131 — 49,756 — —UltraEmerging Markets ProFund — 716,612 — — — —UltraInternational ProFund — 86,189 — — — —UltraJapan ProFund — 8,269 — 441,251 — —UltraLatin America ProFund — 154,155 — — — —UltraMid-Cap ProFund — 2,300,113 — — — —UltraNasdaq-100 ProFund — 69,148,918 — 28,521 — —UltraShort China ProFund — — — — 850,317 —UltraShort Dow 30 ProFund — — — — 146,447 —UltraShort Emerging Markets ProFund — — — — 105,836 —UltraShort International ProFund — — — — 58,857 —UltraShort Japan ProFund 7,641 — — — 11,146 —UltraShort Latin America ProFund — — — — 16,681 —UltraShort Mid-Cap ProFund — — — — 128,569 —UltraShort Nasdaq-100 ProFund — — — — 8,917,874 —UltraShort Small-Cap ProFund 55,354 — — — 500,583 —UltraSmall-Cap ProFund — 4,124,805 — 230,734 — —Utilities UltraSector ProFund — 109,778 — — — —
January 31, 2022 (unaudited) :: Notes to Financial Statements :: 285
Toppan Merrill - ProFunds Public Semi-Annual Report [Funds] 01-31-2022 ED [AUX] | akiesli | 29-Mar-22 08:44 | 22-1296-2.ga | Sequence: 11CHKSUM Content: 35141 Layout: 35416 Graphics: 0 CLEAN
JOB: 22-1296-2 CYCLE#;BL#: 8; 0 TRIM: 8.25" x 10.75" AS: New York: 212-620-5600COLORS: ~note-color 2, Black, ~note-color 3 GRAPHICS: none V1.5
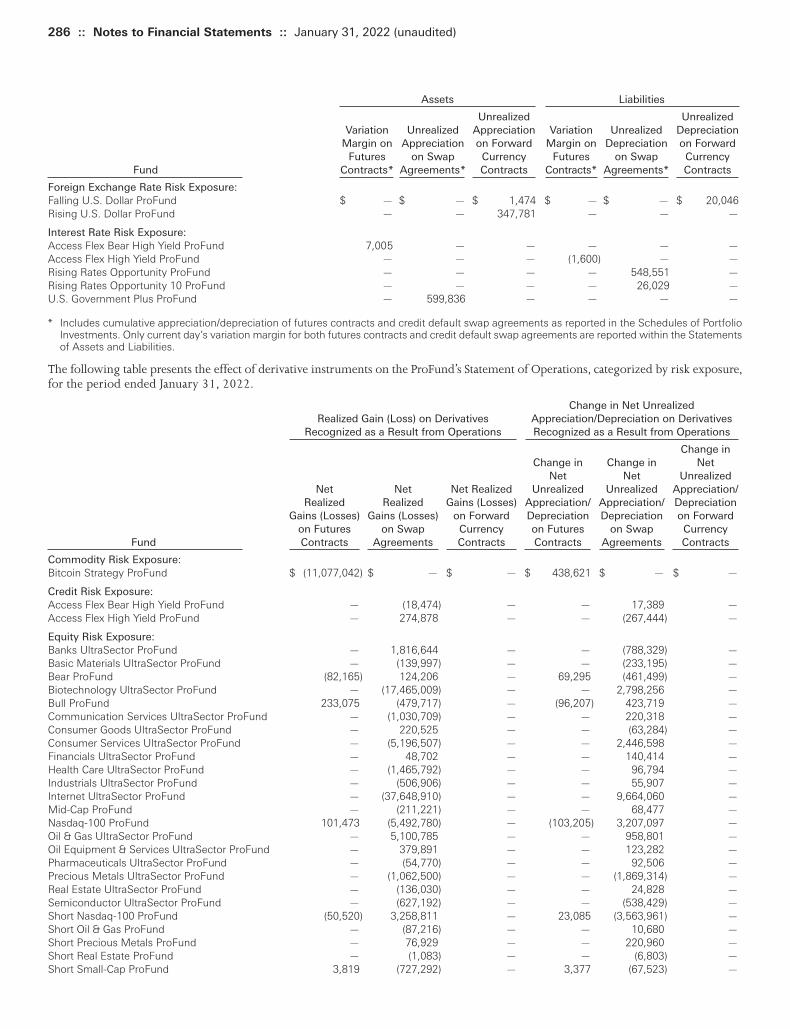
Assets Liabilities
Unrealized UnrealizedVariation Unrealized Appreciation Variation Unrealized Depreciation
Margin on Appreciation on Forward Margin on Depreciation on ForwardFutures on Swap Currency Futures on Swap Currency
Fund Contracts* Agreements* Contracts Contracts* Agreements* Contracts Foreign Exchange Rate Risk Exposure:Falling U.S. Dollar ProFund $ — $ — $ 1,474 $ — $ — $ 20,046Rising U.S. Dollar ProFund — — 347,781 — — —
Interest Rate Risk Exposure:Access Flex Bear High Yield ProFund 7,005 — — — — —Access Flex High Yield ProFund — — — (1,600) — —Rising Rates Opportunity ProFund — — — — 548,551 —Rising Rates Opportunity 10 ProFund — — — — 26,029 —U.S. Government Plus ProFund — 599,836 — — — —
* Includes cumulative appreciation/depreciation of futures contracts and credit default swap agreements as reported in the Schedules of PortfolioInvestments. Only current day’s variation margin for both futures contracts and credit default swap agreements are reported within the Statementsof Assets and Liabilities.
The following table presents the effect of derivative instruments on the ProFund’s Statement of Operations, categorized by risk exposure,for the period ended January 31, 2022.
Change in Net UnrealizedRealized Gain (Loss) on Derivatives Appreciation/Depreciation on Derivatives
Recognized as a Result from Operations Recognized as a Result from Operations
Change in Change in Change in Net Net Net Unrealized Net Net Net Realized Unrealized Unrealized Appreciation/ Realized Realized Gains (Losses) Appreciation/ Appreciation/ Depreciation Gains (Losses) Gains (Losses) on Forward Depreciation Depreciation on Forward on Futures on Swap Currency on Futures on Swap Currency Fund Contracts Agreements Contracts Contracts Agreements Contracts
Commodity Risk Exposure:Bitcoin Strategy ProFund $ (11,077,042) $ — $ — $ 438,621 $ — $ —
Credit Risk Exposure:Access Flex Bear High Yield ProFund — (18,474) — — 17,389 —Access Flex High Yield ProFund — 274,878 — — (267,444) —
Equity Risk Exposure:Banks UltraSector ProFund — 1,816,644 — — (788,329) —Basic Materials UltraSector ProFund — (139,997) — — (233,195) —Bear ProFund (82,165) 124,206 — 69,295 (461,499) —Biotechnology UltraSector ProFund — (17,465,009) — — 2,798,256 —Bull ProFund 233,075 (479,717) — (96,207) 423,719 —Communication Services UltraSector ProFund — (1,030,709) — — 220,318 —Consumer Goods UltraSector ProFund — 220,525 — — (63,284) —Consumer Services UltraSector ProFund — (5,196,507) — — 2,446,598 —Financials UltraSector ProFund — 48,702 — — 140,414 —Health Care UltraSector ProFund — (1,465,792) — — 96,794 —Industrials UltraSector ProFund — (506,906) — — 55,907 —Internet UltraSector ProFund — (37,648,910) — — 9,664,060 —Mid-Cap ProFund — (211,221) — — 68,477 —Nasdaq-100 ProFund 101,473 (5,492,780) — (103,205) 3,207,097 —Oil & Gas UltraSector ProFund — 5,100,785 — — 958,801 —Oil Equipment & Services UltraSector ProFund — 379,891 — — 123,282 —Pharmaceuticals UltraSector ProFund — (54,770) — — 92,506 —Precious Metals UltraSector ProFund — (1,062,500) — — (1,869,314) —Real Estate UltraSector ProFund — (136,030) — — 24,828 —Semiconductor UltraSector ProFund — (627,192) — — (538,429) —Short Nasdaq-100 ProFund (50,520) 3,258,811 — 23,085 (3,563,961) —Short Oil & Gas ProFund — (87,216) — — 10,680 —Short Precious Metals ProFund — 76,929 — — 220,960 —Short Real Estate ProFund — (1,083) — — (6,803) —Short Small-Cap ProFund 3,819 (727,292) — 3,377 (67,523) —
286 :: Notes to Financial Statements :: January 31, 2022 (unaudited)
Toppan Merrill - ProFunds Public Semi-Annual Report [Funds] 01-31-2022 ED [AUX] | akiesli | 29-Mar-22 08:44 | 22-1296-2.ga | Sequence: 12CHKSUM Content: 56891 Layout: 44837 Graphics: 0 CLEAN
JOB: 22-1296-2 CYCLE#;BL#: 8; 0 TRIM: 8.25" x 10.75" AS: New York: 212-620-5600COLORS: ~note-color 2, Black, ~note-color 3 GRAPHICS: none V1.5
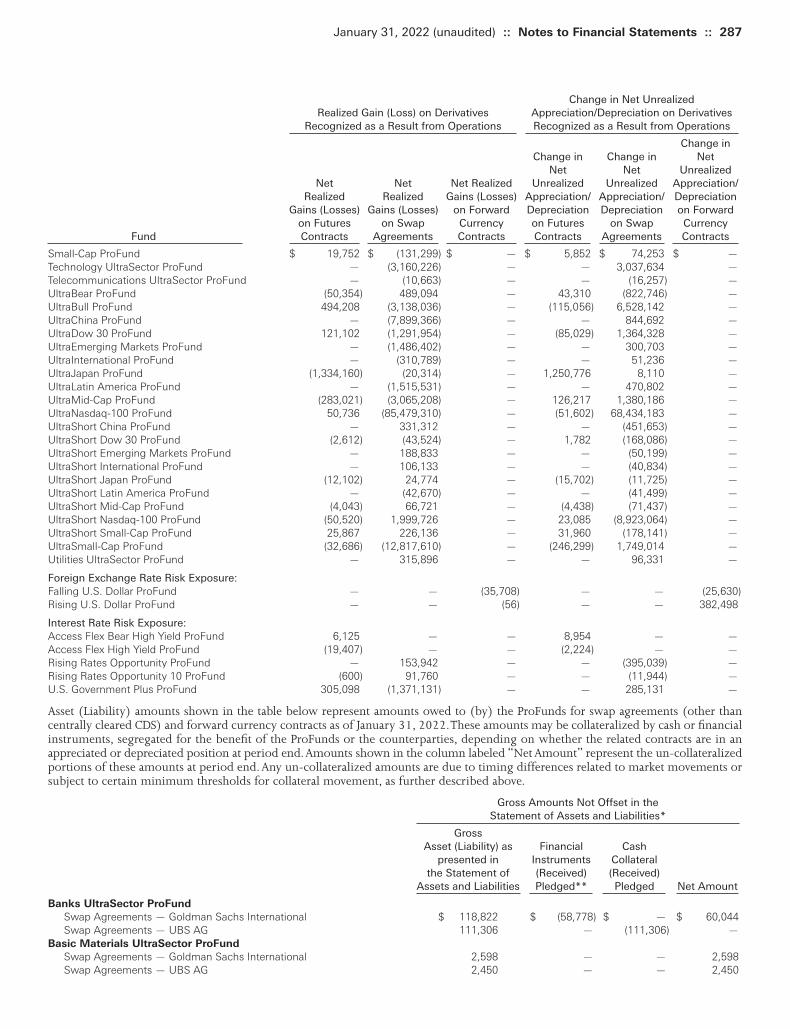
Change in Net UnrealizedRealized Gain (Loss) on Derivatives Appreciation/Depreciation on Derivatives
Recognized as a Result from Operations Recognized as a Result from Operations
Change in Change in Change in Net Net Net Unrealized Net Net Net Realized Unrealized Unrealized Appreciation/ Realized Realized Gains (Losses) Appreciation/ Appreciation/ Depreciation Gains (Losses) Gains (Losses) on Forward Depreciation Depreciation on Forward on Futures on Swap Currency on Futures on Swap Currency Fund Contracts Agreements Contracts Contracts Agreements Contracts
Small-Cap ProFund $ 19,752 $ (131,299) $ — $ 5,852 $ 74,253 $ —Technology UltraSector ProFund — (3,160,226) — — 3,037,634 —Telecommunications UltraSector ProFund — (10,663) — — (16,257) —UltraBear ProFund (50,354) 489,094 — 43,310 (822,746) —UltraBull ProFund 494,208 (3,138,036) — (115,056) 6,528,142 —UltraChina ProFund — (7,899,366) — — 844,692 —UltraDow 30 ProFund 121,102 (1,291,954) — (85,029) 1,364,328 —UltraEmerging Markets ProFund — (1,486,402) — — 300,703 —UltraInternational ProFund — (310,789) — — 51,236 —UltraJapan ProFund (1,334,160) (20,314) — 1,250,776 8,110 —UltraLatin America ProFund — (1,515,531) — — 470,802 —UltraMid-Cap ProFund (283,021) (3,065,208) — 126,217 1,380,186 —UltraNasdaq-100 ProFund 50,736 (85,479,310) — (51,602) 68,434,183 —UltraShort China ProFund — 331,312 — — (451,653) —UltraShort Dow 30 ProFund (2,612) (43,524) — 1,782 (168,086) —UltraShort Emerging Markets ProFund — 188,833 — — (50,199) —UltraShort International ProFund — 106,133 — — (40,834) —UltraShort Japan ProFund (12,102) 24,774 — (15,702) (11,725) —UltraShort Latin America ProFund — (42,670) — — (41,499) —UltraShort Mid-Cap ProFund (4,043) 66,721 — (4,438) (71,437) —UltraShort Nasdaq-100 ProFund (50,520) 1,999,726 — 23,085 (8,923,064) —UltraShort Small-Cap ProFund 25,867 226,136 — 31,960 (178,141) —UltraSmall-Cap ProFund (32,686) (12,817,610) — (246,299) 1,749,014 —Utilities UltraSector ProFund — 315,896 — — 96,331 —
Foreign Exchange Rate Risk Exposure:Falling U.S. Dollar ProFund — — (35,708) — — (25,630)Rising U.S. Dollar ProFund — — (56) — — 382,498
Interest Rate Risk Exposure:Access Flex Bear High Yield ProFund 6,125 — — 8,954 — —Access Flex High Yield ProFund (19,407) — — (2,224) — —Rising Rates Opportunity ProFund — 153,942 — — (395,039) —Rising Rates Opportunity 10 ProFund (600) 91,760 — — (11,944) —U.S. Government Plus ProFund 305,098 (1,371,131) — — 285,131 —
Asset (Liability) amounts shown in the table below represent amounts owed to (by) the ProFunds for swap agreements (other thancentrally cleared CDS) and forward currency contracts as of January 31, 2022. These amounts may be collateralized by cash or financialinstruments, segregated for the benefit of the ProFunds or the counterparties, depending on whether the related contracts are in anappreciated or depreciated position at period end. Amounts shown in the column labeled “Net Amount” represent the un-collateralizedportions of these amounts at period end. Any un-collateralized amounts are due to timing differences related to market movements orsubject to certain minimum thresholds for collateral movement, as further described above.
Gross Amounts Not Offset in theStatement of Assets and Liabilities*
GrossAsset (Liability) as Financial Cash
presented in Instruments Collateralthe Statement of (Received) (Received)
Assets and Liabilities Pledged** Pledged Net Amount
Banks UltraSector ProFund
Swap Agreements — Goldman Sachs International $ 118,822 $ (58,778) $ — $ 60,044Swap Agreements — UBS AG 111,306 — (111,306) —
Basic Materials UltraSector ProFund
Swap Agreements — Goldman Sachs International 2,598 — — 2,598Swap Agreements — UBS AG 2,450 — — 2,450
January 31, 2022 (unaudited) :: Notes to Financial Statements :: 287
Toppan Merrill - ProFunds Public Semi-Annual Report [Funds] 01-31-2022 ED [AUX] | akiesli | 29-Mar-22 08:44 | 22-1296-2.ga | Sequence: 13CHKSUM Content: 21917 Layout: 31419 Graphics: 0 CLEAN
JOB: 22-1296-2 CYCLE#;BL#: 8; 0 TRIM: 8.25" x 10.75" AS: New York: 212-620-5600COLORS: ~note-color 2, Black, ~note-color 3 GRAPHICS: none V1.5
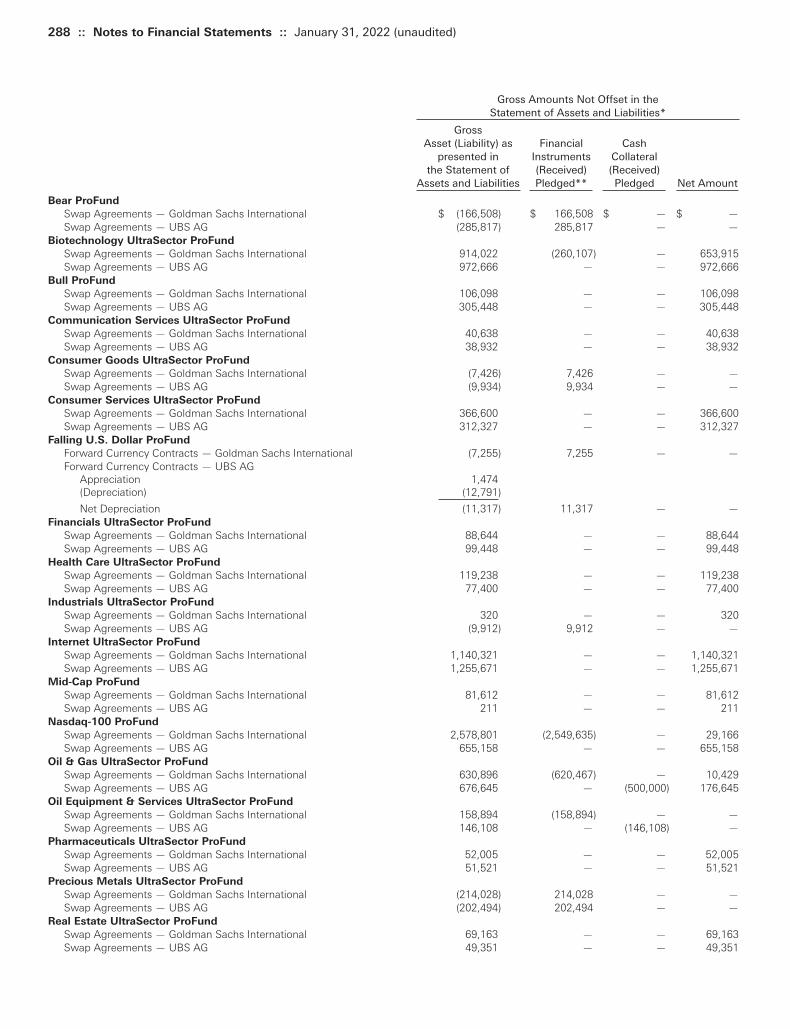
Gross Amounts Not Offset in theStatement of Assets and Liabilities*
GrossAsset (Liability) as Financial Cash
presented in Instruments Collateralthe Statement of (Received) (Received)
Assets and Liabilities Pledged** Pledged Net Amount
Bear ProFund
Swap Agreements — Goldman Sachs International $ (166,508) $ 166,508 $ — $ —Swap Agreements — UBS AG (285,817) 285,817 — —
Biotechnology UltraSector ProFund
Swap Agreements — Goldman Sachs International 914,022 (260,107) — 653,915Swap Agreements — UBS AG 972,666 — — 972,666
Bull ProFund
Swap Agreements — Goldman Sachs International 106,098 — — 106,098Swap Agreements — UBS AG 305,448 — — 305,448
Communication Services UltraSector ProFund
Swap Agreements — Goldman Sachs International 40,638 — — 40,638Swap Agreements — UBS AG 38,932 — — 38,932
Consumer Goods UltraSector ProFund
Swap Agreements — Goldman Sachs International (7,426) 7,426 — —Swap Agreements — UBS AG (9,934) 9,934 — —
Consumer Services UltraSector ProFund
Swap Agreements — Goldman Sachs International 366,600 — — 366,600Swap Agreements — UBS AG 312,327 — — 312,327
Falling U.S. Dollar ProFund
Forward Currency Contracts — Goldman Sachs International (7,255) 7,255 — —Forward Currency Contracts — UBS AG
Appreciation 1,474(Depreciation) (12,791)
Net Depreciation (11,317) 11,317 — —Financials UltraSector ProFund
Swap Agreements — Goldman Sachs International 88,644 — — 88,644Swap Agreements — UBS AG 99,448 — — 99,448
Health Care UltraSector ProFund
Swap Agreements — Goldman Sachs International 119,238 — — 119,238Swap Agreements — UBS AG 77,400 — — 77,400
Industrials UltraSector ProFund
Swap Agreements — Goldman Sachs International 320 — — 320Swap Agreements — UBS AG (9,912) 9,912 — —
Internet UltraSector ProFund
Swap Agreements — Goldman Sachs International 1,140,321 — — 1,140,321Swap Agreements — UBS AG 1,255,671 — — 1,255,671
Mid-Cap ProFund
Swap Agreements — Goldman Sachs International 81,612 — — 81,612Swap Agreements — UBS AG 211 — — 211
Nasdaq-100 ProFund
Swap Agreements — Goldman Sachs International 2,578,801 (2,549,635) — 29,166Swap Agreements — UBS AG 655,158 — — 655,158
Oil & Gas UltraSector ProFund
Swap Agreements — Goldman Sachs International 630,896 (620,467) — 10,429Swap Agreements — UBS AG 676,645 — (500,000) 176,645
Oil Equipment & Services UltraSector ProFund
Swap Agreements — Goldman Sachs International 158,894 (158,894) — —Swap Agreements — UBS AG 146,108 — (146,108) —
Pharmaceuticals UltraSector ProFund
Swap Agreements — Goldman Sachs International 52,005 — — 52,005Swap Agreements — UBS AG 51,521 — — 51,521
Precious Metals UltraSector ProFund
Swap Agreements — Goldman Sachs International (214,028) 214,028 — —Swap Agreements — UBS AG (202,494) 202,494 — —
Real Estate UltraSector ProFund
Swap Agreements — Goldman Sachs International 69,163 — — 69,163Swap Agreements — UBS AG 49,351 — — 49,351
288 :: Notes to Financial Statements :: January 31, 2022 (unaudited)
Toppan Merrill - ProFunds Public Semi-Annual Report [Funds] 01-31-2022 ED [AUX] | akiesli | 29-Mar-22 08:44 | 22-1296-2.ga | Sequence: 14CHKSUM Content: 41405 Layout: 9662 Graphics: 0 CLEAN
JOB: 22-1296-2 CYCLE#;BL#: 8; 0 TRIM: 8.25" x 10.75" AS: New York: 212-620-5600COLORS: ~note-color 2, Black, ~note-color 3 GRAPHICS: none V1.5

Gross Amounts Not Offset in theStatement of Assets and Liabilities*
GrossAsset (Liability) as Financial Cash
presented in Instruments Collateralthe Statement of (Received) (Received)
Assets and Liabilities Pledged** Pledged Net Amount
Rising Rates Opportunity ProFund
Swap Agreements — Citibank North America $ (494,519) $ 490,000 $ — $ (4,519)Swap Agreements — Societe’ Generale (54,032) 30,000 — (24,032)
Rising Rates Opportunity 10 ProFund
Swap Agreements — Citibank North America (10,453) 10,453 — —Swap Agreements — Societe’ Generale (15,576) 15,576 — —
Rising U.S. Dollar ProFund
Forward Currency Contracts — Goldman Sachs International 79,108 (79,108) — —Forward Currency Contracts — UBS AG 268,673 — (268,673) —
Semiconductor UltraSector ProFund
Swap Agreements — Goldman Sachs International 449,481 — — 449,481Swap Agreements — UBS AG 425,538 — — 425,538
Short Nasdaq-100 ProFund
Swap Agreements — Goldman Sachs International (2,603,436) 2,603,436 — —Swap Agreements — UBS AG (960,555) 960,555 — —
Short Oil & Gas ProFund
Swap Agreements — Goldman Sachs International (11,012) 11,012 — —Swap Agreements — UBS AG (8,648) 8,648 — —
Short Precious Metals ProFund
Swap Agreements — Goldman Sachs International 43,894 — — 43,894Swap Agreements — UBS AG 33,414 — — 33,414
Short Real Estate ProFund
Swap Agreements — Goldman Sachs International (9,000) 9,000 — —Swap Agreements — UBS AG 778 — — 778
Short Small-Cap ProFund
Swap Agreements — Goldman Sachs International (40,037) 40,037 — —Swap Agreements — UBS AG (26,485) 26,485 — —
Small-Cap ProFund
Swap Agreements — Goldman Sachs International 45,242 — — 45,242Swap Agreements — UBS AG 84,913 — — 84,913
Technology UltraSector ProFund
Swap Agreements — Goldman Sachs International 1,309,919 (238,755) — 1,071,164Swap Agreements — UBS AG 1,141,979 — — 1,141,979
Telecommunications UltraSector ProFund
Swap Agreements — Goldman Sachs International (8,821) 8,821 — —Swap Agreements — UBS AG (1,448) 1,448 — —
UltraBear ProFund
Swap Agreements — Goldman Sachs International (744,960) 744,960 — —Swap Agreements — UBS AG (56,292) 56,292 — —
UltraBull ProFund
Swap Agreements — Goldman Sachs International 2,728,526 (1,591,702) — 1,136,824Swap Agreements — UBS AG 3,606,944 — (1,800,000) 1,806,944
UltraChina ProFund
Swap Agreements — Goldman Sachs International 1,122,405 (207,698) — 914,707Swap Agreements — UBS AG 1,080,359 — — 1,080,359
UltraDow 30 ProFund
Swap Agreements — Goldman Sachs International 572,492 (342,604) — 229,888Swap Agreements — UBS AG 614,639 — (360,000) 254,639
UltraEmerging Markets ProFund
Swap Agreements — Goldman Sachs International 375,147 — — 375,147Swap Agreements — UBS AG 341,465 — (20,000) 321,465
UltraInternational ProFund
Swap Agreements — Goldman Sachs International 43,521 — — 43,521Swap Agreements — UBS AG 42,668 — — 42,668
UltraJapan ProFund
Swap Agreements — Goldman Sachs International 8,269 — — 8,269UltraLatin America ProFund
Swap Agreements — Goldman Sachs International 81,485 — — 81,485Swap Agreements — UBS AG 72,670 — — 72,670
January 31, 2022 (unaudited) :: Notes to Financial Statements :: 289
Toppan Merrill - ProFunds Public Semi-Annual Report [Funds] 01-31-2022 ED [AUX] | akiesli | 29-Mar-22 08:44 | 22-1296-2.ga | Sequence: 15CHKSUM Content: 43446 Layout: 33354 Graphics: 0 CLEAN
JOB: 22-1296-2 CYCLE#;BL#: 8; 0 TRIM: 8.25" x 10.75" AS: New York: 212-620-5600COLORS: ~note-color 2, Black, ~note-color 3 GRAPHICS: none V1.5

Gross Amounts Not Offset in theStatement of Assets and Liabilities*
GrossAsset (Liability) as Financial Cash
presented in Instruments Collateralthe Statement of (Received) (Received)
Assets and Liabilities Pledged** Pledged Net Amount
UltraMid-Cap ProFund
Swap Agreements — Goldman Sachs International $ 1,962,234 $ (936,581) $ — $ 1,025,653Swap Agreements — UBS AG 337,879 — — 337,879
UltraNasdaq-100 ProFund
Swap Agreements — Goldman Sachs International 36,831,934 (18,807,318) — 18,024,616Swap Agreements — UBS AG 32,316,984 — (19,240,000) 13,076,984
UltraShort China ProFund
Swap Agreements — Goldman Sachs International (391,558) 100,000 — (291,558)Swap Agreements — UBS AG (458,759) 360,000 — (98,759)
UltraShort Dow 30 ProFund
Swap Agreements — Goldman Sachs International (86,423) 86,423 — —Swap Agreements — UBS AG (60,024) 60,024 — —
UltraShort Emerging Markets ProFund
Swap Agreements — Goldman Sachs International (51,797) 40,000 — (11,797)Swap Agreements — UBS AG (54,039) 54,039 — —
UltraShort International ProFund
Swap Agreements — Goldman Sachs International (19,340) 19,340 — —Swap Agreements — UBS AG (39,517) 39,517 — —
UltraShort Japan ProFund
Swap Agreements — Goldman Sachs International (11,146) — — (11,146)UltraShort Latin America ProFund
Swap Agreements — Goldman Sachs International (8,966) 8,966 — —Swap Agreements — UBS AG (7,715) 7,715 — —
UltraShort Mid-Cap ProFund
Swap Agreements — Goldman Sachs International (81,678) 81,678 — —Swap Agreements — UBS AG (46,891) 46,891 — —
UltraShort Nasdaq-100 ProFund
Swap Agreements — Goldman Sachs International (3,601,051) 1,710,000 — (1,891,051)Swap Agreements — UBS AG (5,316,823) 5,316,823 — —
UltraShort Small-Cap ProFund
Swap Agreements — Goldman Sachs International (341,475) 341,475 — —Swap Agreements — UBS AG (159,108) 159,108 — —
UltraSmall-Cap ProFund
Swap Agreements — Goldman Sachs International 1,525,445 (676,473) — 848,972Swap Agreements — UBS AG 2,599,360 — (1,000,000) 1,599,360
U.S. Government Plus ProFund
Swap Agreements — Citibank North America 585,050 — (585,050) —Swap Agreements — Societe’ Generale 14,786 — — 14,786
Utilities UltraSector ProFund
Swap Agreements — Goldman Sachs International 54,346 — — 54,346Swap Agreements — UBS AG 55,432 — — 55,432
* The actual financial instruments and cash collateral (received) pledged may be in excess of the amounts shown in the table. The table only reflectscollateral amounts up to the amount of the financial instrument disclosed on the Statement of Assets and Liabilities.
** Financial instruments and cash collateral received are not disclosed on the Statement of Assets and Liabilities because the Fund does not haveeffective control of the collateral.
290 :: Notes to Financial Statements :: January 31, 2022 (unaudited)
Securities Lending:
Each ProFund may lend securities to brokers, dealers and financialorganizations in exchange for initial collateral in the amount of atleast 102% of the value of U.S. dollar-denominated securitiesloaned or at least 105% of the value of non-U.S. dollar-denominated securities loaned, marked to market daily. Eachsecurity loaned will be secured continuously by collateral in theform of cash, money market instruments or U.S. Governmentsecurities with a market value of at least 100% of the market value
of the loaned securities. When a ProFund lends its securities, itcontinues to receive payments equal to the dividends and interestpaid on the securities loaned and simultaneously may earn intereston the reinvestment of the cash collateral. Any cash collateralreceived by the ProFund in connection with these loans may bereinvested in a variety of short-term investments. Any non-cashcollateral received by the ProFund in connection with these loansmay not be sold or pledged by the ProFund and, accordingly, isnot reflected in the ProFund’s assets and liabilities. The ProFunds
Toppan Merrill - ProFunds Public Semi-Annual Report [Funds] 01-31-2022 ED [AUX] | akiesli | 29-Mar-22 08:44 | 22-1296-2.ga | Sequence: 16CHKSUM Content: 48330 Layout: 3708 Graphics: 0 CLEAN
JOB: 22-1296-2 CYCLE#;BL#: 8; 0 TRIM: 8.25" x 10.75" AS: New York: 212-620-5600COLORS: ~note-color 2, Black, ~note-color 3 GRAPHICS: none V1.5
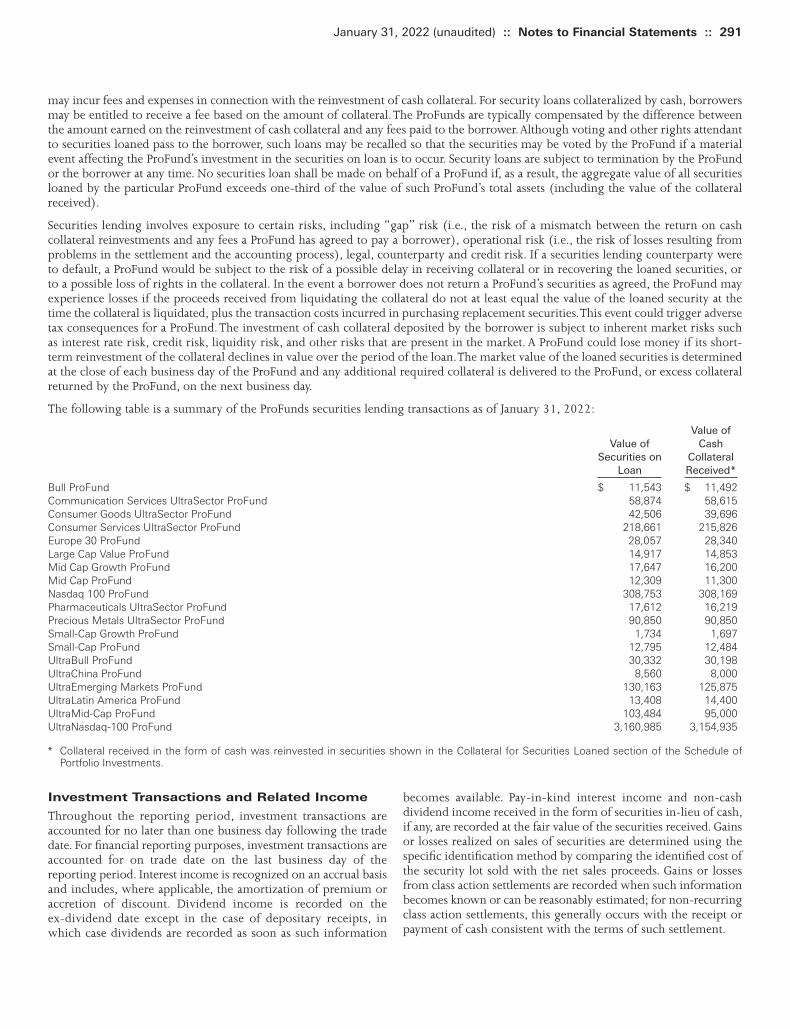
may incur fees and expenses in connection with the reinvestment of cash collateral. For security loans collateralized by cash, borrowersmay be entitled to receive a fee based on the amount of collateral. The ProFunds are typically compensated by the difference betweenthe amount earned on the reinvestment of cash collateral and any fees paid to the borrower. Although voting and other rights attendantto securities loaned pass to the borrower, such loans may be recalled so that the securities may be voted by the ProFund if a materialevent affecting the ProFund’s investment in the securities on loan is to occur. Security loans are subject to termination by the ProFundor the borrower at any time. No securities loan shall be made on behalf of a ProFund if, as a result, the aggregate value of all securitiesloaned by the particular ProFund exceeds one-third of the value of such ProFund’s total assets (including the value of the collateralreceived).
Securities lending involves exposure to certain risks, including “gap” risk (i.e., the risk of a mismatch between the return on cashcollateral reinvestments and any fees a ProFund has agreed to pay a borrower), operational risk (i.e., the risk of losses resulting fromproblems in the settlement and the accounting process), legal, counterparty and credit risk. If a securities lending counterparty wereto default, a ProFund would be subject to the risk of a possible delay in receiving collateral or in recovering the loaned securities, orto a possible loss of rights in the collateral. In the event a borrower does not return a ProFund’s securities as agreed, the ProFund mayexperience losses if the proceeds received from liquidating the collateral do not at least equal the value of the loaned security at thetime the collateral is liquidated, plus the transaction costs incurred in purchasing replacement securities. This event could trigger adversetax consequences for a ProFund. The investment of cash collateral deposited by the borrower is subject to inherent market risks suchas interest rate risk, credit risk, liquidity risk, and other risks that are present in the market. A ProFund could lose money if its short-term reinvestment of the collateral declines in value over the period of the loan. The market value of the loaned securities is determinedat the close of each business day of the ProFund and any additional required collateral is delivered to the ProFund, or excess collateralreturned by the ProFund, on the next business day.
The following table is a summary of the ProFunds securities lending transactions as of January 31, 2022:
Value of Value of Cash
Securities on Collateral Loan Received*
Bull ProFund $ 11,543 $ 11,492Communication Services UltraSector ProFund 58,874 58,615Consumer Goods UltraSector ProFund 42,506 39,696Consumer Services UltraSector ProFund 218,661 215,826Europe 30 ProFund 28,057 28,340Large Cap Value ProFund 14,917 14,853Mid Cap Growth ProFund 17,647 16,200Mid Cap ProFund 12,309 11,300Nasdaq 100 ProFund 308,753 308,169Pharmaceuticals UltraSector ProFund 17,612 16,219Precious Metals UltraSector ProFund 90,850 90,850Small-Cap Growth ProFund 1,734 1,697Small-Cap ProFund 12,795 12,484UltraBull ProFund 30,332 30,198UltraChina ProFund 8,560 8,000UltraEmerging Markets ProFund 130,163 125,875UltraLatin America ProFund 13,408 14,400UltraMid-Cap ProFund 103,484 95,000UltraNasdaq-100 ProFund 3,160,985 3,154,935
* Collateral received in the form of cash was reinvested in securities shown in the Collateral for Securities Loaned section of the Schedule ofPortfolio Investments.
January 31, 2022 (unaudited) :: Notes to Financial Statements :: 291
Investment Transactions and Related Income
Throughout the reporting period, investment transactions areaccounted for no later than one business day following the tradedate. For financial reporting purposes, investment transactions areaccounted for on trade date on the last business day of thereporting period. Interest income is recognized on an accrual basisand includes, where applicable, the amortization of premium oraccretion of discount. Dividend income is recorded on theex-dividend date except in the case of depositary receipts, inwhich case dividends are recorded as soon as such information
becomes available. Pay-in-kind interest income and non-cashdividend income received in the form of securities in-lieu of cash,if any, are recorded at the fair value of the securities received. Gainsor losses realized on sales of securities are determined using thespecific identification method by comparing the identified cost ofthe security lot sold with the net sales proceeds. Gains or lossesfrom class action settlements are recorded when such informationbecomes known or can be reasonably estimated; for non-recurringclass action settlements, this generally occurs with the receipt orpayment of cash consistent with the terms of such settlement.
Toppan Merrill - ProFunds Public Semi-Annual Report [Funds] 01-31-2022 ED [AUX] | akiesli | 29-Mar-22 08:44 | 22-1296-2.ga | Sequence: 17CHKSUM Content: 47886 Layout: 42804 Graphics: 0 CLEAN
JOB: 22-1296-2 CYCLE#;BL#: 8; 0 TRIM: 8.25" x 10.75" AS: New York: 212-620-5600COLORS: ~note-color 2, Black, ~note-color 3 GRAPHICS: none V1.5
Allocations
Expenses directly attributable to a ProFund are charged to thatProFund, while expenses which are attributable to more than onefund in the Trust, or jointly with an affiliate, are allocated amongthe respective funds in the Trust and/or affiliate based uponrelative net assets or another reasonable basis.
Distributions to Shareholders
Each of the ProFunds (except Access Flex High Yield ProFund,Bitcoin Strategy ProFund, Real Estate UltraSector ProFund and U.S.Government Plus ProFund) intends to declare and distribute netinvestment income at least annually, if any. Access Flex High YieldProFund, Bitcoin Strategy ProFund and Real Estate UltraSectorProFund declare and pay dividends from net investment incomequarterly, if any. U.S. Government Plus ProFund declares dividendsfrom net investment income daily and pays dividends on amonthly basis, if any. Net realized capital gains, if any, will bedistributed annually.
The amount of distributions from net investment income and netrealized gains are determined in accordance with federal incometax regulations which may differ from GAAP. These “book/tax”differences are either considered temporary or permanent innature. To the extent these differences are permanent in nature(e.g., return of capital, net operating loss, distributionreclassification, and equalization), such amounts are reclassifiedwithin the composition of net assets based on their federal tax-basis treatment; temporary differences (e.g., wash sales) do notrequire a reclassification. The ProFunds may utilize equalizationaccounting for tax purposes and designate earnings and profits,including net realized gains distributed to shareholders onredemption of shares, as a part of the dividends paid deductionfor income tax purposes. Distributions which exceed netinvestment income and net realized capital gains for financialreporting purposes but not for tax purposes are reported asdistributions in excess of net investment income or net realizedgains. To the extent they exceed net investment income and netrealized capital gains for tax purposes, they are reported asdistribution of capital.
Federal Income Taxes
Each of the ProFunds intends to continue to qualify each year as aRIC under Subchapter M of the Internal Revenue Code of 1986,as amended. A RIC generally is not subject to federal income taxon income and gains distributed in a timely manner to itsshareholders. The ProFunds intend to make timely distributions inorder to avoid tax liability. Accordingly, no provision for federalincome taxes is required in the financial statements.
The Bear ProFund, Bull ProFund, Europe 30 ProFund, UltraBearProFund, UltraBull ProFund, UltraJapan ProFund,UltraNasdaq-100 ProFund, and UltraShort Nasdaq-100 ProFundhave a calendar tax year end. The remaining ProFunds have a taxyear end of October 31st.
Management of the ProFunds has reviewed tax positions taken intax years that remain subject to examination by all major taxjurisdictions, including federal (i.e., the last four tax year ends andthe interim tax period since then, as applicable). Management
believes that there is no tax liability resulting from unrecognizedtax benefits related to uncertain tax positions taken and theProFunds are not aware of any tax positions for which it isreasonably possible that the total amounts of unrecognized taxbenefits will significantly change in the next twelve months.
Other
Expense offsets to custody fees that arise from credits on cashbalances maintained on deposit are reflected on the Statement ofOperations, as applicable, as “Fees paid indirectly.”
3. Investment Valuation Summary
The valuation techniques employed by the ProFunds, describedbelow, maximize the use of observable inputs and minimize theuse of unobservable inputs in determining fair value. Thesevaluation techniques distinguish between market participantassumptions developed based on market data obtained fromsources independent of the ProFunds (observable inputs) and theProFunds’ own assumptions about market participant assumptionsdeveloped based on the best information available under thecircumstances (unobservable inputs). The inputs used for valuingthe ProFunds’ investments are summarized in the three broadlevels listed below:
• Level 1–quoted prices in active markets for identical assets• Level 2–other significant observable inputs (including quoted
prices for similar securities, interest rates, prepayments speeds,credit risk, etc.)
• Level 3–significant unobservable inputs (including the ProFunds’own assumptions in determining the fair value of investments)
The inputs or methodology used for valuing investments are notnecessarily an indication of the risk associated with investing inthose investments. For example, repurchase agreements aregenerally valued at amortized cost. Generally, amortized costapproximates the current fair value of a security, but since thevaluation is not obtained from a quoted price in an active market,such securities are reflected as Level 2. Fair value measurementsmay also require additional disclosure when the volume and levelof activity for the asset or liability have significantly decreased, aswell as when circumstances indicate that a transaction is notorderly. Changes in valuation techniques may result in transfers inor out of an assigned level within the disclosure hierarchy.
Security prices are generally valued at their market value usinginformation provided by a third party pricing service or marketquotations or other procedures approved by the Trust’s Board ofTrustees. The securities in the portfolio of a non-money marketProFund, except as otherwise noted, that are listed or traded on astock exchange or the Nasdaq National Market System(“Nasdaq/NMS”), are valued at the official closing price, ifavailable, or the last sale price, on the exchange or system wherethe security is principally traded. If there have been no sales forthat day on the exchange or system where the security isprincipally traded, then the value may be determined withreference to the last sale price, or the official closing price, ifapplicable, on any other exchange or system. In each of thesesituations, valuations are typically categorized as a Level 1 in thefair value hierarchy. If there have been no sales for that day on any
292 :: Notes to Financial Statements :: January 31, 2022 (unaudited)
Toppan Merrill - ProFunds Public Semi-Annual Report [Funds] 01-31-2022 ED [AUX] | akiesli | 29-Mar-22 08:44 | 22-1296-2.ga | Sequence: 18CHKSUM Content: 60977 Layout: 17632 Graphics: 0 CLEAN
JOB: 22-1296-2 CYCLE#;BL#: 8; 0 TRIM: 8.25" x 10.75" AS: New York: 212-620-5600COLORS: ~note-color 2, Black, ~note-color 3 GRAPHICS: none V1.5

exchange or system, the security will be valued using fair value procedures in accordance with procedures approved by the Trust’sBoard of Trustees as described below.
Securities regularly traded in the OTC markets, including securities listed on an exchange, but that are primarily traded OTC otherthan those traded on the Nasdaq/NMS, are generally valued on the basis of the mean between the bid and asked quotes furnished bydealers actively trading those instruments. Fixed-income securities are generally valued according to prices as furnished by anindependent pricing service, generally at the mean of the bid and asked quotes for those instruments. Short-term fixed-income securitiesmaturing in sixty days or less, and of sufficient credit quality, may be valued at amortized cost, which approximates market value.Under the amortized cost method, premium or discount, if any, is amortized or accreted, respectively, on a constant basis to the maturityof the security. In each of these situations, valuations are typically categorized as Level 2 in the fair value hierarchy.
Derivatives are generally valued using independent pricing services and/or agreements with counterparties or other procedures approvedby the Trust’s Board of Trustees. Futures contracts are generally valued at their last sale price prior to the time at which the net assetvalue per share of a ProFund is determined and are typically categorized as Level 1 in the fair value hierarchy. Swap agreements aregenerally valued using independent sources and/or agreements with counterparties. Forward currency contracts are valued at theirquoted daily prices obtained from an independent pricing service. These valuations are typically categorized as Level 2 in the fair valuehierarchy. If there was no sale on that day, fair valuation procedures as described below may be applied.
When the Advisor determines that the market price of a security is not readily available or deemed unreliable (e.g., an approved pricingservice does not provide a price, a furnished price is in error, certain stale prices, or an event occurs that materially affects the furnishedprice), it may in good faith establish a fair value for that security in accordance with procedures established by and under the generalsupervision and responsibility of the Trust’s Board of Trustees. Fair value pricing may require subjective determinations about the valueof a security. While the Trust’s policy is intended to result in a calculation of a ProFund’s NAV that fairly reflects security values as of thetime of pricing, the Trust cannot ensure that fair values determined by the Advisor or persons acting at their direction would accuratelyreflect the price that a ProFund could obtain for a security if it were to dispose of that security as of the time of pricing (for instance,in a forced or distressed sale). The prices used by a ProFund may differ from the value that would be realized if the securities were soldand the differences could be material to the financial statements. Depending on the source and relative significance of valuation inputs,these instruments may be classified as Level 2 or Level 3 in the fair value hierarchy.
For the period ended January 31, 2022, there were no Level 3 investments for which significant unobservable inputs were used todetermine fair value.
A summary of the valuations as of January 31, 2022, based upon the three levels defined above, is included in the table below whilethe breakdown, by category, of equity securities is disclosed on the Schedule of Portfolio Investments for each ProFund:
LEVEL 2 - Other SignificantLEVEL 1 - Quoted Prices Observable Inputs Total
Investment Other Financial Investment Other Financial Investment Other FinancialSecurities Instruments^ Securities Instruments^ Securities Instruments^
Access Flex Bear High Yield ProFund
Repurchase Agreements $ — $ — $ 457,000 $ — $ 457,000 $ —Futures Contracts — 7,005 — — — 7,005Credit Default Swap Agreements — — — 14,111 — 14,111
Total $ — $ 7,005 $ 457,000 $ 14,111 $ 457,000 $ 21,116
Access Flex High Yield ProFund
U.S. Treasury Obligation $ — $ — $ 4,817,695 $ — $ 4,817,695 $ —Repurchase Agreements — — 2,083,000 — 2,083,000 —Futures Contracts — (1,600) — — — (1,600)Credit Default Swap Agreements — — — (168,307) — (168,307)
Total $ — $ (1,600) $ 6,900,695 $ (168,307) $ 6,900,695 $ (169,907)
Banks UltraSector ProFund
Common Stocks $ 17,286,714 $ — $ — $ — $ 17,286,714 $ —Repurchase Agreements — — 4,099,000 — 4,099,000 —Swap Agreements — — — 230,128 — 230,128
Total $ 17,286,714 $ — $ 4,099,000 $ 230,128 $ 21,385,714 $ 230,128
Basic Materials UltraSector ProFund
Common Stocks $ 5,508,005 $ — $ — $ — $ 5,508,005 $ —Repurchase Agreements — — 1,268,000 — 1,268,000 —Swap Agreements — — — 5,048 — 5,048
Total $ 5,508,005 $ — $ 1,268,000 $ 5,048 $ 6,776,005 $ 5,048
January 31, 2022 (unaudited) :: Notes to Financial Statements :: 293
Toppan Merrill - ProFunds Public Semi-Annual Report [Funds] 01-31-2022 ED [AUX] | akiesli | 29-Mar-22 08:44 | 22-1296-2.ga | Sequence: 19CHKSUM Content: 21755 Layout: 47307 Graphics: 0 CLEAN
JOB: 22-1296-2 CYCLE#;BL#: 8; 0 TRIM: 8.25" x 10.75" AS: New York: 212-620-5600COLORS: ~note-color 2, Black, ~note-color 3 GRAPHICS: none V1.5

LEVEL 2 - Other SignificantLEVEL 1 - Quoted Prices Observable Inputs Total
Investment Other Financial Investment Other Financial Investment Other FinancialSecurities Instruments^ Securities Instruments^ Securities Instruments^
Bear ProFund
Repurchase Agreements $ — $ — $ 10,764,000 $ — $ 10,764,000 $ —Swap Agreements — — — (452,325) — (452,325)
Total $ — $ — $ 10,764,000 $ (452,325) $ 10,764,000 $ (452,325)
Biotechnology UltraSector ProFund
Common Stocks $ 106,495,734 $ — $ — $ — $ 106,495,734 $ —Repurchase Agreements — — 25,647,000 — 25,647,000 —Swap Agreements — — — 1,886,688 — 1,886,688
Total $ 106,495,734 $ — $ 25,647,000 $ 1,886,688 $ 132,142,734 $ 1,886,688
Bitcoin Strategy ProFund
U.S. Treasury Obligation $ — $ — $ 25,979,761 $ — $ 25,979,761 $ —Futures Contracts — (443,590) — — — (443,590)
Total $ — $ (443,590) $ 25,979,761 $ — $ 25,979,761 $ (443,590)
Bull ProFund
Common Stocks $ 38,585,680 $ — $ — $ — $ 38,585,680 $ —Repurchase Agreements — — 9,060,000 — 9,060,000 —Collateral for Securities Loaned 11,492 — — — 11,492 —Swap Agreements — — — 411,546 — 411,546
Total $ 38,597,172 $ — $ 9,060,000 $ 411,546 $ 47,657,172 $ 411,546
Communication Services UltraSector ProFund
Common Stocks $ 6,405,654 $ — $ — $ — $ 6,405,654 $ —Repurchase Agreements — — 1,334,000 — 1,334,000 —Collateral for Securities Loaned 58,615 — — — 58,615 —Swap Agreements — — — 79,570 — 79,570
Total $ 6,464,269 $ — $ 1,334,000 $ 79,570 $ 7,798,269 $ 79,570
Consumer Goods UltraSector ProFund
Common Stocks $ 8,317,985 $ — $ — $ — $ 8,317,985 $ —Repurchase Agreements — — 2,055,000 — 2,055,000 —Collateral for Securities Loaned 39,696 — — — 39,696 —Swap Agreements — — — (17,360) — (17,360)
Total $ 8,357,681 $ — $ 2,055,000 $ (17,360) $ 10,412,681 $ (17,360)
Consumer Services UltraSector ProFund
Common Stocks $ 38,321,544 $ — $ — $ — $ 38,321,544 $ —Repurchase Agreements — — 9,346,000 — 9,346,000 —Collateral for Securities Loaned 215,826 — — — 215,826 —Swap Agreements — — — 678,927 — 678,927
Total $ 38,537,370 $ — $ 9,346,000 $ 678,927 $ 47,883,370 $ 678,927
Europe 30 ProFund
Common Stocks $ 2,938,113 $ — $ — $ — $ 2,938,113 $ —Collateral for Securities Loaned 28,340 — — — 28,340 —
Total $ 2,966,453 $ — $ — $ — $ 2,966,453 $ —
Falling U.S. Dollar ProFund
Repurchase Agreements $ — $ — $ 1,135,000 $ — $ 1,135,000 $ —Forward Currency Contracts — — — (18,572) — (18,572)
Total $ — $ — $ 1,135,000 $ (18,572) $ 1,135,000 $ (18,572)
Financials UltraSector ProFund
Common Stocks $ 6,825,743 $ — $ — $ — $ 6,825,743 $ —Repurchase Agreements — — 2,269,000 — 2,269,000 —Swap Agreements — — — 188,092 — 188,092
Total $ 6,825,743 $ — $ 2,269,000 $ 188,092 $ 9,094,743 $ 188,092
294 :: Notes to Financial Statements :: January 31, 2022 (unaudited)
Toppan Merrill - ProFunds Public Semi-Annual Report [Funds] 01-31-2022 ED [AUX] | akiesli | 29-Mar-22 08:44 | 22-1296-2.ga | Sequence: 20CHKSUM Content: 20386 Layout: 2331 Graphics: 0 CLEAN
JOB: 22-1296-2 CYCLE#;BL#: 8; 0 TRIM: 8.25" x 10.75" AS: New York: 212-620-5600COLORS: ~note-color 2, Black, ~note-color 3 GRAPHICS: none V1.5
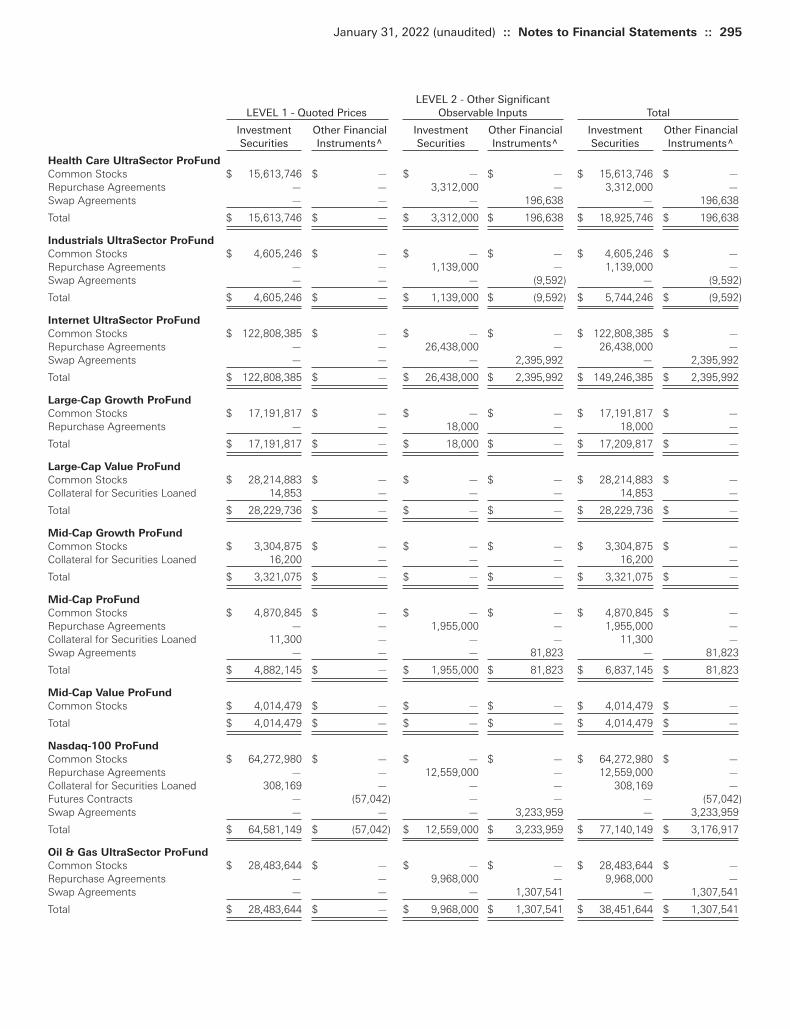
LEVEL 2 - Other SignificantLEVEL 1 - Quoted Prices Observable Inputs Total
Investment Other Financial Investment Other Financial Investment Other FinancialSecurities Instruments^ Securities Instruments^ Securities Instruments^
Health Care UltraSector ProFund
Common Stocks $ 15,613,746 $ — $ — $ — $ 15,613,746 $ —Repurchase Agreements — — 3,312,000 — 3,312,000 —Swap Agreements — — — 196,638 — 196,638
Total $ 15,613,746 $ — $ 3,312,000 $ 196,638 $ 18,925,746 $ 196,638
Industrials UltraSector ProFund
Common Stocks $ 4,605,246 $ — $ — $ — $ 4,605,246 $ —Repurchase Agreements — — 1,139,000 — 1,139,000 —Swap Agreements — — — (9,592) — (9,592)
Total $ 4,605,246 $ — $ 1,139,000 $ (9,592) $ 5,744,246 $ (9,592)
Internet UltraSector ProFund
Common Stocks $ 122,808,385 $ — $ — $ — $ 122,808,385 $ —Repurchase Agreements — — 26,438,000 — 26,438,000 —Swap Agreements — — — 2,395,992 — 2,395,992
Total $ 122,808,385 $ — $ 26,438,000 $ 2,395,992 $ 149,246,385 $ 2,395,992
Large-Cap Growth ProFund
Common Stocks $ 17,191,817 $ — $ — $ — $ 17,191,817 $ —Repurchase Agreements — — 18,000 — 18,000 —
Total $ 17,191,817 $ — $ 18,000 $ — $ 17,209,817 $ —
Large-Cap Value ProFund
Common Stocks $ 28,214,883 $ — $ — $ — $ 28,214,883 $ —Collateral for Securities Loaned 14,853 — — — 14,853 —
Total $ 28,229,736 $ — $ — $ — $ 28,229,736 $ —
Mid-Cap Growth ProFund
Common Stocks $ 3,304,875 $ — $ — $ — $ 3,304,875 $ —Collateral for Securities Loaned 16,200 — — — 16,200 —
Total $ 3,321,075 $ — $ — $ — $ 3,321,075 $ —
Mid-Cap ProFund
Common Stocks $ 4,870,845 $ — $ — $ — $ 4,870,845 $ —Repurchase Agreements — — 1,955,000 — 1,955,000 —Collateral for Securities Loaned 11,300 — — — 11,300 —Swap Agreements — — — 81,823 — 81,823
Total $ 4,882,145 $ — $ 1,955,000 $ 81,823 $ 6,837,145 $ 81,823
Mid-Cap Value ProFund
Common Stocks $ 4,014,479 $ — $ — $ — $ 4,014,479 $ —
Total $ 4,014,479 $ — $ — $ — $ 4,014,479 $ —
Nasdaq-100 ProFund
Common Stocks $ 64,272,980 $ — $ — $ — $ 64,272,980 $ —Repurchase Agreements — — 12,559,000 — 12,559,000 —Collateral for Securities Loaned 308,169 — — — 308,169 —Futures Contracts — (57,042) — — — (57,042)Swap Agreements — — — 3,233,959 — 3,233,959
Total $ 64,581,149 $ (57,042) $ 12,559,000 $ 3,233,959 $ 77,140,149 $ 3,176,917
Oil & Gas UltraSector ProFund
Common Stocks $ 28,483,644 $ — $ — $ — $ 28,483,644 $ —Repurchase Agreements — — 9,968,000 — 9,968,000 —Swap Agreements — — — 1,307,541 — 1,307,541
Total $ 28,483,644 $ — $ 9,968,000 $ 1,307,541 $ 38,451,644 $ 1,307,541
January 31, 2022 (unaudited) :: Notes to Financial Statements :: 295
Toppan Merrill - ProFunds Public Semi-Annual Report [Funds] 01-31-2022 ED [AUX] | akiesli | 29-Mar-22 08:44 | 22-1296-2.ga | Sequence: 21CHKSUM Content: 56756 Layout: 63220 Graphics: 0 CLEAN
JOB: 22-1296-2 CYCLE#;BL#: 8; 0 TRIM: 8.25" x 10.75" AS: New York: 212-620-5600COLORS: ~note-color 2, Black, ~note-color 3 GRAPHICS: none V1.5
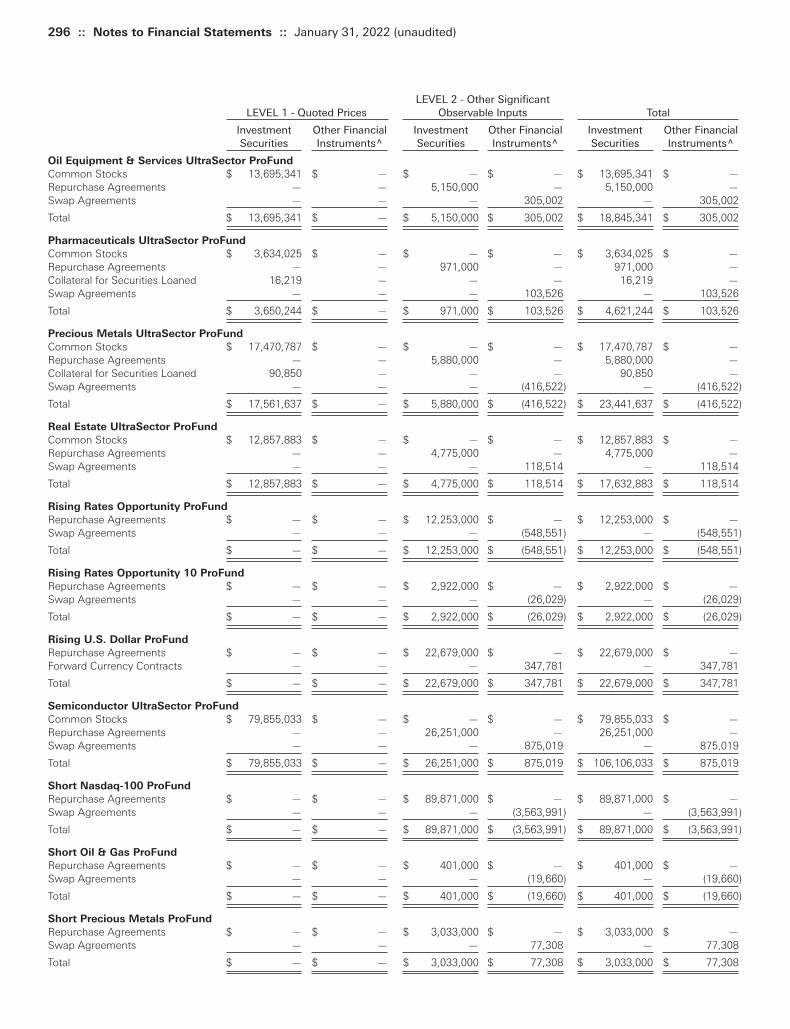
LEVEL 2 - Other SignificantLEVEL 1 - Quoted Prices Observable Inputs Total
Investment Other Financial Investment Other Financial Investment Other FinancialSecurities Instruments^ Securities Instruments^ Securities Instruments^
Oil Equipment & Services UltraSector ProFund
Common Stocks $ 13,695,341 $ — $ — $ — $ 13,695,341 $ —Repurchase Agreements — — 5,150,000 — 5,150,000 —Swap Agreements — — — 305,002 — 305,002
Total $ 13,695,341 $ — $ 5,150,000 $ 305,002 $ 18,845,341 $ 305,002
Pharmaceuticals UltraSector ProFund
Common Stocks $ 3,634,025 $ — $ — $ — $ 3,634,025 $ —Repurchase Agreements — — 971,000 — 971,000 —Collateral for Securities Loaned 16,219 — — — 16,219 —Swap Agreements — — — 103,526 — 103,526
Total $ 3,650,244 $ — $ 971,000 $ 103,526 $ 4,621,244 $ 103,526
Precious Metals UltraSector ProFund
Common Stocks $ 17,470,787 $ — $ — $ — $ 17,470,787 $ —Repurchase Agreements — — 5,880,000 — 5,880,000 —Collateral for Securities Loaned 90,850 — — — 90,850 —Swap Agreements — — — (416,522) — (416,522)
Total $ 17,561,637 $ — $ 5,880,000 $ (416,522) $ 23,441,637 $ (416,522)
Real Estate UltraSector ProFund
Common Stocks $ 12,857,883 $ — $ — $ — $ 12,857,883 $ —Repurchase Agreements — — 4,775,000 — 4,775,000 —Swap Agreements — — — 118,514 — 118,514
Total $ 12,857,883 $ — $ 4,775,000 $ 118,514 $ 17,632,883 $ 118,514
Rising Rates Opportunity ProFund
Repurchase Agreements $ — $ — $ 12,253,000 $ — $ 12,253,000 $ —Swap Agreements — — — (548,551) — (548,551)
Total $ — $ — $ 12,253,000 $ (548,551) $ 12,253,000 $ (548,551)
Rising Rates Opportunity 10 ProFund
Repurchase Agreements $ — $ — $ 2,922,000 $ — $ 2,922,000 $ —Swap Agreements — — — (26,029) — (26,029)
Total $ — $ — $ 2,922,000 $ (26,029) $ 2,922,000 $ (26,029)
Rising U.S. Dollar ProFund
Repurchase Agreements $ — $ — $ 22,679,000 $ — $ 22,679,000 $ —Forward Currency Contracts — — — 347,781 — 347,781
Total $ — $ — $ 22,679,000 $ 347,781 $ 22,679,000 $ 347,781
Semiconductor UltraSector ProFund
Common Stocks $ 79,855,033 $ — $ — $ — $ 79,855,033 $ —Repurchase Agreements — — 26,251,000 — 26,251,000 —Swap Agreements — — — 875,019 — 875,019
Total $ 79,855,033 $ — $ 26,251,000 $ 875,019 $ 106,106,033 $ 875,019
Short Nasdaq-100 ProFund
Repurchase Agreements $ — $ — $ 89,871,000 $ — $ 89,871,000 $ —Swap Agreements — — — (3,563,991) — (3,563,991)
Total $ — $ — $ 89,871,000 $ (3,563,991) $ 89,871,000 $ (3,563,991)
Short Oil & Gas ProFund
Repurchase Agreements $ — $ — $ 401,000 $ — $ 401,000 $ —Swap Agreements — — — (19,660) — (19,660)
Total $ — $ — $ 401,000 $ (19,660) $ 401,000 $ (19,660)
Short Precious Metals ProFund
Repurchase Agreements $ — $ — $ 3,033,000 $ — $ 3,033,000 $ —Swap Agreements — — — 77,308 — 77,308
Total $ — $ — $ 3,033,000 $ 77,308 $ 3,033,000 $ 77,308
296 :: Notes to Financial Statements :: January 31, 2022 (unaudited)
Toppan Merrill - ProFunds Public Semi-Annual Report [Funds] 01-31-2022 ED [AUX] | akiesli | 29-Mar-22 08:44 | 22-1296-2.ga | Sequence: 22CHKSUM Content: 59629 Layout: 49199 Graphics: 0 CLEAN
JOB: 22-1296-2 CYCLE#;BL#: 8; 0 TRIM: 8.25" x 10.75" AS: New York: 212-620-5600COLORS: ~note-color 2, Black, ~note-color 3 GRAPHICS: none V1.5
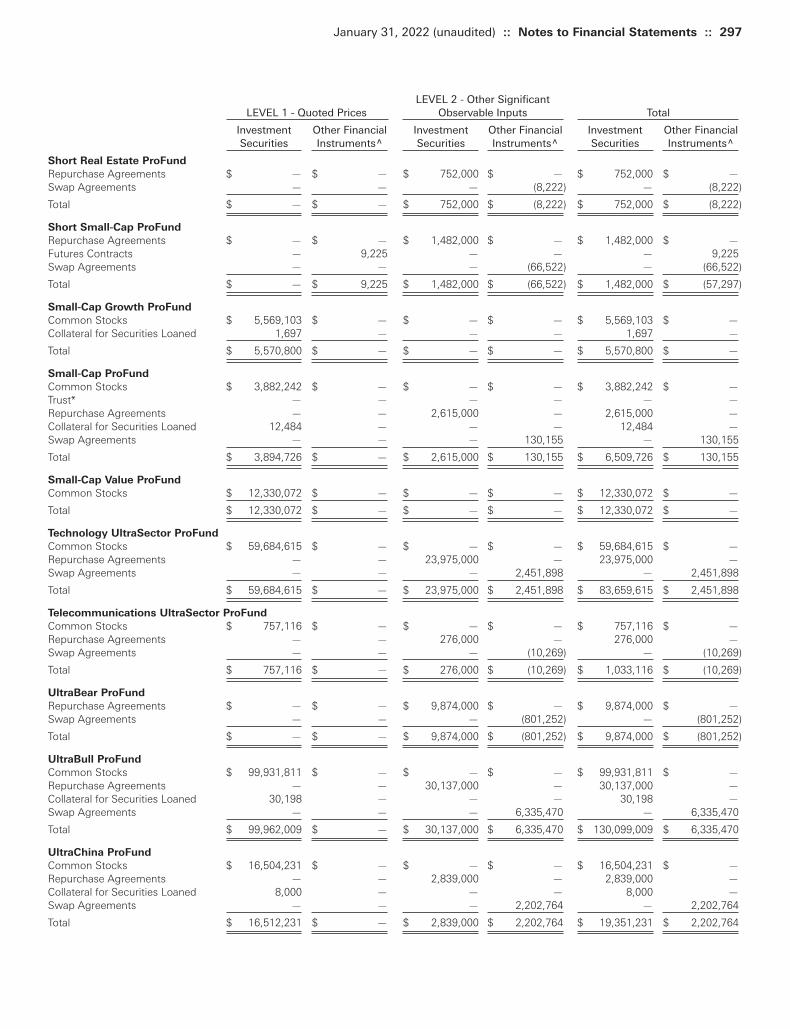
LEVEL 2 - Other SignificantLEVEL 1 - Quoted Prices Observable Inputs Total
Investment Other Financial Investment Other Financial Investment Other FinancialSecurities Instruments^ Securities Instruments^ Securities Instruments^
Short Real Estate ProFund
Repurchase Agreements $ — $ — $ 752,000 $ — $ 752,000 $ —Swap Agreements — — — (8,222) — (8,222)
Total $ — $ — $ 752,000 $ (8,222) $ 752,000 $ (8,222)
Short Small-Cap ProFund
Repurchase Agreements $ — $ — $ 1,482,000 $ — $ 1,482,000 $ —Futures Contracts — 9,225 — — — 9,225Swap Agreements — — — (66,522) — (66,522)
Total $ — $ 9,225 $ 1,482,000 $ (66,522) $ 1,482,000 $ (57,297)
Small-Cap Growth ProFund
Common Stocks $ 5,569,103 $ — $ — $ — $ 5,569,103 $ —Collateral for Securities Loaned 1,697 — — — 1,697 —
Total $ 5,570,800 $ — $ — $ — $ 5,570,800 $ —
Small-Cap ProFund
Common Stocks $ 3,882,242 $ — $ — $ — $ 3,882,242 $ —Trust* — — — — — —Repurchase Agreements — — 2,615,000 — 2,615,000 —Collateral for Securities Loaned 12,484 — — — 12,484 —Swap Agreements — — — 130,155 — 130,155
Total $ 3,894,726 $ — $ 2,615,000 $ 130,155 $ 6,509,726 $ 130,155
Small-Cap Value ProFund
Common Stocks $ 12,330,072 $ — $ — $ — $ 12,330,072 $ —
Total $ 12,330,072 $ — $ — $ — $ 12,330,072 $ —
Technology UltraSector ProFund
Common Stocks $ 59,684,615 $ — $ — $ — $ 59,684,615 $ —Repurchase Agreements — — 23,975,000 — 23,975,000 —Swap Agreements — — — 2,451,898 — 2,451,898
Total $ 59,684,615 $ — $ 23,975,000 $ 2,451,898 $ 83,659,615 $ 2,451,898
Telecommunications UltraSector ProFund
Common Stocks $ 757,116 $ — $ — $ — $ 757,116 $ —Repurchase Agreements — — 276,000 — 276,000 —Swap Agreements — — — (10,269) — (10,269)
Total $ 757,116 $ — $ 276,000 $ (10,269) $ 1,033,116 $ (10,269)
UltraBear ProFund
Repurchase Agreements $ — $ — $ 9,874,000 $ — $ 9,874,000 $ —Swap Agreements — — — (801,252) — (801,252)
Total $ — $ — $ 9,874,000 $ (801,252) $ 9,874,000 $ (801,252)
UltraBull ProFund
Common Stocks $ 99,931,811 $ — $ — $ — $ 99,931,811 $ —Repurchase Agreements — — 30,137,000 — 30,137,000 —Collateral for Securities Loaned 30,198 — — — 30,198 —Swap Agreements — — — 6,335,470 — 6,335,470
Total $ 99,962,009 $ — $ 30,137,000 $ 6,335,470 $ 130,099,009 $ 6,335,470
UltraChina ProFund
Common Stocks $ 16,504,231 $ — $ — $ — $ 16,504,231 $ —Repurchase Agreements — — 2,839,000 — 2,839,000 —Collateral for Securities Loaned 8,000 — — — 8,000 —Swap Agreements — — — 2,202,764 — 2,202,764
Total $ 16,512,231 $ — $ 2,839,000 $ 2,202,764 $ 19,351,231 $ 2,202,764
January 31, 2022 (unaudited) :: Notes to Financial Statements :: 297
Toppan Merrill - ProFunds Public Semi-Annual Report [Funds] 01-31-2022 ED [AUX] | akiesli | 29-Mar-22 08:44 | 22-1296-2.ga | Sequence: 23CHKSUM Content: 58803 Layout: 29137 Graphics: 0 CLEAN
JOB: 22-1296-2 CYCLE#;BL#: 8; 0 TRIM: 8.25" x 10.75" AS: New York: 212-620-5600COLORS: ~note-color 2, Black, ~note-color 3 GRAPHICS: none V1.5
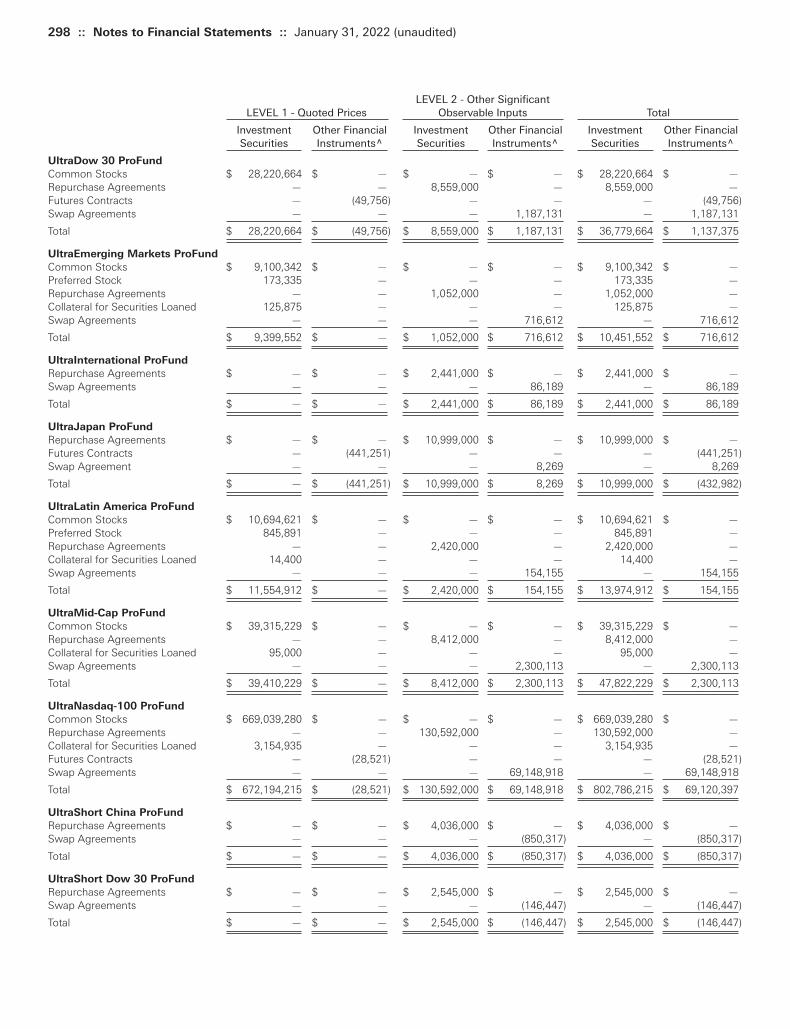
LEVEL 2 - Other SignificantLEVEL 1 - Quoted Prices Observable Inputs Total
Investment Other Financial Investment Other Financial Investment Other FinancialSecurities Instruments^ Securities Instruments^ Securities Instruments^
UltraDow 30 ProFund
Common Stocks $ 28,220,664 $ — $ — $ — $ 28,220,664 $ —Repurchase Agreements — — 8,559,000 — 8,559,000 —Futures Contracts — (49,756) — — — (49,756)Swap Agreements — — — 1,187,131 — 1,187,131
Total $ 28,220,664 $ (49,756) $ 8,559,000 $ 1,187,131 $ 36,779,664 $ 1,137,375
UltraEmerging Markets ProFund
Common Stocks $ 9,100,342 $ — $ — $ — $ 9,100,342 $ —Preferred Stock 173,335 — — — 173,335 —Repurchase Agreements — — 1,052,000 — 1,052,000 —Collateral for Securities Loaned 125,875 — — — 125,875 —Swap Agreements — — — 716,612 — 716,612
Total $ 9,399,552 $ — $ 1,052,000 $ 716,612 $ 10,451,552 $ 716,612
UltraInternational ProFund
Repurchase Agreements $ — $ — $ 2,441,000 $ — $ 2,441,000 $ —Swap Agreements — — — 86,189 — 86,189
Total $ — $ — $ 2,441,000 $ 86,189 $ 2,441,000 $ 86,189
UltraJapan ProFund
Repurchase Agreements $ — $ — $ 10,999,000 $ — $ 10,999,000 $ —Futures Contracts — (441,251) — — — (441,251)Swap Agreement — — — 8,269 — 8,269
Total $ — $ (441,251) $ 10,999,000 $ 8,269 $ 10,999,000 $ (432,982)
UltraLatin America ProFund
Common Stocks $ 10,694,621 $ — $ — $ — $ 10,694,621 $ —Preferred Stock 845,891 — — — 845,891 —Repurchase Agreements — — 2,420,000 — 2,420,000 —Collateral for Securities Loaned 14,400 — — — 14,400 —Swap Agreements — — — 154,155 — 154,155
Total $ 11,554,912 $ — $ 2,420,000 $ 154,155 $ 13,974,912 $ 154,155
UltraMid-Cap ProFund
Common Stocks $ 39,315,229 $ — $ — $ — $ 39,315,229 $ —Repurchase Agreements — — 8,412,000 — 8,412,000 —Collateral for Securities Loaned 95,000 — — — 95,000 —Swap Agreements — — — 2,300,113 — 2,300,113
Total $ 39,410,229 $ — $ 8,412,000 $ 2,300,113 $ 47,822,229 $ 2,300,113
UltraNasdaq-100 ProFund
Common Stocks $ 669,039,280 $ — $ — $ — $ 669,039,280 $ —Repurchase Agreements — — 130,592,000 — 130,592,000 —Collateral for Securities Loaned 3,154,935 — — — 3,154,935 —Futures Contracts — (28,521) — — — (28,521)Swap Agreements — — — 69,148,918 — 69,148,918
Total $ 672,194,215 $ (28,521) $ 130,592,000 $ 69,148,918 $ 802,786,215 $ 69,120,397
UltraShort China ProFund
Repurchase Agreements $ — $ — $ 4,036,000 $ — $ 4,036,000 $ —Swap Agreements — — — (850,317) — (850,317)
Total $ — $ — $ 4,036,000 $ (850,317) $ 4,036,000 $ (850,317)
UltraShort Dow 30 ProFund
Repurchase Agreements $ — $ — $ 2,545,000 $ — $ 2,545,000 $ —Swap Agreements — — — (146,447) — (146,447)
Total $ — $ — $ 2,545,000 $ (146,447) $ 2,545,000 $ (146,447)
298 :: Notes to Financial Statements :: January 31, 2022 (unaudited)
Toppan Merrill - ProFunds Public Semi-Annual Report [Funds] 01-31-2022 ED [AUX] | akiesli | 29-Mar-22 08:44 | 22-1296-2.ga | Sequence: 24CHKSUM Content: 44421 Layout: 41246 Graphics: 0 CLEAN
JOB: 22-1296-2 CYCLE#;BL#: 8; 0 TRIM: 8.25" x 10.75" AS: New York: 212-620-5600COLORS: ~note-color 2, Black, ~note-color 3 GRAPHICS: none V1.5
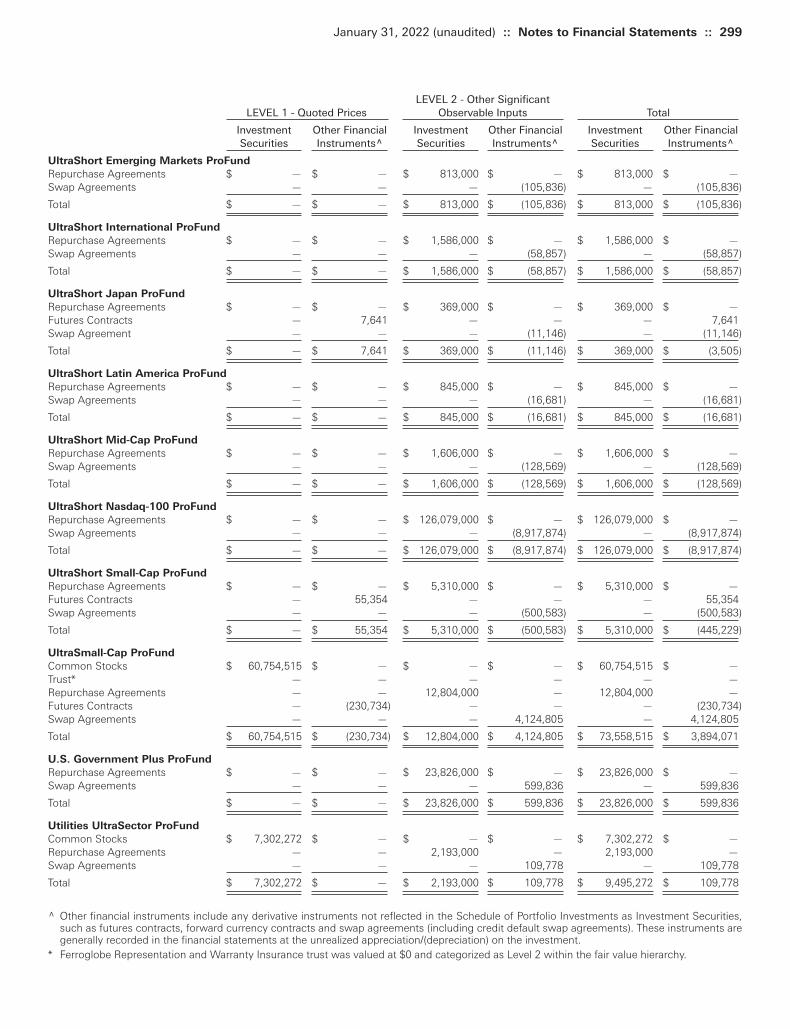
LEVEL 2 - Other SignificantLEVEL 1 - Quoted Prices Observable Inputs Total
Investment Other Financial Investment Other Financial Investment Other FinancialSecurities Instruments^ Securities Instruments^ Securities Instruments^
UltraShort Emerging Markets ProFund
Repurchase Agreements $ — $ — $ 813,000 $ — $ 813,000 $ —Swap Agreements — — — (105,836) — (105,836)
Total $ — $ — $ 813,000 $ (105,836) $ 813,000 $ (105,836)
UltraShort International ProFund
Repurchase Agreements $ — $ — $ 1,586,000 $ — $ 1,586,000 $ —Swap Agreements — — — (58,857) — (58,857)
Total $ — $ — $ 1,586,000 $ (58,857) $ 1,586,000 $ (58,857)
UltraShort Japan ProFund
Repurchase Agreements $ — $ — $ 369,000 $ — $ 369,000 $ —Futures Contracts — 7,641 — — — 7,641Swap Agreement — — — (11,146) — (11,146)
Total $ — $ 7,641 $ 369,000 $ (11,146) $ 369,000 $ (3,505)
UltraShort Latin America ProFund
Repurchase Agreements $ — $ — $ 845,000 $ — $ 845,000 $ —Swap Agreements — — — (16,681) — (16,681)
Total $ — $ — $ 845,000 $ (16,681) $ 845,000 $ (16,681)
UltraShort Mid-Cap ProFund
Repurchase Agreements $ — $ — $ 1,606,000 $ — $ 1,606,000 $ —Swap Agreements — — — (128,569) — (128,569)
Total $ — $ — $ 1,606,000 $ (128,569) $ 1,606,000 $ (128,569)
UltraShort Nasdaq-100 ProFund
Repurchase Agreements $ — $ — $ 126,079,000 $ — $ 126,079,000 $ —Swap Agreements — — — (8,917,874) — (8,917,874)
Total $ — $ — $ 126,079,000 $ (8,917,874) $ 126,079,000 $ (8,917,874)
UltraShort Small-Cap ProFund
Repurchase Agreements $ — $ — $ 5,310,000 $ — $ 5,310,000 $ —Futures Contracts — 55,354 — — — 55,354Swap Agreements — — — (500,583) — (500,583)
Total $ — $ 55,354 $ 5,310,000 $ (500,583) $ 5,310,000 $ (445,229)
UltraSmall-Cap ProFund
Common Stocks $ 60,754,515 $ — $ — $ — $ 60,754,515 $ —Trust* — — — — — —Repurchase Agreements — — 12,804,000 — 12,804,000 —Futures Contracts — (230,734) — — — (230,734)Swap Agreements — — — 4,124,805 — 4,124,805
Total $ 60,754,515 $ (230,734) $ 12,804,000 $ 4,124,805 $ 73,558,515 $ 3,894,071
U.S. Government Plus ProFund
Repurchase Agreements $ — $ — $ 23,826,000 $ — $ 23,826,000 $ —Swap Agreements — — — 599,836 — 599,836
Total $ — $ — $ 23,826,000 $ 599,836 $ 23,826,000 $ 599,836
Utilities UltraSector ProFund
Common Stocks $ 7,302,272 $ — $ — $ — $ 7,302,272 $ —Repurchase Agreements — — 2,193,000 — 2,193,000 —Swap Agreements — — — 109,778 — 109,778
Total $ 7,302,272 $ — $ 2,193,000 $ 109,778 $ 9,495,272 $ 109,778
^ Other financial instruments include any derivative instruments not reflected in the Schedule of Portfolio Investments as Investment Securities,such as futures contracts, forward currency contracts and swap agreements (including credit default swap agreements). These instruments aregenerally recorded in the financial statements at the unrealized appreciation/(depreciation) on the investment.
* Ferroglobe Representation and Warranty Insurance trust was valued at $0 and categorized as Level 2 within the fair value hierarchy.
January 31, 2022 (unaudited) :: Notes to Financial Statements :: 299
Toppan Merrill - ProFunds Public Semi-Annual Report [Funds] 01-31-2022 ED [AUX] | akiesli | 29-Mar-22 08:44 | 22-1296-2.ga | Sequence: 25CHKSUM Content: 32107 Layout: 19102 Graphics: 0 CLEAN
JOB: 22-1296-2 CYCLE#;BL#: 8; 0 TRIM: 8.25" x 10.75" AS: New York: 212-620-5600COLORS: ~note-color 2, Black, ~note-color 3 GRAPHICS: none V1.5
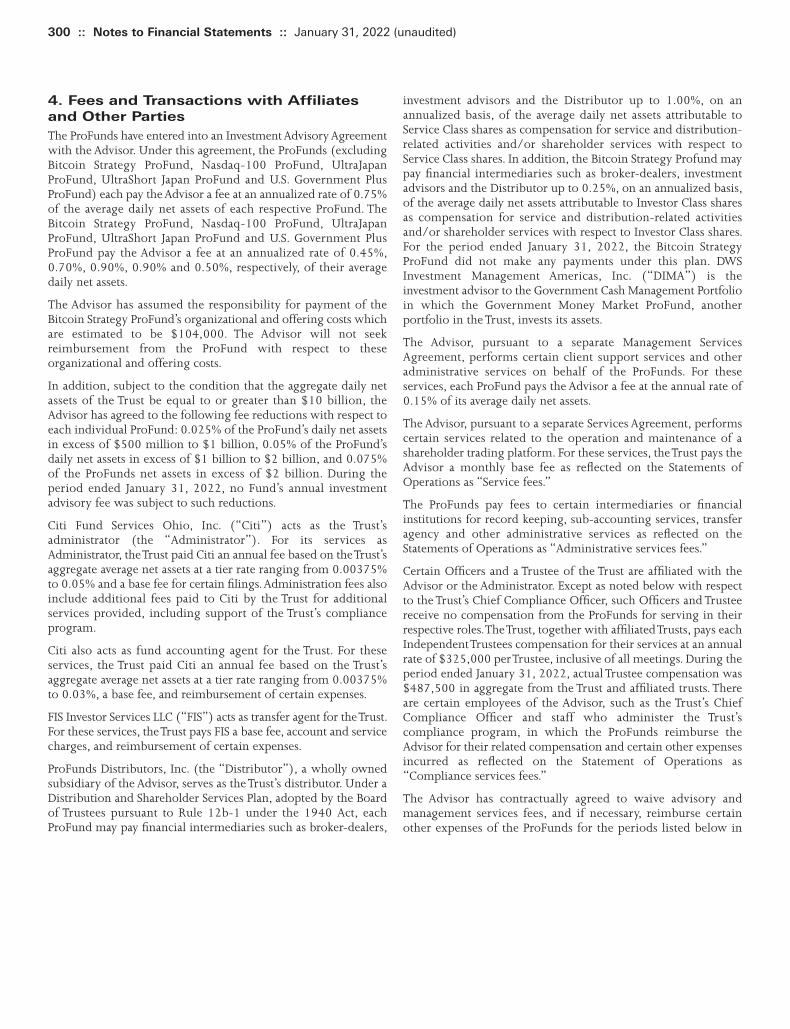
4. Fees and Transactions with Affiliates
and Other Parties
The ProFunds have entered into an Investment Advisory Agreementwith the Advisor. Under this agreement, the ProFunds (excludingBitcoin Strategy ProFund, Nasdaq-100 ProFund, UltraJapanProFund, UltraShort Japan ProFund and U.S. Government PlusProFund) each pay the Advisor a fee at an annualized rate of 0.75%of the average daily net assets of each respective ProFund. TheBitcoin Strategy ProFund, Nasdaq-100 ProFund, UltraJapanProFund, UltraShort Japan ProFund and U.S. Government PlusProFund pay the Advisor a fee at an annualized rate of 0.45%,0.70%, 0.90%, 0.90% and 0.50%, respectively, of their averagedaily net assets.
The Advisor has assumed the responsibility for payment of theBitcoin Strategy ProFund’s organizational and offering costs whichare estimated to be $104,000. The Advisor will not seekreimbursement from the ProFund with respect to theseorganizational and offering costs.
In addition, subject to the condition that the aggregate daily netassets of the Trust be equal to or greater than $10 billion, theAdvisor has agreed to the following fee reductions with respect toeach individual ProFund: 0.025% of the ProFund’s daily net assetsin excess of $500 million to $1 billion, 0.05% of the ProFund’sdaily net assets in excess of $1 billion to $2 billion, and 0.075%of the ProFunds net assets in excess of $2 billion. During theperiod ended January 31, 2022, no Fund’s annual investmentadvisory fee was subject to such reductions.
Citi Fund Services Ohio, Inc. (“Citi”) acts as the Trust’sadministrator (the “Administrator”). For its services asAdministrator, the Trust paid Citi an annual fee based on the Trust’saggregate average net assets at a tier rate ranging from 0.00375%to 0.05% and a base fee for certain filings. Administration fees alsoinclude additional fees paid to Citi by the Trust for additionalservices provided, including support of the Trust’s complianceprogram.
Citi also acts as fund accounting agent for the Trust. For theseservices, the Trust paid Citi an annual fee based on the Trust’saggregate average net assets at a tier rate ranging from 0.00375%to 0.03%, a base fee, and reimbursement of certain expenses.
FIS Investor Services LLC (“FIS”) acts as transfer agent for the Trust.For these services, the Trust pays FIS a base fee, account and servicecharges, and reimbursement of certain expenses.
ProFunds Distributors, Inc. (the “Distributor”), a wholly ownedsubsidiary of the Advisor, serves as the Trust’s distributor. Under aDistribution and Shareholder Services Plan, adopted by the Boardof Trustees pursuant to Rule 12b-1 under the 1940 Act, eachProFund may pay financial intermediaries such as broker-dealers,
investment advisors and the Distributor up to 1.00%, on anannualized basis, of the average daily net assets attributable toService Class shares as compensation for service and distribution-related activities and/or shareholder services with respect toService Class shares. In addition, the Bitcoin Strategy Profund maypay financial intermediaries such as broker-dealers, investmentadvisors and the Distributor up to 0.25%, on an annualized basis,of the average daily net assets attributable to Investor Class sharesas compensation for service and distribution-related activitiesand/or shareholder services with respect to Investor Class shares.For the period ended January 31, 2022, the Bitcoin StrategyProFund did not make any payments under this plan. DWSInvestment Management Americas, Inc. (“DIMA”) is theinvestment advisor to the Government Cash Management Portfolioin which the Government Money Market ProFund, anotherportfolio in the Trust, invests its assets.
The Advisor, pursuant to a separate Management ServicesAgreement, performs certain client support services and otheradministrative services on behalf of the ProFunds. For theseservices, each ProFund pays the Advisor a fee at the annual rate of0.15% of its average daily net assets.
The Advisor, pursuant to a separate Services Agreement, performscertain services related to the operation and maintenance of ashareholder trading platform. For these services, the Trust pays theAdvisor a monthly base fee as reflected on the Statements ofOperations as “Service fees.”
The ProFunds pay fees to certain intermediaries or financialinstitutions for record keeping, sub-accounting services, transferagency and other administrative services as reflected on theStatements of Operations as “Administrative services fees.”
Certain Officers and a Trustee of the Trust are affiliated with theAdvisor or the Administrator. Except as noted below with respectto the Trust’s Chief Compliance Officer, such Officers and Trusteereceive no compensation from the ProFunds for serving in theirrespective roles. The Trust, together with affiliated Trusts, pays eachIndependent Trustees compensation for their services at an annualrate of $325,000 per Trustee, inclusive of all meetings. During theperiod ended January 31, 2022, actual Trustee compensation was$487,500 in aggregate from the Trust and affiliated trusts. Thereare certain employees of the Advisor, such as the Trust’s ChiefCompliance Officer and staff who administer the Trust’scompliance program, in which the ProFunds reimburse theAdvisor for their related compensation and certain other expensesincurred as reflected on the Statement of Operations as“Compliance services fees.”
The Advisor has contractually agreed to waive advisory andmanagement services fees, and if necessary, reimburse certainother expenses of the ProFunds for the periods listed below in
300 :: Notes to Financial Statements :: January 31, 2022 (unaudited)
Toppan Merrill - ProFunds Public Semi-Annual Report [Funds] 01-31-2022 ED [AUX] | akiesli | 29-Mar-22 08:44 | 22-1296-2.ga | Sequence: 26CHKSUM Content: 45730 Layout: 9392 Graphics: 0 CLEAN
JOB: 22-1296-2 CYCLE#;BL#: 8; 0 TRIM: 8.25" x 10.75" AS: New York: 212-620-5600COLORS: ~note-color 2, Black, ~note-color 3 GRAPHICS: none V1.5
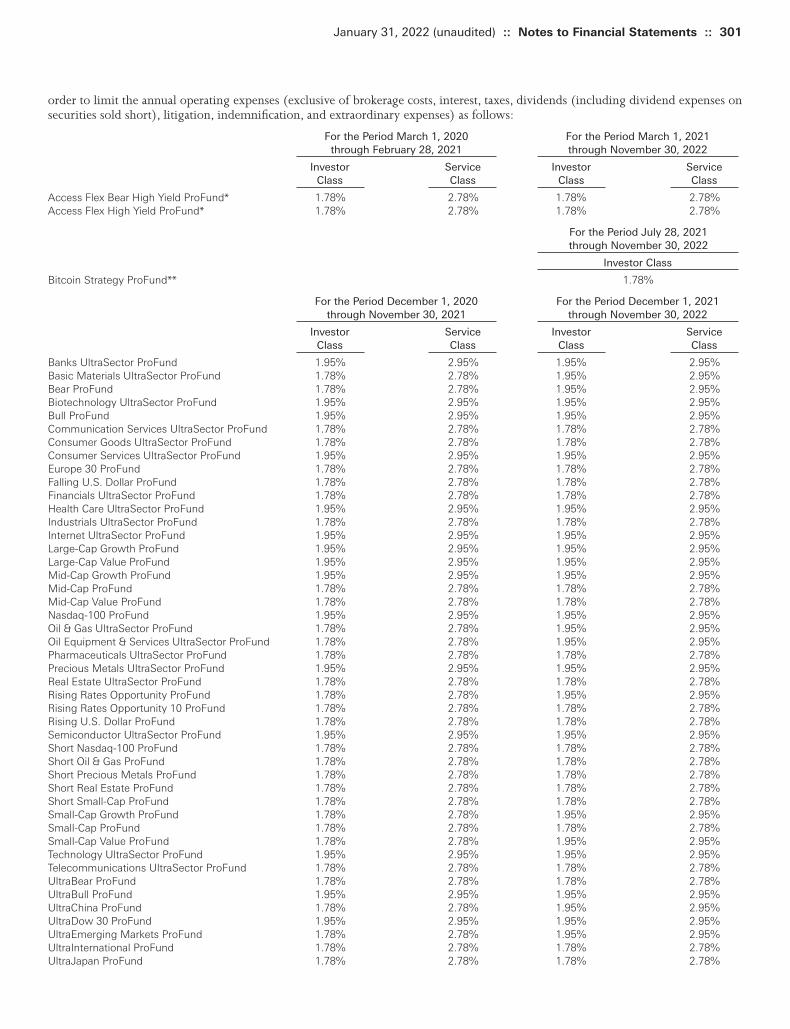
order to limit the annual operating expenses (exclusive of brokerage costs, interest, taxes, dividends (including dividend expenses onsecurities sold short), litigation, indemnification, and extraordinary expenses) as follows:
For the Period March 1, 2020 For the Period March 1, 2021through February 28, 2021 through November 30, 2022
Investor Service Investor ServiceClass Class Class Class
Access Flex Bear High Yield ProFund* 1.78% 2.78% 1.78% 2.78%Access Flex High Yield ProFund* 1.78% 2.78% 1.78% 2.78%
For the Period July 28, 2021through November 30, 2022
Investor Class
Bitcoin Strategy ProFund** 1.78%
For the Period December 1, 2020 For the Period December 1, 2021through November 30, 2021 through November 30, 2022
Investor Service Investor ServiceClass Class Class Class
Banks UltraSector ProFund 1.95% 2.95% 1.95% 2.95%Basic Materials UltraSector ProFund 1.78% 2.78% 1.95% 2.95%Bear ProFund 1.78% 2.78% 1.95% 2.95%Biotechnology UltraSector ProFund 1.95% 2.95% 1.95% 2.95%Bull ProFund 1.95% 2.95% 1.95% 2.95%Communication Services UltraSector ProFund 1.78% 2.78% 1.78% 2.78%Consumer Goods UltraSector ProFund 1.78% 2.78% 1.78% 2.78%Consumer Services UltraSector ProFund 1.95% 2.95% 1.95% 2.95%Europe 30 ProFund 1.78% 2.78% 1.78% 2.78%Falling U.S. Dollar ProFund 1.78% 2.78% 1.78% 2.78%Financials UltraSector ProFund 1.78% 2.78% 1.78% 2.78%Health Care UltraSector ProFund 1.95% 2.95% 1.95% 2.95%Industrials UltraSector ProFund 1.78% 2.78% 1.78% 2.78%Internet UltraSector ProFund 1.95% 2.95% 1.95% 2.95%Large-Cap Growth ProFund 1.95% 2.95% 1.95% 2.95%Large-Cap Value ProFund 1.95% 2.95% 1.95% 2.95%Mid-Cap Growth ProFund 1.95% 2.95% 1.95% 2.95%Mid-Cap ProFund 1.78% 2.78% 1.78% 2.78%Mid-Cap Value ProFund 1.78% 2.78% 1.78% 2.78%Nasdaq-100 ProFund 1.95% 2.95% 1.95% 2.95%Oil & Gas UltraSector ProFund 1.78% 2.78% 1.95% 2.95%Oil Equipment & Services UltraSector ProFund 1.78% 2.78% 1.95% 2.95%Pharmaceuticals UltraSector ProFund 1.78% 2.78% 1.78% 2.78%Precious Metals UltraSector ProFund 1.95% 2.95% 1.95% 2.95%Real Estate UltraSector ProFund 1.78% 2.78% 1.78% 2.78%Rising Rates Opportunity ProFund 1.78% 2.78% 1.95% 2.95%Rising Rates Opportunity 10 ProFund 1.78% 2.78% 1.78% 2.78%Rising U.S. Dollar ProFund 1.78% 2.78% 1.78% 2.78%Semiconductor UltraSector ProFund 1.95% 2.95% 1.95% 2.95%Short Nasdaq-100 ProFund 1.78% 2.78% 1.78% 2.78%Short Oil & Gas ProFund 1.78% 2.78% 1.78% 2.78%Short Precious Metals ProFund 1.78% 2.78% 1.78% 2.78%Short Real Estate ProFund 1.78% 2.78% 1.78% 2.78%Short Small-Cap ProFund 1.78% 2.78% 1.78% 2.78%Small-Cap Growth ProFund 1.78% 2.78% 1.95% 2.95%Small-Cap ProFund 1.78% 2.78% 1.78% 2.78%Small-Cap Value ProFund 1.78% 2.78% 1.95% 2.95%Technology UltraSector ProFund 1.95% 2.95% 1.95% 2.95%Telecommunications UltraSector ProFund 1.78% 2.78% 1.78% 2.78%UltraBear ProFund 1.78% 2.78% 1.78% 2.78%UltraBull ProFund 1.95% 2.95% 1.95% 2.95%UltraChina ProFund 1.78% 2.78% 1.95% 2.95%UltraDow 30 ProFund 1.95% 2.95% 1.95% 2.95%UltraEmerging Markets ProFund 1.78% 2.78% 1.95% 2.95%UltraInternational ProFund 1.78% 2.78% 1.78% 2.78%UltraJapan ProFund 1.78% 2.78% 1.78% 2.78%
January 31, 2022 (unaudited) :: Notes to Financial Statements :: 301
Toppan Merrill - ProFunds Public Semi-Annual Report [Funds] 01-31-2022 ED [AUX] | akiesli | 29-Mar-22 08:44 | 22-1296-2.ga | Sequence: 27CHKSUM Content: 50881 Layout: 26464 Graphics: 0 CLEAN
JOB: 22-1296-2 CYCLE#;BL#: 8; 0 TRIM: 8.25" x 10.75" AS: New York: 212-620-5600COLORS: ~note-color 2, Black, ~note-color 3 GRAPHICS: none V1.5
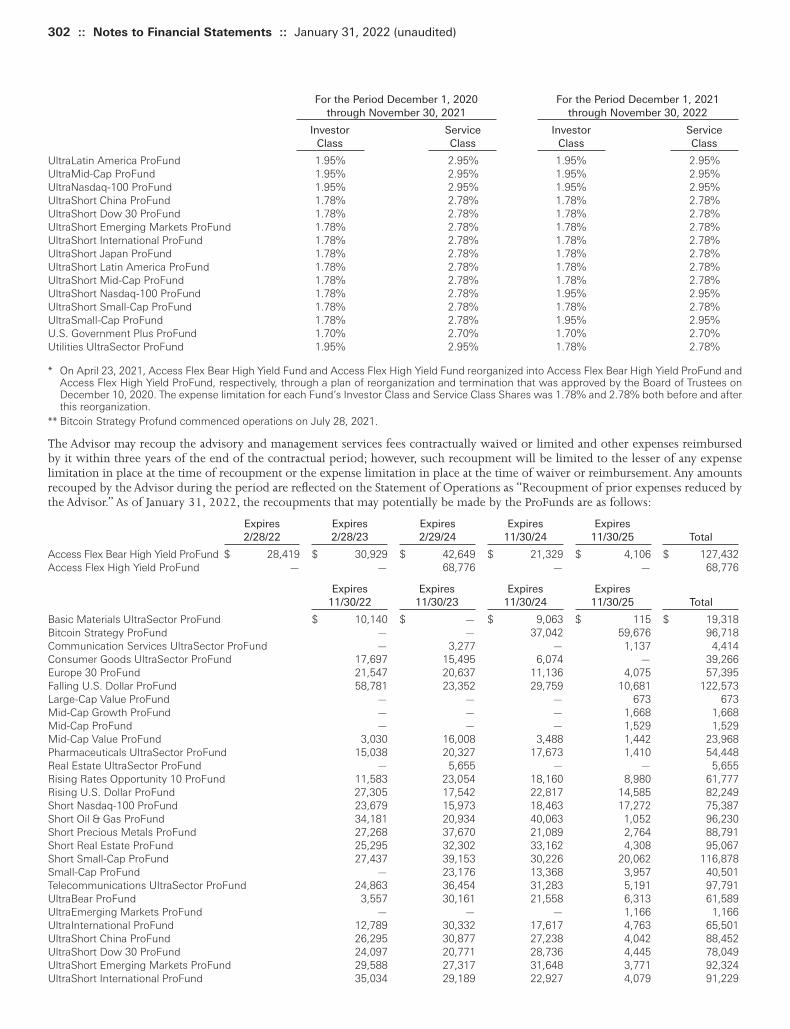
For the Period December 1, 2020 For the Period December 1, 2021through November 30, 2021 through November 30, 2022
Investor Service Investor ServiceClass Class Class Class
UltraLatin America ProFund 1.95% 2.95% 1.95% 2.95%UltraMid-Cap ProFund 1.95% 2.95% 1.95% 2.95%UltraNasdaq-100 ProFund 1.95% 2.95% 1.95% 2.95%UltraShort China ProFund 1.78% 2.78% 1.78% 2.78%UltraShort Dow 30 ProFund 1.78% 2.78% 1.78% 2.78%UltraShort Emerging Markets ProFund 1.78% 2.78% 1.78% 2.78%UltraShort International ProFund 1.78% 2.78% 1.78% 2.78%UltraShort Japan ProFund 1.78% 2.78% 1.78% 2.78%UltraShort Latin America ProFund 1.78% 2.78% 1.78% 2.78%UltraShort Mid-Cap ProFund 1.78% 2.78% 1.78% 2.78%UltraShort Nasdaq-100 ProFund 1.78% 2.78% 1.95% 2.95%UltraShort Small-Cap ProFund 1.78% 2.78% 1.78% 2.78%UltraSmall-Cap ProFund 1.78% 2.78% 1.95% 2.95%U.S. Government Plus ProFund 1.70% 2.70% 1.70% 2.70%Utilities UltraSector ProFund 1.95% 2.95% 1.78% 2.78%
* On April 23, 2021, Access Flex Bear High Yield Fund and Access Flex High Yield Fund reorganized into Access Flex Bear High Yield ProFund andAccess Flex High Yield ProFund, respectively, through a plan of reorganization and termination that was approved by the Board of Trustees onDecember 10, 2020. The expense limitation for each Fund’s Investor Class and Service Class Shares was 1.78% and 2.78% both before and afterthis reorganization.
** Bitcoin Strategy Profund commenced operations on July 28, 2021.
The Advisor may recoup the advisory and management services fees contractually waived or limited and other expenses reimbursedby it within three years of the end of the contractual period; however, such recoupment will be limited to the lesser of any expenselimitation in place at the time of recoupment or the expense limitation in place at the time of waiver or reimbursement. Any amountsrecouped by the Advisor during the period are reflected on the Statement of Operations as “Recoupment of prior expenses reduced bythe Advisor.” As of January 31, 2022, the recoupments that may potentially be made by the ProFunds are as follows:
Expires Expires Expires Expires Expires 2/28/22 2/28/23 2/29/24 11/30/24 11/30/25 Total Access Flex Bear High Yield ProFund $ 28,419 $ 30,929 $ 42,649 $ 21,329 $ 4,106 $ 127,432Access Flex High Yield ProFund — — 68,776 — — 68,776
Expires Expires Expires Expires 11/30/22 11/30/23 11/30/24 11/30/25 Total
Basic Materials UltraSector ProFund $ 10,140 $ — $ 9,063 $ 115 $ 19,318Bitcoin Strategy ProFund — — 37,042 59,676 96,718Communication Services UltraSector ProFund — 3,277 — 1,137 4,414Consumer Goods UltraSector ProFund 17,697 15,495 6,074 — 39,266Europe 30 ProFund 21,547 20,637 11,136 4,075 57,395Falling U.S. Dollar ProFund 58,781 23,352 29,759 10,681 122,573Large-Cap Value ProFund — — — 673 673Mid-Cap Growth ProFund — — — 1,668 1,668Mid-Cap ProFund — — — 1,529 1,529Mid-Cap Value ProFund 3,030 16,008 3,488 1,442 23,968Pharmaceuticals UltraSector ProFund 15,038 20,327 17,673 1,410 54,448Real Estate UltraSector ProFund — 5,655 — — 5,655Rising Rates Opportunity 10 ProFund 11,583 23,054 18,160 8,980 61,777Rising U.S. Dollar ProFund 27,305 17,542 22,817 14,585 82,249Short Nasdaq-100 ProFund 23,679 15,973 18,463 17,272 75,387Short Oil & Gas ProFund 34,181 20,934 40,063 1,052 96,230Short Precious Metals ProFund 27,268 37,670 21,089 2,764 88,791Short Real Estate ProFund 25,295 32,302 33,162 4,308 95,067Short Small-Cap ProFund 27,437 39,153 30,226 20,062 116,878Small-Cap ProFund — 23,176 13,368 3,957 40,501Telecommunications UltraSector ProFund 24,863 36,454 31,283 5,191 97,791UltraBear ProFund 3,557 30,161 21,558 6,313 61,589UltraEmerging Markets ProFund — — — 1,166 1,166UltraInternational ProFund 12,789 30,332 17,617 4,763 65,501UltraShort China ProFund 26,295 30,877 27,238 4,042 88,452UltraShort Dow 30 ProFund 24,097 20,771 28,736 4,445 78,049UltraShort Emerging Markets ProFund 29,588 27,317 31,648 3,771 92,324UltraShort International ProFund 35,034 29,189 22,927 4,079 91,229
302 :: Notes to Financial Statements :: January 31, 2022 (unaudited)
Toppan Merrill - ProFunds Public Semi-Annual Report [Funds] 01-31-2022 ED [AUX] | akiesli | 29-Mar-22 08:44 | 22-1296-2.ga | Sequence: 28CHKSUM Content: 56765 Layout: 47006 Graphics: 0 CLEAN
JOB: 22-1296-2 CYCLE#;BL#: 8; 0 TRIM: 8.25" x 10.75" AS: New York: 212-620-5600COLORS: ~note-color 2, Black, ~note-color 3 GRAPHICS: none V1.5

Expires Expires Expires Expires 11/30/22 11/30/23 11/30/24 11/30/25 Total
UltraShort Japan ProFund $ 39,480 $ 29,550 $ 40,917 $ 2,729 $ 112,676UltraShort Latin America ProFund 27,687 23,861 30,125 2,645 84,318UltraShort Mid-Cap ProFund 23,943 23,952 25,301 7,787 80,983UltraShort Nasdaq-100 ProFund — — — 888 888UltraShort Small-Cap ProFund 50,543 31,634 17,026 4,867 104,070
5. Securities Transactions
The cost of security purchases and the proceeds from the sale of securities (excluding securities maturing less than one year fromacquisition) during the period ended January 31, 2022 were as follows:
Purchases Sales
Banks UltraSector ProFund $ 15,965,646 $ 91,065,303Basic Materials UltraSector ProFund 7,753,517 10,713,985Biotechnology UltraSector ProFund 30,521,173 41,441,154Bull ProFund 3,454,800 6,400,940Communication Services UltraSector ProFund 2,234,756 3,512,427Consumer Goods UltraSector ProFund 6,947,445 2,942,031Consumer Services UltraSector ProFund 11,220,956 29,873,296Europe 30 ProFund 8,624,559 9,073,535Financials UltraSector ProFund 27,663,363 30,738,728Health Care UltraSector ProFund 14,151,201 29,178,120Industrials UltraSector ProFund 13,426,969 20,007,709Internet UltraSector ProFund 23,158,652 50,748,900Large Cap Growth ProFund 110,802,288 126,446,322Large Cap Value ProFund 76,140,075 53,438,972Mid Cap Growth ProFund 4,887,264 5,845,477Mid Cap ProFund 492,734 1,715,871Mid Cap Value ProFund 10,815,566 12,527,084Nasdaq 100 ProFund 164,835,533 200,575,478Oil & Gas UltraSector ProFund 12,170,980 12,704,201Oil Equipment & Services UltraSector 16,359,247 15,261,489Pharmaceuticals UltraSector ProFund 3,686,798 3,445,282Precious Metals UltraSector ProFund 8,649,134 14,128,576Real Estate UltraSector ProFund 101,871,147 117,200,624Semiconductor UltraSector ProFund 36,976,446 21,559,357Small-Cap Growth ProFund 5,138,647 9,103,203Small-Cap ProFund 1,200,210 3,305,657Small-Cap Value ProFund 22,396,477 25,324,180Technology UltraSector ProFund 18,094,988 33,989,490Telecommunications UltraSector ProFund 628,507 676,050UltraBull ProFund 7,219,822 10,069,104UltraChina ProFund 24,350,731 17,475,122UltraDow 30 ProFund 2,598,990 27,974UltraEmerging Markets ProFund 7,998,571 5,938,448UltraLatin America ProFund 6,880,625 7,594,270UltraMid-Cap ProFund 4,006,357 14,731,110UltraNasdaq-100 ProFund 316,620,126 496,708,980UltraSmall-Cap ProFund 18,386,352 8,142,352Utilities UltraSector ProFund 3,581,593 3,236,034
The cost of U.S. government security purchases and the proceeds from the sale of U.S. government securities (excluding securitiesmaturing less than one year from acquisition) during the period ended January 31, 2022 were as follows:
Purchases Sales
Access Flex High Yield ProFund $ 51,680,025 $ 57,702,064
January 31, 2022 (unaudited) :: Notes to Financial Statements :: 303
6. Investment Risks
Some risks apply to all ProFunds, while others are specific to theinvestment strategy of certain ProFunds. Each ProFund may besubject to other risks in addition to these identified risks. Thissection discusses certain common principal risks encountered by
the ProFunds. The risks are presented in an order intended tofacilitate readability, and their order does not imply that therealization of one risk is likely to occur more frequently thananother risk, nor does it imply that the realization of one risk islikely to have a greater adverse impact than another risk.
Toppan Merrill - ProFunds Public Semi-Annual Report [Funds] 01-31-2022 ED [AUX] | akiesli | 29-Mar-22 08:44 | 22-1296-2.ga | Sequence: 29CHKSUM Content: 36912 Layout: 13508 Graphics: 0 CLEAN
JOB: 22-1296-2 CYCLE#;BL#: 8; 0 TRIM: 8.25" x 10.75" AS: New York: 212-620-5600COLORS: ~note-color 2, Black, ~note-color 3 GRAPHICS: none V1.5
Risks Associated with the Use of Derivatives
Certain ProFunds may obtain investment exposure throughderivatives. Investing in derivatives may be considered aggressiveand may expose the ProFund to greater risks and may result inlarger losses or smaller gains than investing directly in thereference asset(s) underlying those derivatives (e.g., securities inthe Index). These risks include counterparty risk, liquidity risk andincreased correlation risk. When the ProFund uses derivatives,there may be imperfect correlation between the value of thereference asset(s) underlying the derivative (e.g., securities in theIndex) and the derivative, which may prevent the ProFund fromachieving its investment objective. Because derivatives oftenrequire only a limited initial investment, the use of derivatives alsomay expose the ProFund to losses in excess of those amountsinitially invested.
Certain ProFunds may use a combination of swaps on the Indexand swaps on an ETF that is designed to track the performance ofthe Index. The performance of an ETF may not track theperformance of the Index due to embedded costs and other factors.Thus, to the extent the Fund invests in swaps that use an ETF asthe reference asset, each Fund may be subject to greater correlationrisk and may not achieve as high a degree of correlation with theIndex as it would if the Fund only used swaps on the Index.
Moreover, with respect to the use of swap agreements, if the Indexhas a dramatic intraday move that causes a material decline in aProFund’s net assets, the terms of a swap agreement between theProFund and its counterparty may permit the counterparty toimmediately close out the transaction with the ProFund. In thatevent, the ProFund may be unable to enter into another swapagreement or invest in other derivatives to achieve the desiredexposure consistent with the ProFund’s investment objective. This,in turn, may prevent the ProFund from achieving its investmentobjective, even if the Index reverses all or a portion of its intradaymove by the end of the day. As a result, the value of an investmentin the ProFund may change quickly and without warning. Anycosts associated with using derivatives will also have the effect oflowering the ProFund’s return.
The Bitcoin Futures Contracts market futures may be lessdeveloped, and potentially less liquid and more volatile, than moreestablished futures markets. While the Bitcoin futures market hasgrown substantially since Bitcoin futures commenced trading,there can be no assurance that this growth will continue. Bitcoinfutures are subject to collateral requirements and daily limits thatmay limit the Fund’s ability to achieve the desired exposure. If theFund is unable to meet its investment objective, the Fund’s returnsmay be lower than expected. Additionally, these collateralrequirements may require the Fund to liquidate its position whenit otherwise would not do so.
Compounding Risk
Most of the ProFunds are “geared” funds (“Geared Funds”) in thesense that the ProFund has an investment objective to match amultiple, the inverse, or an inverse multiple of the performanceof a benchmark on a single day, not for any other period. A “singleday” is measured from the time a ProFund calculates its net assetvalue (“NAV”) to the time of the ProFund’s next NAV calculation.These Geared Funds are subject to all of the correlation risksdescribed below. In addition, because the ProFunds have a single
day investment objective, for periods greater than one day, theeffect of compounding may cause the performance of a ProFundto vary from the benchmark performance (or the inverse of thebenchmark performance) times the stated multiple in the ProFundobjective, as applicable, before accounting for fees and ProFundexpenses. As explained in greater detail in their Prospectuses, as aresult of compounding, Geared Funds are unlikely to provide asimple multiple (e.g. -1x, 2x, or -2x) of a benchmark’s return overperiods longer than a single day.
Leverage Risk
Certain ProFunds utilize leverage (i.e., obtain investment exposurein excess of their assets) in seeking to achieve their investmentobjective and will lose more money in market environmentsadverse to their daily objective than similar funds that do notemploy leverage.
Because the ProFunds that utilize leverage include multipliers of2x, 1.5x, or 1.25x (or sometimes the inverse thereof), a single dayadverse price movement of more than 50%, 67% or 80%,respectively, in a relevant benchmark, could result in the total lossof an investor’s investment.
Active Investor Risk
Each ProFund permits short-term trading of its securities. Inaddition, the Advisor expects a significant portion of the assetsinvested in a ProFund to come from professional money managersand investors who use the ProFund as part of active trading ortactical asset allocation strategies. These strategies often call forfrequent trading to take advantage of anticipated changes in marketconditions, which could increase portfolio turnover, and mayresult in additional costs for the ProFund. In addition, largemovements of assets into and out of the ProFund may have anegative impact on the ProFund’s ability to achieve its investmentobjective or maintain a consistent level of operating expenses. Incertain circumstances, the ProFund’s expense ratio may vary fromcurrent estimates or the historical ratio disclosed in the ProFund’sprospectus.
Bitcoin Risk
The Bitcoin Strategy ProFund does not invest directly in Bitcoin.The Fund invests primarily in Bitcoin futures.
Bitcoin is a relatively new innovation and the market for Bitcoinis subject to rapid price swings, changes and uncertainty. Thefurther development of the Bitcoin Network and the acceptanceand use of Bitcoin are subject to a variety of factors that are difficultto evaluate. The slowing, stopping or reversing of the developmentof the Bitcoin Network or the acceptance of Bitcoin may adverselyaffect the price of Bitcoin. Bitcoin is subject to the risk of fraud,theft, manipulation or security failures, operational or otherproblems that impact Bitcoin trading venues. Additionally, if oneor a coordinated group of miners were to gain control of 51% ofthe Bitcoin Network, they would have the ability to manipulatetransactions, halt payments and fraudulently obtain Bitcoin. Asignificant portion of Bitcoin is held by a small number of holderssometimes referred to as “whales”. These holders have the abilityto manipulate the price of Bitcoin. Unlike the exchanges for moretraditional assets, such as equity securities and futures contracts,Bitcoin and Bitcoin trading venues are largely unregulated. As a
304 :: Notes to Financial Statements :: January 31, 2022 (unaudited)
Toppan Merrill - ProFunds Public Semi-Annual Report [Funds] 01-31-2022 ED [AUX] | akiesli | 29-Mar-22 08:44 | 22-1296-2.ga | Sequence: 30CHKSUM Content: 34209 Layout: 5042 Graphics: 0 CLEAN
JOB: 22-1296-2 CYCLE#;BL#: 8; 0 TRIM: 8.25" x 10.75" AS: New York: 212-620-5600COLORS: ~note-color 2, Black, ~note-color 3 GRAPHICS: none V1.5
result of the lack of regulation, individuals or groups may engagein fraud or market manipulation and investors may be moreexposed to the risk of theft, fraud and market manipulation thanwhen investing in more traditional asset classes. Over the pastseveral years, a number of Bitcoin trading venues have been closeddue to fraud, failure or security breaches. Investors in Bitcoin mayhave little or no recourse should such theft, fraud or manipulationoccur and could suffer significant losses. Legal or regulatorychanges may negatively impact the operation of the BitcoinNetwork or restrict the use of Bitcoin. The realization of any ofthese risks could result in a decline in the acceptance of Bitcoinand consequently a reduction in the value of Bitcoin, Bitcoinfutures, and the Fund. The Bitcoin Network is collectivelymaintained by (1) a decentralized group of participants who runcomputer software that results in the recording and validation oftransactions (commonly referred to as “miners”), (2) developerswho propose improvements to the Bitcoin Protocol and thesoftware that enforces the protocol and (3) users who choosewhich version of the bitcoin software to run. From time to time,the developers suggest changes to the bitcoin software. If asufficient number of users and miners elect not to adopt thechanges, a new digital asset, operating on the earlier version ofthe bitcoin software, may be created. This is often referred to as a“fork.” The creation of a “fork” or a substantial giveaway of Bitcoin(sometimes referred to as an “air drop”) may result in a significantand unexpected declines in the value of Bitcoin, Bitcoin futures,and the Fund.
Bitcoin Futures Risk
The market for Bitcoin futures may be less developed, andpotentially less liquid and more volatile, than more establishedfutures markets. While the Bitcoin futures market has grownsubstantially since Bitcoin futures commenced trading, there canbe no assurance that this growth will continue. Bitcoin futures aresubject to collateral requirements and daily limits that may limitthe Fund’s ability to achieve the desired exposure. If the Fund isunable to meet its investment objective, the Fund’s returns may belower than expected. Additionally, these collateral requirementsmay require the Fund to liquidate its position when it otherwisewould not do so.
When a Bitcoin futures contract is nearing expiration, the Fundwill generally sell it and use the proceeds to buy a Bitcoin futurescontract with a later expiration date. This is commonly referred toas “rolling”. The costs associated with rolling Bitcoin futurestypically are substantially higher than the costs associated withother futures contracts and may have a significant adverse impacton the performance of the Fund.
Borrowing Risk
The Bitcoin Strategy ProFund may borrow for investment purposesusing reverse repurchase agreements. The cost of borrowing mayreduce the Fund’s return. Borrowing may cause a Fund to liquidatepositions under adverse market conditions to satisfy its repaymentobligations. Borrowing increases the risk of loss and may increasethe volatility of the Fund.
Active Management Risk
Access Flex Bear High Yield ProFund, Access Flex High YieldProFund and Bitcoin Strategy ProFund are actively managed, andtheir performance reflect the investment decisions that ProFundAdvisors make for the Funds. ProFund Advisors’ judgements aboutthe Funds’ investments may prove to be incorrect. If theinvestments selected and strategies employed by the Funds fail toproduce the intended results, the Funds could underperform orhave negative returns as compared to other funds with a similarinvestment objective and/or strategies.
Concentration Risk
Concentration risk results from maintaining concentratedexposure to certain types of issuers, industries, market sectors,countries or geographical regions. A ProFund that concentrates itsinvestments will be more susceptible to risks associated with thatconcentration. With respect to the UltraSector and Inverse SectorProFunds, a ProFund may have significant exposure to anindividual industry that constitutes a significant portion of thatProFund’s benchmark. Such a ProFund will be more susceptibleto the risks associated with that specific industry, which may bedifferent from the risks generally associated with otherbenchmarks. Each ProFund will concentrate its investments in aparticular industry or group of industries to approximately thesame extent as its benchmark, up to the extent permitted byapplicable regulatory guidance. Additionally, certain ProFunds thatfocus their investments in particular countries or geographicregions may be particularly susceptible to economic, political orregulatory events affecting those countries or regions. TheseProFunds may be more volatile than a more geographicallydiversified ProFund. The Schedule of Portfolio Investmentsincludes information on each ProFund’s holdings, includingindustry and/or geographical composition, as relevant.
Correlation Risk
There is no guarantee that a ProFund will achieve a high degreeof correlation with its benchmark. Failure to achieve a high degreeof correlation may prevent a ProFund from achieving itsinvestment objective, and the percentage change of the ProFund’sNAV each day may differ, perhaps significantly, from the percentagechange of the ProFund’s benchmark on such day. This may be due,among other reasons, to the impact of a limited trading market inthe underlying component securities on the calculation of thebenchmark.
In order to achieve a high degree of correlation with the Index, aProFund seeks to rebalance its portfolio daily to keep exposureconsistent with its investment objective. Being materially under-or overexposed to the Index may prevent the ProFund fromachieving a high degree of correlation with the Index. Marketdisruptions or closure, regulatory restrictions, market volatilityand other factors will adversely affect the ProFund’s ability toadjust exposure to requisite levels. The target amount of portfolioexposure is impacted dynamically by the Index’s movements.Because of this, it is unlikely that the ProFund will have perfectleveraged exposure at the end of each day and the likelihood ofbeing materially under- or overexposed is higher on days whenthe Index level is volatile at or near the close of the trading day.
January 31, 2022 (unaudited) :: Notes to Financial Statements :: 305
Toppan Merrill - ProFunds Public Semi-Annual Report [Funds] 01-31-2022 ED [AUX] | akiesli | 29-Mar-22 08:44 | 22-1296-2.ga | Sequence: 31CHKSUM Content: 42376 Layout: 17462 Graphics: 0 CLEAN
JOB: 22-1296-2 CYCLE#;BL#: 8; 0 TRIM: 8.25" x 10.75" AS: New York: 212-620-5600COLORS: ~note-color 2, Black, ~note-color 3 GRAPHICS: none V1.5
A number of other factors may adversely affect a ProFund’scorrelation with its benchmark, including material over- orunderexposure, fees, expenses, transaction costs, financing costsassociated with the use of derivatives, income items, valuationmethodology, accounting standards and disruptions or illiquidityin the markets for the securities or financial instruments in whicha ProFund invests. A ProFund may not have investment exposureto all securities in its benchmark, or its weighting of investmentexposure to stocks or industries may be different from that of thebenchmark. In addition, a ProFund may invest in securities notincluded in the benchmark or in financial instruments. EachProFund may take or refrain from taking positions in order toimprove tax efficiency or comply with regulatory restrictions,either of which may negatively affect the ProFund’s correlationwith its benchmark. A ProFund may also be subject to largemovements of assets into and out of the ProFund, potentiallyresulting in the ProFund being over- or underexposed to itsbenchmark, and may be impacted by index reconstitutions andindex rebalancing events. Additionally, a ProFund’s underlyingholdings or reference assets may trade on markets that may or maynot be open on the same day as the ProFund. Each ProFund (otherthan the Classic ProFunds and the Falling U.S. Dollar ProFund)seeks to rebalance its portfolio daily to keep its leveraged, inverseor inverse leveraged exposure to the benchmark consistent withits investment objective. Any of these factors could decreasecorrelation between the performance of a ProFund and may hindera ProFund’s ability to meet its investment objective on or aroundthat day.
Credit Default Swaps (“CDS”) Risk
While the Access Flex Bear High Yield ProFund will normally be anet “buyer” of CDS and the Access Flex High Yield ProFund willnormally be a net “seller” of CDS, at times the Access Flex BearHigh Yield ProFund may be a net “seller” and the Access Flex HighYield ProFund may be a net “buyer” of CDS. When a ProFund is aseller of credit protection, upon the occurrence of a credit event,the ProFund will have an obligation to pay the full notional valueof a defaulted reference entity less recovery value. When a ProFundis a buyer of credit protection, upon the occurrence of a creditevent, the counterparty to the ProFund will have an obligation topay the full notional value of a defaulted reference entity lessrecovery value. Recovery values for CDS are generally determinedvia an auction process to determine the final price for a givenreference entity. Although, each ProFund intends, as practicable,to obtain exposure through centrally cleared CDS, an active marketmay not exist for any of the CDS in which a ProFund invests or inthe reference entities subject to the CDS. As a result, a ProFund’sability to maximize returns or minimize losses on such CDS maybe impaired. Other risks of CDS include difficulty in valuation dueto the lack of pricing transparency and the risk that changes in thevalue of the CDS do not reflect changes in the credit quality of theunderlying reference entities or may otherwise perform differentlythan expected given market conditions. Because a ProFund mayuse a single counterparty or a small number of counterparties,certain CDS involve many reference entities and there are nolimitations on the notional amount established for the CDS. As aresult, counterparty risk may be amplified.
Counterparty Risk
A ProFund that will invest in financial instruments involving thirdparties (i.e., counterparties) is subject to counterparty risk. Theuse of financial instruments, such as swap agreements or futurescontracts, involves risks that are different from those associatedwith ordinary portfolio securities transactions. Certain ProFundswill be subject to credit risk (i.e., the risk that a counterparty isunwilling or unable to make timely payments to meet itscontractual obligations) with respect to the amount they expectto receive from counterparties to financial instruments andrepurchase agreements entered into by the ProFunds. EachProFund generally structures the agreement such that either partycan terminate the contract without penalty prior to thetermination date. A ProFund may be negatively impacted if acounterparty becomes bankrupt or otherwise fails to perform itsobligations, the value of an investment in each ProFund maydecline. A ProFund may experience significant delays in obtainingany recovery in a bankruptcy or other reorganization proceedingand a ProFund may obtain only limited recovery or may obtain norecovery in such circumstances.
The ProFunds typically enter into transactions with counterpartieswhose credit rating at the time of the transaction is investmentgrade, as determined by a nationally recognized statistical ratingorganization, or, if unrated, judged by the Advisor to be ofcomparable quality. These are usually major, global financialinstitutions. Although the counterparty to an exchange-tradedfutures contract is often backed by a futures commission merchant(“FCM”) or clearing organization that is further backed by a groupof financial institutions, there may be instances in which the FCMor the clearing organization could fail to perform its obligations,causing significant losses to the ProFund. For example, a ProFundcould lose margin payments it has deposited with a clearingorganization as well as gains owed but not paid to the ProFund ifthe clearing organization becomes insolvent or otherwise fails toperform its obligations.
Under current CFTC regulations, a FCM maintains customers’assets in a bulk segregated account. If a FCM fails to do so, or isunable to satisfy a substantial deficit in a customer account, itsother customers may be subject to risk of loss of their funds in theevent of that FCM’s bankruptcy. In that event, in the case of futures,the FCM’s customers are entitled to recover, even in respect ofproperty specifically traceable to them, only a proportional shareof all property available for distribution to all of that FCM’scustomers. In the case of cleared swaps, customers of a FCM inbankruptcy are entitled to recover assets specifically attributable tothem pursuant to new CFTC regulations, but may nevertheless riskloss of some or all of their assets due to accounting or operationalissues or due to legal risk in connection with the application ofbankruptcy law to cleared swaps.
Natural Disaster/Epidemic Risk
Natural or environmental disasters, such as earthquakes, fires,floods, hurricanes, tsunamis and other severe weather-relatedphenomena generally, and widespread disease, includingpandemics and epidemics (for example, the novel coronavirus(COVID-19)), have been and can be highly disruptive toeconomies and markets and have recently led, and may continueto lead, to increased market volatility and significant market losses.
306 :: Notes to Financial Statements :: January 31, 2022 (unaudited)
Toppan Merrill - ProFunds Public Semi-Annual Report [Funds] 01-31-2022 ED [AUX] | akiesli | 29-Mar-22 08:44 | 22-1296-2.ga | Sequence: 32CHKSUM Content: 39228 Layout: 45412 Graphics: 0 CLEAN
JOB: 22-1296-2 CYCLE#;BL#: 8; 0 TRIM: 8.25" x 10.75" AS: New York: 212-620-5600COLORS: ~note-color 2, Black, ~note-color 3 GRAPHICS: none V1.5
Such as natural disaster and health crises could exacerbate political,social, and economic risks previously mentioned, and result insignificant breakdowns, delays, shutdowns, social isolation, andother disruptions to important global, local and regional supplychains affected, with potential corresponding results on theoperating performance of the Fund and its investments. A climateof uncertainty and panic, including the contagion of infectiousviruses or diseases, may adversely affect global, regional, and localeconomies and reduce the availability of potential investmentopportunities, and increases the difficulty of performing duediligence and modeling market conditions, potentially reducingthe accuracy of financial projections. Under these circumstances,the Fund may have difficulty achieving its investment objectivewhich may adversely impact performance. Further, such events canbe highly disruptive to economies and markets, significantlydisrupt the operations of individual companies (including, but notlimited to, the Fund’s investment advisor and third party serviceproviders), sectors, industries, markets, securities and commodityexchanges, currencies, interest and inflation rates, credit ratings,investor sentiment, and other factors affecting the value of theFund’s investments. These factors can cause substantial marketvolatility, exchange trading suspensions and closures and canimpact the ability of the Fund to complete redemptions andotherwise affect Fund performance and Fund trading in thesecondary market. A widespread crisis may also affect the globaleconomy in ways that cannot necessarily be foreseen at the currenttime. How long such events will last and whether they willcontinue or recur cannot be predicted. Impacts from these eventscould have significant impact on the Fund’s performance, resultingin losses to your investment.
Risk that Current Assumptions and
Expectations Could Become Outdated As a
Result of Global Economic Shocks
The onset of the novel coronavirus (COVID-19) has causedsignificant shocks to global financial markets and economies, withmany governments taking extreme actions to slow and contain thespread of COVID-19 (including any variants). These actions havehad, and likely will continue to have, a severe economic impacton global economies as economic activity in some instances hasessentially ceased. Financial markets across the globe areexperiencing severe distress at least equal to what was experiencedduring the global financial crisis in 2008. In March 2020, U.S.equity markets entered a bear market in the fastest such move inthe history of U.S. financial markets. During much of 2020, theunemployment rate in the U.S. was extremely high by historicalstandards. Additionally, other public health issues, war, militaryconflicts, sanctions, acts of terrorism, sustained elevated inflation,supply chain issues or other events could have a significantnegative impact on global financial markets and economies. It isnot possible to predict when unemployment and marketconditions will return to more normal levels. The global economicshocks being experienced as of the date hereof may cause theunderlying assumptions and expectations of the Fund to quicklybecome outdated or inaccurate, resulting in significant losses.
Debt Instruments Risk
The ProFunds may invest in, or seek exposure to, debt instruments.Debt instruments are subject to adverse issuer, political, regulatory,
market and economic developments, as well as developments thataffect specific economic sectors, industries or segments of the fixedincome market. Additionally, the credit quality of the issuer of adebt instrument (including the risk of a potential default) can alsoaffect the price of a debt instrument. The perceived or actualinability of issuers, guarantors, or liquidity providers of debtinstruments to make scheduled interest payments can negativelyimpact the performance of the ProFund. Debt instruments mayhave varying levels of sensitivity to changes in interest rates andother factors. Typically, the price of outstanding debt instrumentsfalls when interest rates rise. Without taking into account otherfactors, the prices of debt instruments with longer maturities mayfluctuate more in response to interest rate changes than those ofdebt instruments with shorter maturities. In addition, changes inthe credit quality of the issuer of a debt instrument (including adefault) can also affect the price of a debt instrument. Many typesof debt instruments are subject to prepayment risk, which is therisk that the issuer of the security will repay principal (in part orin whole) prior to the maturity date. Debt instruments allowingprepayment may offer less potential for gains during a period ofdeclining interest rates, as a ProFund may be required to reinvestthe proceeds received at lower interest rates. These factors maycause the value of an investment in the ProFund to change. Also,the securities of certain U.S. government agencies, authorities orinstrumentalities are neither issued by nor guaranteed as toprincipal and interest by the U.S. government, and may be exposedto more credit risk than those issued by and guaranteed as toprincipal and interest by the U.S. government. All U.S. governmentsecurities are subject to credit risk. It is possible that the U.S.government may not be able to meet its financial obligations orthat securities issued by the U.S. government may experience creditdowngrades. Such a credit event may also adversely impact thefinancial markets. Certain ProFunds are inversely correlated tobond prices and will typically respond differently to the abovefactors than would a ProFund positively correlated to bond prices.
High Yield Risk
Investment in or exposure to high yield (lower rated) debtinstruments (also known as “junk bonds”) may involve greaterlevels of interest rate, credit, liquidity and valuation risk than forhigher rated instruments. High yield debt instruments may bemore sensitive to economic changes, political changes, or adversedevelopments specific to a company than other fixed incomeinstruments. These securities are subject to greater risk of loss,greater sensitivity to economic changes, valuation difficulties, anda potential lack of a secondary or public market for securities. Highyield debt instruments are considered predominantly speculativewith respect to the issuer’s continuing ability to make principaland interest payments and, therefore, such instruments generallyinvolve greater risk of default or price changes than higher rateddebt instruments. An economic downturn or period of risinginterest rates could adversely affect the market for these securitiesand reduce market liquidity (liquidity risk). Less active marketsmay diminish a ProFund’s ability to obtain accurate marketquotations when valuing the portfolio securities and thereby giverise to valuation risk. High yield debt instruments may also presentrisks based on payment expectations. For example, theseinstruments may contain redemption or call provisions. If an issuerexercises these provisions in a declining interest rate market, the
January 31, 2022 (unaudited) :: Notes to Financial Statements :: 307
Toppan Merrill - ProFunds Public Semi-Annual Report [Funds] 01-31-2022 ED [AUX] | akiesli | 29-Mar-22 08:44 | 22-1296-2.ga | Sequence: 33CHKSUM Content: 23332 Layout: 45266 Graphics: 0 CLEAN
JOB: 22-1296-2 CYCLE#;BL#: 8; 0 TRIM: 8.25" x 10.75" AS: New York: 212-620-5600COLORS: ~note-color 2, Black, ~note-color 3 GRAPHICS: none V1.5
ProFund would have to replace the security with a lower yieldingsecurity, resulting in a decreased return for investors. If the issuerof a security is in default with respect to interest or principalpayments, the issuer’s security could lose its entire value.Furthermore, the transaction costs associated with the purchaseand sale of high yield debt instruments may vary greatlydepending upon a number of factors and may adversely affect aProFund’s performance. While the realization of certain of theserisks may benefit the Access Flex Bear High Yield ProFund becauseit seeks investment results that correspond to the inverse of thehigh yield market, such occurrences may introduce more volatilityto the ProFund.
Index Performance Risk
Certain ProFunds linked to an index will be subject to indexperformance risk. There is no guarantee or assurance that themethodology used by the third-party provider to create the Indexwill result in the ProFund achieving high, or even positive, returns.Further, there can be no guarantee that the methodologyunderlying the Index or the daily calculation of the Index will befree from error. It is also possible that the value of the Index maybe subject to intentional manipulation by third-party marketparticipants. The Index may underperform, and the ProFund couldlose value, while other indices or measures of market performanceincrease in value.
Investment Capacity Risk
The Bitcoin Strategy ProFund’s ability to obtain exposure to Bitcoinfutures contracts consistent with its investment objective isdisrupted for any reason including, limited liquidity in the Bitcoinfutures market, a disruption to the Bitcoin futures market, or as aresult of margin requirements or position limits imposed by theFund’s futures commission merchants (“FCMs”), the CME, or theCFTC, the Fund would not be able to achieve its investmentobjective and may experience significant losses. The Adviser may,in its sole discretion and without prior notice, limit or rejectpurchases of Fund shares. This is often referred to as “closing” theFund. The Adviser may re-open the Fund in its sole discretion andwithout prior notice.
LIBOR Risk
Many debt securities, derivatives, and other financial instruments,including some of the Funds’ investments, use the LondonInterbank Offered Rate (“LIBOR”) as the reference or benchmarkrate for variable interest rate calculations. LIBOR is beingdiscontinued as a floating rate benchmark. The Secured OvernightFinancing Rate (“SOFR”) is expected to replace U.S. dollar LIBORas the principal floating rate benchmark. The LIBORdiscontinuation has affected and will continue to affect financialmarkets generally. The date of the LIBOR discontinuation will varydepending on the LIBOR currency and tenor.
The UK Financial Conduct Authority (the “FCA”), which is theregulator of the LIBOR administrator, has announced that, afterspecified dates, LIBOR settings will cease to be provided by anyadministrator or will no longer be representative. Those dates are:(i) June 30, 2023, in the case of the principal U.S. dollar LIBORtenors (overnight and one, three, six and 12 month); and(ii) January 31, 2022, in all other cases (i.e., one week and two
month U.S. dollar LIBOR and all tenors of non-U.S. dollar LIBOR).Accordingly, many existing LIBOR obligations will transition toanother benchmark after June 30, 2023 or, in some cases, afterJanuary 31, 2022. The FCA and certain U.S. regulators have statedthat, despite expected publication of U.S. dollar LIBOR throughJune 30, 2023, no new contracts using U.S. dollar LIBOR shouldbe entered into after January 31, 2022.
Although the foregoing reflects the likely timing of the LIBORdiscontinuation and certain consequences, there is no assurance thatLIBOR, of any particular currency or tenor, will continue to bepublished until any particular date or in any particular form, andthere is no assurance regarding the consequences of the LIBORdiscontinuation. In the United States, there have been efforts toidentify alternative reference interest rates for U.S. dollar LIBOR. Thecash markets have generally coalesced around recommendationsfrom the Alternative Reference Rates Committee (the “ARRC”),which was convened by the Board of Governors of the FederalReserve System and the Federal Reserve Bank of New York. The ARRChas recommended that U.S. dollar LIBOR be replaced by rates basedon SOFR plus, in the case of existing LIBOR contracts andobligations, a spread adjustment.
For purposes of the following discussion, the term “LIBOR” referssolely to U.S. dollar LIBOR. SOFR has a limited history, having beenfirst published in April 2018. The future performance of SOFR,and SOFR-based reference rates, cannot be predicted based onSOFR’s history or otherwise. SOFR has been more volatile thanother benchmark or market rates, such as three-month LIBOR,during certain periods. Future levels of SOFR may bear little or norelation to historical levels of SOFR, LIBOR or other rates. SOFR-based rates will differ from LIBOR, and the differences may bematerial. SOFR is intended to be a broad measure of the cost ofborrowing funds overnight in transactions that are collateralizedby U.S. Treasury securities. In contrast, LIBOR is intended to be anunsecured rate that represents interbank funding costs for differentshort-term tenors.
For these reasons, among others, there is no assurance that SOFR,or rates derived from SOFR, will perform in the same or a similarway as LIBOR would have performed at any time, and there is noassurance that SOFR-based rates will be a suitable substitute forLIBOR. Non-LIBOR floating rate obligations, including SOFR-based obligations, may have returns and values that fluctuate morethan those of floating rate obligations that are based on LIBOR orother rates. Resulting changes in the financial markets mayadversely affect financial markets generally and may also adverselyaffect a Fund’s operations specifically, particularly as financialmarkets transition away from LIBOR.
Liquidity Risk
In certain circumstances, such as the disruption of the orderlymarkets for the securities or financial instruments in which aProFund invests, the ProFunds might not be able to acquire ordispose of certain holdings quickly or at prices that represent truefair value in the judgment of the Advisor. Markets for the securitiesor financial instruments in which a ProFund invests may bedisrupted by a number of events, including but not limited toeconomic crises, natural disasters, new legislation, or regulatorychanges inside or outside of the U.S. For example, regulationlimiting the ability of certain financial institutions to invest in
308 :: Notes to Financial Statements :: January 31, 2022 (unaudited)
Toppan Merrill - ProFunds Public Semi-Annual Report [Funds] 01-31-2022 ED [AUX] | akiesli | 29-Mar-22 08:44 | 22-1296-2.ga | Sequence: 34CHKSUM Content: 22508 Layout: 19063 Graphics: 0 CLEAN
JOB: 22-1296-2 CYCLE#;BL#: 8; 0 TRIM: 8.25" x 10.75" AS: New York: 212-620-5600COLORS: ~note-color 2, Black, ~note-color 3 GRAPHICS: none V1.5

certain securities would likely reduce the liquidity of thosesecurities. These situations may prevent a ProFund from limitinglosses, realizing gains, or from achieving a high correlation (orinverse correlation) with its underlying benchmark.
The market for the Bitcoin futures contracts is still developing andmay be subject to periods of illiquidity. During such times it maybe difficult or impossible to buy or sell a position at the desired
price. Market disruptions or volatility can also make it difficult tofind a counterparty willing to transact at a reasonable price andsufficient size. Illiquid markets may cause losses, which could besignificant. The large size of the positions which the Fund mayacquire increases the risk of illiquidity, may make its positionsmore difficult to liquidate, and increase the losses incurred whiletrying to do so.
January 31, 2022 (unaudited) :: Notes to Financial Statements :: 309
7. Federal Income Tax Information
The tax character of distributions paid to shareholders during the applicable tax years ended as noted below, were as follows:
Year Ended 2021 Year Ended 2020
Distributions Distributions Distributions Distributions Paid from Paid from Total Paid from Paid from Total Ordinary Net Long-Term Tax Return Distributions Ordinary Net Long-Term Taxable Tax Return Distributions Income Gains of Capital Paid Income Gains Overdistribution of Capital Paid December 31Bear ProFund $ — $ — $ — $ — $ 8,361 $ — $ — $ — $ 8,361Bull ProFund 1,995,004 2,757,165 — 4,752,169 3,962,399 — — — 3,962,399Europe 30
ProFund 33,014 — — 33,014 104,574 — — — 104,574UltraBear
ProFund — — — — 37,071 — — — 37,071UltraBull
ProFund 5,070,936 2,554,660 — 7,625,596 9,602,431 4,135,538 — — 13,737,969UltraJapan
ProFund 675,945 1,304,962 — 1,980,907 — — — — —UltraNasdaq-100
ProFund 148,739,778 16,381,915 — 165,121,693 74,202,741 8,972,321 — — 83,175,062UltraShort
Nasdaq-100 ProFund — — — — 6,099 — — — 6,099
October 31Access Flex High
Yield ProFund 467,987 — — 467,987 547,098 59,251 606,349Basic Materials
UltraSector ProFund 87,381 4,525 — 91,906 — — — — —
Banks UltraSectorProFund — — — — 147,431 — — — 147,431
Biotechnology UltraSector ProFund 17,310,399 — — 17,310,399 — 6,477,017 — — 6,477,017
Communication Services UltraSector ProFund — — — — 202,746 — — — 202,746
Consumer Goods UltraSector ProFund — — — — 80,976 61,866 — — 142,842
Consumer Services UltraSector ProFund 1,939,814 1,051,801 — 2,991,615 — — — — —
Financials UltraSector ProFund — — — — 153,234 — 34,237 — 187,471
Health Care UltraSector ProFund — — — — 12,104 — — — 12,104
Toppan Merrill - ProFunds Public Semi-Annual Report [Funds] 01-31-2022 ED [AUX] | akiesli | 29-Mar-22 08:44 | 22-1296-2.ga | Sequence: 35CHKSUM Content: 42428 Layout: 5090 Graphics: 0 CLEAN
JOB: 22-1296-2 CYCLE#;BL#: 8; 0 TRIM: 8.25" x 10.75" AS: New York: 212-620-5600COLORS: ~note-color 2, Black, ~note-color 3 GRAPHICS: none V1.5
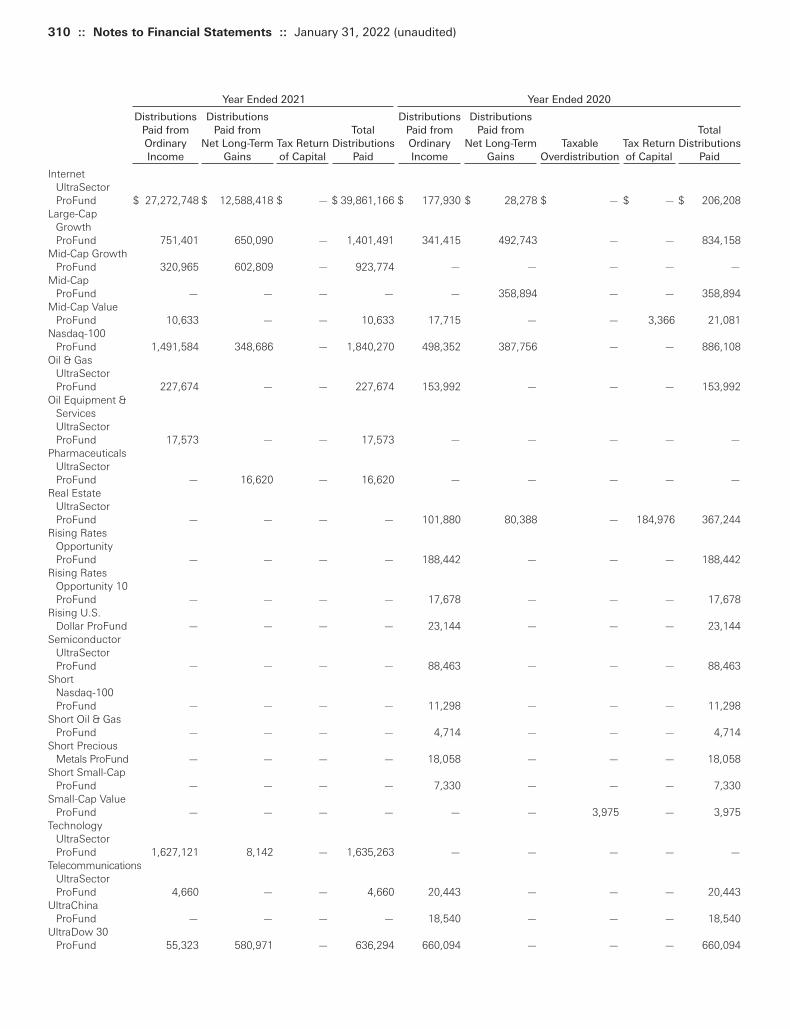
Year Ended 2021 Year Ended 2020
Distributions Distributions Distributions Distributions Paid from Paid from Total Paid from Paid from Total Ordinary Net Long-Term Tax Return Distributions Ordinary Net Long-Term Taxable Tax Return Distributions Income Gains of Capital Paid Income Gains Overdistribution of Capital Paid Internet
UltraSector ProFund $ 27,272,748 $ 12,588,418 $ — $ 39,861,166 $ 177,930 $ 28,278 $ — $ — $ 206,208
Large-Cap Growth ProFund 751,401 650,090 — 1,401,491 341,415 492,743 — — 834,158
Mid-Cap Growth ProFund 320,965 602,809 — 923,774 — — — — —
Mid-Cap ProFund — — — — — 358,894 — — 358,894
Mid-Cap Value ProFund 10,633 — — 10,633 17,715 — — 3,366 21,081
Nasdaq-100 ProFund 1,491,584 348,686 — 1,840,270 498,352 387,756 — — 886,108
Oil & Gas UltraSector ProFund 227,674 — — 227,674 153,992 — — — 153,992
Oil Equipment & Services UltraSector ProFund 17,573 — — 17,573 — — — — —
Pharmaceuticals UltraSector ProFund — 16,620 — 16,620 — — — — —
Real Estate UltraSector ProFund — — — — 101,880 80,388 — 184,976 367,244
Rising Rates Opportunity ProFund — — — — 188,442 — — — 188,442
Rising Rates Opportunity 10 ProFund — — — — 17,678 — — — 17,678
Rising U.S. Dollar ProFund — — — — 23,144 — — — 23,144
Semiconductor UltraSector ProFund — — — — 88,463 — — — 88,463
Short Nasdaq-100 ProFund — — — — 11,298 — — — 11,298
Short Oil & Gas ProFund — — — — 4,714 — — — 4,714
Short Precious Metals ProFund — — — — 18,058 — — — 18,058
Short Small-Cap ProFund — — — — 7,330 — — — 7,330
Small-Cap Value ProFund — — — — — — 3,975 — 3,975
Technology UltraSector ProFund 1,627,121 8,142 — 1,635,263 — — — — —
TelecommunicationsUltraSector ProFund 4,660 — — 4,660 20,443 — — — 20,443
UltraChina ProFund — — — — 18,540 — — — 18,540
UltraDow 30 ProFund 55,323 580,971 — 636,294 660,094 — — — 660,094
310 :: Notes to Financial Statements :: January 31, 2022 (unaudited)
Toppan Merrill - ProFunds Public Semi-Annual Report [Funds] 01-31-2022 ED [AUX] | akiesli | 29-Mar-22 08:44 | 22-1296-2.ga | Sequence: 36CHKSUM Content: 59100 Layout: 16771 Graphics: 0 CLEAN
JOB: 22-1296-2 CYCLE#;BL#: 8; 0 TRIM: 8.25" x 10.75" AS: New York: 212-620-5600COLORS: ~note-color 2, Black, ~note-color 3 GRAPHICS: none V1.5
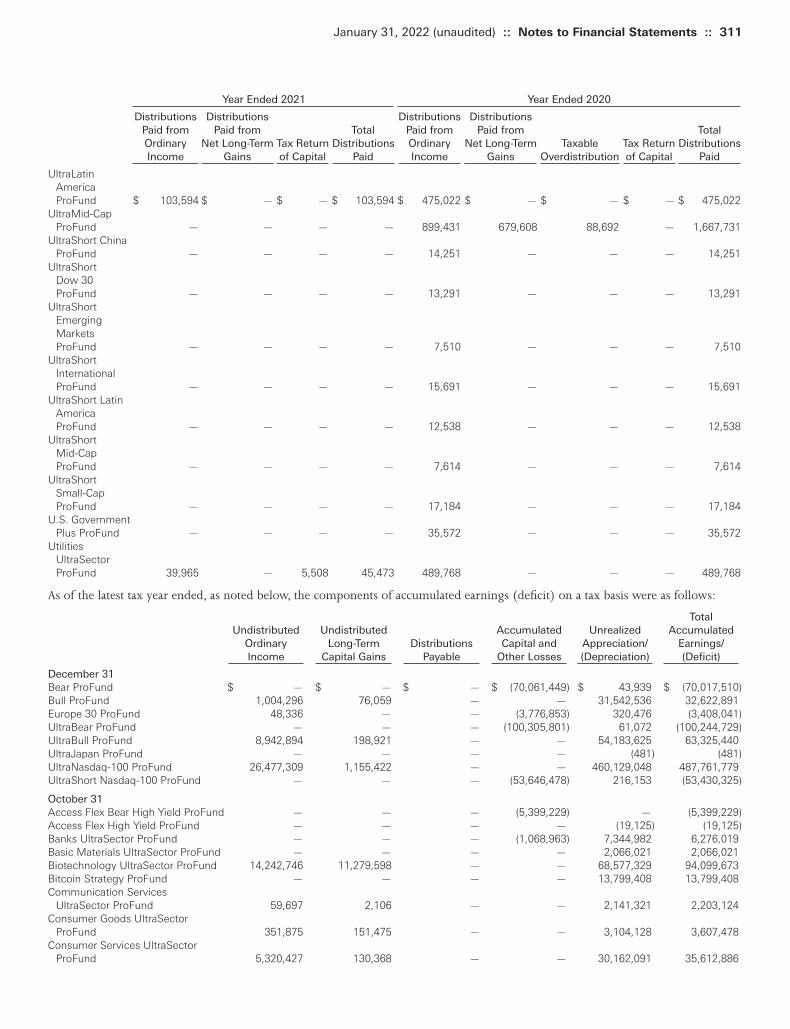
Year Ended 2021 Year Ended 2020
Distributions Distributions Distributions Distributions Paid from Paid from Total Paid from Paid from Total Ordinary Net Long-Term Tax Return Distributions Ordinary Net Long-Term Taxable Tax Return Distributions Income Gains of Capital Paid Income Gains Overdistribution of Capital Paid UltraLatin
America ProFund $ 103,594 $ — $ — $ 103,594 $ 475,022 $ — $ — $ — $ 475,022
UltraMid-Cap ProFund — — — — 899,431 679,608 88,692 — 1,667,731
UltraShort China ProFund — — — — 14,251 — — — 14,251
UltraShort Dow 30 ProFund — — — — 13,291 — — — 13,291
UltraShort Emerging Markets ProFund — — — — 7,510 — — — 7,510
UltraShort International ProFund — — — — 15,691 — — — 15,691
UltraShort Latin America ProFund — — — — 12,538 — — — 12,538
UltraShort Mid-Cap ProFund — — — — 7,614 — — — 7,614
UltraShort Small-Cap ProFund — — — — 17,184 — — — 17,184
U.S. Government Plus ProFund — — — — 35,572 — — — 35,572
Utilities UltraSector ProFund 39,965 — 5,508 45,473 489,768 — — — 489,768
As of the latest tax year ended, as noted below, the components of accumulated earnings (deficit) on a tax basis were as follows:
Total Undistributed Undistributed Accumulated Unrealized Accumulated
Ordinary Long-Term Distributions Capital and Appreciation/ Earnings/Income Capital Gains Payable Other Losses (Depreciation) (Deficit)
December 31Bear ProFund $ — $ — $ — $ (70,061,449) $ 43,939 $ (70,017,510)Bull ProFund 1,004,296 76,059 — — 31,542,536 32,622,891Europe 30 ProFund 48,336 — — (3,776,853) 320,476 (3,408,041)UltraBear ProFund — — — (100,305,801) 61,072 (100,244,729)UltraBull ProFund 8,942,894 198,921 — — 54,183,625 63,325,440UltraJapan ProFund — — — — (481) (481)UltraNasdaq-100 ProFund 26,477,309 1,155,422 — — 460,129,048 487,761,779UltraShort Nasdaq-100 ProFund — — — (53,646,478) 216,153 (53,430,325)
October 31Access Flex Bear High Yield ProFund — — — (5,399,229) — (5,399,229)Access Flex High Yield ProFund — — — — (19,125) (19,125)Banks UltraSector ProFund — — — (1,068,963) 7,344,982 6,276,019Basic Materials UltraSector ProFund — — — — 2,066,021 2,066,021Biotechnology UltraSector ProFund 14,242,746 11,279,598 — — 68,577,329 94,099,673Bitcoin Strategy ProFund — — — — 13,799,408 13,799,408Communication Services
UltraSector ProFund 59,697 2,106 — — 2,141,321 2,203,124Consumer Goods UltraSector
ProFund 351,875 151,475 — — 3,104,128 3,607,478Consumer Services UltraSector
ProFund 5,320,427 130,368 — — 30,162,091 35,612,886
January 31, 2022 (unaudited) :: Notes to Financial Statements :: 311
Toppan Merrill - ProFunds Public Semi-Annual Report [Funds] 01-31-2022 ED [AUX] | akiesli | 29-Mar-22 08:44 | 22-1296-2.ga | Sequence: 37CHKSUM Content: 16706 Layout: 30815 Graphics: 0 CLEAN
JOB: 22-1296-2 CYCLE#;BL#: 8; 0 TRIM: 8.25" x 10.75" AS: New York: 212-620-5600COLORS: ~note-color 2, Black, ~note-color 3 GRAPHICS: none V1.5

Total Undistributed Undistributed Accumulated Unrealized Accumulated
Ordinary Long-Term Distributions Capital and Appreciation/ Earnings/Income Capital Gains Payable Other Losses (Depreciation) (Deficit)
Falling U.S. Dollar ProFund $ — $ — $ — $ (2,636,026) $ — $ (2,636,026)Financials UltraSector ProFund 877,097 2,084 — — 2,458,308 3,337,489Health Care UltraSector ProFund — — — (782,184) 10,602,602 9,820,418Industrials UltraSector ProFund 436,119 3,184 — — 3,267,862 3,707,165Internet UltraSector ProFund 20,936,693 9,806,780 — — 96,845,438 127,588,911Large-Cap Growth ProFund 221,666 85,029 — — 13,211,555 13,518,250Large-Cap Value ProFund 54,514 — — (2,242,014) 1,714,343 (473,157)Mid-Cap Growth ProFund 831,229 119,485 — — 1,826,561 2,777,275Mid-Cap ProFund 158,547 58,875 — — 1,927,537 2,144,959Mid-Cap Value ProFund 50,173 — — — 1,552,088 1,602,261Nasdaq-100 ProFund 2,281,193 2,060,020 — — 49,379,453 53,720,666Oil & Gas UltraSector ProFund 277,761 — — (7,032,306) 6,592,939 (161,606)Oil Equipment & Services
UltraSector ProFund — — — (19,076,521) (1,917,463) (20,993,984)Pharmaceuticals UltraSector ProFund 57,588 128,692 — — 141,333 327,613Precious Metals UltraSector ProFund — — — (59,386,455) 4,052,844 (55,333,611)Real Estate UltraSector ProFund 3,068,498 122,820 — — 5,447,622 8,638,940Rising Rates Opportunity ProFund — — — (50,870,009) (431,237) (51,301,246)Rising Rates Opportunity 10 ProFund — — — (4,101,645) (3,417) (4,105,062)Rising U.S. Dollar ProFund — — — (628,138) — (628,138)Semiconductor UltraSector ProFund 5,976,285 178,486 — — 50,251,014 56,405,785Short Nasdaq-100 ProFund — — — (13,081,201) (23,729) (13,104,930)Short Oil & Gas ProFund — — — (1,681,508) 53,753 (1,627,755)Short Precious Metals ProFund — — — (10,363,077) 229,798 (10,133,279)Short Real Estate ProFund — — — (4,790,072) 2,525 (4,787,547)Short Small-Cap ProFund — — — (15,089,232) (38,775) (15,128,007)Small-Cap Growth ProFund 228,742 328,498 — — 3,164,299 3,721,539Small-Cap ProFund — — — — 1,232,658 1,232,658Small-Cap Value ProFund 168,315 41,014 — — 3,216,105 3,425,434Technology UltraSector ProFund 6,724,711 558,470 — — 48,970,689 56,253,870Telecommunications UltraSector
ProFund 6,192 — — (5,584,373) 124,414 (5,453,767)UltraChina ProFund — — — (17,867,907) (1,894,008) (19,761,915)UltraDow 30 ProFund 2,441,092 102,530 — — 14,206,230 16,749,852UltraEmerging Markets ProFund — — — (4,476,455) 1,907,924 (2,568,531)UltraInternational ProFund — — — (55,331) 18,897 (36,434)UltraLatin America ProFund 499,204 — — (30,225,418) (2,202,861) (31,929,075)UltraMid-Cap ProFund 2,306,933 422,277 — — 14,962,965 17,692,175UltraShort China ProFund — — — (6,512,890) 110,560 (6,402,330)UltraShort Dow 30 ProFund — — — (24,011,916) (50,535) (24,062,451)UltraShort Emerging Markets ProFund — — — (12,533,184) 41,489 (12,491,695)UltraShort International ProFund — — — (16,990,800) (6,975) (16,997,775)UltraShort Japan ProFund — — — (10,528,863) (2,418) (10,531,281)UltraShort Latin America ProFund — — — (15,834,062) 77,321 (15,756,741)UltraShort Mid-Cap ProFund — — — (10,998,003) (47,853) (11,045,856)UltraShort Small-Cap ProFund — — — (55,144,425) (170,047) (55,314,472)UltraSmall-Cap ProFund — — — — 15,237,595 15,237,595U.S. Government Plus ProFund — — — (1,968,090) 735,651 (1,232,439)Utilities UltraSector ProFund — — — (6,976,669) 3,507,493 (3,469,176)
Under current tax law, capital and specific ordinary losses realized after October 31 may be deferred and treated as occurring on thefirst business day of the following tax fiscal year. As of the end of their respective tax years ended October 31, 2021 and December 31,2021, the following ProFunds had deferred losses, which will be treated as arising on the first day of the tax fiscal years ending inOctober 31, 2021 and December 31, 2021:
Qualified Late Year Ordinary
Losses
October 31tax year end ProFunds
Access Flex Bear High Yield ProFund $ 23,714Falling U.S. Dollar ProFund 39,077Health Care UltraSector ProFund 243,046
312 :: Notes to Financial Statements :: January 31, 2022 (unaudited)
Toppan Merrill - ProFunds Public Semi-Annual Report [Funds] 01-31-2022 ED [AUX] | akiesli | 29-Mar-22 08:44 | 22-1296-2.ga | Sequence: 38CHKSUM Content: 26527 Layout: 53439 Graphics: 0 CLEAN
JOB: 22-1296-2 CYCLE#;BL#: 8; 0 TRIM: 8.25" x 10.75" AS: New York: 212-620-5600COLORS: ~note-color 2, Black, ~note-color 3 GRAPHICS: none V1.5

Qualified Late Year Ordinary
Losses
Oil Equipment & Services UltraSector ProFund $ 72,097Rising Rates Opportunity ProFund 328,526Rising Rates Opportunity 10 ProFund 36,701Rising U.S. Dollar ProFund 97,156Short Nasdaq-100 ProFund 76,073Short Oil & Gas ProFund 15,427Short Precious Metals ProFund 38,083Short Real Estate ProFund 9,541UltraEmerging Markets ProFund 40,166UltraInternational ProFund 55,331UltraShort China ProFund 24,471UltraShort Dow 30 ProFund 49,821UltraShort Emerging Markets ProFund 10,640UltraShort Japan ProFund 4,780UltraShort Latin America ProFund 20,920UltraShort Mid-Cap ProFund 20,904UltraShort Small-Cap ProFund 81,953U.S. Government Plus ProFund 182,455
As of the end of their respective tax years ended October 31, 2021 and December 31, 2021, the following ProFunds have capital losscarry forwards (“CLCFs”) as summarized in the table below. CLCFs subject to expiration are applied as short-term capital loss regardlessof whether the originating capital loss was short-term or long-term. CLCFs that are not subject to expiration must be utilized beforethose that are subject to expiration.
No Expiration Fund Date
Access Flex Bear High Yield ProFund $ 5,375,515Banks UltraSector ProFund 1,068,963Bear ProFund 70,061,449Europe 30 ProFund 3,776,853Falling U.S. Dollar ProFund 2,596,949Health Care UltraSector ProFund 539,138Large-Cap Value ProFund 2,242,014Oil & Gas UltraSector ProFund 7,032,306Oil Equipment & Services UltraSector ProFund 19,004,424Precious Metals UltraSector ProFund 59,386,455Rising Rates Opportunity ProFund 50,541,483Rising Rates Opportunity 10 ProFund 4,064,944Rising U.S. Dollar ProFund 530,982Short Nasdaq-100 ProFund 13,005,128Short Oil & Gas ProFund 1,666,081Short Precious Metals ProFund 10,324,994Short Real Estate ProFund 4,780,531Short Small-Cap ProFund 15,089,232Telecommunications UltraSector ProFund 5,584,373UltraBear ProFund 100,305,801UltraChina ProFund 17,867,907UltraEmerging Markets ProFund 4,436,289UltraLatin America ProFund 30,225,418UltraShort China ProFund 6,488,419UltraShort Dow 30 ProFund 23,962,095UltraShort Emerging Markets ProFund 12,522,544UltraShort International ProFund 16,990,800UltraShort Japan ProFund 10,524,083UltraShort Latin America ProFund 15,813,142UltraShort Mid-Cap ProFund 10,977,099UltraShort Nasdaq-100 ProFund 53,646,478UltraShort Small-Cap ProFund 55,062,472U.S. Government Plus ProFund 1,785,635Utilities UltraSector ProFund 6,976,669
January 31, 2022 (unaudited) :: Notes to Financial Statements :: 313
Toppan Merrill - ProFunds Public Semi-Annual Report [Funds] 01-31-2022 ED [AUX] | akiesli | 29-Mar-22 08:44 | 22-1296-2.ga | Sequence: 39CHKSUM Content: 11590 Layout: 28328 Graphics: 0 CLEAN
JOB: 22-1296-2 CYCLE#;BL#: 8; 0 TRIM: 8.25" x 10.75" AS: New York: 212-620-5600COLORS: ~note-color 2, Black, ~note-color 3 GRAPHICS: none V1.5
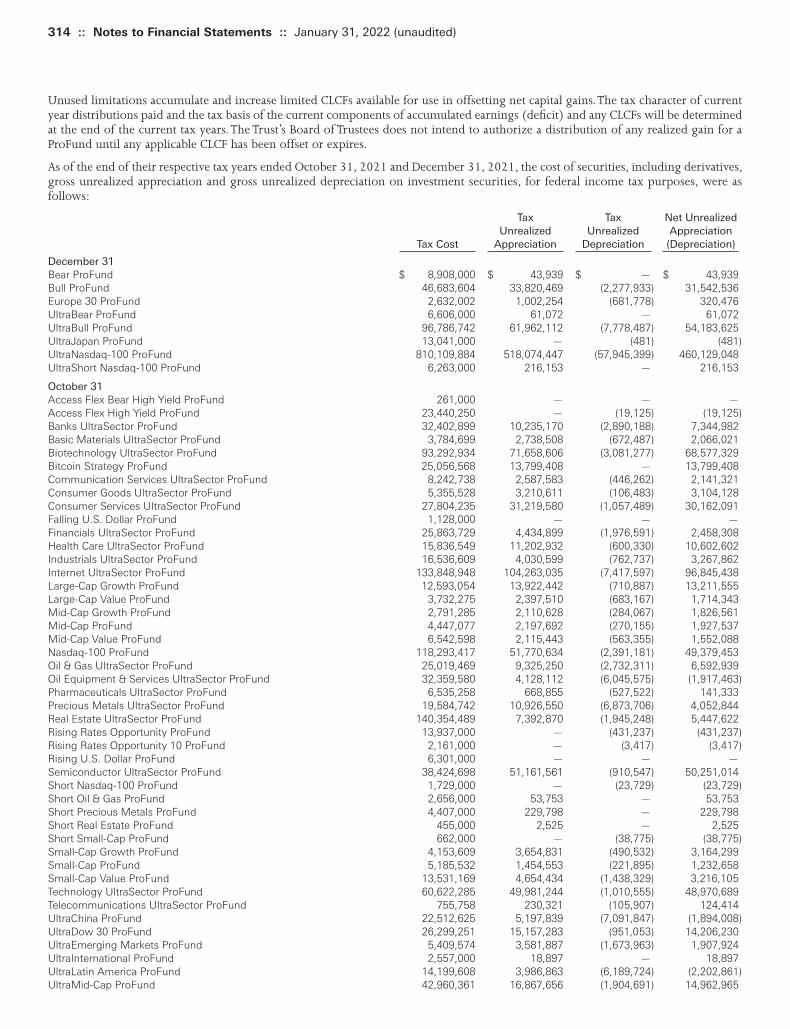
Unused limitations accumulate and increase limited CLCFs available for use in offsetting net capital gains. The tax character of currentyear distributions paid and the tax basis of the current components of accumulated earnings (deficit) and any CLCFs will be determinedat the end of the current tax years. The Trust’s Board of Trustees does not intend to authorize a distribution of any realized gain for aProFund until any applicable CLCF has been offset or expires.
As of the end of their respective tax years ended October 31, 2021 and December 31, 2021, the cost of securities, including derivatives,gross unrealized appreciation and gross unrealized depreciation on investment securities, for federal income tax purposes, were asfollows:
Tax Tax Net UnrealizedUnrealized Unrealized Appreciation
Tax Cost Appreciation Depreciation (Depreciation)
December 31Bear ProFund $ 8,908,000 $ 43,939 $ — $ 43,939Bull ProFund 46,683,604 33,820,469 (2,277,933) 31,542,536Europe 30 ProFund 2,632,002 1,002,254 (681,778) 320,476UltraBear ProFund 6,606,000 61,072 — 61,072UltraBull ProFund 96,786,742 61,962,112 (7,778,487) 54,183,625UltraJapan ProFund 13,041,000 — (481) (481)UltraNasdaq-100 ProFund 810,109,884 518,074,447 (57,945,399) 460,129,048UltraShort Nasdaq-100 ProFund 6,263,000 216,153 — 216,153
October 31Access Flex Bear High Yield ProFund 261,000 — — —Access Flex High Yield ProFund 23,440,250 — (19,125) (19,125)Banks UltraSector ProFund 32,402,899 10,235,170 (2,890,188) 7,344,982Basic Materials UltraSector ProFund 3,784,699 2,738,508 (672,487) 2,066,021Biotechnology UltraSector ProFund 93,292,934 71,658,606 (3,081,277) 68,577,329Bitcoin Strategy ProFund 25,056,568 13,799,408 — 13,799,408Communication Services UltraSector ProFund 8,242,738 2,587,583 (446,262) 2,141,321Consumer Goods UltraSector ProFund 5,355,528 3,210,611 (106,483) 3,104,128Consumer Services UltraSector ProFund 27,804,235 31,219,580 (1,057,489) 30,162,091Falling U.S. Dollar ProFund 1,128,000 — — —Financials UltraSector ProFund 25,863,729 4,434,899 (1,976,591) 2,458,308Health Care UltraSector ProFund 15,836,549 11,202,932 (600,330) 10,602,602Industrials UltraSector ProFund 16,536,609 4,030,599 (762,737) 3,267,862Internet UltraSector ProFund 133,848,948 104,263,035 (7,417,597) 96,845,438Large-Cap Growth ProFund 12,593,054 13,922,442 (710,887) 13,211,555Large-Cap Value ProFund 3,732,275 2,397,510 (683,167) 1,714,343Mid-Cap Growth ProFund 2,791,285 2,110,628 (284,067) 1,826,561Mid-Cap ProFund 4,447,077 2,197,692 (270,155) 1,927,537Mid-Cap Value ProFund 6,542,598 2,115,443 (563,355) 1,552,088Nasdaq-100 ProFund 118,293,417 51,770,634 (2,391,181) 49,379,453Oil & Gas UltraSector ProFund 25,019,469 9,325,250 (2,732,311) 6,592,939Oil Equipment & Services UltraSector ProFund 32,359,580 4,128,112 (6,045,575) (1,917,463)Pharmaceuticals UltraSector ProFund 6,535,258 668,855 (527,522) 141,333Precious Metals UltraSector ProFund 19,584,742 10,926,550 (6,873,706) 4,052,844Real Estate UltraSector ProFund 140,354,489 7,392,870 (1,945,248) 5,447,622Rising Rates Opportunity ProFund 13,937,000 — (431,237) (431,237)Rising Rates Opportunity 10 ProFund 2,161,000 — (3,417) (3,417)Rising U.S. Dollar ProFund 6,301,000 — — —Semiconductor UltraSector ProFund 38,424,698 51,161,561 (910,547) 50,251,014Short Nasdaq-100 ProFund 1,729,000 — (23,729) (23,729)Short Oil & Gas ProFund 2,656,000 53,753 — 53,753Short Precious Metals ProFund 4,407,000 229,798 — 229,798Short Real Estate ProFund 455,000 2,525 — 2,525Short Small-Cap ProFund 662,000 — (38,775) (38,775)Small-Cap Growth ProFund 4,153,609 3,654,831 (490,532) 3,164,299Small-Cap ProFund 5,185,532 1,454,553 (221,895) 1,232,658Small-Cap Value ProFund 13,531,169 4,654,434 (1,438,329) 3,216,105Technology UltraSector ProFund 60,622,285 49,981,244 (1,010,555) 48,970,689Telecommunications UltraSector ProFund 755,758 230,321 (105,907) 124,414UltraChina ProFund 22,512,625 5,197,839 (7,091,847) (1,894,008)UltraDow 30 ProFund 26,299,251 15,157,283 (951,053) 14,206,230UltraEmerging Markets ProFund 5,409,574 3,581,887 (1,673,963) 1,907,924UltraInternational ProFund 2,557,000 18,897 — 18,897UltraLatin America ProFund 14,199,608 3,986,863 (6,189,724) (2,202,861)UltraMid-Cap ProFund 42,960,361 16,867,656 (1,904,691) 14,962,965
314 :: Notes to Financial Statements :: January 31, 2022 (unaudited)
Toppan Merrill - ProFunds Public Semi-Annual Report [Funds] 01-31-2022 ED [AUX] | akiesli | 29-Mar-22 08:44 | 22-1296-2.ga | Sequence: 40CHKSUM Content: 24436 Layout: 12235 Graphics: 0 CLEAN
JOB: 22-1296-2 CYCLE#;BL#: 8; 0 TRIM: 8.25" x 10.75" AS: New York: 212-620-5600COLORS: ~note-color 2, Black, ~note-color 3 GRAPHICS: none V1.5
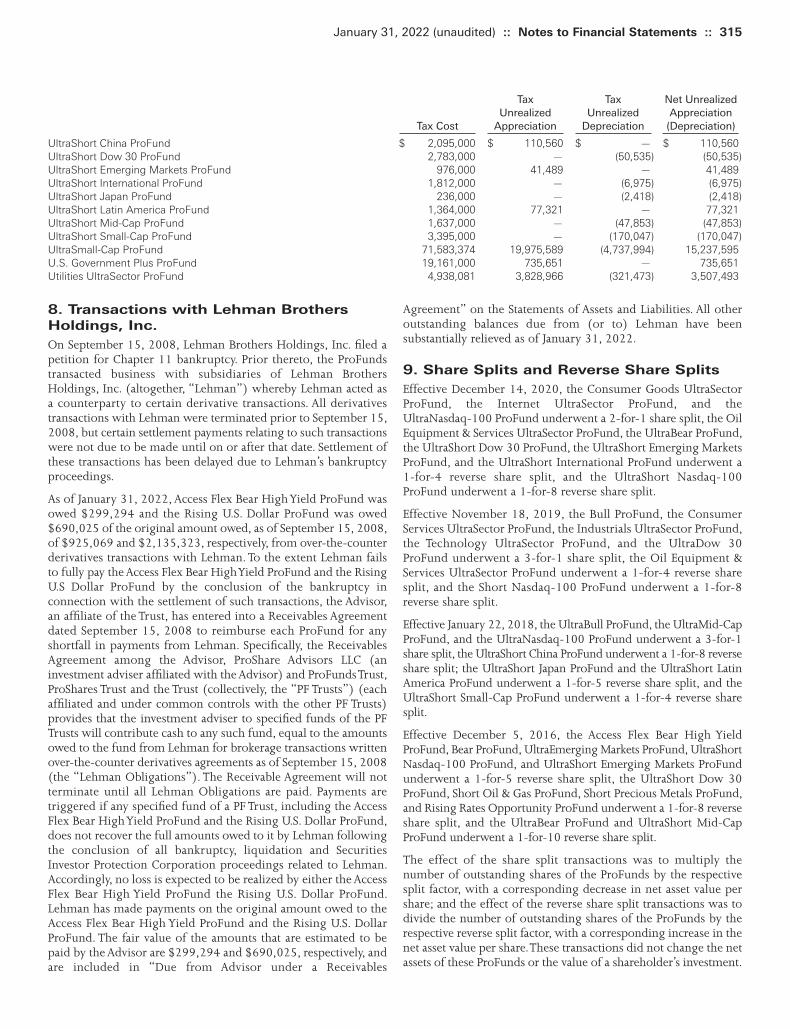
Tax Tax Net UnrealizedUnrealized Unrealized Appreciation
Tax Cost Appreciation Depreciation (Depreciation)
UltraShort China ProFund $ 2,095,000 $ 110,560 $ — $ 110,560UltraShort Dow 30 ProFund 2,783,000 — (50,535) (50,535)UltraShort Emerging Markets ProFund 976,000 41,489 — 41,489UltraShort International ProFund 1,812,000 — (6,975) (6,975)UltraShort Japan ProFund 236,000 — (2,418) (2,418)UltraShort Latin America ProFund 1,364,000 77,321 — 77,321UltraShort Mid-Cap ProFund 1,637,000 — (47,853) (47,853)UltraShort Small-Cap ProFund 3,395,000 — (170,047) (170,047)UltraSmall-Cap ProFund 71,583,374 19,975,589 (4,737,994) 15,237,595U.S. Government Plus ProFund 19,161,000 735,651 — 735,651Utilities UltraSector ProFund 4,938,081 3,828,966 (321,473) 3,507,493
January 31, 2022 (unaudited) :: Notes to Financial Statements :: 315
8. Transactions with Lehman Brothers
Holdings, Inc.
On September 15, 2008, Lehman Brothers Holdings, Inc. filed apetition for Chapter 11 bankruptcy. Prior thereto, the ProFundstransacted business with subsidiaries of Lehman BrothersHoldings, Inc. (altogether, “Lehman”) whereby Lehman acted asa counterparty to certain derivative transactions. All derivativestransactions with Lehman were terminated prior to September 15,2008, but certain settlement payments relating to such transactionswere not due to be made until on or after that date. Settlement ofthese transactions has been delayed due to Lehman’s bankruptcyproceedings.
As of January 31, 2022, Access Flex Bear High Yield ProFund wasowed $299,294 and the Rising U.S. Dollar ProFund was owed$690,025 of the original amount owed, as of September 15, 2008,of $925,069 and $2,135,323, respectively, from over-the-counterderivatives transactions with Lehman. To the extent Lehman failsto fully pay the Access Flex Bear High Yield ProFund and the RisingU.S Dollar ProFund by the conclusion of the bankruptcy inconnection with the settlement of such transactions, the Advisor,an affiliate of the Trust, has entered into a Receivables Agreementdated September 15, 2008 to reimburse each ProFund for anyshortfall in payments from Lehman. Specifically, the ReceivablesAgreement among the Advisor, ProShare Advisors LLC (aninvestment adviser affiliated with the Advisor) and ProFunds Trust,ProShares Trust and the Trust (collectively, the “PF Trusts”) (eachaffiliated and under common controls with the other PF Trusts)provides that the investment adviser to specified funds of the PFTrusts will contribute cash to any such fund, equal to the amountsowed to the fund from Lehman for brokerage transactions writtenover-the-counter derivatives agreements as of September 15, 2008(the “Lehman Obligations”). The Receivable Agreement will notterminate until all Lehman Obligations are paid. Payments aretriggered if any specified fund of a PF Trust, including the AccessFlex Bear High Yield ProFund and the Rising U.S. Dollar ProFund,does not recover the full amounts owed to it by Lehman followingthe conclusion of all bankruptcy, liquidation and SecuritiesInvestor Protection Corporation proceedings related to Lehman.Accordingly, no loss is expected to be realized by either the AccessFlex Bear High Yield ProFund the Rising U.S. Dollar ProFund.Lehman has made payments on the original amount owed to theAccess Flex Bear High Yield ProFund and the Rising U.S. DollarProFund. The fair value of the amounts that are estimated to bepaid by the Advisor are $299,294 and $690,025, respectively, andare included in “Due from Advisor under a Receivables
Agreement” on the Statements of Assets and Liabilities. All otheroutstanding balances due from (or to) Lehman have beensubstantially relieved as of January 31, 2022.
9. Share Splits and Reverse Share Splits
Effective December 14, 2020, the Consumer Goods UltraSectorProFund, the Internet UltraSector ProFund, and theUltraNasdaq-100 ProFund underwent a 2-for-1 share split, the OilEquipment & Services UltraSector ProFund, the UltraBear ProFund,the UltraShort Dow 30 ProFund, the UltraShort Emerging MarketsProFund, and the UltraShort International ProFund underwent a1-for-4 reverse share split, and the UltraShort Nasdaq-100ProFund underwent a 1-for-8 reverse share split.
Effective November 18, 2019, the Bull ProFund, the ConsumerServices UltraSector ProFund, the Industrials UltraSector ProFund,the Technology UltraSector ProFund, and the UltraDow 30ProFund underwent a 3-for-1 share split, the Oil Equipment &Services UltraSector ProFund underwent a 1-for-4 reverse sharesplit, and the Short Nasdaq-100 ProFund underwent a 1-for-8reverse share split.
Effective January 22, 2018, the UltraBull ProFund, the UltraMid-CapProFund, and the UltraNasdaq-100 ProFund underwent a 3-for-1share split, the UltraShort China ProFund underwent a 1-for-8 reverseshare split; the UltraShort Japan ProFund and the UltraShort LatinAmerica ProFund underwent a 1-for-5 reverse share split, and theUltraShort Small-Cap ProFund underwent a 1-for-4 reverse sharesplit.
Effective December 5, 2016, the Access Flex Bear High YieldProFund, Bear ProFund, UltraEmerging Markets ProFund, UltraShortNasdaq-100 ProFund, and UltraShort Emerging Markets ProFundunderwent a 1-for-5 reverse share split, the UltraShort Dow 30ProFund, Short Oil & Gas ProFund, Short Precious Metals ProFund,and Rising Rates Opportunity ProFund underwent a 1-for-8 reverseshare split, and the UltraBear ProFund and UltraShort Mid-CapProFund underwent a 1-for-10 reverse share split.
The effect of the share split transactions was to multiply thenumber of outstanding shares of the ProFunds by the respectivesplit factor, with a corresponding decrease in net asset value pershare; and the effect of the reverse share split transactions was todivide the number of outstanding shares of the ProFunds by therespective reverse split factor, with a corresponding increase in thenet asset value per share. These transactions did not change the netassets of these ProFunds or the value of a shareholder’s investment.
Toppan Merrill - ProFunds Public Semi-Annual Report [Funds] 01-31-2022 ED [AUX] | akiesli | 29-Mar-22 08:44 | 22-1296-2.ga | Sequence: 41CHKSUM Content: 4269 Layout: 31192 Graphics: 0 CLEAN
JOB: 22-1296-2 CYCLE#;BL#: 8; 0 TRIM: 8.25" x 10.75" AS: New York: 212-620-5600COLORS: ~note-color 2, Black, ~note-color 3 GRAPHICS: none V1.5

The historical share transactions presented in the Statements ofChanges in Net Assets and per share data presented in the FinancialHighlights have been adjusted retroactively to give effect to theshare splits and reverse share splits. Additionally, when theapplication of reverse share splits resulted in fractional shares forbeneficial shareholders, a portion of the cost of shares redeemedas presented in the Statements of Changes in Net Assets, reflectspayment of fractional share balances on beneficial shareholderaccounts.
10. Subsequent Events
The ProFunds have evaluated the need for additional disclosuresor adjustments resulting from subsequent events through the datethese financial statements were issued. Based on this evaluation,there were no subsequent events to report that would have amaterial impact on the ProFunds’ financial statements.
316 :: Notes to Financial Statements :: January 31, 2022 (unaudited)
Toppan Merrill - ProFunds Public Semi-Annual Report [Funds] 01-31-2022 ED [AUX] | akiesli | 29-Mar-22 08:44 | 22-1296-2.ga | Sequence: 42CHKSUM Content: 21433 Layout: 23859 Graphics: 0 CLEAN
JOB: 22-1296-2 CYCLE#;BL#: 8; 0 TRIM: 8.25" x 10.75" AS: New York: 212-620-5600COLORS: ~note-color 2, Black, ~note-color 3 GRAPHICS: none V1.5
At a meeting held on September 13-14, 2021, the Board ofTrustees (the “Board”) of ProFunds (the “Trust”) considered therenewal of the Investment Advisory Agreement between ProFundAdvisors LLC (the “Advisor”) and the Trust, on behalf of each ofits operational series (each a “Fund” and collectively the “Funds”)(the “Advisory Agreement”). Certain Funds are designed to match,before fees and expenses, the performance of an underlying indexboth on a single day and over time (each a “Matching Fund” and,collectively, the “Matching Funds”). Certain other Funds areactively managed and are designed to meet a specified investmentobjective (each an “Active Fund” and, collectively, the “ActiveFunds”). Certain other Funds are “geared” funds that are designedto seek daily investment results, before fees and expenses, thatcorrespond to the inverse (-1x), a multiple (i.e., 1.25x, 1.50x or2x), or an inverse multiple (i.e., -1.25x or -2x) of the dailyperformance of an index or security (each a “Geared Fund” and,collectively, the “Geared Funds”).
The Board did not identify any particular information that wasmost relevant to its consideration to approve the continuation ofthe Advisory Agreement and each Trustee may have affordeddifferent weight to the various factors.
The Board received a memorandum from independent legalcounsel to the Independent Trustees regarding the Board’sresponsibilities under state and federal law with respect to theBoard’s consideration of the renewal or approval of investmentadvisory agreements. The Independent Trustees were advised bytheir independent legal counsel throughout the process, includingabout the legal standards applicable to their review.
In response to a request from the Independent Trustees, the Advisorprovided information for the Board to consider relating to thecontinuation of the Advisory Agreement, including informationthat addressed, among other things:
(i) the nature, extent and quality of the services that wereprovided or proposed to be provided by the Advisor;
(ii) the costs of the services to be provided and the profitsrealized by the Advisor;
(iii) the investment performance of the Funds and the Advisor;(iv) the extent to which economies of scale might be realized
as the Funds grow and whether fee levels reflecteconomies of scale, if any, for the benefit of Fundshareholders; and
(v) other benefits to the Advisor and/or its affiliates from therelationship to the Funds.
It was noted that the Independent Trustees requested, and received,information from the Advisor concerning the Funds. In responseto the request from the Independent Trustees, the Advisor providedinformation and reports relevant to the continuation of theAdvisory Agreement, including, among other things:
(i) information about the advisory services that were beingprovided by the Advisor with respect to the Funds;
(ii) the Advisor’s Form ADV;(iii) biographies of the employees of the Advisor who are
primarily responsible for providing investment advisoryservices to the Funds;
(iv) information regarding each component of the contractualfee rates and actual fee rates for the prior fiscal year;
(v) information regarding advisory fees earned versusadvisory fees waived for previous periods;
(vi) performance information for prior periods;(vii) comparative industry fee data;(viii) information about fees and other amounts that were
received by the Advisor and its affiliates for non-advisoryservices with respect to the Funds;
(ix) information regarding the Advisor’s trade allocation andbest execution policies and procedures;
(x) information about the financial condition of the Advisor;(xi) information regarding how the Advisor monitors each
Fund’s compliance with regulatory requirements and Trustprocedures; and
(xii) the Advisor’s reputation, expertise and resources.
The Trustees retained the services of an independent consultant toassist in selecting a universe of peer group funds (the “PeerGroup”) with similar investment strategies, as well as to help themin evaluating information with respect to certain aspects of theirreview, including the reasonableness of fees paid by the Funds. TheBoard evaluated all information available to it on a Fund-by-Fundbasis, and their determinations were made separately with respectto each Fund.
In addition to the information provided and discussions thatoccurred at the meeting at which the Board took action regardingthe renewal of the Advisory Agreement, the Board also consideredinformation they received throughout the year as part of theirregular oversight of the Funds.
Nature, Extent and Quality of the Advisor’s
Services
The Board reviewed the nature, extent and quality of theinvestment advisory services performed by the Advisor. The Boardnoted there would be no significant differences between the scopeof services provided by the Advisor in the past year and those tobe provided in the upcoming year. The Board focused on thequality of the personnel and operations at the Advisor and thesystems and processes required to manage the Funds effectively.In particular, the Board considered the following:
(i) the investment objective of each Fund, the Advisor’sdescription of the skills needed to manage each Fund andthe Advisor’s success in achieving the investmentobjectives of each Fund;
(ii) the unique features of the Funds, including the uniqueasset classes and investment strategies of certain Funds, aswell as the employment of optimization/samplingtechniques necessary to manage certain Funds;
(iii) with respect to the Geared Funds, the fact that to maintainexposure consistent with each Geared Fund’s dailyinvestment objective, each Geared Fund needs to berebalanced each day, an activity not typical of traditionalindex funds;
(iv) the differences in managing the non-geared Funds,including the unique asset classes and investmentstrategies for certain Funds, as well as the employment ofoptimization/sampling techniques necessary to managecertain Funds;
January 31, 2022 (unaudited) :: Board Approval of Investment Advisory Agreement :: 317
Toppan Merrill - ProFunds Public Semi-Annual Report [Funds] 01-31-2022 ED [AUX] | akiesli | 29-Mar-22 08:44 | 22-1296-2.ha | Sequence: 1CHKSUM Content: 34777 Layout: 11748 Graphics: 0 CLEAN
JOB: 22-1296-2 CYCLE#;BL#: 8; 0 TRIM: 8.25" x 10.75" AS: New York: 212-620-5600COLORS: ~note-color 2, Black, ~note-color 3 GRAPHICS: none V1.5
(v) the size and experience of the Advisor’s portfolio staff andthe Advisor’s ability to recruit, train and retain personnelwith relevant experience and the specific expertisenecessary to manage the Funds;
(vi) the structure of the portfolio staff compensation programand the incentives it is intended to provide;
(vii) the collateral, credit and cash management functions atthe Advisor and the enhancements made in these areas;
(viii) the Advisor’s development of investment strategies,including those involving the use of complex financialinstruments and processes that maximize the Funds’ability to meet their stated investment objectives andminimize counterparty risk;
(ix) a significant investment in personnel and state-of-the-arttechnology that the Advisor has made over the course ofseveral years and, recently, instituting certain technologicalupgrades that would generally improve capacity anddocument production capabilities as well as technologicalupgrades that have continued to contribute to successfulremote working conditions during the COVID-19pandemic; and
(x) information regarding allocation of Fund brokerage andthe selection of counterparties for Fund portfoliotransactions, as well as favorable terms of derivativestransactions the Advisor was able to negotiate with swapcounterparties on behalf of various Funds.
The Board considered that the Advisor oversees the operations ofthe Funds and provides compliance services to the Funds. TheBoard also reviewed the Advisor’s compliance program, includingspecific activities associated with the Funds. The Board discussedthe compliance program with the Funds’ Chief Compliance Officer(the “CCO”). The Board and the CCO discussed the CCO’sevaluation of the operation of the Advisor’s compliance program,and efforts with respect to the Funds, changes made to theAdvisor’s compliance program since the CCO’s last annual reportto the Board, and whether the CCO believed additionalenhancements to the compliance program were warranted. TheBoard discussed compliance issues reported to the Board duringthe prior year and the remediation of such issues. The Boarddiscussed key risk areas identified by the CCO and how such risksare addressed by the compliance program.
Based upon its review, the Board, including all of the IndependentTrustees, concluded with respect to each Fund that (i) theinvestment advisory services provided by the Advisor with respectto the Fund were of high quality, (ii) the Advisor achieved theinvestment goals of the Fund, (iii) the Advisor’s services benefitedthe Fund’s shareholders, particularly in light of the nature of theFund and the services required to support each such Fund, and(iv) they were generally satisfied with the nature, quality andextent of services provided to the Fund by the Advisor.
Comparison of Services and Fees
The Advisor presented information about the fairness andreasonableness of the investment advisory fees payable to theAdvisor in light of the investment advisory services provided, thecosts of these services and the comparability to the fees paid byother investment companies, including mutual funds offeringstrategies similar in nature and extent to the Funds. The Board
discussed the methodology used to prepare the comparative feedata for each Fund and the potential limitations of such data. TheBoard discussed the difficulty in compiling the comparative dataand Peer Group information because, by design, many of theFunds are unique and few, if any, fund complexes with fundsoffering substantially similar investment objectives and strategiesexist. The Board considered the Advisor’s representation that itfound the Peer Group compiled by the independent consultant tobe appropriate but acknowledged the existence of certaindifferences between the Funds and their peers. The Board notedthat the methodology used to compile the Peer Group andcomparative data was identical to that used in prior years.Notwithstanding the challenge associated with Peer Group anddata compilation, the Board found the comparative information itreceived to be useful in its evaluation of the reasonableness of theAdvisor’s fee. The Advisor presented information about thesignificant drivers of cost and also examined the costs to investorsto achieve the objectives of the Funds on their own and noted thatit would be more expensive or impractical to do so.
The Board reviewed information prepared by the independentconsultant, comparing management and expense information foreach Fund to that of its Peer Group. The Board reviewed Peer Groupinformation prepared by the consultant comparing the contractualadvisory fee rate to be paid by the Funds to other funds withinvestment objectives most similar to the Funds. The Board alsoconsidered the fee waiver and/or expense reimbursementarrangements currently in place for each Fund and considered thenet advisory fees paid by the Funds after taking waivers andreimbursements into account.
The Board considered and discussed the sub-advisory fees chargedand the services provided by the Advisor to the one mutual fundit serves as sub-adviser. The Board recognized that the scope ofservices provided by the Advisor to the mutual fund is narrowerthan the services provided to the Funds for several reasons,including that the Advisor performs only services delegated to itby the investment adviser to the mutual fund and does not provideother services like daily cash management, collateral managementand counterparty management. The Board noted that for thesereasons it is difficult to make comparisons of fees charged to thesub-advised mutual fund and the Funds.
The Board also recognized that it is difficult to make comparisonsof fees across fund complexes because there may be variations inservices that are included in the fees paid by other mutual funds.
The Board, including all of the Independent Trustees, concludedthat, with respect to the Funds, the investment advisory fees andany other compensation payable to the Advisor were reasonable inrelation to the nature and quality of the services provided and thatthe continuation of the Advisory Agreement was in the bestinterests of the shareholders of the Funds.
Investment Performance of the Funds and the
Advisor
The Board considered total return information for each Fund andfocused on the correlation of returns to benchmark informationfor each Geared Fund for the 3-month, 1-year, 5-year, 10-year andsince inception periods ended June 30, 2021, as applicable. TheBoard also considered performance information provided at
318 :: Board Approval of Investment Advisory Agreement :: January 31, 2022 (unaudited)
Toppan Merrill - ProFunds Public Semi-Annual Report [Funds] 01-31-2022 ED [AUX] | akiesli | 29-Mar-22 08:44 | 22-1296-2.ha | Sequence: 2CHKSUM Content: 18984 Layout: 23426 Graphics: 0 CLEAN
JOB: 22-1296-2 CYCLE#;BL#: 8; 0 TRIM: 8.25" x 10.75" AS: New York: 212-620-5600COLORS: ~note-color 2, Black, ~note-color 3 GRAPHICS: none V1.5
regular Board meetings throughout the year. The Board noted thatcorrelation of returns for each Geared Fund remained strongduring the applicable periods and that Geared Fund performanceversus target performance was generally within expected ranges.The Board further noted that Matching Fund performance versusbenchmark index performance was also generally within expectedranges during the applicable periods. The Board noted that, giventhe nature of the Funds that are Matching Funds or Geared Funds,the correlation of such Fund’s performance with the performanceof its underlying benchmark (or a relevant inverse or multiplethereof) was a more meaningful factor than the Fund’s total return.
In regard to the Active Funds, the Board considered that, for eachof the one-year, three-year, five-year and ten-year periods endedJune 30, 2021, the Access Flex Bear High Yield ProFundunderperformed its Peer Group and benchmark index. In regardto the Access Flex High Yield ProFund, the Board considered thatfor each of the one-year, three-year, five-year and ten-year periodsended June 30, 2021, the Fund underperformed its Peer Groupand benchmark index.
After reviewing the performance of the Funds, the Board,including the Independent Trustees, concluded, in light of theforegoing factors, that the performance of the Funds wassatisfactory.
Profitability
The Board considered and discussed with representatives of theAdvisor the significant drivers of cost incurred by or expected tobe incurred by the Advisor in managing the Funds, including, butnot limited to, intellectual capital, regulatory compliance, dailyportfolio rebalancing of the Geared Funds, and entrepreneurialrisk, and considered the costs that investors likely would incur ifthey independently sought to achieve the objectives of the Funds.The Board considered and discussed with representatives of theAdvisor the profitability to the Advisor of its management of eachof the Funds. The Board also discussed the Advisor’s profit margin,including the expense allocation methodology used in theAdvisor’s profitability analysis. It was noted that the methodologyfor determining profitability was conducted in a similar fashionas the prior year.
The Independent Trustees met in executive session to discuss andevaluate the information provided by the Advisor and theindependent consultant, as well as of the information provided bya separate independent consultant retained to review profitability.Among other things, the Independent Trustees reviewedinformation regarding the financial condition and profitability ofthe Advisor, including the methodologies involved in calculatingprofitability.
Based on its review, the Board, including all of the IndependentTrustees, concluded that the profitability to the Advisor of theAdvisory Agreement was reasonable in light of the services andbenefits provided to each Fund.
Economies of Scale
The Board discussed with representatives of the Advisor potentialeconomies of scale in connection with the management andoperation of each Fund as well as the effect of the contractualexpense limitations undertaken by the Advisor. The Boardconsidered that each Fund covered by the Advisory Agreement paysthe Advisor an annual investment advisory fee of 0.75% of averagedaily net assets (other than the ProFund Ultra Japan Fund and theProFund Ultra Short Japan Fund, each of which pay 0.90%, theProFund Nasdaq-100 which pays 0.70%, and the ProFund V.P. U.S.Government Plus, which pays 0.50%).
The Board considered that, subject to the condition that the aggregatedaily net assets of the Trust be equal to or greater than $10 billion,the Advisor has agreed to reduce each Fund’s annual investmentadvisory fee by 0.025% on assets in excess of $500 million up to$1 billion, 0.05% on assets in excess of $1 billion up to $2 billionand 0.075% on assets in excess of $2 billion. The Board consideredthat for the periods presented, none of the Funds were subject toadvisory fee reductions as a result of breakpoint fee reductions.
The Board indicated to the Advisor that it will continue to considerand evaluate on an ongoing basis potential economies of scale andhow Fund shareholders might benefit from those economies ofscale.
Other Benefits
The Board also considered the Advisor’s non-advisory services,including those performed under a separate Management ServicesAgreement. The Board considered the fact that the Geared Funds’shareholders, and the shareholders of certain Matching Funds,tend to be active traders, which adds a level of complexity to themanagement of those Funds as the Advisor needs to account forsignificant flows in and out of the Funds. The Board alsoconsidered any indirect, or “fall-out,” benefits that the Advisor orits affiliates derived from their relationship to the Funds butconcluded that such benefits were relatively insignificant.
The Board considered that ProFund Distributors, Inc., a wholly-owned subsidiary of the Advisor, earns fees from the Funds forproviding services under a Distribution and Shareholder ServicesPlan.
Conclusions
Based on, but not limited to, the above considerations anddeterminations, the Board, including all of the IndependentTrustees, determined that the Agreement for the Funds is fair andreasonable in light of the nature, extent and quality of the servicesto be performed, the fee rates to be paid, the Advisor’s expensesand such other matters as the Board considered relevant in theexercise of its business judgement. Accordingly, the Boardconcluded that the continuation of the Advisory Agreement wasin the best interests of the shareholders of the Funds. On this basis,the Board unanimously voted in favor of the renewal of theAdvisory Agreement.
January 31, 2022 (unaudited) :: Board Approval of Investment Advisory Agreement :: 319
Toppan Merrill - ProFunds Public Semi-Annual Report [Funds] 01-31-2022 ED [AUX] | akiesli | 29-Mar-22 08:44 | 22-1296-2.ha | Sequence: 3CHKSUM Content: 1056 Layout: 17582 Graphics: 0 CLEAN
JOB: 22-1296-2 CYCLE#;BL#: 8; 0 TRIM: 8.25" x 10.75" AS: New York: 212-620-5600COLORS: ~note-color 2, Black, ~note-color 3 GRAPHICS: none V1.5
ProFunds (the “Trust”) has implemented a liquidity riskmanagement program (“Liquidity Program”) to identify illiquidinvestments pursuant to Rule 22e-4 of the Investment CompanyAct of 1940, as amended. The Board of Trustees of the Trust (“theBoard”) has approved the designation of ProFund Advisors LLC(the “Program Administrator”) to administer the Trust’s LiquidityProgram, subject to the oversight of the Board.
On September 13-14, 2021, during a meeting of the Board, theChief Compliance Officer of the Trust provided to the Board theannual report on the Trust’s Liquidity Program (the “AnnualLiquidity Report”). The Annual Liquidity Report, which coveredthe period from July 1, 2020 through June 30, 2021, addressedthe operation of the Trust’s Liquidity Program and assessed the
adequacy and effectiveness of the Liquidity Program’simplementation. The Annual Liquidity Report affirmed that theProgram Administrator believes that: (1) the Liquidity Programcontinues to be reasonably designed to effectively assess andmanage each Fund’s liquidity risk; (2) each Fund’s liquidity riskcontinues to be appropriate in light of the Fund’s investmentobjective and strategies and each Fund’s investment strategiescontinue to be appropriate for an open-end managementinvestment company; and (3) the Liquidity Program has beenadequately and effectively implemented with respect to each Fundduring the reporting period. The Annual Liquidity Report alsoaffirmed that there have been no material changes to the LiquidityProgram since its initial approval and that no material changeswere being recommended at that time.
320 :: Liquidity Risk Management Program :: January 31, 2022 (unaudited)
Toppan Merrill - ProFunds Public Semi-Annual Report [Funds] 01-31-2022 ED [AUX] | akiesli | 29-Mar-22 08:44 | 22-1296-2.hb | Sequence: 1CHKSUM Content: 23012 Layout: 62567 Graphics: 0 CLEAN
JOB: 22-1296-2 CYCLE#;BL#: 8; 0 TRIM: 8.25" x 10.75" AS: New York: 212-620-5600COLORS: ~note-color 2, Black, ~note-color 3 GRAPHICS: none V1.5

This Page Intentionally Left Blank
Toppan Merrill - ProFunds Public Semi-Annual Report [Funds] 01-31-2022 ED [AUX] | akiesli | 29-Mar-22 08:44 | 22-1296-2.hc | Sequence: 1CHKSUM Content: 28902 Layout: 33751 Graphics: 0 CLEAN
JOB: 22-1296-2 CYCLE#;BL#: 8; 0 TRIM: 8.25" x 10.75" AS: New York: 212-620-5600COLORS: Black, ~note-color 2 GRAPHICS: none V1.5
01/22
ProFunds®
Post Office Mailing Address for InvestmentsP.O. Box 182800Columbus, OH 43218-2800
Phone NumbersFor Individual Investors Only: 888-776-3637 Or: 614-470-8122Institutions and Financial Professionals Only: 888-776-5717 Or: 240-497-6552Fax Number: (800) 782-4797Website Address: ProFunds.com
This report is submitted for the general information of the shareholders of the ProFunds. It is not authorized for distribution to prospectiveinvestors unless preceded or accompanied by an effective prospectus. To receive the most recent month end performance informationfor each Fund, please call toll-free 888-776-5717.
A description of the policies and procedures that the ProFunds uses to determine how to vote proxies relating to portfolio securities isavailable without charge, upon request, by calling toll-free 888-776-3637; and on the Securities and Exchange Commission’s websiteat sec.gov. Information regarding how the ProFund voted proxies relating to portfolio securities during the most recent 12-month periodended June 30 is available. (i) without change by calling toll-free 888-776-3637; (ii) on the ProFunds’ website at ProFunds.com; and(iii) on the Commission’s website at sec.gov.
ProFunds files complete lists of portfolio holdings with the Commission for the first and third quarters of each fiscal year on Form N-PORT(and successor Forms). Schedules of Portfolio Holding for the Funds in this report are available without charge on the Commission’swebsite at sec.gov, or may be reviewed and copied at the Commission’s Public Reference Room in Washington, D.C. Informationon the operation of the Public Reference Room may be obtained by calling 800-SEC-0330.
P.O. Box 182800Columbus, OH 43218-2800
Toppan Merrill - ProFunds Public Semi-Annual Report [Funds] 01-31-2022 ED [AUX] | akiesli | 29-Mar-22 08:44 | 22-1296-2.za | Sequence: 1CHKSUM Content: 61484 Layout: 6015 Graphics: 33057 CLEAN
JOB: 22-1296-2 CYCLE#;BL#: 8; 0 TRIM: 8.25" x 10.75" AS: New York: 212-620-5600COLORS: ~note-color 2, Black GRAPHICS: ProFunds_CVR_logo_k.eps V1.5
Related Documents