Research Methodology in Strategy and Management STRUCTURAL EQUATION MODELING METHODS IN STRATEGY RESEARCH: APPLICATIONS AND ISSUES Larry J Williams, Mark B Gavin, Nathan S Hartman Article information: To cite this document: Larry J Williams, Mark B Gavin, Nathan S Hartman. "STRUCTURAL EQUATION MODELING METHODS IN STRATEGY RESEARCH: APPLICATIONS AND ISSUES" In Research Methodology in Strategy and Management. Published online: 10 Mar 2015; 303-346. Permanent link to this document: http://dx.doi.org/10.1016/S1479-8387(04)01111-7 Downloaded on: 08 June 2015, At: 21:15 (PT) References: this document contains references to 75 other documents. To copy this document: [email protected] The fulltext of this document has been downloaded 609 times since NaN* Users who downloaded this article also downloaded: Henrich R. Greve, Eskil Goldeng, (2004),"LONGITUDINAL ANALYSIS IN STRATEGIC MANAGEMENT", Research Methodology in Strategy and Management, Vol. 1 pp. 135-163 Don D Bergh, Ralph Hanke, Prasad Balkundi, Michael Brown, Xianghong Chen, (2004),"AN ASSESSMENT OF RESEARCH DESIGNS IN STRATEGIC MANAGEMENT RESEARCH: THE FREQUENCY OF THREATS TO INTERNAL VALIDITY", Research Methodology in Strategy and Management, Vol. 1 pp. 347-363 Stanley F Slater, Kwaku Atuahene-Gima, (2004),"CONDUCTING SURVEY RESEARCH IN STRATEGIC MANAGEMENT", Research Methodology in Strategy and Management, Vol. 1 pp. 227-249 Access to this document was granted through an Emerald subscription provided by 394461 [] For Authors If you would like to write for this, or any other Emerald publication, then please use our Emerald for Authors service information about how to choose which publication to write for and submission guidelines are available for all. Please visit www.emeraldinsight.com/authors for more information. About Emerald www.emeraldinsight.com Emerald is a global publisher linking research and practice to the benefit of society. The company manages a portfolio of more than 290 journals and over 2,350 books and book series volumes, as well as providing an extensive range of online products and additional customer resources and services. Emerald is both COUNTER 4 and TRANSFER compliant. The organization is a partner of the Committee on Publication Ethics (COPE) and also works with Portico and the LOCKSS initiative for digital archive preservation. *Related content and download information correct at time of download. Downloaded by Universiti Putra Malaysia At 21:15 08 June 2015 (PT)

Welcome message from author
This document is posted to help you gain knowledge. Please leave a comment to let me know what you think about it! Share it to your friends and learn new things together.
Transcript

Research Methodology in Strategy and ManagementSTRUCTURAL EQUATION MODELING METHODS IN STRATEGY RESEARCH: APPLICATIONS AND ISSUESLarry J Williams, Mark B Gavin, Nathan S Hartman
Article information:To cite this document: Larry J Williams, Mark B Gavin, Nathan S Hartman. "STRUCTURAL EQUATION MODELINGMETHODS IN STRATEGY RESEARCH: APPLICATIONS AND ISSUES" In Research Methodology in Strategy andManagement. Published online: 10 Mar 2015; 303-346.Permanent link to this document:http://dx.doi.org/10.1016/S1479-8387(04)01111-7
Downloaded on: 08 June 2015, At: 21:15 (PT)References: this document contains references to 75 other documents.To copy this document: [email protected] fulltext of this document has been downloaded 609 times since NaN*
Users who downloaded this article also downloaded:Henrich R. Greve, Eskil Goldeng, (2004),"LONGITUDINAL ANALYSIS IN STRATEGIC MANAGEMENT", ResearchMethodology in Strategy and Management, Vol. 1 pp. 135-163Don D Bergh, Ralph Hanke, Prasad Balkundi, Michael Brown, Xianghong Chen, (2004),"AN ASSESSMENT OF RESEARCHDESIGNS IN STRATEGIC MANAGEMENT RESEARCH: THE FREQUENCY OF THREATS TO INTERNAL VALIDITY",Research Methodology in Strategy and Management, Vol. 1 pp. 347-363Stanley F Slater, Kwaku Atuahene-Gima, (2004),"CONDUCTING SURVEY RESEARCH IN STRATEGIC MANAGEMENT",Research Methodology in Strategy and Management, Vol. 1 pp. 227-249
Access to this document was granted through an Emerald subscription provided by 394461 []
For AuthorsIf you would like to write for this, or any other Emerald publication, then please use our Emerald for Authors serviceinformation about how to choose which publication to write for and submission guidelines are available for all. Pleasevisit www.emeraldinsight.com/authors for more information.
About Emerald www.emeraldinsight.comEmerald is a global publisher linking research and practice to the benefit of society. The company manages a portfolio ofmore than 290 journals and over 2,350 books and book series volumes, as well as providing an extensive range of onlineproducts and additional customer resources and services.
Emerald is both COUNTER 4 and TRANSFER compliant. The organization is a partner of the Committee on PublicationEthics (COPE) and also works with Portico and the LOCKSS initiative for digital archive preservation.
*Related content and download information correct at time of download.
Dow
nloa
ded
by U
nive
rsiti
Put
ra M
alay
sia
At 2
1:15
08
June
201
5 (P
T)

STRUCTURAL EQUATION MODELINGMETHODS IN STRATEGY RESEARCH:APPLICATIONS AND ISSUES
Larry J. Williams, Mark B. Gavin and
Nathan S. Hartman
ABSTRACT
The objective of this chapter is to provide strategy researchers with ageneral resource for applying structural equation modeling (SEM) in theirresearch. This objective is important for strategy researchers because oftheir increased use of SEM, the availability of advanced SEM approachesrelevant for their substantive interests, and the fact that important technicalwork on SEM techniques often appear in outlets that may not be notreadily accessible. This chapter begins with a presentation of the basicsof SEM techniques, followed by a review of recent applications of SEM instrategic management research. We next provide an overview of five typesof advanced applications of structural equation modeling and describe howthey can be applied to strategic management topics. In a fourth section wediscuss technical developments related to model evaluation, mediation, anddata requirements. Finally, a summary of recommendations for strategicmanagement researchers using SEM is also provided.
Strategic management research often involves the evaluation of one or moremodels that have been developed based on theory that propose relationships
Research Methodology in Strategy and ManagementResearch Methodology in Strategy and Management, Volume 1, 303–346© 2004 Published by Elsevier Ltd.ISSN: 1479-8387/doi:10.1016/S1479-8387(04)01111-7
303
Dow
nloa
ded
by U
nive
rsiti
Put
ra M
alay
sia
At 2
1:15
08
June
201
5 (P
T)

304 LARRY J. WILLIAMS ET AL.
among some or all of the variables in the model. The evaluation occurs whensample data is collected on variables in the model and measures of association(e.g. correlations or covariances) are obtained. These measures of association arethen used to estimate parameters of the model that represent processes presumedto underlie and be responsible for the sample data. When these models aredepicted in graphic form, they are often referred to as path models, since variableshypothesized to be related are connected with arrows. Beginning in the early1980s, management researchers widely embraced a new latent variable method(often also referred to as the structural equation modeling- SEM) for model testingthat offered many advantages over traditional approaches to model testing.
SEM was introduced in the strategic management literature in the mid-1980sby Farh, Hoffman and Hegarty (1984). As noted in a recent review byShook,Ketchen, Hult and Kacmar (2004), only 5 studies were published in theStrategicManagement Journalbefore 1995, while 27 studies appeared between 1998 and2002. In terms of a broader indicator of the frequency of use of SEM techniques bystrategy researchers, Shook et al. reviewed ten key empirical strategy journals forthe 1984–2002 time period. They focused on studies that examined relationshipsamong the broad constructs of strategy, environment, leadership/organization,and performance. Shook et al. found that there were 92 such studies, with 37%coming from theStrategic Management Journal, 26% published in theAcademyof Management Journal, and 13% appearing in theJournal of Management.Nearly two thirds of these studies were published between 1996 and 2002.
These data indicate the prominence SEM techniques have achieved in strategicmanagement research. They also reveal a trend indicating that future use of thismethod should be even more frequent. With this as background, this chapter hasfour objectives. The latter two objectives are to present to the strategic managementaudience five types of advanced applications currently being used in other areasof management research (e.g. organizational behavior and human resources) thathave potential use by strategy researchers. In addition, we will discuss three areaswhere methodologists are investigating technical aspects of SEM techniques thatstrategic management researchers should be aware of. To make these latter twogoals of interest to a broader audience, the first two objectives are to present a basicintroduction of SEM/latent variable techniques and to provide a review of recentstrategy research that supplements the information reported byShook et al. (2004).
A BRIEF INTRODUCTION TOLATENT VARIABLE TECHNIQUES
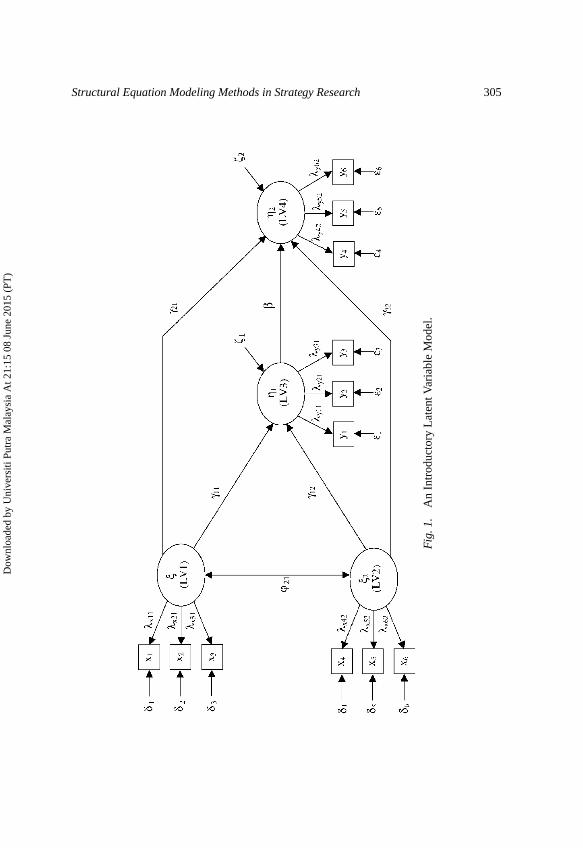
A basic latent variable structural equation model used to introduce topics and issuesto be discussed in this chapter is shown inFig. 1. Several aspects of the traditional
Dow
nloa
ded
by U
nive
rsiti
Put
ra M
alay
sia
At 2
1:15
08
June
201
5 (P
T)
Structural Equation Modeling Methods in Strategy Research 305
Fig.1
.A
nIn
trod
ucto
ryLa
tent
Varia
ble
Mod
el.
Dow
nloa
ded
by U
nive
rsiti
Put
ra M
alay
sia
At 2
1:15
08
June
201
5 (P
T)

306 LARRY J. WILLIAMS ET AL.
notation and terminology are illustrated with this figure using the labels associatedwith the popular LISREL program (Joreskog & Sorbom, 1996). Boxes representmanifest or indicator variables that are also referred to as measured variables, sincevalues for these variables are obtained during the data collection effort. Circles areused to represent latent variables, which are unobserved and not measured, butinstead are proposed by the researcher to be responsible for the values obtained onthe measured variables. The relationships between the latent variables and theirindicators are often referred to as a “measurement” model, in that it representsor depicts an assumed process in which an underlying construct determines orcauses behavior that is reflected in measured indicator variables. The fact that thearrows go from the circles to the boxes is consistent with this type of process.Thus, each factor serves as an independent variable in the measurement model,while the indicator variables serve as the dependent variables, and the connectingpaths are often referred to as factor loadings. Each indicator is also potentiallyinfluenced by a second independent variable in the form of measurement error,and its influence is represented as a cause of the indicator variable through the useof a second arrow leading to each of the indicators. Finally, the model shown inFig. 1 includes a correlation (double headed arrow) between the two exogenousconstructs (LV1–LV2), regression-like structural parameters linking exogenouswith endogenous constructs (LV3, LV4) and linking endogenous constructs to otherendogenous constructs, and the model also acknowledges unexplained variance inthe two endogenous latent variables. The part of the overall model that proposesrelationships among the latent variables is often referred to as the structural model.
The exogenous latent variables also have variances, but these are typically setat 1.0 to achieve identification (which is necessary for unique parameter estimatesto be obtained). The parameter representing the relationship between the twoexogenous latent variables is referred to as a phi parameter (�) his parameter isa factor correlation if identification is achieved by having the factor variances setat 1.0. If identification is achieved by setting a factor loading at 1.0 rather thanthe factor variance, the phi parameter is a covariance. The factor loadings for theindicators of exogenous latent variables are referred to as lambda x (�x) parameterswith LISREL, and the corresponding error variances are referred to as theta deltaparameters (��).
The endogenous latent variables and their indicators are related by lambda y(�y) factor loadings, and the measurement errors for these indicators are referred toas theta epsilon parameters (��). Identification for the latent endogenous variablesis typically achieved by setting one factor loading for each latent variable at 1.0.As mentioned earlier, single headed arrows represent the relationships between theexogenous and endogenous latent variables and the parameters used to estimatethese relationships are often called structural parameters. They are conceptually
Dow
nloa
ded
by U
nive
rsiti
Put
ra M
alay
sia
At 2
1:15
08
June
201
5 (P
T)

Structural Equation Modeling Methods in Strategy Research 307
similar to partial regression coefficients, in that they represent the influence ofone latent variable on another, while holding constant or controlling for theinfluence of other predictors of the dependent latent variable. These structuralparameters are different from traditional OLS regression coefficients becausethey are estimated while accounting for the effects of random measurement error.In LISREL notation the four paths are referred to as gamma parameters (�).
A relationship between the two endogenous latent variables is also shown in theFig. 1 model. Although the parameter representing this relationship is identicalin nature to the gamma parameters just mentioned, it is given a different name inLISREL notation as a beta parameter (�). Additionally, the model reflects the factthat there is an error term for each endogenous variable, and these are representedas zeta, while the residual variance in the two latent endogenous variables that isnot accounted for by the predictors of each is represented in the psi matrix (�).While it is sometimes possible to allow for a correlation between the two errorterms, this is not done in the present model. Finally, the structural part of themodel shown inFig. 1can be represented with two equations, one for each of theendogenous latent variables.
The covariance matrix for the 12 indicators would be used in the analysis ofthe Fig. 1 model. Maximum likelihood is the most commonly used estimationtechnique, and it yields a set of estimates for the parameters of the model and theirstandard errors, which can be used to test null hypotheses that each parameterestimate equals zero. At the completion of parameter estimation, a chi-squarestatistic is obtained for the model. Historically this chi-square and its probabilitylevel was used to judge the adequacy of the model. More recently the modelassessment process incorporates other measures of model fit (e.g. ComparativeFit Index, Bentler, 1990). One final aspect of evaluating latent variable modelswe will address is the capability of comparing competing models within a dataset. This is most easily accomplished if the two models are nested, where nestingmeans one model is a more restricted version of the other model. Two nestedmodels can be compared using a chi-square difference test. With the model shownin Fig. 1, adding two paths from the exogenous variables LV1 and LV2 to theendogenous variables LV4 would yield a nested model that could be compared tothe model that did not include these two paths (as inFig. 1).
RECENT STRATEGIC MANAGEMENTRESEARCH WITH LATENT VARIABLE MODELS
The growth in strategic management applications of structural equation techniquesparalleled researchers’ access to PC based data analysis software programs, such
Dow
nloa
ded
by U
nive
rsiti
Put
ra M
alay
sia
At 2
1:15
08
June
201
5 (P
T)

308 LARRY J. WILLIAMS ET AL.
as LISREL, EQS, and Amos, and has led to the assessment of more sophisticatedtheories.Shook, Ketchen, Hult and Kacmar (2004)have discussed the increaseduse of structural equation modeling in strategic management research and theypresented a critical examination of structural equation modeling in theAcademy ofManagement Journal,Journal ofManagement, andStrategicManagement Journalfrom 1984 to 2002. Their review of strategic management research notes a substan-tial increase since 1995. They observed a lack of standardization in the reportingof results across studies, and found that information on the characteristics of thesample, reliability, validity, the evaluation of model fit, model respecification, andthe acknowledgement of equivalent models was inconsistently reported.
Standardization of Results Reporting
As noted earlier in this chapter, methodological and analytical judgments shouldbe based upon a priori theory, because theory drives model specification, which ul-timately determines the results. This being said rigorous reporting and explanationof model analysis is more important with SEM than other data analysis techniques,because of the complexity and large number of decisions made by researchers ana-lyzing their data with this technique. As in other fields of study, strategy researchershave recently been criticized for their inconsistent in adequately reporting thenature of their studies (Shook et al., 2004). More specifically, Shook et al. foundthat authors often have failed to report if a study is cross-section vs. longitudinalin nature, even though this difference greatly affects inferences of causalityresearchers can draw from their results. Other more specific issues discussedinclude the assessment of data normality, reliability and validity of measures,and statistical power.
The reporting of statistical information in the results sections of studies usingstructural equation modeling had many discrepancies that were also highlighted inthe critical review conducted byShook et al. (2004). For example, when assessingthe fit of measurement models, Shook et al. found that many studies includedseveral comparative fit indices and the most frequently included fit indices werethe chi-square statistic, the goodness of fit index (GFI), the comparative fit index(CFI), and the root mean square residual. Very few studies however, used allthree of these fit measures, as suggested byGerbing and Anderson (1992). Mosttroubling was the fact that model respecification or comparison of a theoreticallyproposed model with an alternative nested model to test a different theoreticalproposition was conducted by fewer than 50% of the studies examined byShook et al. In addition, nearly all researchers engaging in model repsecificationfailed to cite theoretical support for the changes that were made. Finally, almost
Dow
nloa
ded
by U
nive
rsiti
Put
ra M
alay
sia
At 2
1:15
08
June
201
5 (P
T)

Structural Equation Modeling Methods in Strategy Research 309
all researchers fail to acknowledge the existence of equivalent models whendiscussing the results supporting their proposed structural model. This suggeststhat researchers may not remember that there are always alternative models thatmight fit the data as well as the one being proposed.
Overview of Recent Studies
The Shook et al. (2004)review focused on technical aspects of research usingstructural equation techniques in strategic management and these authors notedseveral important points. To supplement their review we concluded a review ofthe three major journals publishing strategic management researcher from 2000 to2003, including theAcademyofManagement Journal, the Journal ofManagement,and theStrategic Management Journal. Our goal with this review was mainly tosummarize the substantive content of these applications. InTable 1we summarizedeighteen of these articles. In this table information is provided on the first author,year of publication, type of theory or topic examined by the study, and the natureof the sample. Also listed are the constructs used in the researchers’ structuralmodels. For each of the constructs listed, it is noted whether it was an endogenous orexogenous variable, the number of items included in the measure, and its reliabilityif reported or if the construct was part of multi-item scale.
The empirical studies included inTable 1were completed using a high levelof sophistication and complex model testing strategies. The samples used inthese studies were comprised of either “respondent” data from employees or/andobjective data obtained from “secondary” sources selected by the analysts.Several of the studies included inTable 1used data collected from outside ofthe United States. For example,Andersson et al. (2002)collected data usingSwedish subsidiaries, Spanos et al. (2001) collected data form Greek CEOs, Songet al. (2001) collected data from Japanese managers, and Steensma et al. (2000)collected data from CEOs and company presidents working in independent jointventures in Hungary. Additionally,Schroeder et al. (2002)used samples from twoor more countries, which included the United Kingdom, Germany, and Italy.
Recognized multi-item scales or items externally validated by the studiesresearchers were used to represent most of the constructs used in the studies foundin Table 1. Constructs within these studies primarily tested main effects, howeversome studies tested the indirect effects between constructs and also used controlvariables. Constructs based on learning or knowledge acquisition were used inseven of the studies included inTable 1. Different conceptualizations of learningwere used 5 times as an exogenous and 3 times as an endogenous variable. Inmost cases learning was measured by obtaining questionnaire survey responses
Dow
nloa
ded
by U
nive
rsiti
Put
ra M
alay
sia
At 2
1:15
08
June
201
5 (P
T)

310LA
RR
YJ.W
ILLIAM
SE
TA
L.
Table 1. Recent Studies from Strategic Management Using Latent Variable Techniques.First Author Year Journala Focus of Study Nature of Latent Respondent/ Exo/Endoc Number Reliability (�)
Sample Constructs Secondaryb of Items
1. Andersson, U. 2002 SMJ This study explored theimportance of externalnetworks as theyinfluence a subsidiariesmarket performance andthe competencedevelopment ofmultinationalcorporations.
Data for this study wascollected withinSwedish multinationalcorporations in themanufacturing industry.
Subsidiary businessembeddedness
Respondent Exo 2 NA
Expected subsidiarymarket performance
Respondent Endo 3 NA
Subsidiary importancefor MNC competencedevelopment
Respondent Endo 2 NA
Subsidiary technicalembeddedness
Respondent Endo 2 NA
2. Baum R. J. 2003 SMJ TThis study supportedEisenhart (1989)andJudge and Miller (1991)by empiricallydetermining thatdecision speed affectsfirm performance.
Data was collected withquestionnairescompleted by 318 CEOsand 122 associatesworking in firms thatoperated in all 10 GlobalIndustry ClassificationStandard sectors in 1997and 2001.
Firm size Secondary Exo/Control 1 NAPast performance Secondary Exo/Control 3 NACentralization ofStrategic management
Respondent Exo 4 0.71
Decentralization ofoperations management
Respondent Exo 4 0.73
Dynamism Respondent Exo 5 0.88Formalization ofroutines
Respondent Exo 3 0.73
In formalization ofnon-routines
Respondent Exo 4 0.83
Munificence Respondent Exo 5 0.85Firm performance Respondent Endo 3 NAStrategic decision speed Respondent Endo 3 0.78D
ownl
oade
d by
Uni
vers
iti P
utra
Mal
aysi
a A
t 21:
15 0
8 Ju
ne 2
015
(PT
)

Stru
cturalE
quatio
nModelin
gMethodsin
Stra
tegyRese
arch
3113. Capron, L. 2001 SMJ In this study researchers
took a positive anddynamic view ofpost-acquisition assetdivestiture occurringpost horizontalacquisitions. In generalthey found that resourceredeployment and assetdivestiture are activelysought by firmsrecombining thecapabilities of mergingbusinesses.
The data set used in thisstudy was comprised of253 different managerresponses recordedusing a questionnairesurvey. Managers wereemployed in firms thatexperienced horizontalacquisitions in NorthAmerica and Europeduring 1988 and 1992.
Strategic similarity Respondent Exo 3 0.80
Acquirer assetdivestiture
Respondent Endo 4 0.90
Resource asymmetry oftarget to acquirer
Respondent Endo 4 0.70
Resource redeploymentto acquirer
Respondent Endo 4 0.96
Resource redeploymentto target
Respondent Endo 4 0.94
Target asset divestiture Respondent Endo 4 0.92
4. Geletkanyz, M. A. 2001 SMJ Relationship betweenCEO external directoratenetworks and CEOcompensations wereexplored in this study.
Data was collectedthrough secondarysources on firms listed inthe 1987 Fortune 1000in the manufacturing andservice industry.
Board power Secondary Exo 1 NAExternal directoratenetworks
Secondary Exo 7 NA
Firm performance Secondary Exo 1 NAFirm size Secondary Exo 1 NAHuman capital Secondary Exo 1 NAManagerial discretion Secondary Exo 1 NACEO compensation Secondary Endo 2 NA
5. Goerzen, A. 2003 SMJ Study supported theorythat firms withgeographically dispersedassets perform betterthan firms with low assetdispersion.
Study data was collectedfrom a 1999 survey of13,529 subsidiaries of580 Japanesemultinational enterpriseswith operations in morethan six countries.Researchers took thesurvey data was from apublication of ToyoKeizai Shinposha (ToyoKeizai, 1999).
Average industryprofitability
Secondary Exo/Control 1 NA
Capital structure Secondary Exo/Control 1 NAFirm size Secondary Exo/Control 1 NAInternational experience Secondary Exo/Control 1 NAMarketing assets Secondary Exo/Control 1 NAProduct diversity Secondary Exo/Control 1 NATechnical assets Secondary Exo/Control 1 NACountry environmentdiversity
Secondary Exo 4 0.89
International assetdispersion
Secondary Exo 3 0.85
Economic performance Secondary Endo 3 0.67
Dow
nloa
ded
by U
nive
rsiti
Put
ra M
alay
sia
At 2
1:15
08
June
201
5 (P
T)

312LA
RR
YJ.W
ILLIAM
SE
TA
L.Table 1. (Continued)
First Author Year Journala Focus of Study Nature of Latent Respondent/ Exo/Endoc Number Reliability (�)Sample Constructs Secondaryb of Items
6. Hoskisson, R. E. 2002 AMJ Study examinesrelationship betweenimportant institutionalownership constituents,internal governancecharacteristics, andcorporate innovationstrategies.
Sample of firms andindustries withoperations in theindustrial manufacturingthat also reported R&Dexpenditures in theStandard & Poor’sCOMPUSTAT annualdata and businesssegment tapes. Topmanagers (n= 286)were also surveyed tomeasure externalacquisition ofinnovation.
Investment managers(institutional investors)
Secondary Exo 2 NA
Pension funds(institutional investors)
Secondary Exo 2 NA
External innovation(innovation mode)
Respondent Endo 3 0.73
Inside directorincentives (Directors)
Secondary Endo 2 NA
Internal innovations(innovation mode)
Secondary Endo 2 NA
Outside directors(Directors)
Secondary Endo 2 NA
Current ratio Secondary Exo/Control 1 NAFirm performance Secondary Exo/Control 2 NAFirm size Secondary Exo/Control 1 NAProduct diversification Secondary Exo/Control 1 NATechnologicalopportunity
Secondary Exo/Control 2 NA
7. Hult, G. 2002 AMJ Study empirically testedaspects of supply chainswithin a firm using datafrom multiple chainparticipants.
Questionnaire survey of114 internal customers,115 corporate buyers,and 58 external supplierswithin a single Fortune500 transportationcompany.
Entrepreneurship Respondent Exo 5 0.84Innovativeness Respondent Exo 5 0.92Learning Respondent Exo 4 0.86Cultural competitiveness Respondent Endo 2nd order factor NACycle times Respondent Endo 7 0.90
8. Hult, G. 2001 SMJ Market orientation,organizationalperformance, andresource-based view.
A senior executive fromeach of 181 strategicbusiness units ofdifferent multinationalcorporations completedquestionnaire surveysfor this study.
Positional advantage Respondent Exo 2nd order factorInnovativeness Respondent Endo 5 0.88Market orientation Respondent Exo 3 NAOrganizational learning Respondent Exo 4 0.85Entrepreneurship Respondent Endo 5 0.88Five-year percentagechange in stock price
Secondary Endo 1 NA
Five-year averagechange inreturn-on-investment
Secondary Endo 1 NA
Dow
nloa
ded
by U
nive
rsiti
Put
ra M
alay
sia
At 2
1:15
08
June
201
5 (P
T)

Stru
cturalE
quatio
nModelin
gMethodsin
Stra
tegyRese
arch
313Five-year percentagechange in income
Secondary Endo 1 NA
9. Isobe, T. 2000 AMJ Study investigateddeterminates andperformanceconsequences of foreignmarket entry strategy inthe emerging market ofChina.
Questionnaire surveydistributed to ChineseCEOs or presidents ofJapanese manufacturingsubsidiaries in Shanghai,Hangzhou, Beijing, andDalian in China. Theeffective sample sizewas 220.
Availability ofsupporting infrastructurein local markets(Infrastructure)
Respondent Exo 3 0.74
Extent of a Japaneseparent’s control within ajoint venture (control)
Respondent Exo 3 NA
Strategic importance ofa joint venture to theJapanese parent(importance)
Respondent Exo 2 0.71
Degree of resourcecommitment totechnology transfer(technology)
Respondent Endo 2 0.80
Employee retention rate Respondent Endo 1 NAOverall satisfaction Respondent Endo 1 NAPerceived economicperformance
Respondent Endo 2 0.73
Timing of entry Respondent Endo 1 NA
10. Kale, P. 2000 SMJ This study analyzed theimplications of learningand protection ofproprietary assets instrategic alliancemanagement.
Strategic alliance relateddata was collected from212 managers inalliances formed byU.S.-based companiesthrough the usingquestionnaire surveys.These companies weregenerally in thepharmaceutical,chemical, computer,electronic,telecommunication, orservice industries.
Alliance duration Respondent Exo/Control 1 NAAlliance structure Respondent Exo/Control 1 NA
Existence of prioralliances
Respondent Exo/Control 1 NA
Partner fit:complementary andcompatibility
Respondent Exo/Control 4 0.82
Partner nationality Respondent Exo/Control 1 NAConflict management Respondent Exo 6 0.92Relational capital Respondent Exo 5 0.91Learning Respondent Endo 3 NAProtection of proprietaryassets
Respondent Endo 2 NA
Dow
nloa
ded
by U
nive
rsiti
Put
ra M
alay
sia
At 2
1:15
08
June
201
5 (P
T)

314LA
RR
YJ.W
ILLIAM
SE
TA
L.Table 1. (Continued)
First Author Year Journala Focus of Study Nature of Latent Respondent/ Exo/Endoc Number Reliability (�)Sample Constructs Secondaryb of Items
11. Schroeder, R. G. 2002 SMJ Manufacturing strategyin the context of theresource-based view ofthe firm
A questionnaire surveywas used to collect 164responses frommanagers employed inmanufacturing plants inGermany, Italy, Japan,the United Kingdom,and the United Statesprovided data for thisstudy.
External learning Respondent Exo 4 0.74Internal learning Respondent Exo 4 0.82Manufacturingperformance
Respondent Endo 5 NA
Proprietary process andequipment
Respondent Endo 4 0.70
12. Sharma, S. 2000 AMJ This study researchedthe identified themanagerial andorganizational factorsinfluencing anorganization’s choice ofenvironmental strategies.
A questionnaire surveywas mailed to CEOs, topmanagers, staffspecialists, and linemanagers of Canadianoil and gas companies.The effective samplesize for this study was181.
Organizational size Secondary Exo/Control 1 NAScope of operations Respondent Exo/Control 1 NAEnvironmental strategy Respondent Exo 54 0.87Managerialinterpretations ofenvironmental issues
Respondent Exo 3 0.79
Discretionary slack Respondent Endo 2 0.96Integration ofenvironmental criteriainto employeeperformance evaluationsystems
Respondent Endo 3 0.86
Issue legitimation as anintegral aspect ofcorporate identity
Respondent Endo 2 0.81
13. Song, M. 2001 AMJ Examines themoderating effect ofperceived technologicaluncertainty on newproduct development.
Questionnaire surveywas completed by 553Japanese projectmanagers working onnew productdevelopments incompanies traded on theTokyo, Osaka, andNagoya stockexchanges.
Number of employees Secondary Exo/Control 1 NAR&D spending/sales Secondary Exo/Control 1 NATotal assets Secondary Exo/Control 1 NACross-functionalintegration
Respondent Exo 3 0.94
Marketing synergy Respondent Exo 8 0.97Technical synergy Respondent Exo 4 0.89Competitive and marketintelligence
Respondent Endo 5 0.89
Dow
nloa
ded
by U
nive
rsiti
Put
ra M
alay
sia
At 2
1:15
08
June
201
5 (P
T)

Stru
cturalE
quatio
nModelin
gMethodsin
Stra
tegyRese
arch
315Marketing proficiency Respondent Endo 6 0.86Perceived technicaluncertainty
Respondent Endo 6 0.87
Product competitiveadvantage
Respondent Endo 5 0.88
Product financialperformance
Respondent Endo 3 NA
Technical proficiency Respondent Endo 6 0.87
14. Spanos, Y. E. 2001 SMJ This study dealt with thecausal logic of rentgeneration. Resultssuggest that industry andfirm effects areimportant but explaindifferent dimensions ofperformance.
Data were collectedusing a questionnairesurvey distributed to 147CEOs of Greek firms.The respondents weregenerally frommanufacturingindustries.
Innovativedifferentiation
Respondent Exo 4 0.82
Low cost Respondent Exo 3 0.73Market position(measure ofperformance)
Respondent Exo 4 0.85
Marketing Respondent Exo 4 0.77Marketingdifferentiation
Respondent Exo 4 0.86
Organizational/managerial
Respondent Exo 7 0.88
Technical Respondent Exo 3 0.80Competitive rivalry Respondent Endo 4 0.83Firm assets Respondent Endo 2nd order factor NAProfitability (measure ofperformance)
Respondent Endo 3 0.87
Strategy Respondent Endo 2nd order factor NA
15. Steensma, H. K. 2000 SMJ International jointventures, relating toimbalance inmanagement control andownership control.
Hungarian presidents orgeneral managers inservice andmanufacturing firmsengaged in internationaljoint ventures wereinterviewed to gatherdata for this study. Thesample size at time onewas 121 and wasreduced to 83 at timetwo.
Firm in the autocomponents industry
NA Exo/Control 1 NA
Firm in the machineryindustry
NA Exo/Control 1 NA
Founding date (firm age) NA Exo/Control 1 NANumber of employees(firm size)
NA Exo/Control 1 NA
Imbalance inmanagement controlbetween and parentfirms (managementcontrol imbalance)
Respondent Exo 7 0.87Dow
nloa
ded
by U
nive
rsiti
Put
ra M
alay
sia
At 2
1:15
08
June
201
5 (P
T)

316LA
RR
YJ.W
ILLIAM
SE
TA
L.
Table 1. (Continued)First Author Year Journala Focus of Study Nature of Latent Respondent/ Exo/Endoc Number Reliability (�)
Sample Constructs Secondaryb of Items
Level of managerialsupport from the foreignparent to the IJV(managerial support)
Respondent Exo 4 0.79
Level of technicalsupport from the foreignparent to the IJV(technical support).
Respondent Exo 3 0.85
Ownership controlimbalance
Secondary Exo 1 NA
IJV learning Respondent Endo 5 0.89IJV survival Secondary Endo 1 NALevel of conflictbetween parent firms(parent conflict)
Respondent Endo 3 0.78
16. Tippins, M. J. 2003 SMJ This study showedknowledge to be animportant firm resource.Organizational learningwas found to mediate theeffect of informationtechnology on firmperformance. Thesefinding contributed tothe resource-based viewbecause it showed that afirm’s competitiveadvantage andperformance are afunction of resourcesembedded within theorganization.
The sample of this studyincluded 271 completedquestionnaire surveys byexecutives inmanufacturingorganizations.
Information technologycompetency
Respondent Exo 2nd order factor NA
Market power Respondent Exo/Control 2 NADeclarative memory Respondent Endo 7 NAFirm performance Respondent Endo 4 NAInformation acquisition Respondent Endo 6 NAInformationdissemination
Respondent Endo 6 NA
Information technologyknowledge
Respondent Endo 4 NA
Information technologyobjects
Respondent Endo 5 NA
Information technologyoperations
Respondent Endo 6 NA
Organizational learning Respondent Endo 2nd order factor NAProcedural memory Respondent Endo 5 NAShared interpretation Respondent Endo 5 NA
Dow
nloa
ded
by U
nive
rsiti
Put
ra M
alay
sia
At 2
1:15
08
June
201
5 (P
T)

Stru
cturalE
quatio
nModelin
gMethodsin
Stra
tegyRese
arch
317
17. Worren, N. 2002 SMJ Modularity, strategicflexibility, and firmperformance
Data were collected witha questionnaire surveyadministered tomanufacturing andmarketing managersemployed in the UnitedKingdom and the UnitedStates. The total numberof respondents in thisstudy was 87.
Customer/competitorchange
Respondent Exo 3 0.58
Firm size Respondent Exo 1 NAInnovation climate Respondent Exo 3 0.80Entrepreneurial intent Respondent Endo 3 0.70Firm performance Respondent Endo 3 0.84Internet channels Respondent Endo 2 0.74Margin/volume pressure Respondent Endo 2 0.62Model variety Respondent EndoModular processes Respondent Endo 7 0.80Modular products Respondent Endo 4 0.64Modular structure Respondent Endo 2 0.56
18. Yli-Renko, H. 2001 SMJ Examined knowledgeexploitation used byyoung technology firmsto gain competitiveadvantage when theyaccrue internalknowledge throughrelationships with theirmajor customers.
In this studyquestionnaire data wasobtained from 180managing directorsworking in youngtechnology-based firmsin the United Kingdom.These firms weretypically focused in thepharmaceutical,electronic, medical,communication, andenergy/environmentaltechnologies.
Customer network ties Respondent Exo 2 0.86Knowledge acquisition Respondent Exo 4 0.85Relationship quality Respondent Exo 3 0.73Social interaction Respondent Exo 2 0.71New productdevelopment
Respondent Endo 1 NA
Sales costs Secondary Endo 1 NATechnologicaldistinctiveness
Respondent Endo 3 0.79
Economic exchange Secondary Exo/Control 1 NAFirm age Secondary Exo/Control 1 NAFirm size Secondary Exo/Control 1 NAIndustry sector Secondary Exo/Control 1 NAInternationalization Secondary Exo/Control 1 NA
aAMJ = The Academy of Management Journal; JOM= Journal of Management; SMJ= Strategic Management Journal.bRespondent= Subjective ratings to survey items provided by respondents; Objective= Objective data obtained from secondary sources by analyst(s).cExo = Exogenous variable; Endo= Endogenous variable.D
ownl
oade
d by
Uni
vers
iti P
utra
Mal
aysi
a A
t 21:
15 0
8 Ju
ne 2
015
(PT
)

318 LARRY J. WILLIAMS ET AL.
from employees. Other examples of perceptual data obtained from employeesincluded concepts involving entrepreneurship, innovativeness, and technologyor technological support. These perceptual variables were generally used asexogenous variables. Different measures of firm performance were also usedin several of the studies reviewed. In 4 studies performance was measured withsecondary data obtained by the researchers, but in 8 studies performance wasmeasured using responses from employees. Performance measures generally hadmore than 2 items and were most commonly used as endogenous variables. Only3 of the studies inTable 1used performance measures as an exogenous variable.Nine of the 18 studies listed inTable 1used control variables in their structuralmodels. Examples of the control variables used are firm size, firm age, industrysector, total assets, and past performance.
Recent Exemplar Strategy and SEM Articles
Although the proceeding review summarized the content of recent strategy researchusing SEM, it was focused on providing an overview of the types of theories andvariables used in this research. Next we will present a more detailed examinationof several articles included inTable 1. The first article we selected used SEMand multiple indicators in the examination of a CEO’s external networks. In thisstudy byGeletkanycz, Boyd and Finkelstein (2001), a focus was given to therelationship between a CEO’s external networks and compensation. Because singleindicator based methodologies like regression are unable to account for all of thenuances in CEO’s external directorate networks, they created a multi-indicatorfactor for this latent construct. This multi-item construct included indicators ofCEO outside directorships, count of the number of directorships held, number ofdirectorships with Fortune 1000 firms, average net sales of each directorship heldby a CEO, average profitability of each directorship held by a CEO, degree of CEOinteraction with other network members, betweenness or extent to which a firm isa control position, and closeness or a measure of a firm’s independence from othernetwork members. The endogenous variable, CEO Compensation, was comprisedof a two-item scale and was found to be directly affected by latent variables ofCEO performance, firm size, external directorate networks, human capital, firmperformance, board power, and managerial discretion.
Throughout this chapter we have supported the notion that SEM allowsresearchers to develop more sophisticated theories. Recent articles by Tippins andSohi (2003) andBaum and Wally (2003)are exemplars for this proposition. Thefirst of these two studies developed and empirically validated scales assessing ITcompetency and organizational learning. In this complex conceptual model the
Dow
nloa
ded
by U
nive
rsiti
Put
ra M
alay
sia
At 2
1:15
08
June
201
5 (P
T)

Structural Equation Modeling Methods in Strategy Research 319
links between 12 latent constructs were examined. Specifically, this study soughtto determine the role information technology competency and organizationallearning has on firm performance. Information technology competency withinthe organization and organizational learning were represented as higher orderconstructs. Organizational learning was represented by five first order factors andinformation technology competency was represented by three first order factors.Structural equation modeling also allowed Tippins and Sohi to test the mediatingeffects of knowledge acquired through organizational learning in the relationshipbetween information technology competency and firm performance.
Baum and Wally (2003)used SEM to test a mediation model with indirect anddirect effects on firm performance. This model included ten latent constructs. Sixof these constructs were proposed to be mediated by strategic decisions speed intheir relationship with firm performance, while strategic decision speed and firmperformance were controlled for by including firm size and past firm performancein the structural model. The analysis of the theoretical model simultaneouslytested nine primary hypothesis. Baum and Wally advanced strategy literature byidentifying specific environmental and organizational factors affecting strategicdecision speed. From a methodological standpoint this study was impressivebecause it used longitudinal data to empirically support the hypothesis thatstrategic decision speed mediates the relationship between organizational andenvironmental factors with firm performance.
Goerzen and Beamish’s (2003)study is an empirical example of testing latentvariable interactions. They examined a structural model of geographic scopeand the economic performance of multinational enterprises. Results for theirstudy showed a positive direct relationship between international asset dispersionand economic performance, while the direct relationship between countryenvironment diversity and economic performance was negative. Using a latentvariable score analysis technique, which involved the creation of factor scoresthat were subsequently used in multiple regression, they also found evidencefor an interaction between the combined effect of international asset dispersionand country environment diversity on multinational enterprises economic perfor-mance. This study found that firms with more geographically dispersed assetsexperienced higher performance, while also demonstrating structural equationmodeling’s flexibility in the analysis of interaction effects.
As a final example, a study completed byHoskisson, Hitt, Johnson andGrossman (2002)used SEM to examine the relationship between importantinstitutional ownership constituents, internal governance characteristics, andcorporate innovative strategies. This study highlights researchers ability tosimultaneously compare the strength of relationships among multiple exogenousand endogenous variables. For example, one of their hypotheses proposed that
Dow
nloa
ded
by U
nive
rsiti
Put
ra M
alay
sia
At 2
1:15
08
June
201
5 (P
T)

320 LARRY J. WILLIAMS ET AL.
professional investment fund manager ownership was positively related withexternal innovation and was more strongly related with external innovationthan institutional pension fund ownership. Hoskisson et al.’s results showed thatinstitutional pension fund ownership was more strongly related with internalmotivation, external motivation, and inside director incentives and ownershipthan was professional investment fund manager ownership. Inside board memberownership and incentives were more strongly related with internal innovation thatthe degree of representation of independent outside board membership. Finally, thedegree of representation of independent outside board members was found to havea stronger relationship with external innovation than inside board membershipand incentives.
ADVANCED APPLICATIONS OF LATENTVARIABLE TECHNIQUES
The preceding sections provided an introduction to latent variable methodsand an overview of applications of structural equation techniques in strategicmanagement. In addition to the basic approach discussed in these sections,there are advanced types of models that have been examined in other areas ofmanagement research that have potential use by strategy researchers. Thus, thenext section will describe five of these types of advanced models, drawing on arecent review byWilliams, Edwards and Vandenberg (2003).
Reflective vs. Formative Indicators
One type of advanced application addresses questions related to the direction ofrelationships between latent variables and their indicators. As noted earlier,Fig. 1specifies latent variables as causes of manifest variables, and these measuresare termedreflective, meaning that they are reflections or manifestations ofunderlying constructs (Edwards & Bagozzi, 2000; Fornell & Bookstein, 1982).Reflective measurement characterizes have been used in nearly all applicationsof structural equation modeling and confirmatory factor analysis in managementresearch. However, in some instances, the direction of the relationship betweenlatent and manifest variables is reversed, such that measures are treated as causesof constructs (Bollen & Lennox, 1991; Edwards & Bagozzi, 2000; MacCallum& Browne, 1993). Since the measures form or produce their associated construct(Fornell & Bookstein, 1982), these measures are calledformative. A frequentlycited example of formative measurement is socioeconomic status, which is viewed
Dow
nloa
ded
by U
nive
rsiti
Put
ra M
alay
sia
At 2
1:15
08
June
201
5 (P
T)

Structural Equation Modeling Methods in Strategy Research 321
as a composite of social and economic indicators such as occupation, education,and income (Hauser & Goldberger, 1971; Marsden, 1982).
From a modeling perspective, important differences between reflective andformative measures can be seen by comparingFig. 1with Fig. 2, the latter of whichrespecifies the manifest variables of LV1 and LV2 using a formative approach.It should be noted that LV1 and LV2 are now endogenous rather than exogenous,given that they are each dependent variables with respect to their indicators.Second, the manifest variables themselves do not include measurement errors,and instead errors in the measurement of LV1 and LV2 are captured by theirresiduals (which represent the part of each latent variable that is not explainedby its indicators). Third, the indicators of LV1 and LV2 are now exogenous, andtheir covariances with one another are freely estimated. If the model also includedlatent exogenous variables, then the covariances between these variables and theformative indicators could be modeled by respecifying the formative indicatorsas latent exogenous variables with single indicators, fixed unit loadings, and nomeasurement error.
As noted byWilliams, Edwards and Vandenberg (2003), a key requirement ofworking with models that include formative variables is to ensure that the modelcontaining the measures is identified. To identify the paths relating the formativemeasures to their construct, the following conditions must be met: (a) the constructmust be specified as a direct or indirect causes of at least two manifest variables;and (b) the variance of the residual of the construct must be fixed, or at leastone of the covariances between the measurement errors of the manifest variablescaused by the construct must be fixed (Bollen & Davis, 1994; Edwards, 2001;MacCallum & Browne, 1993). These conditions are met by the model inFig. 2,given that the indicators of LV1 and LV2 are indirect causes of the six manifestvariables assigned to LV3 and LV4, and the covariances among the measurementerrors of these manifest variables are fixed to zero. Under these conditions,the variances and covariances of the residuals for LV1 and LV2 can be freelyestimated.
Models with formative measures also create interpretational difficulties. Someof these difficulties have been discussed byWilliams, Edwards and Vandenberg(2003), such as the evidence needed to evaluate the construct validity of formativemeasures.Diamantopoulos and Winklhofer (2001)indicated that formativemeasures should meet four criterion: (a) the domain of content covered bythe measures should be clearly specified; (b) the measures should constitute acensus of the content domain, covering all of its facets; (c) the correlations amongthe measures should be modest to avoid multicollinearity; and (d) the construct as-sociated with the measures should exhibit meaningful relationships with criterionvariables. Although the first and second criteria are reasonable, the third and fourth
Dow
nloa
ded
by U
nive
rsiti
Put
ra M
alay
sia
At 2
1:15
08
June
201
5 (P
T)

322LA
RR
YJ.W
ILLIAM
SE
TA
L.
Fig. 2. A Latent Variable Model with Formative Indicators.
Dow
nloa
ded
by U
nive
rsiti
Put
ra M
alay
sia
At 2
1:15
08
June
201
5 (P
T)

Structural Equation Modeling Methods in Strategy Research 323
criteria may result in eliminating measures, thereby altering the meaning of theconstruct.Strategy applications. Strategy researchers will be most familiar with reflective
measures in which the indicators are influenced by the underlying construct. Infact, the strategy literature has many instances of such item-construct representa-tions. For example,Dooley, Fryxell and Judge (2000)assessed management teamdecision commitment using items that referred to the extent to which memberswould be willing to put forth effort to help the decision succeed, talk up thedecision to coworkers, and be proud to tell others they were involved in makingthe decision. Presumably, an individual’s level of decision commitment willinfluence the response to these items.
Much less common in existing SEM applications is the use of formative indica-tors. However, there are several measures and constructs of interest in the strategyliterature that fit such a representation. For example, innovation differentiationmight be assessed using R&D expenditures for product development, R&D ex-penditures for process innovation, and emphasis on being ahead of the competition(Spanos & Lioukas, 2001). In this instance, these variables might actually deter-mine a firm’s innovation differentiation. That is, innovation differentiation resultsfrom these expenditures and an emphasis on being ahead. As another example,consider firm performance as assessed by such indices as sales, market share, andstock price. Here, firm performance does not determine each of these indices.Rather, sales, market share and stock price actually determine firm performance.
While the incorporation of formative indicators into SEM models is rarelyseen in strategy research, it is not likely due to a small number of measures andconstructs that fit this representation. Rather, we would argue that researchersoften default to a reflective approach without really thinking through the nature ofthe relationships between the indicators and the construct. One could make thecase that measures and constructs that would best be represented by a formativemodel are often, in fact, incorrectly specified using a reflective approach.We would encourage those using SEM techniques to thoroughly consider thenature of the relationship between a construct and its indicators before movinginto the analysis. Ultimately, whether a reflective or formative approach is mostappropriate is a conceptual question that very much depends on having a goodtheoretical understanding of the measure being used.
Multidimensional Constructs
Models where the latent variables include different dimensions of an overarchingconstruct can be examined very effectively using a second application of advanced
Dow
nloa
ded
by U
nive
rsiti
Put
ra M
alay
sia
At 2
1:15
08
June
201
5 (P
T)

324 LARRY J. WILLIAMS ET AL.
causal modeling methods. In management research, latent and manifest variablesare usually specified as shown inFig. 1, regardless of whether the latent variablesrefer to unidimensional or multidimensional constructs. When constructs areunidimensional and the indicators are reflective, the specification inFig. 1 isappropriate, provided the indicators of the construct are reflective rather thanformative. However, if the constructs are multidimensional, there are otheralternative models researchers can consider.
Edwards (2001)developed a framework for specifying and estimating mul-tidimensional constructs that considers: (a) the direction of the relationshipsbetween the multidimensional construct and its dimensions; and (b) whether themultidimensional construct is a cause or effect of other constructs within a largercausal model. When the relationships flow from the construct to its dimensions,the construct is termedsuperordinate, meaning that the construct is a generalentity that is manifested or reflected by the specific dimensions that serve as itsindicators. When the relationships flow from the dimensions to the construct,the construct is calledaggregate, meaning that the construct is a composite of itsdimensions. In that superordinate and aggregate constructs can be either causesor effects, four prototypical models can be developed. These models have alsobeen discussed byWilliams, Edwards and Vandenberg (2003), and we will nextpresent some relatively simple examples.
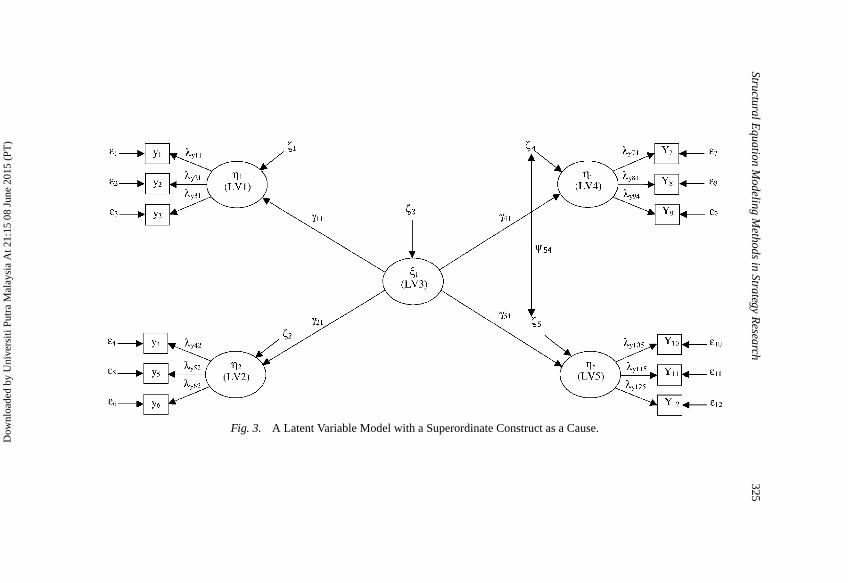
The first model contains a superordinate construct as a cause. This modelis illustrated inFig. 3, in which the multidimensional construct is LV3, thedimensions of the construct that are caused by the superordinate construct areLV1 and LV2, and the effects of the superordinate construct are LV4 and LV5.It is important to note that with this model the multidimensional construct(LV3) is not directly measured with indicators, and thus there are no boxesassociated with it. This model may include relationships among the effects of thesuperordinate construct, either through correlated residuals (as inFig. 3) or causalpaths between the effects of the construct. However, the model does not includerelationships among the dimensions of the multidimensional construct, since themodel proposes that the construct is the only source of covariation among itsdimensions. According to the model, there is no direct relationship between thedimensions and effects of the superordinate construct, and instead the dimensionsand effects both depend on the multidimensional construct.
The second model represents an aggregate construct as a cause. This model issimilar to the model shown inFig. 3, only the direction of the paths linking LV1 andLV2 with LV3 is reversed, so that LV1 and LV2 are proposed to cause LV3. Thus,in contrast to the superordinate cause model, the aggregate cause model containspaths leading from the dimensions to the aggregate construct. The covarianceamong the dimensions of the construct is freely estimated, since forces outside
Dow
nloa
ded
by U
nive
rsiti
Put
ra M
alay
sia
At 2
1:15
08
June
201
5 (P
T)
Stru
cturalE
quatio
nModelin
gMethodsin
Stra
tegyRese
arch
325
Fig. 3. A Latent Variable Model with a Superordinate Construct as a Cause.
Dow
nloa
ded
by U
nive
rsiti
Put
ra M
alay
sia
At 2
1:15
08
June
201
5 (P
T)

326 LARRY J. WILLIAMS ET AL.
the model cause this association. As before, the model specifies the relationshipsbetween the dimensions and effects of the constructs as indirect, such that thedimensions combine to produce the aggregate construct, which in turn influencesits effects.
The third model portrays a superordinate construct as an effect. This modelis closely related to the aggregate cause model just presented, in that bothmodels contain paths to and from the superordinate construct. However, in thesuperordinate effect model, the paths to the superordinate construct emanate fromcauses of the construct, and the paths from the superordinate construct are directedtoward the dimensions of the construct. Thus, the dimensions become endogenousvariables again (as inFig. 3), rather than serving as exogenous variables as in theaggregate cause model just presented. Because the construct is considered theonly source of covariation among its dimensions, the covariance of the residualsof the dimensions is fixed to zero. This model depicts the relationships betweenthe causes and dimensions of the superordinate construct as indirect, whereby thecauses influence the superordinate construct which in turn produces variation inits dimensions.
Finally, the fourth model specifies an aggregate construct as an effect. As in themodel that specifies that the superordinate construct is a cause, the dimensions ofthe construct are antecedents of the aggregate construct, and paths are includedfrom LV1 and LV2 to LV3.
The model includes covariances among the dimensions and among the causesof the construct as well as covariances between the dimensions and causes ofthe construct, given that all of these latent variables are exogenous. Whereasthe preceding three models specify the relationships between the dimension andcauses or effects of the construct as spurious or indirect effects, the aggregateeffect model implicitly specifies the relationships between the dimensions andcauses of the constructs as direct effects. These effects are collapsed into the pathsrelating the causes to relating the causes to each dimension of the construct.Strategy Applications. An example of a multidimensional construct that has
the potential to be cast as superordinate is provided byBaum, Locke and Smith’s(2001)study of the antecedents of venture growth. As part of their research, theysuggested that a CEO’s motivation would impact venture growth. Furthermore,they conceptualized CEO motivation as a superordinate construct with CEOvision, growth goals and self-efficacy as dimensions of motivation, each assessedby a multi-item scale. In this case, as a CEO’s motivation increases or decreases,so would their vision, growth goals and self-efficacy. Motivation, as a superor-dinate construct, could then be incorporated into a larger model investigating itsconsequences, as was the case with the Baum et al. study (venture growth) or itsantecedents.
Dow
nloa
ded
by U
nive
rsiti
Put
ra M
alay
sia
At 2
1:15
08
June
201
5 (P
T)

Structural Equation Modeling Methods in Strategy Research 327
Alternatively, a brief overview of the strategy literature can generate severalexamples of aggregate constructs. For example, a researcher may be interested inexamining the antecedents to and/or the consequences of social capital. However,social capital might be viewed as resulting from several lower-level dimensions,such as information volume, information diversity, and information richness (Koka& Prescott, 2002). With measured indicators of each of these three informationdimensions, attention would shift to the nature of the relationship between thethree information dimensions and social capital. In this context, social capitalis a result of each of information volume, information diversity and informationrichness. Increases in each of these yield higher levels of social capital. Withthe relationship between the observed measures, the lower-level informationdimensions and the social capital aggregate specified, one could embed this in alarger model with other latent variables capturing causes and/or effects of socialcapital.
Latent Growth Modeling
Another type of advanced application of latent variable techniques involvesdesigns with longitudinal data collection, in which the same indicators areavailable from multiple points in time, and where the interest is in change in alatent variable across time but the indicators do not directly address change. Mostlatent variable models focus on associations among or between static levels on thefocal variables, as represented by the paths between the latent variables inFig. 1.This approach has known limitations when it comes to unambiguously addressingquestions concerning actual change along the constructs of interest (Chan, 1998,2002; Chan & Schmitt, 2000; Collins & Sayer, 2001; Lance, Meade & Williamson,2000; Lance, Vandenberg & Self, 2000). Latent growth modeling (LGM), alsoreferred to as latent trajectory modeling (Chan & Schmitt, 2000; Lance, Meade &Williamson, 2000; Lance, Vandenberg & Self, 2000), provides an approach thatallows for assessing parameters that relate more directly to change than those ofa model likeFig. 1. An example that can be used to understand LGM is shownin Fig. 4, which is a simplified version of an example presented byWilliams,Edwards and Vandenberg (2003). In this model, LVT1, LVT2 and LVT3 representthe same latent variable at Time 1, Time 2, and Time 3, and the measures involvethe same indicators obtained from the same observational units at 3 equally spacedintervals in time. In this model, LV4 is modeled as a consequence of both theinitial status of the latent variable and change in this latent variable, both of whichare depicted as second-order factors that influence the latent variable at each ofthe three time points. Finally, since the data includes repeated measures of the
Dow
nloa
ded
by U
nive
rsiti
Put
ra M
alay
sia
At 2
1:15
08
June
201
5 (P
T)

328 LARRY J. WILLIAMS ET AL.
indicators, their disturbance terms are allowed to covary across time (e.g.�11 with�12 with �13, etc.) to account for any biases associated with autocorrelated error.
As described byWilliams, Edwards and Vandenberg (2003), several things areaccommplished by fixing the loadings of the 2nd-order initial status latent variableonto the 1st-order latent variables to 1, and the loadings of the change variable to0, 1 and 2 (see Fig. 9). This step locates the initial status latent variable at Time1, and the scale of time is captured by or defined through the 0, 1, and 2 valueson the loadings of the change latent variable. This pattern represents equallyspaced intervals, but if for some reason, the Time 3 data collection had occurred12 months after Time 2 (twice the interval length between Times 1 and 2), thepattern of fixed values would be 0, 1, and 3. Third, and perhaps most importantly,it identifies a trajectory of change for each observation in the database.Williams,Edwards and Vandenberg (2003)have noted that four types of potential trajectorieshave been suggested (seeDuncan et al., 1999, pp. 27–28 for more completedescriptions).
The model shown inFig. 4 can be better understood by considering theinterpretation of the key parameter estimates. As suggested byWilliams, Edwards
Fig. 4. A Latent Growth Model.
Dow
nloa
ded
by U
nive
rsiti
Put
ra M
alay
sia
At 2
1:15
08
June
201
5 (P
T)

Structural Equation Modeling Methods in Strategy Research 329
and Vandenberg (2003), in most instances the covariance between initial status andchange (�si) will be small and/or statistically non-significant, indicating that re-gardless of initial status on the latent variable, change occurred positively over time(given the fixed values for the paths coming from the slope/change latent variablewere positive and increased in value across time). A negative parameter estimatefor �4i, the path from the initial status second-order latent variable to LV4 wouldhave the same interpretation as typical when one is examining static levels of the fo-cal latent variable and its consequences. However, researchers are often interestedin a different question: does change in the latent variable (and not its initial status)influence the outcome latent variable (LV4)? If�4s, the path from the change vari-able to LV4 were statistically significant and negative, this would indicate that thegreater an observation’s rate of change on the latent variable across time (whichin this hypothetical case is increasing via the fixed values), the lower thevalues would be on LV4.Strategy applications. Latent growth modeling has the potential for many
applications in strategy research when repeated observations are collectedacross observational units. Consider changes in organizational performance overtime, where performance has the potential to be imperfectly measured and/orrepresented as a multidimensional construct. For example, a researcher mightcollect monthly performance measures for a period of one year for a numberof organizations. With organizational performance treated as a latent variable,growth trajectories could be generated for each organization and those growthtrajectories could show different forms. One could then model variation acrossorganizations in both the initial status of performance and the trajectory ofperformance over time and examine consequences of changes in performance.
Moderators and Latent Variable Relationships
Research in strategic management often investigates moderation. In these contexts,there is an interest in whether the strength of the relationship between an indepen-dent variable and a dependent variable depends on the level of a third variable,termed a moderator variable. In structural equation modeling, one technique oftenused for testing moderation involves creating subgroups based on a moderatorvariable and using multi-sample techniques. Although this approach works wellfor categorical moderator variables (e.g. gender, race), it is problematic that manymoderator variables are continuous. To address this problem, researchers have de-veloped structural equation modeling procedures that are analogous to moderatedregression analysis. These procedures date back to the seminal work ofKennyand Judd (1984), and more contemporary developments are reflected byJaccard
Dow
nloa
ded
by U
nive
rsiti
Put
ra M
alay
sia
At 2
1:15
08
June
201
5 (P
T)

330 LARRY J. WILLIAMS ET AL.
and Wan (1995), who emphasized non-linear constraints in LISREL 8 (Joreskog& Sorbom, 1996), andJoreskog and Yang (1996), who advocated the inclusionof intercepts in measurement and structural equations and means of observedand latent variables. Additional approaches for testing moderation in structuralequation models have been developed byPing (1995, 1996)and Bollen andPaxton (1998).
A recent review byCortina, Chen and Dunlap (2001)concluded that moderatedstructural equation models present several major challenges, including thequestion of how a researcher chooses indicators to represent the latent productterm.Cortina et al. (2001)reviewed and empirically evaluated various strategiesfor this type of analysis, ranging from using all possible pairwise products of themain effect indicators to using a single product indicator based on one or more ofthe main effect indicators. Based on their review,Cortina et al. (2001)recommendan approach that is relatively simple to implement and easy to understand forstrategic management researchers.
To illustrate this approach, consider the model shown inFig. 5, which shows thateach latent variable has a single indicator that is a scale constructed by summingthe indicators used to measure the latent variable and standardizing the sum. Also,assume that LV3 signifies the product of LV1 and LV2 (i.e. LV1× LV2) and hasa single indicator formed by multiplying the standardized indicators of LV1 andLV2. With one indicator for each latent variable, the measurement parameters(i.e. factor loadings and error variances) are not identified and must be fixed toprespecified values. Based on classic measurement theory, these values can bederived from estimates of the measurement error (e.g. coefficient alpha) for eachscale. As discussed by Cortina et al., for LV1 and LV2 the factor loading is setequal the square root of the reliability of the scale, and the measurement errorvariance is set equal to one minus the reliability of the scale multiplied by thevariance of the scale. For LV3, the reliability of the product term can be computedfrom the correlation between LV1 and LV2 and the reliabilities of their indicators(Bohrnstedt & Marwell, 1978), and this quantity can be used to fix the loadingand error variance for the product indicator. Once these measurement parametershave been fixed, the test of the interaction between LV1 and LV2 is conductedby comparing a model that includes a path from the LV3 product latent variableto an endogenous variable (e.g. LV4) to a model that excludes this path usinga chi-square difference test.
As discussed byCortina et al. (2001), the form of the interaction betweenLV1 and LV2 can be determined by applying procedures based on those usedin moderated regression analysis. For example, techniques for testing simpleslopes (Aiken & West, 1991) can be adapted to test the relationship between LV1and LV4 at specific values of LV2, such as one standard deviation above and
Dow
nloa
ded
by U
nive
rsiti
Put
ra M
alay
sia
At 2
1:15
08
June
201
5 (P
T)

Stru
cturalE
quatio
nModelin
gMethodsin
Stra
tegyRese
arch
331
Fig. 5. A Single Indicator Latent Variable Model for Examining a Moderated Relationship.
Dow
nloa
ded
by U
nive
rsiti
Put
ra M
alay
sia
At 2
1:15
08
June
201
5 (P
T)

332 LARRY J. WILLIAMS ET AL.
below its mean (Edwards & Kim, 2002). Williams, Edwards and Vandenberg(2003)have described how simple slopes can be computed from weighted linearcombinations of the parameters linking LV1 and LV3 to LV4 (i.e.�11 and�13)and tested using the additional parameters feature of LISREL 8. As discussed byWilliams, Edwards and Vandenberg (2003), values of LV2 at which to test therelationship between LV1 and LV4 can be chosen based on the scale for LV2,and it is convenient to standardize both LV1 and LV2 by fixing the measurementparameters as described above and setting the means of LV1 and LV2 to zerousing the kappa matrix of LISREL.Williams, Edwards and Vandenberg (2003)also mention that under this specification, LV3 isnot standardized because themean and variance of the product of two standardized variables is usually differentfrom zero and one, respectively (Bohrnstedt & Goldberger, 1969).
Strategy applications. Strategy researchers are quite often interested ininteraction effects, with the relationship between two latent variables beingdependent on the level of some third variable, be it a categorical or a continuousmoderator.Steensma and Corley (2000)provide an example of a moderatorthat could be categorized and analyzed within the context of multiple groupSEM. They examined the relationship between various technology attributes (e.g.uniqueness, imitability, etc.) and sourcing performance (treated as a second-orderfactor) in technology sourcing partnerships, hypothesizing that the magnitudeof the relationship would be dependent on partner interdependence as assessedby such markers as licensing. Here, licensing was dichotomized such that apartnership could be characterized by licensing or not. The relationship betweenthe technology attributes and performance, which could easily be cast as latentvariables in an SEM analysis, could then be examined within the two groups, onein which the partnerships were based on licensing and the other in which theywere not.
For contexts in which the moderator is of a continuous nature, consider therelationship between international asset dispersion, country environment diversity,and the economic performance of a multinational enterprise (Goerzen & Beamish,2003). Goerzen and Beamish (2003)hypothesized and found that the relationshipbetween international asset dispersion (IAD) and economic performance willbe dependent on country environment diversity (CED). Both the independentvariable IAD and the moderator CED could be considered latent and continuous.They found that performance was low under conditions of high CED and lowIAD, but that performance was enhanced under conditions of high CED and highIAD. While the authors chose to utilize an approach different from continuouslymoderated SEM with latent variables, the interaction between the two latentvariables could have been investigated using one of the recently developed SEMlatent variable interaction approaches described above.
Dow
nloa
ded
by U
nive
rsiti
Put
ra M
alay
sia
At 2
1:15
08
June
201
5 (P
T)

Structural Equation Modeling Methods in Strategy Research 333
Analysis of Latent Variable Means
Another area of advanced applications of SEM involves models that incorporateinformation from the means of the indicators (the intercepts) and include pa-rameters representing the means of the latent variables. Interest in latent variablemeans can be traced back over 20 years, but applications of these models havebeen infrequent for reasons discussed byHayduk (1987)and more recently byWilliams, Edwards and Vandenberg (2003). Williams et al. noted that statisticalsoftware programs now accommodate models with latent variable means, andthere are three types of research designs for which the inclusion of these means canbe an important part of the analysis: (a) within a measurement invariance context;(b) within LGM; and (c) extending SEM to the analysis of experimental data.
Measurement invariance research focuses on questions related to the equalityof measurement parameters in data obtained from multiple groups, and as suchthe equality of factor loadings, error variances, and factor covariances is typicallyexamined (seeVandenberg & Lance, 2000). However, as noted byWilliams,Edwards and Vandenberg (2003)some researchers have also included in the invari-ance analyses models that test the equality of factor means to test for differencesbetween groups in the level on the construct of interest. Within this context, forexample, one could constrain all of the latent variable means as equivalent betweengroups, and subsequently, compare this model to an alternative, baseline model thatallows the means to be freely estimated within each group. If constraining the latentvariable means to be equal across groups results in a significant worsening of fit rel-ative to the baseline model, the conclusion is that the equality constraints are unten-able and that differences exist in latent means between the two groups.Vandenbergand Lance (2000)also noted that researchers should begin with an omnibus ap-proach that constrains means for all latent variables, and if overall differences existfollow up analyses should investigate which particular latent variable means aredifferent As discussed byVandenberg and Lance (2000)and byWilliams, Edwardsand Vandenberg (2003), analyses with latent variable means allow researchersto test for mean differences while accounting for differences due to a lack ofmeasurement equivalence and while accounting for effects of measurement error.
Williams, Edwards and Vandenberg (2003)have reported that the second designin which the analysis of latent variable means has occurred is within latent growthmodeling.Chan (1998)has presented an integrative approach for longitudinaldesigns with data from the same sample of observations obtained repeatedlyover a few time waves. Chan refers to his approach as LMACS-MLGM, and inthe first of two phases measurement invariance is examined by tests involvingfactor loadings and error variances. However, the Phase 1 analysis also includesexamining the changes in latent variable means over time, which is why it is
Dow
nloa
ded
by U
nive
rsiti
Put
ra M
alay
sia
At 2
1:15
08
June
201
5 (P
T)

334 LARRY J. WILLIAMS ET AL.
referred to as LMACS (longitudinal mean and covariance structure analysis).This is treated as an exploratory step that informs the specification of the latentgrowth models (MLGM) in Phase 2.
The third area of activity related to latent variable means emphasizes the analysisof experimental data. As reviewed byWilliams, Edwards and Vandenberg (2003),Ployhart and Oswald (2003)discuss the advantages of analysis of latent variablemeans, as compared to traditional approaches involvingt-tests or ANOVAs ongroup means. Ployhart and Oswald present a sequence of model comparisons thatbegins with a series of models for tests of invariance (as discussed in the previoussection), and then progresses to include tests of equality of item intercepts and thenequality of latent means. The approach for testing latent variable means discussedby Ployhart and Oswald provides for pairwise comparisons, omnibus tests ofoverall latent mean differences, and tests that parallel ANOVA with constrasts.Examples of latent mean analysis involving data from three independent groupsand data from two independent groups with two repeated measures were presentedby Ployhart and Oswald, and they also discuss potential problems with latentmean analysis, such as larger sample size requirements (relative to traditionalapproaches), the required assumption of multivariate normality, and difficultieswhen the number of groups increases to greater than five. Finally,McDonald,Seifert, Lorenzet, Givens and Jaccard (2002)have investigated the use of latentvariables with multivariate factorial data. McDonald et al. compared ANOVA,MANOVA, and multiple indicator latent variable analytical techniques using asimulation approach. As summarized byWilliams, Edwards and Vandenberg(2003), McDonald et al. recommend that a multiple indicator latent variableapproach is best when a covariate accounts for variance in the dependent variables,measures are unreliable, and there is a large sample.Strategy applications. Potential applications of latent variable mean models in
strategy research involves studies where means were compared across groups onconstructs that could be cast as latent variables (but were instead examined as scalescores that are less than perfectly reliable).Busenitz, Gomez and Spencer (2000)developed and tested a multidimensional measure of country institutional profilesfor entrepreneurship with regulatory, cognitive and normative dimensions. Each ofthese dimensions was assessed with multiple items. CFA was then used to examineand support the three factor structure. Scale scores were then calculated for eachof these dimensions, and the means on these scale scores were compared acrossrespondents from six different countries using ANOVA. Alternatively, the re-searchers might have accounted for the measurement error in these scale scores byrepresenting each construct as a latent variable and comparing these latent means.
Along similar lines,Robertson, Gilley and Street (2003)examined, amongother things, differences in willingness to sacrifice ethics for financial gains across
Dow
nloa
ded
by U
nive
rsiti
Put
ra M
alay
sia
At 2
1:15
08
June
201
5 (P
T)

Structural Equation Modeling Methods in Strategy Research 335
U.S. and Russian employees. Willingness to sacrifice ethics for financial gainswas assessed with a multi-item scale. While this study usedt-tests to comparescale scores on the construct of interest across the two samples, an alternativeapproach would be to represent the willingness to sacrifice ethics as a latentvariable and then compare latent means across the two samples. In both of thesestudies, the researchers could have used the latent means approach to: (1) helpinvestigate the equivalence of the measures across countries; and (2) comparemeans while taking into account measurement error.
CURRENT TECHNICAL ISSUES
Thus far in this chapter we have provided an introduction to latent variablestructural equation techniques, given an overview of recent applications of thismethodology to strategic management research, and described several advancedapplications of this technique with great potential for strategy researchers. In thisfinal section we will describe three general areas where quantitative methodolo-gists are investigating and refining recommendations for practices that researchersshould follow in implementing analyses using structural equation methods. Thesethree areas relate to model evaluation, tests for mediation, and data requirements.
Model Evaluation
As noted earlier, researchers using structural equation techniques must confrontthe question as to whether a particular model provides a good fit to the data, wherethis fit reflects the difference between the sample covariance matrix used in theanalysis and one that is predicted based on the obtained parameter estimates. Itwas also noted that goodness of fit measures are used in this process, and thatmodel comparisons based on a chi-square difference test can be implemented ifmodels are nested. Regarding the goodness of fit measures, recent years have seena proliferation in the number and types of such measures that are available (e.g.Medsker, Williams & Holahan, 1994), nearly all of which are provided by extantsoftware programs. Clearly these measures are critical for researchers, who mustshow that the values for their model(s) are favorable when compared to availablebenchmark standards.
Unfortunately, these indices suffer from many limitations.McDonald andHo (2002)have discussed this issue and note several problems, but for now wefocus on what we see as the most critical problem. Goodness of fit measures,regardless of whether they are an absolute index or a relative index that assesses
Dow
nloa
ded
by U
nive
rsiti
Put
ra M
alay
sia
At 2
1:15
08
June
201
5 (P
T)

336 LARRY J. WILLIAMS ET AL.
a model in comparison to some type of null model, summarize theoverallfit andthe overall degree of difference between the sample and predicted covariancematrices. However, as described byMcDonald and Ho (2002)misfit in a model“can be due to a general scatter of discrepancies not associated with any particularmisspecification,” or it “can originate from a correctable misspecification givinga few large discrepancies” (p. 72). The situation is additionally complicated bythe fact that a latent variable model includes both a measurement component(that links the factors to their indicators) and a structural component (that depictsthe relationships among the latent variables), and as such the model represents acomposite hypothesis involving both components. As noted byMcDonald and Ho(2002), “it is impossible to determine which aspects of the composite hypothesiscan be considered acceptable from the fit indices alone” (p. 72).
This ambiguity associated with global fit indices suggests it might be importantto determine what part of any model misfit is due to problems with the measure-ment vs. the structural part of the model. It is possible that problems with themeasurement component can lead to inadequate fit values when the structuralcomponent is adequate, or that a measurement model can be adequate and leadto acceptable fit values, when the structural component is actually flawed. Toinvestigate these possibilities,McDonald and Ho (2002)used information from14 published studies (non-centrality parameters, of which current fit indices are afunction) to decompose values for overall fit into components associated with themeasurement and structural models. They concluded that in all but a few casesthe overall fit values of the composite model (with both components) concealsthe badness of fit of the structural model, and that once measurement modelinformation is taken into account the goodness of the structural component maybe unacceptable, “contrary to the published conclusions” (p. 74).
While this demonstration byMcDonald and Ho (2002)is compelling, otherswere previously aware of this problem. BothMulaik et al. (1989)andWilliamsand Holahan (1994)have developed fit indices that isolate measurement andstructural components of a composite model, and strategy researchers may wantto consider reporting values for these so that the adequacy of both components canbe determined. McDonald and Ho also have proposed a supplementary two-stageprocedure in which a confirmatory factor analysis for the measurement modelyields a set of factor correlations that are then used as input into the evaluationof the structural component. With this process, the fit values for this second stepassessment of the structural model are not contaminated by the measurementpart of the model. Finally, McDonald and Ho also recommend examining: (a) thestandardized discrepancies (residuals) for the measurement model to determinewhich covariances among the indicator variables are adequately accounted for;and (b) the residuals representing the difference between the factor correlations
Dow
nloa
ded
by U
nive
rsiti
Put
ra M
alay
sia
At 2
1:15
08
June
201
5 (P
T)

Structural Equation Modeling Methods in Strategy Research 337
from the measurement model and the predicted correlations from the second stepof their analysis process. This approach will provide more information about therelative adequacy of both the measurement and structural components, and it willshow specifically which parts of both models are consistent with the sample data.
Tests for Mediation
Another area in which methodologists are conducting research relevant tostrategic management users of structural equation techniques involves proceduresfor testing mediational hypotheses. The previously discussed model inFig. 1includes mediation, in that the two exogenous variables (LV1, LV2) are proposedto influence LV4 both directly via the paths�21, �22 and indirectly through theintervening or mediator variable LV3 (�11, �12). The total effects of the twoexogenous variables on LV4 is the sum of the direct and indirect effects. In manyinstances researchers are interested in whether there is partial mediation, as shownin Fig. 1, where both direct and indirect effects are present, as compared to fullmediation, in which all of the influence of the exogenous variables is channeledthrough the mediator. For full mediation, the direct effects are not included in themodel, and the significance of the indirect effects is of great importance.
Over the years many techniques for testing the significance of interveningvariable effects have been developed and used.MacKinnon, Lockwood, Hoffman,West, and Sheets (2002)have recently provided a comparison of these methods,and their results are relevant for strategy researchers. MacKinnon et al. beganwith a review of the literature that revealed that 14 different methods from avariety of disciplines have been proposed for use with path models that includeintervening variables. While it is beyond the present purpose to provide detailson all 14 methods, these techniques did fall into three main categories: (a) thosethat involve statistical tests of the three causal paths involved in the mediation,including the two paths associated with the indirect effects and the path associatedwith the direct effect; (b) those that involve examining the difference between thevalue for the direct path from a model with the mediator and the value of the directpath from a model without the indirect effects; and (c) those that involve tests ofthe product of the coefficients involved in the indirect effects. It should be notedthat one of the techniques in the third category involves testing the significance ofthe product of the coefficients using a standard error estimate developed bySobel(1982), and this approach is used in tests of indirect effects in software programsused in latent variable structural equation applications (e.g. LISREL, EQS).
MacKinnon et al. (2002)conducted an extensive simulation study to provideinformation about the statistical performance of the 14 tests used in mediational
Dow
nloa
ded
by U
nive
rsiti
Put
ra M
alay
sia
At 2
1:15
08
June
201
5 (P
T)
338 LARRY J. WILLIAMS ET AL.
contexts. Their goal was to compare the Type I error rate and the statistical powerof the tests. The Type I error rate was calculated as the proportion of replications inwhich the null hypotheses that the two paths involved in the mediation relationshipwere zero were rejected, using data based on a model in which these paths wereactually zero. The mediating effect would be expected to be significant 5% of thetime in this situation, given a 0.05 significance level. The statistical power wascalculated as the proportion of cases in which the null hypotheses were rejected,using data based on a model in which the paths were actually significant.
MacKinnon et al. (2002)found that in general the widely used method ofBaronand Kenny (1986), an example of the first category of tests had very low TypeI error rates and very low power unless the effect or sample size was very large.Specifically, the results indicated that with small effects the power was 0.106,even with a sample size of 1000, while with moderate effects the power was 0.49with a sample size of 200. Thus, MacKinnon et al. concluded that studies usingthis approach was most likely to miss real effects as compared to other techniques.
Data Requirements
Those interested in applying SEM techniques to strategy research will need to beaware that these techniques carry several requirements in terms of the propertiesof the data being analyzed. While not an exhaustive list, some of the more salientissues include sample size, normality of the distribution, and missing data.
Sample size requirements are often considered to be straightforward. Mostcommon are recommendations or rules-of-thumb that focus on some minimumthreshold for implementing SEM. Depending on the source, such minimums arethought to be 100, 200, or even more subjects (Boomsma, 1982; Marsh, Balla &McDonald, 1988). The reasoning behind such guidelines is appealing. Maximumlikelihood is an asymptotic estimator, which means large samples are requiredfor stable, consistent estimates. With this mind, researchers and consumers ofresearch have been leery of SEM applications when the numbers of observationsdip below these recommended thresholds.
More recent work suggests that the sample size issue is a little more complex.Noting that the addition of a single observed variable can add several estimatedparameters to a model, it appears that one must consider the complexity of themodel when determining an appropriate sample size such that as models becomemore complex with more parameters being estimated, sample size requirementsgo up (Cudek & Henly, 1991). Along these lines, other rules-of-thumb havebeen offered up suggesting minimum sample size to estimated parameter ratios(e.g. 5:1 as perBentler & Chou, 1987). Whether one strictly adheres to the
Dow
nloa
ded
by U
nive
rsiti
Put
ra M
alay
sia
At 2
1:15
08
June
201
5 (P
T)

Structural Equation Modeling Methods in Strategy Research 339
rule-of-thumb or not, the model complexity generates a simple recommendation.If one is interested in a complex model with many parameters, one will need alarge sample. With smaller samples, less complex models with fewer estimatedparameters should be considered.
Of course, when addressing issues of sample size, one must be concerned withpower issues associated with the overall model fit tests (e.g. chi-square and otherderived fit indices) and the significance tests associated with specific estimatedparameters contained within the model, and many of the above-mentioned studiesas well as those that have followed have either implicitly or explicitly dealt withthe power issue. Researchers looking to analyze SEMs, especially where samplesize is a concern, would be well advised to consider such issues before analyzingtheir models, if not before collecting their data. There are several sources availableon the topic, butMacCallum, Browne and Sugawara (1996)provides a fairlycomprehensive treatment and a good starting point. In fact, a quick internet searchwill likely uncover several programs and code available for conducting the poweranalyses suggested inMacCallum et al. (1996).
Taken as a whole, one is left with several observations concerning sample size.First, decisions about the appropriate sample size should not focus on absolutethresholds while ignoring the complexity of the model. Second, and consistent withmany statistically techniques, more is generally better when it comes to samplesize. Third, and also consistent with recommendations surrounding the use of otherstatistical techniques, it may be worthwhile to conduct a power analysis, preferablya priori, to help determine a target sample size given the model of interest.
The use of SEM with maximum likelihood estimation carries an assumptionof univariate and multivariate normality. Recent work shows that such fit indicesand standard errors, among other model parameters, are fairly robust to small de-partures from multivariate normality. However, where these departures start to getlarge, corrective measures have been investigated, and sometimes proposed. Thisis a rapidly developing literature, and it is difficult to isolate any recommendationsthat enjoy wide-spread consensus, but potential corrections for non normalityhave been offered on everything from the fit indices and standard errors (e.g.Nevitt & Hancock, 2000; Satorra & Bentler, 1994, 2001) to the type of covariancematrix being analyzed and the estimator (i.e. other than maximum likelihood)utilized (e.g.Olsson, Foss, Troye & Howell, 2000; West, Finch & Curran, 1995).
With regard to latter suggestion, in typical applications of SEM, researchersuse the standard covariance matrix. In situations where the observed variablesare continuous and the assumption of multivariate normality is satisfied (orwith small departures from it), this is a reasonable course of action. However,strategy researchers may be interested in analyzing SEMs that include measuredvariables that are either: (1) theoretically continuously distributed but with
Dow
nloa
ded
by U
nive
rsiti
Put
ra M
alay
sia
At 2
1:15
08
June
201
5 (P
T)

340 LARRY J. WILLIAMS ET AL.
appreciable departures from normality; and/or (2) categorical in nature, whichwill yield departures from normality. If the second case is at issue and thecategorically measured variables are associated with latent endogenous (outcome)variables, one must determine whether a continuous distribution underlies thelatent variable. Where that assumption is tenable, most SEM programs allowfor the calculation and analyzing of polychoric correlations and an asymptoticcovariance matrix, which correct for the deviations from multivariate normalitythat categorical variables generate. The major drawback is that such correctionsand the generation of these alternative matrices can require large sample sizes, andin the context of even a moderately complex model, this can mean a sample sizein the thousands.
Alternatively, when it is determined that not only the measured variable but thelatent endogenous (outcome) variable associated with it is truly categorical, thenSEM is an inappropriate analytical technique. To use it would be akin to runningOLS regression on a categorical (e.g. dichotomous) outcome. Rather than SEMin this case, the appropriate analytical technique is latent class analysis (e.g.Clogg, 1995; McCutcheon, 1994). And as a further development, one may wishto look into the work ofMuthen (2001)when a model of interest contains bothcontinuous and categorical latent variables. For such models, Muthen introduceslatent variable mixture modeling, a combination of both latent variable modelingand latent class analysis.
As a starting point for any researcher, prior to moving into the SEM analysis,the multivariate normality assumption should be checked. Where there aredepartures from it, results can be affected and so options for dealing with itmight be considered. However, there is still ambiguity about the benefits of suchcorrections. The best advice here is to stay on top of the literature and recognizethe tradeoffs involved with different corrective actions for non-normality.
Like accounting for departures from normality, missing data is a topic thathas been receiving considerable attention lately within the SEM literature.Traditionally, the two most common options for dealing with missing data includepairwise and listwise deletion. Of the two, where SEM is concerned, listwiseis the preferred method. SEM requires that a sample size be associated withthe covariance matrix being analyzed, and that sample size should be consistentacross every element of the covariance matrix. Pairwise deletion yields situationswhere the sample size can differ across these elements and this can generateproblems with model estimation (e.g. non positive definite matrices). Listwisedeletion avoids this problem but carries with it the potential to lose a large numberof observations depending on the amount and pattern of missing data. In additionto pairwise and listwise deletion, mean replacement is another commonly usedtechnique, where missing data points can be replaced either within subjects (where
Dow
nloa
ded
by U
nive
rsiti
Put
ra M
alay
sia
At 2
1:15
08
June
201
5 (P
T)

Structural Equation Modeling Methods in Strategy Research 341
there is a missing data point on an item from a multiple item scale) or betweensubjects (substituting the sample mean for a missing data point on an item).
However, more recent research is finding little to recommend pairwise, listwiseor mean replacement techniques except under very infrequent circumstances (e.g.Schafer & Graham, 2002). In recent years, more sophisticated options for dealingwith missing data have been introduced and they are becoming more accessible tosubstantive researchers. These newer alternatives include hot-deck imputation, fullinformation maximum likelihood and Bayesian multiple imputation, among others.These techniques use the information in the data set, in the form of the variables forwhich data are available, to predict what values missing data points should take on.Which of the techniques is most favorable will depend on a variety of conditionsincluding, but not limited to, the amount of missing data and the pattern of missingdate (e.g. missing completely at random, missing at random, etc.).
This is both an emerging and rapidly growing literature, and widely agreedupon recommendations are not yet in place. But a good starting point and reviewis offered bySchafer and Graham (2002). What is important to note is thatresearchers now have a wider range of and better options for dealing with missingdata than in past years, and these options can be invoked using specializedmissing data software, a general statistical package (e.g. SPSS) prior to usingSEM software or, in many cases, in the SEM software itself. Where researchersface missing data, these options are worth investigating.
On a closing note with regard to data requirements, it is worth noting thatthe three issues presented here (sample size, normality and violations of it, andmissing data) are often examined jointly in the same simulation study (e.g.Enders, 2001), thus adding both to the complexity of the issues and the richness ofthe developments in SEM research. If it has not yet become apparent, we wouldargue that while SEM does represent a very powerful analytical approach, it doestake some effort to stay atop of developments in SEM and use it appropriately.
CONCLUSIONS
In this chapter we began by documenting the increased frequency of use of struc-tural equation techniques by strategy researchers. After providing a brief intro-duction of this method, we reviewed strategy applications, with an eye on bothtechnical aspects of this work as well as the content areas reflected in this work.We next introduced five types of advanced applications being used in other areasof management that have great potential for strategy researchers, and finally wegave a brief overview of three areas where technical developments are occurringthat strategy researchers should be aware of.
Dow
nloa
ded
by U
nive
rsiti
Put
ra M
alay
sia
At 2
1:15
08
June
201
5 (P
T)

342 LARRY J. WILLIAMS ET AL.
Table 2. Summary of Recommendations for Strategic ManagementResearchers.
(1) Consider direction of relationship between latent variables and their indicators, and useformative approach if appropriate.
(2) If working with multidimensional constructs, consider the direction of their relationships withtheir dimensions and choose appropriate superordinate or aggregate model.
(3) If working with longitudinal data, consider the use of latent growth models to investigatedynamic nature of change.
(4) If investigating moderators that are continuous in nature, consider the single indicatorapproach.
(5) Consider the use of latent variables when interested in variable means (as compared tocovariances).
(6) When assessing the fit of a latent variable model, examine the fit of both its measurement andstructural components.
(7) If testing for mediation, beware of low power of tests common to SEM packages.(8) When deciding on a sample size needed for SEM analyses, consider the complexity of the
model.(9) Check for violation of assumption of multivariate normality, and if this is a problem
investigate the most current recommended strategy.(10) If missing data is a problem, consider the latest approaches available in SEM software.
Strategy researchers typically work with non-experimental data while testingtheories using measures that are likely to contain error. Thus, structural equationmethods are likely only to increase in frequency of use in this domain. This can beseen as a very positive development, because this technique is very powerful in theinferences that it allows. We hope that this chapter will stimulate the frequency,quality, and breadth of this future work. Based on the material in this chapter, wemake 10 recommendations that strategic management researchers should consideras they apply SEM techniques to their data. These recommendations are presentedin Table 2and relate to measurement issues, longitudinal data, moderation andmediation, the study of means, and assessment of fit, as well as data concernsrelated to sample size requirements, distributional assumptions, and missingdata. We hope that future SEM applications on strategic management topics willconsider these recommendations, so that the full potential of this methodology willbe realized.
ACKNOWLEDGMENTS
The authors would like to thank David Ketchen for his helpful feedback duringthe development of this chapter.
Dow
nloa
ded
by U
nive
rsiti
Put
ra M
alay
sia
At 2
1:15
08
June
201
5 (P
T)

Structural Equation Modeling Methods in Strategy Research 343
REFERENCES
Aiken, L. S., & West, S. G. (1991). Multiple Regression: Testing and interpreting interactions.Newbury Park, CA: Sage.
Andersson, U., Forsgren, M., & Holm, U. (2002). The strategic impact of external networks: Sub-sidiary performance and competence development in the multinational corporation.StrategicManagement Journal, 23, 979–996.
Baron, R. M., & Kenny, D. A. (1986). The moderator-mediator variable distinction in social psycho-logical research: Conceptual, strategic, and statistical considerations.Journal of Personalityand Social Psychology, 51, 1173–1182.
Baum, J. R., Locke, E. A., & Smith, K. G. (2001). A multidimensional model of venture growth.Academy of Management Journal, 44, 292–303.
Baum, J. R., & Wally, S. (2003). Strategic decision speed and firm performance.Strategic ManagementJournal, 24, 1107–1129.
Bentler, P. (1990). Comparative fit indices in structural equation models.Psychological Bulletin, 107,238–246.
Bentler, P. M., & Chou, C. P. (1987). Practical issues in structural modeling.Sociological/Methodsand Research, 16, 78–117.
Bohrnstedt, G. W., & Goldberger, A. S. (1969). On the exact covariance of products of randomvariables.Journal of the American Statistical Association, 64, 1439–1442.
Bohrnstedt, G. W., & Marwell, G. (1978). The reliability of products of two random variables. In K. F.Schuessler (Ed.),Sociological Methodology 1978(pp. 254–273). San Francisco: Jossey-Bass.
Bollen, K. A., & Davis, W. R. (1994). Causal indicator models: Identification, estimation, and testing.Paper presented at the 1993 American Sociological Association Convention, Miami, FL.
Bollen, K., & Lennox, R. (1991). Conventional wisdom on measurement: A structural equationperspective.Psychological Bulletin, 110, 305–314.
Bollen, K. A., & Paxton, P. (1998). Interactions of Latent Variables in Structural Equation Models.Structural Equation Modaling, 5, 267–293.
Boomsma, A. (1982). The robustness of LISREL against small sample sizes in factor analysis models.In: K. G. Joreskog & H. Wold (Eds),Systems Under Indirect Observation: Causality, Structureand Prediction(Part 1). Amsterdam: North Holland.
Busenitz, L. W., Gomez, C., & Spencer, J. W. (2000). Country institutional profiles: Unlockingentrepreneurial phenomena.Academy of Management Journal, 43, 994–1003.
Chan, D. (1998). The conceptualization and analysis of change over time: An integrative approachincorporating longitudinal means and covariance structures analysis (LMACS) and multipleindicator latent growth modeling (MLGM).Organizational Research Methods, 1, 421–483.
Chan, D. (2002). Latent growth modeling. In: F. Drasgow & N. Schmitt (Eds),Measuring and Ana-lyzing Behavior in Organizations: Advances in Measurement and Data Analysis(pp. 302–349,Volume in theOrganizational Frontier Series). San Francisco: Jossey-Bass.
Chan, D., & Schmitt, N. (2000). Interindividual differences in intraindividual changes in proactivityduring organizational entry: A latent growth modeling approach to understanding newcomeradaptation.Journal of Applied Psychology, 85, 190–210.
Clogg, C. C. (1995). Latent class models. In: G. Arminger, C. C. Clogg & M. E. Sobel (Eds),Handbook of Statistical Modeling for the Social and Behavioral Sciences. New York: Plenum.
Collins, L. M., & Sayer, A. G. (2001).Newmethods for the analysis of change. Washington, DC: APA.Cortina, J. M., Chen, G., & Dunlap, W. P. (2001). Testing interaction effects in LISREL: Examination
and illustration of available procedures.Organizational Research Methods, 4, 324–360.
Dow
nloa
ded
by U
nive
rsiti
Put
ra M
alay
sia
At 2
1:15
08
June
201
5 (P
T)

344 LARRY J. WILLIAMS ET AL.
Cudek, R., & Henly, S. J. (1991). Model selection in covariance structure analysis and the “problem”of sample size: A clarification.Psychological Bulletin, 109, 512–519.
Diamantopoulos, A., & Winklhofer, H. M. (2001). Index construction with formative indicators: Analternative to scale development.Journal of Marketing Research, 38, 269–277.
Dooley, R. S., Fryxell, G. E., & Judge, W. Q. (2000). Belaboring the not-so-obvious: Consensus,commitment, and strategy implementation speed and success.Journal of Management, 26,1237–1257.
Duncan, T. E., Duncan, S. C., Strycker, L. A., Li, F., & Alpert, A. (1999).An introduction to latentvariablegrowthmodeling:Concepts, issuesandapplications. Mahwah, NJ: Lawrence Erlbaum.
Edwards, J. R. (2001). Multidimensional constructs in organizational behavior research: An integrativeanalytical framework.Organizational Research Methods, 4, 144–192.
Edwards, J. R., & Bagozzi, R. P. (2000). On the nature and direction of the relationship betweenconstructs and measures.Psychological Methods, 5, 155–174.
Edwards, J. R., & Kim, T. Y. (2002). Moderation in structural equation modeling: Specification,estimation, and interpretation using quadratic structural equations. Paper presented at the 18thAnnual Meeting of the Society of Industrial and Organizational Psychology, Toronto, Ontario,April, 2002.
Eisenhart, K. M. (1989). Making fast strategic decisions in high-velocity environments.Academy ofManagement Journal, 27, 299–343.
Enders, C. K. (2001). The impact of non-normality on full information maximum-likelihood estimationfor structural equation models with missing data.Psychological Methods, 6, 352–370.
Farh, J., Hoffman, R. C., & Hegarty, W. H. (1984). Assessing environmental scanning at the subunitlevel: A multitrait-multimethod analysis.Decision Sciences, 15, 197–219.
Fornell, C., & Bookstein, F. L. (1982). Two structural equation models: LISREL and PLS applied toconsumer exit-voice theory.Journal of Marketing Research, 19, 440–452.
Geletkanycz, M. A., Boyd, B. K., & Finkelstein, S. (2001). The strategic value of CEO externaldirectorate networks: Implications for CEO compensation.Strategic Management Journal,22, 889–898.
Gerbing, D. A., & Anderson, J. C. (1992). Monte Carlo evaluations of goodness of fit indices forstructural equation models.Sociological Methods and Research, 21, 132–160.
Goerzen, A., & Beamish, P. W. (2003). Geographic scope and multinational enterprise performance.Strategic Management Journal, 24, 1289–1306.
Hauser, R. M., & Goldberger, A. S. (1971). The treatment of unobservable variables in path analysis. In:H. L. Costner (Ed.),Sociological Methodology 1971(pp. 81–117). San Francisco: Jossey-Bass.
Hayduk, L. (1987).Structural equation modeling with LISREL essentials and advances. Baltimore,MD: Johns Hopkins University Press.
Hoskisson, R. E., Hill, M. A., Johnson, R. A., & Grossman, W. (2002). Conflicting voices: The effectsof institutional ownership heterogeneity and internal governance on corporate innovationstrategies.Academy of Management Journal, 45, 697–717.
Jaccard, J., & Wan, C. K. (1995). Measurement error in the analysis of interaction effects betweencontinuous predictors using multiple regression: Multiple indicator and structural equationapproaches.Psychological Bulletin, 117, 348–357.
Joreskog, K. G., & Sorbom, D. (1996).LISREL 8: User’s reference guide. Chicago, IL: ScientificSoftware International.
Joreskog, K. G., & Yang, F. (1996). Nonlinear structural equation models: The Kenny-Judd model withinteraction effects. In: G. A. Marcoulides & R. E. Schumacker (Eds),Advances in StructuralEquation Modeling(pp. 57–88). Hillsdale, NJ: Lawrence Erlbaum.
Dow
nloa
ded
by U
nive
rsiti
Put
ra M
alay
sia
At 2
1:15
08
June
201
5 (P
T)

Structural Equation Modeling Methods in Strategy Research 345
Judge, W. Q., & Miller, A. (1991). Antecedents and outcomes of decision speed in differentenvironmental contexts.Academy of Management Journal, 34, 449–463.
Kenny, D. A., & Judd, C. M. (1984). Estimating the nonlinear and interactive effects of latent variables.Psychological Bulletin, 96, 201–210.
Koka, B. R., & Prescott, J. E. (2002). Strategic alliances as social capital: A multidimensional view.Strategic Management Journal, 23, 795–816.
Lance, C. E., Meade, A. W., & Williamson, G. M. (2000). We should measure change – And here’show. In: G. M. Williamson & D. R. Shaffer (Eds),Physical Illness and Depression in OlderAdults: Theory, Research, and Practice(pp. 201–235). New York: Plenum.
Lance, C. E., Vandenberg, R. J., & Self, R. M. (2000). Latent growth models of individual change:The case of newcomer adjustment.Organizational Behavior and Human Decision Processes,83, 107–140.
MacCallum, R., & Browne, M. W. (1993). The use of causal indicators in covariance structure models:Some practical issues.Psychological Bulletin, 114, 533–541.
MacCallum, R., Browne, M. W., & Sugawara, H. M. (1996). Power analysis and determination ofsample size for covariance structure modeling.Psychological Methods, 1, 130–149.
MacKinnon, D. P., Lockwood, C. M., Hoffman, J. M., West, S. G., & Sheets, W. (2002). A comparisonof methods to test mediation and other intervening variable effects.Psychological Methods, 7,83–104.
Marsden, P. V. (1982). A note on block variables in multiequation models.Social Science Research,11, 127–140.
Marsh, H. W., Balla, J. R., & McDonald, R. P. (1988). Goodness-of-fit indexes in confirmatory factoranalysis: The effect of sample size.Psychological Bulletin, 103, 391–410.
McCutcheon, A. L. (1994). Latent logit models with polytomous effects variables. In A. von Eye &C. C. Clogg (Eds),Latent Variables Analysis(pp. 353–372). Thousand Oaks, CA: Sage.
McDonald, R. P., & Ho, R. M. (2002). Principles and practice in reporting structural equation analyses.Psychological Methods, 7, 64–82.
McDonald, R., Seifert, C., Lorenzet, S., Givens, S., & Jaccard, J. (2002). The effectiveness of methodsfor analyzing multivariate factorial data.Organizational Research Methods, 5, 254–274.
Medsker, G., Williams, L. J., & Holahan, P. (1994). A review of current practices for evaluating causalmodels in organizational behavior and human resources management research.Journal ofManagement, 20, 439–464.
Mulaik, S. A., James, L. R., Van Alstine, J., Bennett, N., Lind, S., & Stilwell, C. D. (1989). Evaluation ofgoodness-of-fit indices for struotural equation models.Psychological Bulletin, 105, 430–445.
Muthen, B. (2001). Second-generation structural equation modeling with a combination of categoricaland continuous latent variables: New opportunities for latent class/latent growth modeling. In:L. M. C. A. Sayer (Ed.),New Methods for the Analysis of Change. Washington, DC: APA.
Nevitt, J., & Hancock, G. R. (2000). Improving the root mean square error of approximation fornonnormal conditions in structural equation modeling.Journal of Experimental Education,68, 251–268.
Olsson, U. H., Foss, T., Troye, S. V., & Howell, R. D. (2000). The performance of ML, GLS andWLS estimation in structural equation modeling under conditions of misspecification andnonnormality.Structural Equation Modeling, 7, 557–595.
Ping, R. A., Jr. (1995). A parsimonious estimating technique for interaction and quadratic latentvariables.Journal of Marketing Research, 32, 336–347.
Ping, R. A., Jr. (1996). Latent variable interaction and quadratic effect estimation: A two-steptechniques using structural equation analysis.Psychological Bulletin, 119, 166–175.
Dow
nloa
ded
by U
nive
rsiti
Put
ra M
alay
sia
At 2
1:15
08
June
201
5 (P
T)

346 LARRY J. WILLIAMS ET AL.
Ployhart, R. E., & Oswald, F. L. (2003). Applications of mean and covariance structure analysis: Inte-grating correlational and experimental approaches.OrganizationalResearchMethods(in press).
Robertson, C. J., Gilley, K. M., & Street, M. D. (2003). The relationship between ethics and firmpractices in Russia and the United States.Journal of World Business, 38, 375–384.
Satorra, A., & Bentler, P. M. (1994). Corrections to test statistics and standard errors in covariancestructure analysis. In: A. von Eye & C. C. Clogg (Eds),Latent Variable Analysis: Applicationsfor Developmental Research(pp. 399–419). Thousand Oaks, CA: Sage.
Satorra, A., & Bentler, P. M. (2001). A scaled difference chi-square test statistic for moment structureanalysis.Psychometrika, 66, 507–514.
Schafer, J. L., & Graham, J. W. (2002). Missing data: Our view of the state of the art.PsychologicalMethods, 7, 147–177.
Schroeder, R. G., Bates, K. A., & Junttila, M. A. (2002). A resource-based view of manufacturingstrategy and the relationship to manufacturing performance.Strategic Management Journal,23, 105–117.
Shook, C. L., Ketchen, D. J., Hult, G. T. M., & Kacmar, K. M. (2004). An Assessment of the Useof Structural Equation Modeling in Strategic Management Research.Strategic ManagementJournal, 25, 397–404.
Sobel, M. E. (1982). Asymptotic intervals for indirect effects in structural equations models. In: S.Leinhart (Ed.),Sociological methodology(pp. 290–312). San Francisco: Jossey-Bass.
Spanos, Y. E., & Lioukas, S. (2001). An examination into the causal logic of rent generation:Contrasting Porter’s competitive strategy framework and the resource-based perspective.Strategic Management Journal, 22, 907–934.
Steensma, H. K., & Corley, K. G. (2000). On the performance of technology-sourcing partnerships:The interaction between partner interdependence and technology attributes.Academy ofManagement Journal, 43, 1045–1067.
Toyo Keizai (1999).Kaigai Shinshutsu Kigyon Sourankuni Betsu. Toto Keizai: Tokyo.Vandenberg, R. J., & Lance, C. E. (2000). A review and synthesis of the measurement invariance litera-
ture: Suggestions, practices, and recommendations for organizational research.OrganizationalResearch Methods, 3, 4–69.
West, S. G., Finch, J. F., & Curran, P. J. (1995). Structural equation models with nonnormal variables:Problems and remedies. In: R. H. Hoyle (Ed.),Structural Equation Modeling: Concepts,Issues and Applications(pp. 56–75). Thousand Oaks, CA: Sage.
Williams, L., Edwards, J., & Vandenberg, R. (2003). Recent advances in causal modeling methods fororganizational and management research.Journal of Management(in press).
Williams, L. J., & Holahan, P. (1994). Parsimony based fit indices for multiple indicator models: Dothey work?Structural Equation Modeling: A Multidisciplinary Journal, 2, 161–189.
Dow
nloa
ded
by U
nive
rsiti
Put
ra M
alay
sia
At 2
1:15
08
June
201
5 (P
T)

This article has been cited by:
1. Mabel Sánchez-Barrioluengo. 2014. Articulating the ‘three-missions’ in Spanishuniversities. Research Policy 43, 1760-1773. [CrossRef]
2. Ana García-Granero, Óscar Llopis, Anabel Fernández-Mesa, Joaquín Alegre. 2014.Unraveling the link between managerial risk-taking and innovation: The mediatingrole of a risk-taking climate. Journal of Business Research . [CrossRef]
3. Murali Sambasivan, Loke Siew‐Phaik, Zainal Abidin Mohamed, Yee Choy Leong.2011. Impact of interdependence between supply chain partners on strategic allianceoutcomes. Management Decision 49:4, 548-569. [Abstract] [Full Text] [PDF]
4. Nathan P. Podsakoff, Wei Shen, Philip M. PodsakoffThe Role of FormativeMeasurement Models in Strategic Management Research: Review, Critique, andImplications for Future Research 197-252. [Abstract] [Full Text] [PDF] [PDF]
5. Donald D. Bergh, John Perry, Ralph hanke. 2006. Some predictors ofSMJ articleimpact. Strategic Management Journal 27:10.1002/smj.v27:1, 81-100. [CrossRef]
6. H�seyin Tanriverdi, N. Venkatraman. 2005. Knowledge relatedness and theperformance of multibusiness firms. Strategic Management Journal 26:10.1002/smj.v26:2, 97-119. [CrossRef]
Dow
nloa
ded
by U
nive
rsiti
Put
ra M
alay
sia
At 2
1:15
08
June
201
5 (P
T)
Related Documents