ADM Investor Services International Limited is authorised and regulated by The Financial Conduct Authority. Member of The London Stock Exchange. Registered office: 4th Floor Millennium Bridge House, 2 Lambeth Hill, London EC4V 3TT. Registered in England No. 2547805 a subsidiary of Archer Daniels Midland Company. Risk Warning: Investments in Equities, CFDs, Futures, Options, Derivatives and Foreign Exchange can fluctuate in value, investors should therefore be aware that they may not realise the initial amount invested, and indeed may incur additional liabilities. These Investments may entail above average financial risk of loss, and investors should therefore carefully cons ider whether their financial circumstances and investment experience permit them to invest and, if necessary, seek the advice of an independent Financial Advisor. Some services described are not available to certain customers due to regulatory constraints either in the United Kingdom or elsewhere. © 2014 ADM Investor Services International Limited 2014. Equity & Commodity Fulcanelli Report Paul Mylchreest Email: [email protected] Tel: +44 20 7716 8257 25th March 2015 1 Selling Time Central banks arficially lengthened me horizons in financial markets and the real economy by distorng me preference. There is evidence that me horizons are now shortening, e.g. weak capital investment, flaening yield curves, dollar strength & physical gold demand. Perhaps the tsunami of global speculave capital—a result of extreme “financialism” - is geng nervous and seeking safer havens. Historically, volality in currency markets has led to destabilising flows in speculave capital which have subsequently impacted other financial assets. One way to “sell me” is, paradoxically, buying long-term Treasuries and, therefore, “bond-like” equies, such as financially strong Consumer Staples and Ulies companies. For equies in general, we found two indicators which gave well-med sell signals at the last two peaks in the S&P 500 in 2000 and 2007. Both of them – Treasury yield curve (7s10s) and “adjusted” MACD - are geng close to giving the first sell signals in nearly eight years. Can you arbitrage me? Central banks made the whole world “buy me”. There are signs that we’re beginning to sell it

Selling Time
Dec 23, 2015
Paul Mylchreest of ADM Investor Services writes this excellent piece on risk in global markets
Welcome message from author
This document is posted to help you gain knowledge. Please leave a comment to let me know what you think about it! Share it to your friends and learn new things together.
Transcript

ADM Investor Services International Limited is authorised and regulated by The Financial Conduct Authority. Member of The Lon don Stock Exchange. Registered office: 4th Floor Millennium Bridge House, 2 Lambeth Hill, London EC4V 3TT. Registered in England No. 2547805 a
subsidiary of Archer Daniels Midland Company. Risk Warning: Investments in Equities, CFDs, Futures, Options, Derivatives and Foreign Exchange can fluctuate in value, investors should therefore be aware that they may not realise the initial amount invested, and indeed may incur additional
liabilities. These Investments may entail above average financial risk of loss, and investors should therefore carefully cons ider whether their financial circumstances and investment experience permit them to invest and, if necessary, seek the advice of an independent Financial Advisor. Some
services described are not available to certain customers due to regulatory constraints either in the United Kingdom or elsewhere. © 2014 ADM Investor Services International Limited 2014.
Equity & Commodity
Fulcanelli Report
Paul Mylchreest Email: [email protected] Tel: +44 20 7716 8257
25th March 2015
1
Selling Time
Central banks artificially lengthened time horizons in financial markets and the real economy by
distorting time preference. There is evidence that time horizons are now shortening, e.g. weak
capital investment, flattening yield curves, dollar strength & physical gold demand. Perhaps the
tsunami of global speculative capital—a result of extreme “financialism” - is getting nervous and
seeking safer havens. Historically, volatility in currency markets has led to destabilising flows in
speculative capital which have subsequently impacted other financial assets. One way to “sell
time” is, paradoxically, buying long-term Treasuries and, therefore, “bond-like” equities, such as
financially strong Consumer Staples and Utilities companies. For equities in general, we found
two indicators which gave well-timed sell signals at the last two peaks in the S&P 500 in 2000
and 2007. Both of them – Treasury yield curve (7s10s) and “adjusted” MACD - are getting close
to giving the first sell signals in nearly eight years.
Can you arbitrage time? Central banks made the whole world “buy
time”. There are signs that we’re beginning to sell it
ADM Investor Services International Limited is authorised and regulated by The Financial Conduct Authority. Member of The Lon don Stock Exchange. Registered office: 4th Floor Millennium Bridge House, 2 Lambeth Hill, London EC4V 3TT. Registered in England No. 2547805 a
subsidiary of Archer Daniels Midland Company. Risk Warning: Investments in Equities, CFDs, Futures, Options, Derivatives and Foreign Exchange can fluctuate in value, investors should therefore be aware that they may not realise the initial amount invested, and indeed may incur
Equity & Commodity Strategy - Fulcanelli Report Paul Mylchreest Email: [email protected] Tel: +44 20 7716 8257
2
Contents
Executive Summary 3
Time, Debt and Central Banks 7
Shortening Time Horizons 14
- Japan 14
- Real economy 16
- Financial markets 20
Global Speculative Capital 29
- Financialism and the scale of global speculative capital 29
- Volatility and the turning point in mid-2014 34
- Key risks: divergent central bank policy and dollar liquidity 41
- Exter’s Pyramid and capital flows 51

ADM Investor Services International Limited is authorised and regulated by The Financial Conduct Authority. Member of The Lon don Stock Exchange. Registered office: 4th Floor Millennium Bridge House, 2 Lambeth Hill, London EC4V 3TT. Registered in England No. 2547805 a
Equity & Commodity Strategy - Fulcanelli Report Paul Mylchreest Email: [email protected] Tel: +44 20 7716 8257
3
3
Executive Summary
Can you buy and sell time? We think that you can from the perspective of time horizons. In our view, financial markets are operating on the wrong time horizon – one that is too long (thanks to central banks ZIRP/NIRP and credit creation) - although there are signs that this is beginning to change.
We are in a global debt bubble and debt has a “time function” given its ability to bring forward con-sumption from the future into the present. Debt essentially “buys time” and the world has bought a (hell of a) lot of time. The “present” is inexorably catching up with what was the “future.”
Time preference reflects the relative valuation placed on goods at an earlier date versus a later date. While current goods (including cash) should always have a higher valuation than future goods, time preference declines as an economy becomes wealthier, i.e. the proportion of income devoted to cur-rent consumption falls versus that devoted to saving/capital accumulation.
Since the crisis, central banks have sought to address “under-consumption” (how many people do you know who voluntarily under-consume?) by distorting time preferences in the real economy and financial markets via zero interest rates and excessive credit creation. Negative interest rates are an-other step in this direction. At the heart of their policy, however, is a fundamental contradiction.
On one hand, their policies seek to increase current consumption, at the expense of long-term saving & capital accumulation, in an over-leveraged world. This increases time preference and would normally equate with higher interest rates, shortening time horizons and diminution in wealth.
However, by forcing down interest rates, the substitution of savings (real wealth) by cheap credit and by supporting financial markets, they have created an impression that time preference is lower than it really is. This lengthens time horizons, implies that current/rising consumption lev-els are more easily sustainable and induces incorrect spending decisions.
While artificially increasing time preference fundamentally weakens an economy, there is no immedi-ate concern unless there is evidence that businesses, consumers and investors are recognising that time preference is too high and are responding accordingly.
We detect signs that time horizons are shortening in both the “real” economy and financial markets.
In real economy terms, this already looks well advanced in Japan, which is the cutting edge of the cur-rent monetary experiment (spending, investment and saving are all weak). However, we are much more concerned about the weaker-than-expected levels of capital investment. This has been apparent for months on an almost global basis.
The global production chain for manufacturing and services can (also) be thought of in terms of a term structure or time series. It begins with “higher orders” of production, e.g. natural resources and capital goods which are furthest from the final consumer, and ends with producers of goods sold directly to consumers. Investment in upstream production has a positive effect which cascades down through the economy as a whole (implicit in Say’s “Law of Markets”). If the ability of central banks to lengthen time horizons in the real economy is fading, you would expect to see cutbacks to new investment and asset write downs in upstream sectors. This is what we’ve been witnessing in Oil & Gas and Mining.
In the financial markets, there is evidence of shortening time horizons in the flattening of yield curves and a shift of capital into the most “marketable” assets such as:
ADM Investor Services International Limited is authorised and regulated by The Financial Conduct Authority. Member of The Lon don Stock Exchange. Registered office: 4th Floor Millennium Bridge House, 2 Lambeth Hill, London EC4V 3TT. Registered in England No. 2547805 a
subsidiary of Archer Daniels Midland Company. Risk Warning: Investments in Equities, CFDs, Futures, Options, Derivatives and Foreign Exchange can fluctuate in value, investors should therefore be aware that they may not realise the initial amount invested, and indeed may incur
Equity & Commodity Strategy - Fulcanelli Report Paul Mylchreest Email: [email protected] Tel: +44 20 7716 8257
4
The Dollar
Highest “quality” sovereign bonds; and
Physical gold.
While the result of central bank policies is to initially suppress volatility in the business cycle and finan-cial markets, the end result is to exacerbate volatility. This is also starting to happen. Currency volatili-ty began to rise from historically low levels in July 2014 and rapidly moved into other markets, such as bonds and crude oil. It has also been picking up (much more slowly so far) in equities.
Signs of trouble have previously materialised in currency markets before having significant impacts on other assets. In extreme cases, this has led to crises such as 1873, 1929 (which is much misunderstood) and 1987. We are concerned that currency volatility could trigger destabilising capital flows if the di-vergence between the tightening bias of the Federal Reserve and extreme monetary easing by the ECB and BoJ is maintained.
What also makes today’s situation more precarious is the unprecedented degree to which the global economy has been “financialised.” This comes in a number of guises, such as the unprecedented vol-ume of global speculative capital. While central banks have added more than US$ 10 trillion of new credit since the crisis, the stock of globally traded financial assets has increased from US$7 trillion in 1980 to something approaching US$200 trillion.
Surges/reversals in speculative capital are never taken into account by static economic models. Under the “right” conditions, speculative capital flows can overwhelm almost anything in their path. If one were asked to create the conditions which could encourage flows in global speculative capital, one might include many which are already present, e.g. a global debt bubble, slowing global growth, insta-bility in a key currency bloc, heightened geo-political tension, currency mismatch on US$9 trillion of offshore debt and diverging policies amongst major central banks.
As time horizons shorten, we see growing evidence that speculative capital is moving towards safer havens in general. We would pinpoint the start of this trend to late-June/early-July 2014 which marked the beginning of the upward move in the dollar, the acceleration in “Fails to Deliver” in the re-po market, rollover in the global manufacturing PMI, the trough in high yield spreads and the accelera-tion of the fall in the oil price.
What’s happening broadly fits the framework of “Exter’s Pyramid” where capital progressively flows
down from the top layers of the pyramid, containing the riskiest assets, into the bottom layers which
contain the least risky assets, e.g. Treasuries, AAA corporate bonds, defensive equities, cash, etc. Occu-
pying the lowest level of the pyramid is gold.
For the time being, dollar strength will probably remain central to this process: due to.
Central bank policy divergence;
Tightening dollar liquidity;
Slowing global growth; and
“Global Dollar Short” at unprecedented levels.
We looked back to May 2013’s “Taper tantrum” to see which markets were adversely affected by tightening dollar liquidity the most. These included the Shanghai Composite, Brazilian Real and Ibovespa, Turkish Lira and Borsa Istanbul, Rand, Ringitt, the EMB ETF and European banks.

ADM Investor Services International Limited is authorised and regulated by The Financial Conduct Authority. Member of The Lon don Stock Exchange. Registered office: 4th Floor Millennium Bridge House, 2 Lambeth Hill, London EC4V 3TT. Registered in England No. 2547805 a
Equity & Commodity Strategy - Fulcanelli Report Paul Mylchreest Email: [email protected] Tel: +44 20 7716 8257
5
5
Going forward, we expect to see the unfolding of the final leg in the bull market “bubble” in devel-oped world sovereign bonds—much as it pains us to say it.
We also expect further flattening in the Treasury yield curve, with long-term US Treasuries outper-forming short-term maturities — which paradoxically implies “selling time” as we explain below. Our view is that if the Fed does increase rates in June or September this year, we will still see further de-clines in long-term Treasury yields.
Capital is flowing into physical gold and the latest monthly data shows that gold demand from the four major identifiable sources (China ex-PBOC, Indian imports, central banks and ETFs) amounted to 150% of the output of every gold mine in the world. The fact that the gold price remains depressed rather than surging shows that price discovery is still being dominated by paper gold instruments and the lev-eraged long/short trade (long the Nikkei index/short paper gold).
What about equities? While long bonds might have a maturity of 10-30 years, equities theoretically have infinite time horizons. Typically, equity investors make detailed estimates for cash flows for 7-10 years, beyond which cash flows to infinity are capitalised. Sticking with our time theme, when so much consumption has already been “brought forward” due to debt, valuing more distant cash flows on PEs above historic averages seems generous. But how do you even come close to an objective valuation in an increasingly (thanks to central banks) ZIRP or even NIRP world?
Valuation difficulties aside, there are two main indicators, and a third confirmatory indicator, which we are tracking to signal a top in the S&P 500. The first two gave well-timed sell signals at the last two peaks in the S&P 500 in 2000 and 2007. The three indicators are.
A crossover in the “adjusted” MACD;
The flattening of at least part of the Treasury yield curve all the way to zero; and
By way of confirmation - the ISM manufacturing survey crossing the 50.0 line to the downside.
These indicators incorporate signals from credit markets, technical analysis and the real economy.
We are getting close to, but have not yet reached, another bearish crossover in the adjusted MACD.
Source: Bloomberg

ADM Investor Services International Limited is authorised and regulated by The Financial Conduct Authority. Member of The Lon don Stock Exchange. Registered office: 4th Floor Millennium Bridge House, 2 Lambeth Hill, London EC4V 3TT. Registered in England No. 2547805 a
subsidiary of Archer Daniels Midland Company. Risk Warning: Investments in Equities, CFDs, Futures, Options, Derivatives and Foreign Exchange can fluctuate in value, investors should therefore be aware that they may not realise the initial amount invested, and indeed may incur
Equity & Commodity Strategy - Fulcanelli Report Paul Mylchreest Email: [email protected] Tel: +44 20 7716 8257
6
In terms of the Treasury yield curve, Fed intervention has obviously led to substantial distortion, mak-ing us reluctant to rely on either the very short or very long end. Focusing more towards the middle, the 7s10s spread is now only 20 basis points from flattening ( while the 5s10s is at 51 basis points). Source: ADMISI, Bloomberg
The ISM crossed the 50.0 line to the downside shortly after the last two peaks in August 2000 and December 2007. The latest monthly reading was 52.9 and the trend has been downward since October 2015.
Naturally, our stance on equities is defensive and we would highlight “bond-like” equities, particular-ly those which have good correlations between outperformance and falling long-term yields and flattening yield curves. This includes sectors such as Consumer Staples and Utilities.
On the other side of the coin, cyclical sectors such as Capital Goods, Steel and Chemicals have good correlations between underperformance and falling long-term yields and flattening yield curves.
Finally, we want to mention Martin Armstrong’s “Economic Confidence Model” (ECM) as more people seem to be taking an interest. In the past, the ECM has been surprisingly successful in tracking the mar-ket which is seeing the greatest concentration of global speculative capital (“hot money”), e.g. Nikkei in 1989, US sub-prime in 2007, not to mention the 1929 Crash. While he is bullish on the dollar, Arm-strong commented earlier this year that in this cycle, the model is capturing the shift of capital into the bond market, primarily. However, our analysis shows that the dollar index has also been tracking the ECM closely since the major low in the model in June 2011 (2011.45). Many people don’t seem to real-ise that the ECM is fractal, so it operates on multiple, but related, time horizons. According to our calcu-lations, there was a recent intermediate low on 4 March 2015. The dollar’s performance since then has been impressive. The next major high in the ECM is on 1 October 2015 (2015.75) and we will be watch-ing to see if this also marks the high in the dollar (and/or sovereign bonds).
10.0
20.0
30.0
40.0
50.0
60.0
70.0
80.0
90.0
20
10
20
11
20
12
20
13
20
14
20
15
7s10s Yield Curve (basis points)
ADM Investor Services International Limited is authorised and regulated by The Financial Conduct Authority. Member of The Lon don Stock Exchange. Registered office: 4th Floor Millennium Bridge House, 2 Lambeth Hill, London EC4V 3TT. Registered in England No. 2547805 a
Equity & Commodity Strategy - Fulcanelli Report Paul Mylchreest Email: [email protected] Tel: +44 20 7716 8257
7
7
Time, Debt and Central Banks
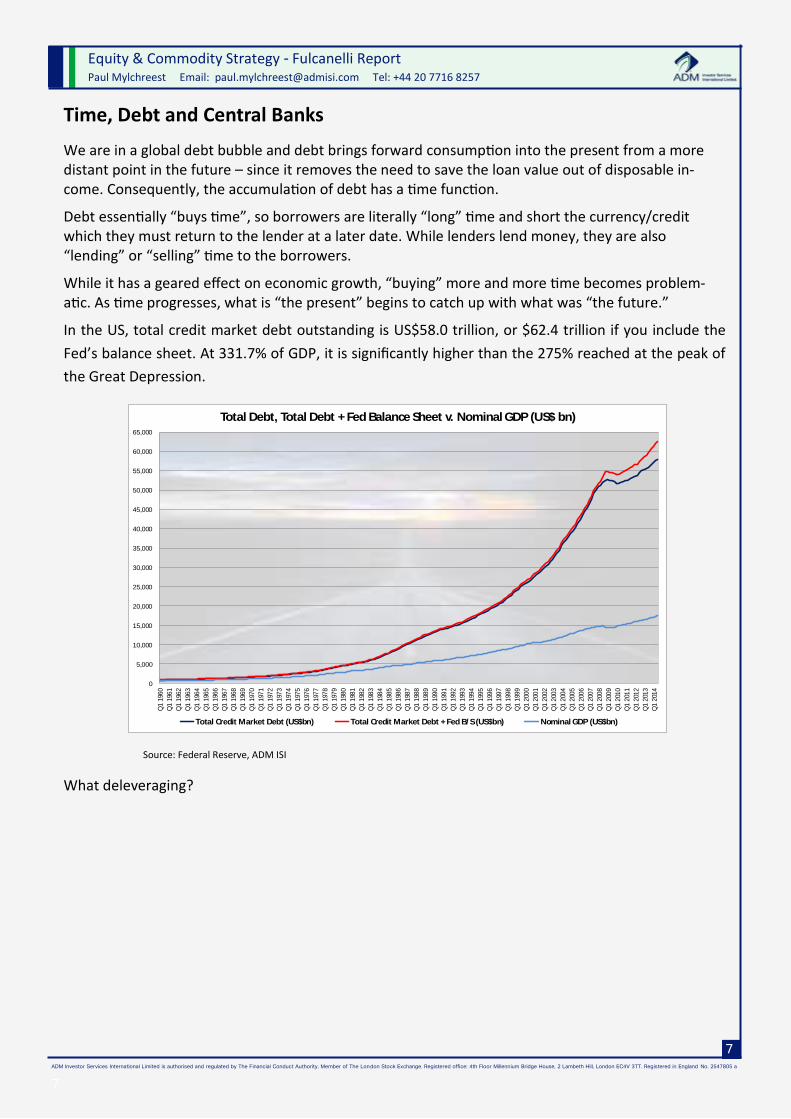
We are in a global debt bubble and debt brings forward consumption into the present from a more distant point in the future – since it removes the need to save the loan value out of disposable in-come. Consequently, the accumulation of debt has a time function.
Debt essentially “buys time”, so borrowers are literally “long” time and short the currency/credit which they must return to the lender at a later date. While lenders lend money, they are also “lending” or “selling” time to the borrowers.
While it has a geared effect on economic growth, “buying” more and more time becomes problem-atic. As time progresses, what is “the present” begins to catch up with what was “the future.”
In the US, total credit market debt outstanding is US$58.0 trillion, or $62.4 trillion if you include the
Fed’s balance sheet. At 331.7% of GDP, it is significantly higher than the 275% reached at the peak of
the Great Depression.
Source: Federal Reserve, ADM ISI
What deleveraging?
0
5,000
10,000
15,000
20,000
25,000
30,000
35,000
40,000
45,000
50,000
55,000
60,000
65,000
Q1
196
0
Q1
196
1
Q1
196
2
Q1
196
3
Q1
196
4
Q1
196
5
Q1
196
6
Q1
196
7
Q1
196
8
Q1
196
9
Q1
197
0
Q1
197
1
Q1
197
2
Q1
197
3
Q1
197
4
Q1
197
5
Q1
197
6
Q1
197
7
Q1
197
8
Q1
197
9
Q1
198
0
Q1
198
1
Q1
198
2
Q1
198
3
Q1
198
4
Q1
198
5
Q1
198
6
Q1
198
7
Q1
198
8
Q1
198
9
Q1
199
0
Q1
199
1
Q1
199
2
Q1
199
3
Q1
199
4
Q1
199
5
Q1
199
6
Q1
199
7
Q1
199
8
Q1
199
9
Q1
200
0
Q1
200
1
Q1
200
2
Q1
200
3
Q1
200
4
Q1
200
5
Q1
200
6
Q1
200
7
Q1
200
8
Q1
200
9
Q1
201
0
Q1
201
1
Q1
201
2
Q1
201
3
Q1
201
4
Total Debt, Total Debt + Fed Balance Sheet v. Nominal GDP (US$ bn)
Total Credit Market Debt (US$bn) Total Credit Market Debt + Fed B/S (US$bn) Nominal GDP (US$bn)

ADM Investor Services International Limited is authorised and regulated by The Financial Conduct Authority. Member of The Lon don Stock Exchange. Registered office: 4th Floor Millennium Bridge House, 2 Lambeth Hill, London EC4V 3TT. Registered in England No. 2547805 a
subsidiary of Archer Daniels Midland Company. Risk Warning: Investments in Equities, CFDs, Futures, Options, Derivatives and Foreign Exchange can fluctuate in value, investors should therefore be aware that they may not realise the initial amount invested, and indeed may incur
Equity & Commodity Strategy - Fulcanelli Report Paul Mylchreest Email: [email protected] Tel: +44 20 7716 8257
8
It’s noticeable how central bankers almost never mention that TOO MUCH DEBT is the key factor holding back growth in what is a credit-driven global economy. This is the sleight of hand to deflect guilt. In fact, their strategy has been to address the fallacy (think about it) of under-consumption by an all-out attempt to make it cheaper to borrow so that the world accumulates even more debt.
And the US is only a part of the story.
The total amount of debt accumulated on a global basis is approximately US$200 trillion according to a
recent report from the management consulting firm, McKinsey.
Source: McKinsey
The world is “long” (a hell of) a lot of time.
Looked at in another way, central banks have artificially lengthened time horizons in the real economy and financial markets by distorting time preference. They have created an illusion at the heart of which is a fundamental contradiction.
Time preference is the relative valuation placed on goods (including money) at an earlier date versus a later date. It almost goes without saying that, in general, people would rather fulfil their desires today than tomorrow. Who wouldn’t? People value present goods more highly than future goods. This con-cept is obviously used in DCF calculations to value financial assets/projects, i.e. cash flows at an earlier date have a higher valuation than cash flows at a more distant date.
In an economy, the way that time preference alters the balance between consumption today versus saving/investment for the future - and how debt accumulation interacts with this process – has major implications for growth. As an economy becomes wealthier, time preference declines.
Time preference plays a key role in the formation of interest rates along with diminishing marginal utili-ty (e.g. if you were on a desert island with nothing but 2 bananas, it probably makes sense to eat the other one tomorrow).

ADM Investor Services International Limited is authorised and regulated by The Financial Conduct Authority. Member of The Lon don Stock Exchange. Registered office: 4th Floor Millennium Bridge House, 2 Lambeth Hill, London EC4V 3TT. Registered in England No. 2547805 a
Equity & Commodity Strategy - Fulcanelli Report Paul Mylchreest Email: [email protected] Tel: +44 20 7716 8257
9
9
Implicit in time preference is that interest rates should be positive. Borrowers have to compensate lenders for the use of cash now if they don’t want to (or can’t) save it out of disposable income. Lenders require positive interest rates to defer consumption over and above some level of precautionary cash reserve.
Negative interest rates violate the normal concept of time preference, implying the premium of present
goods to future goods is reversed. A person who saves SFr100 and gets SFr 99 back in a year’s time
must judge that the value of SFr 99 for consumption in a year’s time is more than SFr100 now.
Switzerland was the first country to see its 10-year yield slip into negative territory.
Source: Bloomberg, ADM ISI

ADM Investor Services International Limited is authorised and regulated by The Financial Conduct Authority. Member of The Lon don Stock Exchange. Registered office: 4th Floor Millennium Bridge House, 2 Lambeth Hill, London EC4V 3TT. Registered in England No. 2547805 a
subsidiary of Archer Daniels Midland Company. Risk Warning: Investments in Equities, CFDs, Futures, Options, Derivatives and Foreign Exchange can fluctuate in value, investors should therefore be aware that they may not realise the initial amount invested, and indeed may incur
Equity & Commodity Strategy - Fulcanelli Report Paul Mylchreest Email: [email protected] Tel: +44 20 7716 8257
10
More than 15% of all developed market sovereign bonds are now trading on a negative yield. Swiss yields are currently negative out to nine years, German yields out to six, Danish out to five and Swedish out to four.
This strikes us as an extraordinary market signal. How could things have become so distorted and why is the consensus view so complacent? It seems that as long as stock markets are buoyant and sovereign bond yields of major nations remain very low, the majority will bask in the status quo.
Many suggestions are being put forward to explain negative yields so far out on the curve.
Rising deflation risk;
SNB’s negative policy rate (reduced from 0.00% to -0.75% since December 2014);
A shift towards “safe” assets as some investors question the future stability of the current finan-cial architecture;
Limited guarantees on bank deposits and risks to the banking system;
A view that Swiss government bond prices will continue rising, so there will be an opportunity to sell them at a higher price to someone else;
Supply shortages of specific assets relative to the massive liquidity injections from central banks;
The financial system has been so distorted by central banks that it’s almost impossible to value anything even with a degree of objectivity any more; and
Asset prices are increasingly driven by flows of capital as markets try to front-run changes in cen-tral bank policy.
All might be contributing, to a greater or lesser extent, but most are reflecting economic weakness and/or risk aversion on one hand and extreme policies of central banks on the other.
In contrast to the Fed, BoJ, BoE and (now) the ECB, the Swiss National Bank has never bought its own sovereign bonds. Nor should we forget that there are still alternative sovereign bonds with respectable credit ratings and much higher (it’s all relative) yields, e.g. US Treasuries. Yet the yield differential has not been arbitraged away, or at least not yet. And if it was, which way would it go?
What’s happening made us think about time preference and the way in which it is being distorted.
An increase in time preference implies that a higher ratio of income is devoted to consumption versus saving/investment for the future.
It should be obvious that this is precisely the aim of central bank policies to “correct” what they view as under-consumption. At its heart is a cynical inducement for businesses and consumers to make what are, in some cases, incorrect or risky spending decisions. Increasing consumption when savings ratios are low and debt is high suggests that central banks are trying to create the illusion that time prefer-ence is lower/falling when it’s actually higher/rising.
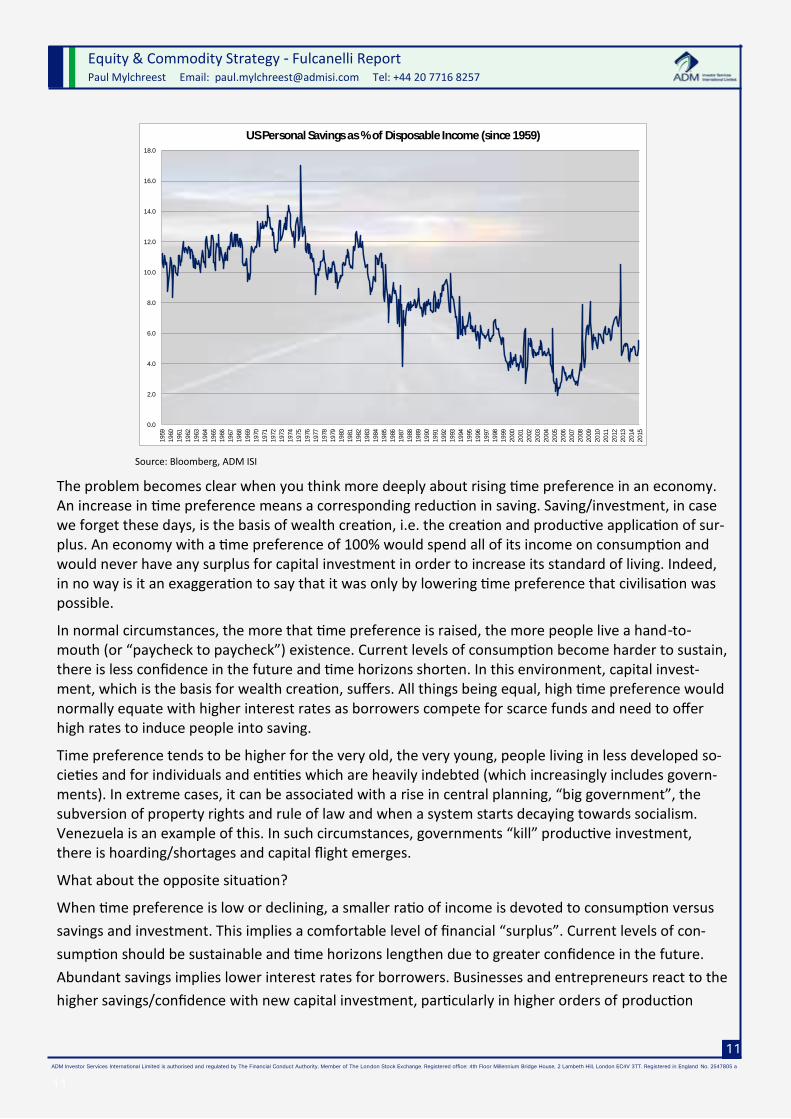
If we look at the US, for example, while debt is at an all-time high, the savings ratio is at a very low level by historical standards.
ADM Investor Services International Limited is authorised and regulated by The Financial Conduct Authority. Member of The Lon don Stock Exchange. Registered office: 4th Floor Millennium Bridge House, 2 Lambeth Hill, London EC4V 3TT. Registered in England No. 2547805 a
Equity & Commodity Strategy - Fulcanelli Report Paul Mylchreest Email: [email protected] Tel: +44 20 7716 8257
11
11
Source: Bloomberg, ADM ISI
The problem becomes clear when you think more deeply about rising time preference in an economy. An increase in time preference means a corresponding reduction in saving. Saving/investment, in case we forget these days, is the basis of wealth creation, i.e. the creation and productive application of sur-plus. An economy with a time preference of 100% would spend all of its income on consumption and would never have any surplus for capital investment in order to increase its standard of living. Indeed, in no way is it an exaggeration to say that it was only by lowering time preference that civilisation was possible.
In normal circumstances, the more that time preference is raised, the more people live a hand-to-mouth (or “paycheck to paycheck”) existence. Current levels of consumption become harder to sustain, there is less confidence in the future and time horizons shorten. In this environment, capital invest-ment, which is the basis for wealth creation, suffers. All things being equal, high time preference would normally equate with higher interest rates as borrowers compete for scarce funds and need to offer high rates to induce people into saving.
Time preference tends to be higher for the very old, the very young, people living in less developed so-cieties and for individuals and entities which are heavily indebted (which increasingly includes govern-ments). In extreme cases, it can be associated with a rise in central planning, “big government”, the subversion of property rights and rule of law and when a system starts decaying towards socialism. Venezuela is an example of this. In such circumstances, governments “kill” productive investment, there is hoarding/shortages and capital flight emerges.
What about the opposite situation?
When time preference is low or declining, a smaller ratio of income is devoted to consumption versus
savings and investment. This implies a comfortable level of financial “surplus”. Current levels of con-
sumption should be sustainable and time horizons lengthen due to greater confidence in the future.
Abundant savings implies lower interest rates for borrowers. Businesses and entrepreneurs react to the
higher savings/confidence with new capital investment, particularly in higher orders of production
0.0
2.0
4.0
6.0
8.0
10.0
12.0
14.0
16.0
18.0
19
59
19
60
19
61
19
62
19
63
19
64
19
65
19
66
19
67
19
68
19
69
19
70
19
71
19
72
19
73
19
74
19
75
19
76
19
77
19
78
19
79
19
80
19
81
19
82
19
83
19
84
19
85
19
86
19
87
19
88
19
89
19
90
19
91
19
92
19
93
19
94
19
95
19
96
19
97
19
98
19
99
20
00
20
01
20
02
20
03
20
04
20
05
20
06
20
07
20
08
20
09
20
10
20
11
20
12
20
13
20
14
20
15
US Personal Savings as % of Disposable Income (since 1959)

ADM Investor Services International Limited is authorised and regulated by The Financial Conduct Authority. Member of The Lon don Stock Exchange. Registered office: 4th Floor Millennium Bridge House, 2 Lambeth Hill, London EC4V 3TT. Registered in England No. 2547805 a
subsidiary of Archer Daniels Midland Company. Risk Warning: Investments in Equities, CFDs, Futures, Options, Derivatives and Foreign Exchange can fluctuate in value, investors should therefore be aware that they may not realise the initial amount invested, and indeed may incur
Equity & Commodity Strategy - Fulcanelli Report Paul Mylchreest Email: [email protected] Tel: +44 20 7716 8257
12
which are more distant from the final consumer. This includes natural resources, like oil & gas and met-als and mining, and capital goods projects.
In a big picture sense, time preference tends to decline when a society experiences a broadly-based rise in wealth/capital accumulation. It is often associated with other factors such as technological progress, free-market capitalism, “small” government, the respect for property rights and the rule of law.
This was Douglas French writing in “High Rises and High Time Preferences”.
“The lower the time preference rate, the earlier the onset of the process of capital formation, and the faster the roundabout structure of production will be lengthened. Civilization is set in motion by indi-vidual saving, investment, and the accumulation of durable consumer goods and capital goods.”
It should be clear how central banks are attempting to distort time preference and how their policies contain a fundamental contradiction in terms of time horizons and wealth creation. In essence, they are creating an illusion.
While aggressively seeking to increase time preference, with all its negative implications, on the one hand, they are trying to give the impression that time preference is lower than it really is by making cur-rent levels of consumption seem more sustainable by forcing down interest rates and replacing savings with cheap credit. This artificially extends time horizons and increases confidence. But, lest we forget, a rising time preference is indicative of a weakening economy, not a strengthening one, and one which is more vulnerable than it looks.
It doesn’t take a genius to realise that the end result of trying to artificially lower time preference is to exacerbate the volatility of the business cycle and financial markets.
We know the result.
Source: Bloomberg, ADM ISI
Each bubble is bigger than the last because the recovery from the previous bubble requires even lower
interest rates and more credit creation…which induces some businesses and consumers to make a new
round of risky spending decisions…and eventually…investment decisions.
400
600
800
1000
1200
1400
1600
1800
2000
2200
19
96
19
97
19
98
19
99
20
00
20
01
20
02
20
03
20
04
20
05
20
06
20
07
20
08
20
09
20
10
20
11
20
12
20
13
20
14
20
15
S&P 500 (since 1996)

ADM Investor Services International Limited is authorised and regulated by The Financial Conduct Authority. Member of The Lon don Stock Exchange. Registered office: 4th Floor Millennium Bridge House, 2 Lambeth Hill, London EC4V 3TT. Registered in England No. 2547805 a
Equity & Commodity Strategy - Fulcanelli Report Paul Mylchreest Email: [email protected] Tel: +44 20 7716 8257
13
13
There comes a point when the illusion should start to fade. The average person will start to realise that, in spite of historically low interest rates and all around central bank largesse, their time preference is not that low. In fact, it’s been rising and increasing it further would be irresponsible. Time horizons will shorten and risk increases.
The focal point of the last bubble was US house prices and associated securitised loans. House prices, which (according to Bernanke) were never supposed to fall, but were already falling more than a year and a half before Lehman collapsed.
Source: Bloomberg, ADM ISI
This got us thinking about what signs we should we look for to tell if the central banks’ time preference illusion is running out of road.
-25
-20
-15
-10
-5
0
5
10
15
20
20
01
20
02
20
03
20
04
20
05
20
06
20
07
20
08
20
09
20
10
20
11
20
12
20
13
20
14
US House Prices (S&P/Case-Shiller 20 City Home Price Index, % yoy)

ADM Investor Services International Limited is authorised and regulated by The Financial Conduct Authority. Member of The Lon don Stock Exchange. Registered office: 4th Floor Millennium Bridge House, 2 Lambeth Hill, London EC4V 3TT. Registered in England No. 2547805 a
subsidiary of Archer Daniels Midland Company. Risk Warning: Investments in Equities, CFDs, Futures, Options, Derivatives and Foreign Exchange can fluctuate in value, investors should therefore be aware that they may not realise the initial amount invested, and indeed may incur
Equity & Commodity Strategy - Fulcanelli Report Paul Mylchreest Email: [email protected] Tel: +44 20 7716 8257
14
Shortening Time Horizons
Shortening time horizons – Japan
We need to start with Japan, which is the “cutting edge” of central bank monetary experiments.
It’s a heavily indebted nation;
Using extreme policies in terms of low interest rates and credit injections; and
Suffering from an ageing demographic.
The embryonic signs that “Abenomics” is failing suggest that it might not be possible to control time preference indefinitely.
The BoJ’s policy rate has been almost zero for most of the last 15 years and its balance sheet is current-
ly expanding at an (almost unbelievable) annualised rate equivalent to 17% of nominal GDP. In spite of
this, retail sales growth is non-existent.
Source: Bloomberg, ADM ISI
Even though the once high saving Japanese population has moved into dissaving mode.
-10.0
-8.0
-6.0
-4.0
-2.0
0.0
2.0
4.0
6.0
8.0
10.0
12.0
Jan
-09
Ma
r-09
Ma
y-0
9
Jul-
09
Sep
-09
No
v-0
9
Jan
-10
Ma
r-10
Ma
y-1
0
Jul-
10
Sep
-10
No
v-1
0
Jan
-11
Ma
r-11
Ma
y-1
1
Jul-
11
Sep
-11
No
v-1
1
Jan
-12
Ma
r-12
Ma
y-1
2
Jul-
12
Sep
-12
No
v-1
2
Jan
-13
Ma
r-13
Ma
y-1
3
Jul-
13
Sep
-13
No
v-1
3
Jan
-14
Ma
r-14
Ma
y-1
4
Jul-
14
Sep
-14
No
v-1
4
Jan
-15
Japan: Retail trade (yoy %)

ADM Investor Services International Limited is authorised and regulated by The Financial Conduct Authority. Member of The Lon don Stock Exchange. Registered office: 4th Floor Millennium Bridge House, 2 Lambeth Hill, London EC4V 3TT. Registered in England No. 2547805 a
Equity & Commodity Strategy - Fulcanelli Report Paul Mylchreest Email: [email protected] Tel: +44 20 7716 8257
15
15
Source: Bloomberg, ADM ISI
Can’t spend and can’t save.
The Composite PMI, covering both manufacturing and services, is rolling over again. Source: Bloomberg, ADM ISI
No matter what the BoJ does in terms of interest rates or credit creation, time preference in Japan seems reluctant to go any higher. It could take suicidal currency debasement to create enough inflation to change this mindset and we can’t even rule this out with Abe/Kuroda at the helm.
44.0
46.0
48.0
50.0
52.0
54.0
56.0
58.0
Feb
-12
Ma
r-12
Ap
r-1
2
Ma
y-1
2
Jun
-12
Jul-
12
Au
g-1
2
Sep
-12
Oct
-12
No
v-1
2
De
c-12
Jan
-13
Feb
-13
Ma
r-13
Ap
r-1
3
Ma
y-1
3
Jun
-13
Jul-
13
Au
g-1
3
Sep
-13
Oct
-13
No
v-1
3
De
c-13
Jan
-14
Feb
-14
Ma
r-14
Ap
r-1
4
Ma
y-1
4
Jun
-14
Jul-
14
Au
g-1
4
Sep
-14
Oct
-14
No
v-1
4
De
c-14
Jan
-15
Feb
-15
Japan: Composite Output PMI (since Feb 2012)
ADM Investor Services International Limited is authorised and regulated by The Financial Conduct Authority. Member of The Lon don Stock Exchange. Registered office: 4th Floor Millennium Bridge House, 2 Lambeth Hill, London EC4V 3TT. Registered in England No. 2547805 a
subsidiary of Archer Daniels Midland Company. Risk Warning: Investments in Equities, CFDs, Futures, Options, Derivatives and Foreign Exchange can fluctuate in value, investors should therefore be aware that they may not realise the initial amount invested, and indeed may incur
Equity & Commodity Strategy - Fulcanelli Report Paul Mylchreest Email: [email protected] Tel: +44 20 7716 8257
16
It’s hard to say, but there is a chance that the Japanese economy has moved into a state of semi-
permanent decline.
Shortening time horizons – real economy
Besides Japan, another focus for us is the trend in capital investment on a global basis. We highlighted the importance of capital investment to wealth creation in our discussion of time preference earlier.
The global production chain for manufacturing and services can (also) be thought of in terms of a time series. It starts with the “higher orders” of production, e.g. natural resources and capital goods, which are the most distant from the final consumer, and ends with businesses producing goods in their final form for consumers. Profitable investment made in upstream production translates into wages and flows of goods and services which cascade down through the entire chain.
We have more sympathy with Jean Baptiste Say’s “Law of Markets” than Keynes’ thinking with regard to under-consumption. The basic idea of the Law of Markets is that when an individual produces a mar-ketable good or service and gets paid for it, he/she is then able to demand other goods and services (including money which is an intermediate good used in exchange).
In essence, the argument is that it is the production of goods and services that drives consumption, not the other way around. Once a unit of a good or service has been consumed, its value has been eliminat-ed. In order to continue to demand, you need to continue to supply. It’s not that supply creates its own demand, as Keynes mistakenly interpreted, but that supply is a precondition for demand.
“Say’s Law has nothing to do with an equilibrium between aggregate supply and aggregate demand, but rather it describes the process by which supplies in general are turned into demands in general. It is always the level of production which determines the ability to demand.”
It reminds us of the fallacy that deposits create loans in the banking system when the reality is that loans create deposits - nothing more than double entry bookkeeping in a pure credit system.
Savings are the source of capital accumulation and provide the basis for entrepreneurs to finance pro-ductive resources. The consequence, however, is that wealth and economic progress is created by pro-duction – increasing the quantity of goods and services available - not consumption. According to Say.
"it is the aim of good government to stimulate production, of bad government to encourage con-sumption."
For companies in the upstream part of the production chain, capital investment projects tend to be very costly, high-risk and long-term in nature. Distinguishing between a genuine reduction in time pref-erence and an artificial one crafted by the central bank is, therefore, critical…and mistakes can be made.
Recent capital investment trends in Japan illustrate this perfectly.
Japanese machinery orders rebounded strongly after Abe’s election victory in December 2012. Howev-er, the marked weakness we’ve seen in recent months seems to imply that confidence in making long-term capital investment has deteriorated.

ADM Investor Services International Limited is authorised and regulated by The Financial Conduct Authority. Member of The Lon don Stock Exchange. Registered office: 4th Floor Millennium Bridge House, 2 Lambeth Hill, London EC4V 3TT. Registered in England No. 2547805 a
Equity & Commodity Strategy - Fulcanelli Report Paul Mylchreest Email: [email protected] Tel: +44 20 7716 8257
17
17
Source: Bloomberg, ADM ISI
If central banks induce businesses to make incorrect capital investment decisions, the end result will be that production is out of line with consumer preferences. This will distort the ratio between capital goods and consumer goods. In such circumstances, some of the increased capacity for capital goods will turn out to be malinvestment.
Capital will decrease, both in terms of physical wastage and loss of value, and decisions on new invest-ment will be cancelled.
This is exactly what’s been happening in the Mining and Oil sectors and these industries represent the highest orders of production, i.e. at the top of the production chain. First came mining and here is a chart of Rio Tinto’s capex since 2010 and its forecasts through 2017.
Source: Bloomberg, ADM ISI
-50
-40
-30
-20
-10
0
10
20
30
40
50
20
09
20
10
20
11
20
12
20
13
20
14
20
15
Japan: Machinery Orders (yoy %)
0.0
2.0
4.0
6.0
8.0
10.0
12.0
14.0
16.0
18.0
20.0
2008 2009 2010 2011 2012 2013 2014 2015e 2016e 2017e
Rio Tinto - Capex 2008-17 (US$bn)

ADM Investor Services International Limited is authorised and regulated by The Financial Conduct Authority. Member of The Lon don Stock Exchange. Registered office: 4th Floor Millennium Bridge House, 2 Lambeth Hill, London EC4V 3TT. Registered in England No. 2547805 a
subsidiary of Archer Daniels Midland Company. Risk Warning: Investments in Equities, CFDs, Futures, Options, Derivatives and Foreign Exchange can fluctuate in value, investors should therefore be aware that they may not realise the initial amount invested, and indeed may incur
Equity & Commodity Strategy - Fulcanelli Report Paul Mylchreest Email: [email protected] Tel: +44 20 7716 8257
18
Oil and gas are following suit…here is the same chart for BP with its 2015 forecast.
Source: Bloomberg, ADM ISI
The capital investment cycle is weak on a global basis. Here is data from the US and Germany, in addi-tion to Japan which we showed above. Source: Bloomberg, ADM ISI
0.0
5.0
10.0
15.0
20.0
25.0
30.0
2008 2009 2010 2011 2012 2013 2014 2015e
BP - Capex 2008-15 (US$bn)
-50.0
-40.0
-30.0
-20.0
-10.0
0.0
10.0
20.0
30.0
40.0
20
09
20
10
20
11
20
12
20
13
20
14
20
15
Capital Goods Order Books: US, Japan & Germany (yoy %)
US Capital Goods Orders (ex-def/air) Japan Machinery Orders Germany Manufacturing Orders
ADM Investor Services International Limited is authorised and regulated by The Financial Conduct Authority. Member of The Lon don Stock Exchange. Registered office: 4th Floor Millennium Bridge House, 2 Lambeth Hill, London EC4V 3TT. Registered in England No. 2547805 a
Equity & Commodity Strategy - Fulcanelli Report Paul Mylchreest Email: [email protected] Tel: +44 20 7716 8257
19
19
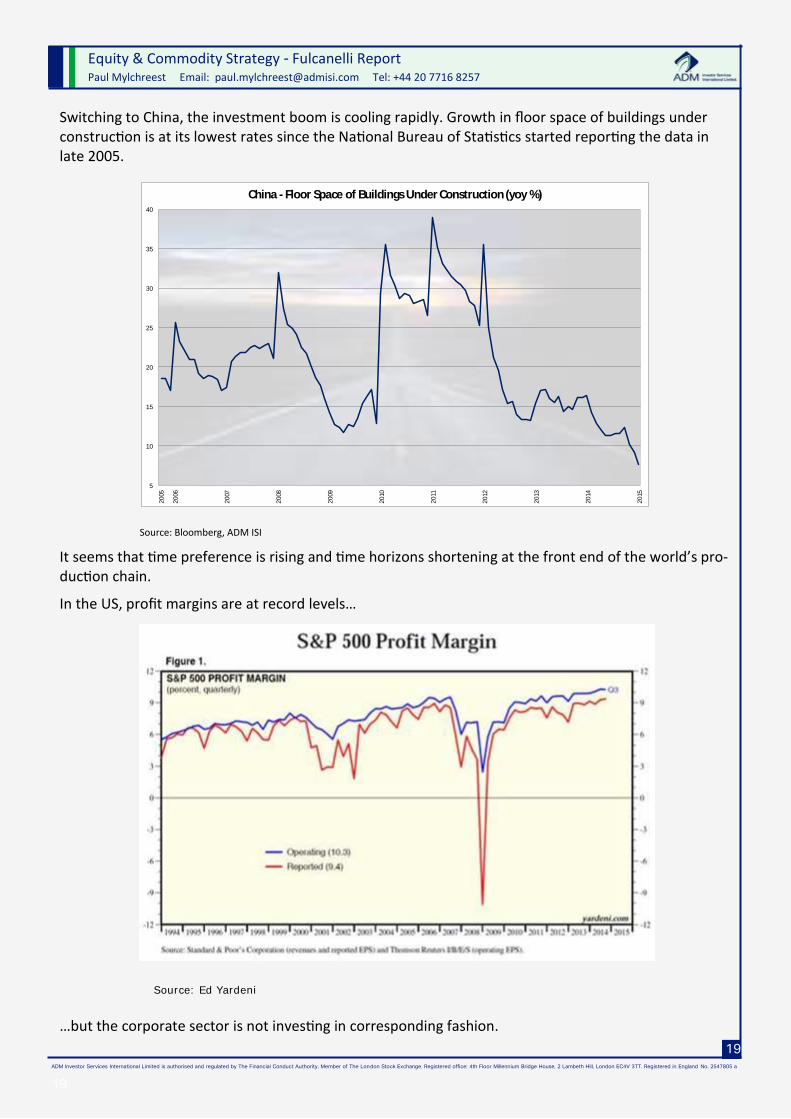
Switching to China, the investment boom is cooling rapidly. Growth in floor space of buildings under construction is at its lowest rates since the National Bureau of Statistics started reporting the data in late 2005.
Source: Bloomberg, ADM ISI
It seems that time preference is rising and time horizons shortening at the front end of the world’s pro-duction chain.
In the US, profit margins are at record levels… Source: Ed Yardeni …but the corporate sector is not investing in corresponding fashion.
5
10
15
20
25
30
35
40
20
05
20
06
20
07
20
08
20
09
20
10
20
11
20
12
20
13
20
14
20
15
China - Floor Space of Buildings Under Construction (yoy %)
ADM Investor Services International Limited is authorised and regulated by The Financial Conduct Authority. Member of The Lon don Stock Exchange. Registered office: 4th Floor Millennium Bridge House, 2 Lambeth Hill, London EC4V 3TT. Registered in England No. 2547805 a
subsidiary of Archer Daniels Midland Company. Risk Warning: Investments in Equities, CFDs, Futures, Options, Derivatives and Foreign Exchange can fluctuate in value, investors should therefore be aware that they may not realise the initial amount invested, and indeed may incur
Equity & Commodity Strategy - Fulcanelli Report Paul Mylchreest Email: [email protected] Tel: +44 20 7716 8257
20
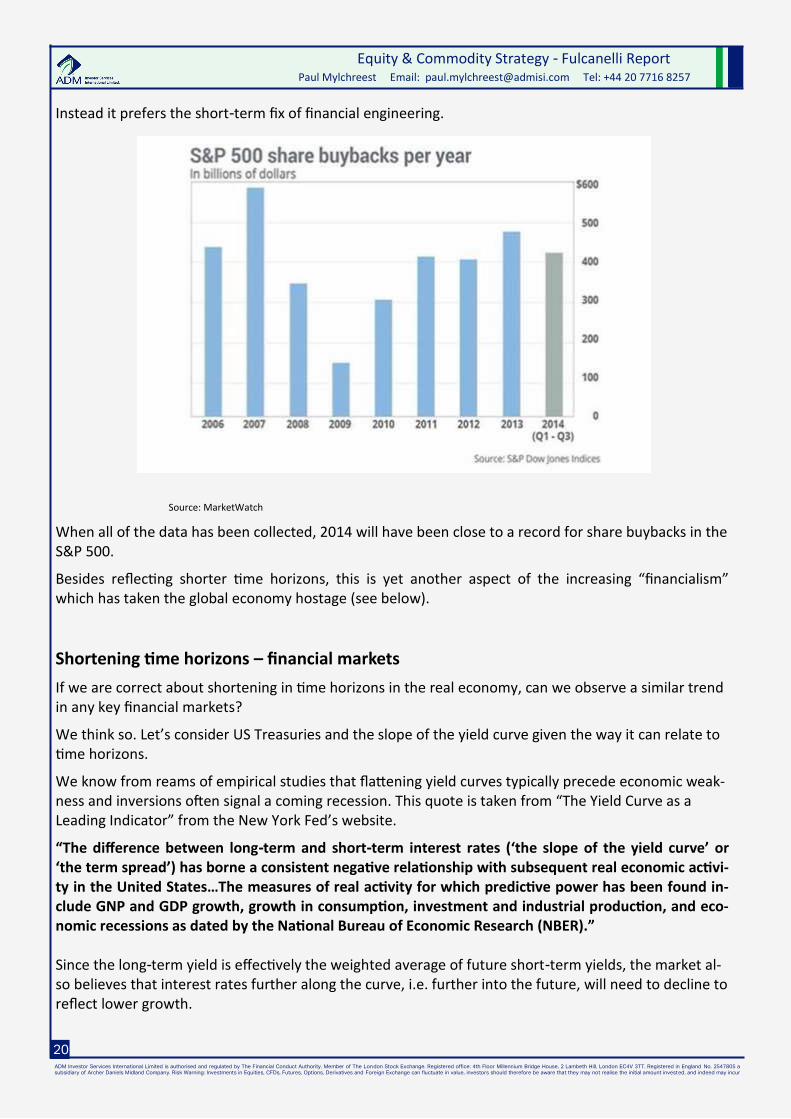
Instead it prefers the short-term fix of financial engineering.
Source: MarketWatch
When all of the data has been collected, 2014 will have been close to a record for share buybacks in the S&P 500.
Besides reflecting shorter time horizons, this is yet another aspect of the increasing “financialism” which has taken the global economy hostage (see below).
Shortening time horizons – financial markets
If we are correct about shortening in time horizons in the real economy, can we observe a similar trend in any key financial markets?
We think so. Let’s consider US Treasuries and the slope of the yield curve given the way it can relate to time horizons.
We know from reams of empirical studies that flattening yield curves typically precede economic weak-ness and inversions often signal a coming recession. This quote is taken from “The Yield Curve as a Leading Indicator” from the New York Fed’s website.
“The difference between long-term and short-term interest rates (‘the slope of the yield curve’ or ‘the term spread’) has borne a consistent negative relationship with subsequent real economic activi-ty in the United States…The measures of real activity for which predictive power has been found in-clude GNP and GDP growth, growth in consumption, investment and industrial production, and eco-nomic recessions as dated by the National Bureau of Economic Research (NBER).” Since the long-term yield is effectively the weighted average of future short-term yields, the market al-so believes that interest rates further along the curve, i.e. further into the future, will need to decline to reflect lower growth.
ADM Investor Services International Limited is authorised and regulated by The Financial Conduct Authority. Member of The Lon don Stock Exchange. Registered office: 4th Floor Millennium Bridge House, 2 Lambeth Hill, London EC4V 3TT. Registered in England No. 2547805 a
Equity & Commodity Strategy - Fulcanelli Report Paul Mylchreest Email: [email protected] Tel: +44 20 7716 8257
21
21
Paradoxically, therefore, buying the long end of the curve (versus the short end) reflects a shortening of time horizons—effectively a way to “sell time.”
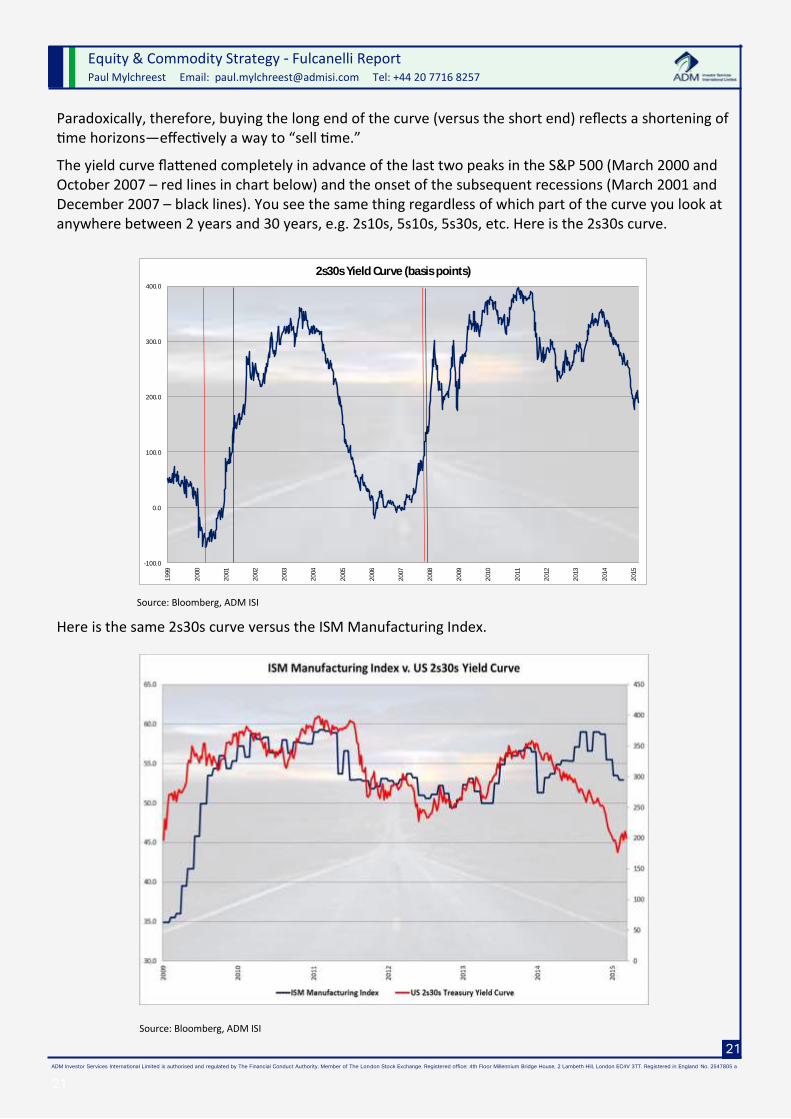
The yield curve flattened completely in advance of the last two peaks in the S&P 500 (March 2000 and October 2007 – red lines in chart below) and the onset of the subsequent recessions (March 2001 and December 2007 – black lines). You see the same thing regardless of which part of the curve you look at anywhere between 2 years and 30 years, e.g. 2s10s, 5s10s, 5s30s, etc. Here is the 2s30s curve.
Source: Bloomberg, ADM ISI
Here is the same 2s30s curve versus the ISM Manufacturing Index.
Source: Bloomberg, ADM ISI
-100.0
0.0
100.0
200.0
300.0
400.0
19
99
20
00
20
01
20
02
20
03
20
04
20
05
20
06
20
07
20
08
20
09
20
10
20
11
20
12
20
13
20
14
20
15
2s30s Yield Curve (basis points)

ADM Investor Services International Limited is authorised and regulated by The Financial Conduct Authority. Member of The Lon don Stock Exchange. Registered office: 4th Floor Millennium Bridge House, 2 Lambeth Hill, London EC4V 3TT. Registered in England No. 2547805 a
subsidiary of Archer Daniels Midland Company. Risk Warning: Investments in Equities, CFDs, Futures, Options, Derivatives and Foreign Exchange can fluctuate in value, investors should therefore be aware that they may not realise the initial amount invested, and indeed may incur
Equity & Commodity Strategy - Fulcanelli Report Paul Mylchreest Email: [email protected] Tel: +44 20 7716 8257
22
In a ZIRP, and increasingly “NIRP”, world, our bond colleagues argue that this is largely due to an ongo-ing reach for yield which his pulling down yields at the long end. We think that it is that and more be-sides, i.e. shortening time horizons and flight to safety.
We also think the yield curve might be helpful again in predicting a peak in the equity market (below).
Besides the flattening in the yield curve, a shortening of time horizons and flight to safety might also be reflected in capital flowing into the most marketable financial assets. InvestorWords.com defines “marketability” as:
“A measure of the ability of a security to be bought and sold. If there is an active marketplace for a security, it has good marketability.”
Which reminds us of this quote from “Oddball” in the movie “Kelly’s Heroes.”
“These engines are the fastest in any tanks in the European theatre of operations, forwards or back-wards. You see, man, we like to feel we can get out of trouble quicker than we got into it.” Three of the most “marketable” financial assets on the planet in our opinion are:
US dollar;
Treasuries (although QE has interfered with this); and
Physical gold.
As we are all well aware, the dollar has been strong - the breakout from the pre-Plaza Accord wedge,
which dates back more than 30 years, is extremely significant.
Source: ADMISI, Bloomberg
70
80
90
100
110
120
130
140
150
160
170
19
84
19
85
19
86
19
87
19
88
19
89
19
90
19
91
19
92
19
93
19
94
19
95
19
96
19
97
19
98
19
99
20
00
20
01
20
02
20
03
20
04
20
05
20
06
20
07
20
08
20
09
20
10
20
11
20
12
20
13
20
14
20
15
US Dollar Index (since 1984)
ADM Investor Services International Limited is authorised and regulated by The Financial Conduct Authority. Member of The Lon don Stock Exchange. Registered office: 4th Floor Millennium Bridge House, 2 Lambeth Hill, London EC4V 3TT. Registered in England No. 2547805 a
Equity & Commodity Strategy - Fulcanelli Report Paul Mylchreest Email: [email protected] Tel: +44 20 7716 8257
23
23
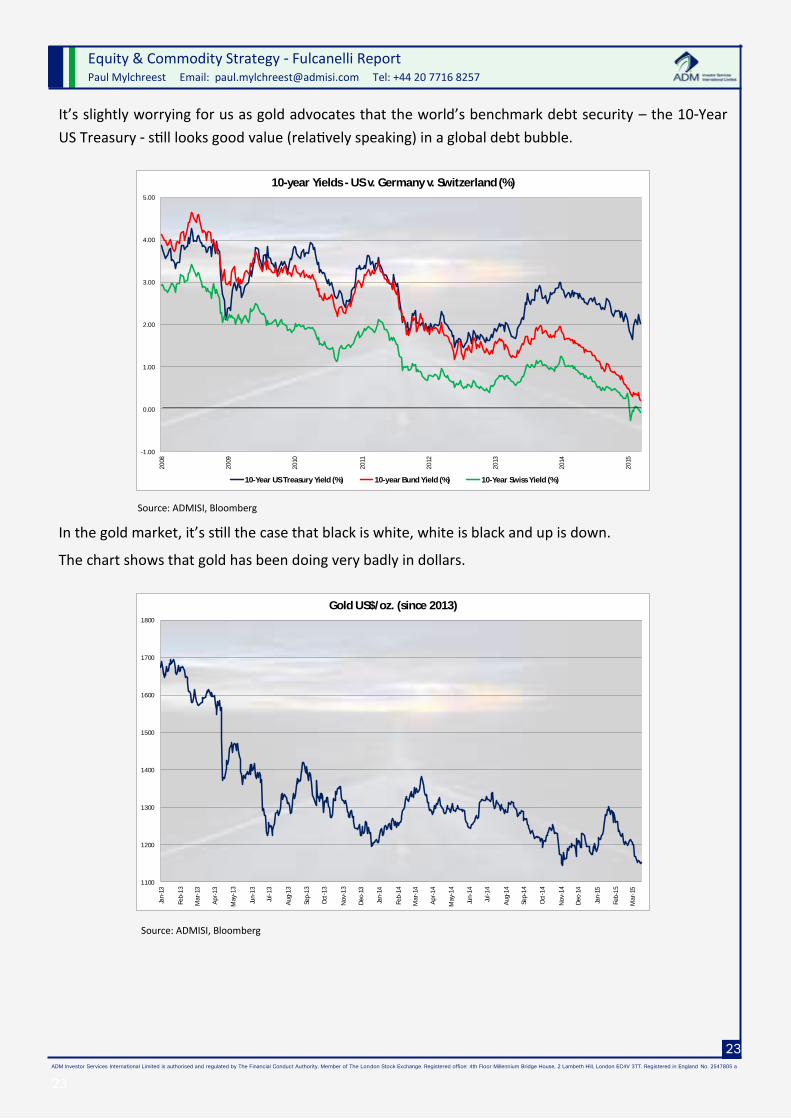
It’s slightly worrying for us as gold advocates that the world’s benchmark debt security – the 10-Year
US Treasury - still looks good value (relatively speaking) in a global debt bubble.
Source: ADMISI, Bloomberg
In the gold market, it’s still the case that black is white, white is black and up is down.
The chart shows that gold has been doing very badly in dollars.
Source: ADMISI, Bloomberg
-1.00
0.00
1.00
2.00
3.00
4.00
5.00
20
08
20
09
20
10
20
11
20
12
20
13
20
14
20
15
10-year Yields - US v. Germany v. Switzerland (%)
10-Year US Treasury Yield (%) 10-year Bund Yield (%) 10-Year Swiss Yield (%)
1100
1200
1300
1400
1500
1600
1700
1800
Jan
-13
Feb
-13
Ma
r-13
Ap
r-1
3
Ma
y-1
3
Jun
-13
Jul-
13
Au
g-1
3
Sep
-13
Oct
-13
No
v-1
3
De
c-13
Jan
-14
Feb
-14
Ma
r-14
Ap
r-1
4
Ma
y-1
4
Jun
-14
Jul-
14
Au
g-1
4
Sep
-14
Oct
-14
No
v-1
4
De
c-14
Jan
-15
Feb
-15
Ma
r-15
Gold US$/oz. (since 2013)

ADM Investor Services International Limited is authorised and regulated by The Financial Conduct Authority. Member of The Lon don Stock Exchange. Registered office: 4th Floor Millennium Bridge House, 2 Lambeth Hill, London EC4V 3TT. Registered in England No. 2547805 a
subsidiary of Archer Daniels Midland Company. Risk Warning: Investments in Equities, CFDs, Futures, Options, Derivatives and Foreign Exchange can fluctuate in value, investors should therefore be aware that they may not realise the initial amount invested, and indeed may incur
Equity & Commodity Strategy - Fulcanelli Report Paul Mylchreest Email: [email protected] Tel: +44 20 7716 8257
24
However, it’s doing far better in non-dollar currencies like the Euro, although people rarely think this
way.
Source: Bloomberg, ADM ISI
The price had doubled in Roubles at one point.
Source: Bloomberg, ADM ISI
850
900
950
1000
1050
1100
1150
1200
1250
1300
Jan
-13
Feb
-13
Ma
r-13
Ap
r-1
3
Ma
y-1
3
Jun
-13
Jul-
13
Au
g-1
3
Sep
-13
Oct
-13
No
v-1
3
De
c-13
Jan
-14
Feb
-14
Ma
r-14
Ap
r-1
4
Ma
y-1
4
Jun
-14
Jul-
14
Au
g-1
4
Sep
-14
Oct
-14
No
v-1
4
De
c-14
Jan
-15
Feb
-15
Ma
r-15
Gold in Euros (since 2013)
35,000
40,000
45,000
50,000
55,000
60,000
65,000
70,000
75,000
80,000
85,000
90,000
95,000
Jan
-13
Feb
-13
Ma
r-13
Ap
r-1
3
Ma
y-1
3
Jun
-13
Jul-
13
Au
g-1
3
Sep
-13
Oct
-13
No
v-1
3
De
c-13
Jan
-14
Feb
-14
Ma
r-14
Ap
r-1
4
Ma
y-1
4
Jun
-14
Jul-
14
Au
g-1
4
Sep
-14
Oct
-14
No
v-1
4
De
c-14
Jan
-15
Feb
-15
Ma
r-15
Gold in Rubles (since 2013)

ADM Investor Services International Limited is authorised and regulated by The Financial Conduct Authority. Member of The Lon don Stock Exchange. Registered office: 4th Floor Millennium Bridge House, 2 Lambeth Hill, London EC4V 3TT. Registered in England No. 2547805 a
Equity & Commodity Strategy - Fulcanelli Report Paul Mylchreest Email: [email protected] Tel: +44 20 7716 8257
25
25
So gold has started to strengthen in major and minor non-dollar currencies.
As we’ve said numerous times over the years, the gold market is bifurcated between a truly vast amount of trading of paper gold instruments, which only purport to be physical gold, and a tiny amount of actual physical gold. The Reserve Bank of India estimated the paper/physical ratio at 92:1 and price discovery remains ludicrously skewed towards the former.
Historically, when the gold price has been rising and bullion banks have refrained from adding more “paper shorts” (i.e. “Commercials” increasing their net short position on COMEX), the gold price has gone parabolic. Here are three examples in 2005-06, 2007-08 and 2010-11.
Source: Bloomberg, ADM ISI
Let’s go back to the gold/dollar relationship.
In the London market, there was something called GOFO – the Gold Forward Offered Rate – which the LBMA stopped reporting a few weeks ago (funny that). GOFO is the cost, in terms of the interest rate, of borrowing dollars using gold as collateral. GOFO moving close to zero implies that the market has a greater need to borrow physical gold, i.e. to swap it for dollars.
GOFO should never be negative in an efficiently functioning gold market with adequate physical supply.
However, GOFO went negative several times after June 2013 and very negative in November/
December 2014.
-320000
-300000
-280000
-260000
-240000
-220000
-200000
-180000
-160000
-140000
-120000
-100000
-80000
-60000
-40000
-20000
0
20000
40000
60000200
400
600
800
1000
1200
1400
1600
1800
2000
20
01
20
02
20
03
20
04
20
05
20
06
20
07
20
08
20
09
20
10
20
11
Gold Price v. COMEX Net Commercials Futures Positions (2001-11)
Gold Price (US$/oz) Gold Net Commercial Futures Positions (Inverted)

ADM Investor Services International Limited is authorised and regulated by The Financial Conduct Authority. Member of The Lon don Stock Exchange. Registered office: 4th Floor Millennium Bridge House, 2 Lambeth Hill, London EC4V 3TT. Registered in England No. 2547805 a
subsidiary of Archer Daniels Midland Company. Risk Warning: Investments in Equities, CFDs, Futures, Options, Derivatives and Foreign Exchange can fluctuate in value, investors should therefore be aware that they may not realise the initial amount invested, and indeed may incur
Equity & Commodity Strategy - Fulcanelli Report Paul Mylchreest Email: [email protected] Tel: +44 20 7716 8257
26
Source: Bloomberg, ADM ISI
Negative GOFO implied that the market was so short of physical gold that it would PAY you to borrow its DOL-LARS (yes dollars…in which the gold price has been weak) if you lent it your gold for a month. So you got paid to borrow dollars which could then be put on deposit, earning you TWO interest rates.
A scramble to obtain physical gold is indicative of a short time horizon in the gold market.
It’s the same story in the gold futures market, which has been in and out of backwardation in recent months.
The “gold basis” is the difference between the spot price of gold and its price in the near-month futures con-tract. The gold market should always be in contango and should never move into backwardation (negative basis), i.e. where the offer price of the near-month future is lower than the bid price of spot gold. Given the off-the-scale ratio of stock to flows in gold, backwardation implies a risk-free profit from selling spot (physical) gold and buying the future at a lower price with the intention to take delivery.
It’s a risk-free profit unless the market is growing concerned about the availability of physical gold upon expiry of the futures contract. By definition, gold bought in the futures market is a “future good”, whereas physical gold bought on a spot basis is a “present good.”
Time horizons again…and talking of physical gold demand.
Withdrawals of bullion on the Shanghai Gold Exchange (SGE) are a good proxy for Chinese gold demand. Under
Chinese law, all gold either mined domestically or imported has to be sold through the SGE. The SGE regulations
(Article 23) specify that bars which have been withdrawn cannot be re-deposited. If they are re-deposited, with-
drawn SGE bars have to be recast and assayed into new bars which count as scrap supply. In addition, please
note that the Chinese central bank does not purchase gold on the SGE, so its purchases (which are only disclosed
every 6 years) are additional.
In each of the last five months (September 2014 – January 2015) SGE withdrawals have been in excess of 200
tonnes. In the last two months, they have equated to more than 100% of the output of all of the world’s gold
mines.

ADM Investor Services International Limited is authorised and regulated by The Financial Conduct Authority. Member of The Lon don Stock Exchange. Registered office: 4th Floor Millennium Bridge House, 2 Lambeth Hill, London EC4V 3TT. Registered in England No. 2547805 a
Equity & Commodity Strategy - Fulcanelli Report Paul Mylchreest Email: [email protected] Tel: +44 20 7716 8257
27
27
Source: Bloomberg, ADM ISI
So, we have one customer increasing its demand to more than 100% of world production, coupled with free market indications (GOFO, futures backwardation) of tightness, yet we see a decline in price. Just to hammer home the point, the next chart aggregates the four major identifiable sources of global gold demand and plots them on a monthly basis. These are:
Gold withdrawals on the Shanghai Gold Exchange (data from the SGE);
Gross gold imports into India;
Net change in gold holdings of all-known ETFs (Bloomberg); and
Net change in central bank gold holdings (WGC, quarterly data weighted on a monthly basis ac-
cording to the WGC’s incomplete data for the latter).
Source: Bloomberg, ADM ISI
0
25
50
75
100
125
150
175
200
225
250
275
Jan
-10
Ma
r-10
Ma
y-1
0
Jul-
10
Sep
-10
No
v-1
0
Jan
-11
Ma
r-11
Ma
y-1
1
Jul-
11
Sep
-11
No
v-1
1
Jan
-12
Ma
r-12
Ma
y-1
2
Jul-
12
Sep
-12
No
v-1
2
Jan
-13
Ma
r-13
Ma
y-1
3
Jul-
13
Sep
-13
No
v-1
3
Jan
-14
Ma
r-14
Ma
y-1
4
Jul-
14
Sep
-14
No
v-1
4
Jan
-15
Shanghai Gold Exchange: Monthly Withdrawals (tonnes)
World gold mine output monthly - 233 tonnes
0
50
100
150
200
250
300
350
400
Jan
-10
Ma
r-10
Ma
y-1
0
Jul-
10
Sep
-10
No
v-1
0
Jan
-11
Ma
r-11
Ma
y-1
1
Jul-
11
Sep
-11
No
v-1
1
Jan
-12
Ma
r-12
Ma
y-1
2
Jul-
12
Sep
-12
No
v-1
2
Jan
-13
Ma
r-13
Ma
y-1
3
Jul-
13
Sep
-13
No
v-1
3
Jan
-14
Ma
r-14
Ma
y-1
4
Jul-
14
Sep
-14
No
v-1
4
Jan
-15
Gold Demand - Major Swing Factors (tonnes/month)
India Gold Import Duty 2% 4% 6% 8% 10%
World gold mine output monthly - 233t
ADM Investor Services International Limited is authorised and regulated by The Financial Conduct Authority. Member of The Lon don Stock Exchange. Registered office: 4th Floor Millennium Bridge House, 2 Lambeth Hill, London EC4V 3TT. Registered in England No. 2547805 a
subsidiary of Archer Daniels Midland Company. Risk Warning: Investments in Equities, CFDs, Futures, Options, Derivatives and Foreign Exchange can fluctuate in value, investors should therefore be aware that they may not realise the initial amount invested, and indeed may incur
Equity & Commodity Strategy - Fulcanelli Report Paul Mylchreest Email: [email protected] Tel: +44 20 7716 8257
28
In aggregate, the four major identifiable sources of demand (SGE, Indian imports, ETFs, central banks) have exceeded 100% of world gold mining output for last 6 months. The latest figure, for January 2015, of 349.7 tonnes was equivalent to 150.0% of world gold mine output.
This is probably the biggest unreported “run” on the banks, or rather a “run on bank vaults” in history. You wouldn’t know it, though, from the gold price. Very clever.
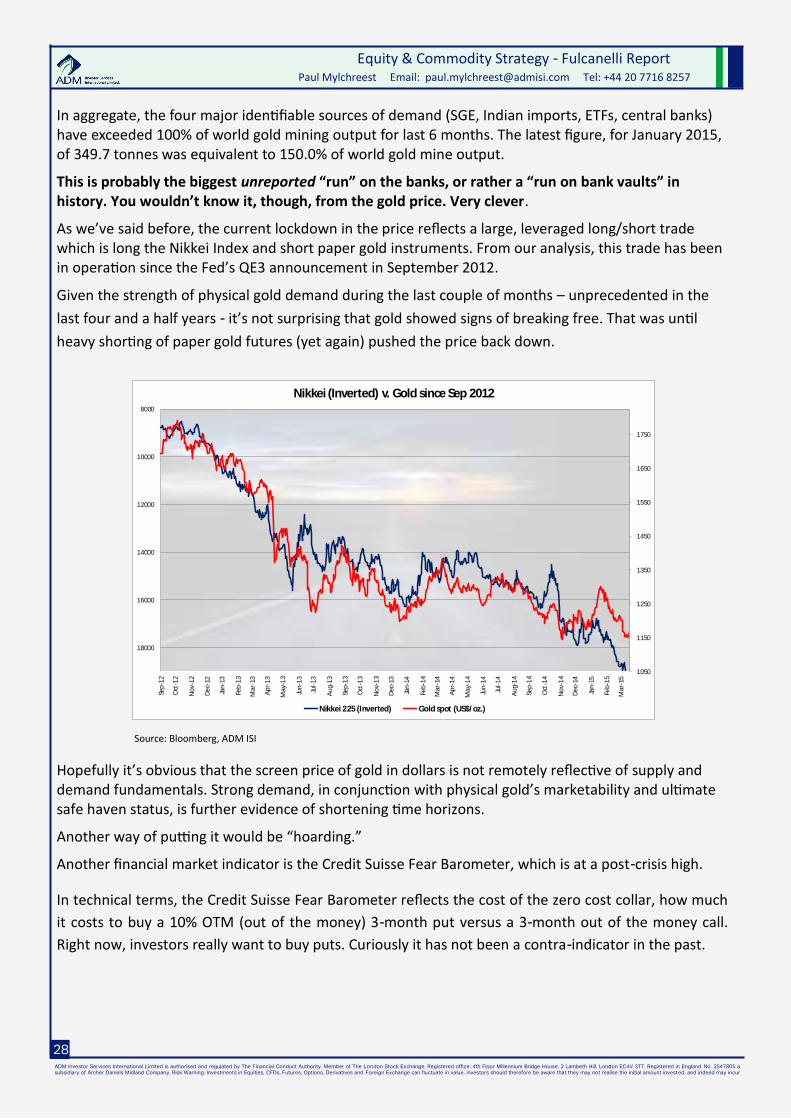
As we’ve said before, the current lockdown in the price reflects a large, leveraged long/short trade which is long the Nikkei Index and short paper gold instruments. From our analysis, this trade has been in operation since the Fed’s QE3 announcement in September 2012.
Given the strength of physical gold demand during the last couple of months – unprecedented in the
last four and a half years - it’s not surprising that gold showed signs of breaking free. That was until
heavy shorting of paper gold futures (yet again) pushed the price back down.
Source: Bloomberg, ADM ISI
Hopefully it’s obvious that the screen price of gold in dollars is not remotely reflective of supply and demand fundamentals. Strong demand, in conjunction with physical gold’s marketability and ultimate safe haven status, is further evidence of shortening time horizons.
Another way of putting it would be “hoarding.”
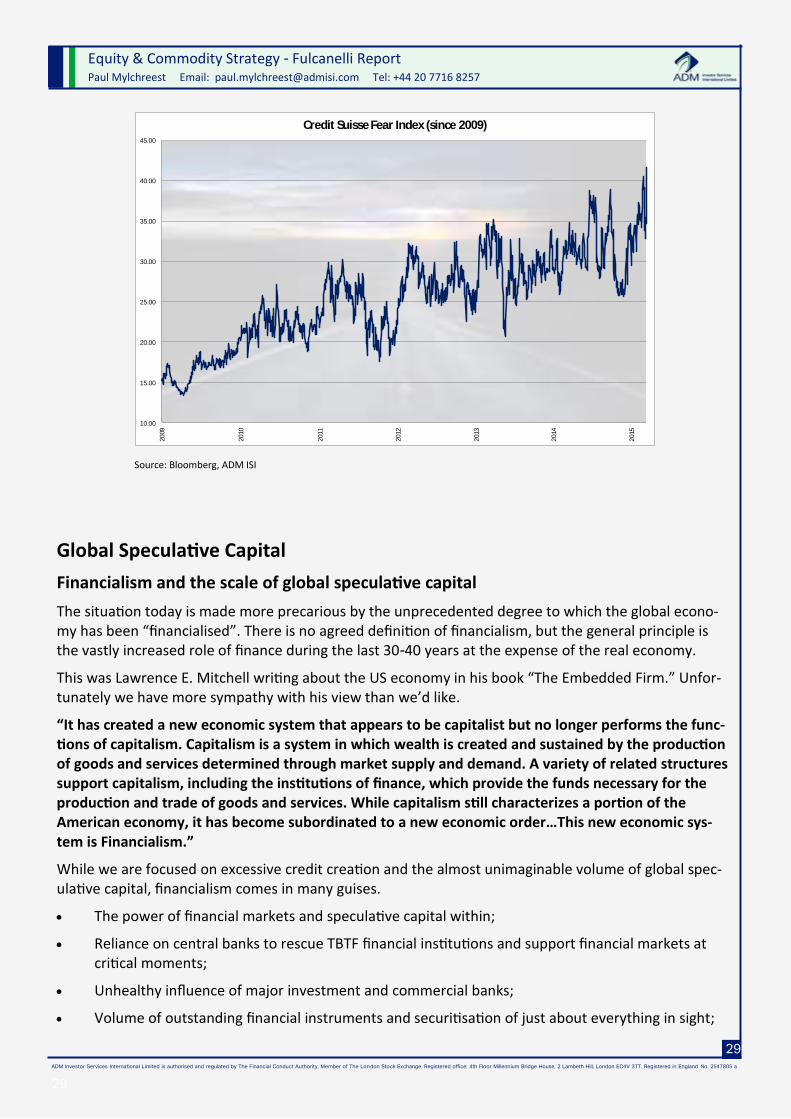
Another financial market indicator is the Credit Suisse Fear Barometer, which is at a post-crisis high.
In technical terms, the Credit Suisse Fear Barometer reflects the cost of the zero cost collar, how much
it costs to buy a 10% OTM (out of the money) 3-month put versus a 3-month out of the money call.
Right now, investors really want to buy puts. Curiously it has not been a contra-indicator in the past.
1050
1150
1250
1350
1450
1550
1650
1750
8000
10000
12000
14000
16000
18000
Sep
-12
Oct
-12
No
v-1
2
De
c-12
Jan
-13
Feb
-13
Ma
r-13
Ap
r-1
3
Ma
y-1
3
Jun
-13
Jul-
13
Au
g-1
3
Sep
-13
Oct
-13
No
v-1
3
De
c-13
Jan
-14
Feb
-14
Ma
r-14
Ap
r-1
4
Ma
y-1
4
Jun
-14
Jul-
14
Au
g-1
4
Sep
-14
Oct
-14
No
v-1
4
De
c-14
Jan
-15
Feb
-15
Ma
r-15
Nikkei (Inverted) v. Gold since Sep 2012
Nikkei 225 (Inverted) Gold spot (US$/oz.)
ADM Investor Services International Limited is authorised and regulated by The Financial Conduct Authority. Member of The Lon don Stock Exchange. Registered office: 4th Floor Millennium Bridge House, 2 Lambeth Hill, London EC4V 3TT. Registered in England No. 2547805 a
Equity & Commodity Strategy - Fulcanelli Report Paul Mylchreest Email: [email protected] Tel: +44 20 7716 8257
29
29
Source: Bloomberg, ADM ISI
Global Speculative Capital
Financialism and the scale of global speculative capital
The situation today is made more precarious by the unprecedented degree to which the global econo-my has been “financialised”. There is no agreed definition of financialism, but the general principle is the vastly increased role of finance during the last 30-40 years at the expense of the real economy.
This was Lawrence E. Mitchell writing about the US economy in his book “The Embedded Firm.” Unfor-tunately we have more sympathy with his view than we’d like.
“It has created a new economic system that appears to be capitalist but no longer performs the func-tions of capitalism. Capitalism is a system in which wealth is created and sustained by the production of goods and services determined through market supply and demand. A variety of related structures support capitalism, including the institutions of finance, which provide the funds necessary for the production and trade of goods and services. While capitalism still characterizes a portion of the American economy, it has become subordinated to a new economic order…This new economic sys-tem is Financialism.”
While we are focused on excessive credit creation and the almost unimaginable volume of global spec-ulative capital, financialism comes in many guises.
The power of financial markets and speculative capital within;
Reliance on central banks to rescue TBTF financial institutions and support financial markets at critical moments;
Unhealthy influence of major investment and commercial banks;
Volume of outstanding financial instruments and securitisation of just about everything in sight;
10.00
15.00
20.00
25.00
30.00
35.00
40.00
45.00
20
09
20
10
20
11
20
12
20
13
20
14
20
15
Credit Suisse Fear Index (since 2009)

ADM Investor Services International Limited is authorised and regulated by The Financial Conduct Authority. Member of The Lon don Stock Exchange. Registered office: 4th Floor Millennium Bridge House, 2 Lambeth Hill, London EC4V 3TT. Registered in England No. 2547805 a
subsidiary of Archer Daniels Midland Company. Risk Warning: Investments in Equities, CFDs, Futures, Options, Derivatives and Foreign Exchange can fluctuate in value, investors should therefore be aware that they may not realise the initial amount invested, and indeed may incur
Equity & Commodity Strategy - Fulcanelli Report Paul Mylchreest Email: [email protected] Tel: +44 20 7716 8257
30
Financially-driven transactions, e.g. share buybacks;
High frequency and algorithmic trading methods;
Financial performance targeting;
Personnel involved in financial services (including compliance); and
Innovation in financial instruments, especially in derivatives (“claims on claims on claims” which become ever more removed from what most people would view as “reality”).
This was Jeffrey Snider of Alhambra Investment Partners writing in January 2015 about financialism and the role of the Eurodollar markets in creating the tsunami of global speculative capital.
“There was no ‘global savings glut’ as the increase in available finance for speculation was created and nurtured by that very federal funds rate. Bubbles are not the end result of decades of positive and productive expansion, but rather the intrusion of finance over and far above any rational means to service actual economic activity – the system is upside down as finance rules all now…
“The conjuring of ‘dollars’ was based on one accounting regulation, namely that US banks operating in NYC (or foreign bank subsidiaries) could use eurodollar liabilities as their own (with or without a holding company structure), and as such that eurodollars were ‘real.’ That was aided in no small part by Alan Greenspan himself who lobbied and received board approval to end any ‘capital’ charge on eurodollar liabilities in 1990. The global ‘dollar’ complex thus connected everywhere the ‘dollar’ as reserve currency penetrated – which was far and wide. This ‘hot money’ bastardization of the global economy was thus predicated on not decades of decent economic stewardship but rather height-ened appetites for bank balance sheet growth in eurodollar markets.”
Source: ADMISI, Bloomberg
In September 2014, the BIS published a paper “Why does financial sector growth crowd out real eco-
nomic growth?” It concluded that the expansion of the financial sector is only positive up to a point,
after which it becomes a drag on growth and productivity. The chart below shows the relationship be-
tween the financial sector’s share of employment growth on the horizontal axis and growth in GDP-per
-worker growth on the vertical axis as deviations from their country means.

ADM Investor Services International Limited is authorised and regulated by The Financial Conduct Authority. Member of The Lon don Stock Exchange. Registered office: 4th Floor Millennium Bridge House, 2 Lambeth Hill, London EC4V 3TT. Registered in England No. 2547805 a
Equity & Commodity Strategy - Fulcanelli Report Paul Mylchreest Email: [email protected] Tel: +44 20 7716 8257
31
31
Source: BIS
From the BIS paper.
“financial booms are not, in general, growth-enhancing, likely because the financial sector competes with the rest of the economy for resources. Second, using sectoral data, we examine the distribution-al nature of this effect and find that credit booms harm what we normally think of as the engines for growth – those that are more R&D intensive.”
We can’t ignore the role of central banks in creating the monster of financialism.
Central banks are important facilitators of financialism via ZIRP policies, credit creation and subversion of free markets. It has reflected an ongoing takeover by an interlocking supranational state apparatus, although the vast majority have been slow to see it for what it is.
The ECB and BoJ are pouring more “gasoline” on to the $10 trillion liquidity infusion fire with their cur-
rent programmes which are set to add an additional US$1.5 trillion during the next 12 months.
The ECB’s recently announced QE was, in some ways, a perfect example of some of the least attractive
aspects of financialism. Few people (us included) think that c.Eur1.05 trillion of securities purchases by
September 2016 will be of significant benefit on Eurozone economic growth. Ironically, this also seemed
to be Mario Draghi’s view as he argued time and again that action from Eurozone governments and the
European Commission was needed on the growth front.
Draghi’s threats to instigate QE eventually caught up with him as financial markets had already dis-counted much of the benefit, e.g. via substantial declines in peripheral bond yields. After jawboning for so long, there would have been a violent reaction in bonds and equities had Draghi failed to provide the additional credit infusion that financial markets were not only demanding, but had heavily discounted.
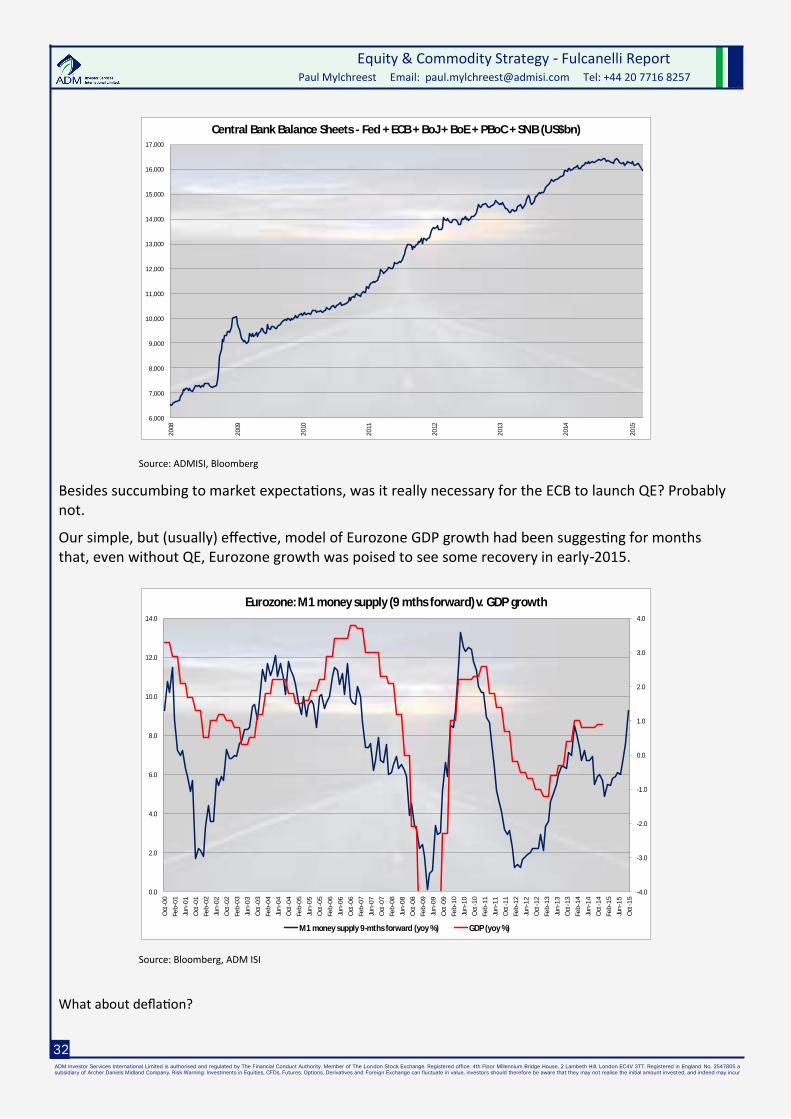
ADM Investor Services International Limited is authorised and regulated by The Financial Conduct Authority. Member of The Lon don Stock Exchange. Registered office: 4th Floor Millennium Bridge House, 2 Lambeth Hill, London EC4V 3TT. Registered in England No. 2547805 a
subsidiary of Archer Daniels Midland Company. Risk Warning: Investments in Equities, CFDs, Futures, Options, Derivatives and Foreign Exchange can fluctuate in value, investors should therefore be aware that they may not realise the initial amount invested, and indeed may incur
Equity & Commodity Strategy - Fulcanelli Report Paul Mylchreest Email: [email protected] Tel: +44 20 7716 8257
32
Source: ADMISI, Bloomberg
Besides succumbing to market expectations, was it really necessary for the ECB to launch QE? Probably not.
Our simple, but (usually) effective, model of Eurozone GDP growth had been suggesting for months that, even without QE, Eurozone growth was poised to see some recovery in early-2015.
Source: Bloomberg, ADM ISI
What about deflation?
6,000
7,000
8,000
9,000
10,000
11,000
12,000
13,000
14,000
15,000
16,000
17,000
20
08
20
09
20
10
20
11
20
12
20
13
20
14
20
15
Central Bank Balance Sheets - Fed + ECB + BoJ + BoE + PBoC + SNB (US$bn)
-4.0
-3.0
-2.0
-1.0
0.0
1.0
2.0
3.0
4.0
0.0
2.0
4.0
6.0
8.0
10.0
12.0
14.0
Oct
-00
Feb
-01
Jun
-01
Oct
-01
Feb
-02
Jun
-02
Oct
-02
Feb
-03
Jun
-03
Oct
-03
Feb
-04
Jun
-04
Oct
-04
Feb
-05
Jun
-05
Oct
-05
Feb
-06
Jun
-06
Oct
-06
Feb
-07
Jun
-07
Oct
-07
Feb
-08
Jun
-08
Oct
-08
Feb
-09
Jun
-09
Oct
-09
Feb
-10
Jun
-10
Oct
-10
Feb
-11
Jun
-11
Oct
-11
Feb
-12
Jun
-12
Oct
-12
Feb
-13
Jun
-13
Oct
-13
Feb
-14
Jun
-14
Oct
-14
Feb
-15
Jun
-15
Oct
-15
Eurozone: M1 money supply (9 mths forward) v. GDP growth
M1 money supply 9-mths forward (yoy %) GDP (yoy %)

ADM Investor Services International Limited is authorised and regulated by The Financial Conduct Authority. Member of The Lon don Stock Exchange. Registered office: 4th Floor Millennium Bridge House, 2 Lambeth Hill, London EC4V 3TT. Registered in England No. 2547805 a
Equity & Commodity Strategy - Fulcanelli Report Paul Mylchreest Email: [email protected] Tel: +44 20 7716 8257
33
33
Well mild deflation, which is what we have in Spain and Italy, for example, increases consumer purchas-ing power. Retail sales volumes have been trending higher in both countries.
Source: ADMISI, Bloomberg
Draghi, like Abe/Kuroda, by swamping the system with new credit is determined to diminish purchasing
power in an already weak economic environment. Genius.
As central banks continue to add to the credit bubble and “financialism” reaches extremes which would have been unimaginable a few years ago, we are at greater and greater risk from surges/or reversals in flows of global speculative capital.
In the right conditions, it can overwhelm almost anything in its path. Economic and financial models and statements from policy makers never take account of this risk. For some reason, it reminds us of that quote from former heavyweight boxing champion, Mike Tyson.
“Everybody has a plan until they get punched in the mouth.”
In its static state, global speculative capital, or “hot money”, represents potential energy which can quickly change into kinetic energy, like a snowball at the top of a mountain or a battering ram.
Mass times velocity.
The potential energy in terms of speculative capital which could flow is now almost beyond comprehen-sion, although the inter-connectedness of global finance is hardly a new phenomenon (e.g. see the dis-cussions of the Panic of 1873, 1929 and 1987 below).
When “hot money” shifts in size, e.g. out of emerging nations, out of the shale industry, or into the Swiss franc, there can be substantial impacts on asset prices, access to funding and its cost, the P&L’s and balance sheets of businesses and financial players (especially leveraged ones), capital investment budgets and complicated feedback loops which include consumer confidence. For example, the cheap credit which was advanced to the US shale industry had the appearance of “capital” until recently. Now it has the appearance of “negative capital” in some cases.
-12.0
-10.0
-8.0
-6.0
-4.0
-2.0
0.0
2.0
4.0
6.0
8.0
20
09
20
10
20
11
20
12
20
13
20
14
Retail Sales Volumes: Spain and Italy (yoy %)
Spain Italy

ADM Investor Services International Limited is authorised and regulated by The Financial Conduct Authority. Member of The Lon don Stock Exchange. Registered office: 4th Floor Millennium Bridge House, 2 Lambeth Hill, London EC4V 3TT. Registered in England No. 2547805 a
subsidiary of Archer Daniels Midland Company. Risk Warning: Investments in Equities, CFDs, Futures, Options, Derivatives and Foreign Exchange can fluctuate in value, investors should therefore be aware that they may not realise the initial amount invested, and indeed may incur
Equity & Commodity Strategy - Fulcanelli Report Paul Mylchreest Email: [email protected] Tel: +44 20 7716 8257
34
There’s never been more speculative global capital, although precisely how much remains unclear.
Having said that, a recent IMF paper “Asset Bubbles: Re-thinking Policy for the Age of Asset Manage-ment” gives us some idea of the growth in the market value of quoted financial assets between 1980-2012.
“As global capital markets continue to expand in scale and scope, there are further reasons to expect
asset price movements to attract the close attention of policy makers. The stock of globally traded
financial assets (i.e. excluding real estate) has expanded sharply over recent decades, from US$7 tril-
lion (71 percent of world GDP) to US$163 trillion (226 per-cent of world GDP) between 1980 and
2012.”
And that was in 2012. Like McKinsey’s estimate for global debt, it must be approaching US$200 trillion now. And that doesn’t include the several hundred trillion dollars notional of derivatives.
Making matters worse is the increasing pro-cyclicality of speculative capital as institutional ownership and short-term performance requirements continue to grow.
It reminds us of the quote in the Wall Street movie from the Lou Mannheim character, who acts as the voice of reason on several occasions.
“Too much cheap money sloshing around the world.”
Volatility and the turning point in mid-2014
We think that the shortening of time horizons is beginning to, for want of a better word, “disturb” glob-al speculative capital. Speculative capital is getting nervous and starting to move towards safer havens in general.
We would pinpoint the start of this trend as late-June/early-July 2014 - which coincided with the start of the major upward move in the dollar.
Source: ADMISI, Bloomberg

ADM Investor Services International Limited is authorised and regulated by The Financial Conduct Authority. Member of The Lon don Stock Exchange. Registered office: 4th Floor Millennium Bridge House, 2 Lambeth Hill, London EC4V 3TT. Registered in England No. 2547805 a
Equity & Commodity Strategy - Fulcanelli Report Paul Mylchreest Email: [email protected] Tel: +44 20 7716 8257
35
35
Risk remains contained as long as capital flows remain relatively orderly, but it doesn’t go away. Ronni Stoeferle, a portfolio manager at Incrementum AG in Liechenstein has noted that.
“The superficial veiling of risks, therefore, also leads to superficial stability.”
Raoul Pal of GMI has his own take on this.
“Suppression of volatility leads to hyper-volatility.”
Which precisely describes what happened to the Swiss franc (see below).
Our knowledge of financial history tells us to watch the currency markets - currency volatility is often a good indicator of future instability. Signs of trouble can materialise in currency markets before having significant impacts on other asset prices. Examples include 1873, 1929 (currency effect much misunder-stood), 1982, 1987 and 1997 to name a few.
The “Panic of 1873”
This triggered a depression in Europe and North America which followed a worldwide boom in equity markets focused on railway speculation. However, the problems began with a currency crisis when Ger-many shifted from a silver standard to a gold standard following the Franco-Prussian War.
This led to a drop in the price of silver which hit the US mining industry, which was a major supplier. The Coinage Act of 1873 moved the US to a de facto gold standard which put further pressure on silver prices. This reduced US money supply and raised interest rates.
The catalyst for the crisis was the crash of the Vienna Stock Exchange in May 1873. This bankrupted several Austrian banks and led to bank failures in other European countries, including Britain. The flow of British capital across the Atlantic, which was helping to finance the American railroad boom, was re-versed. With the crisis in the silver market already tightening monetary policy, it was the collapse of Jay Cooke & Co., which had over-extended itself in the bonds of the Northern Pacific Railway, which precip-itated a stock market crash and knock-on US bank failures.
The 1929 Crash and Great Depression
The usual explanation for the Crash of 1929 is that the Federal Reserve began raising rates in the early part of 1928 and the policy tightening eventually pricked the stock market bubble in October 1929. The reality is a little more complicated and involves currencies and flows in speculative global capital (and gold), which is the reason for mentioning it in this report.
In apportioning blame, policy makers in France and the UK share significant responsibility along with those in the US. For context, let’s briefly rewind to World War I, The major combatants abandoned the gold standard in order to finance their role in the conflict. This caused inflation and left high levels of debt, especially in Britain, France and Germany. In the mid-1920s, nations began returning to the gold standard to control inflation. Under this system, exchange rates were fixed and central banks were re-quired to keep a gold cover ratio amounting to a minimum of 30-40% of currency in circulation and bank deposits.

ADM Investor Services International Limited is authorised and regulated by The Financial Conduct Authority. Member of The Lon don Stock Exchange. Registered office: 4th Floor Millennium Bridge House, 2 Lambeth Hill, London EC4V 3TT. Registered in England No. 2547805 a
subsidiary of Archer Daniels Midland Company. Risk Warning: Investments in Equities, CFDs, Futures, Options, Derivatives and Foreign Exchange can fluctuate in value, investors should therefore be aware that they may not realise the initial amount invested, and indeed may incur
Equity & Commodity Strategy - Fulcanelli Report Paul Mylchreest Email: [email protected] Tel: +44 20 7716 8257
36
The problems began with the exchange rates adopted by certain key nations. Britain returned at its pre-war rate which overvalued the pound and basically guaranteed deflation, a need for higher interest rates (to support the pound) and a deficit on its balance of payments. The latter were financed by gold outflows (exports). In stark contrast, France adopted an exchange rate which undervalued the franc. This made its exports very competitive and led to balance of payments surpluses and gold inflows. The system should have been self-correcting, i.e. gold inflows in France should have increased the money supply leading to higher prices for French goods. The resulting impact on competitiveness would have weakened the balance of payments, leading to gold outflows, thereby bringing the system back to equi-librium.
Unfortunately, the Bank of France (still traumatised by the severe inflation of 1924-26) and the Federal Reserve (when gold inflows resumed in 1928) decided to sterilise the gold inflows rather than monetise them. Although US gold holdings increased slightly during 1928-30, the scale of increase in France’s gold reserves is almost mind boggling. Its share of world gold reserves increased from 7% in 1926 to about 17% in 1929 and 32% in 1932. Cover ratios (ratio of gold to currency and bank deposits) in the US and France rose to almost 50% in France and nearly 70% (from a higher base) in the US in 1929. This had an increasingly deflationary effect on the world economy as other nations were forced to follow rate increases and contract their money supply.
In early 1929, Keynes warned that central banks would compete for gold, forcing each other to tighten policy out of self-protection, which would cause deflation. He got that one right. In the 1990s, Milton Friedman commented that if he had been aware of the scale of French gold imports, he would have as-signed a much greater contribution in his famous “Monetary History of the United States” to France’s role in the Great Depression.
After Britain went back on the gold standard in 1925, the US, the Federal Reserve had been keeping in-terest rates low, in part to help Britain with its balance of payments/gold outflow problem. In the Sum-mer of 1927, as the US economy was poised to emerge from a mild recession, the Fed cut the discount rate from 4.0% to 3.5% and instituted open market operations in which it bought Treasuries. This left the banks with high levels of surplus cash, much of which started to find its way into the call loan mar-ket. Here the borrowers were stock brokers and traders pledging stocks as collateral for loans for stock speculation on margin. Not surprisingly, this helped to fuel the emerging boom in equity prices.
In the mid-1920s, the US had been making large loans to Germany to help with its war reparations and recovery. However, outflows of capital and gold from the US to Europe reversed when the Fed raised the discount rate in steps from 3.5% to 5.0% during January-July 1928. So in 1928-29, gold was flowing into both the US and (especially) France, leaving less to go around elsewhere.
The Fed’s rate increases were aimed at curtailing excessive speculation on Wall Street, but they failed.
This is from the Federal Reserve Bulletin in early-1929.
“During the last year or more, however, the functioning of the Federal Reserve system has encoun-tered interference by reason of the excessive amount of the country’s credit absorbed in speculative security loans. The credit situation since the opening of the new year indicates that some of the fac-tors which occasioned untoward developments during the year 1928 are still at work.”
While US banks cut back on their lending to the call loan market, their role was more than compen-sated for by non-banks/foreigners attracted by interest rates which peaked at more than 14%. Gold and capital were flowing into the US from Britain, Germany and other nations.

ADM Investor Services International Limited is authorised and regulated by The Financial Conduct Authority. Member of The Lon don Stock Exchange. Registered office: 4th Floor Millennium Bridge House, 2 Lambeth Hill, London EC4V 3TT. Registered in England No. 2547805 a
Equity & Commodity Strategy - Fulcanelli Report Paul Mylchreest Email: [email protected] Tel: +44 20 7716 8257
37
37
In February 1929, the Bank of England raised the bank rate to 5.5%. The Economist argued that:
“the 5.5% rate comes as a definite signal to America…that Europe is not prepared to stand idly by and see the world’s stocks sucked into a maelstrom…In any case, the establishment of European in-terest rates upon a new and higher level may well draw gold back from New York before long; and if so the 5.5% rate will have done its work.”
It didn’t and after a temporary hiatus, the outflows resumed. The Fed raised its discount rate to 6.0% on 9 August 1929 and the Dow Jones peaked about a month later on 3 September 1929…but there was no crash (yet). The coup de grace came shortly after from the Bank of England. On 26 September 1929, it raised the bank rate to 6.5% and The Economist reported Chancellor of the Exchequer Snowden’s comments in its 4 October 1929 edition:
“In New York, with America’s plethora of liquid capital and high rates, there has been a usual year’s orgy of speculation, draining money away from England…There has been a raid on the financial re-sources of this country which the increased bank rate is now intended to check. The object of the increased rate is to draw money back to England.”
Snowden’s comments led to increased volatility in the Dow Jones in early October and the BoE’s action withdrew funding from the call loan market. With so much stock bought on margin, and the collateral for loans being stocks whose prices were declining, many investors had no option but to sell when the crash began later that month. In the wake of the crash, The Economist on 23 November 1929 was praising the Bank of England’s contribution via its rate increase…with little idea of what the next four years had in store.
“That advance…was a by no means negligible factor in turning the opposite direction the tide of funds which had been flowing so strongly toward New York, and in causing the edifice of the Ameri-can speculation to totter.”
1987 Crash
The background to the 1987 Crash was the repatriation of Japanese capital due to the falling dollar (currencies again). With the signing of the Plaza Accord on 22 September 1985, the US, Japan, West Germany, UK and France agreed to intervene in the currency markets to reduce the value of the dollar in relation to the Yen and the Deutschemark. The situation reached a head when US Treasury Secre-tary, James Baker, threatened to devalue the dollar further during the weekend before the “Black Monday” market crash if Germany didn’t reverse its interest rate rise. The flow of speculative capital into Japan, which was also encouraged by expansionary policies aimed at overcoming the impact on Japan’s export-dependent economy from the strength of the Yen, helped to drive the final stages of the Japanese asset bubble. The latter reached a climax with the peak in the Nikkei in late December 1989.

ADM Investor Services International Limited is authorised and regulated by The Financial Conduct Authority. Member of The Lon don Stock Exchange. Registered office: 4th Floor Millennium Bridge House, 2 Lambeth Hill, London EC4V 3TT. Registered in England No. 2547805 a
subsidiary of Archer Daniels Midland Company. Risk Warning: Investments in Equities, CFDs, Futures, Options, Derivatives and Foreign Exchange can fluctuate in value, investors should therefore be aware that they may not realise the initial amount invested, and indeed may incur
Equity & Commodity Strategy - Fulcanelli Report Paul Mylchreest Email: [email protected] Tel: +44 20 7716 8257
38
Currency volatility bottomed in late-June/early-July 2014.
Source: ADMISI, Bloomberg
Immediately after the low in currency volatility, came the recent low in volatility in the US Treasury market, as reflected in the MOVE index (Merrill Option Volatility Estimate – implied volatility on 1-month Treasury options).
Source: ADMISI, Bloomberg
2.00
4.00
6.00
8.00
10.00
12.00
14.00
16.00
18.00
20.00
22.00
24.00
20
04
20
05
20
06
20
07
20
08
20
09
20
10
20
11
20
12
20
13
20
14
20
15
Currency Volatility (CVIX)
0.0
50.0
100.0
150.0
200.0
250.0
300.0
20
04
20
05
20
06
20
07
20
08
20
09
20
10
20
11
20
12
20
13
20
14
20
15
Treasury Volatility (MOVE)

ADM Investor Services International Limited is authorised and regulated by The Financial Conduct Authority. Member of The Lon don Stock Exchange. Registered office: 4th Floor Millennium Bridge House, 2 Lambeth Hill, London EC4V 3TT. Registered in England No. 2547805 a
Equity & Commodity Strategy - Fulcanelli Report Paul Mylchreest Email: [email protected] Tel: +44 20 7716 8257
39
39
Fails-to-deliver in the US repo market became more frequent signalling a tightening in dollar funding markets (since QE3).
Source: Bloomberg, ADM ISI
Crude oil volatility also bottomed in the middle of last year.
Source: Bloomberg, ADM ISI
0
20,000
40,000
60,000
80,000
100,000
120,000
140,000
160,000
180,000
200,000
Sep
-12
Oct
-12
No
v-1
2
De
c-12
Jan
-13
Feb
-13
Ma
r-13
Ap
r-1
3
Ma
y-1
3
Jun
-13
Jul-
13
Au
g-1
3
Sep
-13
Oct
-13
No
v-1
3
De
c-13
Jan
-14
Feb
-14
Ma
r-14
Ap
r-1
4
Ma
y-1
4
Jun
-14
Jul-
14
Au
g-1
4
Sep
-14
Oct
-14
No
v-1
4
De
c-14
Jan
-15
Feb
-15
US Treasury Securities Fails to Deliver, US$m (since QE3)
0
5
10
15
20
25
30
35
40
45
50
55
Jan
-13
Feb
-13
Ma
r-13
Ap
r-1
3
Ma
y-1
3
Jun
-13
Jul-
13
Au
g-1
3
Sep
-13
Oct
-13
No
v-1
3
De
c-13
Jan
-14
Feb
-14
Ma
r-14
Ap
r-1
4
Ma
y-1
4
Jun
-14
Jul-
14
Au
g-1
4
Sep
-14
Oct
-14
No
v-1
4
De
c-14
Jan
-15
Feb
-15
Ma
r-15
Merrill Lynch 3-month WTI Volatility Index (since 2013)

ADM Investor Services International Limited is authorised and regulated by The Financial Conduct Authority. Member of The Lon don Stock Exchange. Registered office: 4th Floor Millennium Bridge House, 2 Lambeth Hill, London EC4V 3TT. Registered in England No. 2547805 a
subsidiary of Archer Daniels Midland Company. Risk Warning: Investments in Equities, CFDs, Futures, Options, Derivatives and Foreign Exchange can fluctuate in value, investors should therefore be aware that they may not realise the initial amount invested, and indeed may incur
Equity & Commodity Strategy - Fulcanelli Report Paul Mylchreest Email: [email protected] Tel: +44 20 7716 8257
40
The crude price began its accelerated decline at the same time.
High yield rates bottomed.
Source: Bloomberg, ADM ISI
And the JPMorgan/Markit global Composite PMI peaked in mid-2014.
Source: Bloomberg, ADM ISI
3.00
3.25
3.50
3.75
4.00
4.25
4.50
4.75
5.00
5.25
5.50
5.75
Jan
-13
Feb
-13
Ma
r-13
Ap
r-1
3
Ma
y-1
3
Jun
-13
Jul-
13
Au
g-1
3
Sep
-13
Oct
-13
No
v-1
3
De
c-13
Jan
-14
Feb
-14
Ma
r-14
Ap
r-1
4
Ma
y-1
4
Jun
-14
Jul-
14
Au
g-1
4
Sep
-14
Oct
-14
No
v-1
4
De
c-14
Jan
-15
Feb
-15
Ma
r-15
Barclays US Corporate High Yield Average % (since 2013)
50.0
51.0
52.0
53.0
54.0
55.0
56.0
Jan
-13
Feb
-13
Ma
r-13
Ap
r-1
3
Ma
y-1
3
Jun
-13
Jul-
13
Au
g-1
3
Sep
-13
Oct
-13
No
v-1
3
De
c-13
Jan
-14
Feb
-14
Ma
r-14
Ap
r-1
4
Ma
y-1
4
Jun
-14
Jul-
14
Au
g-1
4
Sep
-14
Oct
-14
No
v-1
4
De
c-14
Jan
-15
Feb
-15
JPMorgan/Markit Global Manufacturing PMI (since 2013)
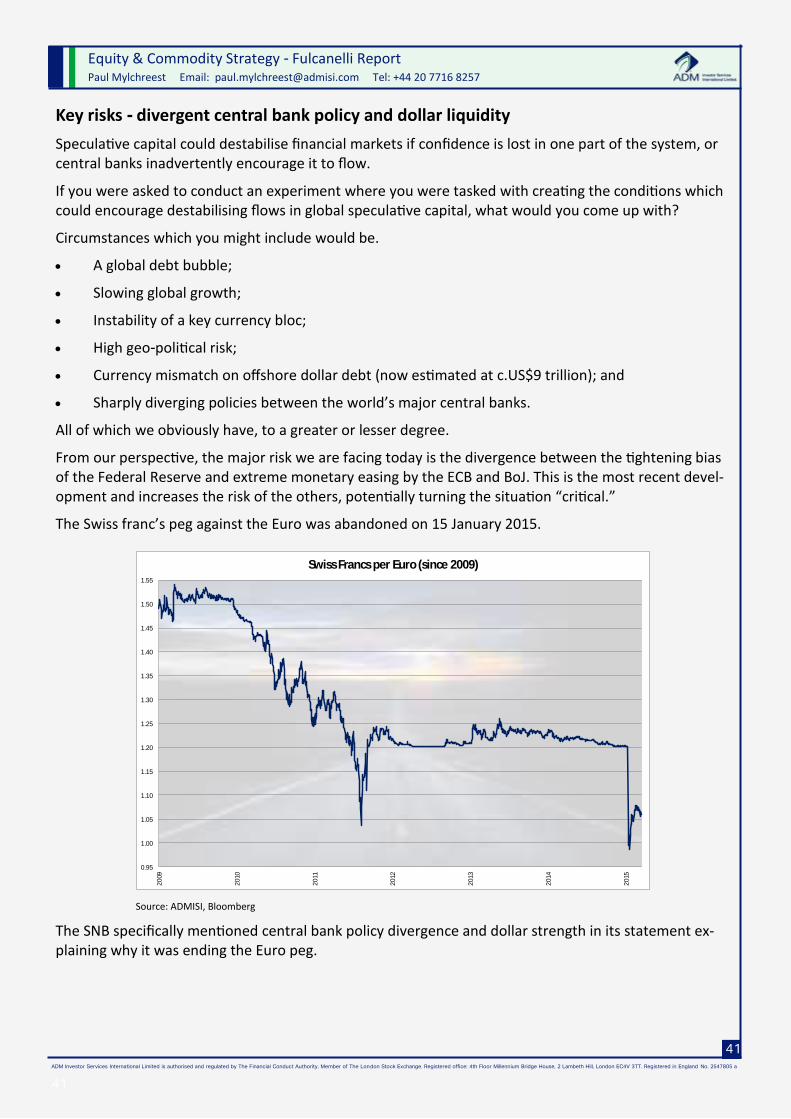
ADM Investor Services International Limited is authorised and regulated by The Financial Conduct Authority. Member of The Lon don Stock Exchange. Registered office: 4th Floor Millennium Bridge House, 2 Lambeth Hill, London EC4V 3TT. Registered in England No. 2547805 a
Equity & Commodity Strategy - Fulcanelli Report Paul Mylchreest Email: [email protected] Tel: +44 20 7716 8257
41
41
Key risks - divergent central bank policy and dollar liquidity
Speculative capital could destabilise financial markets if confidence is lost in one part of the system, or central banks inadvertently encourage it to flow.
If you were asked to conduct an experiment where you were tasked with creating the conditions which could encourage destabilising flows in global speculative capital, what would you come up with?
Circumstances which you might include would be.
A global debt bubble;
Slowing global growth;
Instability of a key currency bloc;
High geo-political risk;
Currency mismatch on offshore dollar debt (now estimated at c.US$9 trillion); and
Sharply diverging policies between the world’s major central banks.
All of which we obviously have, to a greater or lesser degree.
From our perspective, the major risk we are facing today is the divergence between the tightening bias of the Federal Reserve and extreme monetary easing by the ECB and BoJ. This is the most recent devel-opment and increases the risk of the others, potentially turning the situation “critical.”
The Swiss franc’s peg against the Euro was abandoned on 15 January 2015.
Source: ADMISI, Bloomberg
The SNB specifically mentioned central bank policy divergence and dollar strength in its statement ex-plaining why it was ending the Euro peg.
0.95
1.00
1.05
1.10
1.15
1.20
1.25
1.30
1.35
1.40
1.45
1.50
1.55
20
09
20
10
20
11
20
12
20
13
20
14
20
15
Swiss Francs per Euro (since 2009)

ADM Investor Services International Limited is authorised and regulated by The Financial Conduct Authority. Member of The Lon don Stock Exchange. Registered office: 4th Floor Millennium Bridge House, 2 Lambeth Hill, London EC4V 3TT. Registered in England No. 2547805 a
subsidiary of Archer Daniels Midland Company. Risk Warning: Investments in Equities, CFDs, Futures, Options, Derivatives and Foreign Exchange can fluctuate in value, investors should therefore be aware that they may not realise the initial amount invested, and indeed may incur
Equity & Commodity Strategy - Fulcanelli Report Paul Mylchreest Email: [email protected] Tel: +44 20 7716 8257
42
“Recently, divergences between the monetary policies of the major currency areas have increased significantly – a trend that is likely to become even more pronounced. The euro has depreciated con-siderably against the US dollar and this, in turn, has caused the Swiss franc to weaken against the US dollar.”
The ECB’s balance sheet is about to play “catch-up” with the Fed with the launch of QE.
Source: ADMISI, Bloomberg
The growth in newly created dollar liquidity by the Federal Reserve was declining throughout 2014.
Source: ADMISI, Bloomberg
-2.0%
-1.0%
0.0%
1.0%
2.0%
3.0%
4.0%
Se
p-1
2
Oct
-12
No
v-1
2
De
c-1
2
Jan
-13
Fe
b-1
3
Ma
r-13
Ap
r-1
3
Ma
y-1
3
Jun
-13
Jul-
13
Au
g-1
3
Se
p-1
3
Oct
-13
No
v-1
3
De
c-1
3
Jan
-14
Fe
b-1
4
Ma
r-14
Ap
r-1
4
Ma
y-1
4
Jun
-14
Jul-
14
Au
g-1
4
Se
p-1
4
Oct
-14
No
v-1
4
De
c-14
Jan
-14
Fe
b-1
4
Ma
r-14
Fed Balance Sheet - Total Assets (4wk rate of change, %) since QE3 announced

ADM Investor Services International Limited is authorised and regulated by The Financial Conduct Authority. Member of The Lon don Stock Exchange. Registered office: 4th Floor Millennium Bridge House, 2 Lambeth Hill, London EC4V 3TT. Registered in England No. 2547805 a
Equity & Commodity Strategy - Fulcanelli Report Paul Mylchreest Email: [email protected] Tel: +44 20 7716 8257
43
43
The growth in foreign exchange reserves began to slow sharply in mid-2014.
Source: ADMISI, Bloomberg
Which helped to tighten liquidity in the world’s funding currency – the dollar index is inverted in the
following chart.
Source: ADMISI, Bloomberg
-5.0%
0.0%
5.0%
10.0%
15.0%
20.0%
25.0%
30.0%
35.0%
20
04
20
05
20
06
20
07
20
08
20
09
20
10
20
11
20
12
20
13
20
14
World Foreign Exchange Reserves (yoy %)
64.0
69.0
74.0
79.0
84.0
89.0
94.0
99.0
-5%
0%
5%
10%
15%
20%
25%
30%
35%
20
04
20
05
20
06
20
07
20
08
20
09
20
10
20
11
20
12
20
13
20
14
World Forex Reserves (yoy %) v. Dollar Index (Inverted)
World Forex Reserves (yoy %) Dollar Index (Inverted)

ADM Investor Services International Limited is authorised and regulated by The Financial Conduct Authority. Member of The Lon don Stock Exchange. Registered office: 4th Floor Millennium Bridge House, 2 Lambeth Hill, London EC4V 3TT. Registered in England No. 2547805 a
subsidiary of Archer Daniels Midland Company. Risk Warning: Investments in Equities, CFDs, Futures, Options, Derivatives and Foreign Exchange can fluctuate in value, investors should therefore be aware that they may not realise the initial amount invested, and indeed may incur
Equity & Commodity Strategy - Fulcanelli Report Paul Mylchreest Email: [email protected] Tel: +44 20 7716 8257
44
It hits growth in emerging economies as policy is effectively tightening – especially in those countries
linked to the dollar, like…err…China.
Source: ADMISI, Bloomberg
Besides declining dollar liquidity and slowing global growth, we believe that further dollar appreciation will be driven by the size of the “Global Dollar Short” (GDS) and the difficulty in rolling it/cutting it.
The BIS estimated in December 2014 that foreign non-bank borrowers have about US$9trn of US dollar debt.
Source: BIS
-75
-55
-35
-15
5
25
45
65
85
-10%
-5%
0%
5%
10%
15%
20%
25%
30%
35%
40%
20
04
20
05
20
06
20
07
20
08
20
09
20
10
20
11
20
12
20
13
20
14
World Forex Reserves v. EM Economic Surprise Index
World Forex Reserves (yoy %) Citi Economic Surprise Index - EM

ADM Investor Services International Limited is authorised and regulated by The Financial Conduct Authority. Member of The Lon don Stock Exchange. Registered office: 4th Floor Millennium Bridge House, 2 Lambeth Hill, London EC4V 3TT. Registered in England No. 2547805 a
Equity & Commodity Strategy - Fulcanelli Report Paul Mylchreest Email: [email protected] Tel: +44 20 7716 8257
45
45
As Jeffrey Snider of Alhambra Partners has pointed out, prior to the 2008 crisis, foreign banks were
sourcing about US$400bn from domestic US money markets in order for their European head offices to
“play” in the Eurodollar markets (probably in London), e.g. European banks making loans/buying MBS
which helped to fuel the US housing bubble. This is shown by the yellow bar – GDF (Global Dollar Fund-
ing) – in the left chart below. By 2013, that had flipped with foreign banks sourcing about US$500bn
from Eurodollar markets and transferring them to the US – see yellow bar in right chart.
Source: Office of Financial Research
For the most part, this probably involved foreign banks’ European head offices selling MBS back to the Fed as part of the latter’s QE programmes. Notice the growth in the orange bar (cash reserve balances) pre and post-Crisis which reflected the accumulated impact of the Fed’s QE programmes on foreign banks in the US.
Foreign banks were the major counterparties to the Fed’s QE programmes as the corresponding chart
for US banks shows – small size of orange bar in 2013.
Source: Office of Financial Research

ADM Investor Services International Limited is authorised and regulated by The Financial Conduct Authority. Member of The Lon don Stock Exchange. Registered office: 4th Floor Millennium Bridge House, 2 Lambeth Hill, London EC4V 3TT. Registered in England No. 2547805 a
subsidiary of Archer Daniels Midland Company. Risk Warning: Investments in Equities, CFDs, Futures, Options, Derivatives and Foreign Exchange can fluctuate in value, investors should therefore be aware that they may not realise the initial amount invested, and indeed may incur
Equity & Commodity Strategy - Fulcanelli Report Paul Mylchreest Email: [email protected] Tel: +44 20 7716 8257
46
What seems to have happened, and we can only surmise, is that European banks paid back a substan-tial chunk of their “dollar short”. As Snider elucidates.
“the primary interpretation as it relates, importantly, to the global dollar short is that European banks have retreated from the “dollar” market by about $900 billion across the last seven years or so. But that is, again, only the portion of their retreat that we can see; I have little doubt there is more, at least from the European side”
If European banks have cut back their dollar short since the crisis and Euro area non-financials have
kept their dollar borrowings relatively flat as shown in the chart below…
Source: BIS
…those most at risk from tightening dollar liquidity and a stronger dollar are located in Emerging Mar-kets.
But which ones?
We thought that one way of testing this might be to look back to the “Taper tantrum” on 22 May 2013 and see which EM currencies and asset markets were most impacted by the sudden expectation of tighter dollar liquidity.
As far as we can tell China is at the top of the list—which is hardly good for the global growth story.
While there was little disruption to the managed Chinese Yuan, the subsequent spike in Chinese money market rates was unprecedented. The key Chinese 7-day repo rate hit the highest level since Bloom-berg began reporting it in October 2003. Here is the 2013 chart.

ADM Investor Services International Limited is authorised and regulated by The Financial Conduct Authority. Member of The Lon don Stock Exchange. Registered office: 4th Floor Millennium Bridge House, 2 Lambeth Hill, London EC4V 3TT. Registered in England No. 2547805 a
Equity & Commodity Strategy - Fulcanelli Report Paul Mylchreest Email: [email protected] Tel: +44 20 7716 8257
47
47
Source: ADMISI, Bloomberg
Look what happened to Chinese equities – the Shanghai Composite fell 16% between late-May/late-
June-2013.
Source: ADMISI, Bloomberg
1900
1950
2000
2050
2100
2150
2200
2250
2300
2350
2400
2450
2500
Jan
-13
Feb
-13
Ma
r-13
Ap
r-1
3
Ma
y-1
3
Jun
-13
Jul-
13
Au
g-1
3
Sep
-13
Oct
-13
No
v-1
3
De
c-13
Shanghai Composite in 2013
Taper Tantrum 22 May 2013

ADM Investor Services International Limited is authorised and regulated by The Financial Conduct Authority. Member of The Lon don Stock Exchange. Registered office: 4th Floor Millennium Bridge House, 2 Lambeth Hill, London EC4V 3TT. Registered in England No. 2547805 a
subsidiary of Archer Daniels Midland Company. Risk Warning: Investments in Equities, CFDs, Futures, Options, Derivatives and Foreign Exchange can fluctuate in value, investors should therefore be aware that they may not realise the initial amount invested, and indeed may incur
Equity & Commodity Strategy - Fulcanelli Report Paul Mylchreest Email: [email protected] Tel: +44 20 7716 8257
48
The Shanghai Composite Financials sector fell 21% during the same period.
Source: ADMISI, Bloomberg
The Brazilian stock market fell 20%.
Source: ADMISI, Bloomberg
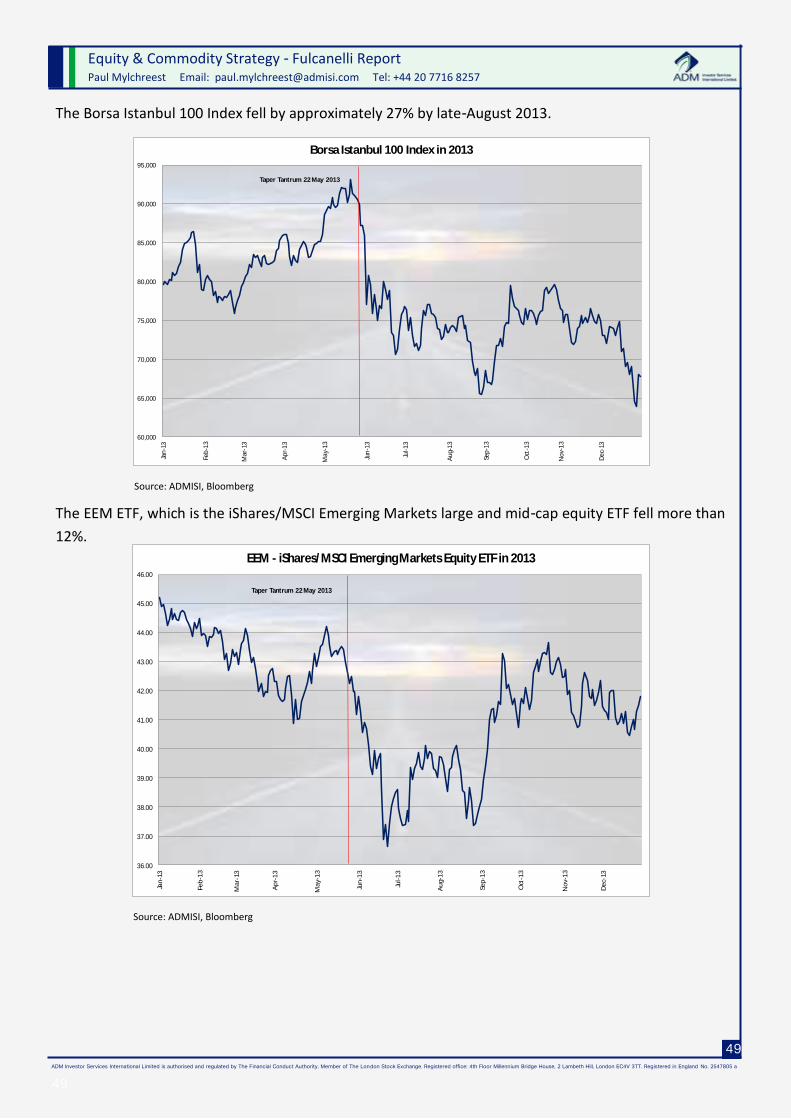
ADM Investor Services International Limited is authorised and regulated by The Financial Conduct Authority. Member of The Lon don Stock Exchange. Registered office: 4th Floor Millennium Bridge House, 2 Lambeth Hill, London EC4V 3TT. Registered in England No. 2547805 a
Equity & Commodity Strategy - Fulcanelli Report Paul Mylchreest Email: [email protected] Tel: +44 20 7716 8257
49
49
The Borsa Istanbul 100 Index fell by approximately 27% by late-August 2013.
Source: ADMISI, Bloomberg
The EEM ETF, which is the iShares/MSCI Emerging Markets large and mid-cap equity ETF fell more than
12%.
Source: ADMISI, Bloomberg
60,000
65,000
70,000
75,000
80,000
85,000
90,000
95,000Ja
n-1
3
Feb
-13
Ma
r-13
Ap
r-1
3
Ma
y-1
3
Jun
-13
Jul-
13
Au
g-1
3
Sep
-13
Oct
-13
No
v-1
3
De
c-13
Borsa Istanbul 100 Index in 2013
Taper Tantrum 22 May 2013
36.00
37.00
38.00
39.00
40.00
41.00
42.00
43.00
44.00
45.00
46.00
Jan
-13
Feb
-13
Ma
r-13
Ap
r-1
3
Ma
y-1
3
Jun
-13
Jul-
13
Au
g-1
3
Sep
-13
Oct
-13
No
v-1
3
De
c-13
EEM - iShares/MSCI Emerging Markets Equity ETF in 2013
Taper Tantrum 22 May 2013
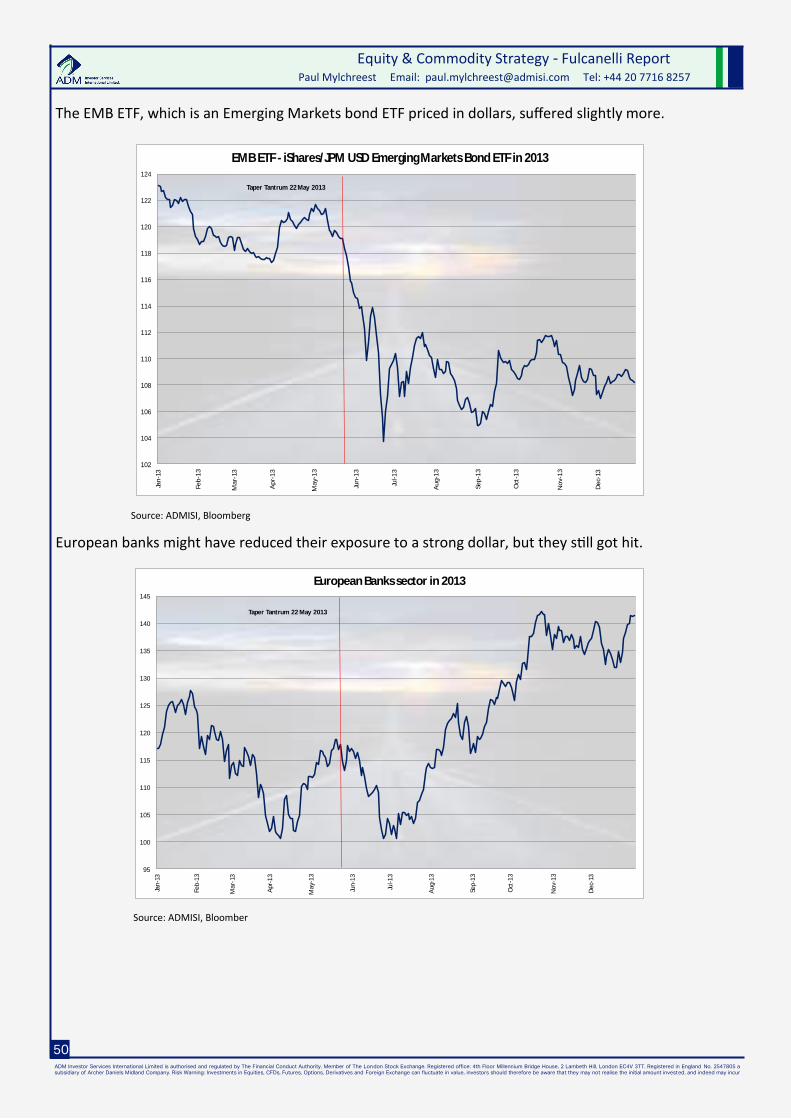
ADM Investor Services International Limited is authorised and regulated by The Financial Conduct Authority. Member of The Lon don Stock Exchange. Registered office: 4th Floor Millennium Bridge House, 2 Lambeth Hill, London EC4V 3TT. Registered in England No. 2547805 a
subsidiary of Archer Daniels Midland Company. Risk Warning: Investments in Equities, CFDs, Futures, Options, Derivatives and Foreign Exchange can fluctuate in value, investors should therefore be aware that they may not realise the initial amount invested, and indeed may incur
Equity & Commodity Strategy - Fulcanelli Report Paul Mylchreest Email: [email protected] Tel: +44 20 7716 8257
50
The EMB ETF, which is an Emerging Markets bond ETF priced in dollars, suffered slightly more.
Source: ADMISI, Bloomberg
European banks might have reduced their exposure to a strong dollar, but they still got hit.
Source: ADMISI, Bloomber
102
104
106
108
110
112
114
116
118
120
122
124
Jan
-13
Feb
-13
Ma
r-13
Ap
r-1
3
Ma
y-1
3
Jun
-13
Jul-
13
Au
g-1
3
Sep
-13
Oct
-13
No
v-1
3
De
c-13
EMB ETF - iShares/JPM USD Emerging Markets Bond ETF in 2013
Taper Tantrum 22 May 2013
95
100
105
110
115
120
125
130
135
140
145
Jan
-13
Feb
-13
Ma
r-13
Ap
r-1
3
Ma
y-1
3
Jun
-13
Jul-
13
Au
g-1
3
Sep
-13
Oct
-13
No
v-1
3
De
c-13
European Banks sector in 2013
Taper Tantrum 22 May 2013
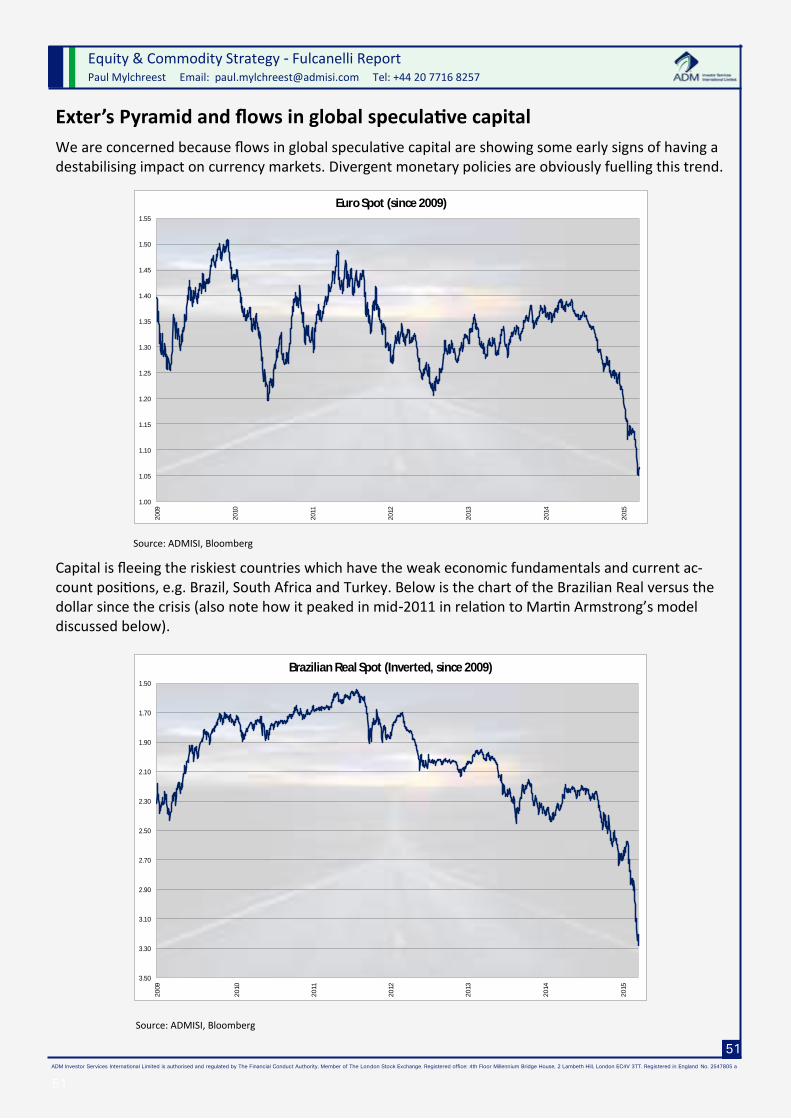
ADM Investor Services International Limited is authorised and regulated by The Financial Conduct Authority. Member of The Lon don Stock Exchange. Registered office: 4th Floor Millennium Bridge House, 2 Lambeth Hill, London EC4V 3TT. Registered in England No. 2547805 a
Equity & Commodity Strategy - Fulcanelli Report Paul Mylchreest Email: [email protected] Tel: +44 20 7716 8257
51
51
Exter’s Pyramid and flows in global speculative capital
We are concerned because flows in global speculative capital are showing some early signs of having a destabilising impact on currency markets. Divergent monetary policies are obviously fuelling this trend.
Source: ADMISI, Bloomberg
Capital is fleeing the riskiest countries which have the weak economic fundamentals and current ac-count positions, e.g. Brazil, South Africa and Turkey. Below is the chart of the Brazilian Real versus the dollar since the crisis (also note how it peaked in mid-2011 in relation to Martin Armstrong’s model discussed below).
Source: ADMISI, Bloomberg
1.00
1.05
1.10
1.15
1.20
1.25
1.30
1.35
1.40
1.45
1.50
1.55
20
09
20
10
20
11
20
12
20
13
20
14
20
15
Euro Spot (since 2009)
1.50
1.70
1.90
2.10
2.30
2.50
2.70
2.90
3.10
3.30
3.50
20
09
20
10
20
11
20
12
20
13
20
14
20
15
Brazilian Real Spot (Inverted, since 2009)
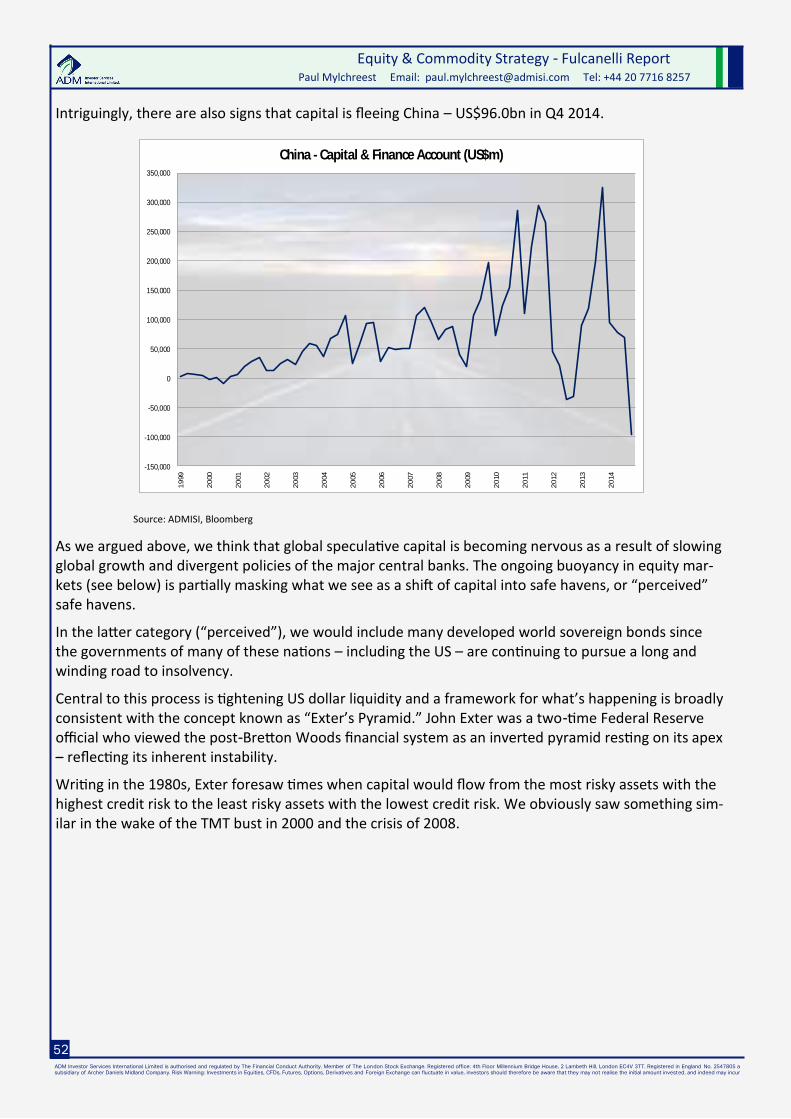
ADM Investor Services International Limited is authorised and regulated by The Financial Conduct Authority. Member of The Lon don Stock Exchange. Registered office: 4th Floor Millennium Bridge House, 2 Lambeth Hill, London EC4V 3TT. Registered in England No. 2547805 a
subsidiary of Archer Daniels Midland Company. Risk Warning: Investments in Equities, CFDs, Futures, Options, Derivatives and Foreign Exchange can fluctuate in value, investors should therefore be aware that they may not realise the initial amount invested, and indeed may incur
Equity & Commodity Strategy - Fulcanelli Report Paul Mylchreest Email: [email protected] Tel: +44 20 7716 8257
52
Intriguingly, there are also signs that capital is fleeing China – US$96.0bn in Q4 2014.
Source: ADMISI, Bloomberg
As we argued above, we think that global speculative capital is becoming nervous as a result of slowing global growth and divergent policies of the major central banks. The ongoing buoyancy in equity mar-kets (see below) is partially masking what we see as a shift of capital into safe havens, or “perceived” safe havens.
In the latter category (“perceived”), we would include many developed world sovereign bonds since the governments of many of these nations – including the US – are continuing to pursue a long and winding road to insolvency.
Central to this process is tightening US dollar liquidity and a framework for what’s happening is broadly consistent with the concept known as “Exter’s Pyramid.” John Exter was a two-time Federal Reserve official who viewed the post-Bretton Woods financial system as an inverted pyramid resting on its apex – reflecting its inherent instability.
Writing in the 1980s, Exter foresaw times when capital would flow from the most risky assets with the highest credit risk to the least risky assets with the lowest credit risk. We obviously saw something sim-ilar in the wake of the TMT bust in 2000 and the crisis of 2008.
-150,000
-100,000
-50,000
0
50,000
100,000
150,000
200,000
250,000
300,000
350,0001
99
9
20
00
20
01
20
02
20
03
20
04
20
05
20
06
20
07
20
08
20
09
20
10
20
11
20
12
20
13
20
14
China - Capital & Finance Account (US$m)

ADM Investor Services International Limited is authorised and regulated by The Financial Conduct Authority. Member of The Lon don Stock Exchange. Registered office: 4th Floor Millennium Bridge House, 2 Lambeth Hill, London EC4V 3TT. Registered in England No. 2547805 a
Equity & Commodity Strategy - Fulcanelli Report Paul Mylchreest Email: [email protected] Tel: +44 20 7716 8257
53
53
Here’s the chart as John Exter characterised it in the late-1980s – although some of the middle and
higher layers in the pyramid seem quaintly out of date.
Source: John Exter
In the currency markets, the breaking of the Swiss franc/Euro peg in January this year fits this frame-work perfectly.
It’s implicit in the upside down nature of the pyramid that there is a large amount of capital in the riski-er financial assets in the upper layers of the pyramid which can flow downwards. Consequently, the valuations of those assets which are considered “safe” could overshoot.
If we are correct, the recent recovery in the high yield market, for example, should be fairly short-lived and we should see a move through the December 2015 high.
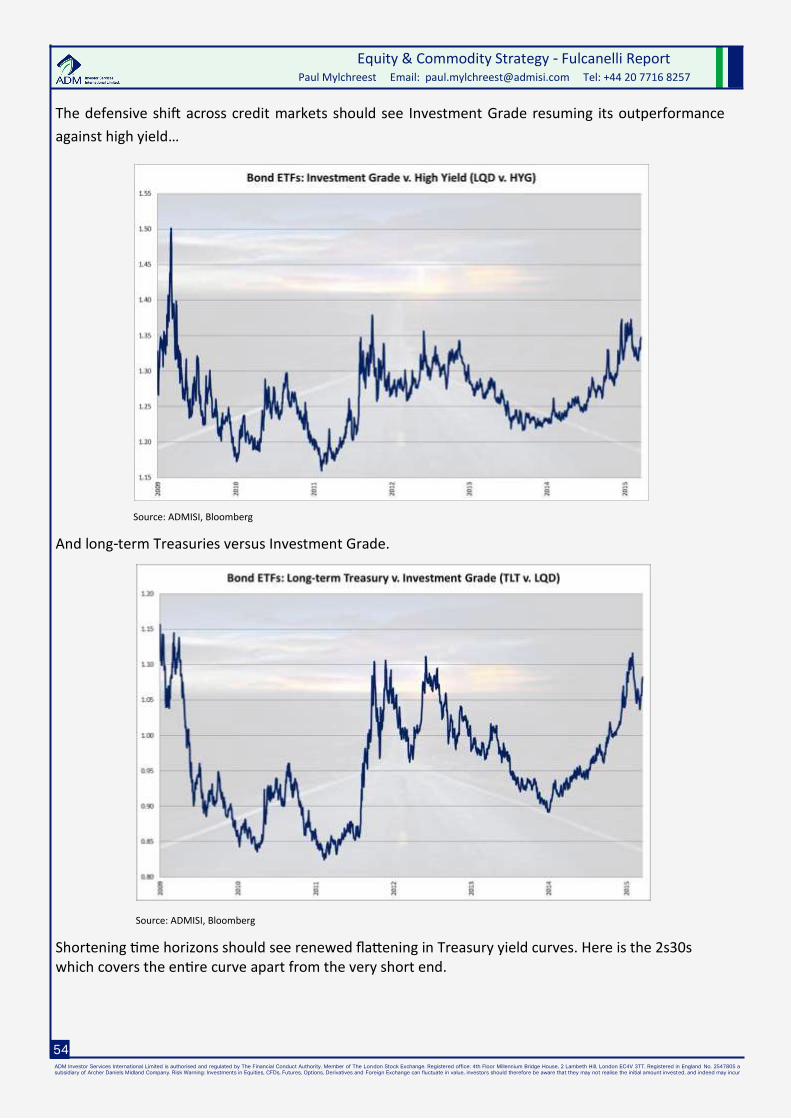
ADM Investor Services International Limited is authorised and regulated by The Financial Conduct Authority. Member of The Lon don Stock Exchange. Registered office: 4th Floor Millennium Bridge House, 2 Lambeth Hill, London EC4V 3TT. Registered in England No. 2547805 a
subsidiary of Archer Daniels Midland Company. Risk Warning: Investments in Equities, CFDs, Futures, Options, Derivatives and Foreign Exchange can fluctuate in value, investors should therefore be aware that they may not realise the initial amount invested, and indeed may incur
Equity & Commodity Strategy - Fulcanelli Report Paul Mylchreest Email: [email protected] Tel: +44 20 7716 8257
54
The defensive shift across credit markets should see Investment Grade resuming its outperformance
against high yield…
Source: ADMISI, Bloomberg
And long-term Treasuries versus Investment Grade.
Source: ADMISI, Bloomberg
Shortening time horizons should see renewed flattening in Treasury yield curves. Here is the 2s30s which covers the entire curve apart from the very short end.

ADM Investor Services International Limited is authorised and regulated by The Financial Conduct Authority. Member of The Lon don Stock Exchange. Registered office: 4th Floor Millennium Bridge House, 2 Lambeth Hill, London EC4V 3TT. Registered in England No. 2547805 a
Equity & Commodity Strategy - Fulcanelli Report Paul Mylchreest Email: [email protected] Tel: +44 20 7716 8257
55
55
Source: ADMISI, Bloomberg
We believe that even if the Fed raises rates this year, the long end of the yield will continue to decline.
As time horizons continue to shorten, we see the potential for a final “blow-off” phase in the “bond
bubble” of developed world sovereign bonds. While we are no more bullish on the prospects for US
government finances than we are on most other developed nations, the yield premium of long-term
US Treasuries versus some of its rivals, especially when some of the latter are aggressively pursuing QE,
remains attractive in relative terms. Below is the spread between the US 10-year Treasury yield and a
synthetic Eurozone 7-10 year sovereign yield.
Source: ADMISI, Bloomberg
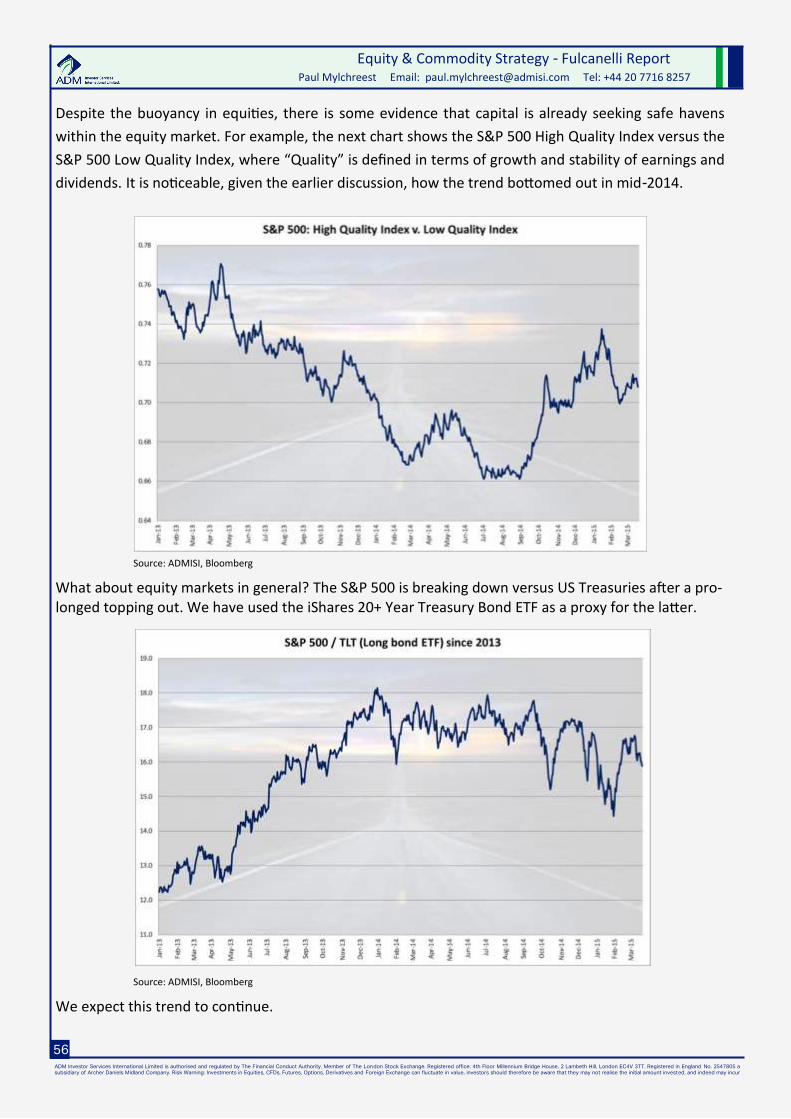
ADM Investor Services International Limited is authorised and regulated by The Financial Conduct Authority. Member of The Lon don Stock Exchange. Registered office: 4th Floor Millennium Bridge House, 2 Lambeth Hill, London EC4V 3TT. Registered in England No. 2547805 a
subsidiary of Archer Daniels Midland Company. Risk Warning: Investments in Equities, CFDs, Futures, Options, Derivatives and Foreign Exchange can fluctuate in value, investors should therefore be aware that they may not realise the initial amount invested, and indeed may incur
Equity & Commodity Strategy - Fulcanelli Report Paul Mylchreest Email: [email protected] Tel: +44 20 7716 8257
56
Despite the buoyancy in equities, there is some evidence that capital is already seeking safe havens
within the equity market. For example, the next chart shows the S&P 500 High Quality Index versus the
S&P 500 Low Quality Index, where “Quality” is defined in terms of growth and stability of earnings and
dividends. It is noticeable, given the earlier discussion, how the trend bottomed out in mid-2014.
Source: ADMISI, Bloomberg
What about equity markets in general? The S&P 500 is breaking down versus US Treasuries after a pro-longed topping out. We have used the iShares 20+ Year Treasury Bond ETF as a proxy for the latter.
Source: ADMISI, Bloomberg
We expect this trend to continue.

ADM Investor Services International Limited is authorised and regulated by The Financial Conduct Authority. Member of The Lon don Stock Exchange. Registered office: 4th Floor Millennium Bridge House, 2 Lambeth Hill, London EC4V 3TT. Registered in England No. 2547805 a
Equity & Commodity Strategy - Fulcanelli Report Paul Mylchreest Email: [email protected] Tel: +44 20 7716 8257
57
57
Like currency, bonds and some commodity markets, volatility in equity markets bottomed out and be-
gan to rise in late June/early July last year – although the rise has been modest so far.
Source: ADMISI, Bloomberg
While long bonds might have a maturity of between 10 and 30 years, equities theoretically have infi-nite time horizons. Typically, equity investors make detailed estimates for corporate cash flows for 7-10 years. Beyond that, cash flows to infinity are capitalised using long-term growth rate assumptions, ROIC fades, etc.
Staying with our time theme and when so much consumption has already been “brought forward” due to the global debt bubble, valuing more distant earnings on above average PEs seems generous. How-ever, how do you even come close to an objective valuation in an increasingly, thanks to central banks, ZIRP/NIRP world?
Valuation difficulties aside, we found two indicators which gave well-timed sell signals at the last two peaks in the S&P 500 in 2000 and 2007. A third signal acted as confirmation. The three indicators are.
The flattening of at least part of the Treasury yield curve all the way to zero;
A crossover in the “adjusted” MACD; and
By way of confirmation - the ISM manufacturing survey crossing the 50.0 line to the downside.
Both the Treasury yield curve and adjusted MACD are close to giving their first sell signals for nearly eight years as we show below. It’s also worth noting that the three indicators incorporate signals from credit markets, technical analysis and the real economy.
When we looked back at Treasury yield curves in the run up to the last two peaks in the S&P 500 in March 2000 and October 2007, we noticed that it didn’t matter which part of the curve we looked at, e.g. 2s10s, 2s30s, 5s30s, 5s10s or 10s30s, etc, but spreads declined to roughly zero, or inverted (went negative), PRIOR to the equity market peaks. But that was then.

ADM Investor Services International Limited is authorised and regulated by The Financial Conduct Authority. Member of The Lon don Stock Exchange. Registered office: 4th Floor Millennium Bridge House, 2 Lambeth Hill, London EC4V 3TT. Registered in England No. 2547805 a
subsidiary of Archer Daniels Midland Company. Risk Warning: Investments in Equities, CFDs, Futures, Options, Derivatives and Foreign Exchange can fluctuate in value, investors should therefore be aware that they may not realise the initial amount invested, and indeed may incur
Equity & Commodity Strategy - Fulcanelli Report Paul Mylchreest Email: [email protected] Tel: +44 20 7716 8257
58
In today’s central banking “fun house”, yield curves have obviously become subject to substantial dis-
tortions. We are reluctant to use either the very short end or the very long end of the curve. Instead,
we are focusing on the 7s10s curve in terms of the equity market. This is thanks to Alejandro Reyes (of
the Rainmaker Investor Report) as we had not looked at the 7s10s before (we had been focusing on
the 5s10s). A caveat here as there were no 7-year Treasuries issued until March 2010 (after a hiatus
during the Clinton years) but, nonetheless, the spread is currently 19.3 basis points (bp). The spread on
the 5s10s curve, the next closest to inverting, is currently 52.3 bp.
Source: ADMISI, Bloomberg
The “adjusted” MACD indicator gave technical sell signals on the S&P 500 with crossovers JUST AFTER the last two peaks in equities, i.e. in May 2000 and January 2008.
MACD stands for “Moving Average Convergence/Divergence.” It consists of three time series, i.e. the MACD, the signal and the divergence between the two. The MACD consists of the difference between a shorter period EMA (exponential moving average) and a longer period EMA. An EMA uses exponen-tially decreasing weights to older data points in a time series. The signal is the EMA of the MACD series itself.
The MACD indicator is calculated on three time parameters for the three EMAs. The default values are normally 12, 26 and 9 days. However, the best indication for predicting the last two peaks (thanks Cris Sheridan) in the equity market has been 25, 26 and 9 days. This is shown in the chart below.

ADM Investor Services International Limited is authorised and regulated by The Financial Conduct Authority. Member of The Lon don Stock Exchange. Registered office: 4th Floor Millennium Bridge House, 2 Lambeth Hill, London EC4V 3TT. Registered in England No. 2547805 a
Equity & Commodity Strategy - Fulcanelli Report Paul Mylchreest Email: [email protected] Tel: +44 20 7716 8257
59
59
It’s clear that we are very close to, but have not quite reached, another bearish crossover in the MACD.
Source: Bloomberg
We view the ISM manufacturing survey as a confirmatory indicator for potential sell signals from the
yield curve and MACD. The ISM crossed the 50.0 line to the downside shortly AFTER the last two peaks
in August 2000 and December 2007. The latest monthly reading was 52.9 and the trend has been
downward since October 2014.
Source: ADMISI, Bloomberg
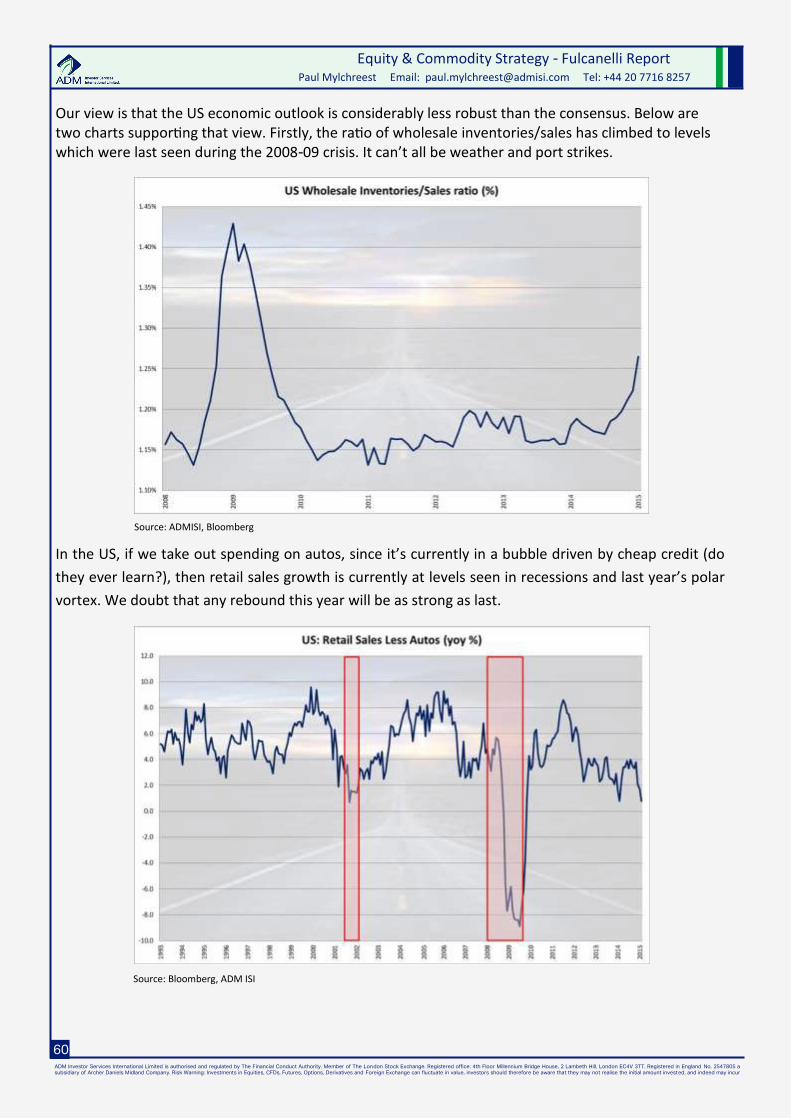
ADM Investor Services International Limited is authorised and regulated by The Financial Conduct Authority. Member of The Lon don Stock Exchange. Registered office: 4th Floor Millennium Bridge House, 2 Lambeth Hill, London EC4V 3TT. Registered in England No. 2547805 a
subsidiary of Archer Daniels Midland Company. Risk Warning: Investments in Equities, CFDs, Futures, Options, Derivatives and Foreign Exchange can fluctuate in value, investors should therefore be aware that they may not realise the initial amount invested, and indeed may incur
Equity & Commodity Strategy - Fulcanelli Report Paul Mylchreest Email: [email protected] Tel: +44 20 7716 8257
60
Our view is that the US economic outlook is considerably less robust than the consensus. Below are two charts supporting that view. Firstly, the ratio of wholesale inventories/sales has climbed to levels which were last seen during the 2008-09 crisis. It can’t all be weather and port strikes.
Source: ADMISI, Bloomberg
In the US, if we take out spending on autos, since it’s currently in a bubble driven by cheap credit (do
they ever learn?), then retail sales growth is currently at levels seen in recessions and last year’s polar
vortex. We doubt that any rebound this year will be as strong as last.
Source: Bloomberg, ADM ISI

ADM Investor Services International Limited is authorised and regulated by The Financial Conduct Authority. Member of The Lon don Stock Exchange. Registered office: 4th Floor Millennium Bridge House, 2 Lambeth Hill, London EC4V 3TT. Registered in England No. 2547805 a
Equity & Commodity Strategy - Fulcanelli Report Paul Mylchreest Email: [email protected] Tel: +44 20 7716 8257
61
61
We don’t believe in the US economy decoupling from the rest of the world – if anything US growth has converged with global growth since the crisis.
Source: ADMISI, Bloomberg
The subdued level of world trade confirms the softness in the global economy.
Source: ADMISI, Bloomberg
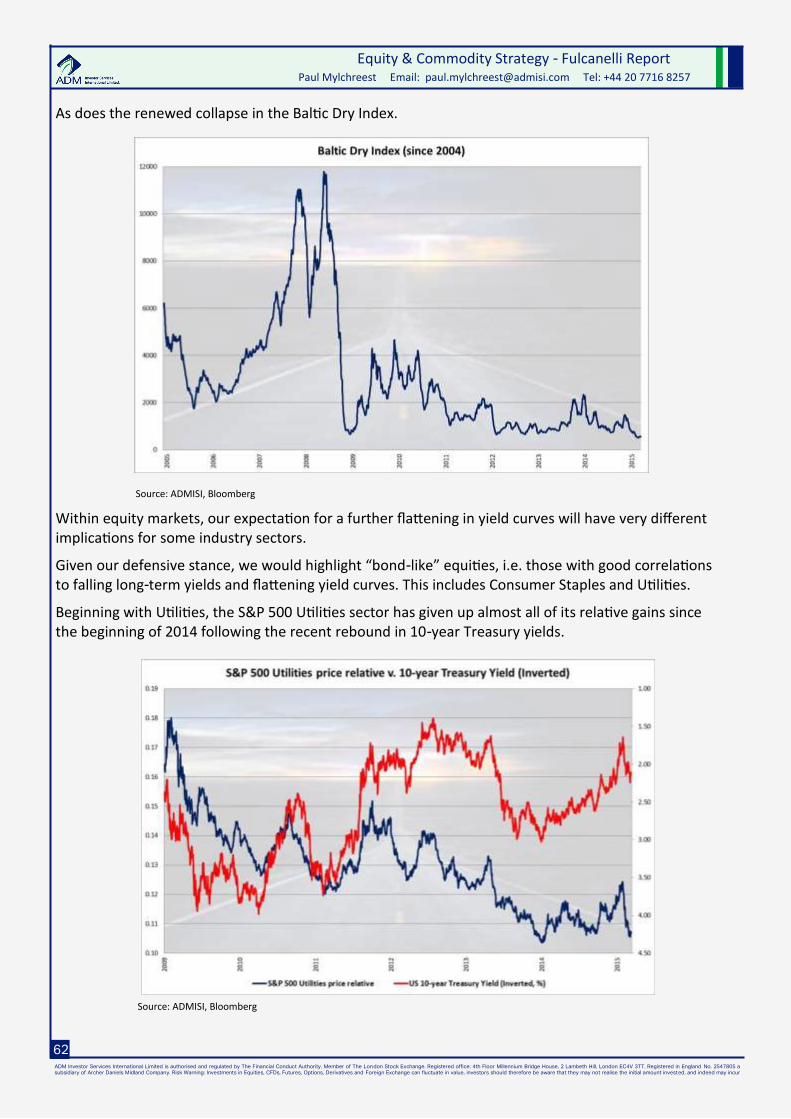
ADM Investor Services International Limited is authorised and regulated by The Financial Conduct Authority. Member of The Lon don Stock Exchange. Registered office: 4th Floor Millennium Bridge House, 2 Lambeth Hill, London EC4V 3TT. Registered in England No. 2547805 a
subsidiary of Archer Daniels Midland Company. Risk Warning: Investments in Equities, CFDs, Futures, Options, Derivatives and Foreign Exchange can fluctuate in value, investors should therefore be aware that they may not realise the initial amount invested, and indeed may incur
Equity & Commodity Strategy - Fulcanelli Report Paul Mylchreest Email: [email protected] Tel: +44 20 7716 8257
62
As does the renewed collapse in the Baltic Dry Index.
Source: ADMISI, Bloomberg
Within equity markets, our expectation for a further flattening in yield curves will have very different implications for some industry sectors.
Given our defensive stance, we would highlight “bond-like” equities, i.e. those with good correlations to falling long-term yields and flattening yield curves. This includes Consumer Staples and Utilities.
Beginning with Utilities, the S&P 500 Utilities sector has given up almost all of its relative gains since the beginning of 2014 following the recent rebound in 10-year Treasury yields.
Source: ADMISI, Bloomberg

ADM Investor Services International Limited is authorised and regulated by The Financial Conduct Authority. Member of The Lon don Stock Exchange. Registered office: 4th Floor Millennium Bridge House, 2 Lambeth Hill, London EC4V 3TT. Registered in England No. 2547805 a
Equity & Commodity Strategy - Fulcanelli Report Paul Mylchreest Email: [email protected] Tel: +44 20 7716 8257
63
63
The same with the UK Utilities sector.
Source: ADMISI, Bloomberg
National Grid has done slightly better.
Source: ADMISI, Bloomberg

ADM Investor Services International Limited is authorised and regulated by The Financial Conduct Authority. Member of The Lon don Stock Exchange. Registered office: 4th Floor Millennium Bridge House, 2 Lambeth Hill, London EC4V 3TT. Registered in England No. 2547805 a
subsidiary of Archer Daniels Midland Company. Risk Warning: Investments in Equities, CFDs, Futures, Options, Derivatives and Foreign Exchange can fluctuate in value, investors should therefore be aware that they may not realise the initial amount invested, and indeed may incur
Equity & Commodity Strategy - Fulcanelli Report Paul Mylchreest Email: [email protected] Tel: +44 20 7716 8257
64
As we said earlier, it’s possible to think of the production chain as a term structure, or time series, from those businesses most distant from the consumer (like oil, mining and capital goods) to those which are closest, including Consumer Staples. This includes many “fast moving consumer goods” (FMCG) which Wikipedia defines as.
“The term FMCGs refers to those retail goods that are generally replaced or fully used up over a
short period of days, weeks, or months, and within one year. Examples include non-durable goods
such as soft drinks, toiletries, etc, and grocery items...Global leaders in the FMCG segment include
Johnson & Johnson, Colgate-Palmolive, Anheuser-Busch InBev, Henkel, Kellogg’s, S.C. Johnson, Bei-
ersdorf, Mars Inc., Heinz, Nestle, Reckitt Benckiser, Unilever, Procter & Gamble, L’Oreal, Coca-Cola,
General Mills Inc., PepsiCo, Mondelez and Kraft Foods.”
The S&P 500 Consumer Staples price relative has historically had a good correlation with the (inverted) 30-year Treasury yield.
Source: ADMISI, Bloomberg
Coca Cola has had some challenges recently, but the price relative has dramatically underperformed
the downward move in the 30-year US Treasury yield during the last 12 months. And it is rolling out a
major restructuring programme.
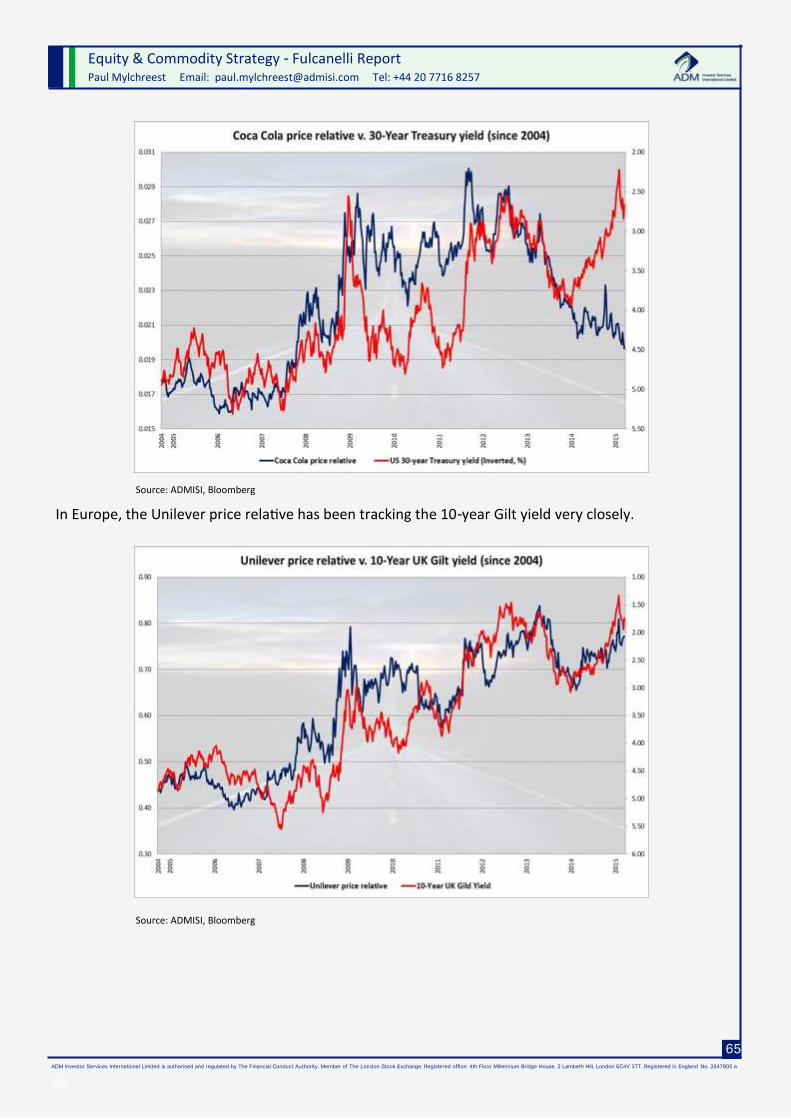
ADM Investor Services International Limited is authorised and regulated by The Financial Conduct Authority. Member of The Lon don Stock Exchange. Registered office: 4th Floor Millennium Bridge House, 2 Lambeth Hill, London EC4V 3TT. Registered in England No. 2547805 a
Equity & Commodity Strategy - Fulcanelli Report Paul Mylchreest Email: [email protected] Tel: +44 20 7716 8257
65
65
Source: ADMISI, Bloomberg
In Europe, the Unilever price relative has been tracking the 10-year Gilt yield very closely.
Source: ADMISI, Bloomberg
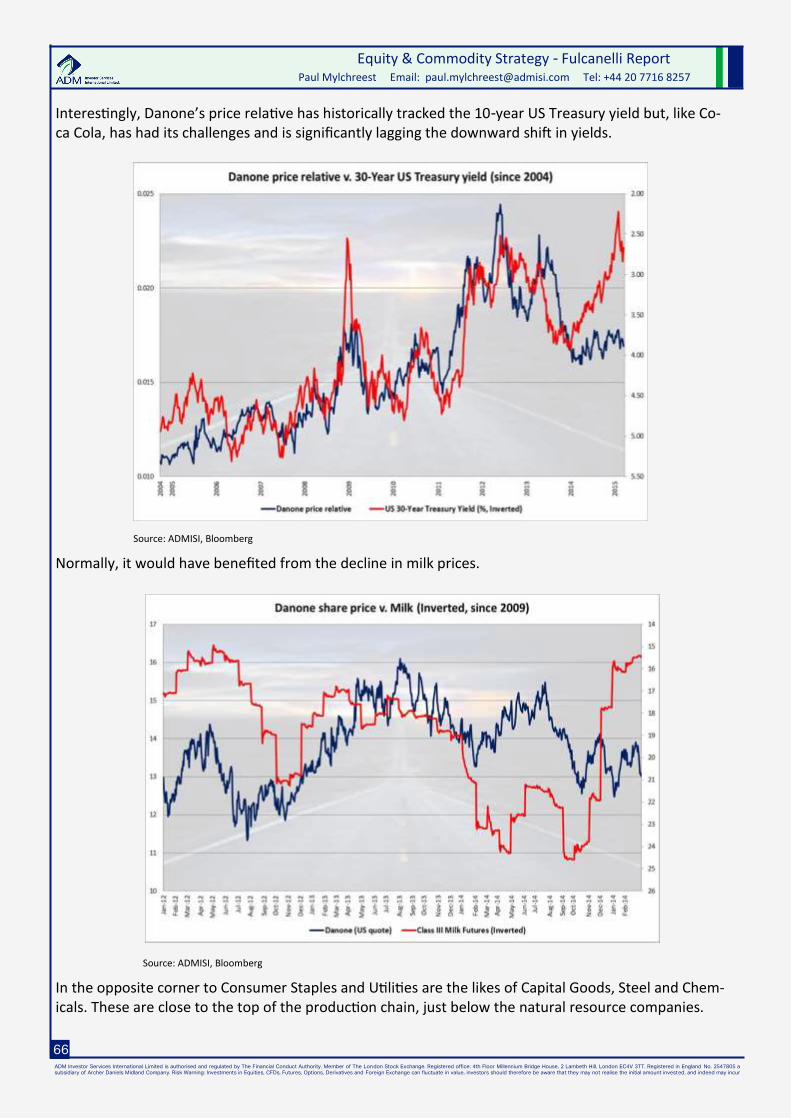
ADM Investor Services International Limited is authorised and regulated by The Financial Conduct Authority. Member of The Lon don Stock Exchange. Registered office: 4th Floor Millennium Bridge House, 2 Lambeth Hill, London EC4V 3TT. Registered in England No. 2547805 a
subsidiary of Archer Daniels Midland Company. Risk Warning: Investments in Equities, CFDs, Futures, Options, Derivatives and Foreign Exchange can fluctuate in value, investors should therefore be aware that they may not realise the initial amount invested, and indeed may incur
Equity & Commodity Strategy - Fulcanelli Report Paul Mylchreest Email: [email protected] Tel: +44 20 7716 8257
66
Interestingly, Danone’s price relative has historically tracked the 10-year US Treasury yield but, like Co-ca Cola, has had its challenges and is significantly lagging the downward shift in yields.
Source: ADMISI, Bloomberg
Normally, it would have benefited from the decline in milk prices.
Source: ADMISI, Bloomberg
In the opposite corner to Consumer Staples and Utilities are the likes of Capital Goods, Steel and Chem-icals. These are close to the top of the production chain, just below the natural resource companies.
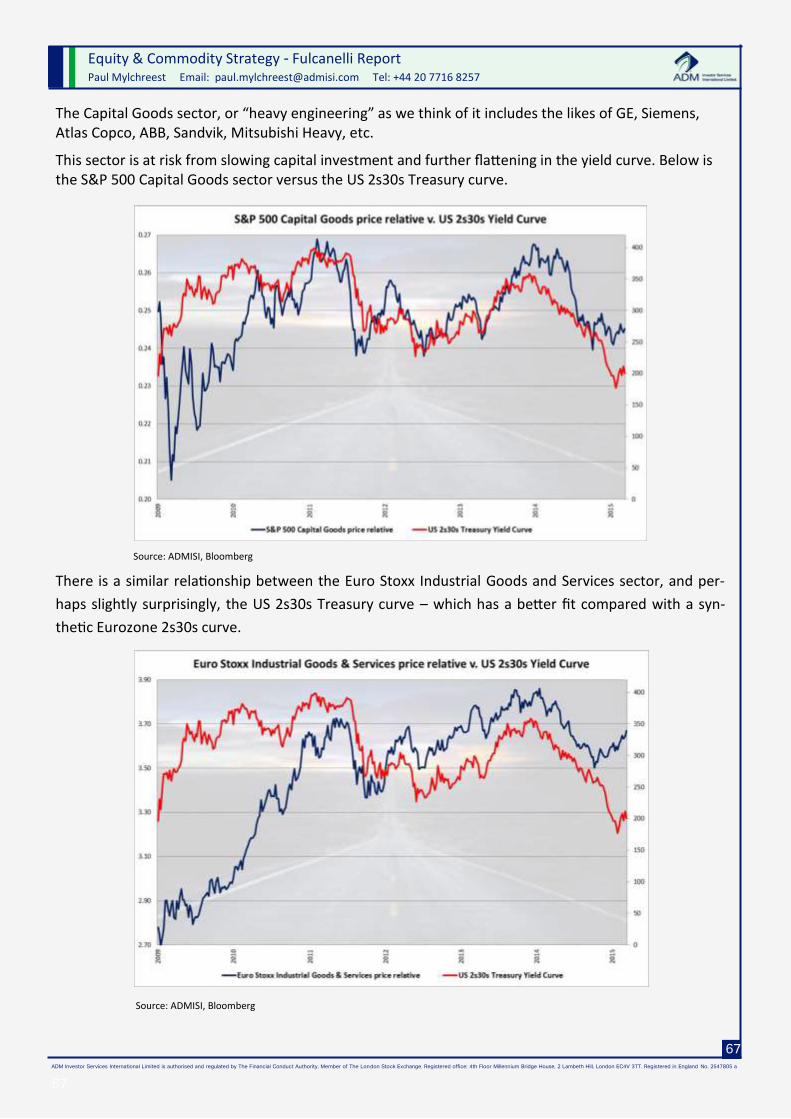
ADM Investor Services International Limited is authorised and regulated by The Financial Conduct Authority. Member of The Lon don Stock Exchange. Registered office: 4th Floor Millennium Bridge House, 2 Lambeth Hill, London EC4V 3TT. Registered in England No. 2547805 a
Equity & Commodity Strategy - Fulcanelli Report Paul Mylchreest Email: [email protected] Tel: +44 20 7716 8257
67
67
The Capital Goods sector, or “heavy engineering” as we think of it includes the likes of GE, Siemens, Atlas Copco, ABB, Sandvik, Mitsubishi Heavy, etc.
This sector is at risk from slowing capital investment and further flattening in the yield curve. Below is the S&P 500 Capital Goods sector versus the US 2s30s Treasury curve.
Source: ADMISI, Bloomberg
There is a similar relationship between the Euro Stoxx Industrial Goods and Services sector, and per-
haps slightly surprisingly, the US 2s30s Treasury curve – which has a better fit compared with a syn-
thetic Eurozone 2s30s curve.
Source: ADMISI, Bloomberg
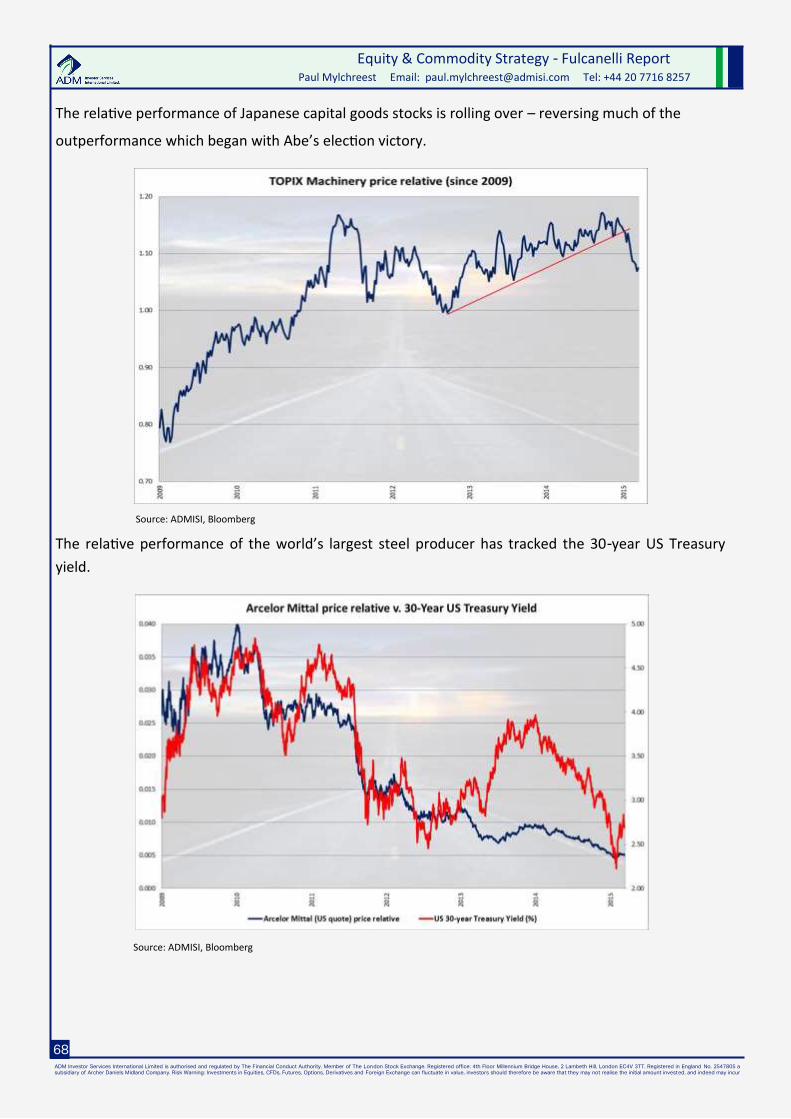
ADM Investor Services International Limited is authorised and regulated by The Financial Conduct Authority. Member of The Lon don Stock Exchange. Registered office: 4th Floor Millennium Bridge House, 2 Lambeth Hill, London EC4V 3TT. Registered in England No. 2547805 a
subsidiary of Archer Daniels Midland Company. Risk Warning: Investments in Equities, CFDs, Futures, Options, Derivatives and Foreign Exchange can fluctuate in value, investors should therefore be aware that they may not realise the initial amount invested, and indeed may incur
Equity & Commodity Strategy - Fulcanelli Report Paul Mylchreest Email: [email protected] Tel: +44 20 7716 8257
68
The relative performance of Japanese capital goods stocks is rolling over – reversing much of the
outperformance which began with Abe’s election victory.
Source: ADMISI, Bloomberg
The relative performance of the world’s largest steel producer has tracked the 30-year US Treasury
yield.
Source: ADMISI, Bloomberg

ADM Investor Services International Limited is authorised and regulated by The Financial Conduct Authority. Member of The Lon don Stock Exchange. Registered office: 4th Floor Millennium Bridge House, 2 Lambeth Hill, London EC4V 3TT. Registered in England No. 2547805 a
Equity & Commodity Strategy - Fulcanelli Report Paul Mylchreest Email: [email protected] Tel: +44 20 7716 8257
69
69
Staying with upstream production, the relative performance of the US Chemicals sector has tracked
the 2s30s curve fairly closely since the crisis.
Source: ADMISI, Bloomberg
Dow Chemcial’s correlation has been particularly close.
Source: ADMISI, Bloomberg

ADM Investor Services International Limited is authorised and regulated by The Financial Conduct Authority. Member of The Lon don Stock Exchange. Registered office: 4th Floor Millennium Bridge House, 2 Lambeth Hill, London EC4V 3TT. Registered in England No. 2547805 a
subsidiary of Archer Daniels Midland Company. Risk Warning: Investments in Equities, CFDs, Futures, Options, Derivatives and Foreign Exchange can fluctuate in value, investors should therefore be aware that they may not realise the initial amount invested, and indeed may incur
Equity & Commodity Strategy - Fulcanelli Report Paul Mylchreest Email: [email protected] Tel: +44 20 7716 8257
70
Finally, we want to mention Martin Armstrong’s “Economic Confidence Model” (ECM) as more and more people seem to be taking an interest in Armstrong’s work. In the past, the ECM has been surpris-ingly successful in tracking the market which is seeing the greatest concentration of global speculative capital (“hot money”). For example, it picked out the peak in the Nikkei in 1989 and the emergence of the US sub-prime housing problems in 2007, both almost to the day. When we tracked it back, it also picked out the 1929 Crash.
While he is bullish on the dollar, Armstrong commented earlier this year that in this cycle, the model is capturing the shift of capital into the bond market, primarily. However, our analysis shows that the dol-lar index has been tracking the ECM fairly closely since the major low in the model in June 2011 (2011.45). This seems to have gone unnoticed, even by Armstrong himself as he commented.
“The 2011 bottom was the peak in oil and gold and the start of the breakout in stocks and the begin-ning of the Euro crisis in full bloom.”
Many people don’t seem to realise that the ECM is fractal, so it operates on multiple, but related, time horizons. According to our calculations, there was a recent intermediate low on 4 March 2015. The dol-lar’s performance since then has been impressive.
The next major high in the ECM is on 1 October 2015 (2015.75) and we will be watching to see if this
also marks the high in the dollar and/or sovereign bonds.
If so, it could also mark the low in the anti-dollar, i.e. gold, or commodity prices. Extreme dollar
strength, if it occurs, could trigger a backlash (led by the BRICS) to dismantle the dollar’s role as the
sole reserve currency and replace it with an SDR-like basket (potentially including gold). We are head-
ing into interesting times.

ADM Investor Services International Limited is authorised and regulated by The Financial Conduct Authority. Member of The Lon don Stock Exchange. Registered office: 4th Floor Millennium Bridge House, 2 Lambeth Hill, London EC4V 3TT. Registered in England No. 2547805 a
Equity & Commodity Strategy - Fulcanelli Report Paul Mylchreest Email: [email protected] Tel: +44 20 7716 8257
71
71
Investments in futures, options and foreign exchange can fluctuate in value, investors should therefore
be aware that they may not realise the initial amount invested, and indeed may incur additional liabili-
ties. Investments in futures, options and foreign exchange entail above average risk, investors should
therefore carefully consider whether their financial circumstances permit them to invest and, if neces-
sary, seek the advice of an Independent Financial Advisor. Some services described are not available to
all investors. Services may also not be available to certain customers due to legal and/or regulatory
constraints either in the United Kingdom or elsewhere. The contents of this electronic mail may have
been changed without the knowledge of the sender. ADM Investor Services International Limited
(‘ADMISI’) does not, and will not, consider itself legally bound by the contents of any electronic mail
which appears to have originated from within the Company. If you believe you have been sent an e-
mail from ADMISI which is inappropriate, please contact the Compliance Department on 44 (0) 20 7716
8000. ADMISI is Authorised and Regulated by the Financial Conduct Authority on any electronic site /
platform / website and is a member of The London Stock Exchange. In the event that this electronic
mail has been sent from Reef Capital LLP, please note the Officers and Representatives of Reef Capital
LLP are authorised and regulated under the auspices of ADM Investor Services International Limited.
Related Documents