EXECUTIVE SUMMARY I n the face of a protracted stagnant Canada–U.S. trade relationship, Canadian businesses of all sizes are being encouraged to target fast-growing mar- kets in developing countries. However, a major concern is that they may be hampered by their limited foreign language skills and cultural knowledge, as well as their lack of trusted relationships and knowledge of how to do business in these markets. However, commentators and policy-makers suggest that these barriers are not insurmountable because Canada has a diverse pool of immigrants upon which it may draw. Still, despite significant immigrant flows from source countries such as China and India over the last decade, Canada’s trade remains largely concentrated in the United States. This raises a fundamental question: Do recent immigrants directly contribute to Canadian export activity? SELLING BEYOND THE U.S. Do Recent Immigrants Advance Canada’s Export Agenda? At a Glance Analysis of more than 15,000 Canadian small and medium-sized enterprises (SMEs) shows that those with a majority owner who is a recent immigrant are more likely to export than other businesses, and are particularly more likely to export to non-U.S. markets. Non-U.S. exporting businesses with an immigrant majority owner are among the fastest-growing Canadian SMEs, but are less operationally efficient than other exporting businesses. Among recent immigrants who export, knowledge-based immigrant exporters represent the strongest potential in non-U.S. markets. BRIEFING JUNE 2014

Welcome message from author
This document is posted to help you gain knowledge. Please leave a comment to let me know what you think about it! Share it to your friends and learn new things together.
Transcript

EXECUTIVE SUMMARY
I n the face of a protracted stagnant Canada–U.S.
trade relationship, Canadian businesses of all sizes
are being encouraged to target fast-growing mar-
kets in developing countries. However, a major concern
is that they may be hampered by their limited foreign
language skills and cultural knowledge, as well as their
lack of trusted relationships and knowledge of how to
do business in these markets. However, commentators
and policy-makers suggest that these barriers are not
insurmountable because Canada has a diverse pool of
immigrants upon which it may draw. Still, despite
significant immigrant flows from source countries such
as China and India over the last decade, Canada’s trade
remains largely concentrated in the United States. This
raises a fundamental question: Do recent immigrants
directly contribute to Canadian export activity?
SELLING BEYOND THE U.S.
Do Recent Immigrants Advance Canada’s Export Agenda?
At a Glance � Analysis of more than 15,000 Canadian small
and medium-sized enterprises (SMEs) shows that those with a majority owner who is a recent immigrant are more likely to export than other businesses, and are particularly more likely to export to non-U.S. markets.
� Non-U.S. exporting businesses with an immigrant majority owner are among the fastest-growing Canadian SMEs, but are less operationally efficient than other exporting businesses.
� Among recent immigrants who export, knowledge-based immigrant exporters represent the strongest potential in non-U.S. markets.
BRIEFING JUNE 2014

2 | Selling Beyond the U.S. —June 2014
Find this briefing and other Conference Board research at www.e-library.ca
To address this question, we investigate the export orien-
tation of over 15,000 Canadian SMEs. Specifically, we
test the hypothesis that Canadian SMEs with a major-
ity owner who is a recent immigrant are more likely to
export to non-U.S. markets, compared with Canadian
SMEs owned by non-immigrants or immigrants who
have lived in Canada for more than five years. We
also examine the growth rates, profitability, access to
business networks and financing, and industrial and
geographic concentrations of exporting SMEs, compar-
ing those owned by recent immigrants with other busi-
nesses. In doing so, our analysis provides new evidence
about the export orientation of businesses owned by
recent immigrants, and also offers new insights into their
strengths and weaknesses. Therefore, this study provides
a solid platform for the formulation of coherent export
promotion policies as it relates to immigrants in Canada.
RECENT IMMIGRANT BUSINESS OWNERS ARE MORE LIKELY TO EXPORT OUTSIDE THE U.S.When choosing between the Canadian market and
non-U.S. markets, we found that recent immigrant busi-
ness owners are 1.6 times more likely to select non-U.S.
markets over the Canadian market than non-immigrant
business owners. If the choice is between U.S. and non-
U.S markets, then recent immigrant business owners
are more than two times more likely to select non-U.S.
markets over the U.S. market than non-immigrant busi-
ness owners.
IMMIGRANT-OWNED BUSINESSES EXPORTING TO NON-U.S. MARKETS ARE FAST-GROWINGOur assessment of the performance of Canadian SMEs
reveals that businesses owned by recent immigrants that
export to non-U.S. markets are among the fastest-grow-
ing SMEs. Over the period 2007–11, their profits grew
at an average annual rate of 21 per cent compared with a
2 per cent decline for their non-immigrant counterparts.
On a whole, immigrant exporters that sell to the U.S.
and non-U.S. markets have realized an average annual
net profit growth rate of 16 per cent (21 per cent for
non-U.S. markets minus 5 per cent for the U.S. market).
By contrast, non-immigrant exporters have realized an
average annual net profit growth rate of just 1 per cent
(3 per cent for the U.S. market minus 2 per cent for
non-U.S. markets).
HOWEVER, IMMIGRANT EXPORTERS TO NON-U.S. MARKETS ARE LESS EFFICIENTIt is important to note that the superior growth in
the profits of non-U.S. immigrant exporters does not
translate into superior rates of return from business
operations. In general, U.S. immigrant exporters and
non-immigrant exporters generate higher profits when
they undertake the same levels of investment in assets or
become exposed to similar risk factors (such as unantici-
pated changes in foreign exchange rates) over the course
of doing business abroad. This suggests that, in general,
non-U.S. immigrant exporters are less operationally effi-
cient than U.S. immigrant exporters and non-immigrant
exporters, and less effective in managing the risks
involved in international business. However, if the most
operationally efficient companies are expected to export
to non-U.S. markets, which are relatively difficult and
costly to serve, then immigrant ownership may actually
confer advantages (i.e., social ties abroad, foreign lan-
guage skills, and cultural knowledge) that partially com-
pensate for the relatively low operational efficiency of
non-U.S. immigrant exporters, at least in the short term.
MOST IMMIGRANT EXPORTERS TO NON-U.S. MARKETS ARE LIKELY COMPETING ON PRICE, NOT INNOVATIONWe found that most non-U.S. immigrant exporters are
recently established wholesale/retail traders with limited
business connections in Canada. In contrast, U.S. immi-
grant exporters are generally more established and better
connected businesses that operate in knowledge-based
and manufacturing industries. In addition, research and
development (R&D) spending accounts for a larger
share of the expenditures of U.S. immigrant exporters
than non-U.S. immigrant exporters. This difference in
R&D spending rates suggests that non-U.S. exporting
businesses owned by immigrants have adopted a funda-
mentally different business model than the immigrant
owners of knowledge-intensive exporting businesses that
sell to the U.S. market. More specifically, the relatively
low R&D spending rates and dominant industry choice
(wholesale/retail trade) of non-U.S. immigrant export-
ers suggest that they are more likely to compete on the
basis of a low-pricing strategy than a premium-pricing
strategy that emphasizes product features. This sug-
gests that non-U.S. immigrant exporters may be more
For the exclusive use of Horatio Morgan, [email protected], Ryerson University.

The Conference Board of Canada | 3
Find this briefing and other Conference Board research at www.e-library.ca
vulnerable to price competition than U.S. immigrant
exporters. A notable exception is knowledge-intensive
non-U.S. immigrant exporters whose business model
appears to be founded on an innovation-based strategy.
QUEBEC AND ONTARIO HAVE THE HIGHEST SHARE OF IMMIGRANT EXPORTERS BEYOND THE U.S.Ontario, British Columbia, and Quebec account for
more than four-fifths of Canada’s immigrant popula-
tion. In general, exporting businesses that are owned
by immigrants are more concentrated in Ontario and
Quebec than in other provinces. In Quebec, just over
40 per cent of immigrant businesses export to non-U.S.
markets. British Columbia has the smallest share of
non-U.S. immigrant exporters. However, given the
disproportionately large share of immigrant-owned
exporting businesses in dominant Ontario and Quebec
industries (i.e., wholesale/retail trade and knowledge-
based as opposed to forestry), the industrial structure
of British Columbia may be less conducive to export
activity for immigrant-owned businesses than that of
Ontario and Quebec.
MOST IMMIGRANT-OWNED BUSINESSES REPRESENT LIMITED LONG-TERM EXPORT POTENTIALWhile the propensity of recent immigrant-owned busi-
nesses to export to non-U.S. markets is relatively high,
the magnitude of their contribution to exporting activ-
ity in Canada is limited for several reasons. First, most
non-U.S. immigrant exporters are recently established,
less operationally efficient firms with limited business
connections in Canada. Second, their business model
does not appear to be founded on an innovation-based
strategy that emphasizes new products as opposed to
product price. This means they may be vulnerable to
price competition in non-U.S. markets over the long
term. However, these shortcomings primarily apply
to a dominant group of non-U.S. immigrant exporters
in the wholesale/retail trade sector.
A SELECT GROUP OF KNOWLEDGE-BASED IMMIGRANT EXPORTERS REPRESENTS IMPORTANT POTENTIAL IN NON-U.S. MARKETSIn contrast, medium-sized immigrant exporters
in the knowledge-based sector that export beyond
the U.S. market are particularly promising. This is
because their business model appears to be founded
on an innovation-based strategy that enables them
to compete on the basis of introducing new products
rather than offering lower prices. At the same time, this
innovation-based strategy predisposes them to formidable
financing challenges in the Canadian private debt and
equity markets. Therefore, the financing of innovative
immigrant exporters that sell to non-U.S. destinations
warrants special attention when formulating export
promotion policies in Canada. Despite the current
policy focus on boosting activity in non-U.S. markets,
the bulk of Canada’s trade is still to the United States.
Policy-makers should also consider the potential of
knowledge-intensive immigrant exporters that sell to
the U.S. market.
INTRODUCTION
For decades, tapping into export markets beyond the
U.S. has been an objective for Canadian businesses and
policy-makers. This objective has become an imperative
given that Canada–U.S. trade has been stagnant over
the past decade while developing country markets grew
rapidly. As a result, policy-makers and analysts have
called on businesses of all sizes to go beyond the U.S.
market, especially to fast-growth, developing country
markets.1 Canadian companies have started to export to
fast-growth markets, with 16 per cent of exports to these
markets in 2012. However, overall, trade is still over-
whelmingly concentrated in the U.S. market.2
Canada has consistently attracted and admitted immi-
grants from fast-growth markets. China, for example, is
the number one source country for Canadian immigrants:
almost 33,000 permanent residents were admitted to
Canada from China alone in 2012.3 Yet, Canada’s export
pattern has not reshaped to reflect the significant immi-
gration flows from China or other key source countries
such as India, which have occurred over the last decade.
1 Foreign Affairs, Trade and Development Canada, Global Markets Action Plan.
2 Sydor, The Internationalization of Canadian SMEs.
3 Citizenship and Immigration Canada, 2012: Canada’s Record-Breaking Year for Immigration.
© The Conference Board of Canada. All rights reserved. Please contact cboc.ca/ip with questions or concerns about the use of this material.
4 | Selling Beyond the U.S. —June 2014
Find this briefing and other Conference Board research at www.e-library.ca
Canadian companies that go beyond the U.S. market
face multiple challenges related to foreign languages,
cultures, social networks, and the cost of doing business.
However, many commentators and policy-makers have
argued that these challenges are not insurmountable
given Canada’s diverse immigrant population. Why
then has Canada not been able to effectively leverage
the foreign language skills, and the cultural knowledge
and networks of recent immigrants that originate from
fast-growth developing economies?
RESEARCH OBJECTIVESAt present, we do not have a clear picture of the actual
role that recent immigrants play in Canadian export
activity. (See box “Key Definitions” for our definition
of recent immigrants, among other key terms used
in this study.) One of the key objectives of this study
is to examine whether the export market decisions
of Canadian immigrant business owners reflect their
global experience and connections outside of Canada.
Specifically, we intend to address the following ques-
tion: Are Canadian SMEs with a recent immigrant
majority owner more likely to export to countries
beyond the U.S., compared with SMEs owned by
non-immigrants (as defined by immigrants who
have lived in Canada for more than five years)?
We are generally interested in Canadian SMEs
because they exhibit a pattern of internationalization
that is consistent with Canada’s export agenda as
defined in Canada’s 2013 Global Markets Action Plan.4
Importantly, this plan places considerable emphasis
on the growth of exports in emerging markets. This
requires that SMEs play a far more significant role as
exporters in emerging markets than is currently the
case. Currently, small businesses disproportionately
account for the value of exports to emerging and
developing country markets, including India, Egypt,
Turkey, and South Korea.5 In addition, they have been
making steady inroads into BRIC countries (Brazil,
Russia, India, and China) as a group.6 Furthermore,
4 Foreign Affairs, Trade and Development Canada, Global Markets Action Plan.
5 Industry Canada, Canadian Small Business Exporters.
6 Ibid.
exports account for a larger share of the sales of
Canadian small businesses than their medium or large
counterparts. However, large firms account for about
two-thirds of the value of exports.7
There is evidence that Canadian SMEs that export to
BRIC countries generally experience a boost in their
performance.8 At the same time, the most experienced
and innovative Canadian SMEs are better positioned to
7 Ibid.
8 Sui and Goldfarb, Not for Beginners.
Key Definitions
Recent immigrants and non-immigrants: Recent immigrants are immigrants who have been living in Canada for up to five years. By default, non-immigrants are defined as immigrants who have been living in Canada for more than five years.1
Small and medium-sized enterprise (SME): A Canadian private firm with fewer than 500 employees and annual revenue less than C$50 million.
Immigrant-owned business: A SME whose majority owner is a recent immigrant.
Non-immigrant-owned business: A SME whose majority owner is a non-immigrant.
U.S. immigrant exporter: A recent immigrant-owned business that sells to the U.S. market only.
U.S. non-immigrant exporter: A non-immigrant-owned business that sells to the U.S. market only.
Non-U.S. immigrant exporter: A recent immigrant-owned business that either sells to non-U.S. markets only, or both the U.S. market and non-U.S. markets.
Non-U.S. non-immigrant exporter: A non-immigrant-owned business that either sells to non-U.S. markets only, or sells to both the U.S. and non-U.S. markets.
1 This classification scheme was adopted because data are only available for immigrants who have been living in Canada for up to five years. By focusing on Canadian businesses that are specifically owned by recent immigrants rather than immigrants in general, we may underestimate their contribution to exporting activity in Canada. At the same time, we are better placed to effectively capture how the unique characteristics of immigrant business owners impact their export market decisions well before they assimilate into mainstream Canadian society.
For the exclusive use of Horatio Morgan, [email protected], Ryerson University.
The Conference Board of Canada | 5
Find this briefing and other Conference Board research at www.e-library.ca
survive after entering BRIC countries.9 To the extent that
international business experience and innovative capacity
increase with company age and size, well-established
medium to large companies are likely to have a com-
petitive advantage over recently established small firms
in fast-growth developing country markets. Arguments
along this line suggest that recently established immi-
grant-owned small businesses that target non-U.S.
markets are unlikely to significantly advance Canada’s
export agenda. However, more systematic evidence is
necessary since the role of recent immigrant businesses
in trade in general, and exporting activity in particular,
is incompletely understood.
This study addresses questions of both theoretical and
practical importance, making it relevant to industry
leaders, policy-makers, and academic researchers.
The questions addressed include:
1. What factors influence the decision of Canadian
SMEs to participate in non-U.S. markets?
2. What are the key elements of the export strategy
of immigrant-owned SMEs? We examine their
characteristics (i.e., majority owner’s gender and
business experience), and potential strengths and
weaknesses, including access to networks and
financing, innovation, size, export performance,
and profitability.
3. Do immigrants help Canada to establish stronger
trade linkages in non-U.S. markets?
4. What factors should policy-makers consider when
formulating export promotion policies that pertain
to immigrants?
RELATED STUDIES AND THE CONTRIBUTIONS OF THIS STUDY
Much of what we currently know about the role of
immigrants in export activity, and how to target export
markets, comes from prior country-level studies on
the relationship between immigration and aggregate
9 Sui and Goldfarb, Not for Beginners.
bilateral trade flows.10 Like our study, previous studies
along this line start out with the notion that immigrants
may systematically differ from non-immigrants in terms
of their preferences, language and cultural skills, and
their access to networks in their countries of origin.
Importantly, these studies generally found a statistic-
ally significant (partial) correlation between immigrant
presence and trade flows to and from the immigrants’
countries of origin. This has been shown for a number
of countries, including the United States,11 the United
Kingdom,12 and Canada.13
Immigrant presence in Canada strengthens the export orientation of Canadian SMEs and enables Canada to develop new trade linkages beyond the United States.
One may infer from the existing evidence that immi-
grants foster trade linkages between their host countries
and the countries from which they originate. However,
the existing evidence does not convincingly show that
immigrants in Canada or elsewhere promote trade
through direct involvement in trade activity or inter-
national business. Therefore, it remains unclear whether
immigration policy is actually a potent tool for redirect-
ing Canadian trade flows.
This study primarily contributes to the existing litera-
ture by providing more direct evidence about the role
that immigrants play in trade promotion in general,
and exporting in particular. Specifically, we examine
firm-level Canadian data for more than 15,000 SMEs to
determine the effects of immigrant ownership on export
orientation. We found that SMEs with a majority owner
who is a recent immigrant are more likely to export to
countries beyond the U.S. compared with SMEs owned
10 Downie, How Immigration Expands Canadian Markets ; Girma and Yu, “The Link Between Immigration and Trade”; Gould, “Immigrant Links to the Home Country”; Head and Ries, “Immigration and Trade Creation”; Wagner, Head, and Ries, “Immigration and the Trade of Provinces.”
11 Gould, “Immigrant Links to the Home Country.”
12 Girma and Yu. “The Link Between Immigration and Trade.”
13 Downie, How Immigration Expands Canadian Markets ; Wagner, Head, and Ries, “Immigration and the Trade Provinces.”
© The Conference Board of Canada. All rights reserved. Please contact cboc.ca/ip with questions or concerns about the use of this material.
by non-immigrants or immigrants who have lived in
Canada for more than five years. This suggests that immi-
grant presence in Canada does not merely strengthen the
export orientation of Canadian SMEs, but also enables
Canada to develop new or stronger trade linkages beyond
the U.S. than would otherwise have been the case. Thus,
prior studies that found a positive correlation between
immigration and total trade flows between countries may
actually point to the potential of immigrants to directly
impact a country’s cross-border trade flows and/or its
existing trade relationships with other countries.
The influx of immigrants in a country may lead to changes in its cross-border trade flows and/or its existing trade relationships with other countries.
More generally, a positive correlation between immigra-
tion and total trade flows between countries suggests
two possibilities along the following lines: (1) people
primarily migrate to foreign countries with pre-existing
trading relationships with their home countries; and
(2) immigrants create new or stronger trading relation-
ships between their host countries and the countries
from which they originate. The first case suggests that
trade causes immigration. Meanwhile, the second case
suggests that immigration causes trade; that is, the
influx of immigrants in a country will lead to a change
in its cross-border trade flows and/or its existing trade
relationships with other countries. Our finding is more
consistent with the second case. Altogether, this sug-
gests that immigrants have an important role to play in
Canada’s export agenda. As such, this study contributes
to the formulation of the policies required to advance
this export agenda by providing new insights into the
strengths and weaknesses of immigrant-owned export-
ing businesses.
OUR DATA AND METHOD
A non-technical explanation of the data and methodol-
ogy is provided here; however, Appendix A provides
more technical details about the methodology, data,
definition of variables, and the results of our regression
analysis.
As mentioned above, one of our key objectives is to
determine whether immigrant-owned SMEs are more
likely to export goods and services to non-U.S. markets
compared with their non-immigrant-owned counterparts.
Our method allowed us to estimate the impact of immi-
grant ownership on the likelihood that Canadian SMEs
will export to non-U.S. markets as opposed to selling
either to the domestic market only or exporting only to
the United States. We controlled for other factors (such
as access to inter-firm networks, R&D intensity, com-
pany age and size) to isolate the effect of immigrant
ownership on export market decisions. In addition, since
the survey data that we used include trade in goods
and services, our coverage of the exporting activity of
Canadian SMEs in general and immigrant-owned busi-
nesses in particular, is more comprehensive than prior
studies that used data on trade in goods only.
For the purpose of this study, we define a SME as a
private firm with fewer than 500 employees and annual
revenue of less than C$50 million. This definition is
consistent with that of Industry Canada and Statistics
Canada. Based on data availability, we define a SME
to be immigrant-owned if its majority owner is an
immigrant who has been living in Canada for up to
five years. (See box “Key Definitions.”)
We drew on the following confidential data sources:
� Statistics Canada’s 2007 Survey on Financing of
Small and Medium Enterprises;
� T2 Corporation Income Tax Return, and the
General Index of Financial Information (GIFI).
These databases have been linked by Statistics Canada’s
Centre for Data Development and Economic Research
(CDER). Based on the data available for 2007, we
have a sample of more than 15,000 Canadian SMEs.
Immigrant-owned SMEs account for almost 3 per cent
(442) of this sample.
LIMITATIONS We acknowledge that this study has a number of lim-
itations that are primarily due to data unavailability.
First, our analysis of immigrant-owned businesses is
restricted to Canadian SMEs with immigrant majority
owners who have lived in Canada for at most five years.
However, it is possible that immigrant business owners
6 | Selling Beyond the U.S. —June 2014
Find this briefing and other Conference Board research at www.e-library.ca
For the exclusive use of Horatio Morgan, [email protected], Ryerson University.
who have lived in Canada beyond five years may be
better positioned to significantly contribute to export
activity; hence, our focus on recent immigrants may
potentially underestimate the extent to which immi-
grants are participating in export markets. At the same
time, we also recognize that it will become increas-
ingly difficult to disentangle the unique contributions
of immigrants versus Canadian-born individuals as the
process of assimilation unfolds over time. So this five-
year restriction may in fact enable us to better capture
how the unique characteristics of immigrant business
owners affect their export market decisions well before
they assimilate into mainstream Canadian society.
Second, although Statistics Canada’s latest Survey on
Financing of Small and Medium Enterprises is available
for 2011, it does not provide data on multiple business
ownership.14 Since only the 2007 survey contains data
on multiple business ownership, we primarily focus
on 2007. Our analysis essentially provides a snapshot
of the impact of immigrant ownership on the export
market decisions of Canadian SMEs, but it does not
tell us whether immigrant-owned businesses will con-
tinue to target the same export markets over time. At
the same time, we do not have a compelling reason to
expect major changes in their export market decisions
over time.
Third, we know from prior studies that it is worthwhile
to jointly study exports and foreign direct investment
(FDI) because they may serve as complements or
substitutes.15 However, data limitation precluded such
an analysis. In addition, although we treat Canadian
SMEs that sell exclusively to the domestic market as
non-exporters, they may very well operate as import-
ers. As importers, they may enable both exporters and
non-exporters in Canada to operate more efficiently
by supplying cheap raw materials and other product-
ive inputs that have been sourced abroad. Therefore,
it is important to understand the importing activity of
14 We need data on multiple business ownership to determine whether SMEs belong to inter-firm networks. These networks are created if entrepreneurs own and/or manage several businesses at the same time.
15 Head and Ries, “Overseas Investment and Firm Exports.”
immigrant-owned SMEs in Canada. However, data lim-
itation precluded an analysis of the import orientation
of Canadian SMEs owned by recent immigrants.
Fourth, our data do not enable us to determine whether
recent immigrant-owned businesses primarily export to
the countries from which their owners originate. Ideally,
we would like to know, for example, whether immi-
grants from India disproportionately account for newly
established or existing businesses that primarily export
to India. This type of information would considerably
strengthen evidence in support of the view that immi-
grant presence in Canada directly promotes trade in
general, and exporting in particular.
Our analysis essentially provides a snapshot of the impact of immigrant ownership on the export market decisions of Canadian SMEs.
Finally, we cannot rule out the possibility that the export
data are overstated for Canada–U.S. trade, and under-
stated for Canada’s trade with non-U.S. countries. For
instance, this may occur in cases where the full value
of exported goods and services is credited to the U.S.,
but only a fraction of those goods and services actually
represents added value (e.g., the entire value of a car
is credited as an export each time it crosses into the
U.S., even if only a part has been added in Canada).
Furthermore, exports from Canada to non-U.S. countries
may be partially credited to the U.S. where it merely
serves as a trans-shipment point. The understatement of
Canada’s trade with non-U.S. countries is often evident
in discrepancies in the officially recorded values of two-
way trade between Canada and non-U.S. countries. For
example, Mexico’s official imports from Canada far
exceed Canada’s recorded exports to Mexico.
EXPORT MARKET DECISIONS OF IMMIGRANT AND NON-IMMIGRANT BUSINESSES
In this section, we will primarily examine whether
recent immigrant-owned businesses systematically
differ from their non-immigrant counterparts in terms
of their export market decisions. As suggested above,
The Conference Board of Canada | 7
Find this briefing and other Conference Board research at www.e-library.ca
© The Conference Board of Canada. All rights reserved. Please contact cboc.ca/ip with questions or concerns about the use of this material.

recent immigrants may have an advantage over non-
immigrants in terms of foreign language skills, cultural
knowledge, and access to networks in their non-U.S.
countries of origin.16 Therefore, we predict that recent
immigrant-owned businesses are more likely to export
to non-U.S. markets (as opposed to the Canadian or
U.S. market) than non-immigrant-owned businesses,
all else being equal.
To determine whether the data actually support this
prediction, we will first broadly compare immigrant-
and non-immigrant-owned businesses based on a num-
ber of export measures. However, we acknowledge that
the evidence from such broad comparisons may not be
comprehensive because there are material differences
(e.g., company age, value of assets, business experience
of owners) between immigrant and non-immigrant busi-
nesses and their owners. Therefore, we will extend our
analysis by drawing on the key results from our regres-
sion analysis. (See Appendix A.) The statistical evidence
from our regression analysis is more comprehensive
because it ensures that immigrant and non-immigrant
businesses are comparable by controlling for material
differences at the level of the owners, firms, the indus-
try, and the location in which they operate.
Most Canadian businesses are focused on the domestic market, but immigrant-owned businesses are more likely to target non-U.S. markets.
Chart 1 indicates that both immigrant and non-immigrant
businesses are focused largely on the domestic market.
However, immigrant-owned businesses are more likely
to target non-U.S. markets than businesses owned by
non-immigrants, as Chart 1 illustrates.
When it comes to international markets, we found that
12 per cent of immigrant-owned businesses are export-
ers that sell goods and services to non-U.S. markets
compared with 7 per cent for non-immigrant businesses.
However, the share (7 per cent) of immigrant and
16 Head and Mayer, What Separates Us? ; Head and Ries, Immigration and Trade Creation.
non-immigrant businesses that export to the U.S. is
the same. (See Chart 1.) Altogether, these results are
consistent with our prediction that immigrant exporters
are more likely to sell to non-U.S. markets than their
non-immigrant counterparts.
Immigrant exporters are low-value exporters in both
U.S. and non-U.S. markets. On average, non-immigrant
exporters sell almost twice as much as immigrant
exporters—C$830,000 compared with C$460,000—
in the U.S. market. (See Chart 2.) But when non-
immigrant exporters sell to non-U.S. markets, the
average value of their exports is more than three times
that of immigrant exporters—C$880,000 compared
with C$270,000. This suggests that while immigrant
exporters are low-value exporters in the U.S. market,
they are even more so in non-U.S. markets. However,
exports account for more than two-thirds of the sales of
non-U.S. immigrant exporters compared with roughly a
half for non-U.S. non-immigrant exporters. Meanwhile,
exports account for the same share of sales (roughly
two-fifths) for U.S. immigrant and non-immigrant
exporters. (See Chart 3.)
Interestingly, non-immigrant exporters seem to use
their human resources more efficiently to generate
value from their exporting activity in either U.S. or
non-U.S. markets; specifically, the average value that
8 | Selling Beyond the U.S. —June 2014
Find this briefing and other Conference Board research at www.e-library.ca
Chart 1Canadian SMEs’ Market Decisions, 2007(percentage share by destination)
Sources: The Conference Board of Canada; Statistics Canada, Survey on Financing Small and Medium Enterprises, 2007.
7
12
81
Immigrant-owned Non-immigrant-owned
U.S. Non−U.S. Domestic
77
86
For the exclusive use of Horatio Morgan, [email protected], Ryerson University.

employees contribute to the exports of non-immigrant
businesses is more than twice that of immigrant busi-
nesses. (See Chart 4.)
Up to this point, our broad comparison of immigrant
and non-immigrant businesses suggests that immigrant
businesses are:
� more likely to export to non-U.S. markets;
� more export-oriented in general (exports represent
a larger share of their sales);
� disproportionately low-value exporters in both U.S.
and non-U.S. markets, but more so in the latter;
� more dependent on the sales generated from non-
U.S. markets;
� less operationally efficient in terms of their use of
employees in their export operations.17
The following will extend our analysis by focusing on
the first result above. Specifically, we will examine
whether immigrant exporters are more likely to sell
to non-U.S. markets than otherwise comparable non-
immigrant exporters.
All else being equal, we found that immigrant exporters
are more likely to sell goods and services to non-U.S.
markets than non-immigrant exporters. (See Table 1.)
17 This is consistent with their relatively low export value per employee.
The Conference Board of Canada | 9
Find this briefing and other Conference Board research at www.e-library.ca
Chart 2Value of Exports, 2007($ millions)
Sources: The Conference Board of Canada; Statistics Canada, Survey on Financing Small and Medium Enterprises, 2007.
U.S. Non−U.S.0
0.20.40.60.81.0
Immigrant−owned Non−immigrant−owned
Chart 3Export Intensity, 2007(percentage of sales)
Sources: The Conference Board of Canada; Statistics Canada, Survey on Financing Small and Medium Enterprises, 2007.
U.S. Non−U.S.0
20
40
60
80Immigrant−owned Non−immigrant−owned
Chart 4Value of Exports per Employee, 2007($ millions)
Sources: The Conference Board of Canada; Statistics Canada, Survey on Financing Small and Medium Enterprises, 2007.
U.S. Non−U.S.0
0.10.20.30.40.50.6
Immigrant−owned Non−immigrant−owned
Table 1Selected Factors That Impact the Market Decisions of Canadian SMEs
U.S. vs. Domestic
Non-U.S. vs. Domestic
Non-U.S. vs. U.S.
Immigrant owner ~ + +
Access to inter-firm networks + ~ ~
Located in urban centre ~ + ~
R&D (share of total spending) + + ~
Company size (value of assets) + + ~
Company age (years) + ~ ~
Note: A plus sign indicates a significant and positive relationship, a minus sign indicates a significant and negative relationship, and a tilde (~) indicates statistical insignificance. Please see Table 1 in Appendix A for more detailed regression results.Sources: The Conference Board of Canada; Statistics Canada, Survey on Financing Small and Medium Enterprises, 2007.
© The Conference Board of Canada. All rights reserved. Please contact cboc.ca/ip with questions or concerns about the use of this material.
Specifically, if immigrant and non-immigrant business
owners are similarly faced with a choice between sell-
ing to non-U.S. markets and the Canadian market, our
findings indicate that immigrant business owners are
1.6 times more likely than their non-immigrant counter-
parts to select non-U.S. markets over the Canadian
market.18 (See Table 1 in Appendix A.) If the choice
is between the U.S. and non-U.S. markets, immigrant
business owners are more than two times more likely
to select non-U.S. markets over the U.S. market. Other
factors such as business connections also influence
export market decisions. (For other findings, see box
“Selected Factors Other Than the Immigrant Status of
Owners That Influence Export Market Decisions.”)
PERFORMANCE OUTCOMES
We have established that immigrant exporters are
more likely to sell to non-U.S. markets than otherwise
comparable non-immigrant exporters; however, this
raises another related question: Do non-U.S. immigrant
exporters outperform other exporters on average? To
address this question, we will evaluate the performance
of immigrant and non-immigrant exporters based on the
following three measures:
� profitability
� growth rate of profits
� “profit stability” or risk-adjusted profitability
To evaluate the profitability of exporters, we examine
their return on assets (ROA) between 2007 and 2011.
This is the average profit per dollar invested in assets.
Importantly, this performance measure captures whether
the companies are using resources efficiently in the mar-
kets in which they operate. When we look at exporters
to non-U.S. markets, we found that the average ROA
of non-immigrant exporters is more than twice the aver-
age ROA of their immigrant counterparts; specifically,
for every C$1.00 that is invested in assets, non-U.S.
non-immigrant exporters realized C$2.39 in profits on
average compared with C$1.18 for non-U.S. immigrant
18 Table 1 in Appendix A reports a log odds ratio of 0.954. Taking the antilog with respect to base e (i.e., e 0.954) yields an odds ratio of 2.60. Since an odds ratio of 1 implies equal chances, the addi-tional gain in the odds ratio is 1.60.
exporters. (See Chart 5.) However, immigrant exporters
that sell to the U.S. market outperform non-immigrant
exporters on average—for every one Canadian dollar
that is invested in assets, U.S. immigrant exporters
realized C$2.65 in profits on average compared with
C$1.83 for U.S. non-immigrant exporters. As our
10 | Selling Beyond the U.S. —June 2014
Find this briefing and other Conference Board research at www.e-library.ca
Selected Factors Other Than the Immigrant Status of Owners That Influence Export Market Decisions1
� Business connections matter: The odds of becoming a U.S. exporter2 as opposed to a non-exporter are 55 per cent higher when SMEs belong to an inter-firm network rather than operating as stand-alone enterprises.
� Innovation matters: A one percentage-point increase in R&D spending as a share of total expenditures increases the odds that SMEs will sell to non-U.S. markets by 5 per cent.
� Manufacturers are more likely to export: The odds of becoming an exporter as opposed to a non-exporter are generally lower for non-manufacturing SMEs relative to manufacturing SMEs. This is not surprising because some non-manufacturing SMEs may actually be non-trading service-based firms. At the same time, many services are tradable across borders. However, the export activity of firms that offer tradable services may not be adequately captured if they operate through foreign affiliates—so that exports are treated as foreign direct investment (FDI)—or if their value-added activities are embedded in the overall value of trade in manufactures.
� Location matters: When SMEs are based in Ontario and Quebec, rather than other provinces, they are more likely to become exporters that sell to U.S. and non-U.S. markets. Thus, these provinces seem to have conditions or industries that are more conducive to export activity. Meanwhile, the odds of becoming a non-U.S. exporter instead of a non-exporter are 49 per cent higher when SMEs are based in an urban centre rather than a rural area.
� Company size matters: An increase in the asset value of SMEs by one dollar increases the odds that they will sell to the U.S. and non-U.S. markets by 1.5 and 2 per cent, respectively, as opposed to the domestic market.
� Company age is not critical: An additional year of business operation does not significantly increase the likelihood that SMEs export either to U.S. or non-U.S. markets as opposed to selling to the domestic market.
1 See Table 1 in Appendix A.
2 We conveniently use the term “U.S. exporters” to refer to Canadian SMEs that export only to the United States.
For the exclusive use of Horatio Morgan, [email protected], Ryerson University.

results below indicate, these top-performing U.S.
immigrant exporters are apparently highly innovative
businesses in the knowledge-based sector.
The profits of immigrant exporters that sell to non-U.S.
markets grew the fastest but were the least profitable
and the least stable. Charts 5 to 7 show the average
profits, profit growth, and profit stability for immigrant-
owned versus non-immigrant-owned exporters.
To evaluate the growth performance of exporters,
we examined the average rates at which their profits
grew. In principle, if revenue from exports is growing at
a faster rate than the costs associated with the deploy-
ment of assets and employees in export operations, we
expect to see an increase in the growth rate of profits
over time. Drawing on the financial results of compan-
ies for the period 2007–11, we found that immigrant
exporters that sell to non-U.S. markets have grown the
fastest on average, at a rate of 21 per cent annually on
average. (See Chart 6.) In contrast, the profits of non-
U.S. non-immigrant exporters declined by 2 per cent
annually on average. (See Chart 6.) On a whole, while
immigrant exporters that sell to U.S. and non-U.S. mar-
kets have realized an average annual net profit growth
rate of 16 per cent (21 per cent for non-U.S. markets
minus 5 per cent for the U.S. market), non-immigrant
exporters have realized an average annual net profit
growth rate of just 1 per cent (3 per cent for the U.S.
market minus 2 per cent for non-U.S. markets).
While the ROA profitability measure captures the extent
to which companies are efficiently using resources in
the markets in which they operate, it does not capture
the extent to which they are compensated for the degree
of risk that they assume when they serve one market
versus another. To capture differences in the degree of
risk across markets, we adjusted the ROA profitability
measure.19 This yields what may be called a “profit
stability” profitability measure; or more directly, a risk-
19 Specifically, we divided average ROA by the standard deviation of ROA for the period 2007–11. Standard deviation of ROA is a measure of the variation around the average ROA value. It serves as proxy for risk. A higher (lower) standard deviation implies higher (lower) degree of risk, which is observed as greater (lower) variability in profits for a given period. All else being equal, the risk-adjusted ROA values will decrease (increase) as the standard deviation of ROA increases (decreases).
The Conference Board of Canada | 11
Find this briefing and other Conference Board research at www.e-library.ca
Chart 5Average Profits, 2007–11(average profit per dollar invested in assets)
Sources: The Conference Board of Canada; Statistics Canada, Survey on Financing Small and Medium Enterprises, 2007.
U.S. Non−U.S.0
0.51.01.52.02.53.0
Immigrant−owned Non−immigrant−owned
Chart 6Average Annual Profit Growth Rate, 2007–11(per cent)
Sources: The Conference Board of Canada; Statistics Canada, Survey on Financing Small and Medium Enterprises, 2007.
U.S. Non−U.S.–10
0
10
20
30Immigrant−owned Non−immigrant−owned
Chart 7Average Profit Stability, 2007–11(average profit per dollar invested in assets adjusted for risk)
Sources: The Conference Board of Canada; Statistics Canada, Survey on Financing Small and Medium Enterprises, 2007.
U.S. Non−U.S.0
0.51.01.52.02.5
Immigrant−owned Non−immigrant−owned
© The Conference Board of Canada. All rights reserved. Please contact cboc.ca/ip with questions or concerns about the use of this material.
adjusted ROA profitability measure, which we define as
the average profit on a dollar invested in assets per unit
of risk.
We found that immigrant and non-immigrant export-
ers that sell to non-U.S. markets have average profit
stability (an average risk-adjusted ROA) of C$0.83 and
C$1.59, respectively. (See Chart 7.) This suggests that
non-immigrant exporters are better compensated than
immigrant exporters for the risks that they assume in
non-U.S. markets. We also found that non-immigrant
exporters that sell to the U.S. market outperform their
immigrant counterparts in terms of risk-adjusted profit-
ability; specifically, the non-immigrant and immigrant
exporters have an average risk-adjusted ROA of C$2.38
and C$1.14, respectively. (See Chart 7.) Altogether, these
results suggest that non-immigrant exporters manage the
risks involved in international business more effectively
than immigrant exporters, and the former are rewarded
for doing so in terms of higher average profitability
adjusted for risk.
DO NON-U.S. IMMIGRANT EXPORTERS HAVE A VIABLE BUSINESS MODEL?The superior growth performance of immigrant export-
ers that sell to non-U.S. markets is a notable finding.
It is consistent with a prior study which found that
newly established immigrant-owned exporting com-
panies outperform other immigrant-owned domestic
companies in Canada as well as newly established non-
immigrant-owned exporting companies in terms of the
average rate of growth in revenue, profits, employment,
and average wage.20 However, that study did not indi-
cate which export markets primarily account for these
superior growth outcomes. Our study suggests that
these outcomes may be partially attributed to immigrant
exporters that sell to non-U.S. markets. Furthermore,
as we illustrate below, recently established immigrant-
owned SMEs disproportionately sell more goods and
services to non-U.S. markets compared with immigrant-
owned SMEs that have been in business for more than
a decade.
20 Neville and others, “Do Young Firms Owned by Recent Immigrants Outperform Other Young Firms?”
Although non-U.S. immigrant exporters are among the
fastest growing Canadian SMEs, their superior growth
performance does not translate into superior rates of
return from business operations. In general, U.S. immi-
grant exporters and non-immigrant exporters usually
generate more profits when they undertake the same
levels of investment in assets, or become exposed to
similar risk factors—such as unanticipated changes in
foreign exchange rates—over the course of doing busi-
ness abroad. Ideally, business owners and managers
should pursue both high growth rates and high rates
of return.21 However, if both of these performance out-
comes are not attainable at a particular stage of business
development, then business owners and managers should
primarily focus on generating high rates of return from
business operations.22 This strategic focus will enable
firms that are initially slow growing to eventually scale
up their operations to achieve both high growth rates
and high rates of return. Therefore, the high growth-low
return outcome for non-U.S. immigrant exporters gives
cause for concern; specifically, they are at risk of not
achieving the desired high growth-high return perform-
ance outcome over the long term.
A relatively large proportion of immigrant exporters to non-U.S. markets are essentially wholesale/retail traders with limited business connections in Canada.
For several reasons, the relatively low operational effi-
ciency of non-U.S. immigrant exporters calls the viability
of their business model into question. A major concern
is that they are low-value exporters. (See Chart 2.) As
low-value exporters, they are perhaps not sufficiently
compensated for the additional assets and employees
that must be deployed, and the additional risks that must
be assumed, when expanding into non-U.S. markets.
However, the relatively low operational efficiency of
non-U.S. immigrant exporters is not only limited by their
low export values. On average, they are more recently
established than U.S. immigrant exporters, and they also
21 Davidsson, Steffens, and Fitzsimmons, “Growing Profitable or Growing From Profits?”
22 Ibid.
12 | Selling Beyond the U.S. —June 2014
Find this briefing and other Conference Board research at www.e-library.ca
For the exclusive use of Horatio Morgan, [email protected], Ryerson University.
generate relatively low average revenue from their export
operations despite their relatively large asset base. We
will also show that a relatively large proportion of non-
U.S. immigrant exporters are essentially wholesale/retail
traders with limited business connections in Canada.
Furthermore, we assert that their business model makes
them more vulnerable to price competition compared
with both U.S. and non-U.S. immigrant exporters in
the knowledge-based sector.
THE CHARACTERISTICS, RESOURCES AND STRATEGIC OPERATIONS OF IMMIGRANT- AND NON-IMMIGRANT BUSINESSESUp to this point in our analysis, we have evaluated
the export market decisions of immigrant and non-
immigrant businesses, as well as their implications
for performance. In this final part of our analysis, we
will provide greater insights into the characteristics
of non-immigrant businesses.23
23 The descriptive statistics for female ownership and business experience are based on less than one-third of the observations in our sample. Descriptive statistics for all other owner and firm characteristics are based on the full sample.
Female Immigrant Owners Target Non-U.S. MarketsOn a whole, immigrant businesses have a lower share
of female ownership—19 per cent compared with
29 per cent—relative to non-immigrant businesses.
(See Table 2.) However, when we looked at immigrant
businesses that sell to non-U.S. markets, we found
that almost one-third of them have a female majority
owner. This is much higher than the one-fifth share
of domestically focused immigrant-owned businesses.
(See Table 2.) This could mean that female immigrant
owners face fewer barriers in non-U.S. markets than in
the Canadian market.
Recently Established, Small, and Less Operationally Efficient Immigrant Businesses Disproportionally Export to Non-U.S. MarketsOn a whole, recent immigrant businesses are almost
10 years old on average.24 (See Table 2.) Non-immigrant
businesses are more than one-and-a-half times older
24 Although recent immigrants have been in Canada for up to five years, they may become majority owners in established Canadian businesses. This explains why it is possible for recent immigrants to own businesses that are more than five years old.
The Conference Board of Canada | 13
Find this briefing and other Conference Board research at www.e-library.ca
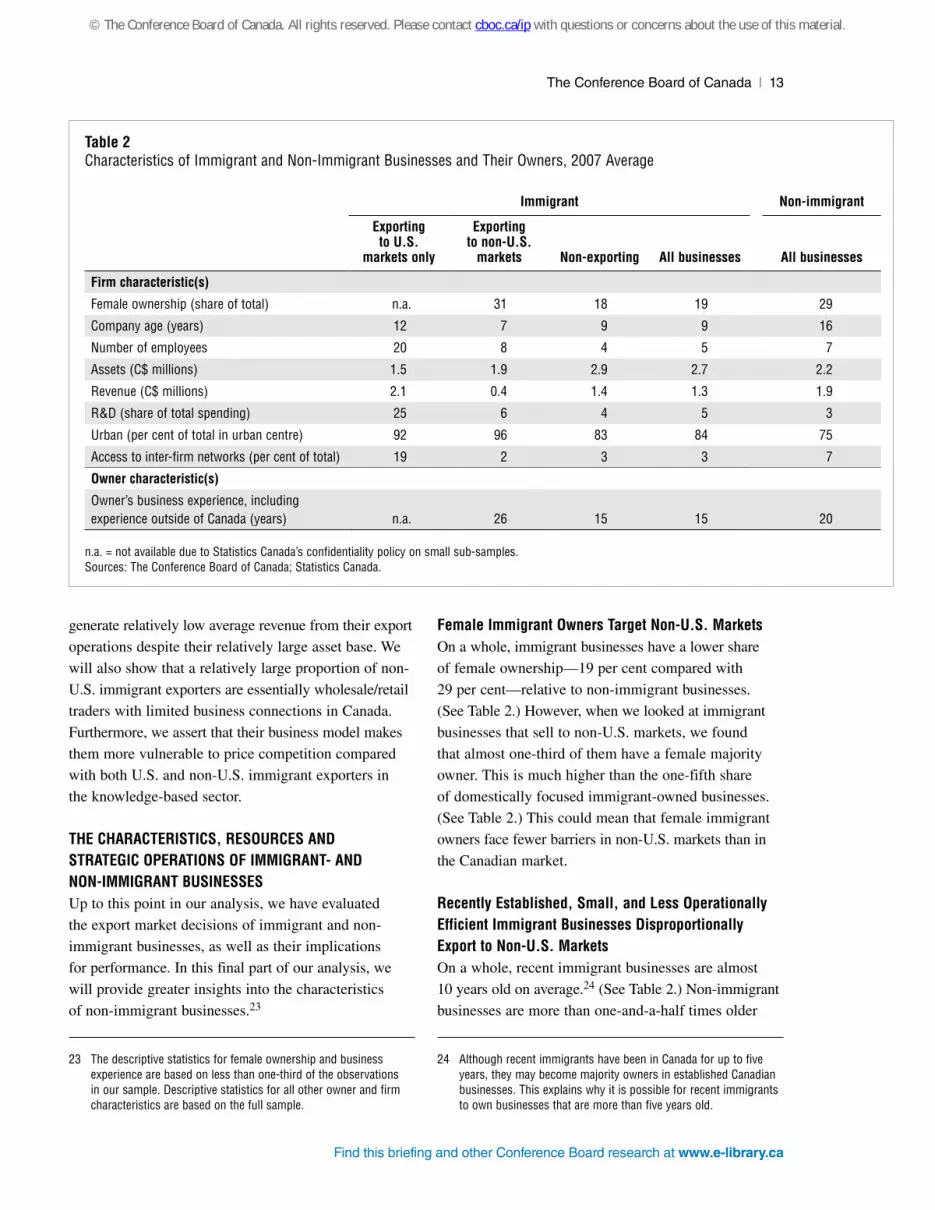
Table 2Characteristics of Immigrant and Non-Immigrant Businesses and Their Owners, 2007 Average
Immigrant Non-immigrant
Exporting to U.S.
markets only
Exporting to non-U.S.
markets Non-exporting All businesses All businesses
Firm characteristic(s)
Female ownership (share of total) n.a. 31 18 19 29
Company age (years) 12 7 9 9 16
Number of employees 20 8 4 5 7
Assets (C$ millions) 1.5 1.9 2.9 2.7 2.2
Revenue (C$ millions) 2.1 0.4 1.4 1.3 1.9
R&D (share of total spending) 25 6 4 5 3
Urban (per cent of total in urban centre) 92 96 83 84 75
Access to inter-firm networks (per cent of total) 19 2 3 3 7
Owner characteristic(s)
Owner’s business experience, including experience outside of Canada (years) n.a. 26 15 15 20
n.a. = not available due to Statistics Canada’s confidentiality policy on small sub-samples.Sources: The Conference Board of Canada; Statistics Canada.
© The Conference Board of Canada. All rights reserved. Please contact cboc.ca/ip with questions or concerns about the use of this material.
than immigrant businesses. While immigrant exporters
that sell to non-U.S. markets have been in business for
less than 10 years on average, their owners appear to
have substantial business experience outside of Canada.
Meanwhile, immigrant exporters that sell to the U.S.
market have been in business for more than 10 years
on average. (See Table 2.) What is clear is that recently
established immigrant exporting businesses dispropor-
tionately sell goods and services to non-U.S. markets.
On average, we found that immigrant businesses are
smaller than non-immigrant businesses in terms of the
number of employers (five compared with seven) and
revenue (just over C$1 million compared with almost
C$2 million). However, the average immigrant business
has almost C$3 million in assets compared with just over
C$2 million for the average non-immigrant business.
(See Table 2.) If the average immigrant business has
more assets but generates lower revenue than the
average non-immigrant business, it is possible that
the former is not operated as efficiently as the latter.
Immigrant ownership may confer advantages in non-U.S. markets, such as social ties or language skills that may partially compensate for company size, inexperience, or weaker R&D activity.
When we look at immigrant exporters as a group, we
find that the asset value of an average non-U.S. immi-
grant exporter is roughly 21 per cent higher than that
of an average U.S. immigrant exporter; yet the average
non-U.S. exporter generates less than one-fifth of the
revenue of the average U.S. exporter. (See Table 2.)
Altogether, these results suggest that less operation-
ally efficient, young, and small immigrant exporters
disproportionately sell goods and services to non-U.S.
markets. However, this finding warrants explanation
because it appears to be at odds with prior research
that suggests that the most operationally efficient
firms will export to difficult export markets.25
In terms of the degree of difficulty and cost of doing
business, Canadian firms are likely to find the U.S. mar-
ket easier and potentially less costly to deal with than
non-U.S. markets because the former is large, close to
Canada, and similar in terms of language, culture, and
legal and regulatory institutions. This implies that the
most operationally efficient Canadian firms are expected
to sell to non-U.S. markets, yet the findings of this
study indicate the opposite: recently established immi-
grant-owned SMEs disproportionately sell to non-U.S.
markets. Furthermore, as detailed below, these non-U.S.
immigrant exporting businesses constitute a relatively
large share of wholesale/retail traders with limited busi-
ness connections in Canada. However, if immigrant-
owned exporting businesses lack the capabilities that
engender operational efficiency, how are they able to sell
to the supposedly more demanding non-U.S. markets?
We suggest that less operationally efficient immigrant-
owned firms may export to non-U.S. markets over the
short term because immigrant ownership confers advan-
tages (i.e., social ties abroad, foreign language skills,
cultural knowledge) that may partially compensate for
firm characteristics that are associated with high produc-
tivity (e.g., R&D activity, company age and size). This
is consistent with our finding that immigrant ownership
has a greater positive effect than company age and R&D
intensity on the likelihood that Canadian SMEs will sell
to non-U.S. markets as opposed to either the domestic or
U.S. market. (See Table 1 in Appendix A.) More prac-
tically, recent immigrant business owners with limited
business connections in either Canada or the U.S. may
perceive few, if any, commercial opportunities in the
North American market; if so, they will be motivated to
export to non-U.S. markets where they are likely to have
stronger social and business ties.
25 Arnold and Hussinger, “Export Behavior and Firm Productivity in German Manufacturing”; Bernard and Jensen, “Exporters, Jobs, and Wages”; “Exceptional Exporter Performance”; “Why Some Firms Export”; Clerides, Lach, and Tybout, “Is Learning by Exporting Important?”; Wagner, “The Causal Effects of Exports on Firm Size and Labor Productivity.”
14 | Selling Beyond the U.S. —June 2014
Find this briefing and other Conference Board research at www.e-library.ca
For the exclusive use of Horatio Morgan, [email protected], Ryerson University.

The Most Innovative Immigrant Exporters Sell to the U.S. MarketIn practice, innovative businesses are characterized
by their capacity to generate new ideas about how to
make novel products and services or improve existing
ones. One way to identify an innovative company is
to assess the share of its revenue that is generated
from new products or services.26 However, due to
data limitations we were unable to apply such
an output-based measure of innovative capacity.
Therefore, we applied an input measure to proxy
innovation. Specifically, we used the share of R&D
spending in total expenditures as a measure of the
innovative capacity of the companies in our sample.
On average, we found that R&D spending accounts for
a larger share of the expenditures—5 per cent compared
with 3 per cent—of immigrant businesses relative to
non-immigrant businesses. (See Table 2.) But this higher
average share of R&D spending among immigrant
businesses is primarily attributed to U.S. immigrant
exporters. The share of their spending budget that
is allocated to R&D activities is roughly four times
larger than that of non-U.S. immigrant exporters. (See
Table 2.) The differences in R&D spending rates across
immigrant-owned businesses that export partly reflect
differences in the nature of competition in the industry
in which they operate. Although a relatively large group
of non-U.S. immigrant exporters operate in knowledge-
based industries, non-U.S. immigrant exporters are over-
whelmingly concentrated in the wholesale/retail trade
and other services.27 (See Chart 8.) Insofar as above-
average R&D spending rates are required to sustain
international competitiveness in the knowledge-based
and manufacturing industries, the relatively high R&D
intensity of U.S. immigrant exporters is consistent
with their relatively high participation rates in these
industries—22 and 34 per cent respectively (see charts 9
and 10)—compared with either non-U.S. immigrant
26 Therrien and Mohnen, “How Innovative Are Canadian Firms?”
27 We recognize that a relatively large share of non-U.S. immigrant exporters operate in a variety of service-based industries (shown as “Other services” in Chart 8). However, since our data do not adequately reflect the nature of these services, we will focus on wholesale/retail trade throughout this study. This emphasis is appropriate since the wholesale/retail trade sector accounts for the largest share of non-U.S. immigrant exporters.
exporters or non-immigrant exporters in general. In the
wholesale/retail trade sector where lower R&D spend-
ing rates are expected relative to the knowledge-based
and manufacturing industries, non-U.S. immigrant
exporters account for the largest share—just over one-
fifth (see Chart 11)—of immigrant-owned businesses.
The Conference Board of Canada | 15
Find this briefing and other Conference Board research at www.e-library.ca
Chart 8Share of Immigrant-Owned Businesses Active in Each Market, by Sector, 2007(per cent)
Sources: The Conference Board of Canada; Statistics Canada.Survey on Financing Small and Medium Enterprises, 2007.
Other services
Accommodation and food
Wholesale/retail trade
Professional services
Knowledge−based industriesService sector
Manufacturing
Agriculture/primaryGoods producing sector
0 5 10 15 20 25 30 35 40 45 50
U.S. Non−U.S. Domestic
Chart 9Share of Immigrant and Non-Immigrant Owned Businesses Active in Each Market, Knowledge-Based Industries, 2007(per cent)
Sources: The Conference Board of Canada; Statistics Canada.Survey on Financing Small and Medium Enterprises, 2007.
22
1860
10
16
74
U.S. Non−U.S. Domestic
Immigrant-owned Non-immigrant-owned
© The Conference Board of Canada. All rights reserved. Please contact cboc.ca/ip with questions or concerns about the use of this material.
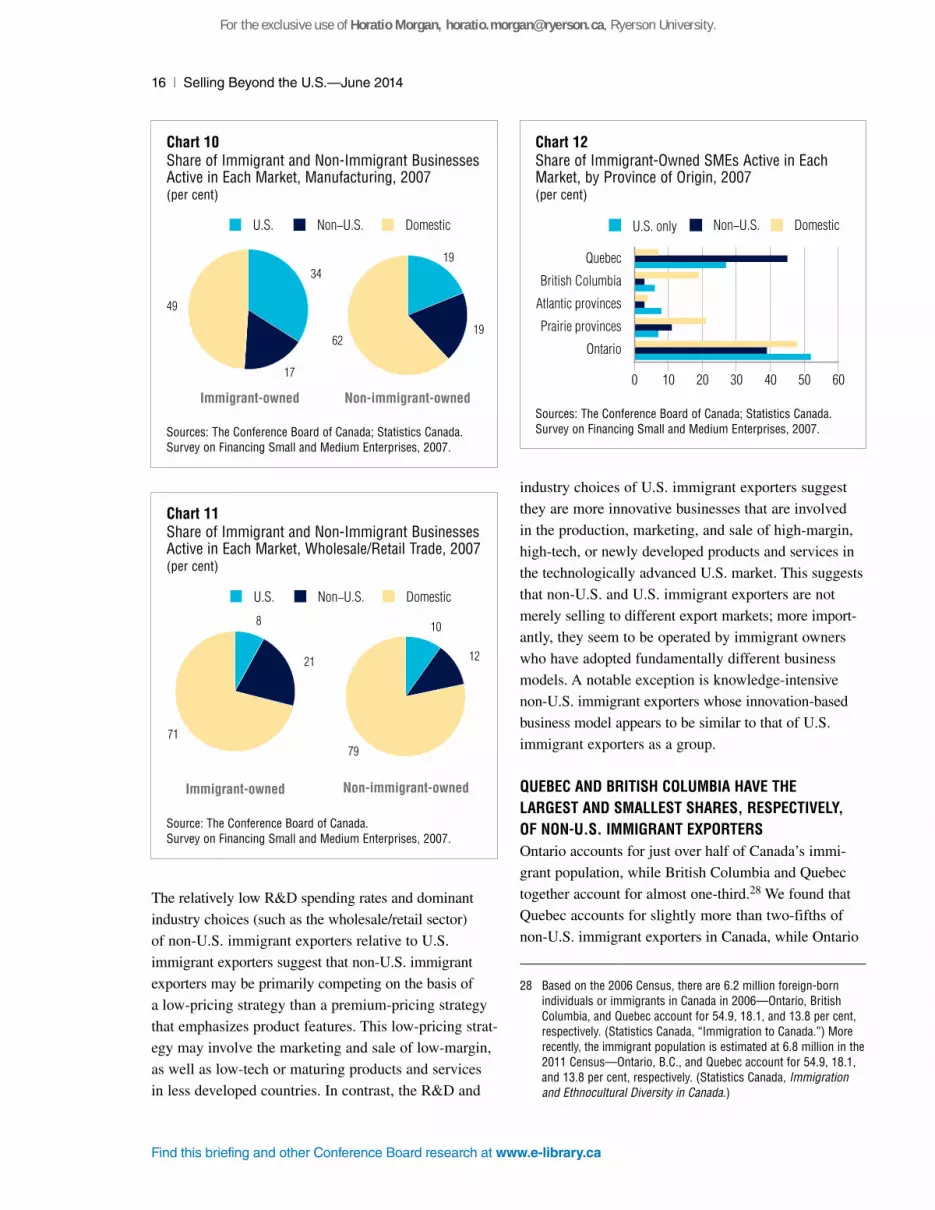
The relatively low R&D spending rates and dominant
industry choices (such as the wholesale/retail sector)
of non-U.S. immigrant exporters relative to U.S.
immigrant exporters suggest that non-U.S. immigrant
exporters may be primarily competing on the basis of
a low-pricing strategy than a premium-pricing strategy
that emphasizes product features. This low-pricing strat-
egy may involve the marketing and sale of low-margin,
as well as low-tech or maturing products and services
in less developed countries. In contrast, the R&D and
industry choices of U.S. immigrant exporters suggest
they are more innovative businesses that are involved
in the production, marketing, and sale of high-margin,
high-tech, or newly developed products and services in
the technologically advanced U.S. market. This suggests
that non-U.S. and U.S. immigrant exporters are not
merely selling to different export markets; more import-
antly, they seem to be operated by immigrant owners
who have adopted fundamentally different business
models. A notable exception is knowledge-intensive
non-U.S. immigrant exporters whose innovation-based
business model appears to be similar to that of U.S.
immigrant exporters as a group.
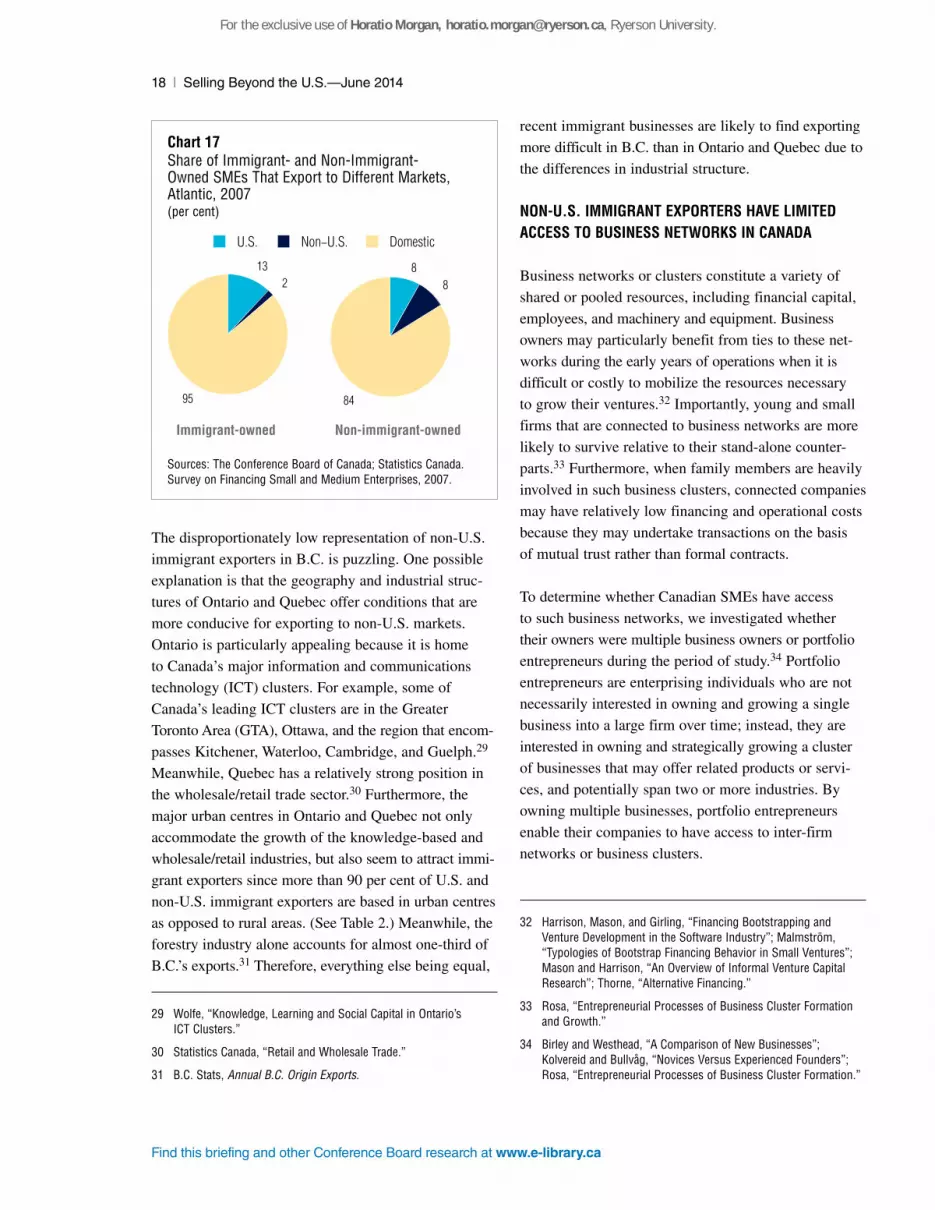
QUEBEC AND BRITISH COLUMBIA HAVE THE LARGEST AND SMALLEST SHARES, RESPECTIVELY, OF NON-U.S. IMMIGRANT EXPORTERS Ontario accounts for just over half of Canada’s immi-
grant population, while British Columbia and Quebec
together account for almost one-third.28 We found that
Quebec accounts for slightly more than two-fifths of
non-U.S. immigrant exporters in Canada, while Ontario
28 Based on the 2006 Census, there are 6.2 million foreign-born individuals or immigrants in Canada in 2006—Ontario, British Columbia, and Quebec account for 54.9, 18.1, and 13.8 per cent, respectively. (Statistics Canada, “Immigration to Canada.”) More recently, the immigrant population is estimated at 6.8 million in the 2011 Census—Ontario, B.C., and Quebec account for 54.9, 18.1, and 13.8 per cent, respectively. (Statistics Canada, Immigration and Ethnocultural Diversity in Canada.)
16 | Selling Beyond the U.S. —June 2014
Find this briefing and other Conference Board research at www.e-library.ca
Chart 12Share of Immigrant-Owned SMEs Active in Each Market, by Province of Origin, 2007(per cent)
Sources: The Conference Board of Canada; Statistics Canada.Survey on Financing Small and Medium Enterprises, 2007.
Ontario
Prairie provinces
Atlantic provinces
British Columbia
Quebec
600 10 20 30 40 50
U.S. only Non−U.S. Domestic
Chart 11Share of Immigrant and Non-Immigrant Businesses Active in Each Market, Wholesale/Retail Trade, 2007(per cent)
Source: The Conference Board of Canada.Survey on Financing Small and Medium Enterprises, 2007.
8
21
71
10
12
79
U.S. Non−U.S. Domestic
Immigrant-owned Non-immigrant-owned
Chart 10Share of Immigrant and Non-Immigrant Businesses Active in Each Market, Manufacturing, 2007(per cent)
Sources: The Conference Board of Canada; Statistics Canada.Survey on Financing Small and Medium Enterprises, 2007.
34
17
49
19
1962
U.S. Non−U.S. Domestic
Immigrant-owned Non-immigrant-owned
For the exclusive use of Horatio Morgan, [email protected], Ryerson University.

accounts for just over one-third. (See Chart 12.) B.C.
accounts for less than one-twentieth of non-U.S. immi-
grant exporters in Canada. Alternatively, the share of
immigrant-owned businesses in Quebec that export to
non-U.S. markets is just over four and twenty times
larger than the shares of immigrant-owned businesses
in Ontario and B.C., respectively. (See charts 13, 14,
and 15.) Meanwhile, the share of immigrant businesses
in Quebec that export to the U.S. is two and more than
four times larger than the shares of U.S. immigrant
exporters in Ontario and B.C., respectively. (See charts
13, 14, and 15.) With the exception of B.C., non-U.S.
immigrant exporters account for a larger share of
total immigrant-owned businesses than non-U.S.
non-immigrant exporters across provinces. (See
charts 13 to 17.)
The Conference Board of Canada | 17
Find this briefing and other Conference Board research at www.e-library.ca
Chart 13Share of Immigrant- and Non-Immigrant-Owned SMEs Active in Each Market, Ontario, 2007(per cent)
Sources: The Conference Board of Canada; Statistics Canada.Survey on Financing Small and Medium Enterprises, 2007.
Chart 15Share of Immigrant- and Non-Immigrant-Owned SMEs Active in Each Market, British Columbia, 2007(per cent)
Sources: The Conference Board of Canada; Statistics Canada.Survey on Financing Small and Medium Enterprises, 2007.
710
83
88
84
U.S. Non−U.S. Domestic
Immigrant-owned Non-immigrant-owned
Chart 14Share of Immigrant- and Non-Immigrant-Owned SMEs Active in Each Market, Quebec, 2007(per cent)
Sources: The Conference Board of Canada; Statistics Canada.Survey on Financing Small and Medium Enterprises, 2007.
14
41
456
7
87
U.S. Non−U.S. Domestic
Immigrant-owned Non-immigrant-owned
3 2
95
88
84
U.S. Non−U.S. Domestic
Immigrant-owned Non-immigrant-owned
Chart 16Share of Immigrant- and Non-Immigrant-Owned SMEs Active in Each Market, Prairies, 2007(per cent)
Sources: The Conference Board of Canada; Statistics Canada.Survey on Financing Small and Medium Enterprises, 2007.
3 7
91
56
90
U.S. Non−U.S. Domestic
Immigrant-owned Non-immigrant-owned
© The Conference Board of Canada. All rights reserved. Please contact cboc.ca/ip with questions or concerns about the use of this material.
The disproportionately low representation of non-U.S.
immigrant exporters in B.C. is puzzling. One possible
explanation is that the geography and industrial struc-
tures of Ontario and Quebec offer conditions that are
more conducive for exporting to non-U.S. markets.
Ontario is particularly appealing because it is home
to Canada’s major information and communications
technology (ICT) clusters. For example, some of
Canada’s leading ICT clusters are in the Greater
Toronto Area (GTA), Ottawa, and the region that encom-
passes Kitchener, Waterloo, Cambridge, and Guelph.29
Meanwhile, Quebec has a relatively strong position in
the wholesale/retail trade sector.30 Furthermore, the
major urban centres in Ontario and Quebec not only
accommodate the growth of the knowledge-based and
wholesale/retail industries, but also seem to attract immi-
grant exporters since more than 90 per cent of U.S. and
non-U.S. immigrant exporters are based in urban centres
as opposed to rural areas. (See Table 2.) Meanwhile, the
forestry industry alone accounts for almost one-third of
B.C.’s exports.31 Therefore, everything else being equal,
29 Wolfe, “Knowledge, Learning and Social Capital in Ontario’s ICT Clusters.”
30 Statistics Canada, “Retail and Wholesale Trade.”
31 B.C. Stats, Annual B.C. Origin Exports.
recent immigrant businesses are likely to find exporting
more difficult in B.C. than in Ontario and Quebec due to
the differences in industrial structure.
NON-U.S. IMMIGRANT EXPORTERS HAVE LIMITED ACCESS TO BUSINESS NETWORKS IN CANADA
Business networks or clusters constitute a variety of
shared or pooled resources, including financial capital,
employees, and machinery and equipment. Business
owners may particularly benefit from ties to these net-
works during the early years of operations when it is
difficult or costly to mobilize the resources necessary
to grow their ventures.32 Importantly, young and small
firms that are connected to business networks are more
likely to survive relative to their stand-alone counter-
parts.33 Furthermore, when family members are heavily
involved in such business clusters, connected companies
may have relatively low financing and operational costs
because they may undertake transactions on the basis
of mutual trust rather than formal contracts.
To determine whether Canadian SMEs have access
to such business networks, we investigated whether
their owners were multiple business owners or portfolio
entrepreneurs during the period of study.34 Portfolio
entrepreneurs are enterprising individuals who are not
necessarily interested in owning and growing a single
business into a large firm over time; instead, they are
interested in owning and strategically growing a cluster
of businesses that may offer related products or servi-
ces, and potentially span two or more industries. By
owning multiple businesses, portfolio entrepreneurs
enable their companies to have access to inter-firm
networks or business clusters.
32 Harrison, Mason, and Girling, “Financing Bootstrapping and Venture Development in the Software Industry”; Malmström, “Typologies of Bootstrap Financing Behavior in Small Ventures”; Mason and Harrison, “An Overview of Informal Venture Capital Research”; Thorne, “Alternative Financing.”
33 Rosa, “Entrepreneurial Processes of Business Cluster Formation and Growth.”
34 Birley and Westhead, “A Comparison of New Businesses”; Kolvereid and Bullvåg, “Novices Versus Experienced Founders”; Rosa, “Entrepreneurial Processes of Business Cluster Formation.”
18 | Selling Beyond the U.S. —June 2014
Find this briefing and other Conference Board research at www.e-library.ca
Chart 17Share of Immigrant- and Non-Immigrant- Owned SMEs That Export to Different Markets, Atlantic, 2007(per cent)
Sources: The Conference Board of Canada; Statistics Canada.Survey on Financing Small and Medium Enterprises, 2007.
132
95
88
84
U.S. Non−U.S. Domestic
Immigrant-owned Non-immigrant-owned
For the exclusive use of Horatio Morgan, [email protected], Ryerson University.

On a whole, we found that a larger share of non-
immigrant businesses—7 per cent compared with 3 per
cent—have access to inter-firm networks in Canada
relative to immigrant businesses. (See Table 2.) When
we look at immigrant businesses as a group, we found
that almost one-fifth of immigrant exporters that sell to
the U.S. have access to inter-firm networks. (See Table 2.)
This is almost 10 times and slightly more than 6 times
the proportion of non-U.S. immigrant exporters and
immigrant non-exporters, respectively, with inter-firm
network connections. By having limited business ties in
Canada, non-U.S. immigrant exporters are likely to find
it difficult or costly to source both the financial and non-
financial resources that are required to profitably expand
their export operations. This is a cause for
concern since non-U.S. immigrant exporters are
disproportionately young and small.
Immigrant exporters to the U.S. are concentrated in the knowledge-based sector and, therefore less likely to be able to pledge tangible assets as collateral for loans.
NON-U.S. IMMIGRANT EXPORTERS HAVE BETTER ACCESS TO BANK FINANCING On average, a larger proportion of immigrant
businesses—84 per cent compared with 71 per cent—
apply for a bank loan relative to non-immigrant
businesses. (See Table 3.) The loan approval rate of
immigrant businesses is 70 per cent, which is almost
10 per cent higher than that of non-immigrant businesses.
(See Table 3.) While roughly four-fifths of U.S. and
non-U.S. immigrant exporters apply for a bank loan,
about two-thirds and three-quarters of U.S. and non-
U.S. immigrant exporters, respectively, are approved
for loans by Canadian banks. (See Table 3.) What is
clear is that a larger proportion of U.S. immigrant
exporters than non-U.S. immigrant exporters are
denied a bank loan when they apply for one. On
the surface, this difference in denial rates is puzzling
because Canadian exporters are likely to seek financing
from their banks with the expectation that they will
qualify for a loan guarantee under Export Development
Canada’s Export Guarantee Program (EGP).35
Canadian exporters with C$5 million or more in export
sales are likely to qualify for an EGP loan guarantee.
Importantly, this focus on export value is consistent
with prior studies that suggest that export promotion
programs should primarily target medium-sized firms
that are already exporting.36 In practice, however, small
Canadian exporters may qualify for an EGP loan guar-
antee if exports account for at least 15 per cent of their
sales. This suggests that both U.S. and non-U.S.
immigrant exporters are likely to qualify for EGP
loan guarantees based on the current export-related
criteria. However, Canadian financial institutions, acting
independently of Export Development Canada, ultim-
ately decide whether to provide loans to exporters with
EGP loan guarantees. Given the lower loan approval
rate of U.S. immigrant exporters relative to non-U.S.
immigrant exporters (see Table 3), it is possible that
Canadian financial institutions are less willing to lend
to U.S. immigrant exporters with EGP loan guarantees.
35 Export Development Canada, Export Guarantee Program.
36 Fernandes and Mattoo, Leave Export Promotion to Goldilocks ; Freund and Pierola, Export Superstars ; Sui and Goldfarb, Not for Beginners.
The Conference Board of Canada | 19
Find this briefing and other Conference Board research at www.e-library.ca
Table 3Access to Finance From Canadian Financial Institutions, 2007(per cent)
MarketsLoan
application rateLoan
approval rate
Immigrant
U.S. 85 67
Non-U.S. 79 75
Domestic 85 60
Total 84 70
Non-immigrant
Total 71 62
Sources: The Conference Board of Canada; Statistics Canada.Survey on Financing Small and Medium Enterprises, 2007.
© The Conference Board of Canada. All rights reserved. Please contact cboc.ca/ip with questions or concerns about the use of this material.
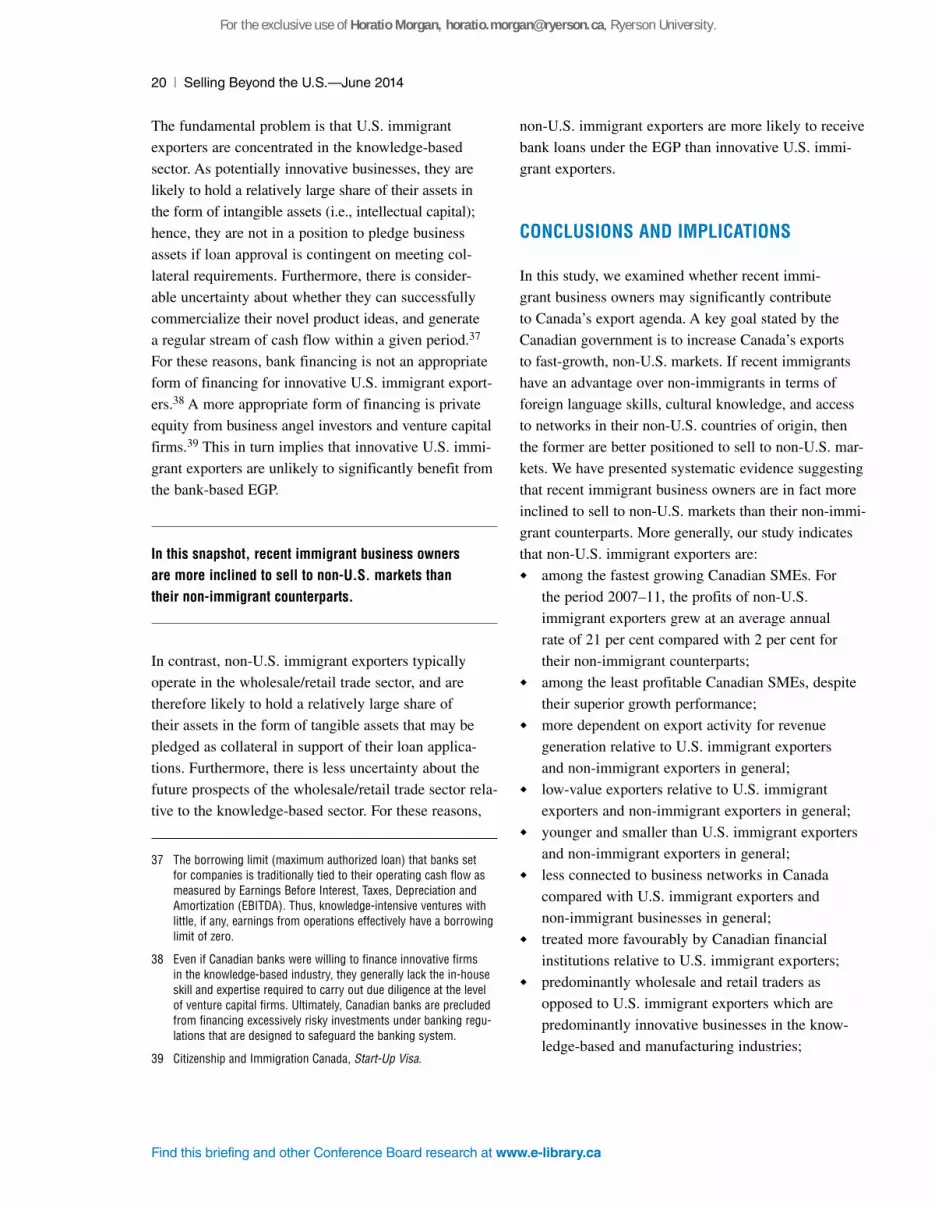
20 | Selling Beyond the U.S. —June 2014
Find this briefing and other Conference Board research at www.e-library.ca
The fundamental problem is that U.S. immigrant
exporters are concentrated in the knowledge-based
sector. As potentially innovative businesses, they are
likely to hold a relatively large share of their assets in
the form of intangible assets (i.e., intellectual capital);
hence, they are not in a position to pledge business
assets if loan approval is contingent on meeting col-
lateral requirements. Furthermore, there is consider-
able uncertainty about whether they can successfully
commercialize their novel product ideas, and generate
a regular stream of cash flow within a given period.37
For these reasons, bank financing is not an appropriate
form of financing for innovative U.S. immigrant export-
ers.38 A more appropriate form of financing is private
equity from business angel investors and venture capital
firms.39 This in turn implies that innovative U.S. immi-
grant exporters are unlikely to significantly benefit from
the bank-based EGP.
In this snapshot, recent immigrant business owners are more inclined to sell to non-U.S. markets than their non-immigrant counterparts.
In contrast, non-U.S. immigrant exporters typically
operate in the wholesale/retail trade sector, and are
therefore likely to hold a relatively large share of
their assets in the form of tangible assets that may be
pledged as collateral in support of their loan applica-
tions. Furthermore, there is less uncertainty about the
future prospects of the wholesale/retail trade sector rela-
tive to the knowledge-based sector. For these reasons,
37 The borrowing limit (maximum authorized loan) that banks set for companies is traditionally tied to their operating cash flow as measured by Earnings Before Interest, Taxes, Depreciation and Amortization (EBITDA). Thus, knowledge-intensive ventures with little, if any, earnings from operations effectively have a borrowing limit of zero.
38 Even if Canadian banks were willing to finance innovative firms in the knowledge-based industry, they generally lack the in-house skill and expertise required to carry out due diligence at the level of venture capital firms. Ultimately, Canadian banks are precluded from financing excessively risky investments under banking regu-lations that are designed to safeguard the banking system.
39 Citizenship and Immigration Canada, Start-Up Visa.
non-U.S. immigrant exporters are more likely to receive
bank loans under the EGP than innovative U.S. immi-
grant exporters.
CONCLUSIONS AND IMPLICATIONS
In this study, we examined whether recent immi-
grant business owners may significantly contribute
to Canada’s export agenda. A key goal stated by the
Canadian government is to increase Canada’s exports
to fast-growth, non-U.S. markets. If recent immigrants
have an advantage over non-immigrants in terms of
foreign language skills, cultural knowledge, and access
to networks in their non-U.S. countries of origin, then
the former are better positioned to sell to non-U.S. mar-
kets. We have presented systematic evidence suggesting
that recent immigrant business owners are in fact more
inclined to sell to non-U.S. markets than their non-immi-
grant counterparts. More generally, our study indicates
that non-U.S. immigrant exporters are:
� among the fastest growing Canadian SMEs. For
the period 2007–11, the profits of non-U.S.
immigrant exporters grew at an average annual
rate of 21 per cent compared with 2 per cent for
their non-immigrant counterparts;
� among the least profitable Canadian SMEs, despite
their superior growth performance;
� more dependent on export activity for revenue
generation relative to U.S. immigrant exporters
and non-immigrant exporters in general;
� low-value exporters relative to U.S. immigrant
exporters and non-immigrant exporters in general;
� younger and smaller than U.S. immigrant exporters
and non-immigrant exporters in general;
� less connected to business networks in Canada
compared with U.S. immigrant exporters and
non-immigrant businesses in general;
� treated more favourably by Canadian financial
institutions relative to U.S. immigrant exporters;
� predominantly wholesale and retail traders as
opposed to U.S. immigrant exporters which are
predominantly innovative businesses in the know-
ledge-based and manufacturing industries;
For the exclusive use of Horatio Morgan, [email protected], Ryerson University.
The Conference Board of Canada | 21
Find this briefing and other Conference Board research at www.e-library.ca
� urban-based operations like U.S. immigrant
exporters;
� predominantly based in Ontario and Quebec;
� operated by a relatively large share of female owners
compared with either U.S. immigrant exporters or
non-immigrant businesses in general.
IMMIGRANT OWNERSHIP MAY HELP LESS OPERATIONALLY EFFICIENT SMES TO EXPORT TO NON-U.S. MARKETS IN THE SHORT TERM The finding that small, recently established, and less
operationally efficient immigrant businesses dispropor-
tionately export to non-U.S. markets is a puzzling one.
This finding is fundamentally at odds with prior research
that points to operational efficiency or high productivity
as a precondition for exporting to difficult foreign mar-
kets. To the extent that exporting to non-U.S. markets is
more difficult and costly than exporting to the U.S., this
suggests that immigrant ownership may actually confer
advantages (i.e., social ties abroad, foreign language
skills, cultural knowledge) that partially compensate
for the relatively low operational efficiency of non-U.S.
immigrant exporters in wholesale/retail trade. However,
owner-specific advantages along this line may not
adequately compensate for low productivity over the
long term. As a result, the participation of less oper-
ationally efficient non-U.S. immigrant exporters in
non-U.S. markets may be short-lived.
A FEW ESTABLISHED MEDIUM TO LARGE INNOVATIVE NON-U.S. IMMIGRANT EXPORTERS MAY ADVANCE CANADA’S EXPORT AGENDA We found that recent immigrants account for 3 per cent
(almost 30,000) of Canadian SMEs. Some may suggest
that recent immigrants may play a more substantial role
in export activity if they have a higher participation rate
in business start-ups in Canada. However, the findings
in this study suggest that it is not the proliferation of
young and small, immigrant-owned export businesses
that will substantially advance Canada’s export agenda
over the long term; rather it is the existence of a few
medium to large innovative non-U.S. immigrant export-
ing businesses.40
40 Fernandes and Mattoo, Leave Export Promotion to Goldilocks ; Freund and Pierola, Export Superstars ; Sui and Goldfarb, Not for Beginners.
Financing Challenges Faced by Innovative Non-U.S. Immigrant ExportersIt is noteworthy that non-U.S. immigrant exporters
are generally more likely to receive bank loans than
U.S. immigrant exporters. However, we established
that the former are predominantly wholesale/retail
traders, while the latter are predominantly innovative
businesses in the knowledge-based sector. It perhaps
makes little, if any, difference to Canadian banks
whether the most innovative immigrant exporters sell
to the U.S. or non-U.S. markets. Canadian banks will
generally avoid innovative businesses in the knowledge-
based sector given the high degree of uncertainty that
surrounds their future prospects, and the unavailability
of marketable tangible assets that may be pledged as
collateral. Thus, innovative immigrant exporters are
expected to have a relatively high loan rejection rate as
a group. This in turn implies they are unlikely to sig-
nificantly benefit from the current bank-based Export
Guarantee Program. Instead, they are more likely to
benefit from access to private equity from business
angel investors and venture capital firms.
The financing of innovative immigrant exporters to non-U.S. markets warrants special attention when formulating export promotion policies in Canada.
CONTRIBUTION OF RECENT IMMIGRANT BUSINESSES TO CANADA’S EXPORT AGENDA We generally acknowledge that recent immigrant
businesses have been contributing to Canada’s overall
export agenda based on their participation in both the
U.S. and non-U.S. markets. In particular, we recognize
that they have the potential to help Canada expand its
horizon beyond the U.S. market because they are gen-
erally more likely to export than non-immigrant busi-
nesses and, when they do, they are more likely to sell
to non-U.S. markets. However, the magnitude of their
contribution to Canada’s export agenda has been limited
by a number of factors.
First, although recently established immigrant
exporters are among the fastest growing companies
in Canada, they are also among the least operationally
efficient companies. Second, their business model is
© The Conference Board of Canada. All rights reserved. Please contact cboc.ca/ip with questions or concerns about the use of this material.

22 | Selling Beyond the U.S. —June 2014
Find this briefing and other Conference Board research at www.e-library.ca
not generally founded on an innovation-based strategy
that supports competition based on product novelty
as opposed to product price. As a result, they may be
vulnerable to price competition in the non-U.S. markets
over the long term. However, we are quick to point out
that these shortcomings primarily apply to non-U.S.
immigrant exporters that belong to the wholesale/retail
trade sector. In contrast, medium to large non-U.S.
immigrant exporters in the knowledge-based sector
appear to be more promising, although their innovation-
based strategy predisposes them to formidable financing
challenges in the Canadian private debt and equity
markets. For this reason, the financing of innovative
non-U.S. immigrant exporters warrants special attention
when formulating export promotion policies in Canada.
However, a more comprehensive approach also calls for
attention to knowledge-intensive immigrant exporters
that sell only to the U.S. market.
> Tell us how we’re doing—rate this publication.
www.conferenceboard.ca/e-Library/abstract.aspx?did=6250
For the exclusive use of Horatio Morgan, [email protected], Ryerson University.

Find this briefing and other Conference Board research at www.e-library.ca
METHODOLOGY
A multinomial logit model is used to evaluate the
export market decision of business owner i for a set
of owner-firm characteristics and macroeconomic
conditions. The model has the following structure:
ln[Prob(Marketi = j) ÷ Prob(Marketi = 0)] = 'Xi
where the categorical dependent variable is the log odds
of exporting to Marketi relative to a given reference
market (i.e., Marketi = 0). We consider two reference-
market cases. In the first case, we define the reference
market as the domestic market or “not exporting,” and
the alternative market choices as the U.S. and non-U.S.
markets. In the second case, the reference market is the
U.S., and the alternative choice is non-U.S. markets.
Xi is a vector of owner and firm characteristics, and
macroeconomic conditions that impact the firm’s export
market decisions. Finally, is a vector of coefficients,
or log odds ratios, to be estimated. Therefore, the
odds ratios are obtained by taking the antilogarithm
of reported estimates with respect to base e.
The variables included in the multinomial regression
model are summarized as follows.
DEPENDENT VARIABLE: CATEGORICAL DEPENDENT VARIABLE (MARKET CHOICES)
� U.S.—A firm’s export market choice is defined
as the “U.S. market” if it exports only to the
United States.
� Non-U.S. market—A firm’s export market choice is
defined as “non-U.S. market” if it exports to at least
one non-U.S. country or region (i.e., Latin America,
Europe, or Asia), and/or exports to both the U.S.
and non-U.S. countries.
� Domestic market—A non-exporter’s market choice
is characterized as “domestic market.”
INDEPENDENT/CONTROL VARIABLESOwner characteristics:
� Immigrant—A binary variable with value 1 if the
business owner is a recent immigrant (i.e., living
in Canada for up to five years), and 0 otherwise.
� Visible minority—A binary variable with value for
1 if the business owner is non-white in colour/race
without regard for the place of birth, and 0 other-
wise. The definition of a visible minority excludes
individuals of Aboriginal origin.
Firm characteristics: � Company age—Age of the company at the time of
the 2007 survey.
� Company size—Measured in terms of the value of assets.
� R&D intensity—R&D spending as a percentage of
total expenditure.
Export Market Decision Regression Analysis
Appendix A
© The Conference Board of Canada. All rights reserved. Please contact cboc.ca/ip with questions or concerns about the use of this material.
24 | Selling Beyond the U.S. —June 2014
Find this briefing and other Conference Board research at www.e-library.ca
� Access to inter-firm network—A SME belongs to an
inter-firm network if it is owned by someone who also
owns and/or operates at least another business; that is,
the owner is a multiple-business owner or a portfolio
entrepreneur. Thus, access to an inter-firm network is
defined as a binary variable with value 1 if the SME
owner is a portfolio entrepreneur, and 0 otherwise.
Macroeconomic conditions: � Sector/industry category—Goods producing sectors
(agriculture/primary industries, manufacturing);
service sectors (knowledge-intensive industries,
professional services; wholesale/retail trade; accom-
modation and food services).
� Provinces/provincial region and the territories—Atlantic
provinces (New Brunswick, Prince Edward Island,
Nova Scotia, Newfoundland and Labrador); British
Columbia; Ontario; Prairie provinces (Alberta,
Saskatchewan, and Manitoba); Quebec, and the
Territories (Northwest Territories, Nunavut, Yukon).
� Urban—A binary variable with value 1 if the busi-
ness is located in an urban centre, and 0 otherwise.
The variable denoting immigrant ownership is the
principle independent variable; therefore, all other
variables essentially constitute control variables. We did
not include female ownership or business experience in
the regression analysis because this information is avail-
able only for less than one-third of the observations in
our sample.
DATA
To empirically evaluate the export market decisions
of immigrant- and non-immigrant-owned SMEs, we
draw on the following data sources: Statistics Canada’s
Survey on Financing of Small and Medium Enterprises,
T2 Corporation Income Tax Return, and the General
Index of Financial Information (GIFI). These confi-
dential microdata files provide both financial and
non-financial data on incorporated Canadian owners
and firms. Based on the data available for the year
2007, we have a sample of 15,794 Canadian SMEs
(immigrant-owned SMEs, 442; non-immigrant-owned
SMEs, 15,352). Statistics Canada randomly selected
1 per cent of the estimated population of Canadian
SMEs in 2007 (1.6 million) to be part of this survey.
RESULTS
TABLE 1 Export Market Decisions: Estimates (Log Odds Ratios) From the Multinomial Logit ModelDependent variable Market Choices is a categorical
variable that has three outcomes:
� U.S.—A firm’s export market choice is defined as
the “U.S. market” if it exports only to the United
States.
� Non-U.S. market—A firm’s export market choice is
defined as “non-U.S. market” if it exports to at least
one non-U.S. country or region (i.e., Latin America,
Europe, Asia), and/or exports to both the U.S. and
non-U.S. countries.
� Domestic market—A non-exporter’s market choice is
characterized as “domestic market.”
For the exclusive use of Horatio Morgan, [email protected], Ryerson University.

The Conference Board of Canada | 25
Find this briefing and other Conference Board research at www.e-library.ca
Table 1Export Market Decisions: Estimates (Log Odds Ratios) From the Multinomial Logit Model
U.S. vs. Domestic Non-U.S. vs. Domestic Non-U.S. vs. US
Immigrant-owned –0.165 (0.363) 0.954*** (0.340) 1.119** (0.445)
Visible minority –0.289 (0.257) –0.123 (0.200) 0.167 (0.309)
Access to inter-firm networks 0.437** (0.191) 0.052 (0.221) –0.385 (0.270)
Urban 0.042 (0.194) 0.399* (0.207) 0.358 (0.268)
R&D intensity 0.037*** (0.010) 0.048*** (0.012) 0.011 (0.010)
Company size (assets) 0.015** (0.007) 0.020** (0.010) 0.005 (0.010)
Company age 0.007 (0.004) 0.004 (0.004) –0.003 (0.005)
Industries
Accommodation/food –2.992*** (0.330) –3.489*** (0.361) –0.497 (0.479)
Agriculture/primary –1.307*** (0.238) –1.337*** (0.273) –0.029 (0.344)
Knowledge-based –0.979*** (0.164) –0.601*** (0.153) 0.378* (0.207)
Professional services –1.322*** (0.181) –1.038*** (0.177) 0.284 (0.238)
Whole/retail trade –1.059*** (0.186) –1.022*** (0.185) 0.037 (0.244)
Other services –2.138*** (0.229) –2.042*** (0.222) 0.096 (0.307)
Provinces/Territories
Atlantic provinces –0.465** (0.222) –0.220 (0.200) 0.245 (0.282)
British Columbia –0.139 (0.204) –0.082 (0.200) 0.056 (0.267)
Prairie provinces –0.866*** (0.212) –0.528** (0.214) 0.338 (0.284)
Quebec –0.465** (0.189) –0.014 (0.182) 0.451* (0.245)
Territories –0.523* (0.314) –0.653* (0.363) –0.130 (0.458)
Constant –1.267*** (0.213) –1.831*** (0.241) –0.564 (0.302)
No. 11,111 Wald Chi–squared 428.776
Log pseudo-likelihood –353,664 Pseudo R–squared 0.079
Note: standard errors are in parentheses. The reported estimates in this table are log odds ratios. To properly interpret these estimates, one has to first convert log odds ratios into odds ratios. This may be done with a standard exponent calculator, where the base is e (approximately 2.718) and the exponent or power is the reported estimate in question. To see how this works, consider the estimate of 0.954 that is reported for the effect of immigrant-ownership on the likelihood that Canadian SMEs will sell to non-U.S. markets as opposed to the domestic market (first entry in the second column of the table). Using an exponent calculator, one may confirm that a log odds ratio of 0.954 is equal to an odds ratio of 2.60. Since an odds ratio of 1 implies equal chances, the additional gain in the odds ratio is 1.60 when the firm is immigrant-owned as opposed to non-immigrant owned. Thus, we conclude that immigrant business owners are 1.6 times more likely than non-immigrant business owners to select non-U.S. markets over the Canadian market.*p < 0.1, **p < 0.05, ***p < 0.01Sources: The Conference Board of Canada.
© The Conference Board of Canada. All rights reserved. Please contact cboc.ca/ip with questions or concerns about the use of this material.

Find this briefing and other Conference Board research at www.e-library.ca
Appendix B
Arnold, J., and K. Hussinger. “Export Behavior and
Firm Productivity in German Manufacturing: A Firm-
Level Analysis.” Review of World Economics 141, no. 2
(2005): 219–43.
B.C. Stats. Annual BC Origin Exports.
www.britishcolumbia.ca/Export/Documents/Exports-
(Annual-Data).aspx (accessed April 18, 2014).
Bernard, A.B., and J. B. Jensen. “Exceptional Exporter
Performance: Cause, Effect, or Both?” Journal of
International Economics 47, no. 1 (1999): 1–25.
—. “Exporters, Jobs, and Wages in U.S. Manufacturing:
1976–1987.” Brookings Papers on Economic Activity,
Microeconomics 1995 (1995): 67–119.
—. “Why Some Firms Export.” Review of Economics
and Statistics 86, no. 2 (2004): 561–69.
Birley, S., and P. Westhead. “A Comparison of New
Businesses Established by ‘Novice’ and ‘Habitual’
Founders in Great Britain.” International Small
Business Journal 12, no. 1 (2003): 38–60.
Citizenship and Immigration Canada. 2012:
Canada’s Record-Breaking Year for Immigration.
www.cicnews.com/2013/03/2012-canadas-
recordbreaking-year-immigration-032346.html
(accessed February 20, 2014).
Citizenship and Immigration Canada. Start-Up Visa.
www.cic.gc.ca/english/immigrate/business/start-up/
index.asp (accessed April 16, 2014).
Clerides, S.K., S. Lach, and J.R. Tybout. “Is Learning
by Exporting Important? Micro-Dynamic Evidence
From Columbia, Mexico and Morocco.” Quarterly
Journal of Economics 113, no. 3 (1998): 903–47.
Davidsson, P., P. Steffens, and J. Fitzsimmons,
“Growing Profitable or Growing From Profits:
Putting the Horse in Front of the Cart?” Journal
of Business Venturing 24 (2009): 388–406
Downie, M. How Immigration Expands Canadian
Markets. Ottawa: The Conference Board of Canada,
October 2010.
Export Development Canada. Export Guarantee
Program. www.edc.ca/EN/Our-Solutions/Financing/
Pages/export-guarantee-program.aspx (accessed
March 2, 2014).
Fernandes, A., and A. Mattoo. Leave Export
Promotion to Goldilocks. February 25, 2014.
http://blogs.worldbank.org/developmenttalk/
leave-export-promotion-goldilocks (accessed
February 25, 2014).
Bibliography
For the exclusive use of Horatio Morgan, [email protected], Ryerson University.

The Conference Board of Canada | 27
Find this briefing and other Conference Board research at www.e-library.ca
Foreign Affairs, Trade and Development Canada.
Global Markets Action Plan. Cat. no. FR5-84/2013.
Ottawa: Foreign Affairs, Trade and Development
Canada, 2013.
Freund, C., and M.D. Pierola, M.D. Export Superstars.
Policy Research Working Paper # 6222. Washington,
DC: World Bank, 2012.
Girma, S., and Z. Yu. “The Link Between Immigration
and Trade: Evidence From the United Kingdom.”
Weltwirtschaftliches Archiv Bd 138, H.1 (2002):
115–30.
Gould, D.M. “Immigrant Links to the Home Country:
Empirical Implications for U.S. Bilateral Trade Flows.”
Review of Economics and Statistics 76, 2 (1994):
302–16.
Harrison, R.T., C.M. Mason, and P. Girling. “Financial
Bootstrapping and Venture Development in the
Software Industry.” Entrepreneurship and Regional
Development 16 (2004): 307–33.
Head, K., and J. Ries. “Immigration and Trade
Creation: Econometric Evidence From Canada.”
Canadian Journal of Economics 31, 1 (1998): 42–47.
—. “Overseas Investment and Firm Exports.” Review
of International Economics 9, 1 (2001): 108–122.
Head, K., and T. Mayer. What Separates Us? Sources
of Resistance to Globalization. Centre d’étude prospect-
ives et d’inormations internationales Working Paper
No 2013 – 26, September 2013.
Industry Canada. Canadian Small Business Exporters.
Cat. no. lu186-1/2011-1E-PDF. Ottawa: Industry
Canada, June 2011.
Kolvereid, L., and E. Bullvåg. “Novices Versus
Experienced Founders: An Exploratory Investigation.”
In S. Birley, I.C. MacMillan, and S. Subramony (Eds.),
Entrepreneurship Research: Global Perspectives
(pp. 275–285). Amsterdam: Elsevier Science, 1993.
Malmström, M. “Typologies of Bootstrap Financing
Behavior in Small Ventures.” Venture Capital 16, 1
(2014): 27–50.
Mason, C., and R.T. Harrison. “An Overview of
Informal Venture Capital Research.” Venture Capital 1,
no. 2 (1999): 95–100.
Neville, F., B. Orser, A. Riding, and O. Jung. “Do
Young Firms Owned by Recent Immigrants Outperform
Other Young Firms?” Journal of Business Venturing 29
(2014): 55–71.
Rosa, P. “Entrepreneurial Processes of Business Cluster
Formation and Growth by ‘Habitual’ Entrepreneurs.”
Entrepreneurship Theory & Practice 22, 4 (1998):
43–61.
Statistics Canada, Immigration and Ethnocultural
Diversity in Canada: National Household Survey, 2011.
Catalogue no. 99-010-X2011001. Ottawa: Statistics
Canada, 2011.
—. Immigration to Canada: A Portrait of the Foreign-
Born Population, 2006 Census. Catalogue no. 97-557-
XIE. Ottawa: Statistics Canada, 2006.
—. “Retail and Wholesale Trade.” Canada Year Book
2012, Cat. no. 11-402-X. Ottawa: Statistics Canada,
2012.
—. Survey of Financing of Small and Medium
Enterprises. Ottawa: Statistics Canada, 2007.
Sui, S., and D. Goldfarb. Not for Beginners:
Should SMEs Go to Fast-Growth Markets. Ottawa:
Global Commerce Centre, The Conference Board of
Canada, 2014.
Sydor, A. The Internationalization of Canadian
SMEs. Ottawa: Foreign Affairs and International
Trade Canada, 2013.
© The Conference Board of Canada. All rights reserved. Please contact cboc.ca/ip with questions or concerns about the use of this material.
28 | Selling Beyond the U.S. —June 2014
Find this briefing and other Conference Board research at www.e-library.ca
Therrien, P., and P. Mohnen, “How Innovative
Are Canadian Firms Compared to Some European
Firms? A Comparative Look at Innovation Surveys.”
Technovation 23 (2003): 359–69.
Thorne, J.R. “Alternative Financing Strategies for
Entrepreneurial Ventures.” Entrepreneurship Theory and
Practice, 13 (1989): 7–9.
Wagner, J. “The Causal Effects of Exports on Firm
Size and Labor Productivity: First Evidence From a
Matching Approach.” Economics Letters 77, 2 (2002):
287–92.
Wagner, D., K. Head, and J. Ries. “Immigration and
the Trade of Provinces.” Scottish Journal of Political
Economy 49, 5 (2002): 507–25.
Wolfe, D.A. “Knowledge, Learning and Social
Capital in Ontario’s ICT Clusters.” Annual Meeting of
Canadian Political Science Association. Held at the
University of Toronto, Toronto, May 29–21, 2002.
For the exclusive use of Horatio Morgan, [email protected], Ryerson University.

The Conference Board of Canada | 29
Find this briefing and other Conference Board research at www.e-library.ca
Acknowledgements
The authors would like to thank members of the Conference Board’s Global Commerce Centre, Danielle Goldfarb, Keith Head, Michelle Parkouda, Pedro Antunes, André Downs, Todd Evans, Richard Archambault, and Andrea Pierce for comments on this analysis at an earlier stage. We also thank Industry Canada and the Canadian Centre for Data Development and Economic Research of Statistics Canada for their support in working with the firm-level database.
ABOUT THE GLOBAL COMMERCE CENTREThe Global Commerce Centre (www.conferenceboard.ca/gcc) helps business and government leaders respond effectively to the dramatic changes in the global economy. The Centre provides evidence-based tools and strategies to help companies succeed in global markets, and brings together public and private sector leaders to discuss effective solutions to global commerce challenges.
Champion MembersExport Development Canada Foreign Affairs, Trade and Development CanadaHalifax Port Authority
Lead Members British Columbia Ministry of International TradeBusiness Development BankCanada Economic Development for Quebec RegionsIndustry CanadaMinistère des Relations Internationales, de la Francophonie
et du Commerce ExtérieurOntario Ministry of Economic Development, Trade, and EmploymentScotiabankTransport Canada
Partner Members Canada Border Services AgencyCanadian Commercial CorporationCanadian Council of Chief ExecutivesColgate-Palmolive Canada Inc.Nova Scotia Ministry of Economic and Rural Development
and TourismSaint Mary’s UniversityWestern Economic Diversification Canada
Note: These organizations do not necessarily endorse the research conclusions of this briefing.
© The Conference Board of Canada. All rights reserved. Please contact cboc.ca/ip with questions or concerns about the use of this material.
To cite this briefing: Sui Sui, and Horatio M. Morgan. Selling Beyond the U.S.: Do Recent Immigrants Advance Canada’s Export Agenda? Ottawa: The Conference Board of Canada, 2014.
© 2014 The Conference Board of Canada (incorporated as AERIC Inc.). Published in Canada. All rights reserved. Agreement No. 40063028.
®The Conference Board of Canada and the torch logo are registered trademarks of The Conference Board, Inc.
For more information, please contact us at the numbers listed above or e-mail [email protected]. This publication is available on the Internet at www.e-library.ca.
Forecasts and research often involve numerous assumptions and data sources, and are subject to inherent risks and uncertainties. This information is not intended as specific investment, accounting, legal, or tax advice.
Selling Beyond the U.S.: Do Recent Immigrants Advance Canada’s Export Agenda?
by Sui Sui and Horatio M. Morgan
255 Smyth Road, Ottawa ON
K1H 8M7 Canada
Tel. 613-526-3280
Fax 613-526-4857
Inquiries 1-866-711-2262
conferenceboard.ca
PUBLICATION 6250
E-COPY: Complimentary
Insights. Understanding. Impact.
For the exclusive use of Horatio Morgan, [email protected], Ryerson University.
Related Documents