SELF-STORAGE A Resilient Asset Class That Will Continue to Perform Well Through Downturn THE SELF-STORAGE ADVISORY GROUP CUSHMAN & WAKEFIELD MIDYEAR 2020 CLICK TO VIEW Cushman & Wakefield's COVID-19 Recovery Readiness Guide

Welcome message from author
This document is posted to help you gain knowledge. Please leave a comment to let me know what you think about it! Share it to your friends and learn new things together.
Transcript
SELF-STORAGEA Resilient Asset Class That Will Continue to Perform Well Through Downturn
THE SELF-STORAGE ADVISORY GROUPCUSHMAN & WAKEFIELDMIDYEAR 2020
CLICK TO VIEW
Cushman & Wakefield's COVID-19 Recovery
Readiness Guide
SERVICES
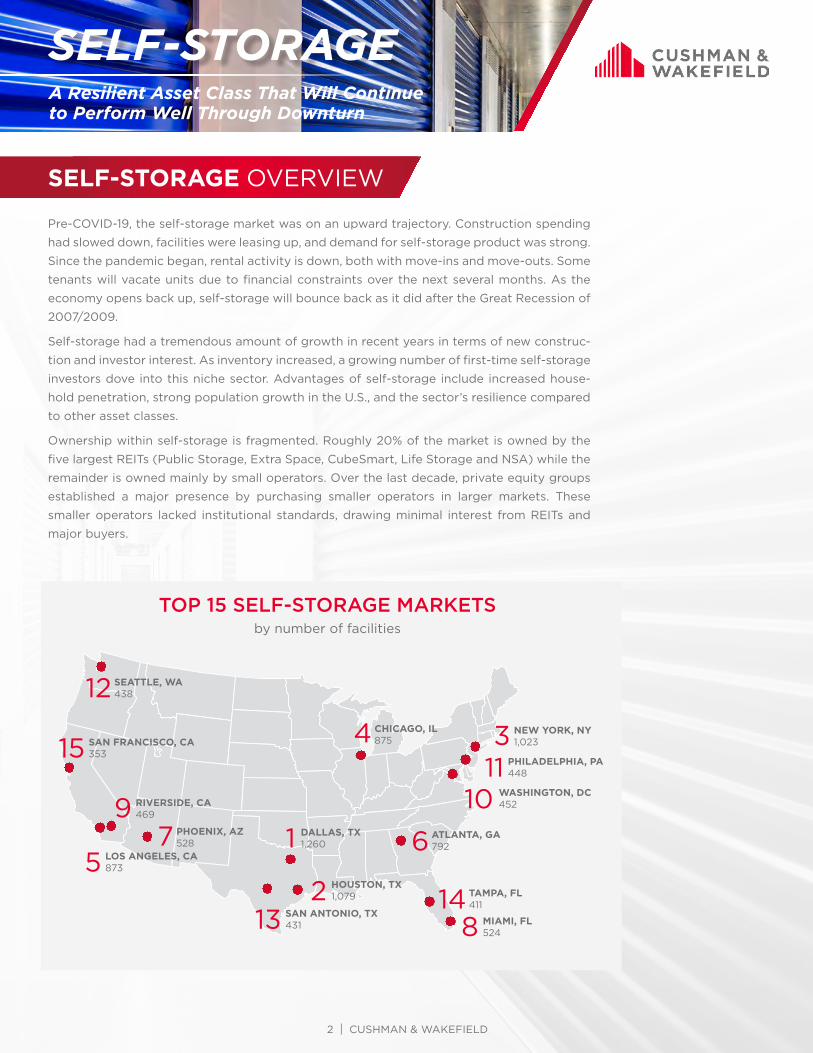
TOP 15 SELF-STORAGE MARKETS by number of facilities
DALLAS, TX 1,2601
SAN ANTONIO, TX 431
15
RIVERSIDE, CA 469
8
SAN FRANCISCO, CA 353
13
LOS ANGELES, CA 873
3
HOUSTON, TX 1,0792
PHILADELPHIA, PA 448
12CHICAGO, IL 875
5ATLANTA, GA 7926
TAMPA, FL 41114
NEW YORK, NY 1,0234
MIAMI, FL 524
7
WASHINGTON, DC 45210
PHOENIX, AZ 528
9
SEATTLE, WA 438
11
SELF-STORAGE OVERVIEW
Pre-COVID-19, the self-storage market was on an upward trajectory. Construction spending
had slowed down, facilities were leasing up, and demand for self-storage product was strong.
Since the pandemic began, rental activity is down, both with move-ins and move-outs. Some
tenants will vacate units due to financial constraints over the next several months. As the
economy opens back up, self-storage will bounce back as it did after the Great Recession of
2007/2009.
Self-storage had a tremendous amount of growth in recent years in terms of new construc-
tion and investor interest. As inventory increased, a growing number of first-time self-storage
investors dove into this niche sector. Advantages of self-storage include increased house-
hold penetration, strong population growth in the U.S., and the sector’s resilience compared
to other asset classes.
Ownership within self-storage is fragmented. Roughly 20% of the market is owned by the
five largest REITs (Public Storage, Extra Space, CubeSmart, Life Storage and NSA) while the
remainder is owned mainly by small operators. Over the last decade, private equity groups
established a major presence by purchasing smaller operators in larger markets. These
smaller operators lacked institutional standards, drawing minimal interest from REITs and
major buyers.
SELF-STORAGEA Resilient Asset Class That Will Continue to Perform Well Through Downturn
2 | CUSHMAN & WAKEFIELD
Source: Extra Space Storage Investor Presentation
0.35
0.4
0.45
0.5
0.55
0.6
0.65
2013 2014 2015 2016 2017 2018 2019
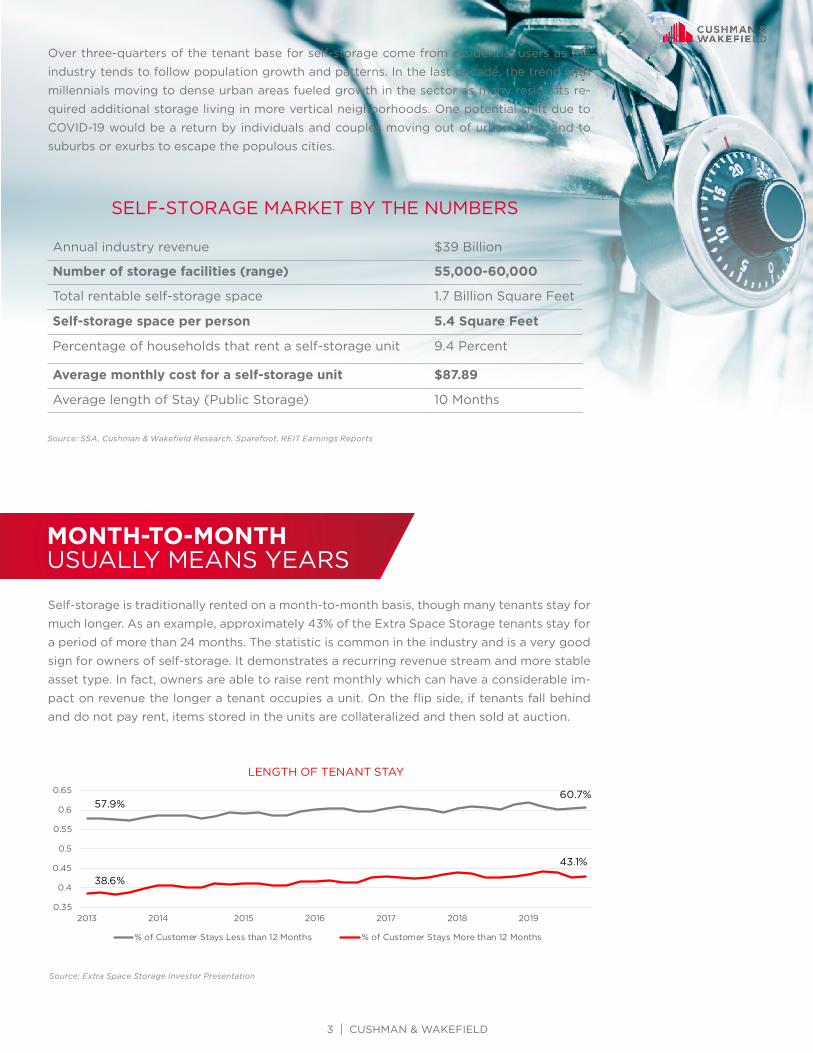
LENGTH OF TENANT STAY
% of Customer Stays Less than 12 Months % of Customer Stays More than 12 Months
57.9%60.7%
43.1%
38.6%
MONTH-TO-MONTH USUALLY MEANS YEARS
SELF-STORAGE MARKET BY THE NUMBERS
Annual industry revenue $39 Billion
Number of storage facilities (range) 55,000-60,000
Total rentable self-storage space 1.7 Billion Square Feet
Self-storage space per person 5.4 Square Feet
Percentage of households that rent a self-storage unit 9.4 Percent
Average monthly cost for a self-storage unit $87.89
Average length of Stay (Public Storage) 10 Months
Source: SSA, Cushman & Wakefield Research, Sparefoot, REIT Earnings Reports
Self-storage is traditionally rented on a month-to-month basis, though many tenants stay for
much longer. As an example, approximately 43% of the Extra Space Storage tenants stay for
a period of more than 24 months. The statistic is common in the industry and is a very good
sign for owners of self-storage. It demonstrates a recurring revenue stream and more stable
asset type. In fact, owners are able to raise rent monthly which can have a considerable im-
pact on revenue the longer a tenant occupies a unit. On the flip side, if tenants fall behind
and do not pay rent, items stored in the units are collateralized and then sold at auction.
Over three-quarters of the tenant base for self-storage come from residential users as the
industry tends to follow population growth and patterns. In the last decade, the trend with
millennials moving to dense urban areas fueled growth in the sector as many residents re-
quired additional storage living in more vertical neighborhoods. One potential shift due to
COVID-19 would be a return by individuals and couples moving out of urban cores and to
suburbs or exurbs to escape the populous cities.
3 | CUSHMAN & WAKEFIELD
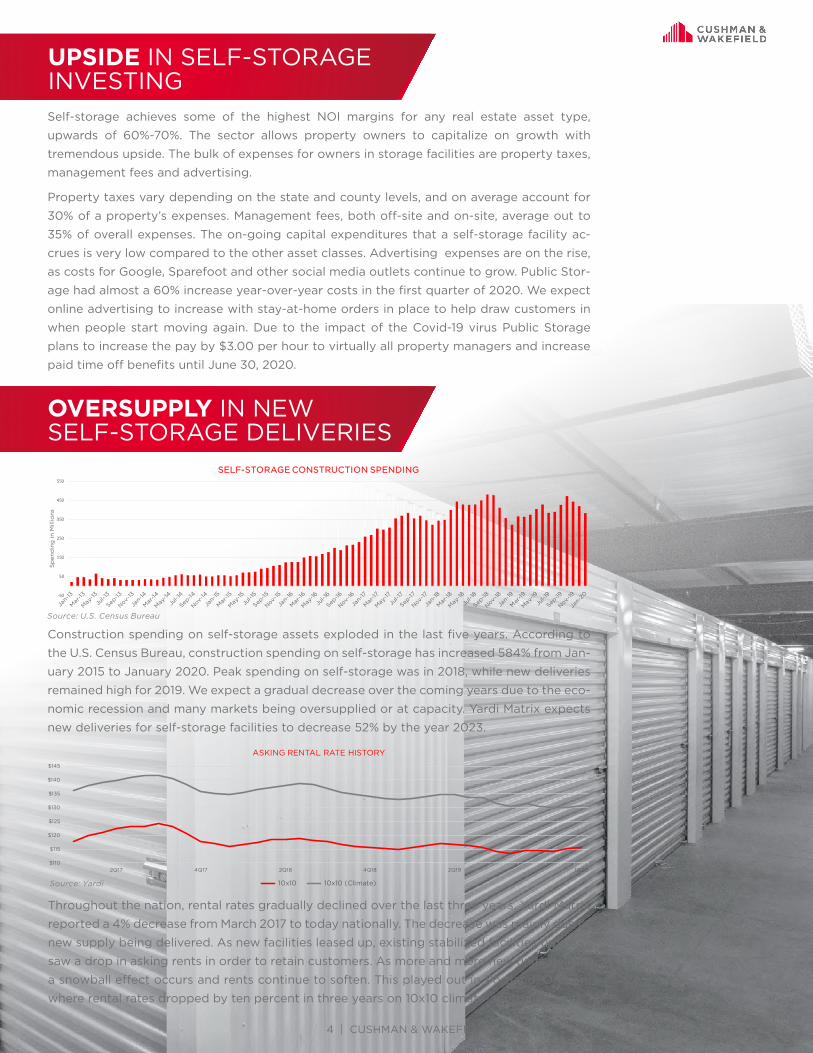
Construction spending on self-storage assets exploded in the last five years. According to
the U.S. Census Bureau, construction spending on self-storage has increased 584% from Jan-
uary 2015 to January 2020. Peak spending on self-storage was in 2018, while new deliveries
remained high for 2019. We expect a gradual decrease over the coming years due to the eco-
nomic recession and many markets being oversupplied or at capacity. Yardi Matrix expects
new deliveries for self-storage facilities to decrease 52% by the year 2023.
Self-storage achieves some of the highest NOI margins for any real estate asset type,
upwards of 60%-70%. The sector allows property owners to capitalize on growth with
tremendous upside. The bulk of expenses for owners in storage facilities are property taxes,
management fees and advertising.
Property taxes vary depending on the state and county levels, and on average account for
30% of a property’s expenses. Management fees, both off-site and on-site, average out to
35% of overall expenses. The on-going capital expenditures that a self-storage facility ac-
crues is very low compared to the other asset classes. Advertising expenses are on the rise,
as costs for Google, Sparefoot and other social media outlets continue to grow. Public Stor-
age had almost a 60% increase year-over-year costs in the first quarter of 2020. We expect
online advertising to increase with stay-at-home orders in place to help draw customers in
when people start moving again. Due to the impact of the Covid-19 virus Public Storage
plans to increase the pay by $3.00 per hour to virtually all property managers and increase
paid time off benefits until June 30, 2020.
UPSIDE IN SELF-STORAGE INVESTING
Source: Yardi
$110
$115
$120
$125
$130
$135
$140
$145
2Q17 4Q17 2Q18 4Q18 2Q19 1Q20
ASKING RENTAL RATE HISTORY
10x10 10x10 (Climate)
Source: U.S. Census Bureau
-50
50
150
250
350
450
550
Sp
end
ing
in M
illio
ns
SELF-STORAGE CONSTRUCTION SPENDING
OVERSUPPLY IN NEW SELF-STORAGE DELIVERIES
Throughout the nation, rental rates gradually declined over the last three years. Yardi Matrix
reported a 4% decrease from March 2017 to today nationally. The decrease was mainly due to
new supply being delivered. As new facilities leased up, existing stabilized facilities typically
saw a drop in asking rents in order to retain customers. As more and more new units deliver,
a snowball effect occurs and rents continue to soften. This played out in Portland, Oregon,
where rental rates dropped by ten percent in three years on 10x10 climate-controlled units.
4 | CUSHMAN & WAKEFIELD
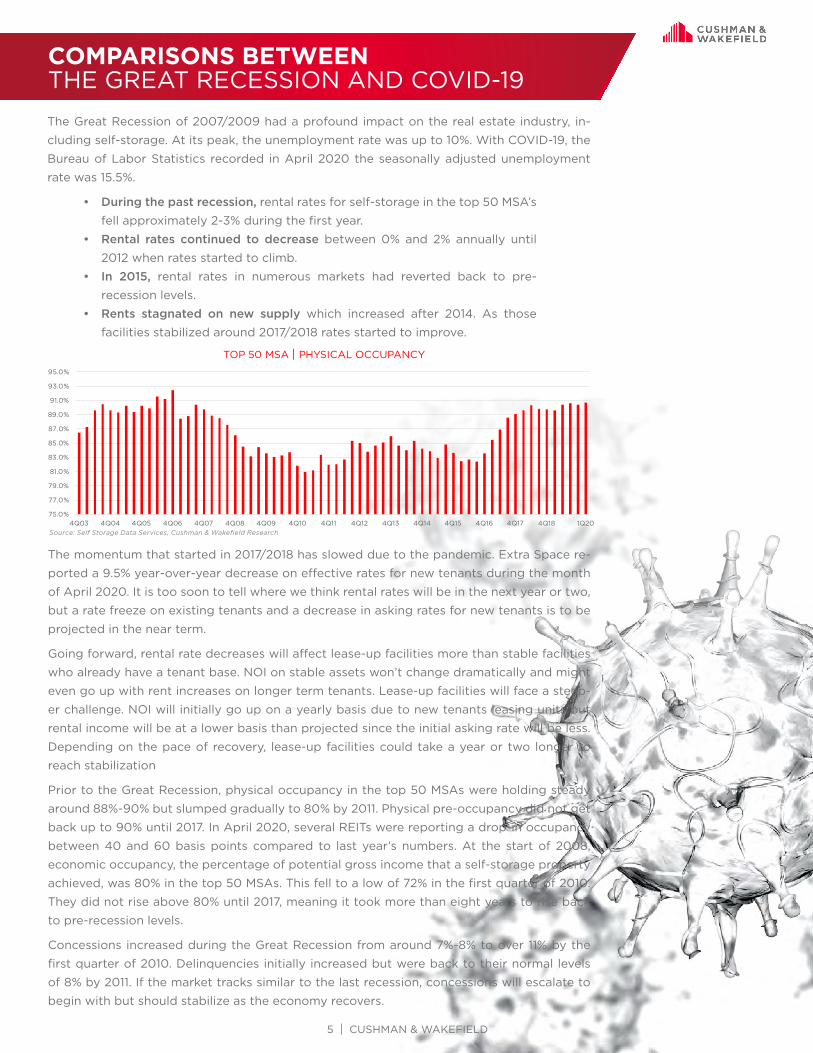
The Great Recession of 2007/2009 had a profound impact on the real estate industry, in-
cluding self-storage. At its peak, the unemployment rate was up to 10%. With COVID-19, the
Bureau of Labor Statistics recorded in April 2020 the seasonally adjusted unemployment
rate was 15.5%.
• During the past recession, rental rates for self-storage in the top 50 MSA’s
fell approximately 2-3% during the first year.
• Rental rates continued to decrease between 0% and 2% annually until
2012 when rates started to climb.
• In 2015, rental rates in numerous markets had reverted back to pre-
recession levels.
• Rents stagnated on new supply which increased after 2014. As those
facilities stabilized around 2017/2018 rates started to improve.
Source: Self Storage Data Services, Cushman & Wakefield Research
The momentum that started in 2017/2018 has slowed due to the pandemic. Extra Space re-
ported a 9.5% year-over-year decrease on effective rates for new tenants during the month
of April 2020. It is too soon to tell where we think rental rates will be in the next year or two,
but a rate freeze on existing tenants and a decrease in asking rates for new tenants is to be
projected in the near term.
Going forward, rental rate decreases will affect lease-up facilities more than stable facilities
who already have a tenant base. NOI on stable assets won’t change dramatically and might
even go up with rent increases on longer term tenants. Lease-up facilities will face a steep-
er challenge. NOI will initially go up on a yearly basis due to new tenants leasing units but
rental income will be at a lower basis than projected since the initial asking rate will be less.
Depending on the pace of recovery, lease-up facilities could take a year or two longer to
reach stabilization
Prior to the Great Recession, physical occupancy in the top 50 MSAs were holding steady
around 88%-90% but slumped gradually to 80% by 2011. Physical pre-occupancy did not get
back up to 90% until 2017. In April 2020, several REITs were reporting a drop-in occupancy
between 40 and 60 basis points compared to last year’s numbers. At the start of 2008,
economic occupancy, the percentage of potential gross income that a self-storage property
achieved, was 80% in the top 50 MSAs. This fell to a low of 72% in the first quarter of 2010.
They did not rise above 80% until 2017, meaning it took more than eight years to rise back
to pre-recession levels.
Concessions increased during the Great Recession from around 7%-8% to over 11% by the
first quarter of 2010. Delinquencies initially increased but were back to their normal levels
of 8% by 2011. If the market tracks similar to the last recession, concessions will escalate to
begin with but should stabilize as the economy recovers.
COMPARISONS BETWEEN THE GREAT RECESSION AND COVID-19
75.0%
77.0%
79.0%
81.0%
83.0%
85.0%
87.0%
89.0%
91.0%
93.0%
95.0%
4Q03 4Q04 4Q05 4Q06 4Q07 4Q08 4Q09 4Q10 4Q11 4Q12 4Q13 4Q14 4Q15 4Q16 4Q17 4Q18 1Q20
TOP 50 MSA | PHYSICAL OCCUPANCY
5 | CUSHMAN & WAKEFIELD
Jul-15 Aug-15 Sep-15 Oct-15 Nov-15 4Q15 2Q16 4Q16 2Q17 4Q17 2Q18 4Q18 2Q19 4Q19 1Q205.42% 5.45% 5.28% 5.23% 5.13% 5.17% 4.35% 4.15% 4.22% 4.23% 4.35% 4.60% 4.76% 4.68% 4.78% 4.98% 5.03% 5.23% 5.18% 5.31% 5.37% 5.52% 5.47% 5.75% 5.49% 5.44% 5.40% 5.21% 5.18% 4.89% 4.83% 4.51% 4.55% 4.36% 4.12% 3.95% 3.81% 3.64% 3.41% 3.42% 3.33% 3.11% 3.02% 2.87% 2.88% 2.82% 2.66% 2.84% 2.62% 2.54% 2.51% 2.47% 2.34% 2.34% 2.14% 2.04% 2.07%
https://info.trepp.com/trepptalk/cmbs-delinquency-rate-ticks-up-but-a-deluge-is-coming-march-2020
Source: TREPP, 2020.
0.00%
1.00%
2.00%
3.00%
4.00%
5.00%
6.00%
7.00%
2Q16 4Q16 2Q17 4Q17 2Q18 4Q18 2Q19 4Q19
PERCENTAGE OF CMBS MARKED AS 30+ DAYS DELINQUENT
Source: TREPP, 2020
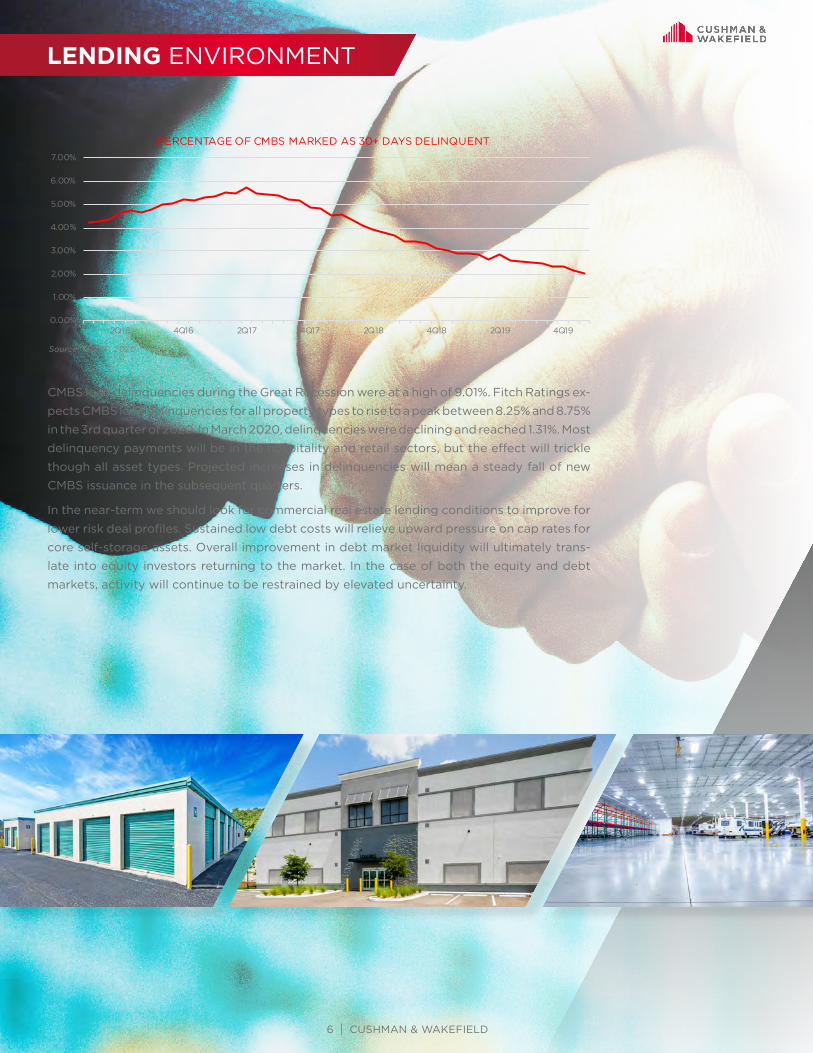
CMBS loan delinquencies during the Great Recession were at a high of 9.01%. Fitch Ratings ex-
pects CMBS loan delinquencies for all property types to rise to a peak between 8.25% and 8.75%
in the 3rd quarter of 2020. In March 2020, delinquencies were declining and reached 1.31%. Most
delinquency payments will be in the hospitality and retail sectors, but the effect will trickle
though all asset types. Projected increases in delinquencies will mean a steady fall of new
CMBS issuance in the subsequent quarters.
In the near-term we should look for commercial real estate lending conditions to improve for
lower risk deal profiles. Sustained low debt costs will relieve upward pressure on cap rates for
core self-storage assets. Overall improvement in debt market liquidity will ultimately trans-
late into equity investors returning to the market. In the case of both the equity and debt
markets, activity will continue to be restrained by elevated uncertainty.
LENDING ENVIRONMENT
6 | CUSHMAN & WAKEFIELD
FINAL WORDS
Until the second half of March and the start of the pandemic, self-storage operations were strong.
• Rate increases on existing tenants have mostly been put on hold by
REITs and asking rates for new tenants declined as well.
• Collections dropped slightly, but REITs have stated some of that drop
is intentional as they have been less aggressive in pursuing collections
on past due accounts for the time being. Collections could start picking
up again in May.
• Short-term NOI could take a hit and be flat to negative for the
remainder of 2020.
• Investment activity paused with most deals far down the pipeline still
set to finalize.
• Like most other deal activity, acquisitions for self- storage are expected
to be limited in the near term.
• Many REITS are watching closely for the potential to acquire assets or
are looking to pick up below market deals from their management
pipelines. Leveraged projects that are not meeting performance metrics
may be targets.
• Some well capitalized REITs (notably Public and EXR) have stated on
earnings calls that they are looking at opportunities as sites come to
market. Life Storage, another REIT, indicated a pause on acquisitions for
the time being.
Self-storage remains relatively resilient with minimal fundamental changes to underlying
drivers of demand in the long-term. The near-term shocks to NOI, including flattening or
declining rental rates for the remainder of the year will be felt. The increase in delinquency
rates in April were not as pronounced as the market feared with the true impact to surface in
May and June. COVID-19 related declines in traffic and leasing, as well as a rise in collections
will have an immediate impact. Well-established virtual marketing practices and e-payment
platforms will help mitigate some of the challenges. Cash flows in the next two years could
take a hit in several different areas, including reduced rent growth rates (in-place and mar-
ket), lower additional income streams, diminished stabilized occupancy levels or increased
credit loss.
We expect move in rental rates to drop for the remainder of 2020 and overall NOI to remain
flat or slightly down on stabilized same store revenue. Cap rates for self-storage properties
should remain relatively consistent in the near term. While there is disruption in the overall
economy, the need for self-storage space will continue and address changing needs by users.
7 | CUSHMAN & WAKEFIELD
©2020 Cushman & Wakefield NO WARRANTY OR REPRESENTATION, EXPRESS OR IMPLIED, IS MADE TO THE ACCURACY OR COMPLETENESS OF THE INFORMATION CONTAINED HEREIN, AND SAME IS SUBMITTED SUBJECT TO ERRORS, OMISSIONS, CHANGE OF PRICE, RENTAL OR OTHER CONDITIONS, WITHDRAWAL WITHOUT NOTICE, AND TO ANY SPECIAL LISTING CONDITIONS IMPOSED BY THE PROPERTY OWNER(S). AS APPLICABLE, WE MAKE NO REPRESENTATION AS TO THE CONDITION OF THE PROPERTY (OR PROPERTIES) IN QUESTION.
FOR MORE INFORMATION CONTACT:
MICHAEL A. MELEVice Chairman +1 813 462 [email protected]
LUKE ELLIOTTExecutive Managing Director+1 813 462 [email protected]
CHRIS OWENDirector, Florida Research+1 407 541 [email protected]
RYAN CLEMONSSenior Financial Analyst+1 813 462 [email protected]
STEVEN PAULFinancial Analyst+1 813 462 [email protected]
Cushman & WakefieldOne Tampa City Center, Suite 3300Tampa, Florida 33602cushmanwakefield.com
Related Documents