eScholarship provides open access, scholarly publishing services to the University of California and delivers a dynamic research platform to scholars worldwide. Center for Studies in Higher Education UC Berkeley Title: The Educational Benefits of Sustaining Cross-Racial Interaction Among Undergraduates Author: Chang, Mitchell J. , University of California, Los Angeles Denson, Nida , University of California, Los Angeles Sáenz, Victor , University of California, Los Angeles Misa, Kimberly , University of California, Los Angeles Publication Date: 02-01-2005 Series: Research and Occasional Papers Series Permalink: http://escholarship.org/uc/item/2d83s4q0 Keywords: Cross-Racial Interaction, Diversity, Affirmative Action, Policy, Higher Education, Access, Admissions, Student Development Abstract: This study examined whether or not students who either had higher levels of cross-racial interaction during college or had same-institution peers with higher average levels of this type of interaction tend to report significantly larger developmental gains than their counterparts. Unlike previous quantitative studies that tested cross-racial interaction using single-level linear models, this study more accurately models the structure of multilevel data by applying Hierarchical Linear Modeling (HLM). The general pattern of findings suggests that higher individual levels of cross- racial interaction have positive effects on students' openness to diversity, cognitive development, and self-confidence. The results also show that even though a student’s own level of cross-racial interaction is a more direct and powerful way to realize developmental gains, simply being in an environment where other students are interacting frequently also contributes to students’ self- reported development. Copyright Information: All rights reserved unless otherwise indicated. Contact the author or original publisher for any necessary permissions. eScholarship is not the copyright owner for deposited works. Learn more at http://www.escholarship.org/help_copyright.html#reuse

Welcome message from author
This document is posted to help you gain knowledge. Please leave a comment to let me know what you think about it! Share it to your friends and learn new things together.
Transcript
eScholarship provides open access, scholarly publishingservices to the University of California and delivers a dynamicresearch platform to scholars worldwide.
Center for Studies in Higher EducationUC Berkeley
Title:The Educational Benefits of Sustaining Cross-Racial Interaction Among Undergraduates
Author:Chang, Mitchell J., University of California, Los AngelesDenson, Nida, University of California, Los AngelesSáenz, Victor, University of California, Los AngelesMisa, Kimberly, University of California, Los Angeles
Publication Date:02-01-2005
Series:Research and Occasional Papers Series
Permalink:http://escholarship.org/uc/item/2d83s4q0
Keywords:Cross-Racial Interaction, Diversity, Affirmative Action, Policy, Higher Education, Access,Admissions, Student Development
Abstract:This study examined whether or not students who either had higher levels of cross-racialinteraction during college or had same-institution peers with higher average levels of this type ofinteraction tend to report significantly larger developmental gains than their counterparts. Unlikeprevious quantitative studies that tested cross-racial interaction using single-level linear models,this study more accurately models the structure of multilevel data by applying Hierarchical LinearModeling (HLM). The general pattern of findings suggests that higher individual levels of cross-racial interaction have positive effects on students' openness to diversity, cognitive development,and self-confidence. The results also show that even though a student’s own level of cross-racialinteraction is a more direct and powerful way to realize developmental gains, simply being in anenvironment where other students are interacting frequently also contributes to students’ self-reported development.
Copyright Information:All rights reserved unless otherwise indicated. Contact the author or original publisher for anynecessary permissions. eScholarship is not the copyright owner for deposited works. Learn moreat http://www.escholarship.org/help_copyright.html#reuse
Research & Occasional Paper Series: CSHE.2.05
UNIVERSITY OF CALIFORNIA, BERKELEY http://ishi.lib.berkeley.edu/cshe/
THE EDUCATIONAL BENEFITS OF SUSTAINING CROSS-RACIAL INTERACTION AMONG UNDERGRADUATES *
February 2005
Mitchell J. Chang
Associate Professor, Higher Education and Organizational Change Graduate School of Education & Information Studies
University of California, Los Angeles
Nida Denson University of California, Los Angeles
Victor Sáenz
University of California, Los Angeles
Kimberly Misa University of California, Los Angeles
Copyright 2005 Mitchell J. Chang, Nida Denson, Victor Sáenz, and Kimberly Misa, all rights reserved.
ABSTRACT This study examined whether or not students who either had higher levels of cross-racial interaction during college or had same-institution peers with higher average levels of this type of interaction tend to report significantly larger developmental gains than their counterparts. Unlike previous quantitative studies that tested cross-racial interaction using single-level linear models, this study more accurately models the structure of multilevel data by applying Hierarchical Linear Modeling (HLM). The general pattern of findings suggests that higher individual levels of cross-racial interaction have positive effects on students' openness to diversity, cognitive development, and self-confidence. The results also show that even though a student’s own level of cross-racial interaction is a more direct and powerful way to realize developmental gains, simply being in an environment where other students are interacting frequently also contributes to students’ self-reported development. * Forthcoming in The Journal of Higher Education.
Chang et al., EDUCATIONAL BENEFITS OF CROSS-RACIAL INTERACTION 2
In June of 2003, the U.S. Supreme Court upheld the University of Michigan Law School's practice of considering race in admissions by a margin of 5-4 (Grutter v. Bollinger), but struck down the formulaic approach for admitting freshmen by a margin of 6-3 (Gratz v. Bollinger). Even though the Court limited the use of race by rejecting mechanical scoring systems that assign bonus points to underrepresented students, they left the door open for colleges and universities to continue to consider race in admissions in order to enroll a “critical mass” of racially/ethnically diverse students. Among the Court itself, there was major disagreement over the value and effects of diversity in an educational setting. For example, Justice Sandra Day O’Connor, who authored the majority opinion in the Grutter, wrote that “student body diversity is a compelling state interest that can justify using race in university admissions,” whereas her counterpart Justice Antonin Scalia wrote in the dissenting opinion that he was not convinced that educational benefits flowed from diversity and listed this shortcoming as one of a long list of issues that could potentially bring about future lawsuits. Given the conflicting opinions, it is clear that the controversy regarding claims about the educational benefits of diversity is far from settled, and that there continues to be a pressing need to understand empirically how students actually benefit, if at all, from being in more racially/ethnically diverse environments. This study applies a multilevel approach to the examination of the student and institution-level effects of one key form of diversity, namely, frequency of cross-racial interaction. This study is guided by two key research questions: 1) How do college students who report high levels versus low levels of cross-racial interaction compare with regards to the educational outcomes of openness to diversity, cognitive development, and self-confidence? 2) How do students who attend institutions with high peer versus low peer average levels of cross-racial interaction compare on measures of openness to diversity, cognitive development, and self-confidence? Background Because of the recent national attention on the constitutionality of race-conscious admissions practices, a growing body of empirical research about diversity has emerged in the last ten years, which has focused mainly on racial/ethnic diversity with in the goal of enrolling a larger proportion of underrepresented students (African American, Latino/a, & Native American). This body of research has been reviewed recently in several publications (see for example: Hurtado, Dey, Gurin, & Gurin, 2003; Milem & Hakuta, 2000; Hurtado, Milem, Clayton-Pedersen, & Allen, 1998 & 1999; Smith, Gerbick, Figueroa, Watkins, Levitan, Moore, Merchant, Beliak, & Figueroa, 1997). Basically, these reviews show that diversity-related benefits are far-ranging, and have positive effects on individual students and the institutions in which they enroll, as well as on private enterprise, the economy, and the broader society. There is remarkable consistency among these reviews concerning both the empirical studies considered and the conclusions they have drawn. One important conclusion that has emerged from these studies is that the vitality, stimulation, and educational potential of an institution are directly related to the composition of its student body, faculty, and staff. A number of studies have shown that campus communities that are more racially diverse tend to create more richly varied educational experiences that help students learn and also prepare them better for participation in a democratic society (Antonio, 2001b; Astin, 1993a; Bowen & Bok, 1998;
CSHE Research & Occasional Paper Series
Chang et al., EDUCATIONAL BENEFITS OF CROSS-RACIAL INTERACTION 3
Chang, 1999; Chang, Witt, Jones, & Hakuta, 2003; Gurin, Dey, Hurtado, & Gurin, 2002; Hurtado, 2001; Milem, 1994; Orfield & Kurlaender, 2001; Pascarella, Edison, Nora, Hagedorn, & Terenzini, 1996; Sax & Astin, 1997). One reason for this appears to be that race still shapes opportunities and experiences in U.S. society, which is also evident among students in higher education. For example, Cabrera and Nora (1994) found that students of color, compared to their White counterparts, hold more nuanced perceptions of discrimination, and Ancis, Sedlacek, and Mohr (2000) found that for one campus, African American students consistently reported experiencing more racial antipathy, less equitable treatment by faculty, staff, and teaching assistants, and greater pressure to conform to stereotypes than their peers. Not surprisingly, students of different racial groups often have differing opinions and viewpoints about a wide range of pressing contemporary issues. Although individuals of any given race hold the full range of opinions, as a group, average viewpoints differ on such issues as the death penalty, consumer protection, health care, drug testing, taxation, free speech, criminal rights, and the prevalence of discrimination (Chang, 2003). In short, due to the ongoing power of race to shape life experiences, racial and ethnic compositional diversity can create a rich and complex social and learning environment that can subsequently be applied as an educational tool to promote students’ learning and development. The problem, however, is that student’s improved understanding of and willingness to interact and exchange ideas with others who are racially different is not assured even when the student body is highly diverse. So far, the research literature suggests that the educational potential of "diversity" is not reducible simply to the mere presence of underrepresented students;rather, its value appears to depend on whether or not it leads to greater levels of engagement in diversity-related activities. One of those key engagement activities is the opportunity to interact in sustained and meaningful ways with someone of another racial or ethnic background. Numerous studies have shown that interaction with close friends of a different race or ethnicity is a powerful way in which students accrue the educational benefits of a racially diverse student body. Those benefits include enhanced self-confidence, motivation, intellectual and civic development, educational aspirations, cultural awareness, and commitment to racial equity (Antonio, 2001a & 2001b; Chang, 1999; Chang, Astin, & Kim, 2004; Gurin et al., 2002). These findings not only suggest that exposure to and interaction with diverse peers is educationally significant, but they also support a well established premise regarding student development, namely, that students’ interpersonal interactions with peers is one of the most powerful educational resources in higher education (Astin, 1993b; Kuh, 1995; Milem, 1994; Terenzini, Pascarella, & Blimling, 1996). Gordon Allport (1954) has offered perhaps the most widely recognized theory about the benefits and dynamics of cross-racial interaction or contact. Through a series of studies, he showed that interaction can lead to positive outcomes, but those benefits depend on the presence of appropriate conditions. Without certain conditions in place, contact may even heighten rather than reduce racial prejudice. According to Allport’s well-known "Intergroup Contact Theory," cross-racial interaction is more likely to lead to positive race relations when it occurs in a situation in which groups have equal status, pursue of common goals, cooperate between groups, and have the support of authorities, law, or custom. A sizeable body of research has since extended and clarified the conditions that are likely to improve the quality and results of cross-racial interaction (for a review, see Pettigrew, 1998). In short, the contact theory makes clear that if positive results
CSHE Research & Occasional Paper Series
Chang et al., EDUCATIONAL BENEFITS OF CROSS-RACIAL INTERACTION 4
from cross-racial interaction are desired, the environmental conditions that improve the quality of contact is just as important as having interpersonal contact. Although the benefits of cross-racial interaction have been examined broadly and systematically within the study of higher education, as cited earlier, the equally important conditions that support higher levels of interaction and presumably more positive contact have been understudied. One problem, faced by large-scale studies that utilize existing secondary data sources, is the difficulty of operationalizing the long list of conditions because the set of items available are usually too limited. In a recent study, however, Chang, Astin, and Kim (2004) found that some of the ideal conditions for improving cross-racial interaction include a more racially diverse student body and more opportunities for students to live and work on campus. Although the Intergroup Contact Theory was not actually tested in this study, the findings support the notion that conditions do matter in determining the frequency of contact in colleges and universities. Identifying the range of specific conditions, however, may not necessarily adequately capture a more fundamental issue that is linked to the core of an institution, which is much more difficult to specify. According to some scholars (Hurtado et al., 1999; Smith et al., 1997), the successful implementation of those ideal conditions for cultivating positive race relations is inextricably linked to establishing a “nonracist” culture/climate, which includes altering the legacy of exclusion, the organizational structure, and the psychological and behavioral climate of the campus. Even though there has been serious thinking about what a “nonracist” culture/climate might look like in higher education (also see, for example, Hale, 2004), there is no consensus regarding what exactly institutions must do to achieve this type of environment. Part of the reason for this lack of consensus is that each college or university faces a set of unique circumstances that cannot be easily addressed by ready-made “cookbook” strategies. Richardson and Skinner (1990), for example, concluded in their study of nine four-year institutions that the coordination of a wide variety of strategies is more critical than the implementation of a particular program or policy in institutions’ successful adaptation to diversity. Nevertheless, arguments pointing to the importance of culture/climate do suggest that a superficial account of specific conditions, programs, or policies fails to describe fully the complex dynamics and qualities of a college or university that sustain positive race relations among students. If there is indeed a unique dynamic or quality linked to a set of conditions associated with positive race relations, which is presumably just as important as having interpersonal contact, then it stands to reason that this type of environment should have a unique effect on student outcomes that extends beyond a student’s own level of cross-racial interaction. In other words, students should uniquely benefit not only from their own interactions with someone of a different race or ethnicity, but also from being enrolled in an institution that sustains positive race relations, since one’s own individual interactions are distinct from the institutional context in which contact occurs. Although it is possible to separate statistically the effects of individual experience and institutional context, it is very difficult to quantify a nonracist dynamic or atmosphere. One way to address this problem is to develop reasonable proxies to approximate that type of institutional context. Subsequently, this study seeks to inform two main research questions: (1) Do students who have higher levels of cross-racial interaction (CRI) tend to report higher levels of
CSHE Research & Occasional Paper Series
Chang et al., EDUCATIONAL BENEFITS OF CROSS-RACIAL INTERACTION 5
openness to diversity, cognitive development, and self-confidence than their peers who have lower levels of CRI? (2) Do students who attend institutions with higher average peer levels of CRI tend to report higher levels on those same outcomes than their peers who attend institutions with lower average peer levels of CRI? Because institutions with higher overall levels of CRI are more likely than those with lower levels to possess a complex set of institutional conditions and an institutionalclimate that sustains positive race relations, average peer level of CRI is used here to approximate the overall campus quality for enhancing cross-racial interaction. Whereas the first research question has been studied before using multivariate regression analyses and more dated data sources, the second question remains largely unexamined.
Method Data The primary source of data for our study comes from the Cooperative Institutional Research Program (CIRP) which is housed at the Higher Education Research Institute (HERI) at the University of California, Los Angeles. This study drew mainly from CIRP survey data collected at two different times. The first survey (Freshman Survey), conducted in 1994, was administered during orientation programs and in the first few weeks of classes to first-time full-time students. These data provide background information about students prior to them having any substantial experience with college. Students were surveyed about a wide variety of topics, including their personal and demographic background information, high school experiences, values, attitudes, self-concepts, and career aspirations. The students were administered a second survey in 1998 (Follow-up Survey) at the end of their fourth year, presumably when they were about to graduate. The follow-up sample was chosen from the original students who completed the 1994 Freshman Survey. The 1998 Follow-up Survey also asked students about a wide variety of topics, but unlike the Freshman Survey, it queried students about how various college experiences had changed or affected them. The sample used for this study was slightly different from the full longitudinal sample described above. First, we excluded those students who had missing data on race, gender, or 1994 residential status. We also excluded students who attended two-year institutions, historically Black colleges and universities, institutions with less than 15 respondents, institutions with missing data on number of full-time undergraduate enrollment or selectivity, and institutions that had more than five percent missing cases for our primary independent variable of interest (CRI). The final sample consisted of 19,667 students nested within 227 four-year institutions who were surveyed upon entering college in 1994 and followed-up in 1998. Of the 227 institutions, 36 (15.9%) were public institutions, and 191 (84.1%) were private institutions. Disaggregated by race, the sample included 17,467 (88.8%) Whites, 802 (4.1%) Asian Americans, 652 (3.3%) Latino/as, 446 (2.3%) African Americans, and 300 (1.5%) American Indians. Of these students, 7,289 (37.1%) were male, and 12,380 (62.9%) were female. Since the sample was somewhat biased at the student-level toward female white students and at the institution-level toward private institutions, we statistically controlled for these biases in our analyses.
CSHE Research & Occasional Paper Series
Chang et al., EDUCATIONAL BENEFITS OF CROSS-RACIAL INTERACTION 6
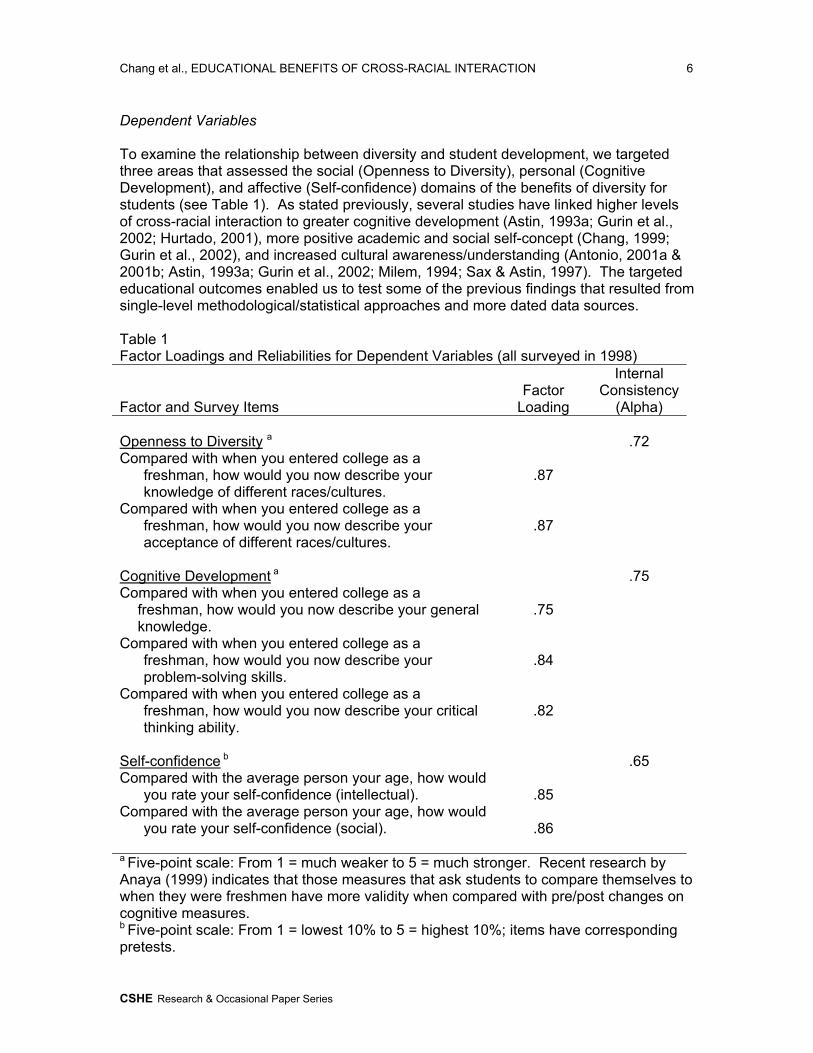
Dependent Variables To examine the relationship between diversity and student development, we targeted three areas that assessed the social (Openness to Diversity), personal (Cognitive Development), and affective (Self-confidence) domains of the benefits of diversity for students (see Table 1). As stated previously, several studies have linked higher levels of cross-racial interaction to greater cognitive development (Astin, 1993a; Gurin et al., 2002; Hurtado, 2001), more positive academic and social self-concept (Chang, 1999; Gurin et al., 2002), and increased cultural awareness/understanding (Antonio, 2001a & 2001b; Astin, 1993a; Gurin et al., 2002; Milem, 1994; Sax & Astin, 1997). The targeted educational outcomes enabled us to test some of the previous findings that resulted from single-level methodological/statistical approaches and more dated data sources. Table 1 Factor Loadings and Reliabilities for Dependent Variables (all surveyed in 1998) Factor and Survey Items
Factor
Loading
Internal Consistency
(Alpha) Openness to Diversity a
.72
Compared with when you entered college as a freshman, how would you now describe your knowledge of different races/cultures.
.87
Compared with when you entered college as a freshman, how would you now describe your acceptance of different races/cultures.
.87
Cognitive Development a
.75
Compared with when you entered college as a freshman, how would you now describe your general knowledge.
.75
Compared with when you entered college as a freshman, how would you now describe your problem-solving skills.
.84
Compared with when you entered college as a freshman, how would you now describe your critical thinking ability.
.82
Self-confidence b
.65
Compared with the average person your age, how would you rate your self-confidence (intellectual).
.85
Compared with the average person your age, how would you rate your self-confidence (social).
.86
a Five-point scale: From 1 = much weaker to 5 = much stronger. Recent research by Anaya (1999) indicates that those measures that ask students to compare themselves to when they were freshmen have more validity when compared with pre/post changes on cognitive measures. b Five-point scale: From 1 = lowest 10% to 5 = highest 10%; items have corresponding pretests.
CSHE Research & Occasional Paper Series
Chang et al., EDUCATIONAL BENEFITS OF CROSS-RACIAL INTERACTION 7
All items used to measure those developmental constructs were drawn from students' responses to the 1998 Follow-up survey. A principal component factor analysis of these seven individual items (with varimax rotation) produced three factors, confirming our three constructs. The factor loadings were all greater than .75. This solution, accounting for 72.43 percent of the variance in the correlation matrix, is shown in Table 1. The construct Openness to Diversity was measured by a student's composite score on two items: their perceived growth since entering college in acceptance of other races, and knowledge of people of different races (α = .72). The Cognitive Development measure was a composite of students' responses on three items: their perceived growth in problem solving, critical thinking, and general knowledge (α = .75). Lastly, Self-confidence was measured by calculating students’ scores on their self-ratings of their own intellectual and social self-confidence as compared to their peers (α = .65). Independent Variables The principal independent variables of interest concern the student’s level of cross-racial interaction (CRI) and the institution’s average level of CRI among the student body. Students’ CRI level was a composite variable that combined each student's score on four items from the 1998 survey. These items queried how often the student engaged in the following activities at the college (all coded as a 3-point scale where 1 = not at all, 2 = occasionally, and 3 = frequently):
studied with someone from a different racial/ethnic group, dined with someone from a different racial/ethnic group, dated someone from a different racial/ethnic group, interacted in class with someone from a different racial/ethnic group.
This composite variable ranged in values from 4 to 12, with higher values indicating more frequent interactions with someone from a different racial/ethnic group (α = .76). The institutional peer level of CRI was the average CRI score of all respondents for that institution. This aggregate average measure of CRI is used to approximate the overall campus quality for sustaining positive race relations. Control Variables In testing the effects of cross-racial interaction (CRI) on student outcomes, key variables were included in the analyses to minimize self-selection bias and to control for the effect of critical institutional characteristics (see Appendix A). These variables were selected based on their noted importance in those studies cited earlier and as a way to rule out alternative explanations for findings. These variables are discussed below with respect to how they were considered by level in the subsequent analyses. Of course, there are innumerable variables that could conceivably be included in our analyses (e.g., student’s major field, engagement in particular college activities, etc.). Methodologically speaking, however, including too many variables in the model can pose serious problems. The common rule of thumb for regression analysis is at least 10 observations for each predictor; however, the corresponding rules for hierarchical models are somewhat more complex due to the statistical consideration of multiple levels. For our analyses, there should also be at least 10 institutions per institution-level predictor in the model (Raudenbush & Bryk, 2002). Thus, due to these methodological constraints, we were very careful in deciding which variables to include in our final analyses, and where
CSHE Research & Occasional Paper Series
Chang et al., EDUCATIONAL BENEFITS OF CROSS-RACIAL INTERACTION 8
possible, we created composites as a way to reduce the number of variables (e.g., student involvement was a composite of student participation in a fraternity/sorority, student government, and racial/ethnic organizations). The set of variables included in our final analyses are presented next. Student-level. The first set of student-level variables consisted of identical freshman pretests or reasonable proxies for each of the outcome measures: goal of promoting racial understanding, 1994 self-ratings of academic ability, and 1994 self-ratings of self-confidence. A second set of control variables consisted of students' precollege characteristics such as race, gender, high school GPA, and socioeconomic status (composite of mother’s education, father’s education, and income). It should be noted that while we did not explicitly compare students from different racial/ethnic groups by running separate analyses for each group (due to limitations in sample sizes per racial group), we are fully aware that students from different racial/ethnic groups probably experience campus diversity in different ways (see, for example, Gurin et al., 2002; Chang, 1999). As a result, we included four dummy coded variables for race (i.e., Asian Americans, Latino/as, African Americans, and American Indians), with Whites being the comparison (omitted) group. Thus, each of the racial/ethnic group coefficients compares students from that specific racial/ethnic group with White students. Lastly, a third set controlled for individual college experiences such as both living and working arrangements (on campus/off campus), civic goals, and level of campus involvement in student organizations. The civic goals variable was a composite asking students to indicate the importance to them personally of the following three items (on a scale of 1=not important to 4=essential): influence of social values, helping others in difficulty, and participating in a community action program. Level of campus involvement was also an index of items asking students whether or not they had joined any of the following groups (0=not marked; 1=marked): a fraternity/sorority, student government, and a racial/ethnic organization. Again, while these control variables are not of primary substantive interest, they were included in the analyses because they represent predispositions, characteristics, and college experiences that have been shown in previous studies to be related to but unique from cross-racial interaction (Antonio, 2001b; Astin, 1993a; Chang, 1999 & 2004; Gurin et al., 2002; Milem, 1994). Controlling for them thus reduces the risk of overestimating the effects of CRI. Institution-level. These control variables included enrollment size, level of selectivity, and public vs. private institution, since those are well-known structural differences that shape student experiences in higher education and also enable us to control for sample biases. Since enrollment size was highly skewed, we transformed its values to the natural log scale. We also included at this level the aggregate measures of the student-level variables for all the students within each institution so that we could better differentiate student vs. institution-level effects and rule out other potential unique culture/climate effects. Appendix A also lists descriptive statistics for all the variables included in the analyses. Analytic Approach Because of the hierarchical multilevel character of this data, we decided against using a single-level approach for this study. The problems of neglecting the hierarchical or
CSHE Research & Occasional Paper Series
Chang et al., EDUCATIONAL BENEFITS OF CROSS-RACIAL INTERACTION 9
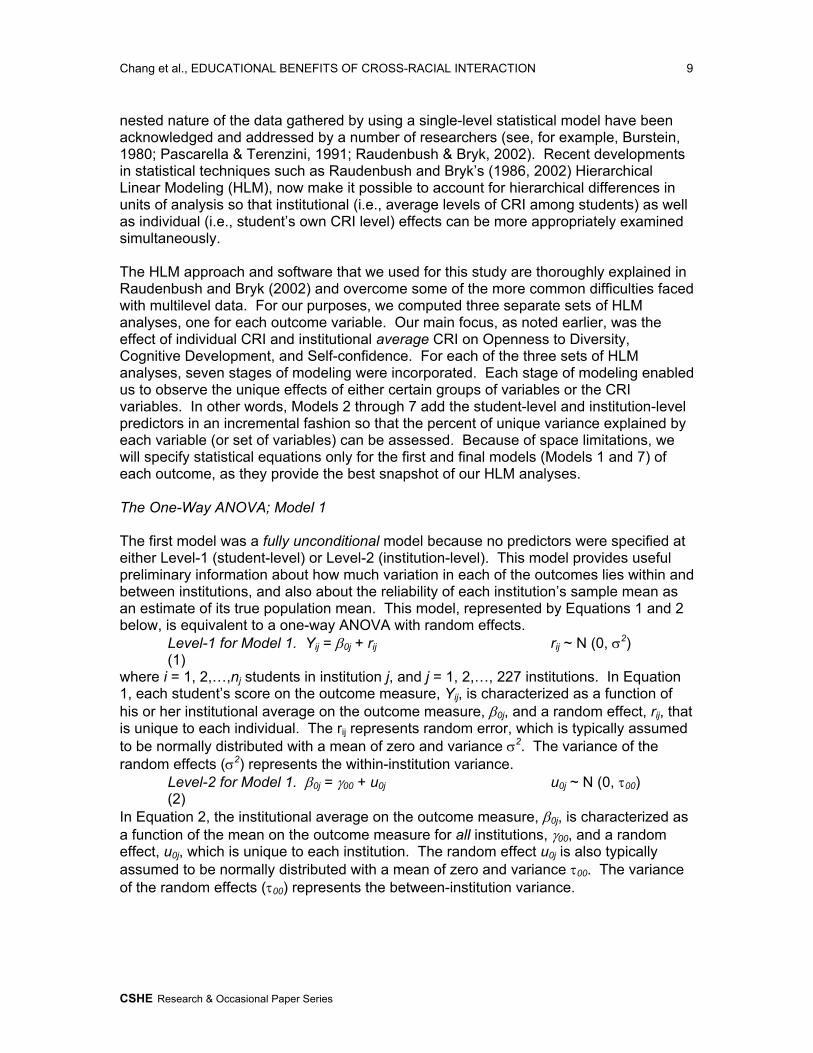
nested nature of the data gathered by using a single-level statistical model have been acknowledged and addressed by a number of researchers (see, for example, Burstein, 1980; Pascarella & Terenzini, 1991; Raudenbush & Bryk, 2002). Recent developments in statistical techniques such as Raudenbush and Bryk’s (1986, 2002) Hierarchical Linear Modeling (HLM), now make it possible to account for hierarchical differences in units of analysis so that institutional (i.e., average levels of CRI among students) as well as individual (i.e., student’s own CRI level) effects can be more appropriately examined simultaneously. The HLM approach and software that we used for this study are thoroughly explained in Raudenbush and Bryk (2002) and overcome some of the more common difficulties faced with multilevel data. For our purposes, we computed three separate sets of HLM analyses, one for each outcome variable. Our main focus, as noted earlier, was the effect of individual CRI and institutional average CRI on Openness to Diversity, Cognitive Development, and Self-confidence. For each of the three sets of HLM analyses, seven stages of modeling were incorporated. Each stage of modeling enabled us to observe the unique effects of either certain groups of variables or the CRI variables. In other words, Models 2 through 7 add the student-level and institution-level predictors in an incremental fashion so that the percent of unique variance explained by each variable (or set of variables) can be assessed. Because of space limitations, we will specify statistical equations only for the first and final models (Models 1 and 7) of each outcome, as they provide the best snapshot of our HLM analyses. The One-Way ANOVA; Model 1 The first model was a fully unconditional model because no predictors were specified at either Level-1 (student-level) or Level-2 (institution-level). This model provides useful preliminary information about how much variation in each of the outcomes lies within and between institutions, and also about the reliability of each institution’s sample mean as an estimate of its true population mean. This model, represented by Equations 1 and 2 below, is equivalent to a one-way ANOVA with random effects. Level-1 for Model 1. Yij = β0j + rij rij ~ N (0, σ2) (1) where i = 1, 2,…,nj students in institution j, and j = 1, 2,…, 227 institutions. In Equation 1, each student’s score on the outcome measure, Yij, is characterized as a function of his or her institutional average on the outcome measure, β0j, and a random effect, rij, that is unique to each individual. The rij represents random error, which is typically assumed to be normally distributed with a mean of zero and variance σ2. The variance of the random effects (σ2) represents the within-institution variance. Level-2 for Model 1. β0j = γ00 + u0j u0j ~ N (0, τ00) (2) In Equation 2, the institutional average on the outcome measure, β0j, is characterized as a function of the mean on the outcome measure for all institutions, γ00, and a random effect, u0j, which is unique to each institution. The random effect u0j is also typically assumed to be normally distributed with a mean of zero and variance τ00. The variance of the random effects (τ00) represents the between-institution variance.
CSHE Research & Occasional Paper Series
Chang et al., EDUCATIONAL BENEFITS OF CROSS-RACIAL INTERACTION 10
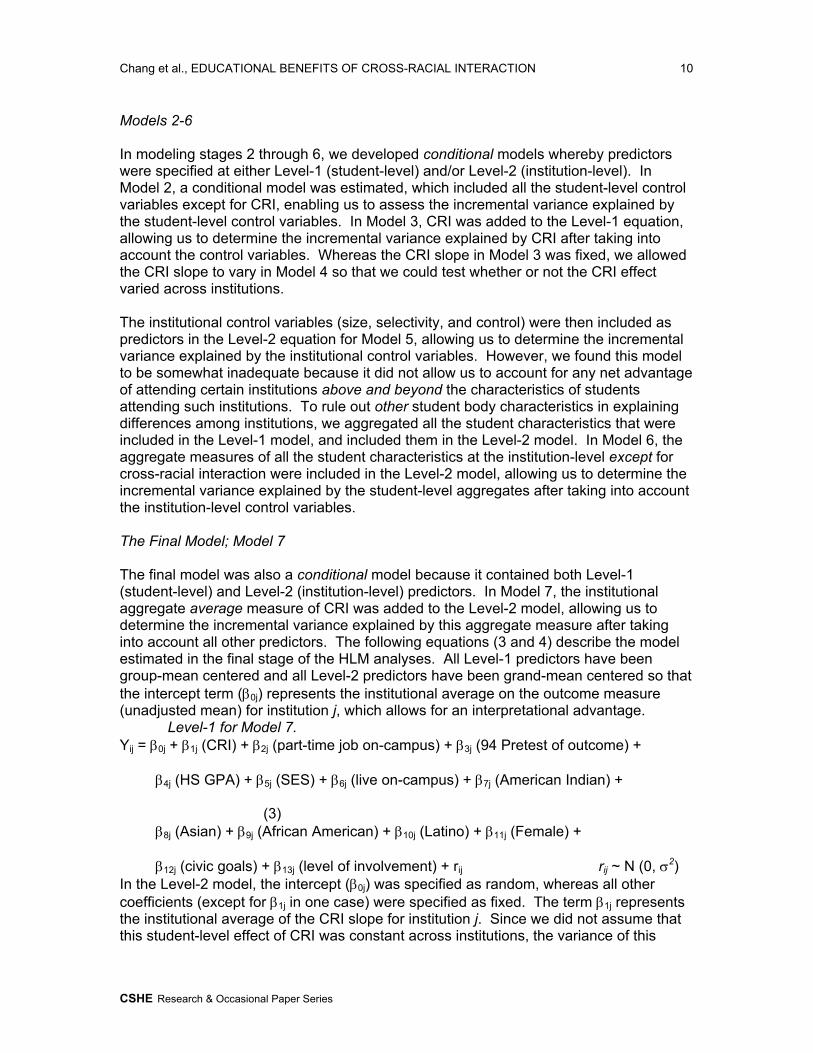
Models 2-6 In modeling stages 2 through 6, we developed conditional models whereby predictors were specified at either Level-1 (student-level) and/or Level-2 (institution-level). In Model 2, a conditional model was estimated, which included all the student-level control variables except for CRI, enabling us to assess the incremental variance explained by the student-level control variables. In Model 3, CRI was added to the Level-1 equation, allowing us to determine the incremental variance explained by CRI after taking into account the control variables. Whereas the CRI slope in Model 3 was fixed, we allowed the CRI slope to vary in Model 4 so that we could test whether or not the CRI effect varied across institutions. The institutional control variables (size, selectivity, and control) were then included as predictors in the Level-2 equation for Model 5, allowing us to determine the incremental variance explained by the institutional control variables. However, we found this model to be somewhat inadequate because it did not allow us to account for any net advantage of attending certain institutions above and beyond the characteristics of students attending such institutions. To rule out other student body characteristics in explaining differences among institutions, we aggregated all the student characteristics that were included in the Level-1 model, and included them in the Level-2 model. In Model 6, the aggregate measures of all the student characteristics at the institution-level except for cross-racial interaction were included in the Level-2 model, allowing us to determine the incremental variance explained by the student-level aggregates after taking into account the institution-level control variables. The Final Model; Model 7 The final model was also a conditional model because it contained both Level-1 (student-level) and Level-2 (institution-level) predictors. In Model 7, the institutional aggregate average measure of CRI was added to the Level-2 model, allowing us to determine the incremental variance explained by this aggregate measure after taking into account all other predictors. The following equations (3 and 4) describe the model estimated in the final stage of the HLM analyses. All Level-1 predictors have been group-mean centered and all Level-2 predictors have been grand-mean centered so that the intercept term (β0j) represents the institutional average on the outcome measure (unadjusted mean) for institution j, which allows for an interpretational advantage. Level-1 for Model 7. Yij = β0j + β1j (CRI) + β2j (part-time job on-campus) + β3j (94 Pretest of outcome) + β4j (HS GPA) + β5j (SES) + β6j (live on-campus) + β7j (American Indian) +
(3) β8j (Asian) + β9j (African American) + β10j (Latino) + β11j (Female) + β12j (civic goals) + β13j (level of involvement) + rij rij ~ N (0, σ2) In the Level-2 model, the intercept (β0j) was specified as random, whereas all other coefficients (except for β1j in one case) were specified as fixed. The term β1j represents the institutional average of the CRI slope for institution j. Since we did not assume that this student-level effect of CRI was constant across institutions, the variance of this
CSHE Research & Occasional Paper Series
Chang et al., EDUCATIONAL BENEFITS OF CROSS-RACIAL INTERACTION 11
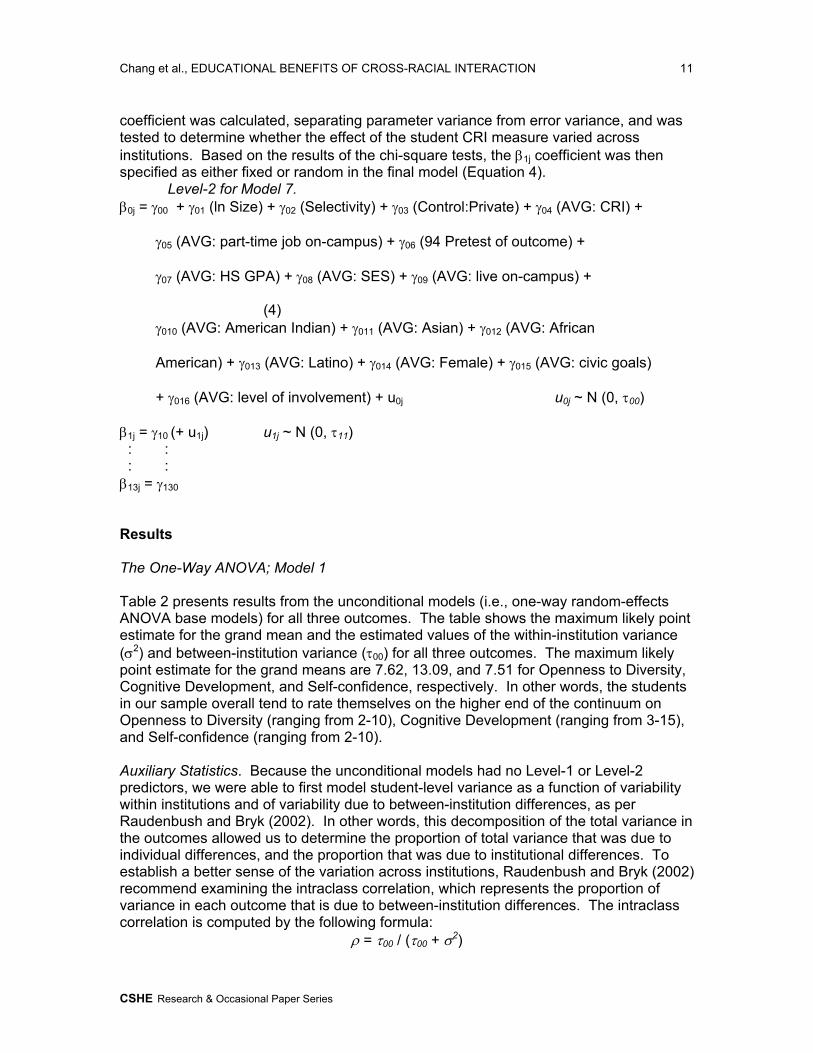
coefficient was calculated, separating parameter variance from error variance, and was tested to determine whether the effect of the student CRI measure varied across institutions. Based on the results of the chi-square tests, the β1j coefficient was then specified as either fixed or random in the final model (Equation 4). Level-2 for Model 7. β0j = γ00 + γ01 (ln Size) + γ02 (Selectivity) + γ03 (Control:Private) + γ04 (AVG: CRI) + γ05 (AVG: part-time job on-campus) + γ06 (94 Pretest of outcome) + γ07 (AVG: HS GPA) + γ08 (AVG: SES) + γ09 (AVG: live on-campus) +
(4) γ010 (AVG: American Indian) + γ011 (AVG: Asian) + γ012 (AVG: African American) + γ013 (AVG: Latino) + γ014 (AVG: Female) + γ015 (AVG: civic goals) + γ016 (AVG: level of involvement) + u0j u0j ~ N (0, τ00) β1j = γ10 (+ u1j) u1j ~ N (0, τ11) : : : : β13j = γ130
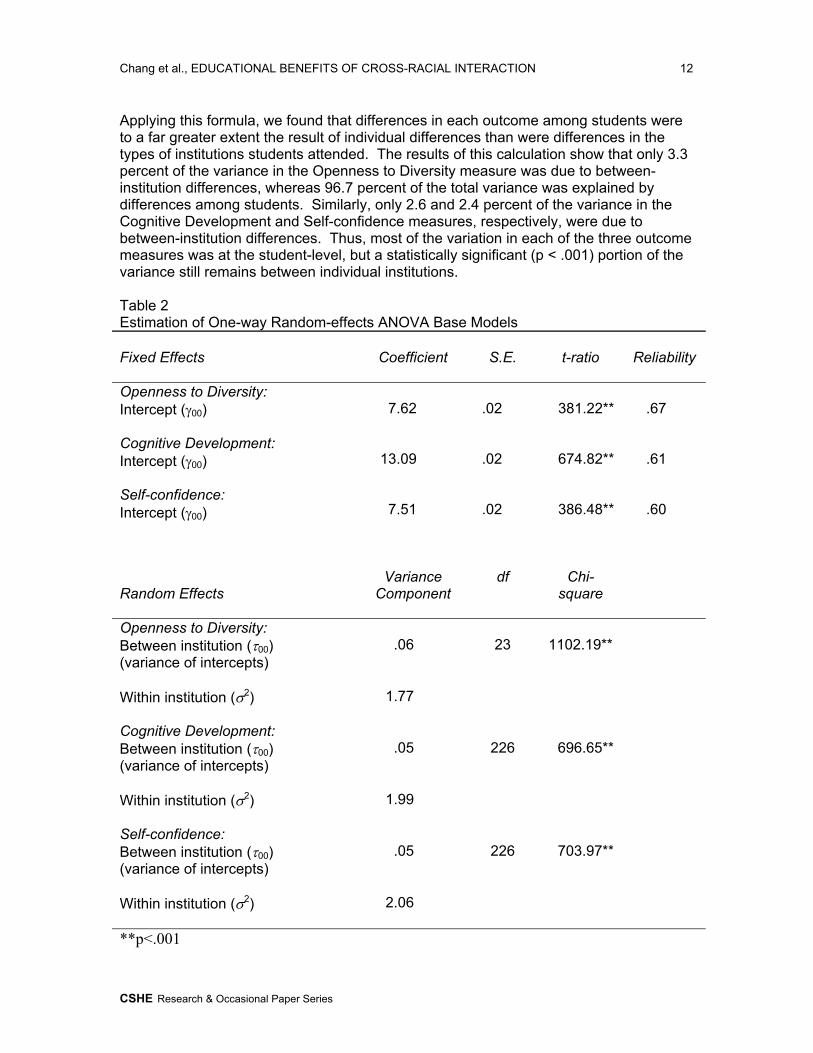
Results The One-Way ANOVA; Model 1 Table 2 presents results from the unconditional models (i.e., one-way random-effects ANOVA base models) for all three outcomes. The table shows the maximum likely point estimate for the grand mean and the estimated values of the within-institution variance (σ2) and between-institution variance (τ00) for all three outcomes. The maximum likely point estimate for the grand means are 7.62, 13.09, and 7.51 for Openness to Diversity, Cognitive Development, and Self-confidence, respectively. In other words, the students in our sample overall tend to rate themselves on the higher end of the continuum on Openness to Diversity (ranging from 2-10), Cognitive Development (ranging from 3-15), and Self-confidence (ranging from 2-10). Auxiliary Statistics. Because the unconditional models had no Level-1 or Level-2 predictors, we were able to first model student-level variance as a function of variability within institutions and of variability due to between-institution differences, as per Raudenbush and Bryk (2002). In other words, this decomposition of the total variance in the outcomes allowed us to determine the proportion of total variance that was due to individual differences, and the proportion that was due to institutional differences. To establish a better sense of the variation across institutions, Raudenbush and Bryk (2002) recommend examining the intraclass correlation, which represents the proportion of variance in each outcome that is due to between-institution differences. The intraclass correlation is computed by the following formula:
ρ = τ00 / (τ00 + σ2)
CSHE Research & Occasional Paper Series
Chang et al., EDUCATIONAL BENEFITS OF CROSS-RACIAL INTERACTION 12
Applying this formula, we found that differences in each outcome among students were to a far greater extent the result of individual differences than were differences in the types of institutions students attended. The results of this calculation show that only 3.3 percent of the variance in the Openness to Diversity measure was due to between-institution differences, whereas 96.7 percent of the total variance was explained by differences among students. Similarly, only 2.6 and 2.4 percent of the variance in the Cognitive Development and Self-confidence measures, respectively, were due to between-institution differences. Thus, most of the variation in each of the three outcome measures was at the student-level, but a statistically significant (p < .001) portion of the variance still remains between individual institutions. Table 2 Estimation of One-way Random-effects ANOVA Base Models Fixed Effects
Coefficient
S.E.
t-ratio
Reliability
Openness to Diversity: Intercept (γ00) Cognitive Development: Intercept (γ00) Self-confidence: Intercept (γ00)
7.62
13.09
7.51
.02 .02 .02
381.22**
674.82**
386.48**
.67 .61 .60
Random Effects
Variance Component
df Chi-square
Openness to Diversity: Between institution (τ00) (variance of intercepts)
.06
23
1102.19**
Within institution (σ2)
1.77
Cognitive Development: Between institution (τ00) (variance of intercepts)
.05
226
696.65**
Within institution (σ2)
1.99
Self-confidence: Between institution (τ00) (variance of intercepts)
.05
226
703.97**
Within institution (σ2)
2.06
**p<.001
CSHE Research & Occasional Paper Series
Chang et al., EDUCATIONAL BENEFITS OF CROSS-RACIAL INTERACTION 13
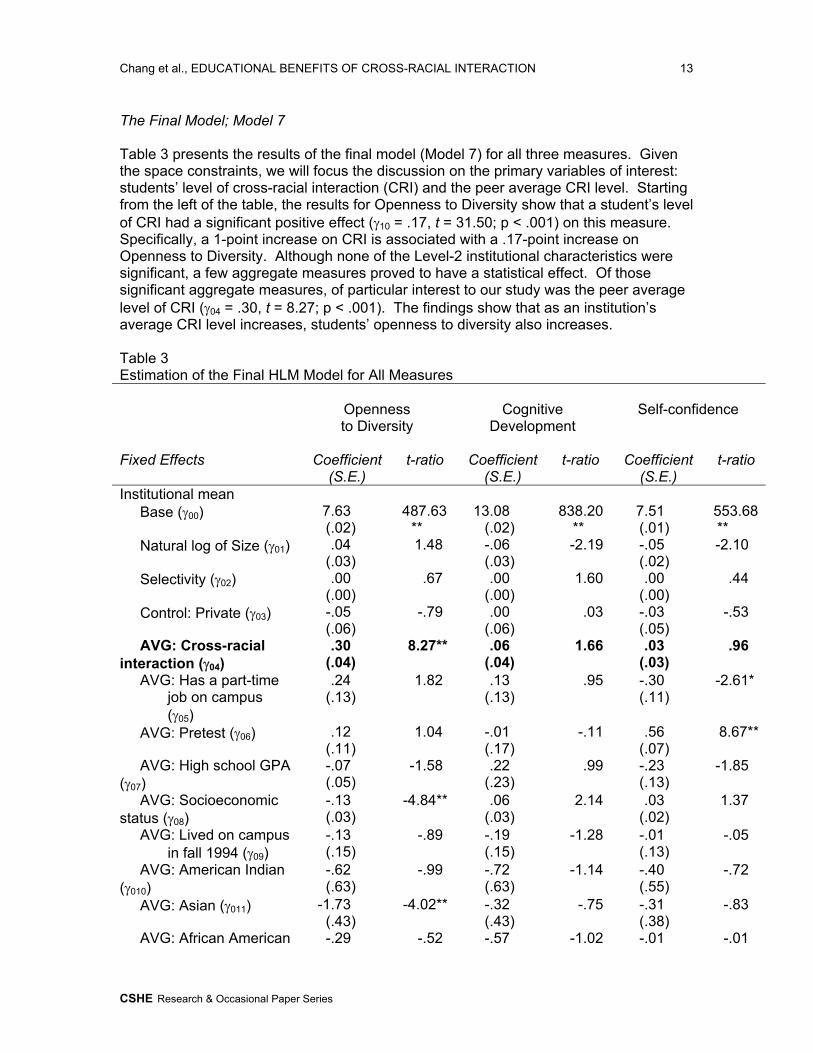
The Final Model; Model 7 Table 3 presents the results of the final model (Model 7) for all three measures. Given the space constraints, we will focus the discussion on the primary variables of interest: students’ level of cross-racial interaction (CRI) and the peer average CRI level. Starting from the left of the table, the results for Openness to Diversity show that a student’s level of CRI had a significant positive effect (γ10 = .17, t = 31.50; p < .001) on this measure. Specifically, a 1-point increase on CRI is associated with a .17-point increase on Openness to Diversity. Although none of the Level-2 institutional characteristics were significant, a few aggregate measures proved to have a statistical effect. Of those significant aggregate measures, of particular interest to our study was the peer average level of CRI (γ04 = .30, t = 8.27; p < .001). The findings show that as an institution’s average CRI level increases, students’ openness to diversity also increases. Table 3 Estimation of the Final HLM Model for All Measures
Openness to Diversity
Cognitive
Development
Self-confidence
Fixed Effects
Coefficient
(S.E.)
t-ratio
Coefficient
(S.E.)
t-ratio
Coefficient
(S.E.)
t-ratio
Institutional mean Base (γ00) 7.63
(.02) 487.63
** 13.08
(.02) 838.20
** 7.51 (.01)
553.68**
Natural log of Size (γ01) .04 (.03)
1.48 -.06 (.03)
-2.19 -.05 (.02)
-2.10
Selectivity (γ02) .00 (.00)
.67 .00 (.00)
1.60 .00 (.00)
.44
Control: Private (γ03) -.05 (.06)
-.79 .00 (.06)
.03 -.03 (.05)
-.53
AVG: Cross-racial interaction (γ04)
.30 (.04)
8.27** .06 (.04)
1.66 .03 (.03)
.96
AVG: Has a part-time job on campus (γ05)
.24 (.13)
1.82 .13 (.13)
.95 -.30 (.11)
-2.61*
AVG: Pretest (γ06) .12 (.11)
1.04 -.01 (.17)
-.11 .56 (.07)
8.67**
AVG: High school GPA (γ07)
-.07 (.05)
-1.58 .22 (.23)
.99 -.23 (.13)
-1.85
AVG: Socioeconomic status (γ08)
-.13 (.03)
-4.84** .06 (.03)
2.14 .03 (.02)
1.37
AVG: Lived on campus in fall 1994 (γ09)
-.13 (.15)
-.89 -.19 (.15)
-1.28 -.01 (.13)
-.05
AVG: American Indian (γ010)
-.62 (.63)
-.99 -.72 (.63)
-1.14 -.40 (.55)
-.72
AVG: Asian (γ011) -1.73 (.43)
-4.02** -.32 (.43)
-.75 -.31 (.38)
-.83
AVG: African American -.29 -.52 -.57 -1.02 -.01 -.01
CSHE Research & Occasional Paper Series
Chang et al., EDUCATIONAL BENEFITS OF CROSS-RACIAL INTERACTION 14
(γ012) (.55) (.55) (.48) AVG: Latino (γ013) -.15
(.62) -.24 .30
(.62) .48 .18
(.55) .33
AVG: Gender: female (γ014)
-.13 (.12)
-1.08 -.34 (.12)
-2.71* -.19 (.11)
-1.69
AVG: Civic goals (γ015) .19 (.05)
4.25** .20 (.04)
4.54** .14 (.04)
3.62*
AVG: Level of campus involvement (γ016)
.14 (.07)
1.93 .06 (.07)
.83 .24 (.06)
3.98**
Cross-racial interaction (γ10)
.17 (.01)
31.50**
.05 (.01)
7.09** .04 (.01)
6.83**
Has a part-time job on campus (γ20)
.04 (.02)
2.07 .07 (.02)
2.97* -.01 (.02)
-.70
Pretest (γ30) -.01 (.01)
-.53 .10 (.02)
5.86** .45 (.01)
67.41**
High school GPA (γ40) .03 (.03)
1.19 .12 (.03)
3.55* -.00 (.03)
-.02
Socioeconomic status (γ50)
-.03 (.00)
-7.16** .01 (.00)
1.34 .02 (.00)
5.64**
Lived on campus in fall 1994 (γ60)
.14 (.04)
3.62* -.10 (.04)
-2.24 -.00 (.04)
-.06
American Indian (γ70) -.21 (.07)
-2.87* -.13 (.08)
-1.58 -.01 (.07)
-.11
Asian (γ80) -.17 (.05)
-3.54* -.17 (.05)
-3.18* -.11 (.05)
-2.24
African American (γ90) -.01 (.06)
-.11 -.01 (.07)
-.09 -.04 (.06)
-.68
Latino (γ100) -.10 (.05)
-1.99 .09 (.06)
1.59 .00 (.05)
.06
Gender: female (γ110) -.12 (.02)
-5.87** -.11 (.02)
-5.14** -.36 (.02)
-18.27*
* Civic goals (γ120) .14
(.01) 27.46*
* .13
(.01) 24.60*
* .09
(.01) 18.01*
* Level of campus involvement (γ130)
.11 (.02)
7.57** .07 (.02)
4.02** .13 (.02)
8.88**
Random Effects
Variance Component
(df)
Chi-
square
Variance Component
(df)
Chi-
square
Variance Component
(df)
Chi-
square Between institution (τ00) (variance of intercepts)
.03 (210)
583.99**
.02 (210)
429.86**
.02 (210)
379.22**
Cross-racial interaction slope (τ11)
.00 (226)
279.59**
Within institution (σ2)
1.56 1.90 1.54
*p<.01; **p<.001
CSHE Research & Occasional Paper Series
Chang et al., EDUCATIONAL BENEFITS OF CROSS-RACIAL INTERACTION 15
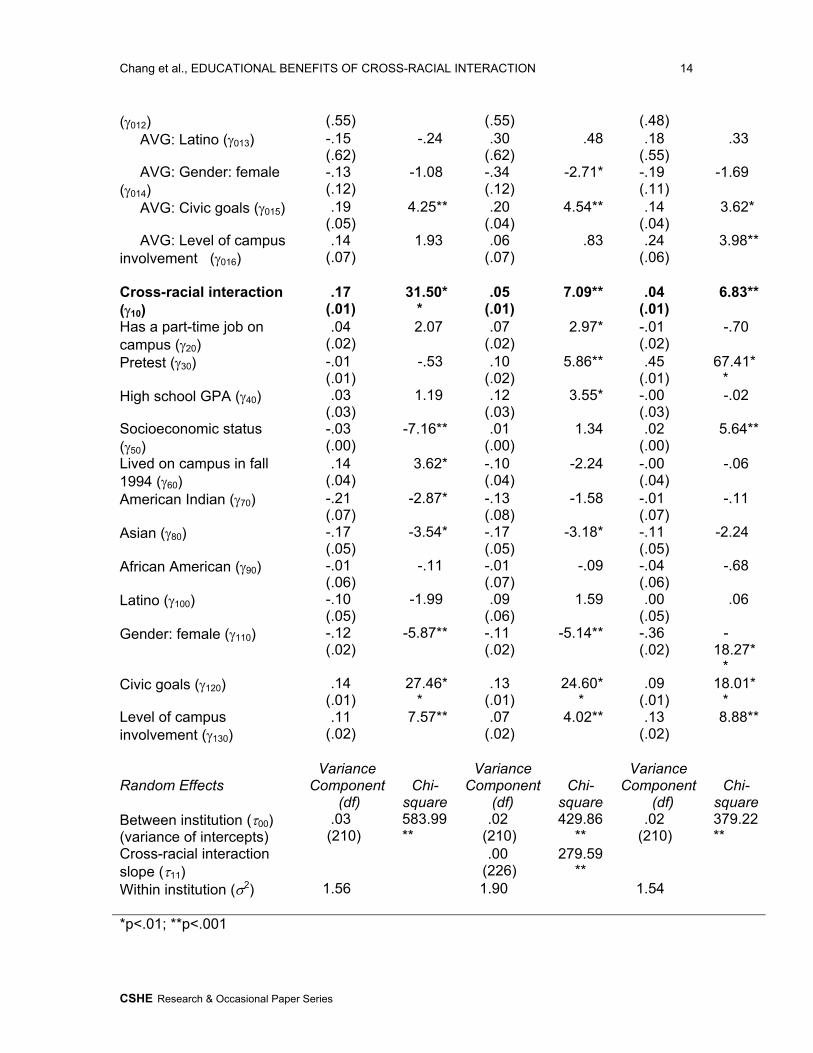
The second column of results in Table 3 is associated with the measure Cognitive Development. Again, focusing on the main variables of interest, the results show that on average (i.e., across all institutions), a student’s level of CRI has a significant positive effect on Cognitive Development (γ10 = .05, t = 7.09; p < .001). Specifically, a 1-point increase on CRI is on average associated with a .05-point increase on this measure. As can be seen from the random effects results on the bottom of Table 3, the CRI slope does indeed vary across institutions for this outcome [χ2 (df = 226) = 279.59; p < .01], unlike the other two outcomes. That is, some institutions have steeper CRI/Cognitive Development slopes, whereas other institutions have flatter slopes. It is also important to note that the aggregate peer measure of CRI is marginally significant (γ04 = .06, t = 1.66; p >.01), indicating that as the level of CRI among students increases one point, a student’s Cognitive Development increases .06 points on average. Turning now to the results associated with the Self-confidence measure reported in Table 3, we again observe that a student’s CRI level has a significant positive effect on the measure Self-confidence (γ10 = .04, t = 6.83; p < .001). Specifically, a 1-point CRI increase is associated with a .04-point increase in the Self-confidence measure. However, the aggregate CRI measure was not significant (γ04 = .03, t = .961; p >.01) for this outcome, suggesting that the peer average level of cross-racial interaction has no effect on the Self-confidence measure. Auxiliary Statistics. To establish a sense of how much of the student-level variance and institution-level variance in each outcome is accounted for by the set of predictors in the final models, we compared estimates for σ2 and τ00 based on the one-way ANOVA models and on each conditional model (Models 2-7). This also enabled us to observe the proportion of unique variance explained by our two primary variables of interest: students’ own CRI levels and peer average CRI levels. According to Raudenbush and Bryk (2002), by comparing the σ2 and τ00 estimates, we can calculate indices of the proportion reduction in variance or “variance explained” at Level-1, which is calculated as:
σ2 (unconditional model) – σ2 (conditional model) σ2 (unconditional model)
and also the proportion reduction in variance or “variance explained” at Level-2, which is similarly calculated as:
τ00 (unconditional model) – τ00 (conditional model) τ00 (unconditional model) The proportion of variance explained indices at Level-1 (the student-level) are reported in the top panel of Table 4, and the proportion of variance explained indices at Level-2 (the institution-level) are reported in the bottom panel of Table 4. The results show a sizeable reduction in the within-institution variance for each of the three outcomes when the student-level control variables were added to the model (see top panel of Table 4). For the Openness to Diversity measure, for example, adding the student-level control variables reduced the within-institution variance by 7.09 percent. For the Cognitive Development and Self-confidence measures, the student-level control variables reduced the within-institution variance by 4.33 and 25.11 percent, respectively. Adding students’ own CRI level to the predictors reduced an even larger proportion of the within-institution variance for all three outcomes. For Openness to Diversity, for
CSHE Research & Occasional Paper Series
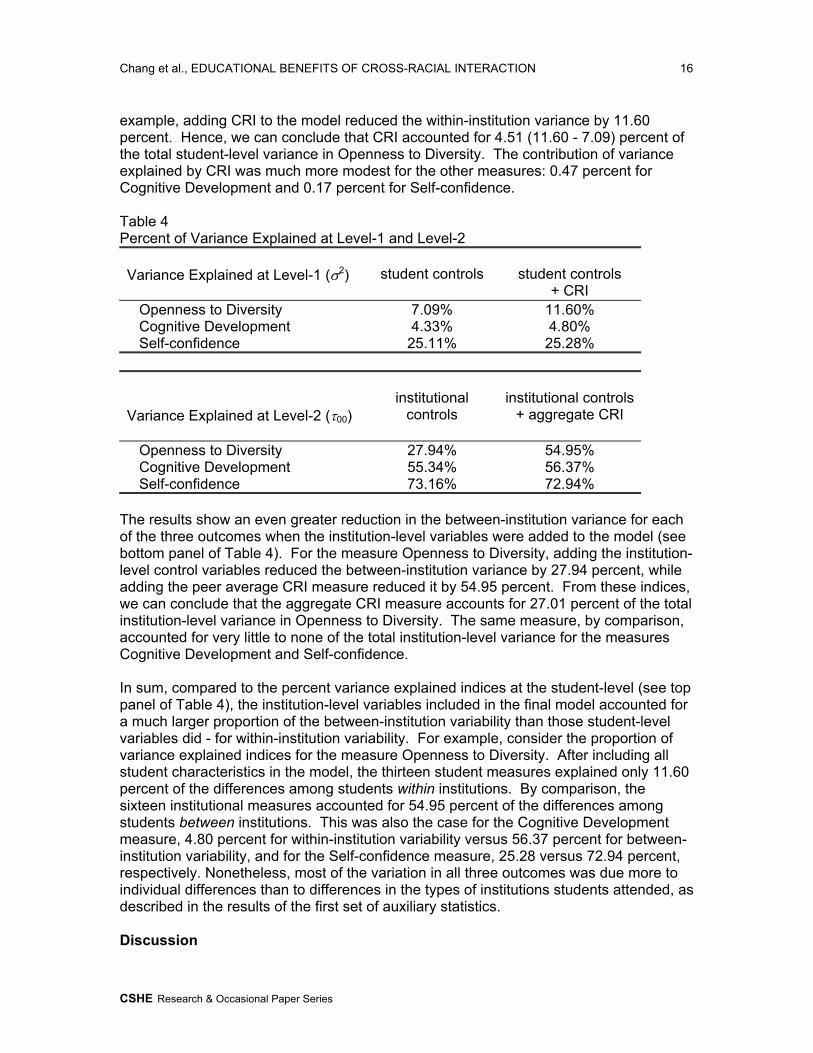
Chang et al., EDUCATIONAL BENEFITS OF CROSS-RACIAL INTERACTION 16
example, adding CRI to the model reduced the within-institution variance by 11.60 percent. Hence, we can conclude that CRI accounted for 4.51 (11.60 - 7.09) percent of the total student-level variance in Openness to Diversity. The contribution of variance explained by CRI was much more modest for the other measures: 0.47 percent for Cognitive Development and 0.17 percent for Self-confidence. Table 4 Percent of Variance Explained at Level-1 and Level-2 Variance Explained at Level-1 (σ2)
student controls
student controls
+ CRI Openness to Diversity 7.09% 11.60% Cognitive Development 4.33% 4.80% Self-confidence 25.11% 25.28%
Variance Explained at Level-2 (τ00)
institutional
controls
institutional controls
+ aggregate CRI
Openness to Diversity 27.94% 54.95% Cognitive Development 55.34% 56.37% Self-confidence 73.16% 72.94%
The results show an even greater reduction in the between-institution variance for each of the three outcomes when the institution-level variables were added to the model (see bottom panel of Table 4). For the measure Openness to Diversity, adding the institution-level control variables reduced the between-institution variance by 27.94 percent, while adding the peer average CRI measure reduced it by 54.95 percent. From these indices, we can conclude that the aggregate CRI measure accounts for 27.01 percent of the total institution-level variance in Openness to Diversity. The same measure, by comparison, accounted for very little to none of the total institution-level variance for the measures Cognitive Development and Self-confidence. In sum, compared to the percent variance explained indices at the student-level (see top panel of Table 4), the institution-level variables included in the final model accounted for a much larger proportion of the between-institution variability than those student-level variables did - for within-institution variability. For example, consider the proportion of variance explained indices for the measure Openness to Diversity. After including all student characteristics in the model, the thirteen student measures explained only 11.60 percent of the differences among students within institutions. By comparison, the sixteen institutional measures accounted for 54.95 percent of the differences among students between institutions. This was also the case for the Cognitive Development measure, 4.80 percent for within-institution variability versus 56.37 percent for between-institution variability, and for the Self-confidence measure, 25.28 versus 72.94 percent, respectively. Nonetheless, most of the variation in all three outcomes was due more to individual differences than to differences in the types of institutions students attended, as described in the results of the first set of auxiliary statistics. Discussion
CSHE Research & Occasional Paper Series
Chang et al., EDUCATIONAL BENEFITS OF CROSS-RACIAL INTERACTION 17
Even though the U.S. Supreme Court upheld the practice of considering race in their June 23, 2003 ruling of Grutter v. Bollinger, the decision will not likely end the controversy and the litigation regarding race-conscious admissions practices. Justice Antonin Scalia, who wrote a dissenting opinion in Grutter, exposed a long list of problems associated with this ruling, which can potentially bring on similar lawsuits in the future. One of the problems he noted was what he believed to be weak empirical support for claims about educational benefits being linked to a racially diverse student body. The results of this study confirm previous findings (Antonio, 2001b; Astin, 1993a; Chang, 1999 & 2004; Gurin et al., 2002; Milem, 1994) that higher frequencies of interacting with someone of a different race during college have added educational benefits for students. However, unlike previous quantitative studies that tested only students’ own frequency of cross-racial interaction (CRI) using single-level linear models to examine multilevel effects, this study modeled the structure of multilevel data by applying Hierarchical Linear Modeling (HLM) and also tested the effect of an aggregate peer measure of CRI. Thus, in those ways, the results here also extend previous findings. Student-level effects Overall, the effects of students’ frequency of cross-racial interaction on all of the three outcomes tested (Openness to Diversity, Cognitive Development, and Self-confidence) were significant and uniformly positive. Students who had higher levels of CRI tended to report significantly larger gains made since entering college in their knowledge of and ability to accept different races/cultures, growth in general knowledge, critical thinking ability, and problem-solving skills, and intellectual and social self-confidence than did their peers who had lower levels of interaction. These student-level effects remained statistically significant and positive even after controlling for differences in students’ backgrounds and key institutional and student body characteristics. Of the three outcomes tested, the effect of CRI was strongest on students’ openness to diversity. Although adding the CRI measure reduced the proportion of the within-institution variance for all three outcomes, the measure accounted for a much larger proportion of the total student-level variance in students’ openness to diversity. Institution-level effects Perhaps even more noteworthy are the findings regarding the peer average level of cross-racial interaction, one of the Level-2 aggregate measures. The results associated with this measure provide a sense of how student bodies that interact more frequently across race affect individual development above and beyond a student’s own level of interaction. Here, we did not expect much of an effect because, as we found in the unconditional models, differences in the outcome measures were to a far greater extent the result of individual differences than differences in the type of institution students attended. Less than 4 percent of the variance on any of the three outcomes was explained by institutional differences. Still, the peer average CRI level had a significant positive effect on students’ openness to diversity and was marginally significant for cognitive development. Adding the aggregate peer measure of CRI reduced the between-institution variance of students’ openness to diversity by over 25 percent, but
CSHE Research & Occasional Paper Series
Chang et al., EDUCATIONAL BENEFITS OF CROSS-RACIAL INTERACTION 18
accounted for very little of the institution-level variance for the cognitive development measure. The above findings thus show that the peer average level of cross-racial interaction positively affects students’ self-comparison of gains made since entering college, particularly in their knowledge of and ability to accept different races/cultures, above and beyond a student’s own level of cross-racial interaction during college. In other words, even those students who have very little cross-racial interaction, yet are part of a student body that has high average levels of interaction, tend to report greater individual gains in openness to diversity than those who have the same level of interaction but are a part of a student body that has low average levels. Because the HLM model reduces standard error estimates due to the dependence of individual responses (i.e., student-level CRI) within an institution that are associated with the environment, the peer mean CRI can be said to be exerting a “compositional effect” or a common influence on each person within that environment. According to Raudenbush and Bryk (2002), compositional effects occur when the institutional aggregate (i.e., peer mean CRI) of a person-level characteristic (i.e., a student’s own CRI level) significantly affects the outcome measure of interest, even after controlling for the effect of the person-level characteristic. How might a campus environment that possesses relatively high overall levels of cross-racial contact among students yield unique positive results for all students, independent of a student’s own frequency of interaction? We unfortunately are unable to answer this question with a large degree of precision. One limitation with this study is that it is not absolutely clear what the peer mean CRI is actually measuring. However, given that this measure shows a strong independent positive effect on self-reported gains in knowledge of and ability to accept different races/cultures, we believe that the measure captures more than a superficial account of the environment but is likely to reflect a more complex set of institutional qualities associated with race relations, as theorized by Allport (1954) and described by Hale (2004), Hurtado et al. (1999), and Smith et al. (1997). We know, for example, that this peer mean measure accounts for more than just the probability of having cross-racial contact, as we statistically controlled for student body racial composition. We also know from the literature reviewed earlier that realizing the benefits of positive race relations requires deep and substantial institutional changes that address the learning opportunities offered, cultural norms, and social arrangements of institutions. Perhaps those campuses with higher peer CRI means have in place a curriculum that reflects the historical and contemporary experiences of people of color, programs that support the recruitment, retention and graduation of students of color, and an institutional mission that reinforces the colleges' commitment to pluralism (Allen & Solorzano, 2001; Richardson & Skinner, 1990). Such campuses might also more carefully and intentionally attend to their historical legacy of exclusion, structural diversity, and student perceptions of racial tension or discrimination (Hurtado, 2002). Whatever the specific conditions might be, students who attend campuses with higher peer average CRI levels are not only benefiting from simply observing more students interacting across racial differences, but are in all likelihood also benefiting from the overall institutional quality that sustains positive race relations, or what Hale (2004) describes as the “network of values, policies, practices, traditions, resources, and sentiments” (11) that make higher overall frequency of contact possible. Future studies should consider unpacking more precisely the effect of peer mean CRI levels on self-reported gains in one’s knowledge of and ability to accept different races/cultures. Still,
CSHE Research & Occasional Paper Series
Chang et al., EDUCATIONAL BENEFITS OF CROSS-RACIAL INTERACTION 19
as a matter of practice, the findings suggest that campuses that actively and intentionally establish the conditions, culture, climate, and dynamic that sustain higher levels of cross-racial interaction among students might be reassured to know that even those students who report little or no interaction will also likely benefit from institutional efforts to sustain positive race relations. Conclusion To the extent that average peer level of cross-racial interaction is a function of a complex set of institutional conditions associated with positive race relations, the above findings have quite interesting implications. While the student-level results confirm previous findings regarding the positive educational effects linked to engaging with diversity, the broader-level aggregate effects suggest that the overall institutional quality associated with higher average frequency of contact among students might also be educationally relevant. Any attempt to theorize the educational relevance of cross-racial interaction should think beyond just a focus on interpersonal relationships, but also consider how broader aspects of the immediate context (i.e., campus environment) that shapes both the quality and frequency of contact might itself lead to benefits. Greater focus on the latter is a slight shift in direction away from the general body of research produced in the past five years. Largely due to the affirmative action controversy in higher education, most of the recent research has focused mainly on asking if diversity matters. That there are measurable developmental gains related to being in an environment that enhances the overall frequency of interactions across racial differences among students suggest that equal attention should also be given to what institutions can actually do to realize those benefits. It is becoming increasingly clear that the effects of diversity are conditional, which explains in part why there is still ongoing controversy regarding the body of research informing the benefits of diversity as noted by Justice Scalia. In order to understand if diversity matters, we need to also understand what makes diversity work or fall short. There is still a pressing need for more quality research because the if question is not yet fully resolved in the courts, and the what question has serious implications for institutional practice, which subsequently contributes to how the educational relevance of diversity will invariably be judged. References Allen, W., & Solorzano, D. (2001). Affirmative Action, educational equity and campus
racial climate: A case study of the University of Michigan Law School. La Raza Law Journal, 12, 237-363.
Allport, G. (1954). The nature of prejudice. Cambridge, MA: Addison-Wesley. Ancis, J. R., Sedlacek, W. E., & Mohr, J. J. (2000). Student perceptions of campus
cultural climate by race. Journal of Counseling and Development, 78(2), 180-185.
Antonio, A.L. (2001a). Diversity and the influence of friendship groups in college. Review of Higher Education, 25(1), 63-89.
CSHE Research & Occasional Paper Series
Chang et al., EDUCATIONAL BENEFITS OF CROSS-RACIAL INTERACTION 20
Antonio, A.L. (2001b). The role of interracial interaction in the development of leadership skills and cultural knowledge and understanding. Research in Higher Education, 42(5), 593-617.
Astin, A. W. (1993a). Diversity and multiculturalism on the campus: How are students affected? Change, 23, 44-49.
Astin, A. W. (1993b). What matters in college: Four critical years revisited. San Francisco: Jossey Bass.
Bowen, W. G., & Bok, D. (1998). The shape of the river: Long-term consequences of considering race in college and university admissions. Princeton, NJ: Princeton University Press.
Burstein, L. (1980). The analysis of multilevel data in educational research and evaluation. In D. C. Berliner (Ed.), Review of Research in Education (Vol. 8). Washington, DC: American Educational Research Association.
Cabrera, A. F., & Nora, A. (1994). College students' perceptions of prejudice and discrimination and their feelings of alienation: A construct validation approach. Review of Education/Pedagogy/Cultural Studies, 16, 387-409.
Chang, M. J. (1999). Does racial diversity matter?: The educational impact of a racially diverse undergraduate population. Journal of College Student Development, 40, 377-395.
Chang, M. J., Witt, D., Jones, J., & Hakuta, K. (Eds.). (2003). Compelling interest: Examining the evidence on racial dynamics in colleges and universities. Stanford, CA: Stanford University Press.
Chang, M. J. (2003). Racial differences in viewpoints about contemporary issues among entering college students: Fact or fiction? NASPA Journal, 40(4), 55-71.
Chang, M.J., Astin, A.W., & Kim, D. (2004). Cross-racial interaction among undergraduates: Some causes and consequences. Research in Higher Education, 45(5), 527-551.
Gratz v. Bollinger, et al., 122 F.Supp.2d 811 (2000). Grutter v. Bollinger, et al., 137 F.Supp.2d 821 (E.D. Mich. 2001), rev’d, 288 F.3d732 (6th
Cir. 2002). Gurin, P., Dey, E., Hurtado, S., & Gurin, G. (2002). Diversity and higher education:
Theory and impact on educational outcomes. Harvard Educational Review, 72, 330-366.
Hale, F. W. (Ed.). (2004). What makes racial diversity work in higher education: Academic leaders present successful policies and strategies. Sterling, VA: Stylus Publishing.
Hurtado, S. (2001). Linking diversity and educational purpose: How diversity affects the classroom environment and student development. In G. Orfield & M. Kurlaender (Eds.), Diversity challenged: Evidence on the impact of affirmative action (pp. 187-203). Cambridge, MA: Harvard Education Publishing Group.
Hurtado, S. (2002). Creating a climate of inclusion: Understanding Latina/o college students. In W. A. Smith, P.G. Altbach, & K. Lomotey (Eds.), The racial crisis in American higher education: Continuing challenges for the twenty-first century (pp. 121-136). Albany: State University of New York Press.
Hurtado, S., Milem, J., Clayton-Pederson, A.R., & Allen, W.R. (1998). Enhancing campus climates for racial/ethnic diversity: Educational policy and practice. The Review of Higher Education, 21(3), 279-302.
Hurtado, S., Milem, J.F., Clayton-Pedersen, A.R., & Allen, W.R. (1999). Enacting diverse learning environments: Improving the campus climate for racial/ethnic diversity in
CSHE Research & Occasional Paper Series
Chang et al., EDUCATIONAL BENEFITS OF CROSS-RACIAL INTERACTION 21
higher education. ASHE-ERIC Higher Education Reports Series, 26 (8). San Francisco: Jossey Bass Publishers.
Hurtado, S., Dey, E. L., Gurin, P., & Gurin, G. (2003). College environments, diversity, and student learning. In J. C. Smart (Ed.), Higher education: Handbook of theory and research (Vol. 18, pp. 145-190): Kluwer Academic Publishers, UK.
Kuh, G. D. (1995). The other curriculum: Out-of-class experiences associated with student learning and personal development. Journal of Higher Education, 66, 123-155.
Milem, J. F. (1994). College, students, and racial understanding. Thought and Action, 9(2), 51-92.
Milem, J. F., & Hakuta, K. (2000). The benefits of racial and ethnic diversity in higher education, featured report. In D. Wilds (author), Minorities in higher education: Seventeenth annual status report (p. 39-67). Washington, DC: American Council on Education.
Orfield, G., & Kurlaender, M. (Eds.). (2001). Diversity challenged: Evidence on the impact of affirmative action. Cambridge: Harvard Educational Publishing Group. Pascarella, E. T., & Terenzini, P. T. (1991). How college affects students. San
Francisco: Jossey-Bass. Pascarella, E.T., Edison, M., Nora, A., Hagedorn, L.S., & Terenzini, P.T. (1996).
Influences on students' openness to diversity and challenge in the first year of college. The Journal of Higher Education, 67(2), 174-195.
Pettigrew, T. (1998). Intergroup contact theory. Annual Review of Psychology, 49, 65-85. Raudenbush, S., & Bryk, A.S. (1986). A hierarchical model for studying school effects.
Sociology of Education, 59, 1-17. Raudenbush, S., & Bryk, A. (2002). Hierarchical linear models: applications and data
analysis methods (2nd edition). Thousand Oaks, CA: Sage Publications. Richardson, R. C., & Skinner, E. F. (1990). Adapting to diversity: Organizational
influences on student achievement. Journal of Higher Education, 61(5), 485-511. Sax, L. J., & Astin, A. W. (1997). The development of ‘civic virtue’ among college
students. In J.N. Gardner & G. Van der Veer (eds.), The senior year experience: Facilitating integration, reflection, closure, and transition. San Francisco: Jossey-Bass.
Smith, D.G., Gerbick, G.L., Figueroa, M.A., Watkins, G.H., Levitan, T., Moore, L.C., Merchant, P.A., Beliak, H.D., & Figueroa, B. (1997). Diversity works: The emerging picture of how students benefit? Washington, D.C.: Association of American Colleges and Universities.
Terenzini, P. T., Pascarella, E. T., & Blimling, G. S. (1996). Students' out-of-class experiences and their influence on learning and cognitive development: A literature review. Journal of College Student Development, 37(2), 149-163.
CSHE Research & Occasional Paper Series
Chang et al., EDUCATIONAL BENEFITS OF CROSS-RACIAL INTERACTION 22
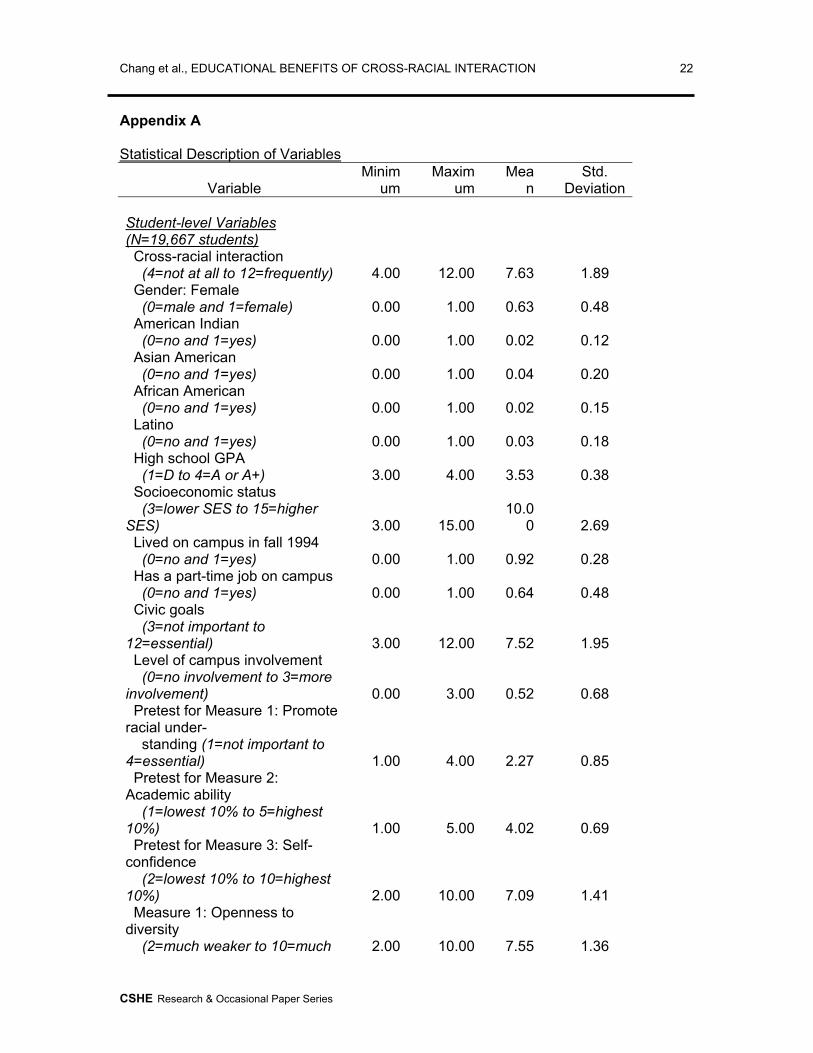
Appendix A Statistical Description of Variables
Variable Minim
um Maxim
um Mea
n Std.
Deviation Student-level Variables (N=19,667 students) Cross-racial interaction (4=not at all to 12=frequently) 4.00 12.00 7.63 1.89 Gender: Female (0=male and 1=female) 0.00 1.00 0.63 0.48 American Indian (0=no and 1=yes) 0.00 1.00 0.02 0.12 Asian American (0=no and 1=yes) 0.00 1.00 0.04 0.20 African American (0=no and 1=yes) 0.00 1.00 0.02 0.15 Latino (0=no and 1=yes) 0.00 1.00 0.03 0.18 High school GPA (1=D to 4=A or A+) 3.00 4.00 3.53 0.38 Socioeconomic status (3=lower SES to 15=higher SES) 3.00 15.00
10.00 2.69
Lived on campus in fall 1994 (0=no and 1=yes) 0.00 1.00 0.92 0.28 Has a part-time job on campus (0=no and 1=yes) 0.00 1.00 0.64 0.48 Civic goals (3=not important to 12=essential) 3.00 12.00 7.52 1.95 Level of campus involvement (0=no involvement to 3=more involvement) 0.00 3.00 0.52 0.68 Pretest for Measure 1: Promote racial under- standing (1=not important to 4=essential) 1.00 4.00 2.27 0.85 Pretest for Measure 2: Academic ability (1=lowest 10% to 5=highest 10%) 1.00 5.00 4.02 0.69 Pretest for Measure 3: Self-confidence (2=lowest 10% to 10=highest 10%) 2.00 10.00 7.09 1.41 Measure 1: Openness to diversity (2=much weaker to 10=much 2.00 10.00 7.55 1.36
CSHE Research & Occasional Paper Series
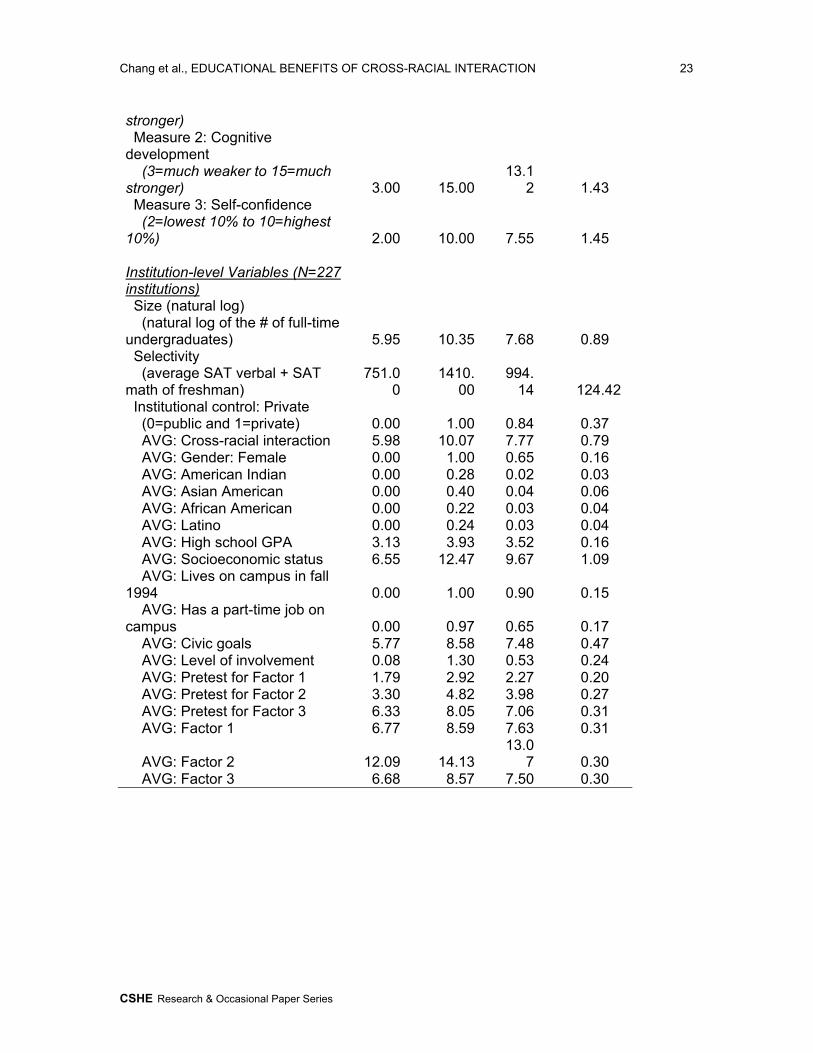
Chang et al., EDUCATIONAL BENEFITS OF CROSS-RACIAL INTERACTION 23
stronger) Measure 2: Cognitive development (3=much weaker to 15=much stronger) 3.00 15.00
13.12 1.43
Measure 3: Self-confidence (2=lowest 10% to 10=highest 10%) 2.00 10.00 7.55 1.45 Institution-level Variables (N=227 institutions) Size (natural log) (natural log of the # of full-time undergraduates) 5.95 10.35 7.68 0.89 Selectivity (average SAT verbal + SAT math of freshman)
751.00
1410.00
994.14 124.42
Institutional control: Private (0=public and 1=private) 0.00 1.00 0.84 0.37 AVG: Cross-racial interaction 5.98 10.07 7.77 0.79 AVG: Gender: Female 0.00 1.00 0.65 0.16 AVG: American Indian 0.00 0.28 0.02 0.03 AVG: Asian American 0.00 0.40 0.04 0.06 AVG: African American 0.00 0.22 0.03 0.04 AVG: Latino 0.00 0.24 0.03 0.04 AVG: High school GPA 3.13 3.93 3.52 0.16 AVG: Socioeconomic status 6.55 12.47 9.67 1.09 AVG: Lives on campus in fall 1994 0.00 1.00 0.90 0.15 AVG: Has a part-time job on campus 0.00 0.97 0.65 0.17 AVG: Civic goals 5.77 8.58 7.48 0.47 AVG: Level of involvement 0.08 1.30 0.53 0.24 AVG: Pretest for Factor 1 1.79 2.92 2.27 0.20 AVG: Pretest for Factor 2 3.30 4.82 3.98 0.27 AVG: Pretest for Factor 3 6.33 8.05 7.06 0.31 AVG: Factor 1 6.77 8.59 7.63 0.31
AVG: Factor 2 12.09 14.13 13.0
7 0.30 AVG: Factor 3 6.68 8.57 7.50 0.30
CSHE Research & Occasional Paper Series
Related Documents