Self-Consolidating Concrete for Prestressed Bridge Girders Junwon Seo, PhD, PE (Assistant Professor) Eduardo Torres, EIT (Graduate Student) William Schaffer, EIT (Graduate Student) Department of Civil and Environmental Engineering South Dakota State University WisDOT ID no. 0092-15-03 July 2017

Welcome message from author
This document is posted to help you gain knowledge. Please leave a comment to let me know what you think about it! Share it to your friends and learn new things together.
Transcript

Self-Consolidating Concrete for Prestressed Bridge Girders
Junwon Seo, PhD, PE (Assistant Professor) Eduardo Torres, EIT (Graduate Student) William Schaffer, EIT (Graduate Student)
Department of Civil and Environmental Engineering South Dakota State University
WisDOT ID no. 0092-15-03
July 2017

i
Disclaimer
This research was funded through the Wisconsin Highway Research Program by the
Wisconsin Department of Transportation and the Federal Highway Administration under
Project 0092-15-03. The contents of this report reflect the views of the authors who are
responsible for the facts and accuracy of the data presented herein. The contents do not
necessarily reflect the official views of the Wisconsin Department of Transportation or the
Federal Highway Administration at the time of publication.
This document is disseminated under the sponsorship of the Department of Transportation in
the interest of information exchange. The United States Government assumes no liability for
its contents or use thereof. This report does not constitute a standard, specification or
regulation.
The United States Government does not endorse products or manufacturers. Trade and
manufacturers’ names appear in this report only because they are considered essential to the
object of the document.
ii
Technical Report Documentation Page 1. Report No. 2. Government Accession No 3. Recipient’s Catalog No
4. Title and SubtitleSelf-Consolidating Concrete for Prestressed Bridge Girders
5. Report Date
6. Performing Organization Code
7. AuthorsJunwon Seo, Eduardo Torres, and William Schaffer
8. Performing Organization Report No.
9. Performing Organization Name and AddressDepartment of Civil and Environmental EngineeringSouth Dakota State UniversityCrothers Engineering HallBrookings, SD 57007-0945
10. Work Unit No. (TRAIS)
11. Contract or Grant No.0092-15-03
12. Sponsoring Agency Name and AddressWisconsin Department of Transportation4802 Sheboygan Ave. Rm 104Madison, WI 73707-7965
13. Type of Report and Period CoveredNovember 2014 – July 2017
14. Sponsoring Agency Code
15. Supplementary NotesThis research project was funded by the Wisconsin DOT and FHWA through WHRP Program along with MPC. WisconsinDOT contact: Mr. Steve Doocy (608) 261-6063
16. AbstractThis document reports the findings of a research project designed to better understand material and structural performance ofprestressed bridge girders made with Self-Consolidating Concrete (SCC) from Wisconsin. SCC has high potential to be usedfor prestressed bridge girder construction due to exceptional workability and strength. However, many local precasters havestruggled to maintain uniformity in SCC mixtures, in order to achieve consistent, desirable performance, which are ultimateconcerns to Wisconsin Department of Transportation (WisDOT). Hence, the ultimate objective of this project was to developwidely accepted, uniform recommendations on SCC mixture design that achieves desired performance for the use of SCC inWisDOT bridge projects. To that end, this project initially investigated the effects of material constituents (e.g., cement type)on the fresh and hardened properties of trial SCC mixtures made from precastors in Wisconsin. A small group of SCC mixtureswere identified based on the experimental investigation of results, technical findings from a comprehensive literature review,and additional input from the Project Oversight Committee (POC) and a survey to several DOTs. The identified SCC mixtureswere tested at precasting plants for the evaluation of their material performance. With a detailed investigation of the results,high quality SCC mixtures were selected and used to build cylinders and prims for the evaluation of their creep and shrinkagefor a period of 280 days. Based on the investigation of the results, the most appropriate SCC mixture was selected to fabricatea full-scale SCC girder to verify structural performance, including prestress losses, transfer length, and camber. The resultsof the SCC girder were compared to those of a Conventional Concrete (CC) girder that was fabricated to be utilized as areference girder. Then, field monitoring of prestress losses of both girders that were installed in a WisDOT bridge, was madefrom its erection to deck placement. At the end of this project, recommendations for SCC mixture design were established topromote SCC in prestressed bridge girders in Wisconsin. Key findings indicate that the full-scale SCC and CC girdersexhibited the almost identical long-term camber and prestress losses, but the transfer length of SCC girder was somewhatlesser than that for the CC girder.17. Key WordsSelf-Consolidating Concrete, prestressed bridgegirder, fresh properties, hardened properties, creep,shrinkage, prestress losses, transfer length, fieldtesting
18. Distribution StatementNo restriction. This document is available to the publicthrough the National Technical Information Service5285 Port Royal RoadSpringfield VA 22161
19. Security Classif.(of this report)Unclassified
20. Security Classif. (of this page)Unclassified
21. No. of Pages 22. Price
0092-15-03
181
July 2017
Wisconsin Highway Research Program WisDOT ID NO. 0092-15-03
Self-Consolidating Concrete for Prestressed Bridge Girders
Final Report
By:
Junwon Seo Eduardo Torres William Schaffer
South Dakota State University Department of Civil and Environmental Engineering
Submitted To
Wisconsin Department of Transportation
July 2017
iii

iv
Acknowledgements
The authors thank the Wisconsin Department of Transportation (Wisconsin DOT) and the
Mountain-Plains Consortium (MPC) University Transportation Center for providing the
funding for this project. The authors wish to acknowledge the Project Oversight Committee
(POC), who put time and effort into this project: Mr. William Oliva, Mr. James Parry, Dr.
Michael Oliva, Mr. Steve Doocy, Mr. Ali Soleimanbeigi, Dr. Al Ghorbanpoor, Mr. Tim
Holien, and Ms. Rita Lederle. The authors also would like to acknowledge the collaboration
of Mr. Forrest Brunette, Mr. Chad Hemenway, Mr. Ziad Sakkal, Mr. Brian Rowekamp, Mr.
John Kaiser, and Mr. Brandon Boleen for providing the required material constituents for
testing the mixtures of each plant. The authors would like to specifically thank the University
of Wisconsin – Madison for their assistance with the creep frames, measurement equipment
for camber, and strand readings taken both at the plant and in the field. Finally, the authors
would like to thank Dr. Wehbe and Mr. Gutzmer for their guidance over the testing of creep
and shrinkage and transfer length, and Mr. Phillip Ciha for his effort in collecting the
necessary field test data.

v
Executive Summary
Self-Consolidating Concrete (SCC) is widely used in the concrete industry providing benefits
during production due to its superior workability and productivity. SCC can flow through
dense reinforcement to fill formwork without additional vibration mechanisms or possible
signs of segregation. Along with the particular benefits, various Departments of
Transportation (DOTs) have attempted to use SCC in many precast applications according
to their own guidelines regarding SCC mixture development for prestressed concrete (PSC)
bridge girders. However, local producers in Wisconsin still struggle to maintain uniformity
in terms of material properties with low segregation in the SCC mixture when transporting
and placing of SCC for PSC bridge girder production.
For the implementation of prestressed SCC girders across Wisconsin, this project was
intended to develop a SCC mixture design guideline that will serve as the basic reference
source for local precastors and bridge engineers. To accomplish this objective, this project
primarily completed the literature review to understand basic findings from a number of
technical documents related to SCC and existing SCC mixture guidelines developed by
various DOTs, development of multiple SCC mixtures made of local aggregates, and
evaluation of their fresh and hardened properties. Long-term material properties, such as
creep and shrinkage, and structural performance of a full-scale SCC girder were also
investigated. Further, a survey was sent to several DOTs to refer to existing requirements
for the implementation of SCC in PSC bridge girders.
vi
For the fresh and hardened material testing, numerous trials of SCC mixtures that were
developed using local materials from three different precasters located in Wisconsin were
completed. The precast plants participating in the project were County Materials Janesville,
County Materials Roberts and Spancrete. During the mixture design, trial mixtures were
developed to investigate parameters, such as cement content and type, aggregate size and
type, sand-to-aggregate ratio (S/Agg) and water-to-cement ratio (w/c). After initial mix
design trials, several SCC mixtures were tested in the laboratory to meet criteria established
in this project. These mixtures were at first evaluated at fresh state using the following tests:
Slump Flow, Visual Stability Index (VSI), T20, J-Ring and Column Segregation. Then,
compressive strength per mixture was tested at transfer at 18hrs and at 28 days.
Based upon the examination and discussion of the fresh and hardened testing results with the
Project Oversight Committee (POC), five SCC mixtures were selected from the mixtures
tested in the laboratory. All five mixtures were tested using production practices of each plant
in terms of mixing, curing and quality control. Each mixture was tested for fresh properties
and compressive strength at each plant, and corresponding specimens were fabricated to
examine their creep and shrinkage for 280 days. Specifically, the creep cylinders only built
at plant were loaded on a creep frame designed to sustain a load of 2000psi throughout the
testing period, and the shrinkage specimens were made at both the plant and laboratory. Any
negative effects of the environment during transportation of the specimens and curing
conditions between the plant and laboratory on the creep and shrinkage per mixture were
investigated.
vii
After 28 days of the creep and shrinkage monitoring, one mixture was selected to cast a full-
scale prestressed SCC girder to monitor structural performance. A conventional concrete (CC)
girder with the similar target compressive strength was also fabricated as a control specimen.
Afterward, prestress losses and camber for both the SCC and CC girders were monitored in
the precast yard for 161 days, and their transfer lengths were measured for 28 days. It was
recommended that both the girders be implemented on a bridge, which is a part of on-going
Wisconsin DOT Zoo Interchange Bridge projects. Prestress losses were also recorded during
construction of the bridge, including the girder erection and deck placement.
From the results of this project, it can be concluded that the precasters in Wisconsin have the
ability to develop reliable SCC mixtures enabling them to meet performance criteria
established in other states or specified by WisDOT. A quality control guideline was
recommended to the WisDOT to assess the performance of SCC mixtures based on the fresh
properties material testing. In terms of creep and shrinkage, mixture parameters such as
S/Agg and cement type were identified to have more effect on changes in length due to creep
and shrinkage effects.
Full-scale girders exhibited similar characteristics between SCC and CC. Transfer length was
observed to be higher for the CC girder. Camber results showed that both the SCC and CC
girders had same final values, but the SCC girder started out with a lower camber value than
the CC girder. The prestress losses showed interesting results, with a climbing value until
day 161, when the girders were placed on site. At this point, the prestress losses began
declining until they each reached a final value within 0.3% of each other. It can be concluded
that the prestress losses for both girders can be expected to settle at an almost identical final

viii
value, despite the CC girder experiencing a 17% higher elastic shortening value than the SCC
girder.
ix
Table of Contents
1. Introduction .................................................................................................................... 1
1.1 Background and Problem Statement ......................................................................... 2
1.2 Objectives .................................................................................................................. 5
1.3 Project Scope and Organization ................................................................................ 5
2. Comprehensive Literature Review ................................................................................ 7
2.1 Historical Perspectives on SCC ................................................................................. 7
2.2 Overview of Key SCC Constituents .......................................................................... 9
2.2.1 Cement ............................................................................................................... 9
2.2.2 Fillers ................................................................................................................. 9
2.2.3 Coarse Aggregate ............................................................................................ 10
2.2.4 Admixtures ...................................................................................................... 11
2.3 SCC Mixture Properties .......................................................................................... 13
2.3.1 Fresh Properties ............................................................................................... 13
2.3.2 Hardened Properties ........................................................................................ 17
2.3.2.1 Compressive Strength ....................................................................... 17
2.3.2.2 Modulus of Elasticity ....................................................................... 18
2.3.3 Time Dependent Material Characteristics ....................................................... 19
2.3.3.1 Shrinkage .......................................................................................... 19
2.3.3.2 Creep ................................................................................................. 21
2.4 Structural Performance ............................................................................................ 23
2.4.1 Transfer Length ............................................................................................... 23
2.4.1.1 Codified Equations ........................................................................... 24
2.4.1.2 Test Interpretation............................................................................. 25
2.4.2 Prestress Losses ............................................................................................... 26
2.4.2.1 Overview .......................................................................................... 26
2.4.2.2 AASHTO LRFD Specifications ....................................................... 28
2.4.2.3 PCI Design Handbook Method ........................................................ 29
2.4.3 Camber ............................................................................................................ 32
x
3. Results and Discussion on DOT Survey ...................................................................... 34
3.1 SCC Mixture Parameters ......................................................................................... 35
3.2 Fresh Property Requirements .................................................................................. 38
4. Wisconsin Precast Concrete Plant Identification ......................................................... 40
5. SCC Mixture Design and Laboratory Material Testing ............................................... 41
5.1 Material Properties .................................................................................................. 41
5.2 Workability and Strength Performance Criteria ...................................................... 44
5.3 Laboratory SCC Mixtures ....................................................................................... 44
5.3.1 Mixing and Curing Procedures ........................................................................ 45
5.3.2 Stage One ......................................................................................................... 46
5.3.2.1 Results of Stage One ........................................................................ 48
5.3.3 Stage Two ........................................................................................................ 54
5.3.3.1 Results of Stage Two ........................................................................ 55
5.4 Plant Mixtures ......................................................................................................... 57
5.4.1 Curing .............................................................................................................. 58
5.4.2 Results ............................................................................................................. 60
6. Time-Dependent SCC Material Characteristics .......................................................... 62
6.1 Creep ....................................................................................................................... 62
6.1.1 Testing Setup ................................................................................................... 62
6.1.2 Creep Measurement ......................................................................................... 63
6.1.3 Results and Discussion .................................................................................... 64
6.1.4 Comparison with Codified Creep .................................................................... 67
6.2 Shrinkage ................................................................................................................. 70
6.2.1 Testing Setup ................................................................................................... 70
6.2.2 Shrinkage Measurement .................................................................................. 71
6.2.3 Results and Discussion .................................................................................... 72
6.2.4 Comparison with Codified Shrinkage ............................................................. 76
6.3 Discussion for Final Mixture Selection ................................................................... 80
7. Full-Scale Testing of SCC and CC girders .................................................................. 81
7.1 Girder Details .......................................................................................................... 81
7.2 Instrumentation ........................................................................................................ 82
xi
7.2.1 Strain Gages ..................................................................................................... 83
7.2.2 Vibrating-Wire Gages...................................................................................... 88
7.2.3 Camber ............................................................................................................ 90
7.3 Transfer Length ....................................................................................................... 91
7.4 Prestress Losses ....................................................................................................... 94
7.5 Camber .................................................................................................................. 102
8. Recommendations for SCC Girder Implementation .................................................. 104
8.1 SCC Mixture Design Specification ....................................................................... 104
8.2 Recommendations for SCC Girder Implementation ............................................. 105
9. Summary, Conclusions, and Future Work ................................................................. 107
9.1 Summary and Conclusions .................................................................................... 107
9.2 Future Work .......................................................................................................... 115
References ...................................................................................................................... 116
Appendix A .................................................................................................................... 121
Appendix B .................................................................................................................... 133
Appendix C .................................................................................................................... 141
Appendix D .................................................................................................................... 147
Appendix E .................................................................................................................... 163
xii
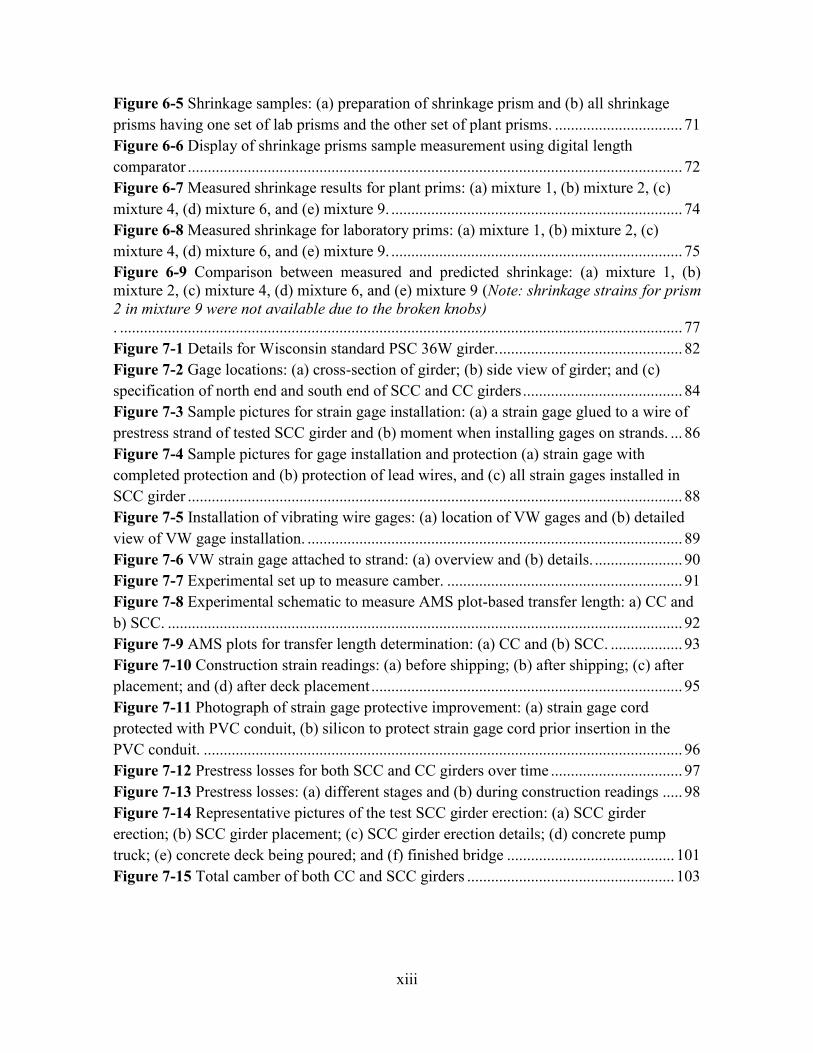
List of Figures
Figure 1-1 Sample photographs obtained through SCC project: (a) laboratory slump testing; (b) field column segregation testing; (c) fabrication at plant; and (d) implementation on bridge site .......................................................................................................................... 2 Figure 1-2 Visual side-by-side comparison of SCC and CC girders at the precast plant where both girders have been fabricated through this project ................................................ 3 Figure 2-1 Slump comparison between SCC and normal concrete (Wehbe et al. 2007): (a) SCC slump flow test and (b) slump test for normal concrete ............................................... 14 Figure 2-2 J-Ring test. ......................................................................................................... 15 Figure 2-3 L-box test (Wehbe et al. 2009). ......................................................................... 16 Figure 2-4 Column segregation test ..................................................................................... 17 Figure 2-5 Shrinkage test setup: (a) HM-250D length comparator and (b) SCC prism specimen ............................................................................................................................... 20 Figure 2-6 Creep frame setup (Oliva and Cramer 2008): (a) creep frame and (b) chucks location at one end. ............................................................................................................... 22 Figure 2-7 Sample AMS method (Russell and Burns 1993). .............................................. 26 Figure 2-8 Stress in strands over time (Tadros et al. 2003) ................................................. 27 Figure 3-1 Percent of DOTs that approve the range of maximum w/c ratio ....................... 36 Figure 3-2 Percent of DOTs that approve the use of fillers for a SCC mixture used in prestressed bridge girders ..................................................................................................... 37 Figure 5-1 Types of aggregate: (a) Janesville crushed limestone; (b) Roberts crushed limestone; and (c) Spancrete river gravel. ............................................................................ 43 Figure 5-2 Drum used to mix SCC ...................................................................................... 45 Figure 5-3 Water bath to simulate steam curing of SCC cylinders ..................................... 46 Figure 5-4 Slump flow results for Janesville and Roberts mixtures .................................... 50 Figure 5-5 Passing ability results for Janesville and Roberts mixtures ............................... 52 Figure 5-6 Segregation results for Janesville and Roberts mixtures ................................... 53 Figure 5-7 Compressive strength at transfer ........................................................................ 54 Figure 5-8 Creep samples placed adjacent to girder bed for steam curing .......................... 54 Figure 5-9 Steam curing regime: (a) Roberts and Janesville and (b) Spancrete with standard regime..................................................................................................................... 60 Figure 6-1 Creep test setup: (a) loaded creep frame and (b) cylinder with brass inserts on both sides .............................................................................................................................. 63 Figure 6-2 Representative pictures of creep samples: (a) all creep frames and (b) measurement taken on creep frame ...................................................................................... 64 Figure 6-3 Measured creep up to 280 days: (a) mixture 1, (b) mixture 2, (c) mixture 4, (d) mixture 6, and (e) mixture 9 ................................................................................................. 66 Figure 6-4 Comparison between measured and predicted creep coefficients: (a) mixture 1, (b) mixture 2, (c) mixture 4, (d) mixture 6, and (e) mixture 9. ............................................ 68
xiii
Figure 6-5 Shrinkage samples: (a) preparation of shrinkage prism and (b) all shrinkage prisms having one set of lab prisms and the other set of plant prisms. ................................ 71 Figure 6-6 Display of shrinkage prisms sample measurement using digital length comparator ............................................................................................................................ 72 Figure 6-7 Measured shrinkage results for plant prims: (a) mixture 1, (b) mixture 2, (c) mixture 4, (d) mixture 6, and (e) mixture 9. ......................................................................... 74 Figure 6-8 Measured shrinkage for laboratory prims: (a) mixture 1, (b) mixture 2, (c) mixture 4, (d) mixture 6, and (e) mixture 9. ......................................................................... 75 Figure 6-9 Comparison between measured and predicted shrinkage: (a) mixture 1, (b) mixture 2, (c) mixture 4, (d) mixture 6, and (e) mixture 9 (Note: shrinkage strains for prism 2 in mixture 9 were not available due to the broken knobs) . ............................................................................................................................................. 77 Figure 7-1 Details for Wisconsin standard PSC 36W girder. .............................................. 82 Figure 7-2 Gage locations: (a) cross-section of girder; (b) side view of girder; and (c) specification of north end and south end of SCC and CC girders ........................................ 84 Figure 7-3 Sample pictures for strain gage installation: (a) a strain gage glued to a wire of prestress strand of tested SCC girder and (b) moment when installing gages on strands. ... 86 Figure 7-4 Sample pictures for gage installation and protection (a) strain gage with completed protection and (b) protection of lead wires, and (c) all strain gages installed in SCC girder ............................................................................................................................ 88 Figure 7-5 Installation of vibrating wire gages: (a) location of VW gages and (b) detailed view of VW gage installation. .............................................................................................. 89 Figure 7-6 VW strain gage attached to strand: (a) overview and (b) details. ...................... 90 Figure 7-7 Experimental set up to measure camber. ........................................................... 91 Figure 7-8 Experimental schematic to measure AMS plot-based transfer length: a) CC and b) SCC. ................................................................................................................................. 92 Figure 7-9 AMS plots for transfer length determination: (a) CC and (b) SCC. .................. 93 Figure 7-10 Construction strain readings: (a) before shipping; (b) after shipping; (c) after placement; and (d) after deck placement .............................................................................. 95 Figure 7-11 Photograph of strain gage protective improvement: (a) strain gage cord protected with PVC conduit, (b) silicon to protect strain gage cord prior insertion in the PVC conduit. ........................................................................................................................ 96 Figure 7-12 Prestress losses for both SCC and CC girders over time ................................. 97 Figure 7-13 Prestress losses: (a) different stages and (b) during construction readings ..... 98 Figure 7-14 Representative pictures of the test SCC girder erection: (a) SCC girder erection; (b) SCC girder placement; (c) SCC girder erection details; (d) concrete pump truck; (e) concrete deck being poured; and (f) finished bridge .......................................... 101 Figure 7-15 Total camber of both CC and SCC girders .................................................... 103
xiv
List of Tables
Table 2-1 Suggested cement replacement percent ............................................................... 10 Table 2-2 Test methods for SCC fresh properties ............................................................... 14 Table 2-3 Factors to calculate relaxation of strand. ............................................................. 31 Table 2-4 C factor for strand or wire ................................................................................... 32 Table 2-5 PCI (2010) recommended factors for long-term camber .................................... 33 Table 3-1 Information provided by state DOTs ................................................................... 34 Table 3-2 SCC fresh property requirements for surveyed state DOTs ................................ 39 Table 5-1 Materials used for the production of prestressed SCC girders for all the plants . 42 Table 5-2 Workability criteria for SCC mixtures. ............................................................... 44 Table 5-3 Mixture parameters and corresponding values .................................................... 47 Table 5-4 Test matrix for stage one ..................................................................................... 48 Table 5-5 Stage one results .................................................................................................. 49 Table 5-6 Test matrix for stage two ..................................................................................... 55 Table 5-7 Results of stage two ............................................................................................. 56 Table 5-8 Mixture proportions for plant testing .................................................................. 57 Table 5-9 Fresh and hardened properties results of plant testing ........................................ 61 Table 6-1 Average creep strain change over time ............................................................... 65 Table 6-2 Measured and predicted creep coefficients at 28 and 280 days .......................... 69 Table 6-3 Comparison of average shrinkage between plant and laboratory prisms at 28 and 280 days. ............................................................................................................................... 76 Table 6-4 Percent difference between measured and codified shrinkage values using RH of 0.4 and 0.45. ......................................................................................................................... 78 Table 6-5 Summary of creep and shrinkage for all five tested mixtures at 28 days ............ 80 Table 7-1 SCC and CC Girder Mixture Details ................................................................... 81 Table 7-2 Transfer length results ......................................................................................... 92 Table 7-3 Overall prestress losses development ............................................................... 102 Table 7-4 Variation in camber for both measured and calculated (using Eq. 2.15) values for SCC and CC girders ........................................................................................................... 103

xv
1
1. Introduction
SCC has a high potential to increase production of PSC girder bridges due to its better
workability, quality, and durability compared to CC. With these benefits, several State DOTs
have successfully used SCC in PSC girder bridges according to their own guidelines on SCC
materials, mixture design and fresh and hardened properties. However, such guidelines do
not exist, specific to SCC, supplied by local precasters to the WisDOT, resulting in difficulty
using SCC in the state of Wisconsin. Therefore, this project aimed to develop a SCC mixture
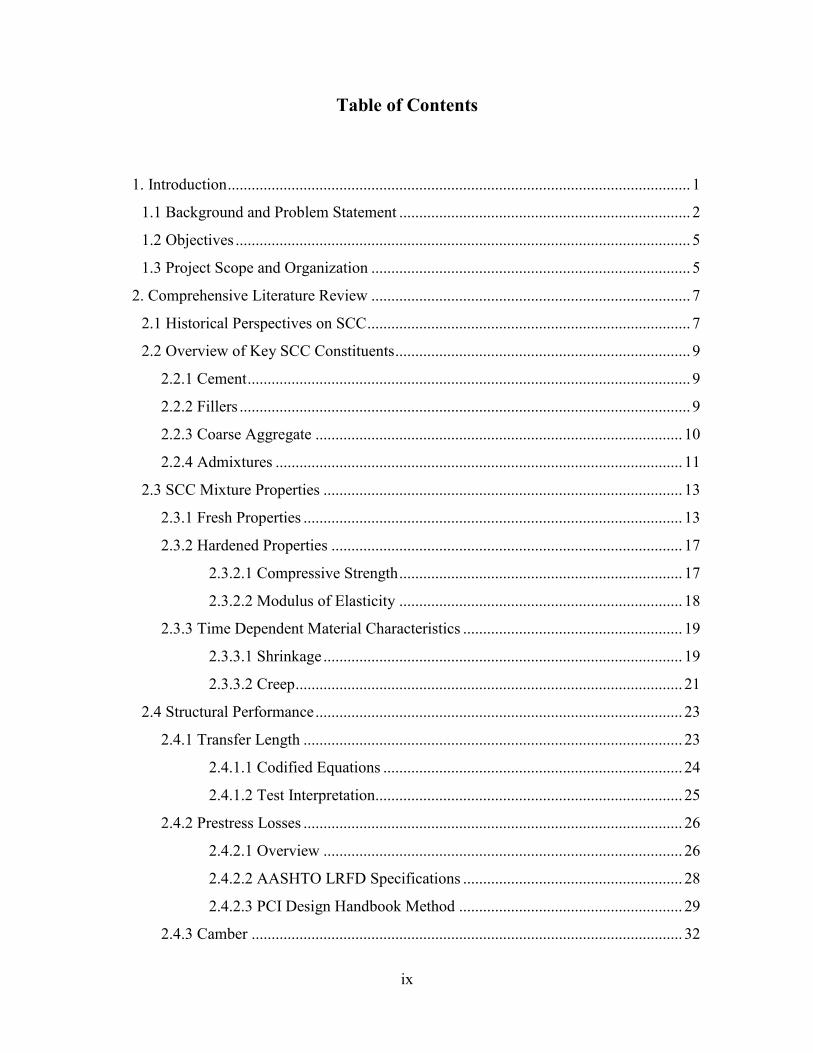
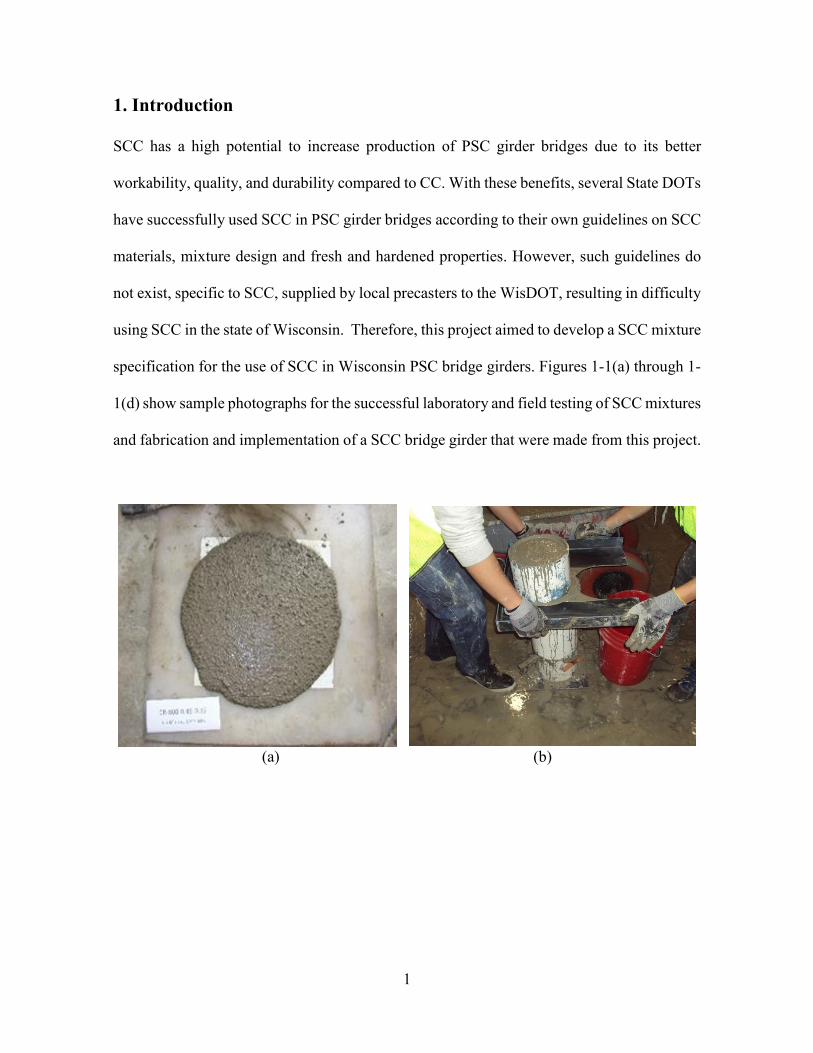
specification for the use of SCC in Wisconsin PSC bridge girders. Figures 1-1(a) through 1-
1(d) show sample photographs for the successful laboratory and field testing of SCC mixtures
and fabrication and implementation of a SCC bridge girder that were made from this project.
(a) (b)
2
(c) (d) Figure 1-1 Sample photographs obtained through SCC project: (a) laboratory slump testing; (b) field column segregation testing; (c) fabrication at plant; and (d) implementation onbridge site
1.1 Background and Problem Statement
SCC was initially developed in the 1980s in Japan (Okamura and Ouchi 1999). SCC is
capable of smoothly taking formwork shapes, and easily passing through congested
reinforcing bars with no vibration efforts. These benefits make it a more practical material
when compared to normal concrete, making it a “smart concrete” (Shamsad et al. 2014). SCC
is also able to improve workability and economic efficiency under severe environmental
conditions. These features are demonstrated by reducing labor, shortening of the construction
time, eliminating vibration and noise hazards, simplifying the placing process and better
finishing (Skarendahl 2003). In particular, SCC has a certain benefit of providing
significantly improved surfaces without small holes referring to as “bug holes” and other
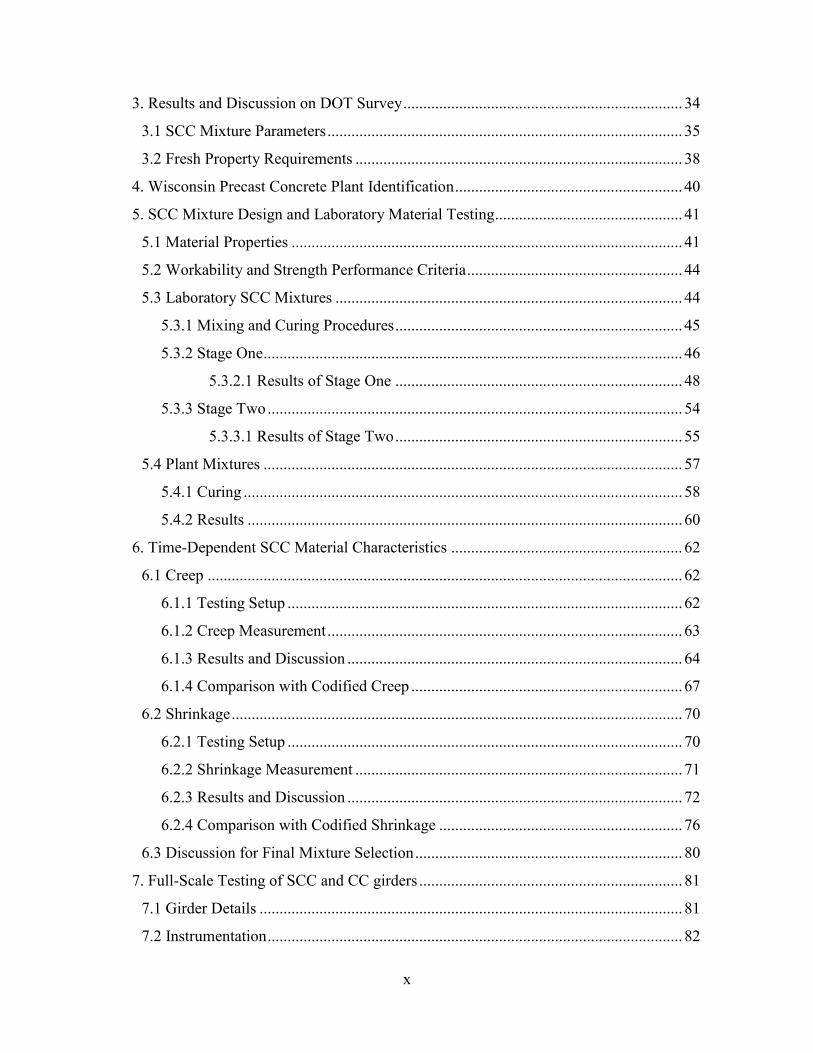
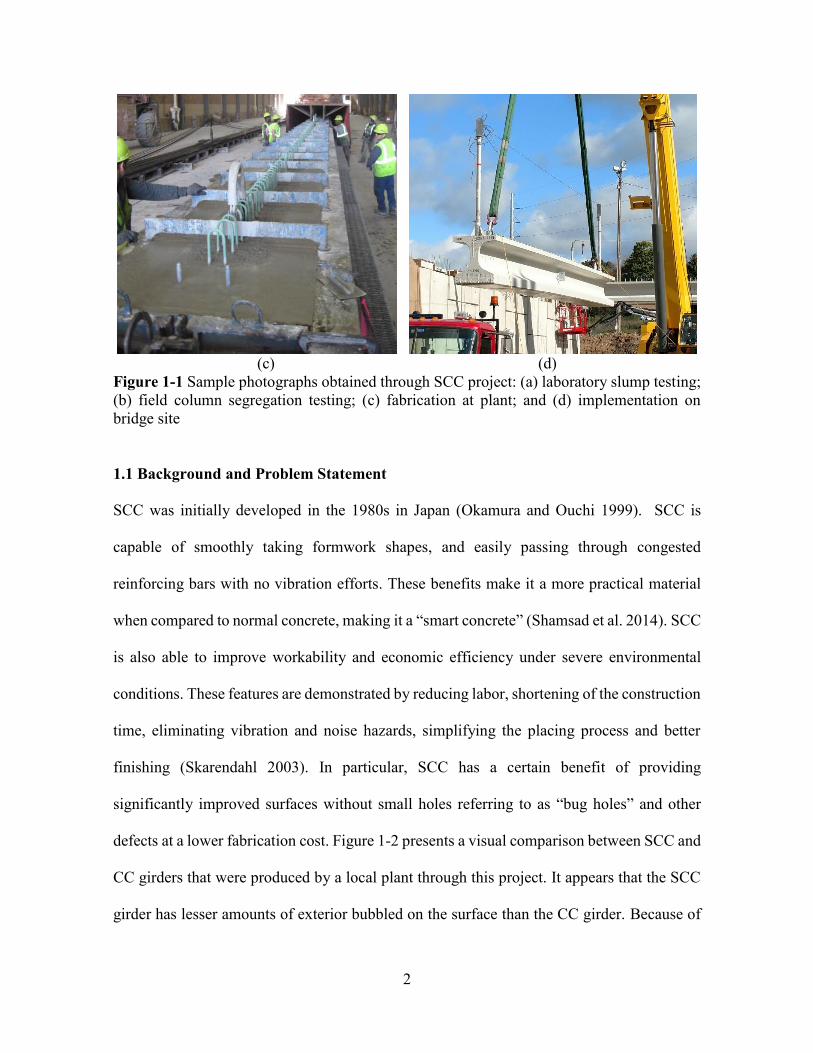
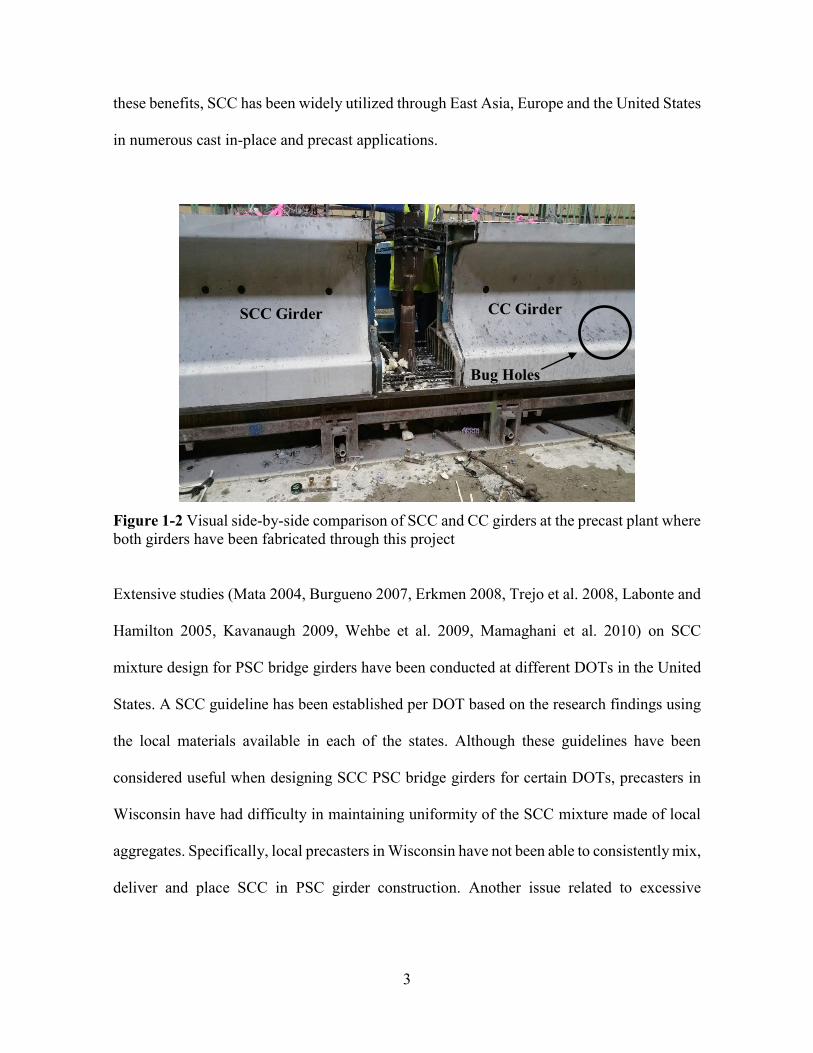
defects at a lower fabrication cost. Figure 1-2 presents a visual comparison between SCC and
CC girders that were produced by a local plant through this project. It appears that the SCC
girder has lesser amounts of exterior bubbled on the surface than the CC girder. Because of
3
these benefits, SCC has been widely utilized through East Asia, Europe and the United States
in numerous cast in-place and precast applications.
Figure 1-2 Visual side-by-side comparison of SCC and CC girders at the precast plant where both girders have been fabricated through this project
Extensive studies (Mata 2004, Burgueno 2007, Erkmen 2008, Trejo et al. 2008, Labonte and
Hamilton 2005, Kavanaugh 2009, Wehbe et al. 2009, Mamaghani et al. 2010) on SCC
mixture design for PSC bridge girders have been conducted at different DOTs in the United
States. A SCC guideline has been established per DOT based on the research findings using
the local materials available in each of the states. Although these guidelines have been
considered useful when designing SCC PSC bridge girders for certain DOTs, precasters in
Wisconsin have had difficulty in maintaining uniformity of the SCC mixture made of local
aggregates. Specifically, local precasters in Wisconsin have not been able to consistently mix,
deliver and place SCC in PSC girder construction. Another issue related to excessive
SCC Girder CC Girder
Bug Holes
4
segregation of wet batches during placements have been also observed during a previous
field trial of SCC in PSC girders in Wisconsin (Torres and Seo, 2016).
In addition to these concerns, insufficiently demonstrated data on time-dependent material
characteristics for SCC such as creep and shrinkage have caused WisDOT to not allow the
use of SCC in PSC bridge girders. In fact, the overall structural performance of PSC girders
directly relies on creep and shrinkage with fresh and hardened material properties. SCC
mixtures have commonly consisted of higher paste volumes, smaller maximum size of
aggregate (MSA), lower coarse aggregate volume, and higher ratio of minimum amount of
coarse or fine aggregates, S/Agg compared to CC (Kim et al. 2011). Due to the SCC mixture
design with different material constituent proportioning, it can develop different values of
creep and shrinkage compared to CC, which can substantially affect structural performance
of prestressed SCC bridge girders over time.
As mentioned above, the lack of sufficient test data on fresh and hardened material properties,
shrinkage, and creep of PSC girders related to time-dependent prestress losses has impeded
the use of SCC in PSC girders in the State of Wisconsin. Although the previous projects done
by several DOTs have attempted to use SCC in actual PSC girders based on their own state
guidelines, there have been no specific recommendations for WisDOT that can be established
with substantiated data through the laboratory and field testing with SCC mixtures made of
local aggregates. Hence, a widely accepted, uniform guideline for SCC mixture design that
achieves desired performance for use in prestressed girders for WisDOT should be at first
developed for improving efficiency and safety in its construction. To avoid overestimating
or underestimating prestress losses of SCC girders to be made based upon the recommended

5
mixture guideline, an accurate estimation of creep and shrinkage behavior along with
understanding its long-term behavior of SCC in terms of prestress losses are needed.
1.2 Objectives
The ultimate objective of this project was to develop a SCC mix design guideline that serves
as the basis for the use of SCC in PSC girders on WisDOT bridge projects. Effects of various
SCC mixture constituents on the fresh, hardened, and time-dependent material characteristics
and long-term structural behavior of a full-scale prestressed SCC girder used on the actual
PSC WisDOT bridge project were also examined.
1.3 Project Scope and Organization
To achieve the aforementioned objectives, the following tasks were undertaken in this work:
1) Conduct comprehensive literature review of the state of the art and practice in
development of SCC mixture design and fresh, hardened, and time-dependent material
properties
2) Survey for various DOTs to determine practical limits for fresh and hardened properties
of SCC
3) Identify suppliers for prestressed SCC girder in Wisconsin
4) Conduct laboratory and field examination of SCC material characteristics
5) Develop SCC design recommendation and guidance
6) Implementation and field monitoring of SCC bridge girder
7) Prepare final report and submission along with closeout presentation

6
This project is divided into nine sections. Section 2 is dedicated to research findings from the
literature review in SCC material characteristics necessary for SCC mixture design and
material testing. Section 3 deals with a summary of different state DOT survey responses and
specifications specific to the SCC mixture. Section 4 provides the information for the
identified precast concrete plants in Wisconsin. Section 5 details SCC mixture design with
local fine and coarse aggregates and laboratory testing of selected SCC mixtures to determine
their fresh and hardened material characteristics. Section 6 is devoted to results and
discussion on the creep and shrinkage from the field and/or laboratory testing of the selected
SCC mixtures. Section 7 provides overview and findings from full-scale testing of SCC
girder to capture transfer length and prestress losses and its field extended monitoring after
placing the girder on an actual bridge. Section 8 gives SCC mixture design guidance and
recommendations on the implementation of SCC girders. Finally, Section 9 contains a
summary, conclusions, and future work.
7
2. Comprehensive Literature Review
The literature review was structured into four sections: Section 2.1 provides a background
for the historical perspectives on SCC; Section 2.2 presents an overview of key SCC
constituents and relevant research findings to achieve adequate material performance;
Section 2.3 details mixture property testing required for the investigation of fresh and
hardened properties, modulus of elasticity, shrinkage and creep; and Section 2.4 is dedicated
to the structural performance of SCC and existent codes for the prediction of transfer length,
camber and prestress losses.
2.1 Historical Perspectives on SCC
SCC that was first developed in the 1980s in Japan has broadly expanded through a few
decades across Europe and North America (Okamura and Ouchi 1999). SCC has exhibited
superior workability compared to CC, creating potential to increase precast production and
growth, especially for production of PSC bridge girders (Wehbe et al. 2009). Achieving the
SCC desired performance by material testing of SCC is necessary for more efficient SCC
construction. Specifically, adequate flowability, good passing and filling abilities, proper
segregation resistance, and stability are required to satisfy the fresh property requirements.
The required properties can be achieved by properly proportioning the constituent materials
and admixtures (Erkmen et al. 2008). Note that flowability and passing-ability can be defined
as the ability to flow through tight openings, such as spaces between reinforcing bars, under
its own weight (Wehbe et al. 2009). If the concrete does not possess adequate passing-ability,
it results in a non-uniform structure, caused by blockage of coarse aggregate between
reinforcing bars.
8
SCC, compared to high strength concrete and ordinary concrete, is much more prone to
segregation (Bonen and Shah 2004). It is worthwhile to note that segregation resistance is
defined as the distribution of aggregate particles in the concrete that is relatively equivalent
at all locations (Turkel and Kandemir 2010). A lack of segregation resistance might be caused
by internal and external bleeding of water associated with differential accumulation of light
ingredients and air voids. Segregation can also result in settling of the aggregates on the
bottom of the paste. The segregation resistance varies depending on three main factors: 1)
the viscosity of the cement, 2) the difference in the specific densities of cement and aggregate,
and 3) the particle size of the aggregates (Bonen and Shah 2004). Desired segregation
resistance is achieved by using high powder (cement and fillers) content, Viscosity
Modifying Admixtures (VMA), or a combination of the two admixtures (Bonen and Shah
2004 and Berke et al. 2003). SCC is susceptible to segregation at higher w/c ratios due to the
decrease in viscosity on the mix.
Stability is of high importance in SCC, for which fresh and hardened methods are used for
quality control of the mix. There are two types of stability characteristics: dynamic and static
stability. Dynamic stability describes the resistance of the concrete to the separation of the
constituents during transport, placement, and spread into the formwork. Static stability refers
to the resistance of the concrete to bleeding, segregation, and surface settlement after casting
until the beginning of setting (Long et al. 2014). The stability of SCC can be enhanced by
incorporating fine materials such as limestone powder, slag cement, fly ash, and microsilica
fume. The use of such powders can enhance the grain-size distribution and the particle
packing ensuring greater cohesiveness (Sonebi et al. 2007).
9
2.2 Overview of Key SCC Constituents
SCC constituents are proportioned according to the type of SCC needed. Three types of SCC
can be produced: powder-type, VMA-type, and combination-type (Wehbe et al. 2009). The
powder type SCC is characterized by the large amounts of powder which is usually in the
range of 925 to 1095 lb/yrd3. In the VMA-type the powder content is in a lower range of 590
to 760 lb/yrd3. In the combination type of SCC, the powder content is between the previous
two ranges at 760 to 925 lb/yrd3 (Burgueno and Bendert 2007). The key constituents of SCC
include coarse aggregate, fine aggregate, cement, and water along with admixtures. This
section is devoted to a description of characteristics on each constituent and relevant research
findings for prestressed SCC bridge girders.
2.2.1 Cement
Cement types that are in use for SCC vary for each state and precaster. According to the
American Society of Testing Materials (ASTM) C150 (ASTM 2016), Portland cement can
be classified into five types: Type I, Type II, Type III, Type IV, and Type V. Types I, II, and
III are employed to produce SCC for the casting of PSC girders across regions in the United
States (Wehbe et al. 2007). Type I is used when special properties of other cements are not
necessary. Type II is utilized when moderate sulfate resistance or adequate heat of hydration
are desired. Type III is used when high early strength is desired (ASTM C150).
2.2.2 Fillers
Fillers may be added to enhance a certain concrete property or reduce the amount of cement
required (Wehbe et al. 2009); thus, fillers are used as additional components or to be replaced
with some of the cement in a concrete mix. Most common fillers used for SCC mix include
10
fly ash, ground granulated blast-furnace slag, silica fume, and limestone powder. Technical
benefits of using fillers are: increase in early strength and bleeding control, improvement of
the concrete workability, deformability, viscosity, and reduction of porosity (Shamsad et al.
2014). Workability improves as a result of the reduction of internal friction between the
particles (Sonebi et al. 2007). Reduction in friction is achieved by increasing the distance
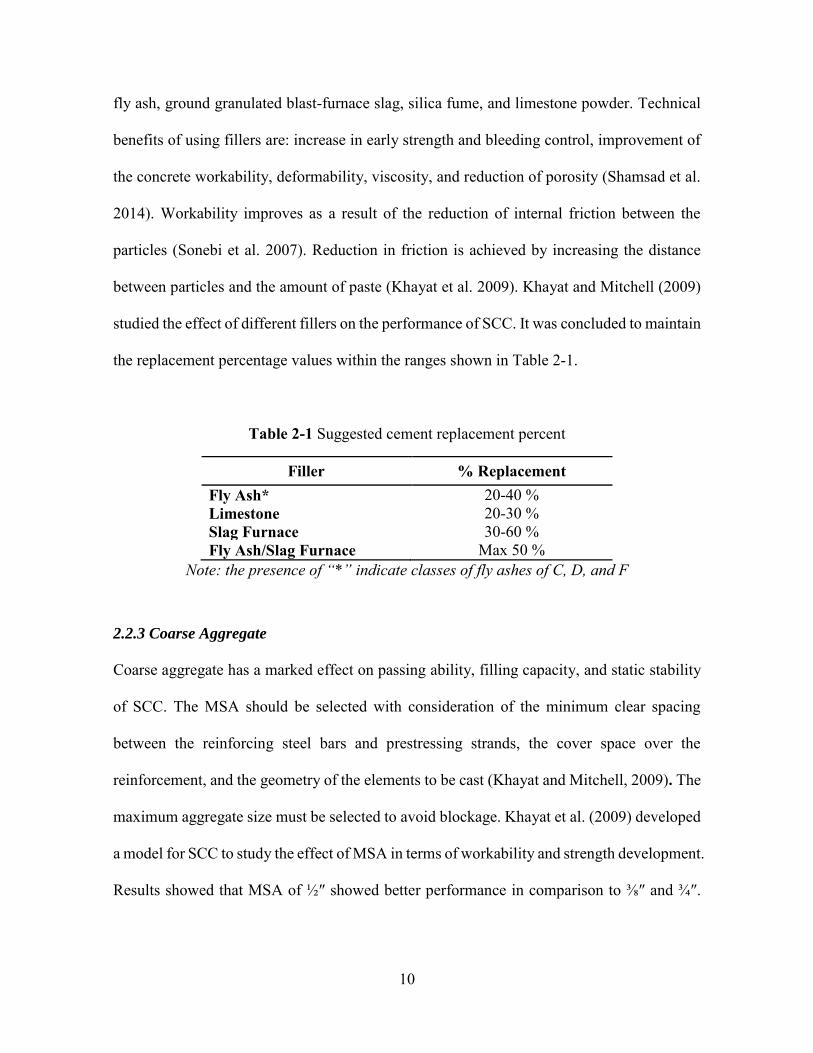
between particles and the amount of paste (Khayat et al. 2009). Khayat and Mitchell (2009)
studied the effect of different fillers on the performance of SCC. It was concluded to maintain
the replacement percentage values within the ranges shown in Table 2-1.
Table 2-1 Suggested cement replacement percent
Filler % Replacement Fly Ash* 20-40 % Limestone 20-30 % Slag Furnace 30-60 % Fly Ash/Slag Furnace Max 50 %
Note: the presence of “*” indicate classes of fly ashes of C, D, and F
2.2.3 Coarse Aggregate
Coarse aggregate has a marked effect on passing ability, filling capacity, and static stability
of SCC. The MSA should be selected with consideration of the minimum clear spacing
between the reinforcing steel bars and prestressing strands, the cover space over the
reinforcement, and the geometry of the elements to be cast (Khayat and Mitchell, 2009). The
maximum aggregate size must be selected to avoid blockage. Khayat et al. (2009) developed
a model for SCC to study the effect of MSA in terms of workability and strength development.
Results showed that MSA of ½″ showed better performance in comparison to ⅜″ and ¾″.

11
Khayat et al. (2009) recommended that the coarse aggregate size for SCC be between ⅜″ and
½″, but not to exceed ¾″.
2.2.4 Admixtures
Admixtures are ingredients in a concrete mixture other than Portland cement, water, and
aggregates that are added to the mixture immediately before or during mixing (Pellerin et al.
2005). Admixtures can be classified by function as indicated below:
1. Air-entraining admixtures 2. Water-reducing admixtures
3. Plasticizers 4. Accelerating admixtures
5. Retarding admixtures 6.Hydration-control admixtures
7. Corrosion inhibitors 8. Shrinkage reducers
9. Alkali-silica reactivity inhibitors 10. Coloring admixtures
Air entraining admixtures are added to freshly mixed SCC to raise the air content. The main
goal of increasing the air content in a concrete mixture is to improve durability. The amount
of air in the fresh mix can increase in the short term, but decrease gradually over longer
periods of time. The addition of air entraining admixtures can improve workability,
cohesiveness, segregation, and bleeding resistance and decrease strength by 10-20 %
(Mindess et al. 2003).
High Range Water Reducing (HRWR) admixtures, also called plasticizers, are used to
achieve high flowability. HRWR admixtures are added in small amounts to freshly mixed
SCC to improve the workability for a short period of time. HRWR admixtures typically have
12
a workability window of 30-60 minutes. These admixtures are added to decrease the water
demand of concrete and create fluidity in the mix (Kosmatka et al. 2002). Fluidity in the mix
is achieved by neutralizing the surface charge of the cement particles. Once the particles have
the same charge, the particles are able to repel each other throughout the water. As particles
are more evenly dispersed, more water is used to hydrate the cement. As a result of the
particle dispersion, HRWR admixtures can make mixes with lower w/c ratio to have
acceptable flowability and higher strength (EFNARC 2006). Some relevant studies
conducted by Erkmen et al. (2008) and Wehbe et al. (2009) have shown that plasticizers can
increase the compressive strength of concrete by 10-25 %.
VMAs are high molecular weight polymers, which increase the viscosity of the mix, to the
extent where there is no need to reduce the water content. Consequently, the VMAs are able
to reduce segregation and bleeding. However, VMAs are not auxiliary for poor quality
constituents or mixture design. According to European Federation of National Associations
Representing for Concrete (EFNARC 2006), potential benefits of using VMA are the
following:
Less sensitive to variations in the moisture content of the aggregate;
Lower powder content;
Reduction in the level of production control;
Allows more fluid mixes to be used without the risk of segregation;
Improved placing rate; and
Better surface appearance.
13
2.3 SCC Mixture Properties
With an increase in demand of SCC in various structures, SCC test methods were established
to determine workability of freshly mixed SCC and its hardened properties along with time-
dependent material characteristics. The majority of the test methods, such as slump flow and
column segregation testing, were provided by ASTM. Precast/Prestressed Concrete Institute
(PCI) has also developed guidelines for SCC test methods and mixing procedures (PCI 2003).
Detailed information on each method with relevant findings gained from literature review is
presented in the following subsections.
2.3.1 Fresh Properties
As mentioned previously, there are three key characteristics of SCC in the fresh state: filling
ability, passing ability, and resistance to segregation or stability. Filling ability is the ability
of concrete to fill the form with its own weight, while passing ability is the ability of fresh
concrete to flow through congested spaces between strands or reinforcement without
segregation or blocking. Resistance to segregation or stability is the ability to maintain a
homogeneous composition without bleeding in the fresh state (Trejo et al. 2008). Fresh tests
used to determine these characteristics include Slump Flow, Visual Stability Index (VSI), J-
Ring, L-Box and Column Segregation. Table 2-2 shows what fresh tests are used for each
fresh property. All the tests have standard test guidelines from the ASTM (Mata 2004) with
the exception of L-Box which is included in the Interim Guidelines written by PCI (PCI
2003).
14
Table 2-2 Test methods for SCC fresh properties
Test Methods Fresh Properties
Slump Flow (ASTM C 1611) Filling Ability
L-Box (PCI), J-Ring (ASTM C 1621) Passing Ability
VSI (ASTM C 1611) Column Segregation (ASTM C 1610) Segregation Resistance
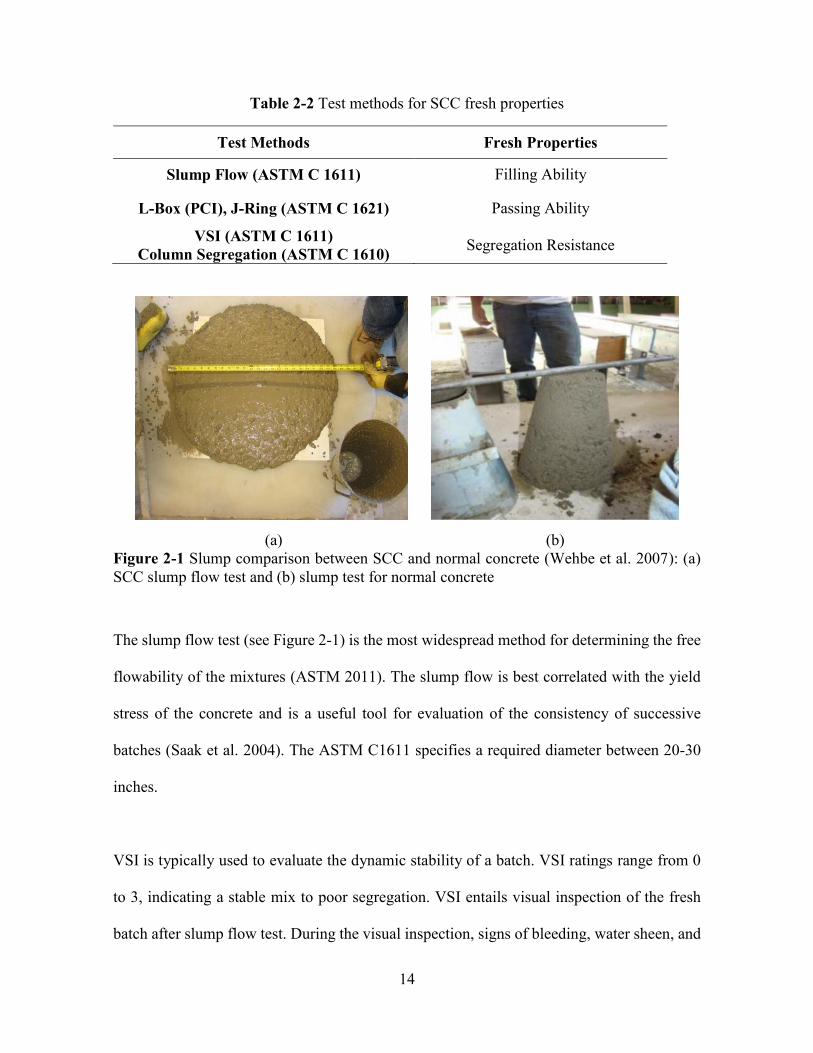
(a) (b) Figure 2-1 Slump comparison between SCC and normal concrete (Wehbe et al. 2007): (a) SCC slump flow test and (b) slump test for normal concrete
The slump flow test (see Figure 2-1) is the most widespread method for determining the free
flowability of the mixtures (ASTM 2011). The slump flow is best correlated with the yield
stress of the concrete and is a useful tool for evaluation of the consistency of successive
batches (Saak et al. 2004). The ASTM C1611 specifies a required diameter between 20-30
inches.
VSI is typically used to evaluate the dynamic stability of a batch. VSI ratings range from 0
to 3, indicating a stable mix to poor segregation. VSI entails visual inspection of the fresh
batch after slump flow test. During the visual inspection, signs of bleeding, water sheen, and
15
conglomeration of aggregate are used as signs to determine the VSI rating as described in
ASTM C1611 (ASTM 2011). According to the ACI regulations (ACI 2007), VSI is a
subjective test that can be used by precasters in quality control of the SCC mix. VSI provides
a visual image of the distribution of aggregates and the presence of bleeding throughout the
mix (PCI 2003).
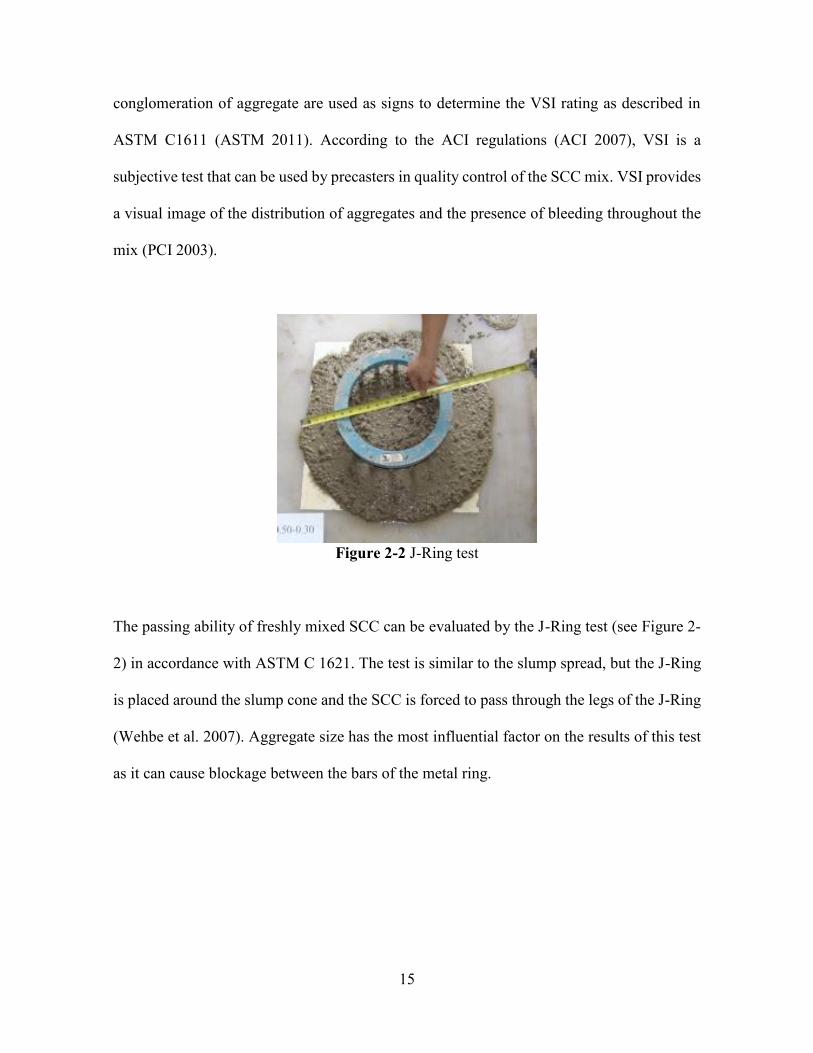
Figure 2-2 J-Ring test
The passing ability of freshly mixed SCC can be evaluated by the J-Ring test (see Figure 2-
2) in accordance with ASTM C 1621. The test is similar to the slump spread, but the J-Ring
is placed around the slump cone and the SCC is forced to pass through the legs of the J-Ring
(Wehbe et al. 2007). Aggregate size has the most influential factor on the results of this test
as it can cause blockage between the bars of the metal ring.

16
Figure 2-3 L-box test (Wehbe et al. 2009)
The L-Box test is not an ASTM standard test, but is used to evaluate passing ability. Figure
2-3 shows the setup of an L-Box test. The test can be performed in accordance with the PCI
interim guidelines 2003 (PCI 2003). The measured L-Box results are expressed in terms of
the ratio H2 /H1 which are the heights at the horizontal ends as seen in Figure 2-3 (Wehbe et
al. 2007 and PCI 2003). Acceptable values of H2/H1 are between 0.80 and 1.00 in (JSCE
1998 and PCI 2003).
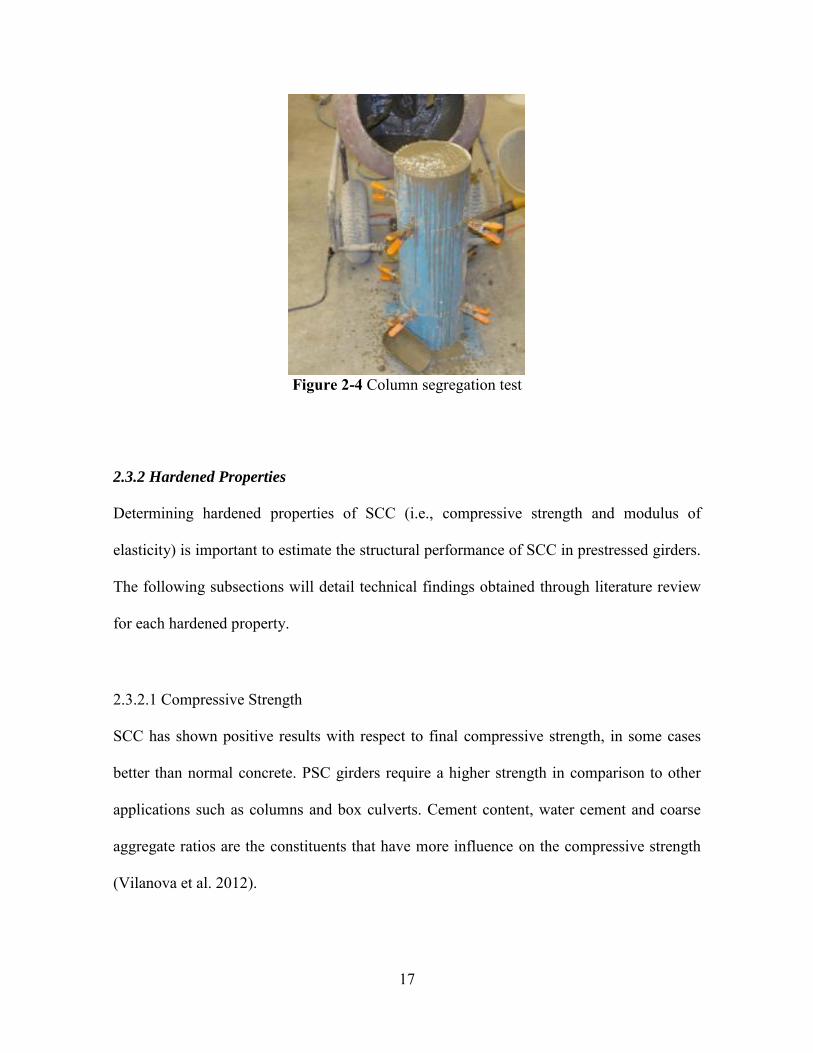
The ASTM C1610 test method covers the determination of static segregation of self-
consolidating concrete by measuring the coarse aggregate content in the top and bottom
portions of a cylindrical specimen. Column segregation test results are expressed as the
percentage ratio of the difference of aggregate mass between the bottom and the top segments
of the column to the total aggregate mass in the two segments (Wehbe et al. 2009). Figure 2-
4 show a sample picture of column segregation test.
17
Figure 2-4 Column segregation test
2.3.2 Hardened Properties
Determining hardened properties of SCC (i.e., compressive strength and modulus of
elasticity) is important to estimate the structural performance of SCC in prestressed girders.
The following subsections will detail technical findings obtained through literature review
for each hardened property.
2.3.2.1 Compressive Strength
SCC has shown positive results with respect to final compressive strength, in some cases
better than normal concrete. PSC girders require a higher strength in comparison to other
applications such as columns and box culverts. Cement content, water cement and coarse
aggregate ratios are the constituents that have more influence on the compressive strength
(Vilanova et al. 2012).
18
Attiogbe et al. (2006), Collepardi et al. (2005) and Wehbe et al. (2007) concluded that the
compressive strength of SCC is comparable or higher than that of normal concrete with the
same w/c ratio. Burgueno et al. (2007) tested three different types of SCC: Powder Type,
VMA Type and Combination Type I/II. From the compressive strength test, Powder Type
and VMA Type showed higher strength than normal concrete. However, Combination Type
I/II showed slower strain gains compared to the rest of SCC types. Another parameter that
has been studied is the replacement of cement for respective fillers. Turkel et al. (2010)
studied how different fillers affect properties of the mix. Results showed that SCC mixtures
using limestone have shown substantial higher strength than mixtures with other mineral
admixtures or fillers (Turkel et al. 2010). Compressive strength is tested according to the
ASTM C36 (ASTM 2011). Readings are recorded at 18 hr, 3, 7, 14, 28 and 56 days of curing.
Curing conditions have shown to have an impact on the early strength of concrete. Heat
curing conditions significantly improve strength gains at early age relative to moist curing
(Wehbe et al, 2009).
2.3.2.2 Modulus of Elasticity
Modulus of elasticity is known as the resistance to deform elastically when a force is applied.
The modulus of elasticity in the SCC mixtures is affected by the use of mineral admixtures,
paste volume, and size of coarse aggregate. Modulus of elasticity increases in the following
order for the different mineral admixture types: fly ash, limestone filler, and ground-
granulated blast-furnace slag (Vilanova et al. 2012). SCC girders may exhibit lower modulus
of elasticity than CC girders due to greater prestress losses in SCC (Shamsad et al. 2014).
19
2.3.3 Time Dependent Material Characteristics
Time-dependent material characteristics for SCC PSC girders have been studied by the
quantification of its creep and shrinkage. The following subsections summarize test methods
for creep and shrinkage and its relevant findings from the literature review.
2.3.3.1 Shrinkage
Shrinkage is a phenomenon that is the result of moisture loss in concrete. Volume change
occurs as concrete loses excess water. Concrete can lose water to its surroundings through
evaporation or through the hydration process. When the internal water evaporates, negative
capillary pressures are formed that cause the paste to contract (Wehbe et al. 2009). A volume-
to-surface area ratio is used in shrinkage prediction equations; thus, higher volume-to-surface
area ratio ratios lead to less shrinkage. For SCC concrete, there are three cases of shrinkage
that need special consideration as follows: 1) plastic shrinkage occurs as the surface of fresh
concrete rapidly loses moisture; 2) autogeneous shrinkage occurs when concrete begins to
dry internally, and a volume reduction of paste occurs due to the hydration process; and 3)
drying shrinkage is the strain that is caused by water loss from hardened concrete when it is
exposed to the environment (Kosmatka 2002).
Lower autogeneous and higher drying shrinkage have been reported to have higher effect on
SCC (ACI 237 2007). The aggregate content is one of the main factors affecting the shrinkage
strains of concrete. The main function of the aggregate is to restrain the shrinkage
deformations. SCC with a low aggregate content is associated with a higher shrinkage strain
(Gomez et al. 2007). SCC made with higher binder content can exhibit higher drying
shrinkage varying between 500 and 1000 micro strain after 300 days. However, substituting
20
Portland cement by non-pozzolanic filler, such as limestone, substantially decreases the
drying shrinkage.
Many studies (Mata 2004, Wehbe et al. 2009, and Khayat et al. 2009) have focused on the
effect of the shrinkage on SCC performance used for prestressed bridge girders. Shrinkage
values of SCC are compared to those for CC with the similar characteristics and curing
conditions and to those from the AASHTO prediction models. Shrinkage can be measured
following the approach stipulated by ASTM C157 (ASTM 2011). This approach can
determine the changes in length that are produced by causes other than externally applied
forces and temperature changes in hardened concrete specimens. These specimens are
exposed to controlled conditions of temperature (73̊ ± 2̊) and relative humidity (50 % ± 4 %)
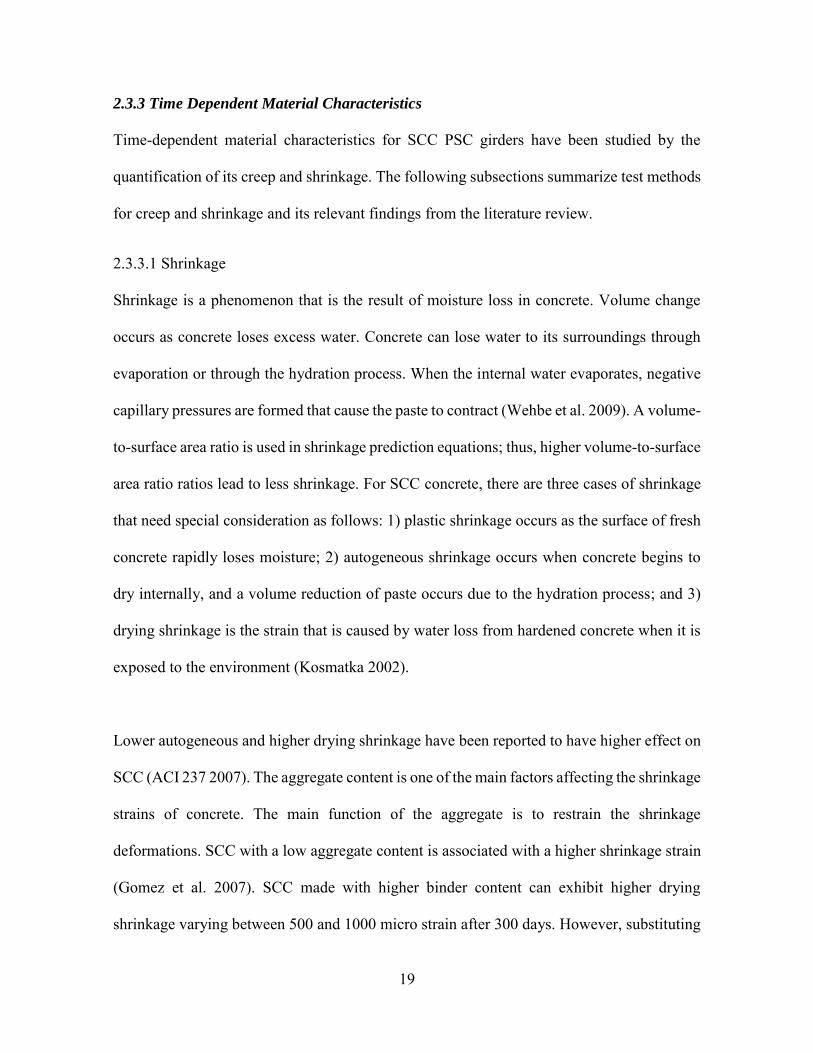
recommended by ASTM C157. Shrinkage test setup can be seen in Figure 2-5.
(a) (b)
Figure 2-5 Shrinkage test setup: (a) HM-250D length comparator and (b) SCC prism specimen
21
2.3.3.2 Creep
Creep is a volumetric change due to external loads. In concrete, long-term creep deformations
are generally larger than the initial elastic deformation due to applied loads (Trejo 2008). The
creep shortening of concrete under permanent loading ranges from 0.5 to 4 times the initial
elastic shortening. The magnitude of creep depends on concrete maturity at the time of
loading (Trejo 2008).
Previous research (Khayat and Mitchell 2009) on creep comparing high performance
concrete (HPC) to SCC shows that SCC may experience 10-20 % more strain than HPC.
SCC with high paste volumes may result in increased creep and prestress losses and
deflections, along with reduced capacities of PSC elements made with this high paste volume
(Kim et al. 2011).
In addition to the effect of high paste volume, aggregates used in SCC mix have an influence
on the creep. For example, river gravel exhibits lower creep in comparison to limestone due
to the higher stiffness of the river gravel (Kim et al, 2011). It was also found that w/c ratio
did not appear to have considerable effect on creep. This can be attributed to the fact that
other mixture parameters, such as binder content and type, had a more predominant influence
on creep (Long and Khayat 2011).
A test method used to determine creep is the ASTM C512 (ASTM 2011). This test method
measures the load-induced time dependent compressive strain at selected ages for concrete
under an arbitrary set of controlled environmental conditions. According to the ASTM C512,
22
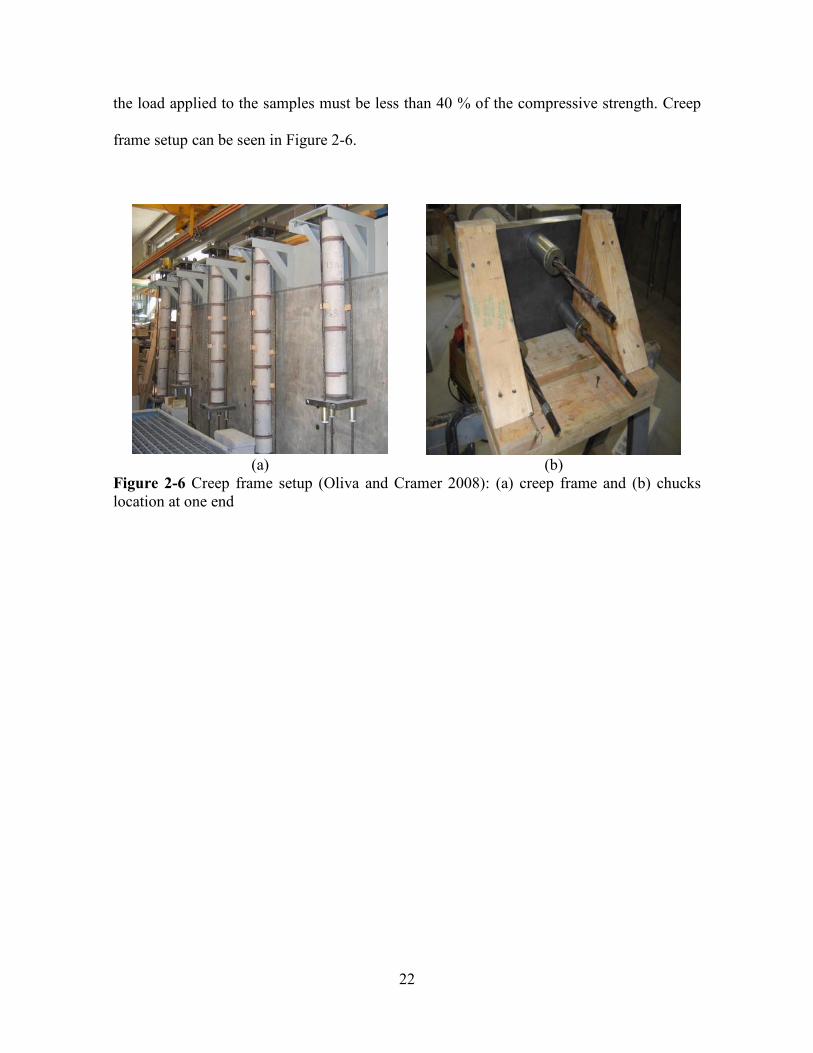
the load applied to the samples must be less than 40 % of the compressive strength. Creep
frame setup can be seen in Figure 2-6.
(a) (b) Figure 2-6 Creep frame setup (Oliva and Cramer 2008): (a) creep frame and (b) chucks location at one end
23
2.4 Structural Performance
Lack of prediction models for the structural performance for different SCC mixture designs
have made difficult the implementation of SCC for PSC girders (Bassem 2013). This section
presents existing code requirements (i.e., transfer length, prestress loss, and camber)
necessary for the implementation of PSC girders.
2.4.1 Transfer Length
The ACI code (ACI 2008) defines transfer length as the length of the embedded pretensioned
strand, required to transfer the effective prestress to the concrete. A number of past studies
(Labonte and Hamilton 2005, Wehbe et al. 2009, and Trejo et al. 2014) have determined the
transfer length of both SCC and CC girders. Wehbe et al. (2009) utilized two methods to
determine transfer length. The first method consisted of installing demec points on the
surface of the girder flange, while the second method used strain gages attached to the strands
near each end of the girder. After release of the strands, the second method exhibited similar
results between the CC and SCC girders. Labonte and Hamilton (2005) placed vibrating wire
gages along the bottom flange in both ends of the SCC girder. Different transfer length was
observed at each end of the girder due to sudden release of the strands; however, resulting
transfer length remained similar for both SCC and CC girders. Hence, Wehbe et al. (2009)
and Labonte and Hamilton (2005) concluded that there was not significant differences in
transfer length between SCC and CC girders.
On the other hand, Trejo et al. (2014) found similar transfer length after release of the strands
for both SCC and CC girders, but it was also observed that the transfer length almost doubled
after 128 days of monitoring for both the girders. Similarly, the other studies (Barnes et al.

24
2003, Kaar et al. 1963) showed that transfer length increases over time due to time-dependent
properties. Barnes et al. (2003) and Kaar et al. (1963) found that creep, shrinkage and strand
relaxation around the transfer region increased the transfer length for PSC girders. Details
for the determination of transfer length are provided in the next subsections.
2.4.1.1 Codified Equations
Transfer length can be determined following the ACI (2008) and AASHTO LRFD Bridge
Design Specifications (2014). The ACI code provides Eq. 2.1 to simply determine the
transfer length of prestressing strands. Note that this equation assumes strand Grade 270
being prestressed to 75 % of ultimate strength, and approximately 25 % of prestress losses.
𝐿𝑡 = 50𝑑𝑏 (Eq. 2.1)
where Lt is the transfer length and db is the strand bar diameter.
The AASHTO LRFD Specifications have developed a more conservative equation for
transfer length as shown below:
𝐿𝑡 = 60𝑑𝑏 (Eq. 2.2)
where Lt is the transfer length and db is the strand bar diameter.

25
2.4.1.2 Test Interpretation
The 95 % Average Maximum Strain (AMS) procedure proposed by Russell and Burns (1997)
have been frequently used by several researchers to determine the transfer length of PSC
girders. Note that the concrete samples used for the study had a compressive strength of 4000
psi at release and 6000 psi after 28 days, and the induced force in the strands was 75 % the
tensile strength of the prestressing strands. This procedure can be applied to prestress strands
with a diameter of 0.6 in, Grade 270 seven-wire, low relaxation strands.
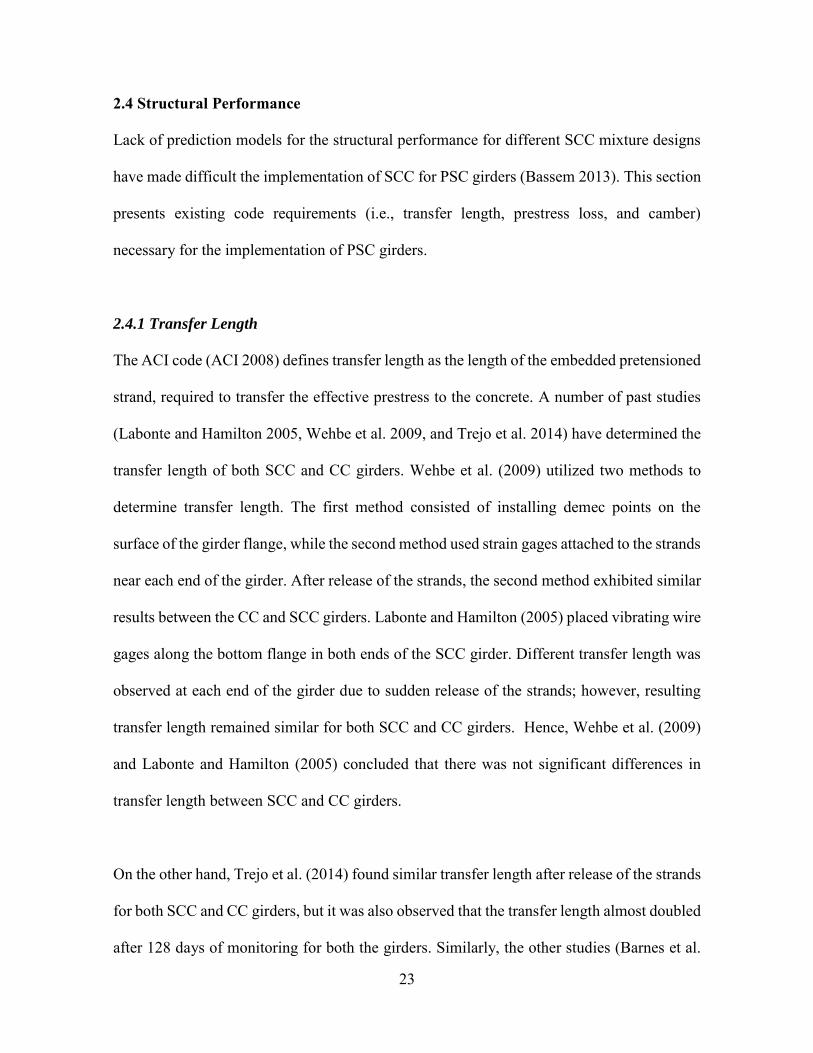
Transfer length can be determined using the 95 % AMS method (see Figure 2-7) as follows:
• Plot the strain profile against the potential transfer length of the strand;
• Determine the AMS for the specimen by computing the numerical average of all the
strains contained within the strain plateau of the fully effective prestress force;
• Scale the AMS value by 0.95 and construct a line on the plot corresponding to 0.95
AMS; and
• Determine the transfer length as the length between zero strain and the intersection of
the strain profile with the 0.95 AMS line.
26
Figure 2-7 Sample AMS method (Russell and Burns 1993)
2.4.2 Prestress Losses
Codified approaches to predict prestress losses are available in the AASHTO LRFD
Specifications (2014) and PCI Design Handbook (2004). Overview for prestress loss and
details for each approach are presented in the following subsections.
2.4.2.1 Overview
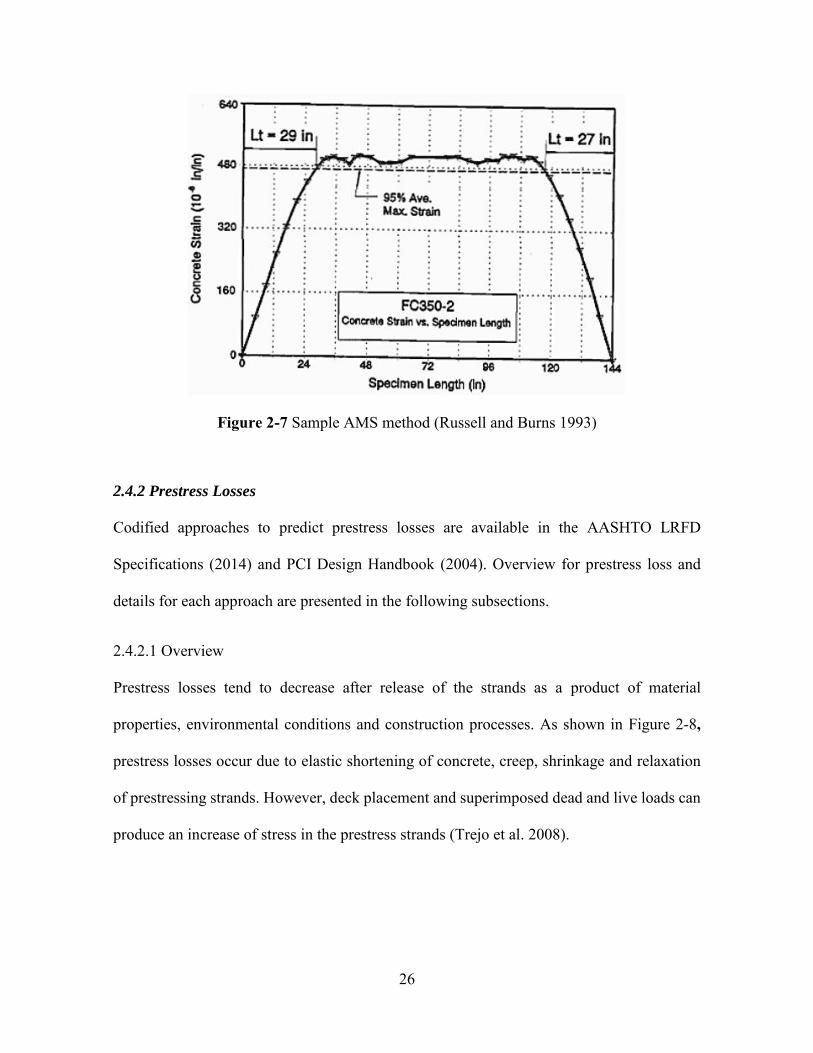
Prestress losses tend to decrease after release of the strands as a product of material
properties, environmental conditions and construction processes. As shown in Figure 2-8,
prestress losses occur due to elastic shortening of concrete, creep, shrinkage and relaxation
of prestressing strands. However, deck placement and superimposed dead and live loads can
produce an increase of stress in the prestress strands (Trejo et al. 2008).
27
Figure 2-8 Stress in strands over time (Tadros et al. 2003)
Several past studies (Erkmen et al. 2007, Burgueno and Bendert 2007, and Wehbe et al. 2009)
have compared the prestress losses of both CC and SCC girders where contradictory results
have been reported. Specifically, Burgueno and Bendert (2007) and Erkmen et al. (2007)
concluded that both SCC and CC girders tend to develop similar losses. It was also reported
that the AASHTO and PCI prediction models are likely to overestimate long-term prestress
losses of SCC and CC girders. In contrast, Wehbe et al. (2009) reported that higher losses for
SCC girders during the elastic shortening stage, but lower long-term losses compared to CC
girders.
Varying material characteristics make it difficult to predict whether SCC will have higher
losses than CC. For example, Trejo et al (2008) compared the effect of limestone and river
gravel on long-term losses. It was found that SCC mixtures with limestone exhibited higher

28
long-term losses than those with river gravel, and SCC and CC mixtures had similar losses
when they were made of the same type of aggregate.
2.4.2.2 AASHTO LRFD Specifications
The prestress losses are divided into the initial losses due to elastic shortening and long-term
losses as shown in Eq. 2.3:
𝛥𝑓𝑝𝑇 = 𝛥𝑓𝑝𝐸𝑆 + 𝛥𝑓𝑝𝐿𝑇 (Eq. 2.3)
where 𝛥fpT is the total loss (ksi), 𝛥fpES is losses due to elastic shortening (ksi), and 𝛥fpLT is
the sum of the long term losses.
The losses due to elastic shortening are computed as follows:
∆𝑓𝑝𝐸𝑆 =𝐸𝑝
𝐸𝑐𝑡𝑓𝑐𝑔𝑝 (Eq. 2.4)
where Ep is the modulus of elasticity of the prestressing strands (ksi), Ect is the modulus of
elasticity of concrete at transfer (ksi), and fcgp is the concrete stress of the prestressing tendons
due to the prestressing force immediately after transfer.
Long-term losses (𝛥fpLT) are determined by the following equations:
𝛥𝑓𝑝𝐿𝑇 = 10.0 𝑓𝑝𝑖𝐴𝑝𝑠
𝐴𝑔 𝛾ℎ𝛾𝑠𝑡 + ∆𝑓𝑝𝑟 (Eq. 2.5)

29
𝛾ℎ = 1.7 − 0.01 𝐻 (Eq. 2.6)
𝛾𝑠 = 5
(1.7−0.01𝐻) (Eq. 2.7)
where fpi is the prestress steel prior to transfer (ksi), Aps is the area of the prestressing strand
(in2), Ag is the gross area of concrete section (in2), γh is the correction factor for relative
humidity, γst is the correction factor for specified concrete strength at time of prestress
transfer, H is the relative humidity (%), and ΔfpR is an estimate of the relaxation loss assumed
to be 2.5 ksi for low relaxation strands.
2.4.2.3 PCI Design Handbook Method
This method was developed with the joint participation of both ACI and ASCE. Total
prestress losses (TL) are computed as follows:
𝑇𝐿 = 𝐸𝑆 + 𝐶𝑅 + 𝑆𝐻 + 𝑅𝐸 (Eq. 2.8)
where ES is the loss due to elastic shortening (psi), CR are the creep losses (psi), SH are the
shrinkage losses(psi) and RE are the losses due to the relaxation of tendons (psi).
Elastic shortening losses are determined as follows:
𝐸𝑆 = 𝐾𝑒𝑠𝑓𝑐𝑖𝑟 (𝐸𝑝𝑠
𝐸𝑐𝑖) (Eq. 2.9)

30
where Kes is 1.0 for pretensioned members, Eps is the modulus of elasticity of prestressing
tendons (psi), Eci is the modulus of elasticity of concrete (psi), and fcir is the net compressive
stress in concrete at the center of gravity of prestressing force immediately after the prestress
has been applied to the concrete (psi).
𝑓𝑐𝑖𝑟 = 𝐾𝑐𝑖𝑟 (𝑃𝑖
𝐴𝑔) −
𝑀𝑔𝑒
𝐼𝑔 (Eq. 2.10)
where Kcir is 0.9 for pretensioned members, Pi is the initial prestress force before release
(lb), e is the eccentricity of center of gravity of tendons with respect to the center of gravity
of the concrete section (in), Ag is the gross concrete section (in2), Ig is the moment of inertia
of the concrete section (in4), and Mg is the bending moment due to self-weight (lb-in).
Losses due to creep (CR) are estimated with the following equation:
𝐶𝑅 = 𝐾𝑐𝑟 (𝐸𝑝𝑠
𝐸𝑐) (𝑓𝑐𝑖𝑟 − 𝑓𝑐𝑑𝑠) (Eq. 2.11)
where Kcr is 2.0 for CC and SCC for this study, Eps is the modulus of elasticity of concrete at
release (psi), Ec is the modulus of elasticity of concrete at 28 days (psi), and fcds is the
compressive stress in concrete at the center of gravity of the prestressing steel due to all dead
loads applied to the member after it has been prestressed (psi).
𝑓𝑐𝑑𝑠 = 𝑀𝑠𝑑∙𝑒
𝐼𝑔 (Eq. 2.12)

31
where Msd is the moment due to superimposed dead loads after prestress force is applied (lb-
in).
Shrinkage losses (SH) are determined as follows:
𝑆𝐻 = (8.2 × 10⁻⁶)𝐾𝑠ℎ𝐸𝑝𝑠(1 − 0.06𝑉
𝑆)(100 − 𝑅𝐻) (Eq. 2.13)
where Ksh is 1.0 for pretensioned members, V/S is the volume to surface area ratio (in), and
RH is the relative humidity (%).
Relaxation in the strands is computed using the following equation:
𝑅𝐸 = [𝐾𝑟𝑒 − 𝐽(𝑆𝐻 + 𝐶𝑅 + 𝐸𝑆)]𝐶 (Eq. 2.14)
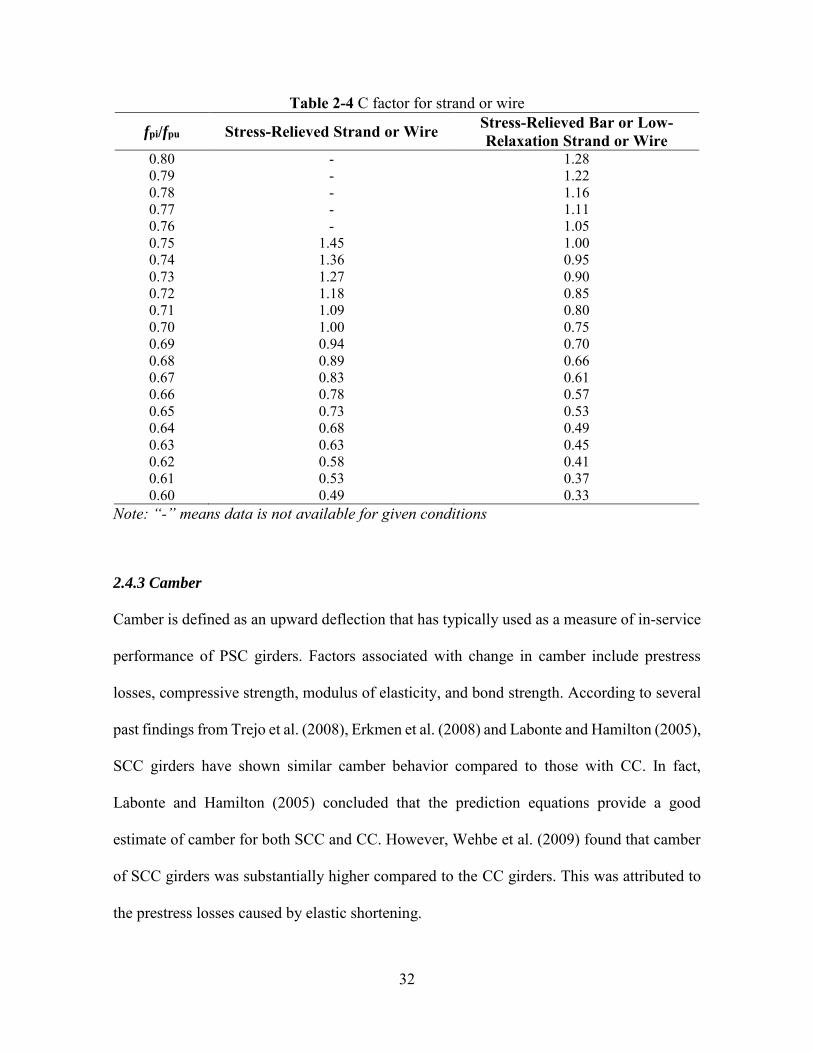
where Kre and J are given in Table 2-3 depending on the type of the strand and C is a factor
based on the ratio of fpi and fpu as shown in Table 2-4. These tables show values for 270 grade
strands for other types of strands, referring to the PCI handbook.
Table 2-3 Factors to calculate relaxation of strand Type of Tendon Kre J
270 Grade stress-relieved strand or wire 20,000 0.15 270 Grade low-relaxation strand 5,000 0.040
32
Table 2-4 C factor for strand or wire
fpi/fpu Stress-Relieved Strand or Wire Stress-Relieved Bar or Low-Relaxation Strand or Wire
0.80 - 1.28 0.79 - 1.22 0.78 - 1.16 0.77 - 1.11 0.76 - 1.05 0.75 1.45 1.00 0.74 1.36 0.95 0.73 1.27 0.90 0.72 1.18 0.85 0.71 1.09 0.80 0.70 1.00 0.75 0.69 0.94 0.70 0.68 0.89 0.66 0.67 0.83 0.61 0.66 0.78 0.57 0.65 0.73 0.53 0.64 0.68 0.49 0.63 0.63 0.45 0.62 0.58 0.41 0.61 0.53 0.37 0.60 0.49 0.33
Note: “-” means data is not available for given conditions
2.4.3 Camber
Camber is defined as an upward deflection that has typically used as a measure of in-service
performance of PSC girders. Factors associated with change in camber include prestress
losses, compressive strength, modulus of elasticity, and bond strength. According to several
past findings from Trejo et al. (2008), Erkmen et al. (2008) and Labonte and Hamilton (2005),
SCC girders have shown similar camber behavior compared to those with CC. In fact,
Labonte and Hamilton (2005) concluded that the prediction equations provide a good
estimate of camber for both SCC and CC. However, Wehbe et al. (2009) found that camber
of SCC girders was substantially higher compared to the CC girders. This was attributed to
the prestress losses caused by elastic shortening.
33
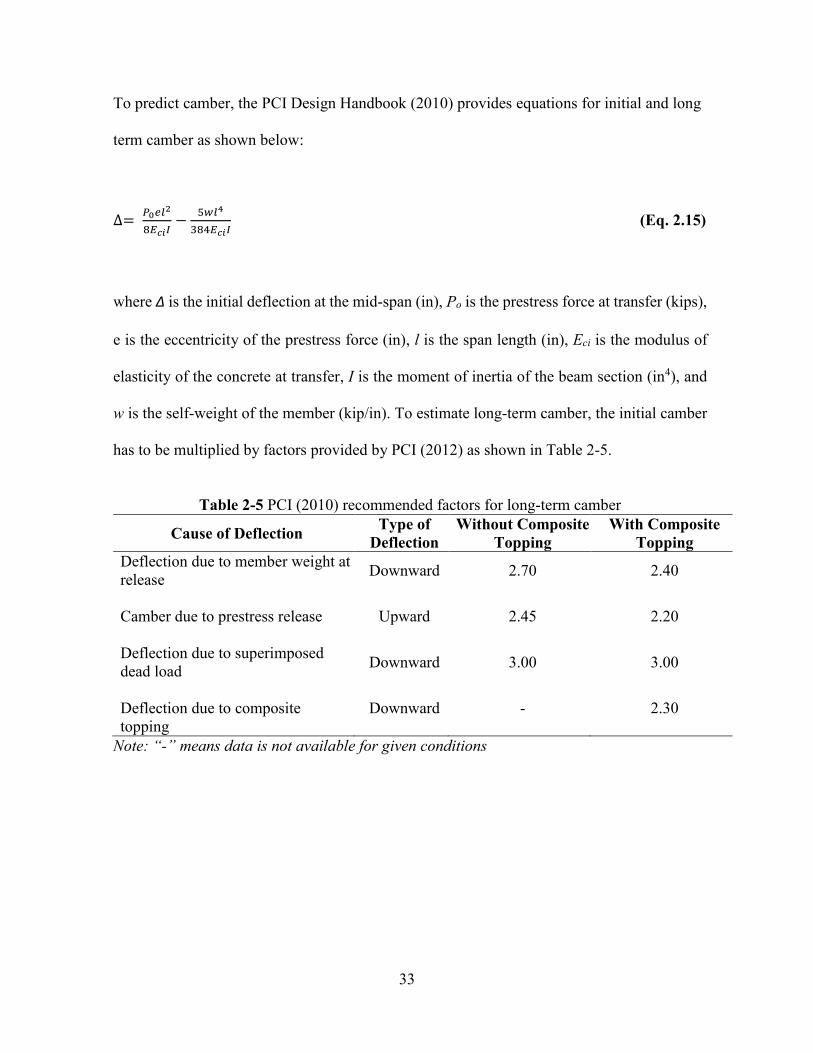
To predict camber, the PCI Design Handbook (2010) provides equations for initial and long
term camber as shown below:
∆= 𝑃0𝑒𝑙2
8𝐸𝑐𝑖𝐼−
5𝑤𝑙4
384𝐸𝑐𝑖𝐼 (Eq. 2.15)
where Δ is the initial deflection at the mid-span (in), Po is the prestress force at transfer (kips),
e is the eccentricity of the prestress force (in), l is the span length (in), Eci is the modulus of
elasticity of the concrete at transfer, I is the moment of inertia of the beam section (in4), and
w is the self-weight of the member (kip/in). To estimate long-term camber, the initial camber
has to be multiplied by factors provided by PCI (2012) as shown in Table 2-5.
Table 2-5 PCI (2010) recommended factors for long-term camber
Cause of Deflection Type of Deflection
Without Composite Topping
With Composite Topping
Deflection due to member weight at release Downward 2.70 2.40
Camber due to prestress release
Upward 2.45 2.20
Deflection due to superimposed dead load Downward 3.00 3.00
Deflection due to composite topping
Downward - 2.30
Note: “-” means data is not available for given conditions
34
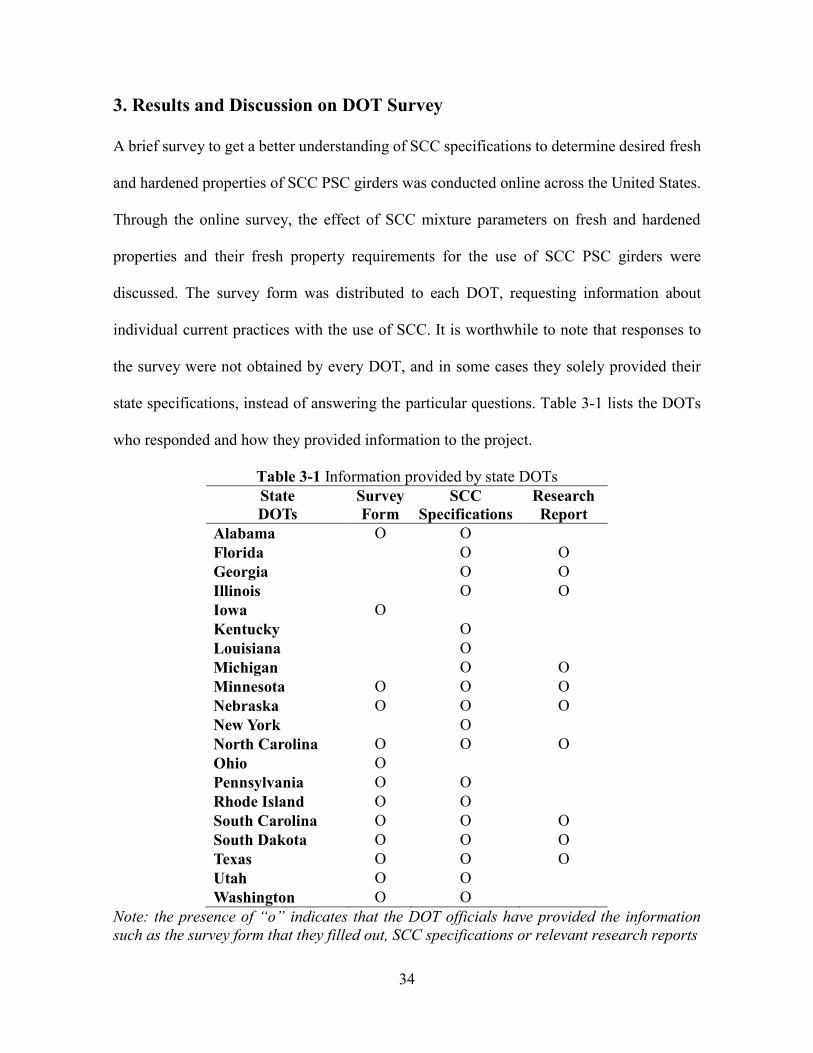
3. Results and Discussion on DOT Survey
A brief survey to get a better understanding of SCC specifications to determine desired fresh
and hardened properties of SCC PSC girders was conducted online across the United States.
Through the online survey, the effect of SCC mixture parameters on fresh and hardened
properties and their fresh property requirements for the use of SCC PSC girders were
discussed. The survey form was distributed to each DOT, requesting information about
individual current practices with the use of SCC. It is worthwhile to note that responses to
the survey were not obtained by every DOT, and in some cases they solely provided their
state specifications, instead of answering the particular questions. Table 3-1 lists the DOTs
who responded and how they provided information to the project.
Table 3-1 Information provided by state DOTs State DOTs
Survey Form
SCC Specifications
Research Report
Alabama O O Florida O O Georgia O O Illinois O O Iowa O Kentucky O Louisiana O Michigan O O Minnesota O O O Nebraska O O O New York O North Carolina O O O Ohio O Pennsylvania O O Rhode Island O O South Carolina O O O South Dakota O O O Texas O O O Utah O O Washington O O
Note: the presence of “o” indicates that the DOT officials have provided the information such as the survey form that they filled out, SCC specifications or relevant research reports
35
The survey was designed to cover three aspects of SCC. The first aspect was directed at the
practices and future planning for the use of SCC. The second aspect was to investigate the
materials used in a state and specific parameters for its mixture. This aspect was of high
importance because of the lack of specific guidelines for SCC in PSC girders. The third
aspect was to gather data on each of the state-level requirements and test methods to approve
a SCC mixture. The first two aspects related to the acceptance and applications of SCC to
prestressed bridge girders in use in individual DOTs were covered by performing the survey.
Summary for the survey results are presented in the following subsections. Note that the
details for the survey form and its results can be found in Appendix A.
3.1 SCC Mixture Parameters
Several parameters in the survey form were considered to be of high important for the SCC
mixture design for PSC girders. The most significant parameter that should be considered for
the SCC mixture design is the cement content. Determining the minimum amount of total
cement content required is the initial step to adjust the appropriate proportions of the SCC
mixtures. To obtain minimum compressive strengths for a specific DOT, each DOT has
established a minimum amount of cement content. For example, some DOTs (e.g., Utah,
South Dakota, Nebraska and Alabama) require the minimum cement content to be over 22.0
lb/ft3. Some other states may require higher cement content; this is the case of Florida DOT
which requires a minimum of 27.8 lb/ft3. On the other hand, a few DOTs, such as Illinois
DOT, have established an upper limit of 26.1 lb/ft3. Once the cement content is determined,
w/c ratio has to be determined. Figure 3-1 shows a range of maximum w/c ratios used by the
participated DOTs. It appears that the most common range of maximum w/c ratios is within
0.41 to 0.45.
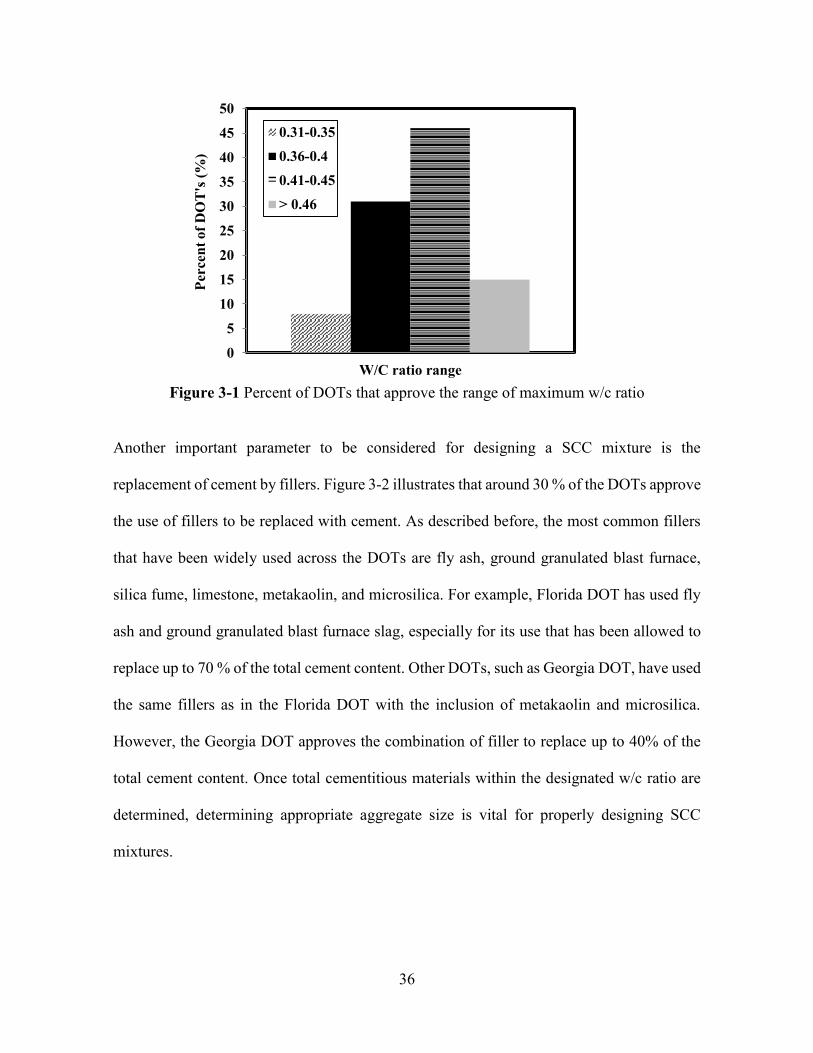
36
Figure 3-1 Percent of DOTs that approve the range of maximum w/c ratio
Another important parameter to be considered for designing a SCC mixture is the
replacement of cement by fillers. Figure 3-2 illustrates that around 30 % of the DOTs approve
the use of fillers to be replaced with cement. As described before, the most common fillers
that have been widely used across the DOTs are fly ash, ground granulated blast furnace,
silica fume, limestone, metakaolin, and microsilica. For example, Florida DOT has used fly
ash and ground granulated blast furnace slag, especially for its use that has been allowed to
replace up to 70 % of the total cement content. Other DOTs, such as Georgia DOT, have used
the same fillers as in the Florida DOT with the inclusion of metakaolin and microsilica.
However, the Georgia DOT approves the combination of filler to replace up to 40% of the
total cement content. Once total cementitious materials within the designated w/c ratio are
determined, determining appropriate aggregate size is vital for properly designing SCC
mixtures.
0
5
10
15
20
25
30
35
40
45
50
W/C ratio range
Perc
ent o
f DO
T's
(%)
0.31-0.350.36-0.40.41-0.45> 0.46
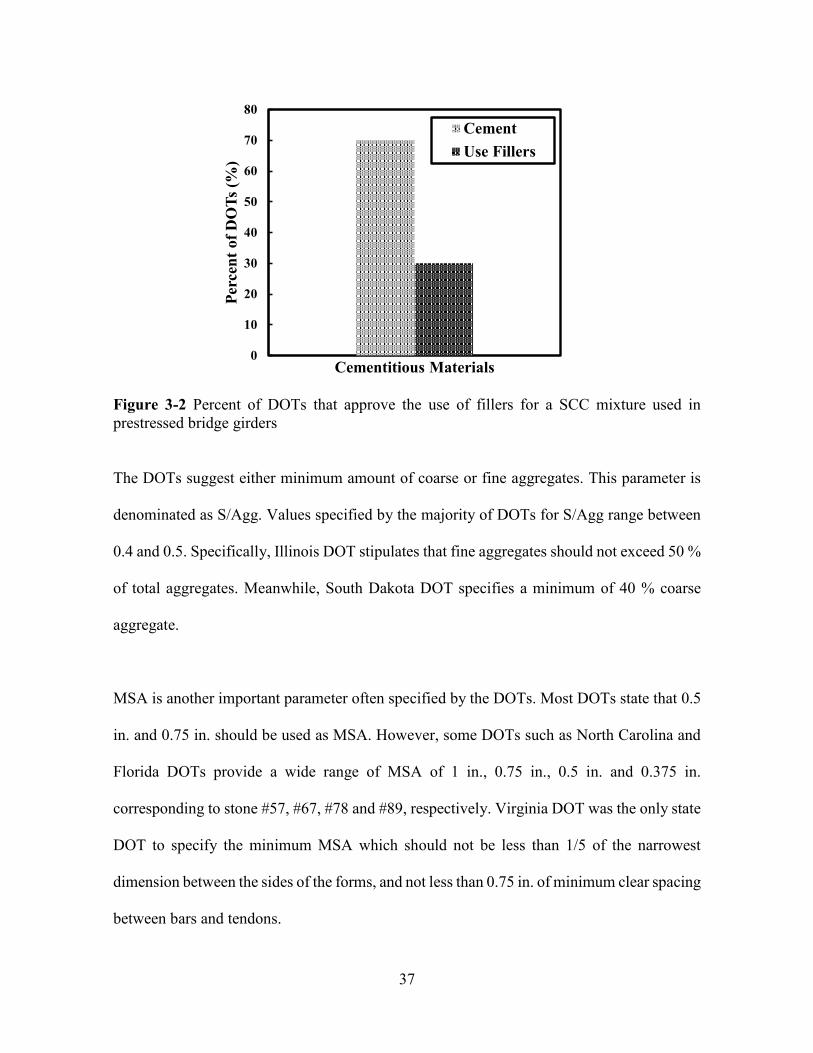
37
Figure 3-2 Percent of DOTs that approve the use of fillers for a SCC mixture used in prestressed bridge girders
The DOTs suggest either minimum amount of coarse or fine aggregates. This parameter is
denominated as S/Agg. Values specified by the majority of DOTs for S/Agg range between
0.4 and 0.5. Specifically, Illinois DOT stipulates that fine aggregates should not exceed 50 %
of total aggregates. Meanwhile, South Dakota DOT specifies a minimum of 40 % coarse
aggregate.
MSA is another important parameter often specified by the DOTs. Most DOTs state that 0.5
in. and 0.75 in. should be used as MSA. However, some DOTs such as North Carolina and
Florida DOTs provide a wide range of MSA of 1 in., 0.75 in., 0.5 in. and 0.375 in.
corresponding to stone #57, #67, #78 and #89, respectively. Virginia DOT was the only state
DOT to specify the minimum MSA which should not be less than 1/5 of the narrowest
dimension between the sides of the forms, and not less than 0.75 in. of minimum clear spacing
between bars and tendons.
0
10
20
30
40
50
60
70
80
Perc
ent o
f DO
Ts (%
)
Cementitious Materials
CementUse Fillers

38
3.2 Fresh Property Requirements
The survey collected information on what each of the DOTs consider a requirement for SCC
fresh performance directly related to the mixture proportioning. It is important to recognize
what fresh property requirements are frequently used in different states across DOTs to
construct reliable SCC girders.
Table 3-2 summarizes the requirements of the participated DOTs for all the test methods for
the fresh property evaluation. For instance, Illinois DOT has parameters for all fresh property
methods explained herein. For the slump flow, Illinois DOT has a lower and upper limit of
20 in. and 28 in., respectively. VSI shall be a maximum of 1. The J-Ring value should be a
maximum of 4 in., meaning that the value is the height of the concrete in the inner diameter
of the ring. L-Box must be a minimum of 60 %. Column segregation index shall be a
maximum of 15 %. Additionally, Illinois DOT allows contractors to establish more strict
guidelines based on their own SCC mixture design. New York State and Washington DOTs
allow the contractors to select a “Target” value, and report results within ±2” from the target
value.
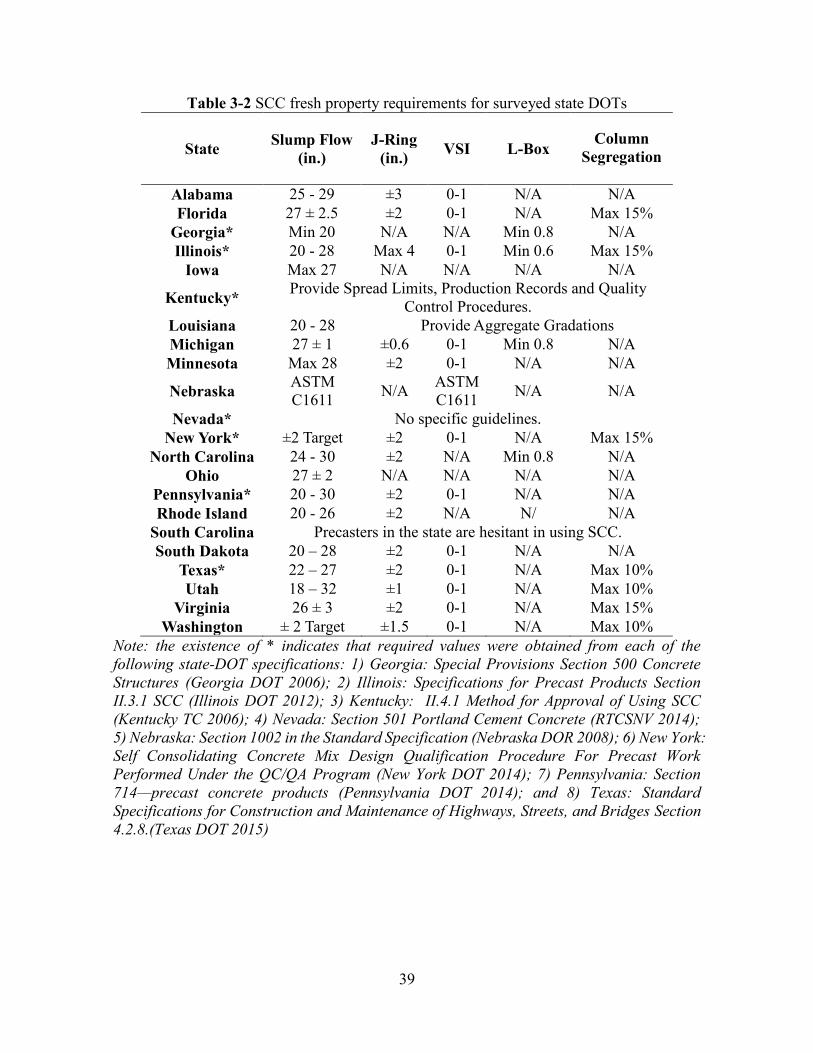
39
Table 3-2 SCC fresh property requirements for surveyed state DOTs
State Slump Flow (in.)
J-Ring (in.) VSI L-Box Column
Segregation
Alabama 25 - 29 ±3 0-1 N/A N/A Florida 27 ± 2.5 ±2 0-1 N/A Max 15%
Georgia* Min 20 N/A N/A Min 0.8 N/A Illinois* 20 - 28 Max 4 0-1 Min 0.6 Max 15%
Iowa Max 27 N/A N/A N/A N/A
Kentucky* Provide Spread Limits, Production Records and Quality Control Procedures.
Louisiana 20 - 28 Provide Aggregate Gradations Michigan 27 ± 1 ±0.6 0-1 Min 0.8 N/A Minnesota Max 28 ±2 0-1 N/A N/A
Nebraska ASTM C1611 N/A ASTM
C1611 N/A N/A
Nevada* No specific guidelines. New York* ±2 Target ±2 0-1 N/A Max 15%
North Carolina 24 - 30 ±2 N/A Min 0.8 N/A Ohio 27 ± 2 N/A N/A N/A N/A
Pennsylvania* 20 - 30 ±2 0-1 N/A N/A Rhode Island 20 - 26 ±2 N/A N/ N/A
South Carolina Precasters in the state are hesitant in using SCC. South Dakota 20 – 28 ±2 0-1 N/A N/A
Texas* 22 – 27 ±2 0-1 N/A Max 10% Utah 18 – 32 ±1 0-1 N/A Max 10%
Virginia 26 ± 3 ±2 0-1 N/A Max 15% Washington ± 2 Target ±1.5 0-1 N/A Max 10%
Note: the existence of * indicates that required values were obtained from each of the following state-DOT specifications: 1) Georgia: Special Provisions Section 500 Concrete Structures (Georgia DOT 2006); 2) Illinois: Specifications for Precast Products Section II.3.1 SCC (Illinois DOT 2012); 3) Kentucky: II.4.1 Method for Approval of Using SCC (Kentucky TC 2006); 4) Nevada: Section 501 Portland Cement Concrete (RTCSNV 2014); 5) Nebraska: Section 1002 in the Standard Specification (Nebraska DOR 2008); 6) New York: Self Consolidating Concrete Mix Design Qualification Procedure For Precast Work Performed Under the QC/QA Program (New York DOT 2014); 7) Pennsylvania: Section 714—precast concrete products (Pennsylvania DOT 2014); and 8) Texas: Standard Specifications for Construction and Maintenance of Highways, Streets, and Bridges Section 4.2.8.(Texas DOT 2015)

40
4. Wisconsin Precast Concrete Plant Identification
SCC mixture design has many difficulties at determining the constituent proportions due to
the lack of specific requirements and guidelines in producing consistent and high quality SCC
mixtures. To produce good quality SCC mixtures, several trial batches are required to identify
material properties, admixtures dosages and long-term properties. Due to the possibility of
creating several high quality mixtures with different parameters and materials a large test
matrix was developed.
In this project, three different precasters in different regions of Wisconsin were selected to
produce SCC mixtures with their available materials. SCC mixtures of each precaster were
evaluated and refined in a laboratory setting using trial batches procedure to achieve
satisfactory workability properties. The three prestressed plants include: County Materials
Roberts, County Materials Janesville and Spancrete. Throughout this report, County Material
Plants will be referred as Roberts and Janesville, respectively. Each plant was contacted in a
preliminary stage of the project to determine expectation and concerns. All three plants were
eager to collaborate to achieve the production of SCC girder in the State of Wisconsin. With
the survey sent to the DOTs, each precaster was simultaneously asked to provide their input
to develop a mixture design. Some parameters, such as cement content, w/c ratio and S/Agg
were chosen based on the survey responses, precasters input, and WisDOT
recommendations. Description on the materials and construction techniques used by each
plant will be discussed in further sections.
41
5. SCC Mixture Design and Laboratory Material Testing
Due to the lack of information on SCC mixtures using materials from Wisconsin, the initial
number of parameters to consider was substantial; thus, a refinement process was introduced
to identify the key parameters having a direct influence on workability and strength of SCC.
Note that this process was initiated at the SDSU Structures Laboratory. The subsequent
sections describe in detail materials, SCC performance criteria, SCC mixture designs, and
testing for workability and strength for each plant.
5.1 Material Properties
Materials used for the refinement process were obtained directly from the respective precast
plants and shipped to the SDSU Structures Laboratory. Each plant provided detailed
information of their material constitutions, including cement type, coarse and fine aggregate,
and admixture provider. Note that the admixture provider recommended a specific product
and dosages for SCC mixtures based on their specific product. Table 5-1 summarizes the
respective materials used at each for the production of prestressed SCC girders. It should be
noted that the coarse aggregate consisted of limestone No 67 (3/4”) and No 78 (3/8”)
conforming to the AASHTO M43 (AASHTO 2009) for County Materials and river gravel
No 67 (3/4”) and No 78 (3/8”) for Spancrete. Aggregate characteristics were obtained from
the respective distributors to be used for the SCC mixture design.
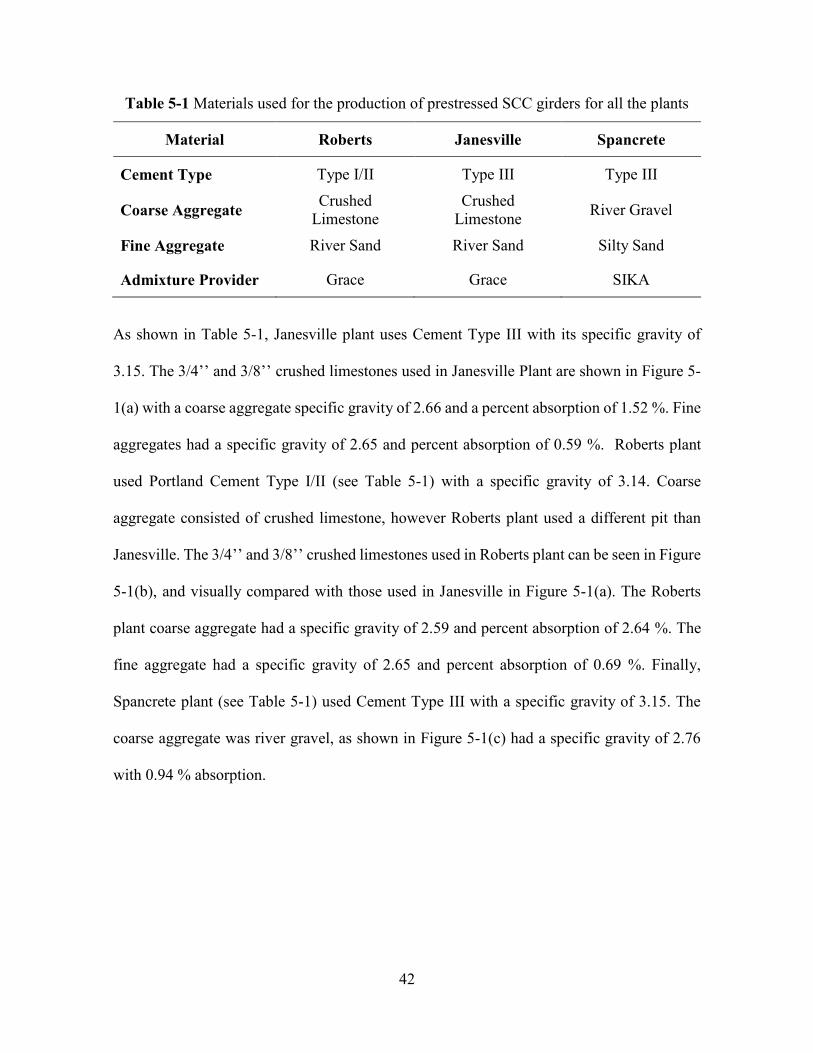
42
Table 5-1 Materials used for the production of prestressed SCC girders for all the plants
Material Roberts Janesville Spancrete
Cement Type Type I/II Type III Type III
Coarse Aggregate Crushed Limestone
Crushed Limestone River Gravel
Fine Aggregate River Sand River Sand Silty Sand
Admixture Provider Grace Grace SIKA
As shown in Table 5-1, Janesville plant uses Cement Type III with its specific gravity of
3.15. The 3/4’’ and 3/8’’ crushed limestones used in Janesville Plant are shown in Figure 5-
1(a) with a coarse aggregate specific gravity of 2.66 and a percent absorption of 1.52 %. Fine
aggregates had a specific gravity of 2.65 and percent absorption of 0.59 %. Roberts plant
used Portland Cement Type I/II (see Table 5-1) with a specific gravity of 3.14. Coarse
aggregate consisted of crushed limestone, however Roberts plant used a different pit than
Janesville. The 3/4’’ and 3/8’’ crushed limestones used in Roberts plant can be seen in Figure
5-1(b), and visually compared with those used in Janesville in Figure 5-1(a). The Roberts
plant coarse aggregate had a specific gravity of 2.59 and percent absorption of 2.64 %. The
fine aggregate had a specific gravity of 2.65 and percent absorption of 0.69 %. Finally,
Spancrete plant (see Table 5-1) used Cement Type III with a specific gravity of 3.15. The
coarse aggregate was river gravel, as shown in Figure 5-1(c) had a specific gravity of 2.76
with 0.94 % absorption.
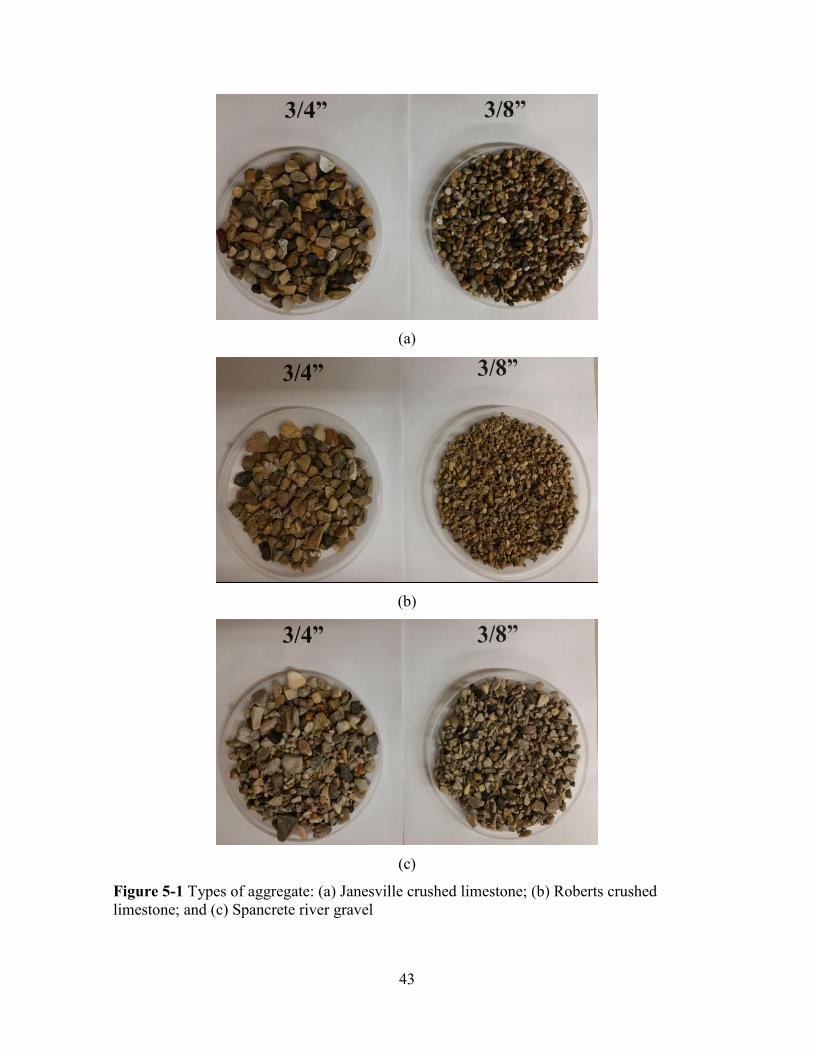
43
(a)
(b)
(c)
Figure 5-1 Types of aggregate: (a) Janesville crushed limestone; (b) Roberts crushed limestone; and (c) Spancrete river gravel
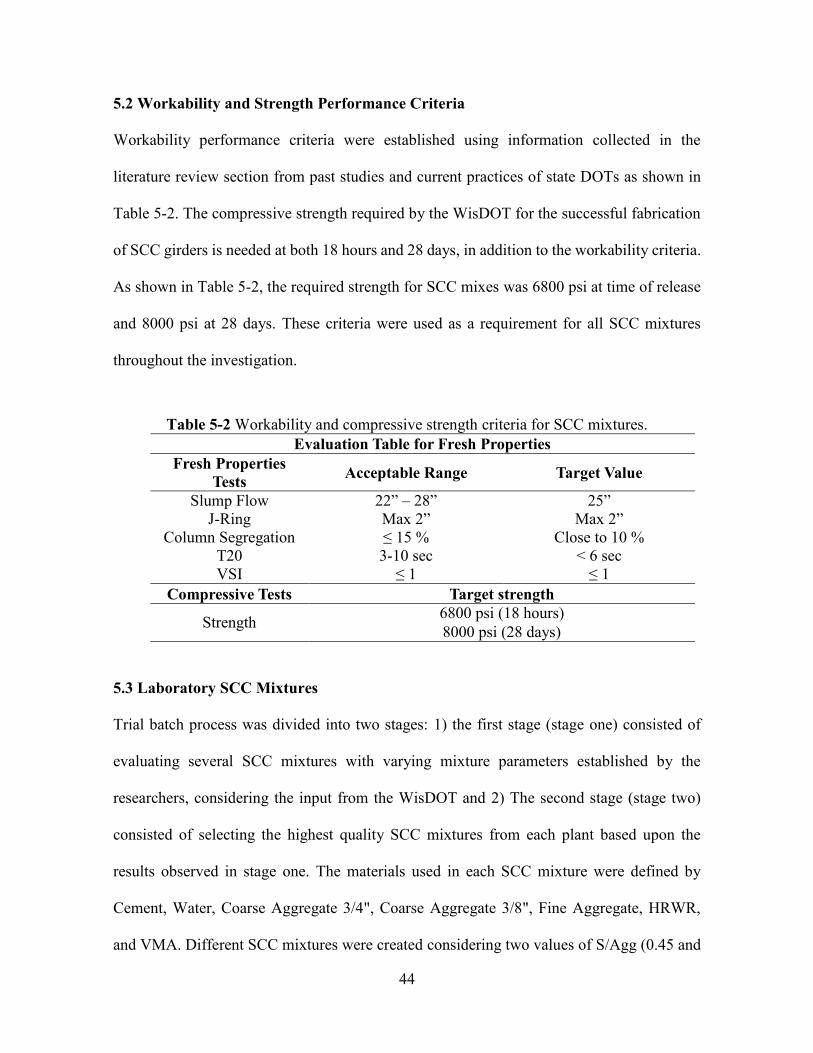
44
5.2 Workability and Strength Performance Criteria
Workability performance criteria were established using information collected in the
literature review section from past studies and current practices of state DOTs as shown in
Table 5-2. The compressive strength required by the WisDOT for the successful fabrication
of SCC girders is needed at both 18 hours and 28 days, in addition to the workability criteria.
As shown in Table 5-2, the required strength for SCC mixes was 6800 psi at time of release
and 8000 psi at 28 days. These criteria were used as a requirement for all SCC mixtures
throughout the investigation.
Table 5-2 Workability and compressive strength criteria for SCC mixtures. Evaluation Table for Fresh Properties
Fresh Properties Tests Acceptable Range Target Value
Slump Flow 22” – 28” 25” J-Ring Max 2” Max 2”
Column Segregation ≤ 15 % Close to 10 % T20 3-10 sec < 6 sec VSI ≤ 1 ≤ 1
Compressive Tests Target strength
Strength 6800 psi (18 hours) 8000 psi (28 days)
5.3 Laboratory SCC Mixtures
Trial batch process was divided into two stages: 1) the first stage (stage one) consisted of
evaluating several SCC mixtures with varying mixture parameters established by the
researchers, considering the input from the WisDOT and 2) The second stage (stage two)
consisted of selecting the highest quality SCC mixtures from each plant based upon the
results observed in stage one. The materials used in each SCC mixture were defined by
Cement, Water, Coarse Aggregate 3/4", Coarse Aggregate 3/8", Fine Aggregate, HRWR,
and VMA. Different SCC mixtures were created considering two values of S/Agg (0.45 and
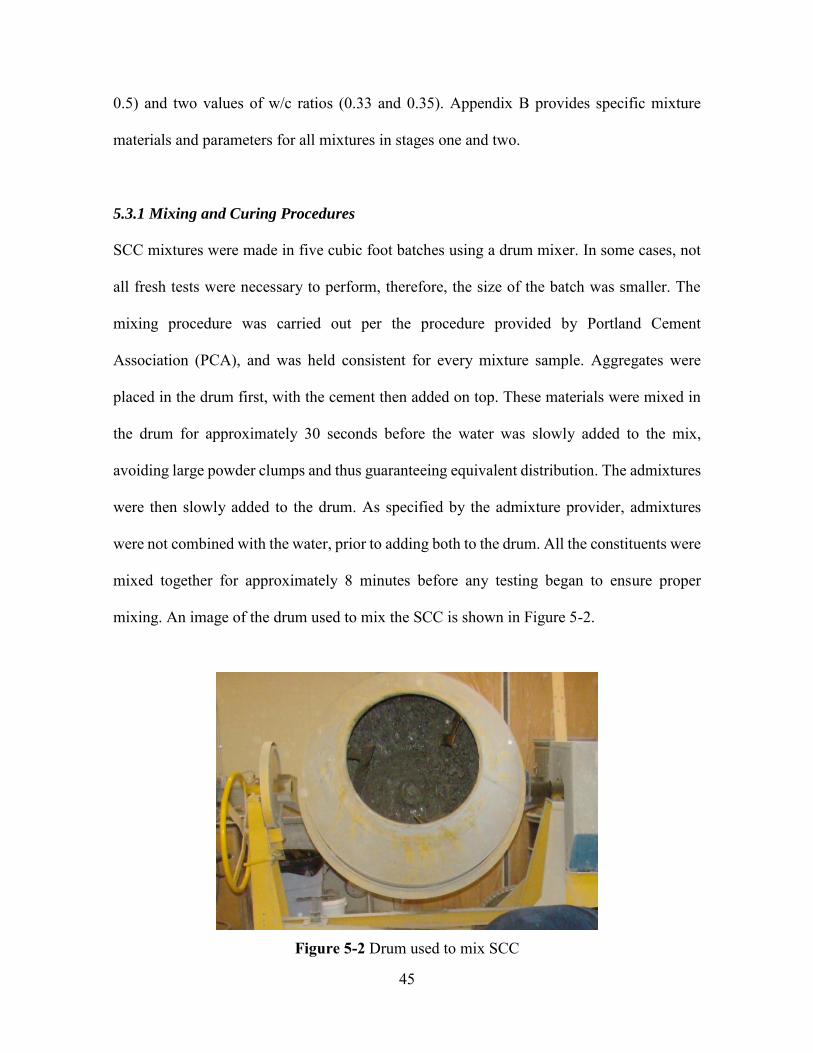
45
0.5) and two values of w/c ratios (0.33 and 0.35). Appendix B provides specific mixture
materials and parameters for all mixtures in stages one and two.
5.3.1 Mixing and Curing Procedures
SCC mixtures were made in five cubic foot batches using a drum mixer. In some cases, not
all fresh tests were necessary to perform, therefore, the size of the batch was smaller. The
mixing procedure was carried out per the procedure provided by Portland Cement
Association (PCA), and was held consistent for every mixture sample. Aggregates were
placed in the drum first, with the cement then added on top. These materials were mixed in
the drum for approximately 30 seconds before the water was slowly added to the mix,
avoiding large powder clumps and thus guaranteeing equivalent distribution. The admixtures
were then slowly added to the drum. As specified by the admixture provider, admixtures
were not combined with the water, prior to adding both to the drum. All the constituents were
mixed together for approximately 8 minutes before any testing began to ensure proper
mixing. An image of the drum used to mix the SCC is shown in Figure 5-2.
Figure 5-2 Drum used to mix SCC
46
Fresh properties were measured immediately after mixing was complete. Slump flow, J-Ring
and column segregation tests were completed in the respective order in a lapse of 30 min at
the completed stage of each mixing. Concrete cylinders were finally made after the fresh
property testing concluded. Note that for the preparation of the cylinders no rodding was
done as it is unnecessary for SCC. For each mixture, compressive strength was tested after
18 hours of curing to simulate the estimated time of curing at the identified plants before
strands release. To simulate steam curing, a water bath was used as seen in Figure 5-3.
Cylinders were placed in the water bath for 18 hours at a temperature of 110 °F.
Figure 5-3 Water bath to simulate steam curing of SCC cylinders
5.3.2 Stage One
Prior to mixing any batches, some parameters of the mixture design were established by the
researchers with some input from the WisDOT. These parameters include cement content,
aggregate type and size, and blending of coarse aggregate. Modifications to these parameters
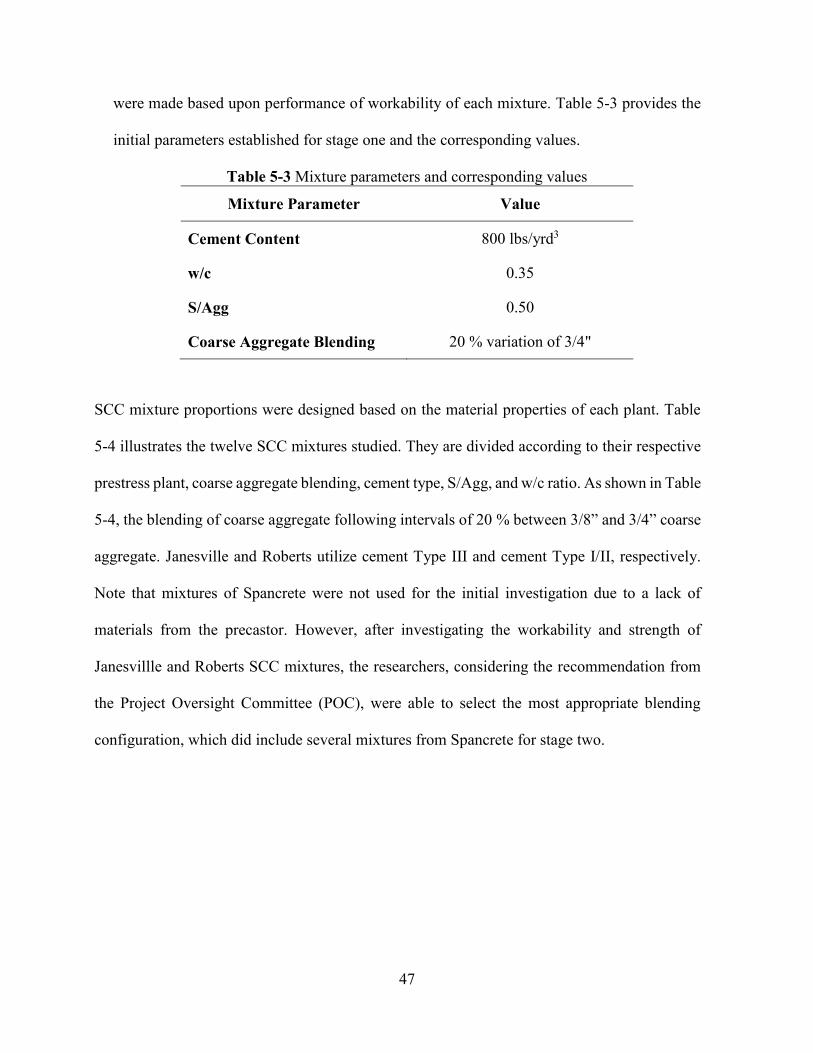
47
were made based upon performance of workability of each mixture. Table 5-3 provides the
initial parameters established for stage one and the corresponding values.
Table 5-3 Mixture parameters and corresponding values
Mixture Parameter Value
Cement Content 800 lbs/yrd3
w/c 0.35
S/Agg 0.50
Coarse Aggregate Blending 20 % variation of 3/4"
SCC mixture proportions were designed based on the material properties of each plant. Table
5-4 illustrates the twelve SCC mixtures studied. They are divided according to their respective
prestress plant, coarse aggregate blending, cement type, S/Agg, and w/c ratio. As shown in Table
5-4, the blending of coarse aggregate following intervals of 20 % between 3/8” and 3/4” coarse
aggregate. Janesville and Roberts utilize cement Type III and cement Type I/II, respectively.
Note that mixtures of Spancrete were not used for the initial investigation due to a lack of
materials from the precastor. However, after investigating the workability and strength of
Janesvillle and Roberts SCC mixtures, the researchers, considering the recommendation from
the Project Oversight Committee (POC), were able to select the most appropriate blending
configuration, which did include several mixtures from Spancrete for stage two.
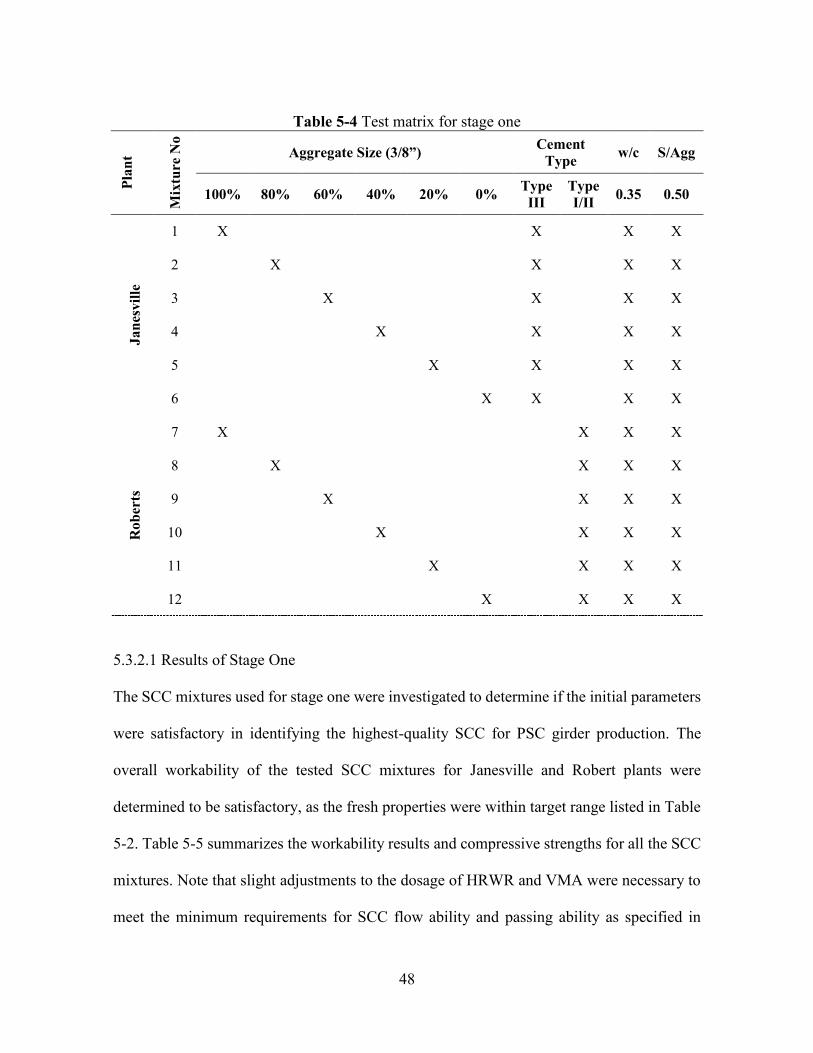
48
Table 5-4 Test matrix for stage one
Plan
t
Mix
ture
No
Aggregate Size (3/8”) Cement Type w/c S/Agg
100% 80% 60% 40% 20% 0% Type III
Type I/II 0.35 0.50
Jane
svill
e
1 X X X X
2 X X X X
3 X X X X
4 X X X X
5 X X X X
6 X X X X
Rob
erts
7 X X X X
8 X X X X
9 X X X X
10 X X X X
11 X X X X
12 X X X X
5.3.2.1 Results of Stage One
The SCC mixtures used for stage one were investigated to determine if the initial parameters
were satisfactory in identifying the highest-quality SCC for PSC girder production. The
overall workability of the tested SCC mixtures for Janesville and Robert plants were
determined to be satisfactory, as the fresh properties were within target range listed in Table
5-2. Table 5-5 summarizes the workability results and compressive strengths for all the SCC
mixtures. Note that slight adjustments to the dosage of HRWR and VMA were necessary to
meet the minimum requirements for SCC flow ability and passing ability as specified in
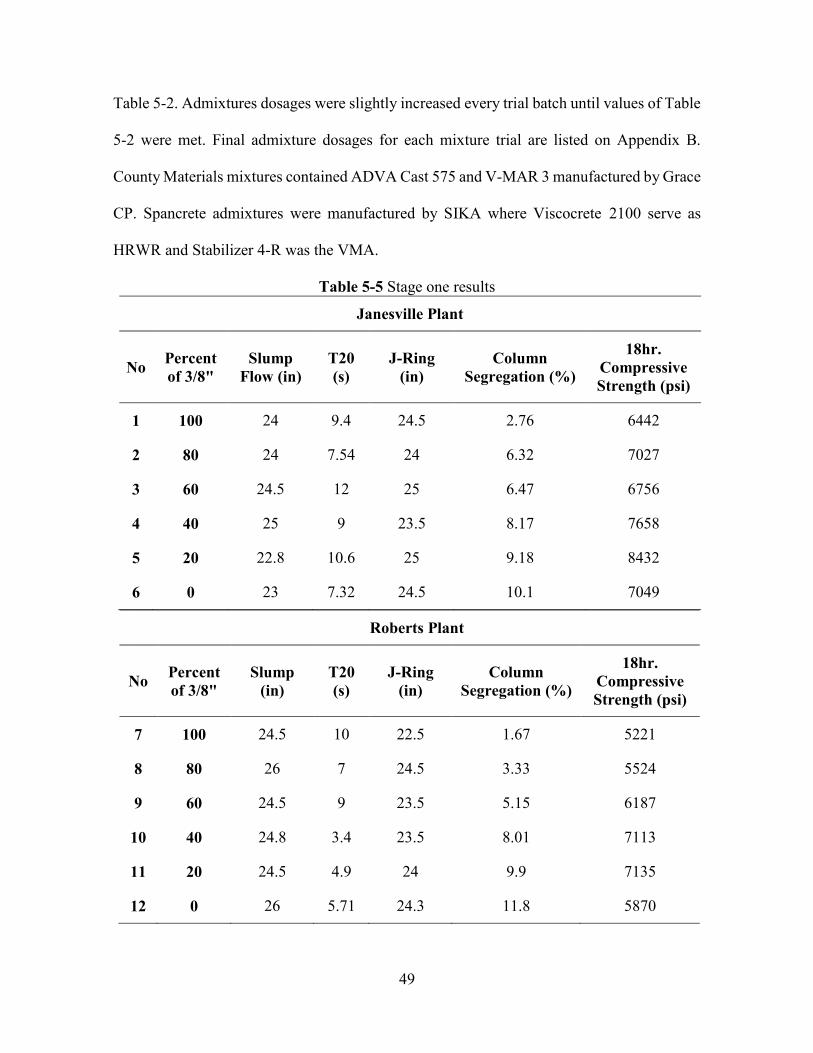
49
Table 5-2. Admixtures dosages were slightly increased every trial batch until values of Table
5-2 were met. Final admixture dosages for each mixture trial are listed on Appendix B.
County Materials mixtures contained ADVA Cast 575 and V-MAR 3 manufactured by Grace
CP. Spancrete admixtures were manufactured by SIKA where Viscocrete 2100 serve as
HRWR and Stabilizer 4-R was the VMA.
Table 5-5 Stage one results Janesville Plant
No Percent of 3/8"
Slump Flow (in)
T20 (s)
J-Ring(in)
Column Segregation (%)
18hr. Compressive Strength (psi)
1 100 24 9.4 24.5 2.76 6442
2 80 24 7.54 24 6.32 7027
3 60 24.5 12 25 6.47 6756
4 40 25 9 23.5 8.17 7658
5 20 22.8 10.6 25 9.18 8432
6 0 23 7.32 24.5 10.1 7049
Roberts Plant
No Percentof 3/8"
Slump (in)
T20 (s)
J-Ring(in)
Column Segregation (%)
18hr. Compressive Strength (psi)
7 100 24.5 10 22.5 1.67 5221
8 80 26 7 24.5 3.33 5524
9 60 24.5 9 23.5 5.15 6187
10 40 24.8 3.4 23.5 8.01 7113
11 20 24.5 4.9 24 9.9 7135
12 0 26 5.71 24.3 11.8 5870
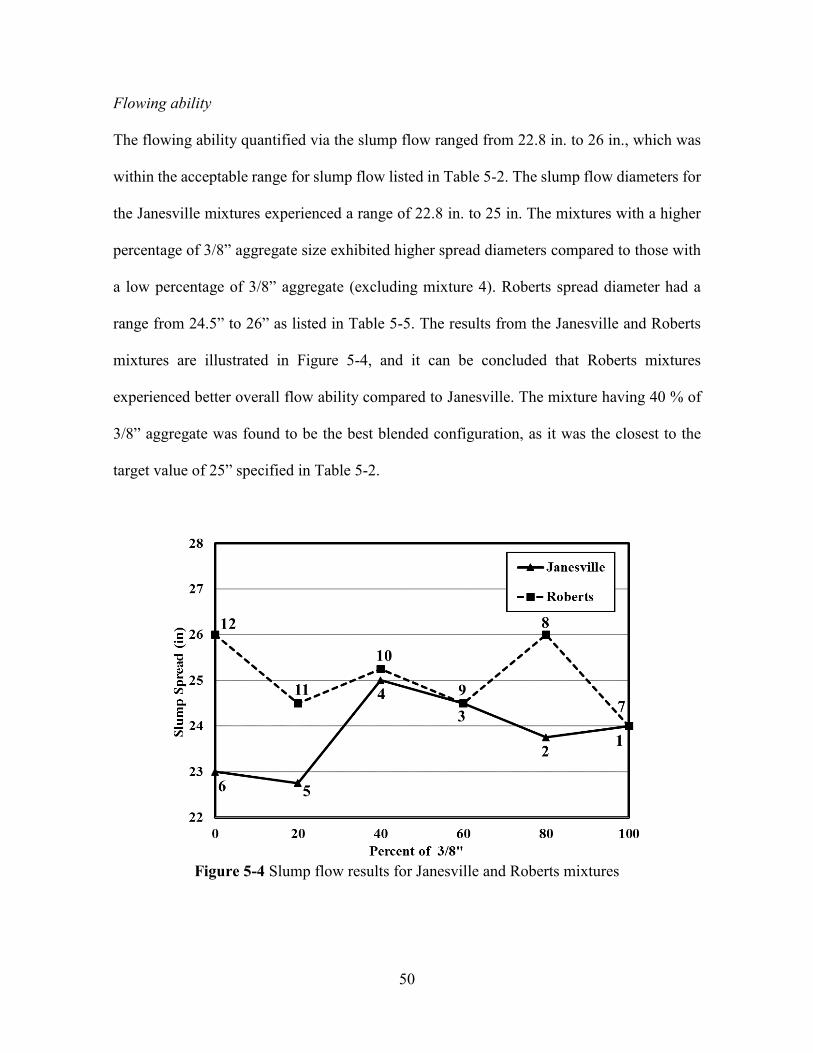
50
Flowing ability
The flowing ability quantified via the slump flow ranged from 22.8 in. to 26 in., which was
within the acceptable range for slump flow listed in Table 5-2. The slump flow diameters for
the Janesville mixtures experienced a range of 22.8 in. to 25 in. The mixtures with a higher
percentage of 3/8” aggregate size exhibited higher spread diameters compared to those with
a low percentage of 3/8” aggregate (excluding mixture 4). Roberts spread diameter had a
range from 24.5” to 26” as listed in Table 5-5. The results from the Janesville and Roberts
mixtures are illustrated in Figure 5-4, and it can be concluded that Roberts mixtures
experienced better overall flow ability compared to Janesville. The mixture having 40 % of
3/8” aggregate was found to be the best blended configuration, as it was the closest to the
target value of 25” specified in Table 5-2.
Figure 5-4 Slump flow results for Janesville and Roberts mixtures

51
From the slump flow tests for both Janesville and Roberts plants, T20 values were recorded,
(presented in Table 5-5) to quantify the viscosity of each mixture. In Roberts mixtures, T20
values tended to decrease as the percent of 3/8” aggregate decreases. Janesville mixtures did
not follow the same trend seen in Roberts mixtures, rather the T20 values were more
inconsistent with a few ups and downs. The discrepancy in T20 values between Janeville and
Roberts mixtures may be caused by the effect of cement type.
Passing Ability
Passing ability is quantified by the difference in diameter between slump flow and J-Ring
test methods. Figure 5-5 illustrates the passing ability trends for Janesville and Roberts
mixtures. Passing ability for Janesville mixtures ranged from 0.25 in. to 2.25 in., while
Roberts mixtures ranged from 0.75 in. to 1.75 in. Janesville mixtures showed the best passing
ability for mixtures having a high percentage of 3/8” coarse aggregate. This trend was
expected, as less blockage between the J-Ring bars is seen with smaller aggregate size,
however, mixtures 4, 5, and 6 had a noticeable decrease in passing ability whereas mixture 5
greatly exceeded the 2 in. established for the optimum workability. Again, results from
Roberts are within a smaller range compared to the results from Janesville, as the percent of
3/8” aggregate varies. Roberts had a similar trend shown in Figure 5-5, where the best results
were seen in mixtures 9, 10, and 11. Mixture 10 had the best passing ability for Roberts with
a value of 0.75 in. During testing, it was observed with Roberts mixtures that as the
percentage of 3/8” aggregate increased, the viscosity increased, resulting in less flow ability.
52
Figure 5-5 Passing ability results for Janesville and Roberts mixtures
Segregation
Segregation was measured using the column segregation test. This test calculated the percent
of segregation based on the percent difference of the aggregate weight between the top and
bottom sections of the cylinder. Segregation has a negative impact on the structural
performance of SCC, and thereby a maximum of 15 % segregation was allowed, as shown
in Table 5-2. Figure 5-6 illustrates that the percent segregation for both plants is under the
maximum allowed. The segregation for both plants decreased as the percentage of 3/8”
coarse aggregate increased. This behavior was expected as larger aggregate tends to segregate
at a faster rate due to its self-weight. Results for both plants were under the 15 % requirement,
signifying that the mixture was viscous enough to prevent segregation or bleeding.
53
Figure 5-6 Segregation results for Janesville and Roberts mixtures
Compressive Strength
Compressive strength of all Janesville mixtures, at transfer, were higher than those from
Roberts, as was expected, due to the cement types. Figure 5-7 shows the compressive strength
results at 18 hours for Janesville and Roberts plants. As the percent of 3/8” coarse aggregate
decreased the compressive strength of the concrete, in most cases, increased. Compressive
strength of Janesville mixtures ranged from 6442 psi to 8432 psi, while Roberts compressive
strength values ranged from 5221 psi to 7135 psi.
54
Figure 5-7 Compressive strength at transfer
Summary
Results from stage one indicated the mixtures having 60 % and 80 % of 3/4” aggregate
provided exceptional workability and compressive strength, desired to produce the highest
quality PSC girders for the WisDOT. Mixtures 2 and 3 from Janesville plant and mixtures 8
and 9 from Roberts plant were selected for further testing. These mixtures were used for
investigation of workability and compressive strength at release and 28 days in stage two.
5.3.3 Stage Two
For stage two, S/Agg and cement content were modified within the identified mixtures
illustrated in Table 5-6. For mixtures of Roberts plant, which used cement Type I/II, it was
decided to additionally modify the w/c from 0.35 to 0.33 because the 18-hour compressive
strength results were low for the PSC girder production based on the WisDOT requirements.
55
As previously mentioned, mixtures of Spancrete were also used for this investigation to
extensively cover all options, in order to determine the most suitable SCC mixtures in
production of PSC bridge girders.
Table 5-6 Test matrix for stage two
Roberts Janesville Spancrete
Cement Content S/Agg CA Blend S/Agg CA Blend S/Agg CA Blend
800 lbs 0.45 A B 0.45 A B 0.45 A B
0.50 A B 0.50 A B 0.50 A B
750 lbs 0.45 A B 0.45 A B 0.45 A B
0.50 A B 0.50 A B 0.50 A B
Note: A= 60% of ¾” and 40% of 3/8” aggregate, while B= 80% of ¾” and 20% of 3/8” aggregate 5.3.3.1 Results of Stage Two
The test matrix shown in Table 5-6 defines the SCC mixtures evaluated at the precast plants.
Table 5-7 illustrates the laboratory testing results for mixtures from all three plants. Based
upon examination of the results, comparison against the predetermined target values (see
Table 5-2), and careful deliberation with the POC in the WisDOT, five SCC mixtures were
selected for the final workability and compressive strength testing at the plants and creep and
shrinkage testing. Table 5-7 includes the selected five mixtures, provided in bold, which met
the requirements previously established. Appendix C includes a compilation of all the
detailed results of stage two. Note that the nomenclature in the mixture code is defined as
follows: the first letter refers to the respective plant where R, J, and S represent Roberts,
Janesville and Spancrete, respectively. The first number refers to the cement content, where
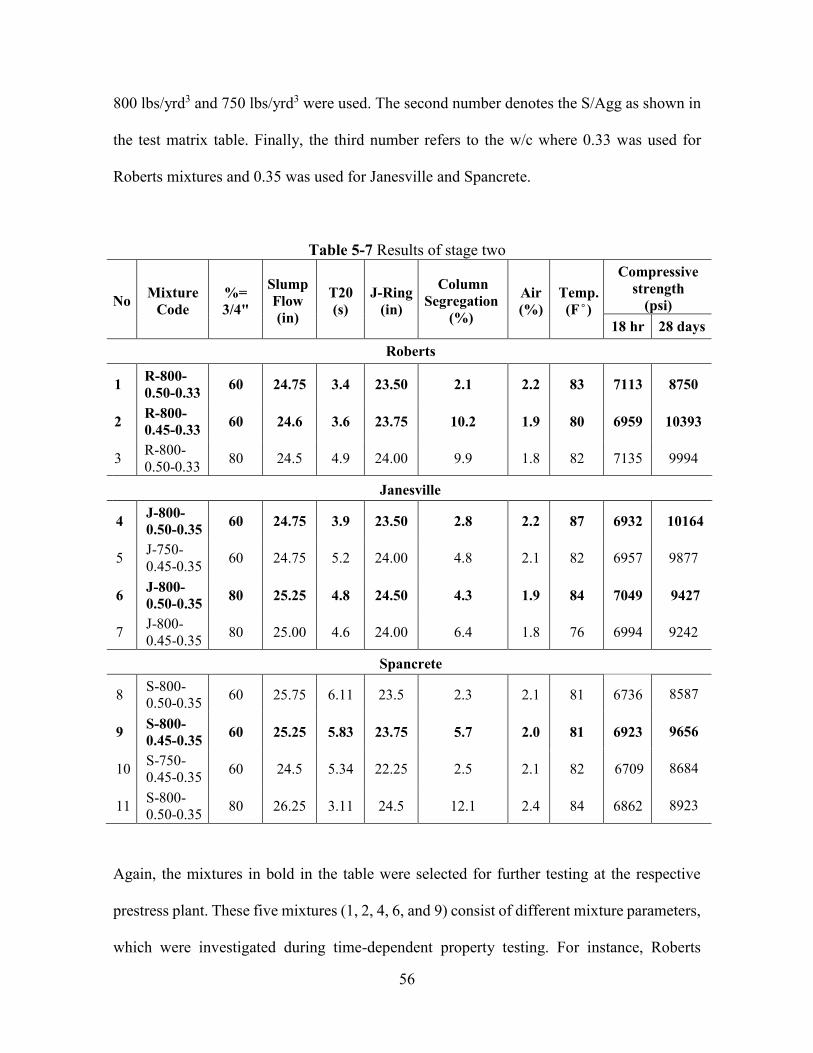
56
800 lbs/yrd3 and 750 lbs/yrd3 were used. The second number denotes the S/Agg as shown in
the test matrix table. Finally, the third number refers to the w/c where 0.33 was used for
Roberts mixtures and 0.35 was used for Janesville and Spancrete.
Table 5-7 Results of stage two
No Mixture Code
%= 3/4"
Slump Flow (in)
T20 (s)
J-Ring (in)
Column Segregation
(%)
Air (%)
Temp. (F ̊ )
Compressive strength
(psi) 18 hr 28 days
Roberts
1 R-800-0.50-0.33 60 24.75 3.4 23.50 2.1 2.2 83 7113 8750
2 R-800-0.45-0.33 60 24.6 3.6 23.75 10.2 1.9 80 6959 10393
3 R-800-0.50-0.33 80 24.5 4.9 24.00 9.9 1.8 82 7135 9994
Janesville
4 J-800-0.50-0.35 60 24.75 3.9 23.50 2.8 2.2 87 6932 10164
5 J-750-0.45-0.35 60 24.75 5.2 24.00 4.8 2.1 82 6957 9877
6 J-800-0.50-0.35 80 25.25 4.8 24.50 4.3 1.9 84 7049 9427
7 J-800-0.45-0.35 80 25.00 4.6 24.00 6.4 1.8 76 6994 9242
Spancrete
8 S-800-0.50-0.35 60 25.75 6.11 23.5 2.3 2.1 81 6736 8587
9 S-800-0.45-0.35 60 25.25 5.83 23.75 5.7 2.0 81 6923 9656
10 S-750-0.45-0.35 60 24.5 5.34 22.25 2.5 2.1 82 6709 8684
11 S-800-0.50-0.35 80 26.25 3.11 24.5 12.1 2.4 84 6862 8923
Again, the mixtures in bold in the table were selected for further testing at the respective
prestress plant. These five mixtures (1, 2, 4, 6, and 9) consist of different mixture parameters,
which were investigated during time-dependent property testing. For instance, Roberts
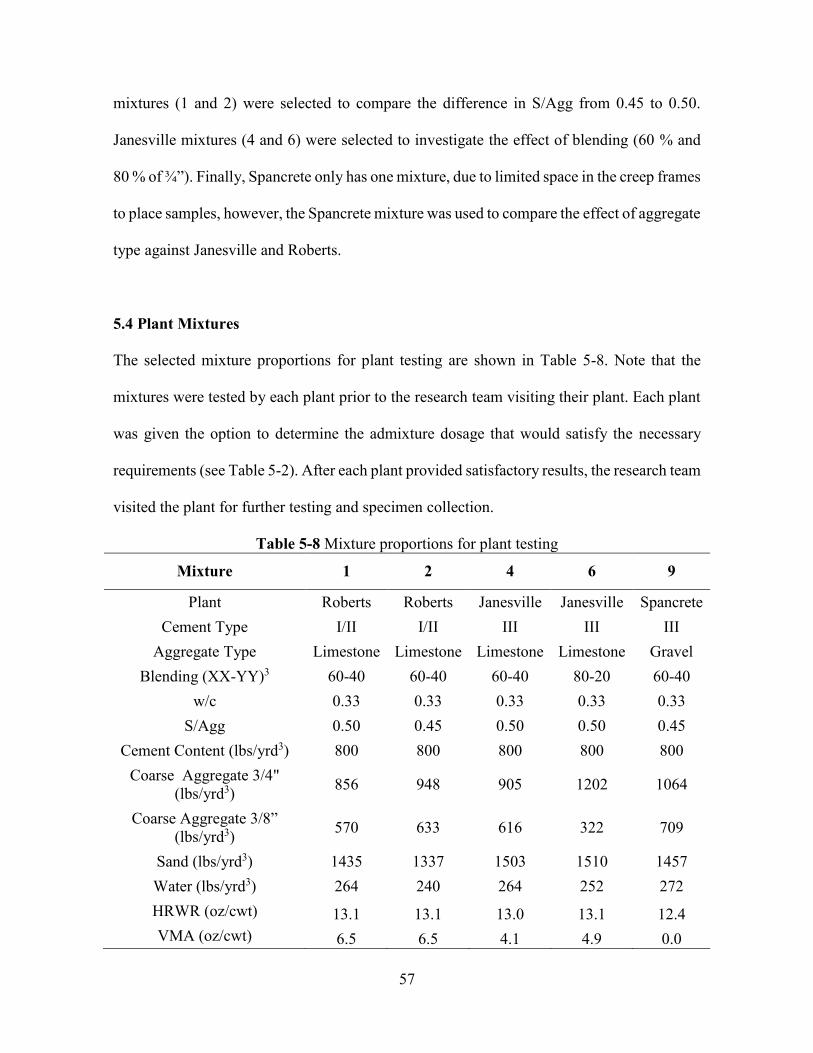
57
mixtures (1 and 2) were selected to compare the difference in S/Agg from 0.45 to 0.50.
Janesville mixtures (4 and 6) were selected to investigate the effect of blending (60 % and
80 % of ¾”). Finally, Spancrete only has one mixture, due to limited space in the creep frames
to place samples, however, the Spancrete mixture was used to compare the effect of aggregate
type against Janesville and Roberts.
5.4 Plant Mixtures
The selected mixture proportions for plant testing are shown in Table 5-8. Note that the
mixtures were tested by each plant prior to the research team visiting their plant. Each plant
was given the option to determine the admixture dosage that would satisfy the necessary
requirements (see Table 5-2). After each plant provided satisfactory results, the research team
visited the plant for further testing and specimen collection.
Table 5-8 Mixture proportions for plant testing
Mixture 1 2 4 6 9
Plant Roberts Roberts Janesville Janesville Spancrete Cement Type I/II I/II III III III
Aggregate Type Limestone Limestone Limestone Limestone Gravel Blending (XX-YY)3 60-40 60-40 60-40 80-20 60-40
w/c 0.33 0.33 0.33 0.33 0.33S/Agg 0.50 0.45 0.50 0.50 0.45
Cement Content (lbs/yrd3) 800 800 800 800 800Coarse Aggregate 3/4"
(lbs/yrd3) 856 948 905 1202 1064
Coarse Aggregate 3/8” (lbs/yrd3) 570 633 616 322 709
Sand (lbs/yrd3) 1435 1337 1503 1510 1457 Water (lbs/yrd3) 264 240 264 252 272 HRWR (oz/cwt) 13.1 13.1 13.0 13.1 12.4 VMA (oz/cwt) 6.5 6.5 4.1 4.9 0.0
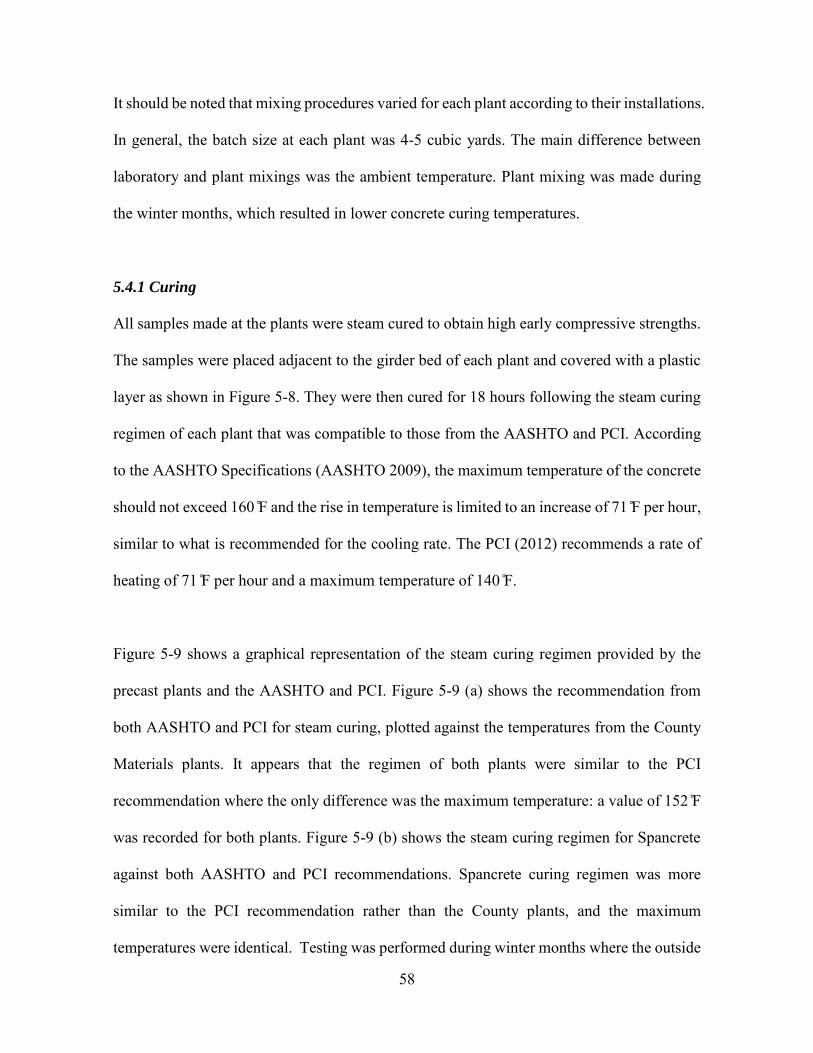
58
It should be noted that mixing procedures varied for each plant according to their installations.
In general, the batch size at each plant was 4-5 cubic yards. The main difference between
laboratory and plant mixings was the ambient temperature. Plant mixing was made during
the winter months, which resulted in lower concrete curing temperatures.
5.4.1 Curing
All samples made at the plants were steam cured to obtain high early compressive strengths.
The samples were placed adjacent to the girder bed of each plant and covered with a plastic
layer as shown in Figure 5-8. They were then cured for 18 hours following the steam curing
regimen of each plant that was compatible to those from the AASHTO and PCI. According
to the AASHTO Specifications (AASHTO 2009), the maximum temperature of the concrete
should not exceed 160 ̊F and the rise in temperature is limited to an increase of 71 ̊F per hour,
similar to what is recommended for the cooling rate. The PCI (2012) recommends a rate of
heating of 71 ̊F per hour and a maximum temperature of 140 ̊F.
Figure 5-9 shows a graphical representation of the steam curing regimen provided by the
precast plants and the AASHTO and PCI. Figure 5-9 (a) shows the recommendation from
both AASHTO and PCI for steam curing, plotted against the temperatures from the County
Materials plants. It appears that the regimen of both plants were similar to the PCI
recommendation where the only difference was the maximum temperature: a value of 152 ̊F
was recorded for both plants. Figure 5-9 (b) shows the steam curing regimen for Spancrete
against both AASHTO and PCI recommendations. Spancrete curing regimen was more
similar to the PCI recommendation rather than the County plants, and the maximum
temperatures were identical. Testing was performed during winter months where the outside

59
temperature was approximately 0 ̊F, and could have potentially lowered the steam
temperature in the girder bed. Note that lab concrete samples were cured at a constant
temperature of 110°F, which was not adjusted during the curing period.
To investigate the effects on shrinkage of steam curing and transportation of specimens from
the precast plant to the laboratory, it was decided to also cast samples in a laboratory setting.
The laboratory samples made for shrinkage tests were moist cured for 18 hours at a
temperature of 73 ± 4 ̊ F. Then, the samples were removed from the metal molds and placed
in a temperature controlled room to be air cured with the plant samples. This environment
experienced controlled temperatures, with recordings taken twice a week showing a range
between 72 and 73 ̊ F. The humidity experienced some changes, with recordings dropping
from a weekly average of 50 % at day 140.
Figure 5-8 Creep samples placed adjacent to girder bed for steam curing
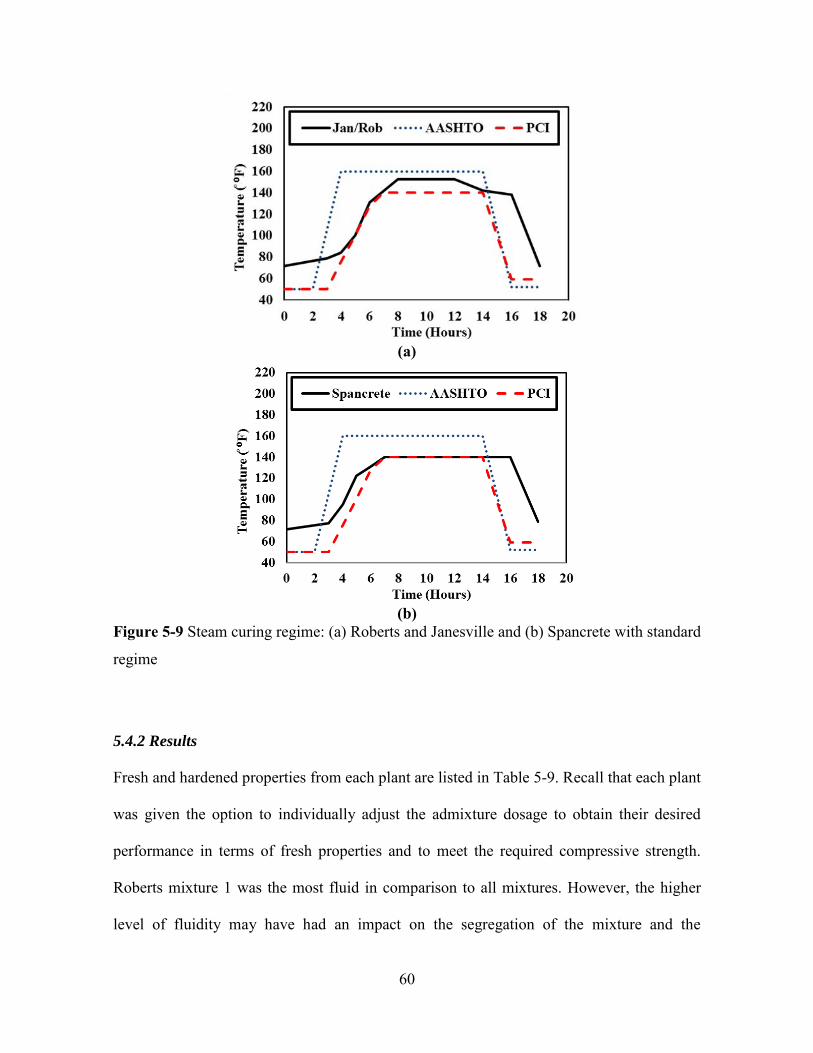
60
(a)
(b)
Figure 5-9 Steam curing regime: (a) Roberts and Janesville and (b) Spancrete with standard
regime
5.4.2 Results
Fresh and hardened properties from each plant are listed in Table 5-9. Recall that each plant
was given the option to individually adjust the admixture dosage to obtain their desired
performance in terms of fresh properties and to meet the required compressive strength.
Roberts mixture 1 was the most fluid in comparison to all mixtures. However, the higher
level of fluidity may have had an impact on the segregation of the mixture and the
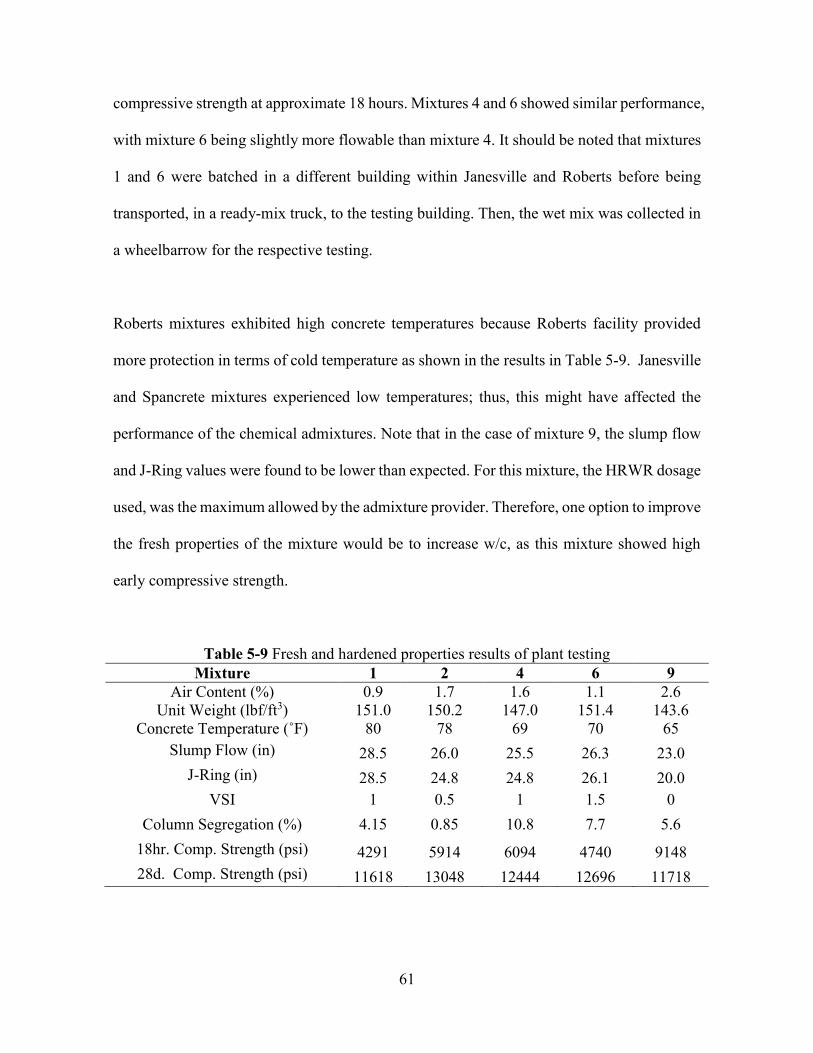
61
compressive strength at approximate 18 hours. Mixtures 4 and 6 showed similar performance,
with mixture 6 being slightly more flowable than mixture 4. It should be noted that mixtures
1 and 6 were batched in a different building within Janesville and Roberts before being
transported, in a ready-mix truck, to the testing building. Then, the wet mix was collected in
a wheelbarrow for the respective testing.
Roberts mixtures exhibited high concrete temperatures because Roberts facility provided
more protection in terms of cold temperature as shown in the results in Table 5-9. Janesville
and Spancrete mixtures experienced low temperatures; thus, this might have affected the
performance of the chemical admixtures. Note that in the case of mixture 9, the slump flow
and J-Ring values were found to be lower than expected. For this mixture, the HRWR dosage
used, was the maximum allowed by the admixture provider. Therefore, one option to improve
the fresh properties of the mixture would be to increase w/c, as this mixture showed high
early compressive strength.
Table 5-9 Fresh and hardened properties results of plant testing Mixture 1 2 4 6 9
Air Content (%) 0.9 1.7 1.6 1.1 2.6 Unit Weight (lbf/ft3) 151.0 150.2 147.0 151.4 143.6
Concrete Temperature (˚F) 80 78 69 70 65 Slump Flow (in) 28.5 26.0 25.5 26.3 23.0
J-Ring (in) 28.5 24.8 24.8 26.1 20.0 VSI 1 0.5 1 1.5 0
Column Segregation (%) 4.15 0.85 10.8 7.7 5.6 18hr. Comp. Strength (psi) 4291 5914 6094 4740 9148 28d. Comp. Strength (psi) 11618 13048 12444 12696 11718
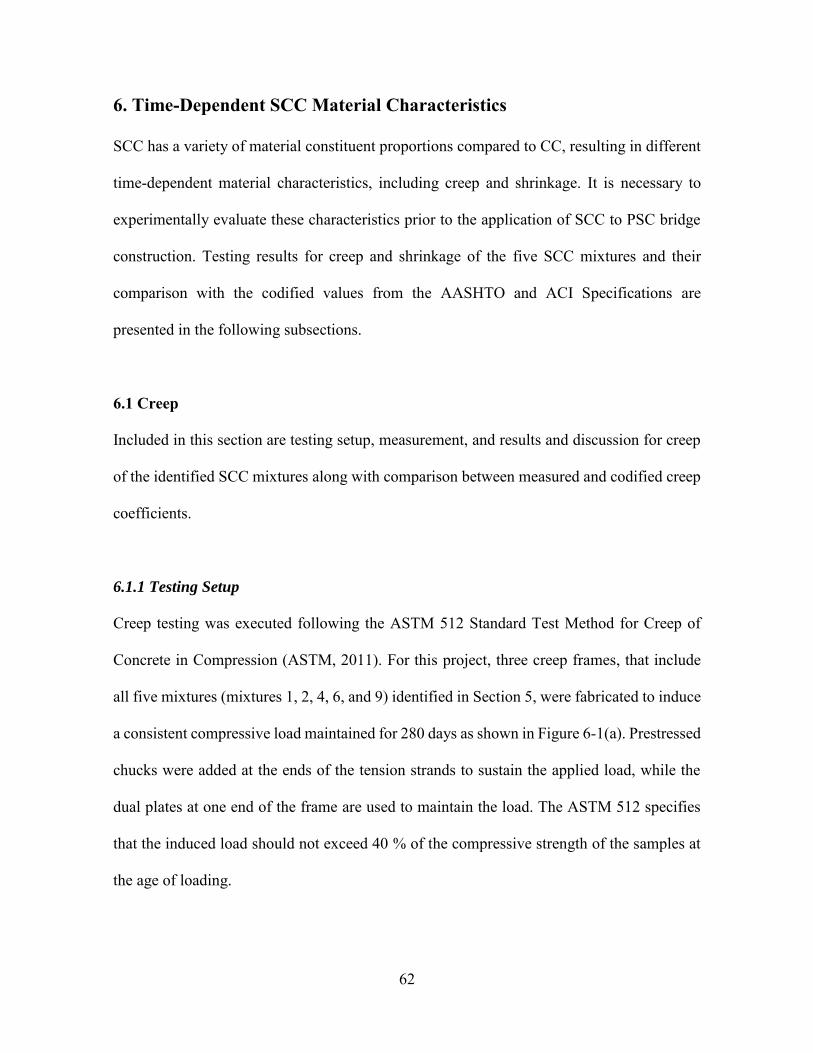
62
6. Time-Dependent SCC Material Characteristics
SCC has a variety of material constituent proportions compared to CC, resulting in different
time-dependent material characteristics, including creep and shrinkage. It is necessary to
experimentally evaluate these characteristics prior to the application of SCC to PSC bridge
construction. Testing results for creep and shrinkage of the five SCC mixtures and their
comparison with the codified values from the AASHTO and ACI Specifications are
presented in the following subsections.
6.1 Creep
Included in this section are testing setup, measurement, and results and discussion for creep
of the identified SCC mixtures along with comparison between measured and codified creep
coefficients.
6.1.1 Testing Setup
Creep testing was executed following the ASTM 512 Standard Test Method for Creep of
Concrete in Compression (ASTM, 2011). For this project, three creep frames, that include
all five mixtures (mixtures 1, 2, 4, 6, and 9) identified in Section 5, were fabricated to induce
a consistent compressive load maintained for 280 days as shown in Figure 6-1(a). Prestressed
chucks were added at the ends of the tension strands to sustain the applied load, while the
dual plates at one end of the frame are used to maintain the load. The ASTM 512 specifies
that the induced load should not exceed 40 % of the compressive strength of the samples at
the age of loading.
63
To simulate the placement of the concrete deck on the girder, the load induced into the creep
frames was 2000 psi, which was below 40 % of the compressive strength. To ensure uniform
distribution and transmission of the load between cylinders, neoprene pads were placed at
the ends and between cylinders. Five 6” x 12” cylinders were placed in each frame as shown
in Figure 6-1(a). Note that three cylinders for each of the identified mixtures were made,
resulting in fifteen total cylinders. Each cylinder was outfitted with two metal tabs on
opposite sides of the cylinder, with 10 in. spacing between them. This method allows for a
comparison of each side of each cylinder, and to develop the overall compression of each
cylinder through an average of both measurements. The metal tabs were embedded in
cylinders shown in Figure 6-1(b).
(a)
(b)
Figure 6-1 Creep test setup: (a) loaded creep frame and (b) cylinder with brass inserts on both sides
6.1.2 Creep Measurement
A multi-length strain change extensometer was used to measure strain changes between the
metal tabs for each of the cylinders per frame (see Figure 6-2(a)). Each reading with the
extensometer had a precision of 0.0001 in. Three readings were taken on each side of the
cylinder with calibration bar measurements taken between each reading, and then the average
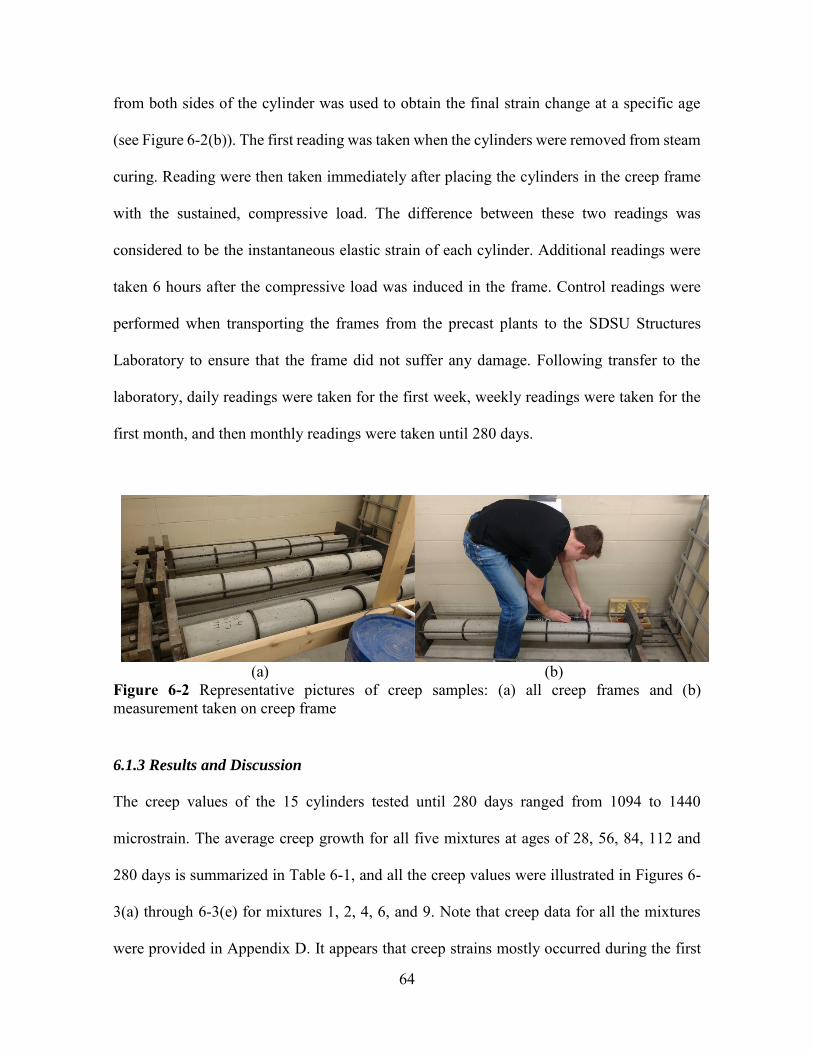
64
from both sides of the cylinder was used to obtain the final strain change at a specific age
(see Figure 6-2(b)). The first reading was taken when the cylinders were removed from steam
curing. Reading were then taken immediately after placing the cylinders in the creep frame
with the sustained, compressive load. The difference between these two readings was
considered to be the instantaneous elastic strain of each cylinder. Additional readings were
taken 6 hours after the compressive load was induced in the frame. Control readings were
performed when transporting the frames from the precast plants to the SDSU Structures
Laboratory to ensure that the frame did not suffer any damage. Following transfer to the
laboratory, daily readings were taken for the first week, weekly readings were taken for the
first month, and then monthly readings were taken until 280 days.
(a)
(b)
Figure 6-2 Representative pictures of creep samples: (a) all creep frames and (b) measurement taken on creep frame
6.1.3 Results and Discussion
The creep values of the 15 cylinders tested until 280 days ranged from 1094 to 1440
microstrain. The average creep growth for all five mixtures at ages of 28, 56, 84, 112 and
280 days is summarized in Table 6-1, and all the creep values were illustrated in Figures 6-
3(a) through 6-3(e) for mixtures 1, 2, 4, 6, and 9. Note that creep data for all the mixtures
were provided in Appendix D. It appears that creep strains mostly occurred during the first
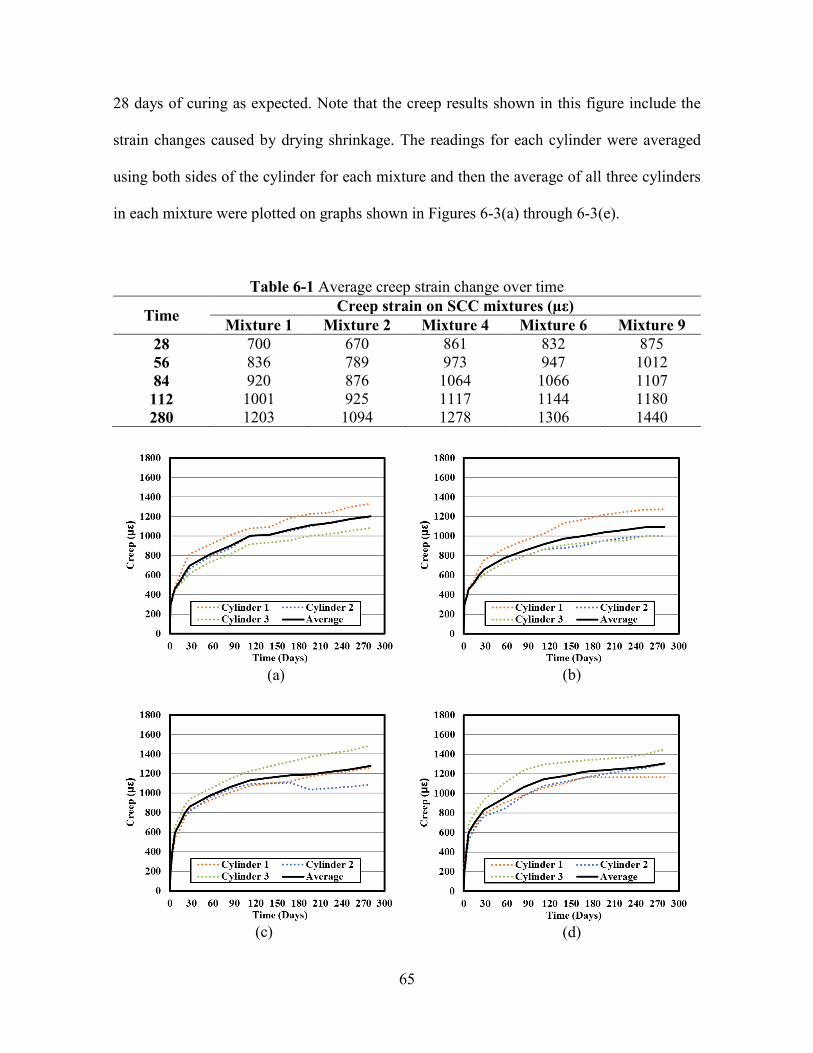
65
28 days of curing as expected. Note that the creep results shown in this figure include the
strain changes caused by drying shrinkage. The readings for each cylinder were averaged
using both sides of the cylinder for each mixture and then the average of all three cylinders
in each mixture were plotted on graphs shown in Figures 6-3(a) through 6-3(e).
Table 6-1 Average creep strain change over time
Time Creep strain on SCC mixtures (µε) Mixture 1 Mixture 2 Mixture 4 Mixture 6 Mixture 9
28 700 670 861 832 875 56 836 789 973 947 1012 84 920 876 1064 1066 1107 112 1001 925 1117 1144 1180 280 1203 1094 1278 1306 1440
(a)
(b)
(c)
(d)
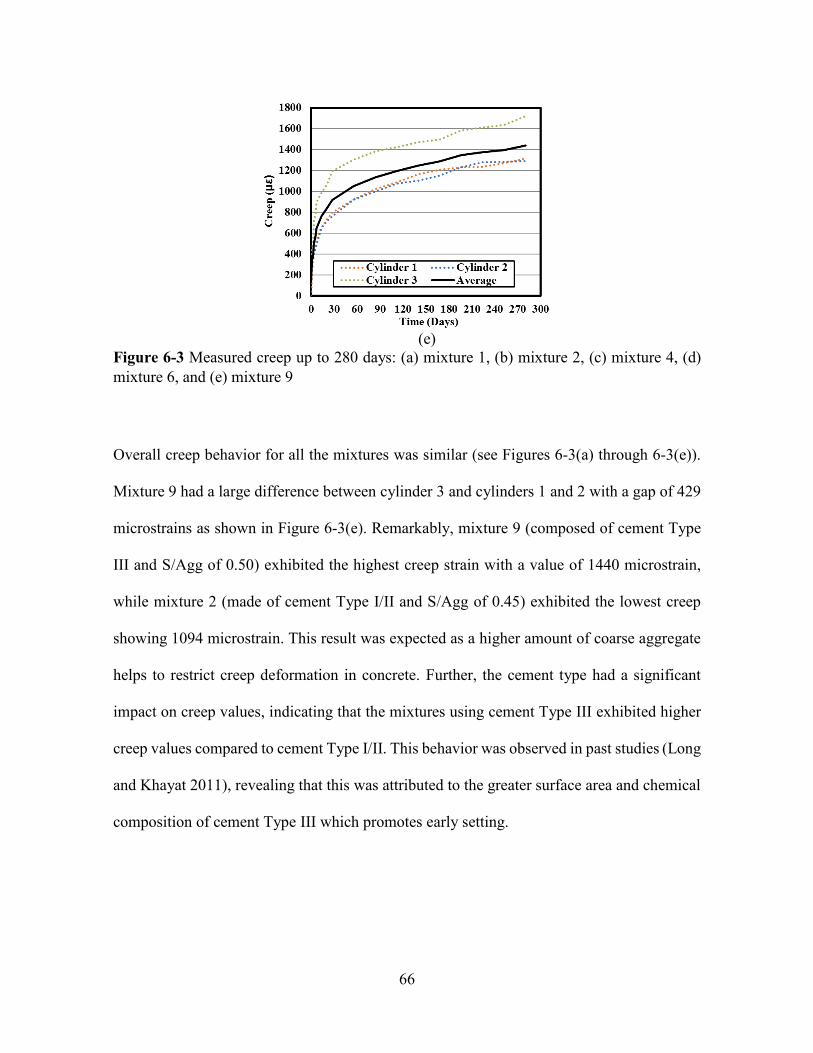
66
(e)
Figure 6-3 Measured creep up to 280 days: (a) mixture 1, (b) mixture 2, (c) mixture 4, (d) mixture 6, and (e) mixture 9
Overall creep behavior for all the mixtures was similar (see Figures 6-3(a) through 6-3(e)).
Mixture 9 had a large difference between cylinder 3 and cylinders 1 and 2 with a gap of 429
microstrains as shown in Figure 6-3(e). Remarkably, mixture 9 (composed of cement Type
III and S/Agg of 0.50) exhibited the highest creep strain with a value of 1440 microstrain,
while mixture 2 (made of cement Type I/II and S/Agg of 0.45) exhibited the lowest creep
showing 1094 microstrain. This result was expected as a higher amount of coarse aggregate
helps to restrict creep deformation in concrete. Further, the cement type had a significant
impact on creep values, indicating that the mixtures using cement Type III exhibited higher
creep values compared to cement Type I/II. This behavior was observed in past studies (Long
and Khayat 2011), revealing that this was attributed to the greater surface area and chemical
composition of cement Type III which promotes early setting.
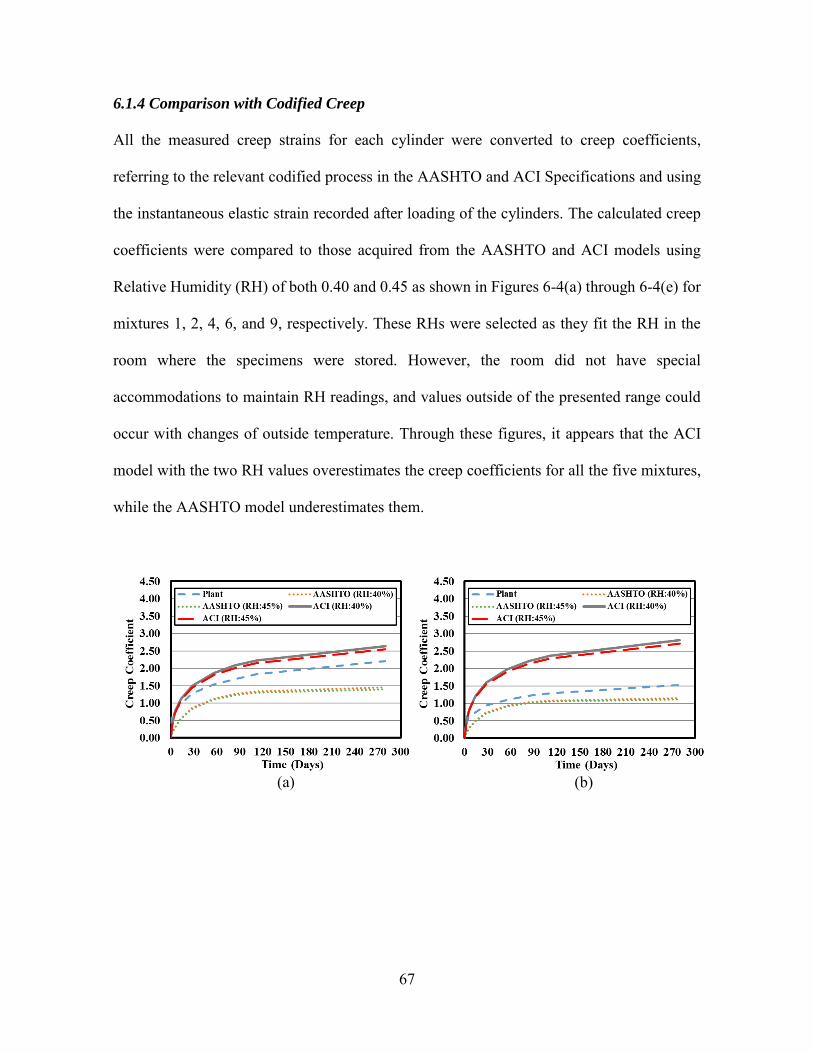
67
6.1.4 Comparison with Codified Creep
All the measured creep strains for each cylinder were converted to creep coefficients,
referring to the relevant codified process in the AASHTO and ACI Specifications and using
the instantaneous elastic strain recorded after loading of the cylinders. The calculated creep
coefficients were compared to those acquired from the AASHTO and ACI models using
Relative Humidity (RH) of both 0.40 and 0.45 as shown in Figures 6-4(a) through 6-4(e) for
mixtures 1, 2, 4, 6, and 9, respectively. These RHs were selected as they fit the RH in the
room where the specimens were stored. However, the room did not have special
accommodations to maintain RH readings, and values outside of the presented range could
occur with changes of outside temperature. Through these figures, it appears that the ACI
model with the two RH values overestimates the creep coefficients for all the five mixtures,
while the AASHTO model underestimates them.
(a)
(b)
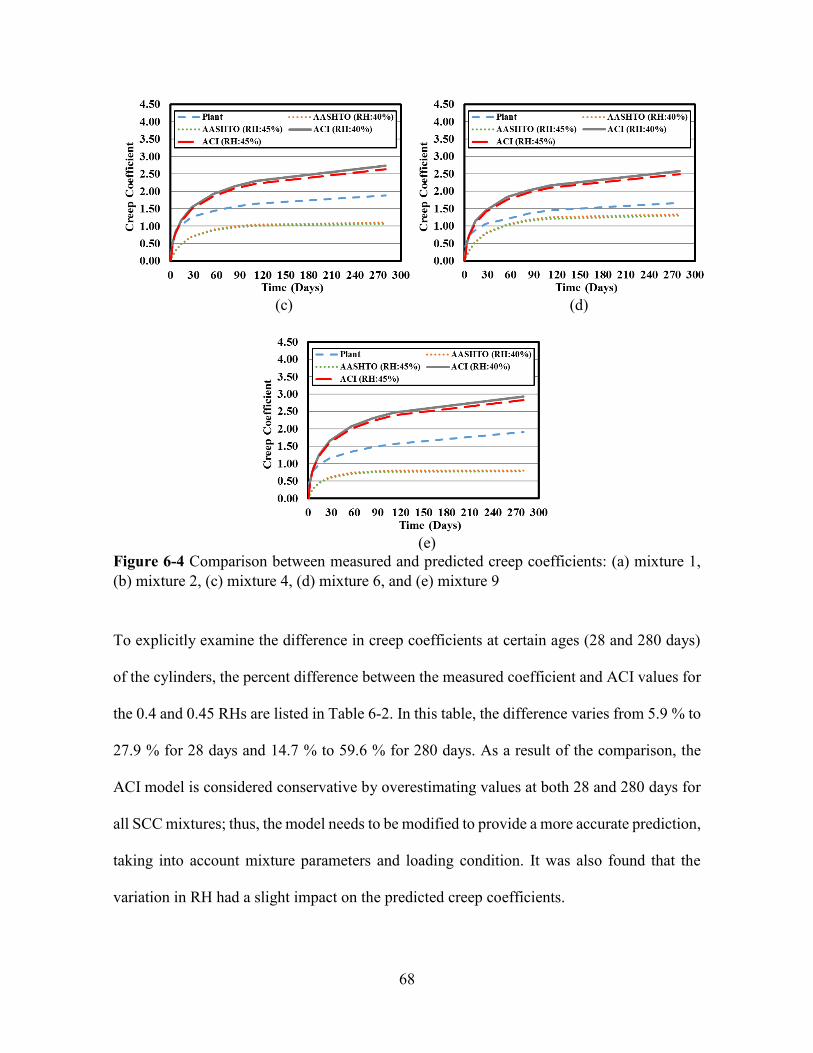
68
(c)
(d)
(e)
Figure 6-4 Comparison between measured and predicted creep coefficients: (a) mixture 1, (b) mixture 2, (c) mixture 4, (d) mixture 6, and (e) mixture 9
To explicitly examine the difference in creep coefficients at certain ages (28 and 280 days)
of the cylinders, the percent difference between the measured coefficient and ACI values for
the 0.4 and 0.45 RHs are listed in Table 6-2. In this table, the difference varies from 5.9 % to
27.9 % for 28 days and 14.7 % to 59.6 % for 280 days. As a result of the comparison, the
ACI model is considered conservative by overestimating values at both 28 and 280 days for
all SCC mixtures; thus, the model needs to be modified to provide a more accurate prediction,
taking into account mixture parameters and loading condition. It was also found that the
variation in RH had a slight impact on the predicted creep coefficients.
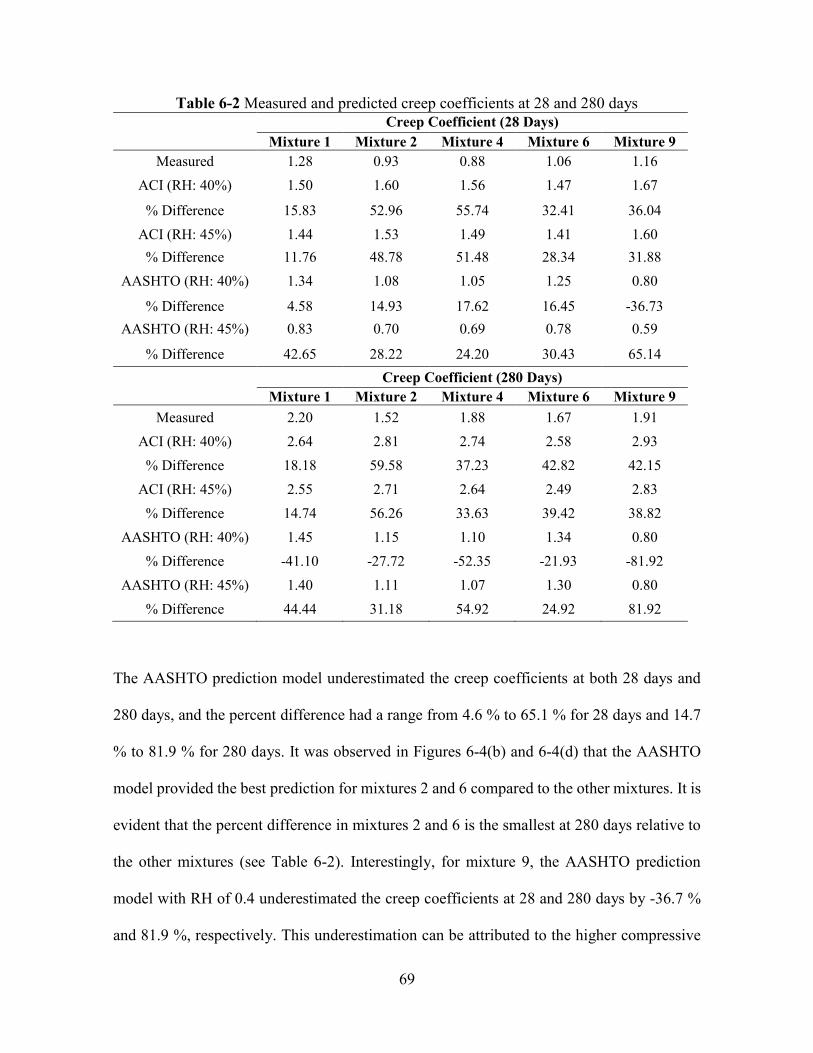
69
Table 6-2 Measured and predicted creep coefficients at 28 and 280 days
Creep Coefficient (28 Days) Mixture 1 Mixture 2 Mixture 4 Mixture 6 Mixture 9
Measured 1.28 0.93 0.88 1.06 1.16 ACI (RH: 40%) 1.50 1.60 1.56 1.47 1.67
% Difference 15.83 52.96 55.74 32.41 36.04 ACI (RH: 45%) 1.44 1.53 1.49 1.41 1.60
% Difference 11.76 48.78 51.48 28.34 31.88 AASHTO (RH: 40%) 1.34 1.08 1.05 1.25 0.80
% Difference 4.58 14.93 17.62 16.45 -36.73 AASHTO (RH: 45%) 0.83 0.70 0.69 0.78 0.59
% Difference 42.65 28.22 24.20 30.43 65.14 Creep Coefficient (280 Days) Mixture 1 Mixture 2 Mixture 4 Mixture 6 Mixture 9
Measured 2.20 1.52 1.88 1.67 1.91 ACI (RH: 40%) 2.64 2.81 2.74 2.58 2.93
% Difference 18.18 59.58 37.23 42.82 42.15 ACI (RH: 45%) 2.55 2.71 2.64 2.49 2.83
% Difference 14.74 56.26 33.63 39.42 38.82 AASHTO (RH: 40%) 1.45 1.15 1.10 1.34 0.80
% Difference -41.10 -27.72 -52.35 -21.93 -81.92 AASHTO (RH: 45%) 1.40 1.11 1.07 1.30 0.80
% Difference 44.44 31.18 54.92 24.92 81.92
The AASHTO prediction model underestimated the creep coefficients at both 28 days and
280 days, and the percent difference had a range from 4.6 % to 65.1 % for 28 days and 14.7
% to 81.9 % for 280 days. It was observed in Figures 6-4(b) and 6-4(d) that the AASHTO
model provided the best prediction for mixtures 2 and 6 compared to the other mixtures. It is
evident that the percent difference in mixtures 2 and 6 is the smallest at 280 days relative to
the other mixtures (see Table 6-2). Interestingly, for mixture 9, the AASHTO prediction
model with RH of 0.4 underestimated the creep coefficients at 28 and 280 days by -36.7 %
and 81.9 %, respectively. This underestimation can be attributed to the higher compressive

70
strength of this mixture at the loading time as shown in Table 6-2. It should be noted that the
AASHTO model used to predict creep coefficients accounts for environmental, exposure and
compressive strength conditions. Due to the small amount of variables in the prediction
model, it results in more sensitivity to the variation of each parameters. In terms of creep
testing, increased compressive strength significantly reduced the accuracy of the model.
To obtain a better understanding of creep behavior measured from this project, some
discussion regarding the comparison of creep values gained from this project and past studies
is needed. However, it is difficult to compare creep results to other studies due to the
difference in the constant loading, age of loading and mixture constituents. It should be also
noted that the effect of only creep from the results cannot be isolated as the cylinders for
creep had shrinkage deformations.
6.2 Shrinkage
This section focuses on testing setup, measurement, results and discussion, and comparison
with codified values for shrinkage of all the mixtures used in the testing for creep.
6.2.1 Testing Setup
To investigate shrinkage behavior, two sets of SCC mixtures were cast. The first set consisted
of mixtures made at each plant which were then transported to the laboratory, while the
second set consisted of mixtures made at the laboratory using same proportions as mixtures
made at the plants. The second set of samples was used to compare and determine the effect
of the storing conditions during transport regarding early shrinkage.
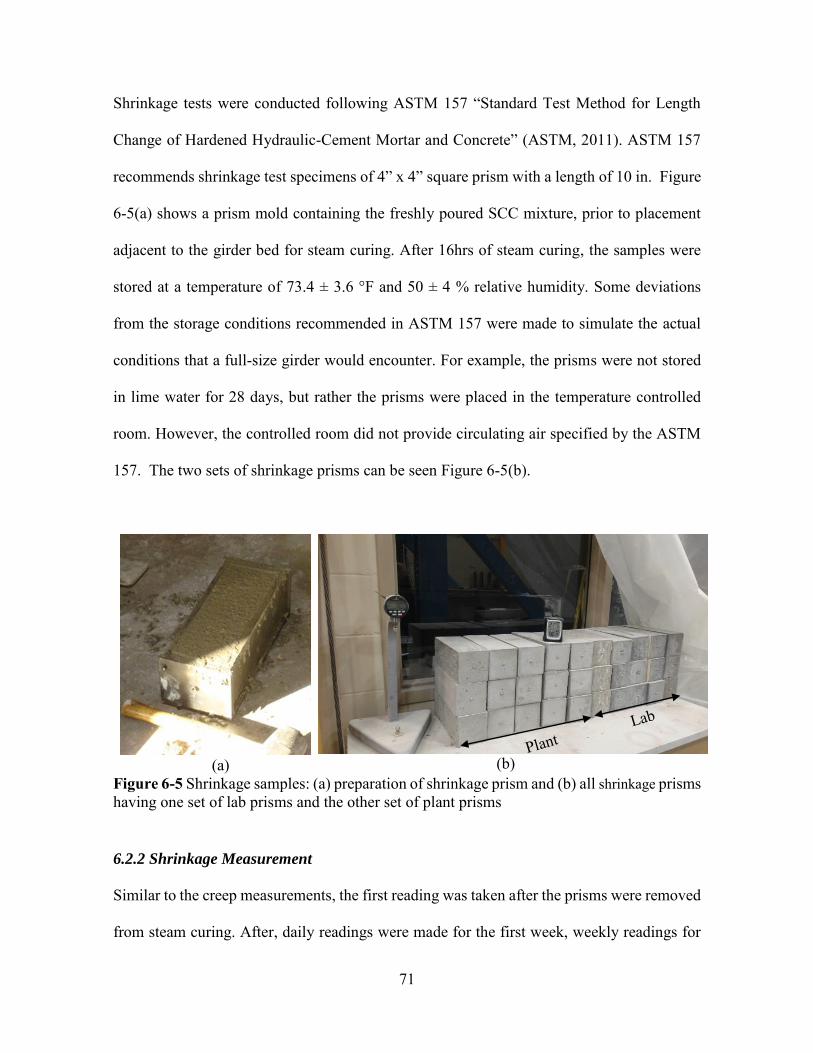
71
Shrinkage tests were conducted following ASTM 157 “Standard Test Method for Length
Change of Hardened Hydraulic-Cement Mortar and Concrete” (ASTM, 2011). ASTM 157
recommends shrinkage test specimens of 4” x 4” square prism with a length of 10 in. Figure
6-5(a) shows a prism mold containing the freshly poured SCC mixture, prior to placement
adjacent to the girder bed for steam curing. After 16hrs of steam curing, the samples were
stored at a temperature of 73.4 ± 3.6 °F and 50 ± 4 % relative humidity. Some deviations
from the storage conditions recommended in ASTM 157 were made to simulate the actual
conditions that a full-size girder would encounter. For example, the prisms were not stored
in lime water for 28 days, but rather the prisms were placed in the temperature controlled
room. However, the controlled room did not provide circulating air specified by the ASTM
157. The two sets of shrinkage prisms can be seen Figure 6-5(b).
(a)
(b)
Figure 6-5 Shrinkage samples: (a) preparation of shrinkage prism and (b) all shrinkage prisms having one set of lab prisms and the other set of plant prisms
6.2.2 Shrinkage Measurement
Similar to the creep measurements, the first reading was taken after the prisms were removed
from steam curing. After, daily readings were made for the first week, weekly readings for

72
the first month, and monthly readings until 280 days. Readings were taken using a HM-
250D Length Comparator with a digital indicator as shown in Figure 6-6. This apparatus took
readings with a precision of 0.000098 in. The difference in length between the calibration
bar and the prisms was recorded three times for each prism, and then the average was used
for the respective curing age.
Figure 6-6 Display of shrinkage prisms sample measurement using digital length comparator
6.2.3 Results and Discussion
The shrinkage results for the prisms made at plants are shown in Figures 6-7(a) through 6-
7(e) for mixtures 1, 2, 4, 6 and 9. In particular, these figures illustrate shrinkage growth for
each prism and the average of all prisms of the respective mixture. After 120 days, some
peaks and pitfalls were observed for mixtures 1 and 2, but the trend continued the anticipated
path afterward. The average shrinkage values for all the mixtures ranged from 567 to 850
microstrain at 280 days. Detailed shinkage results for all the mixtures can be found in
Appendix D.
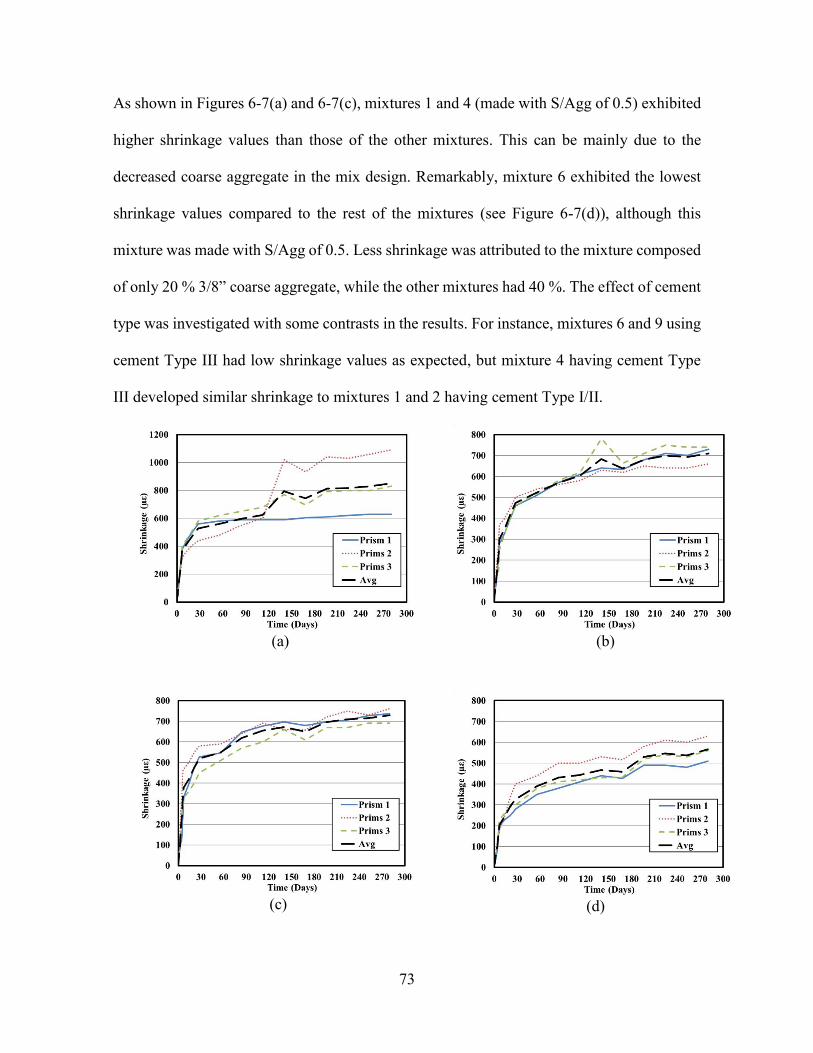
73
As shown in Figures 6-7(a) and 6-7(c), mixtures 1 and 4 (made with S/Agg of 0.5) exhibited
higher shrinkage values than those of the other mixtures. This can be mainly due to the
decreased coarse aggregate in the mix design. Remarkably, mixture 6 exhibited the lowest
shrinkage values compared to the rest of the mixtures (see Figure 6-7(d)), although this
mixture was made with S/Agg of 0.5. Less shrinkage was attributed to the mixture composed
of only 20 % 3/8” coarse aggregate, while the other mixtures had 40 %. The effect of cement
type was investigated with some contrasts in the results. For instance, mixtures 6 and 9 using
cement Type III had low shrinkage values as expected, but mixture 4 having cement Type
III developed similar shrinkage to mixtures 1 and 2 having cement Type I/II.
(a)
(b)
(c)
(d)
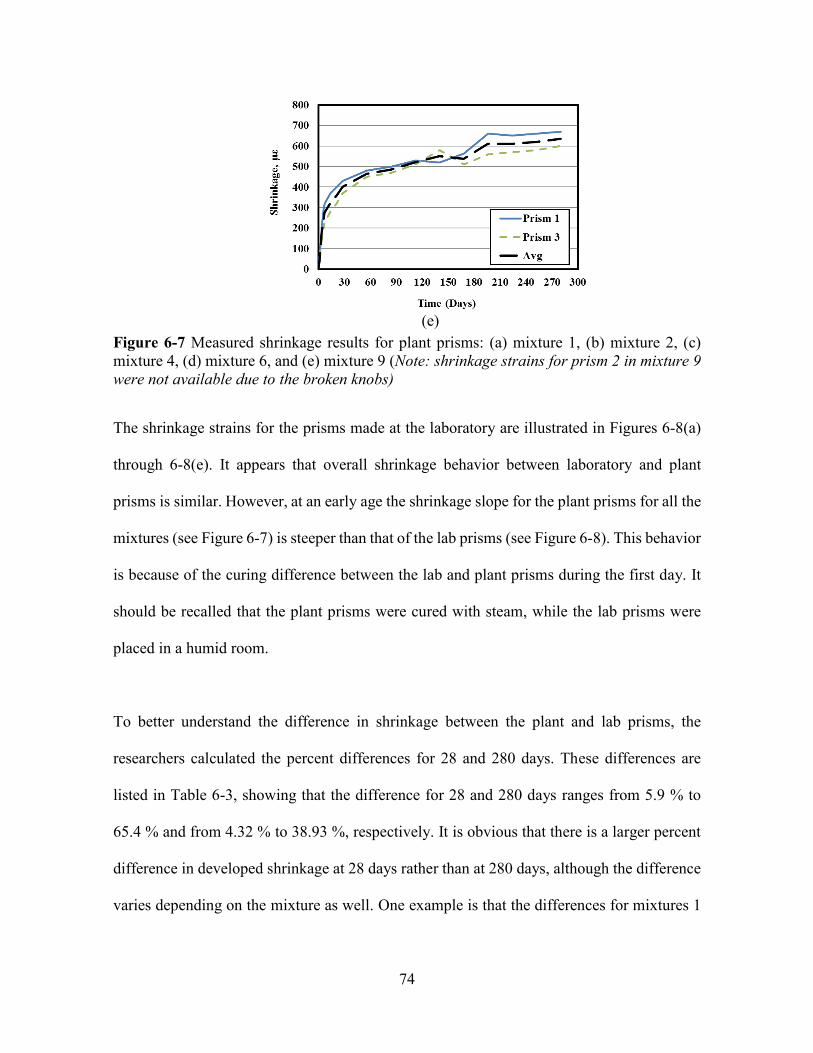
74
(e)
Figure 6-7 Measured shrinkage results for plant prisms: (a) mixture 1, (b) mixture 2, (c) mixture 4, (d) mixture 6, and (e) mixture 9 (Note: shrinkage strains for prism 2 in mixture 9 were not available due to the broken knobs)
The shrinkage strains for the prisms made at the laboratory are illustrated in Figures 6-8(a)
through 6-8(e). It appears that overall shrinkage behavior between laboratory and plant
prisms is similar. However, at an early age the shrinkage slope for the plant prisms for all the
mixtures (see Figure 6-7) is steeper than that of the lab prisms (see Figure 6-8). This behavior
is because of the curing difference between the lab and plant prisms during the first day. It
should be recalled that the plant prisms were cured with steam, while the lab prisms were
placed in a humid room.
To better understand the difference in shrinkage between the plant and lab prisms, the
researchers calculated the percent differences for 28 and 280 days. These differences are
listed in Table 6-3, showing that the difference for 28 and 280 days ranges from 5.9 % to
65.4 % and from 4.32 % to 38.93 %, respectively. It is obvious that there is a larger percent
difference in developed shrinkage at 28 days rather than at 280 days, although the difference
varies depending on the mixture as well. One example is that the differences for mixtures 1
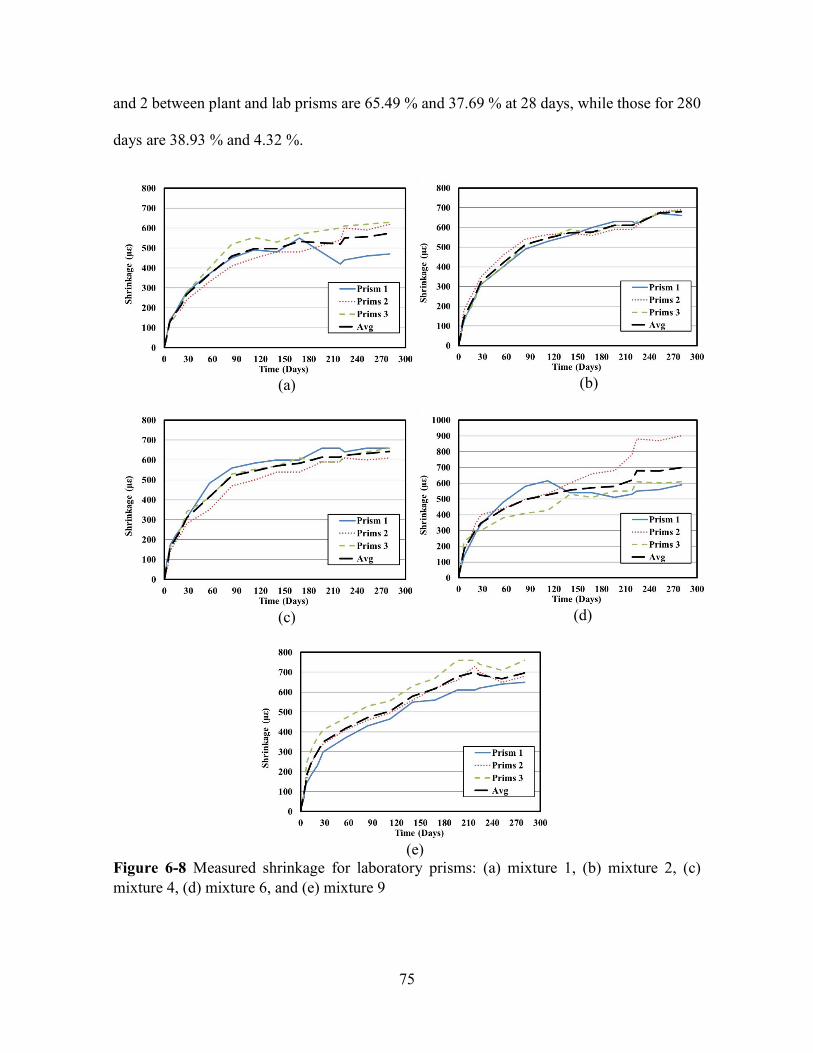
75
and 2 between plant and lab prisms are 65.49 % and 37.69 % at 28 days, while those for 280
days are 38.93 % and 4.32 %.
(a)
(b)
(c)
(d)
(e)
Figure 6-8 Measured shrinkage for laboratory prisms: (a) mixture 1, (b) mixture 2, (c) mixture 4, (d) mixture 6, and (e) mixture 9
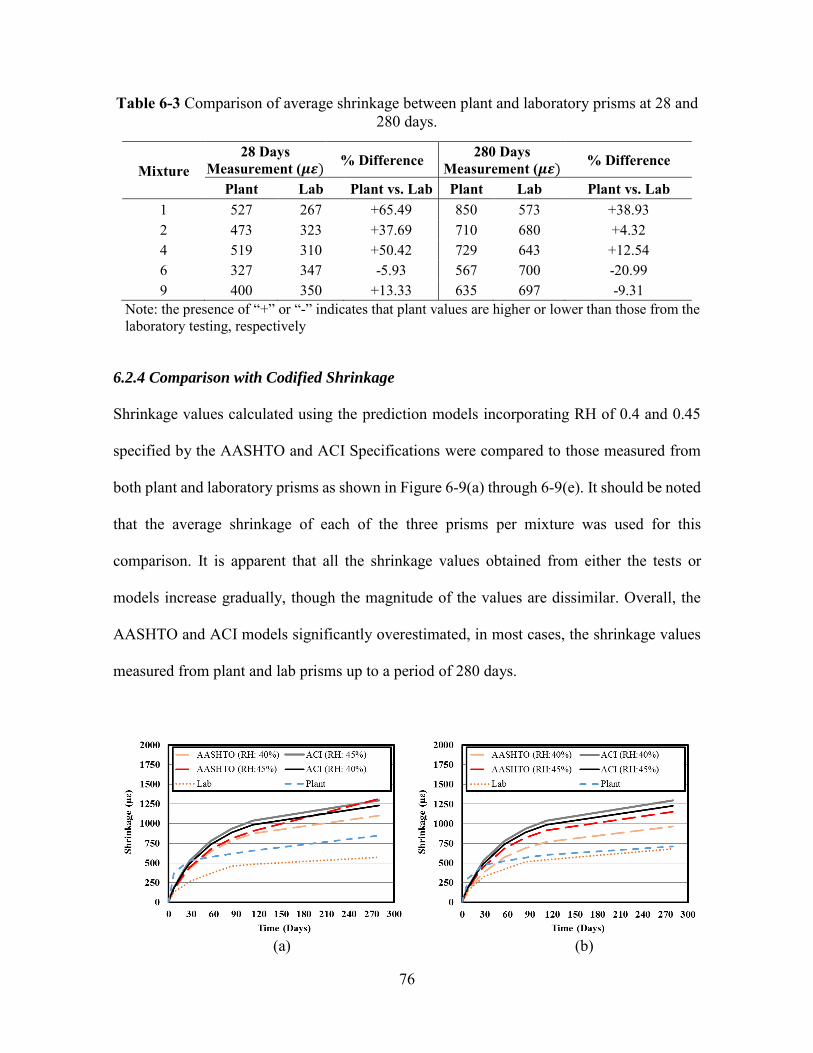
76
Table 6-3 Comparison of average shrinkage between plant and laboratory prisms at 28 and 280 days.
Mixture 28 Days
Measurement (𝝁𝜺) % Difference 280 Days Measurement (𝝁𝜺) % Difference
Plant Lab Plant vs. Lab Plant Lab Plant vs. Lab 1 527 267 +65.49 850 573 +38.93 2 473 323 +37.69 710 680 +4.32 4 519 310 +50.42 729 643 +12.54 6 327 347 -5.93 567 700 -20.99 9 400 350 +13.33 635 697 -9.31
Note: the presence of “+” or “-” indicates that plant values are higher or lower than those from the laboratory testing, respectively
6.2.4 Comparison with Codified Shrinkage
Shrinkage values calculated using the prediction models incorporating RH of 0.4 and 0.45
specified by the AASHTO and ACI Specifications were compared to those measured from
both plant and laboratory prisms as shown in Figure 6-9(a) through 6-9(e). It should be noted
that the average shrinkage of each of the three prisms per mixture was used for this
comparison. It is apparent that all the shrinkage values obtained from either the tests or
models increase gradually, though the magnitude of the values are dissimilar. Overall, the
AASHTO and ACI models significantly overestimated, in most cases, the shrinkage values
measured from plant and lab prisms up to a period of 280 days.
(a)
(b)
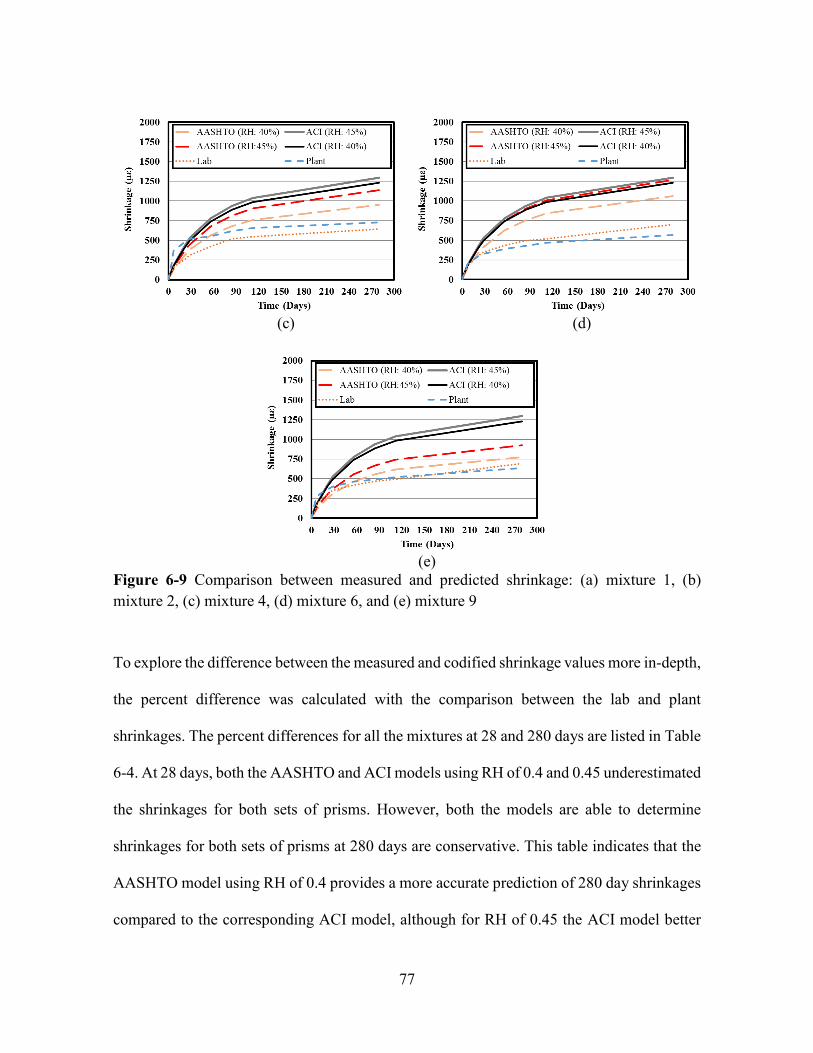
77
(c)
(d)
(e)
Figure 6-9 Comparison between measured and predicted shrinkage: (a) mixture 1, (b) mixture 2, (c) mixture 4, (d) mixture 6, and (e) mixture 9
To explore the difference between the measured and codified shrinkage values more in-depth,
the percent difference was calculated with the comparison between the lab and plant
shrinkages. The percent differences for all the mixtures at 28 and 280 days are listed in Table
6-4. At 28 days, both the AASHTO and ACI models using RH of 0.4 and 0.45 underestimated
the shrinkages for both sets of prisms. However, both the models are able to determine
shrinkages for both sets of prisms at 280 days are conservative. This table indicates that the
AASHTO model using RH of 0.4 provides a more accurate prediction of 280 day shrinkages
compared to the corresponding ACI model, although for RH of 0.45 the ACI model better
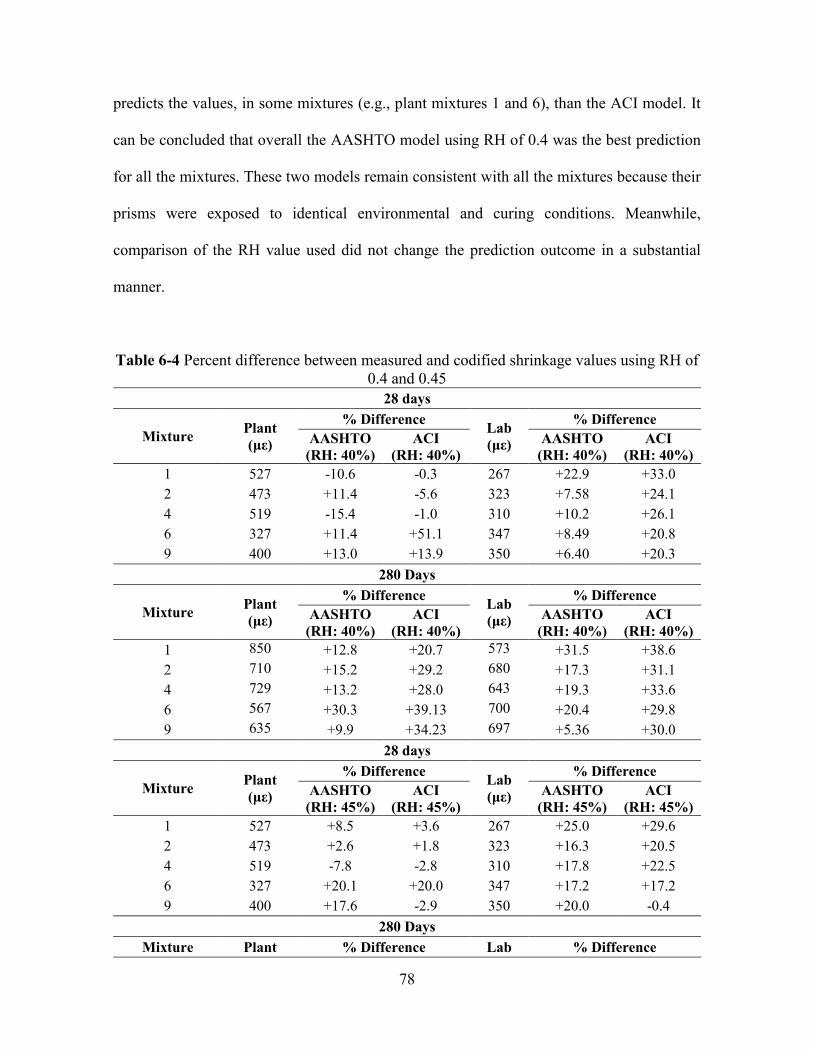
78
predicts the values, in some mixtures (e.g., plant mixtures 1 and 6), than the ACI model. It
can be concluded that overall the AASHTO model using RH of 0.4 was the best prediction
for all the mixtures. These two models remain consistent with all the mixtures because their
prisms were exposed to identical environmental and curing conditions. Meanwhile,
comparison of the RH value used did not change the prediction outcome in a substantial
manner.
Table 6-4 Percent difference between measured and codified shrinkage values using RH of 0.4 and 0.45
28 days
Mixture Plant (με)
% Difference Lab (με)
% Difference AASHTO (RH: 40%)
ACI (RH: 40%)
AASHTO (RH: 40%)
ACI (RH: 40%)
1 527 -10.6 -0.3 267 +22.9 +33.0 2 473 +11.4 -5.6 323 +7.58 +24.1 4 519 -15.4 -1.0 310 +10.2 +26.1 6 327 +11.4 +51.1 347 +8.49 +20.8 9 400 +13.0 +13.9 350 +6.40 +20.3
280 Days
Mixture Plant (με)
% Difference Lab (με)
% Difference AASHTO (RH: 40%)
ACI (RH: 40%)
AASHTO (RH: 40%)
ACI (RH: 40%)
1 850 +12.8 +20.7 573 +31.5 +38.6 2 710 +15.2 +29.2 680 +17.3 +31.1 4 729 +13.2 +28.0 643 +19.3 +33.6 6 567 +30.3 +39.13 700 +20.4 +29.8 9 635 +9.9 +34.23 697 +5.36 +30.0
28 days
Mixture Plant (με)
% Difference Lab (με)
% Difference AASHTO (RH: 45%)
ACI (RH: 45%)
AASHTO (RH: 45%)
ACI (RH: 45%)
1 527 +8.5 +3.6 267 +25.0 +29.6 2 473 +2.6 +1.8 323 +16.3 +20.5 4 519 -7.8 -2.8 310 +17.8 +22.5 6 327 +20.1 +20.0 347 +17.2 +17.2 9 400 +17.6 -2.9 350 +20.0 -0.4
280 Days Mixture Plant % Difference Lab % Difference

79
(με) AASHTO (RH: 45%)
ACI (RH: 45%)
(με) AASHTO (RH: 45%)
ACI (RH: 45%)
1 850 +21.4 +18.2 573 +39.3 +36.4 2 710 +23.7 +26.7 680 +25.8 +28.7 4 729 +21.8 +25.5 643 +27.7 +31.3 6 567 +38.1 +36.8 700 +28.7 +27.4 9 635 +18.6 +31.8 697 +14.1 +27.6
Note: “-” indicate that the codified model underestimated shrinkage values resulting from either plant or lab testing at the respective age, while “+” means an overestimation of testing values
Meanwhile, some discussion is provided regarding the shrinkage values measured from this
project in comparison to values found in past studies. Oliva and Cramer (2008) measured
shrinkage values for SCC and CC mixtures made with Spancrete and County Materials
constituents. It was concluded that Spancrete SCC mixtures results in almost twice the
amount of shrinkage micro strain compared to CC. It was also found that County Materials
SCC mixtures developed less shrinkage than Spancrete SCC mixtures, but the values were
not compared to those from CC mixtures. The shrinkage values measured from this project
were lower than the values found in Oliva and Cramer (2008). Due to the uncertainty in the
mixture proportions from the past project, unfortunately no specific conclusions can be made
for the difference in values.
Another SCC shrinkage study conducted by Khayat and Long (2010) found that the SCC
mixture with similar cement content and w/c ratio developed about 965 micro strain at 252
days. This value is higher to what was found in all of County Materials and Spancrete SCC
mixtures both in the plant and lab.

80
6.3 Discussion for Final Mixture Selection
To continue with full-scale testing, one mixture had to be selected for fabrication of the girder
prior to the completion of creep and shrinkage measurement for a period of 280 days. Hence,
creep and shrinkage results for all five mixtures at 28 days were analyzed to select the most
suitable mixture for the full-scale testing (see Table 6-5). Note that the creep values listed in
this table were combined creep and shrinkage from the creep testing. Selecting mixtures 4
and 9 was a reasonable choice to be used for full-scale SCC girder fabrication and testing
(see Table 6-5) because they had the first and second highest creep and shrinkage strains,
resulting in the significant amount of prestress losses during the full-scale testing. County
Materials Janesville offered to fabricate the girder, meaning that final selection was between
mixture 4 and 6. Mixture 4 was selected for investigation, anticipating the largest prestress
losses to compare with the losses of the CC girder.
Table 6-5 Summary of creep and shrinkage for all five tested mixtures at 28 days
No Creep (με) Shrinkage (με)
Cylinder 1
Cylinder 2
Cylinder 3 Ave. Prism
1 Prism
2 Prism
3 Ave.
1 817 666 616 700 560 440 580 527 2 756 612 620 670 460 500 460 473 4 831 814 939 861 525 580 450 519 6 793 765 919 832 280 400 305 327 9 797 762 1065 875 430 370 - 400
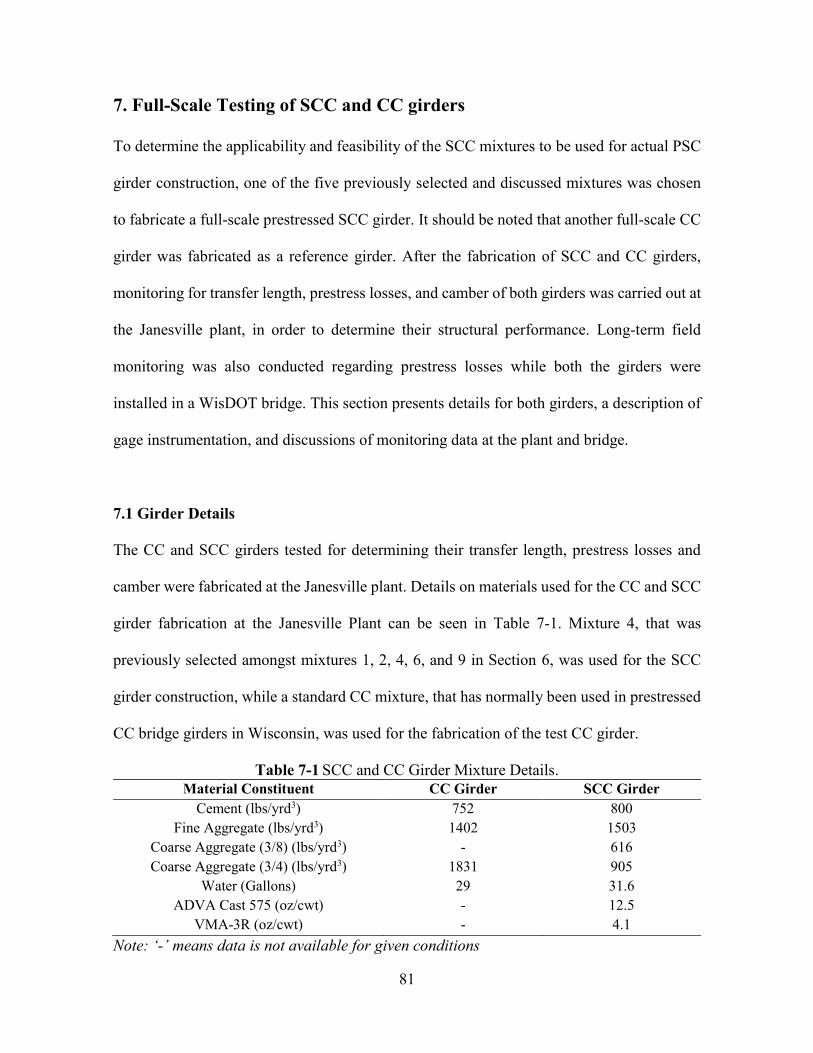
81
7. Full-Scale Testing of SCC and CC girders
To determine the applicability and feasibility of the SCC mixtures to be used for actual PSC
girder construction, one of the five previously selected and discussed mixtures was chosen
to fabricate a full-scale prestressed SCC girder. It should be noted that another full-scale CC
girder was fabricated as a reference girder. After the fabrication of SCC and CC girders,
monitoring for transfer length, prestress losses, and camber of both girders was carried out at
the Janesville plant, in order to determine their structural performance. Long-term field
monitoring was also conducted regarding prestress losses while both the girders were
installed in a WisDOT bridge. This section presents details for both girders, a description of
gage instrumentation, and discussions of monitoring data at the plant and bridge.
7.1 Girder Details
The CC and SCC girders tested for determining their transfer length, prestress losses and
camber were fabricated at the Janesville plant. Details on materials used for the CC and SCC
girder fabrication at the Janesville Plant can be seen in Table 7-1. Mixture 4, that was
previously selected amongst mixtures 1, 2, 4, 6, and 9 in Section 6, was used for the SCC
girder construction, while a standard CC mixture, that has normally been used in prestressed
CC bridge girders in Wisconsin, was used for the fabrication of the test CC girder.
Table 7-1 SCC and CC Girder Mixture Details. Material Constituent CC Girder SCC Girder
Cement (lbs/yrd3) 752 800 Fine Aggregate (lbs/yrd3) 1402 1503
Coarse Aggregate (3/8) (lbs/yrd3) - 616 Coarse Aggregate (3/4) (lbs/yrd3) 1831 905
Water (Gallons) 29 31.6 ADVA Cast 575 (oz/cwt) - 12.5
VMA-3R (oz/cwt) - 4.1 Note: ‘-’ means data is not available for given conditions
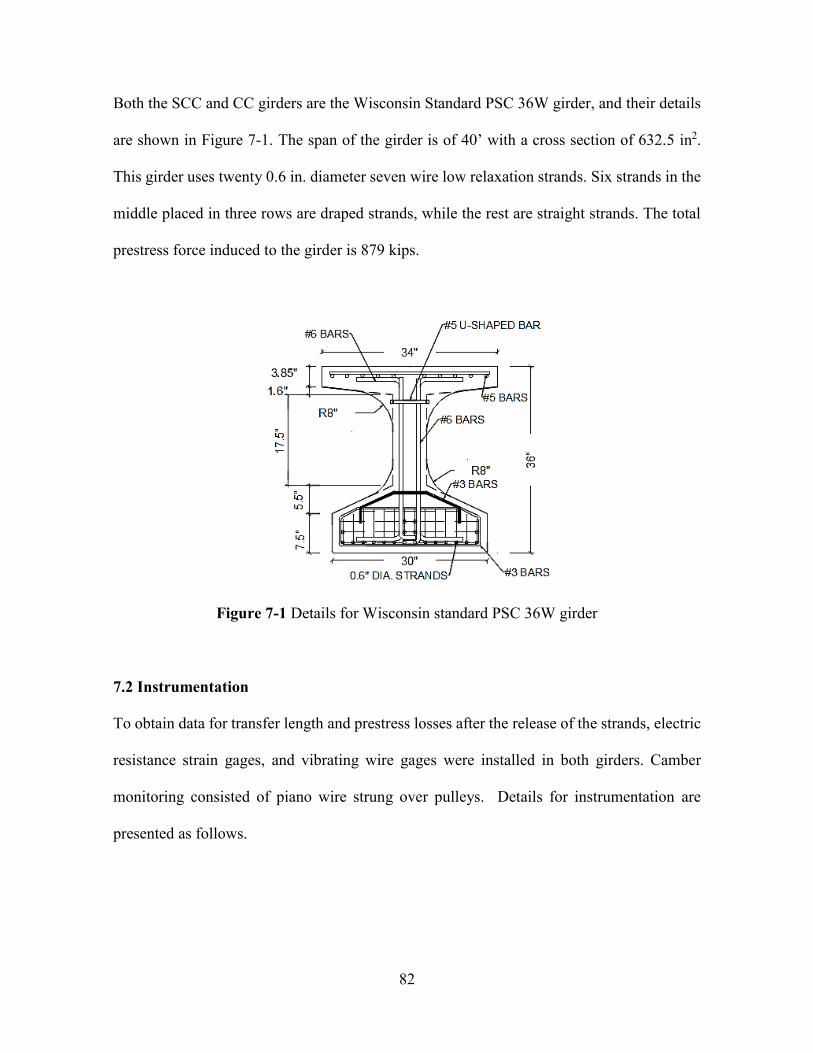
82
Both the SCC and CC girders are the Wisconsin Standard PSC 36W girder, and their details
are shown in Figure 7-1. The span of the girder is of 40’ with a cross section of 632.5 in2.
This girder uses twenty 0.6 in. diameter seven wire low relaxation strands. Six strands in the
middle placed in three rows are draped strands, while the rest are straight strands. The total
prestress force induced to the girder is 879 kips.
Figure 7-1 Details for Wisconsin standard PSC 36W girder
7.2 Instrumentation
To obtain data for transfer length and prestress losses after the release of the strands, electric
resistance strain gages, and vibrating wire gages were installed in both girders. Camber
monitoring consisted of piano wire strung over pulleys. Details for instrumentation are
presented as follows.
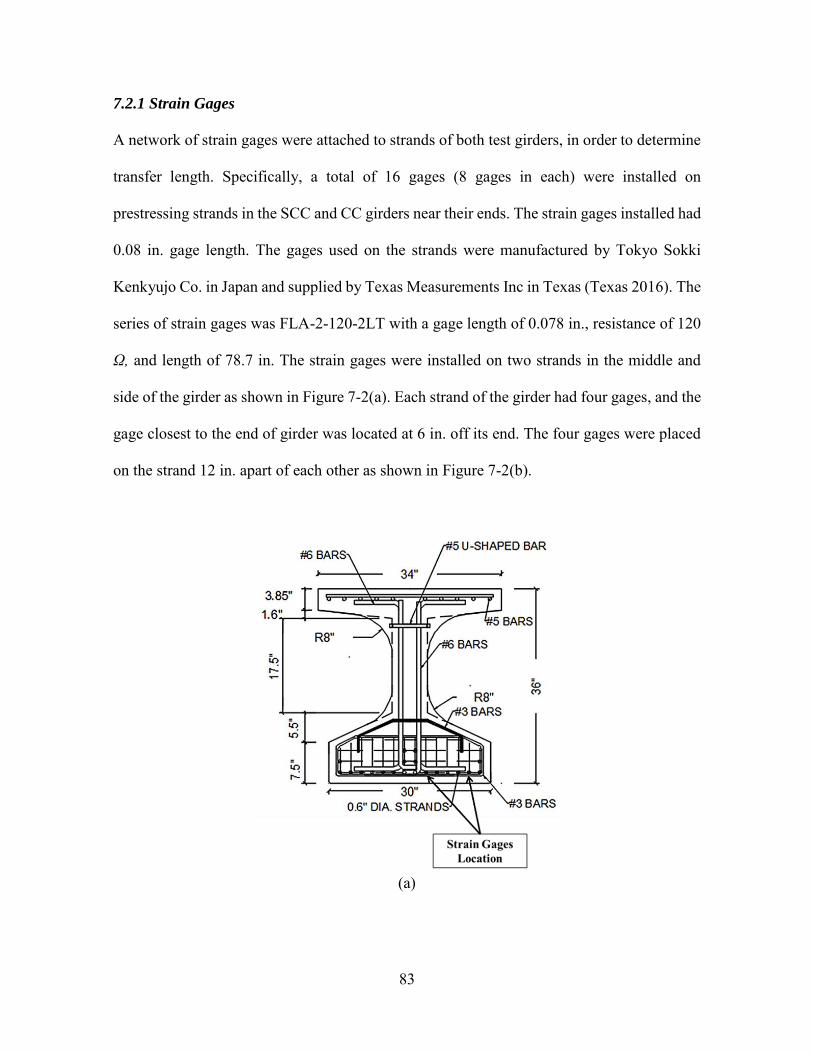
83
7.2.1 Strain Gages
A network of strain gages were attached to strands of both test girders, in order to determine
transfer length. Specifically, a total of 16 gages (8 gages in each) were installed on
prestressing strands in the SCC and CC girders near their ends. The strain gages installed had
0.08 in. gage length. The gages used on the strands were manufactured by Tokyo Sokki
Kenkyujo Co. in Japan and supplied by Texas Measurements Inc in Texas (Texas 2016). The
series of strain gages was FLA-2-120-2LT with a gage length of 0.078 in., resistance of 120
Ω, and length of 78.7 in. The strain gages were installed on two strands in the middle and
side of the girder as shown in Figure 7-2(a). Each strand of the girder had four gages, and the
gage closest to the end of girder was located at 6 in. off its end. The four gages were placed
on the strand 12 in. apart of each other as shown in Figure 7-2(b).
(a)
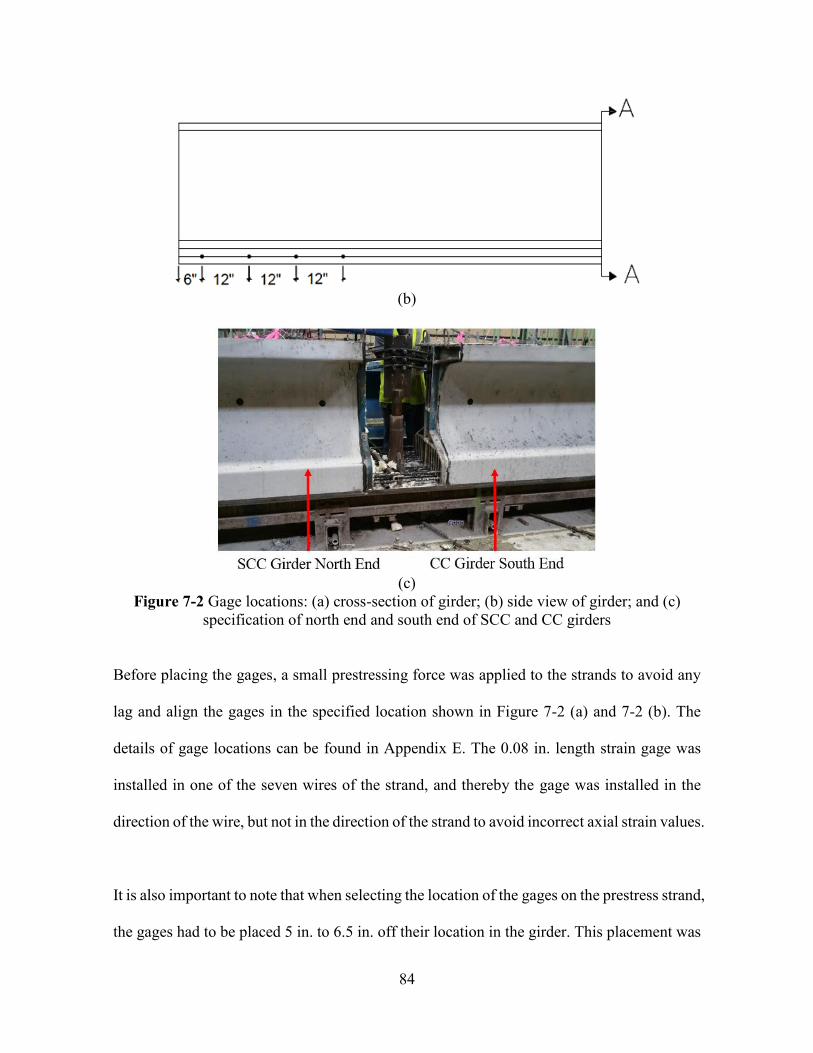
84
(b)
(c)
Figure 7-2 Gage locations: (a) cross-section of girder; (b) side view of girder; and (c) specification of north end and south end of SCC and CC girders
Before placing the gages, a small prestressing force was applied to the strands to avoid any
lag and align the gages in the specified location shown in Figure 7-2 (a) and 7-2 (b). The
details of gage locations can be found in Appendix E. The 0.08 in. length strain gage was
installed in one of the seven wires of the strand, and thereby the gage was installed in the
direction of the wire, but not in the direction of the strand to avoid incorrect axial strain values.
It is also important to note that when selecting the location of the gages on the prestress strand,
the gages had to be placed 5 in. to 6.5 in. off their location in the girder. This placement was
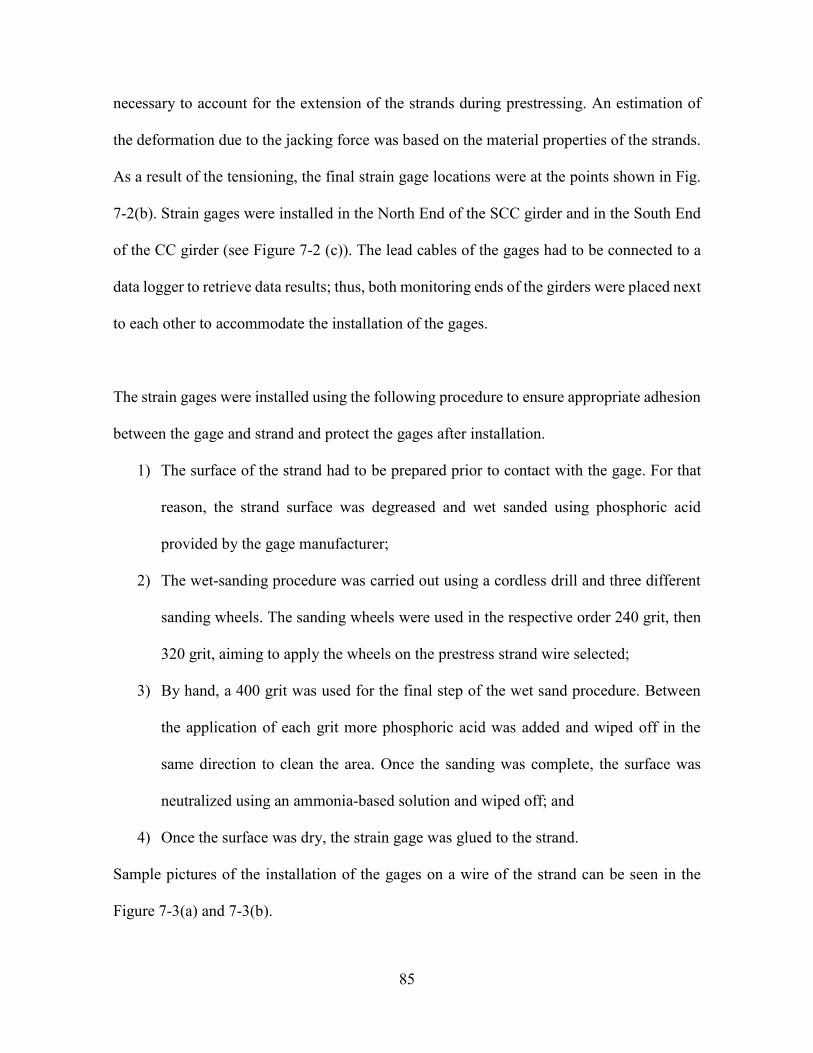
85
necessary to account for the extension of the strands during prestressing. An estimation of
the deformation due to the jacking force was based on the material properties of the strands.
As a result of the tensioning, the final strain gage locations were at the points shown in Fig.
7-2(b). Strain gages were installed in the North End of the SCC girder and in the South End
of the CC girder (see Figure 7-2 (c)). The lead cables of the gages had to be connected to a
data logger to retrieve data results; thus, both monitoring ends of the girders were placed next
to each other to accommodate the installation of the gages.
The strain gages were installed using the following procedure to ensure appropriate adhesion
between the gage and strand and protect the gages after installation.
1) The surface of the strand had to be prepared prior to contact with the gage. For that
reason, the strand surface was degreased and wet sanded using phosphoric acid
provided by the gage manufacturer;
2) The wet-sanding procedure was carried out using a cordless drill and three different
sanding wheels. The sanding wheels were used in the respective order 240 grit, then
320 grit, aiming to apply the wheels on the prestress strand wire selected;
3) By hand, a 400 grit was used for the final step of the wet sand procedure. Between
the application of each grit more phosphoric acid was added and wiped off in the
same direction to clean the area. Once the sanding was complete, the surface was
neutralized using an ammonia-based solution and wiped off; and
4) Once the surface was dry, the strain gage was glued to the strand.
Sample pictures of the installation of the gages on a wire of the strand can be seen in the
Figure 7-3(a) and 7-3(b).
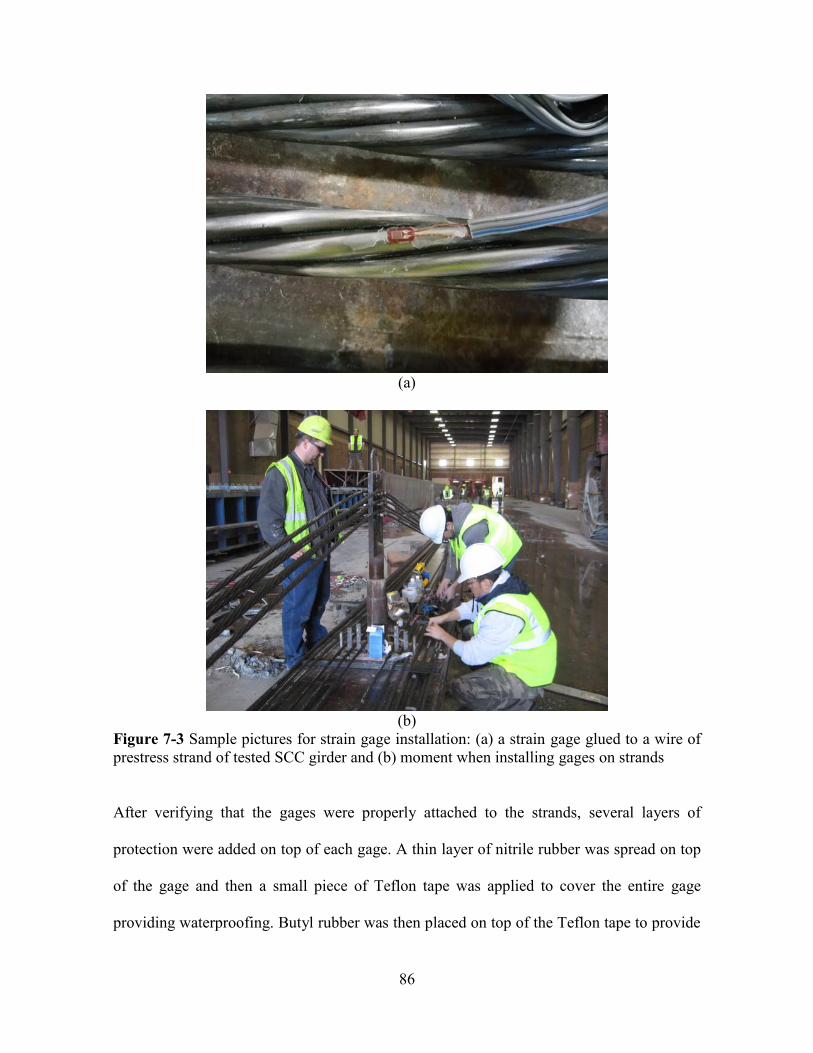
86
(a)
(b)
Figure 7-3 Sample pictures for strain gage installation: (a) a strain gage glued to a wire of prestress strand of tested SCC girder and (b) moment when installing gages on strands
After verifying that the gages were properly attached to the strands, several layers of
protection were added on top of each gage. A thin layer of nitrile rubber was spread on top
of the gage and then a small piece of Teflon tape was applied to cover the entire gage
providing waterproofing. Butyl rubber was then placed on top of the Teflon tape to provide
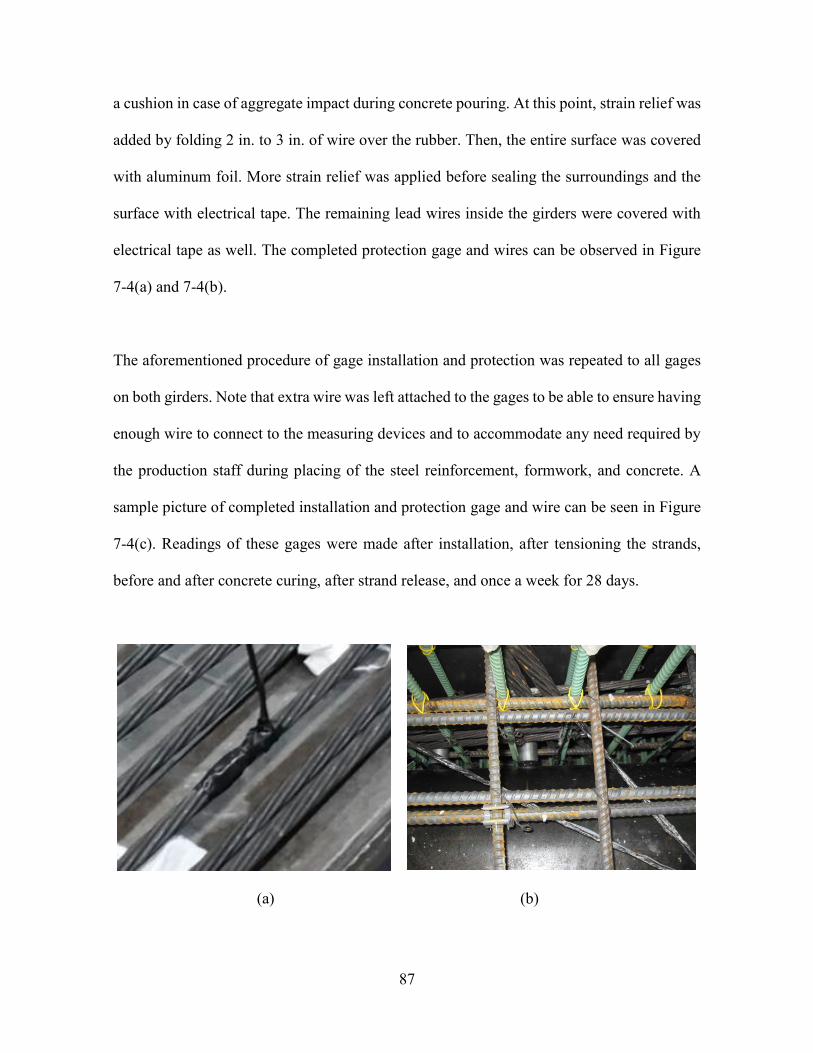
87
a cushion in case of aggregate impact during concrete pouring. At this point, strain relief was
added by folding 2 in. to 3 in. of wire over the rubber. Then, the entire surface was covered
with aluminum foil. More strain relief was applied before sealing the surroundings and the
surface with electrical tape. The remaining lead wires inside the girders were covered with
electrical tape as well. The completed protection gage and wires can be observed in Figure
7-4(a) and 7-4(b).
The aforementioned procedure of gage installation and protection was repeated to all gages
on both girders. Note that extra wire was left attached to the gages to be able to ensure having
enough wire to connect to the measuring devices and to accommodate any need required by
the production staff during placing of the steel reinforcement, formwork, and concrete. A
sample picture of completed installation and protection gage and wire can be seen in Figure
7-4(c). Readings of these gages were made after installation, after tensioning the strands,
before and after concrete curing, after strand release, and once a week for 28 days.
(a) (b)
88
(c) Figure 7-4 Sample pictures for gage installation and protection (a) strain gage with completed protection and (b) protection of lead wires, and (c) all strain gages installed in SCC girder 7.2.2 Vibrating-Wire Gages
Vibrating wire (VW) gages were used to monitor concrete strain which was utilized to
determine prestress losses. These gages were installed in the midspan of both CC and SCC
girder. Figure 7-5(a) shows the specific location and installation of these gages in the strands.
The VW gage on each girder was placed in between strands on the first and second row of
the girder as shown in Figures 7-5(a) through 7-5(b). The gage was firmly attached to the
strand in the second row using quick ties. The quick ties were used to attach the same gage
loosely with the strand in the first row near the bottom of the formwork as shown in the
Figure 7-5 (b).
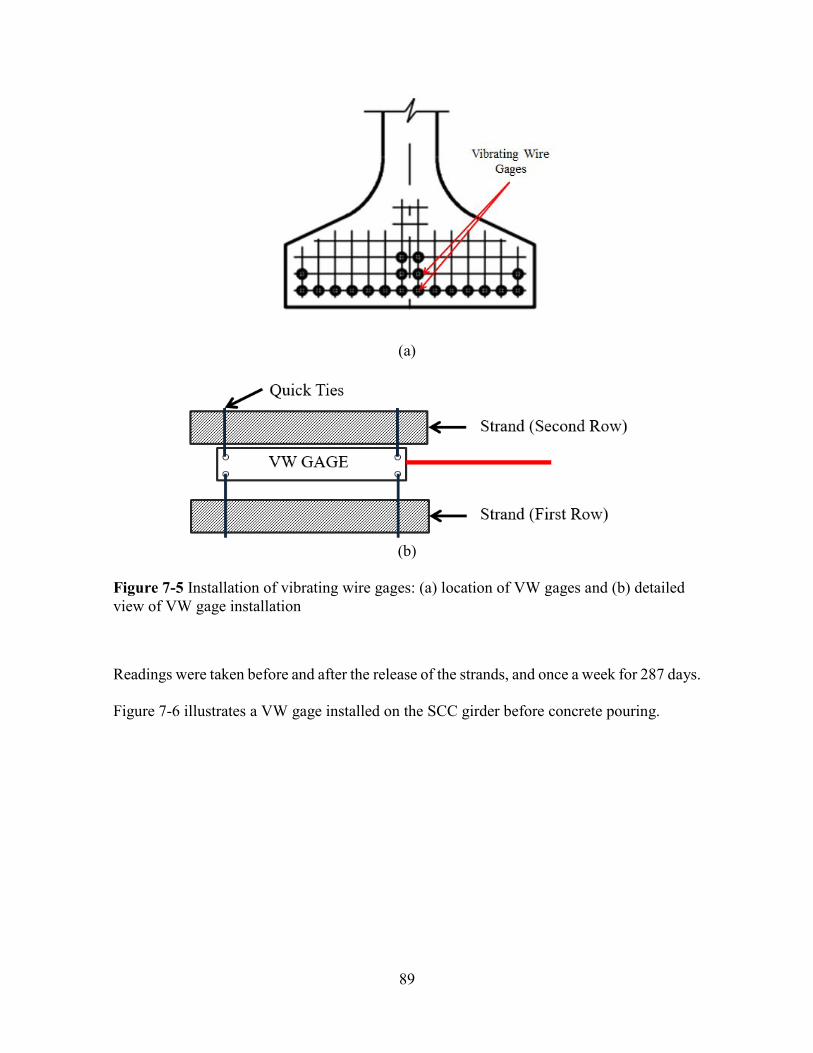
89
(a)
(b)
Figure 7-5 Installation of vibrating wire gages: (a) location of VW gages and (b) detailed view of VW gage installation
Readings were taken before and after the release of the strands, and once a week for 287 days.
Figure 7-6 illustrates a VW gage installed on the SCC girder before concrete pouring.
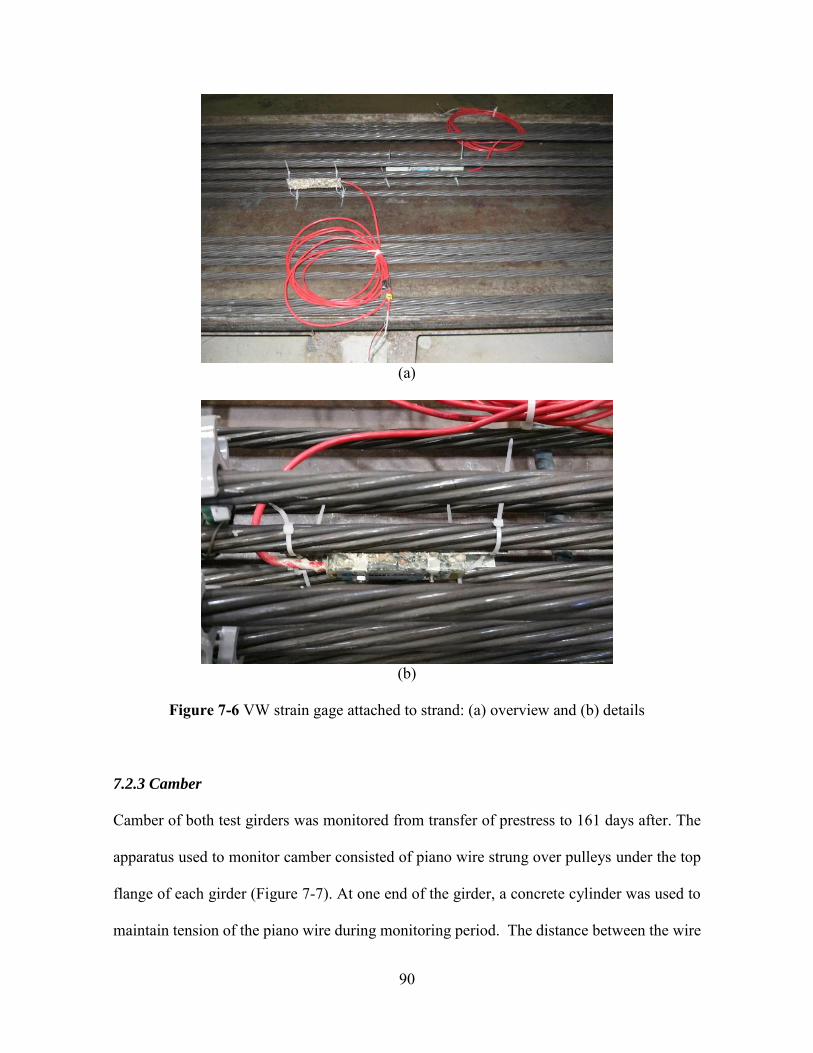
90
(a)
(b)
Figure 7-6 VW strain gage attached to strand: (a) overview and (b) details
7.2.3 Camber
Camber of both test girders was monitored from transfer of prestress to 161 days after. The
apparatus used to monitor camber consisted of piano wire strung over pulleys under the top
flange of each girder (Figure 7-7). At one end of the girder, a concrete cylinder was used to
maintain tension of the piano wire during monitoring period. The distance between the wire
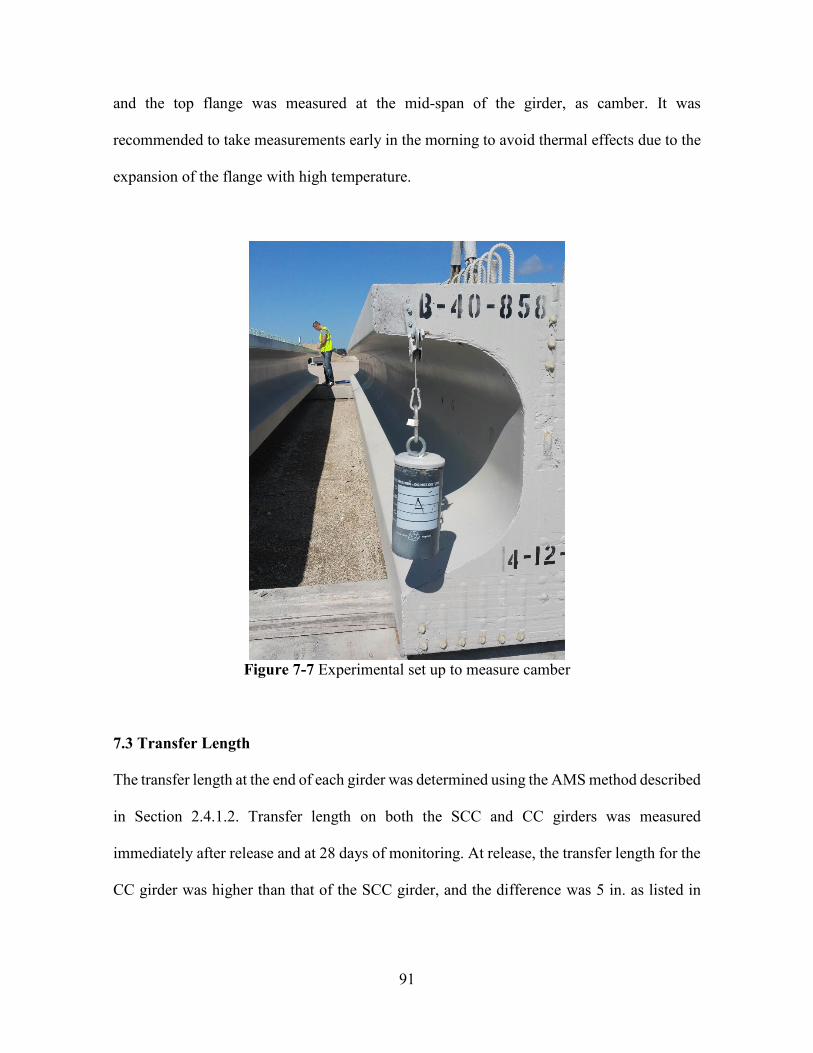
91
and the top flange was measured at the mid-span of the girder, as camber. It was
recommended to take measurements early in the morning to avoid thermal effects due to the
expansion of the flange with high temperature.
Figure 7-7 Experimental set up to measure camber
7.3 Transfer Length
The transfer length at the end of each girder was determined using the AMS method described
in Section 2.4.1.2. Transfer length on both the SCC and CC girders was measured
immediately after release and at 28 days of monitoring. At release, the transfer length for the
CC girder was higher than that of the SCC girder, and the difference was 5 in. as listed in

92
Table 7-2. Figure 7-8 shows a schematic for transfer length measurement between the tested
SCC and CC girders at the plant.
Figure 7-8 Experimental schematic to measure AMS plot-based transfer length: a) CC and b) SCC
Table 7-2 Transfer length results
Time South End CC (in)
North End SCC (in)
AASHTO: 60db (in)
ACI: 50db (in)
Immediately after release 24.0 19.0 36 30 28 Days 24.5 20.0
Transfer length can increase over time due to time-dependent PSC properties such as creep,
shrinkage and relaxation of the strands. It was observed that after 28 days the CC girder
transfer length increased by 0.5 in., while that of the SCC girder increased by 1 in. (see Table
7-1). It is important to remark that transfer lengths for both girders are under 60db specified
by the AASHTO LRFD Specifications (AASHTO 2012) and 50db stipulated from the ACI
Codes (ACI 2009) as listed in Table 7-1. The transfer lengths for both the CC and SCC
girders, determined using the AMS method, are illustrated in Figure 7-9.
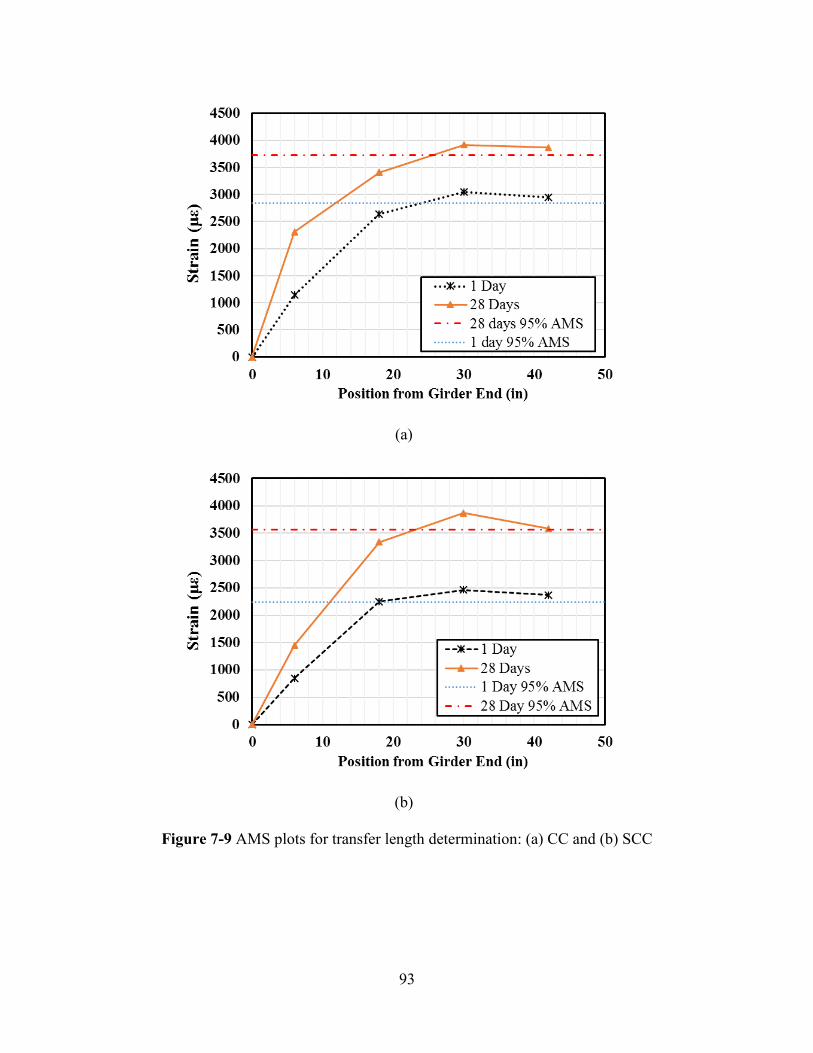
93
(a)
(b)
Figure 7-9 AMS plots for transfer length determination: (a) CC and (b) SCC
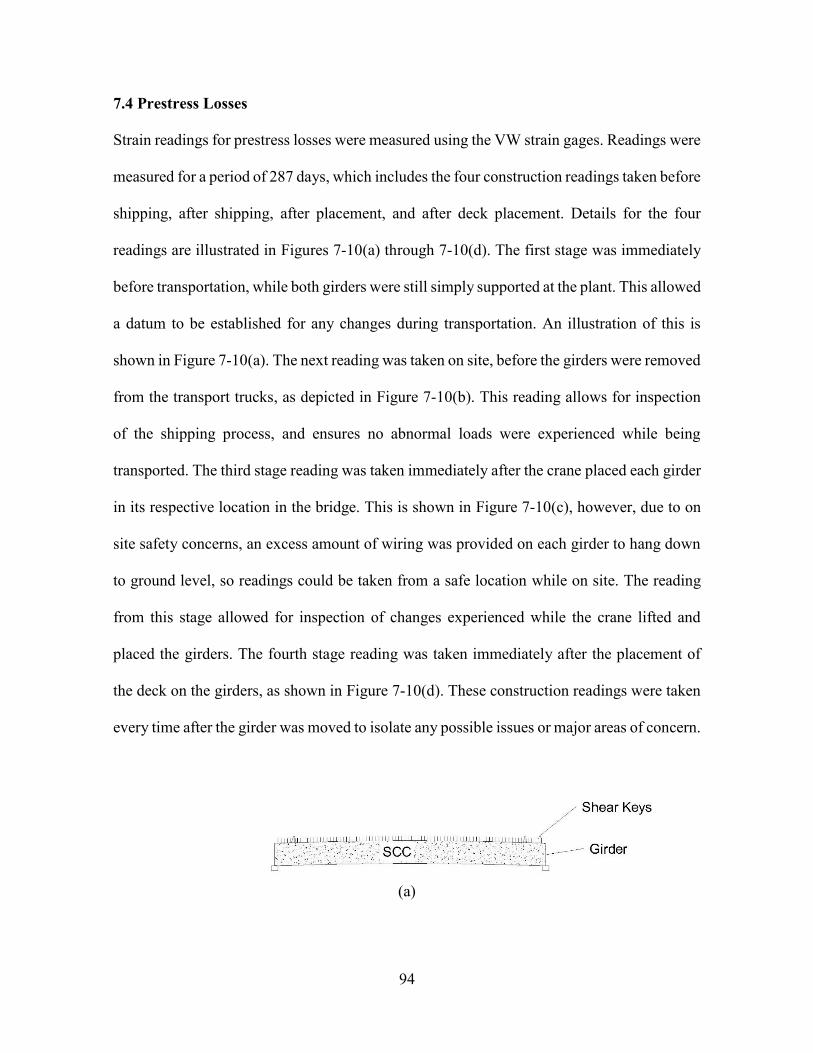
94
7.4 Prestress Losses
Strain readings for prestress losses were measured using the VW strain gages. Readings were
measured for a period of 287 days, which includes the four construction readings taken before
shipping, after shipping, after placement, and after deck placement. Details for the four
readings are illustrated in Figures 7-10(a) through 7-10(d). The first stage was immediately
before transportation, while both girders were still simply supported at the plant. This allowed
a datum to be established for any changes during transportation. An illustration of this is
shown in Figure 7-10(a). The next reading was taken on site, before the girders were removed
from the transport trucks, as depicted in Figure 7-10(b). This reading allows for inspection
of the shipping process, and ensures no abnormal loads were experienced while being
transported. The third stage reading was taken immediately after the crane placed each girder
in its respective location in the bridge. This is shown in Figure 7-10(c), however, due to on
site safety concerns, an excess amount of wiring was provided on each girder to hang down
to ground level, so readings could be taken from a safe location while on site. The reading
from this stage allowed for inspection of changes experienced while the crane lifted and
placed the girders. The fourth stage reading was taken immediately after the placement of
the deck on the girders, as shown in Figure 7-10(d). These construction readings were taken
every time after the girder was moved to isolate any possible issues or major areas of concern.
(a)
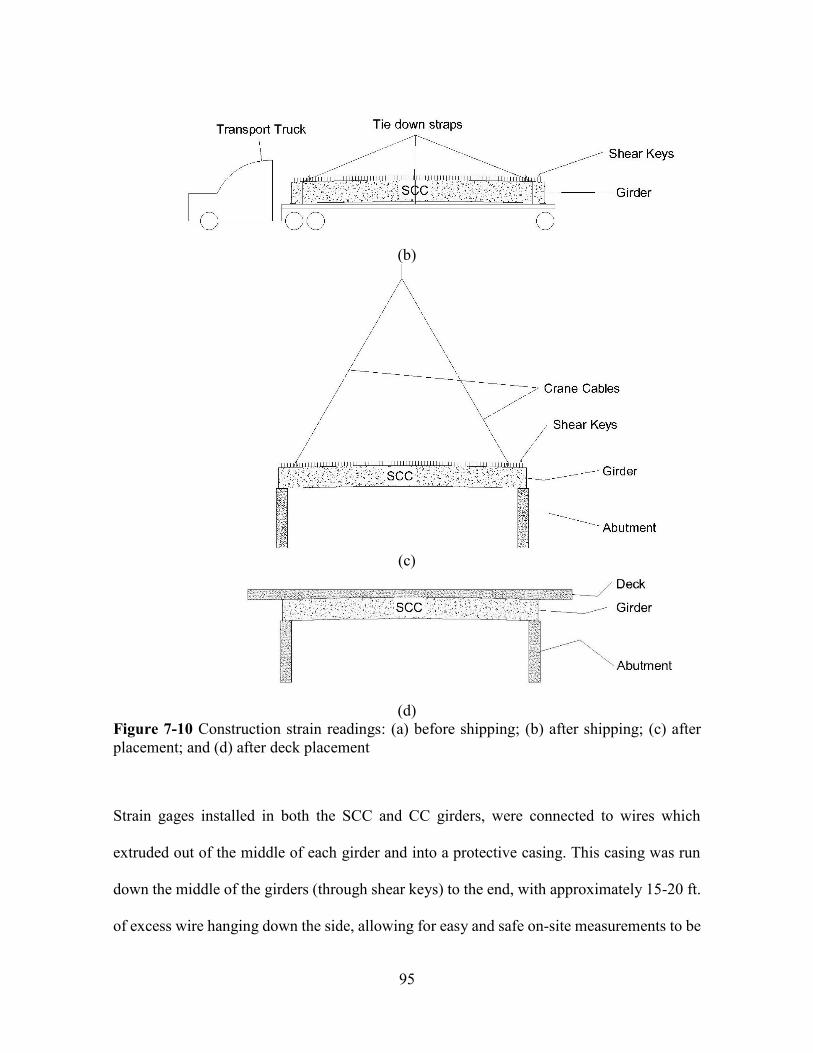
95
(b)
(c)
(d)
Figure 7-10 Construction strain readings: (a) before shipping; (b) after shipping; (c) after placement; and (d) after deck placement
Strain gages installed in both the SCC and CC girders, were connected to wires which
extruded out of the middle of each girder and into a protective casing. This casing was run
down the middle of the girders (through shear keys) to the end, with approximately 15-20 ft.
of excess wire hanging down the side, allowing for easy and safe on-site measurements to be
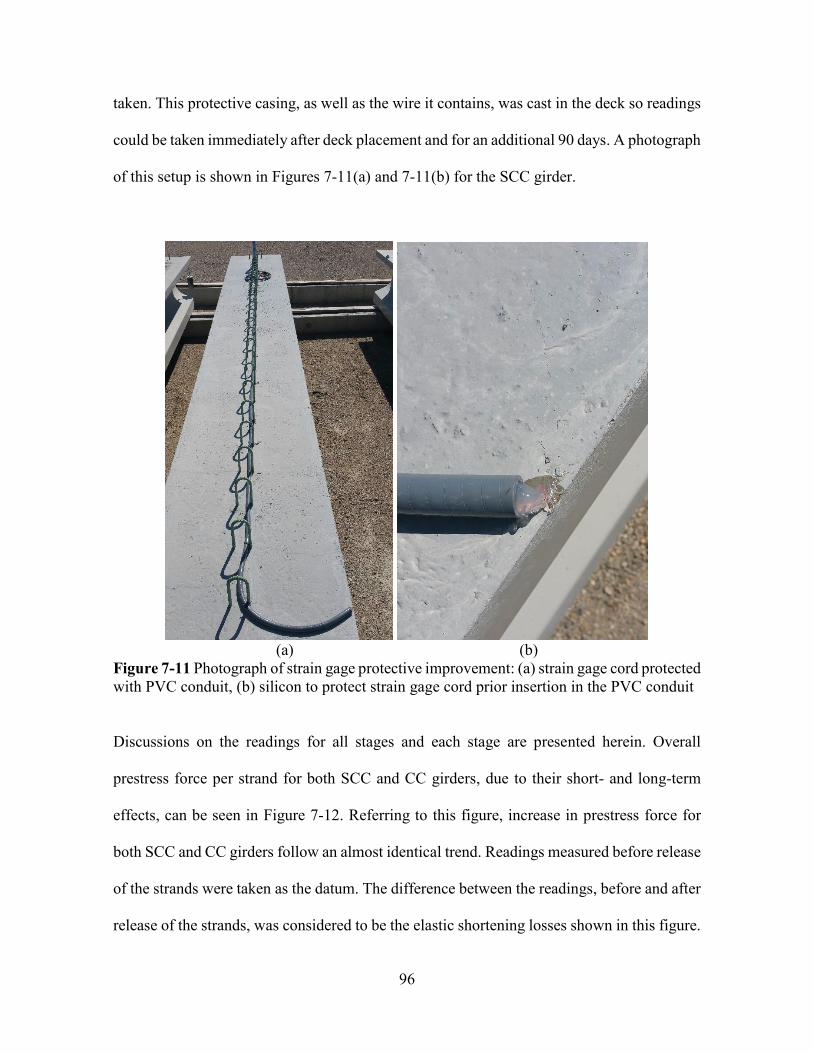
96
taken. This protective casing, as well as the wire it contains, was cast in the deck so readings
could be taken immediately after deck placement and for an additional 90 days. A photograph
of this setup is shown in Figures 7-11(a) and 7-11(b) for the SCC girder.
(a) (b)
Figure 7-11 Photograph of strain gage protective improvement: (a) strain gage cord protected with PVC conduit, (b) silicon to protect strain gage cord prior insertion in the PVC conduit
Discussions on the readings for all stages and each stage are presented herein. Overall
prestress force per strand for both SCC and CC girders, due to their short- and long-term
effects, can be seen in Figure 7-12. Referring to this figure, increase in prestress force for
both SCC and CC girders follow an almost identical trend. Readings measured before release
of the strands were taken as the datum. The difference between the readings, before and after
release of the strands, was considered to be the elastic shortening losses shown in this figure.
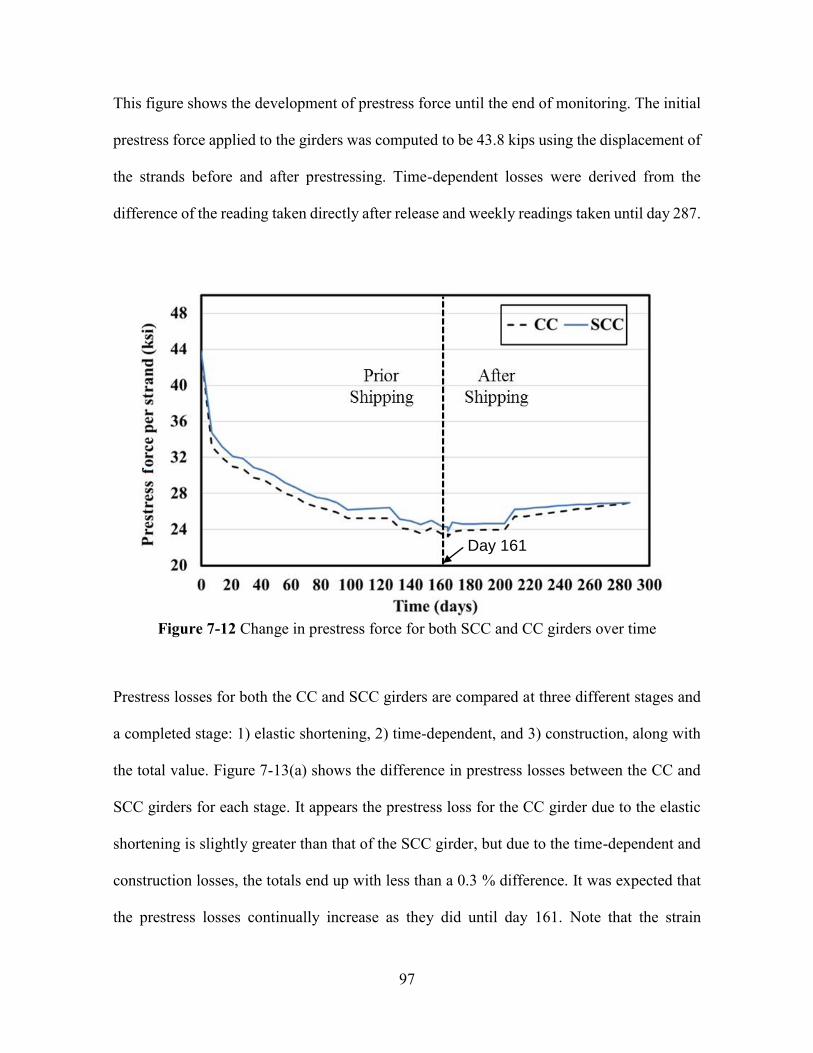
97
This figure shows the development of prestress force until the end of monitoring. The initial
prestress force applied to the girders was computed to be 43.8 kips using the displacement of
the strands before and after prestressing. Time-dependent losses were derived from the
difference of the reading taken directly after release and weekly readings taken until day 287.
Figure 7-12 Change in prestress force for both SCC and CC girders over time
Prestress losses for both the CC and SCC girders are compared at three different stages and
a completed stage: 1) elastic shortening, 2) time-dependent, and 3) construction, along with
the total value. Figure 7-13(a) shows the difference in prestress losses between the CC and
SCC girders for each stage. It appears the prestress loss for the CC girder due to the elastic
shortening is slightly greater than that of the SCC girder, but due to the time-dependent and
construction losses, the totals end up with less than a 0.3 % difference. It was expected that
the prestress losses continually increase as they did until day 161. Note that the strain
Day 161
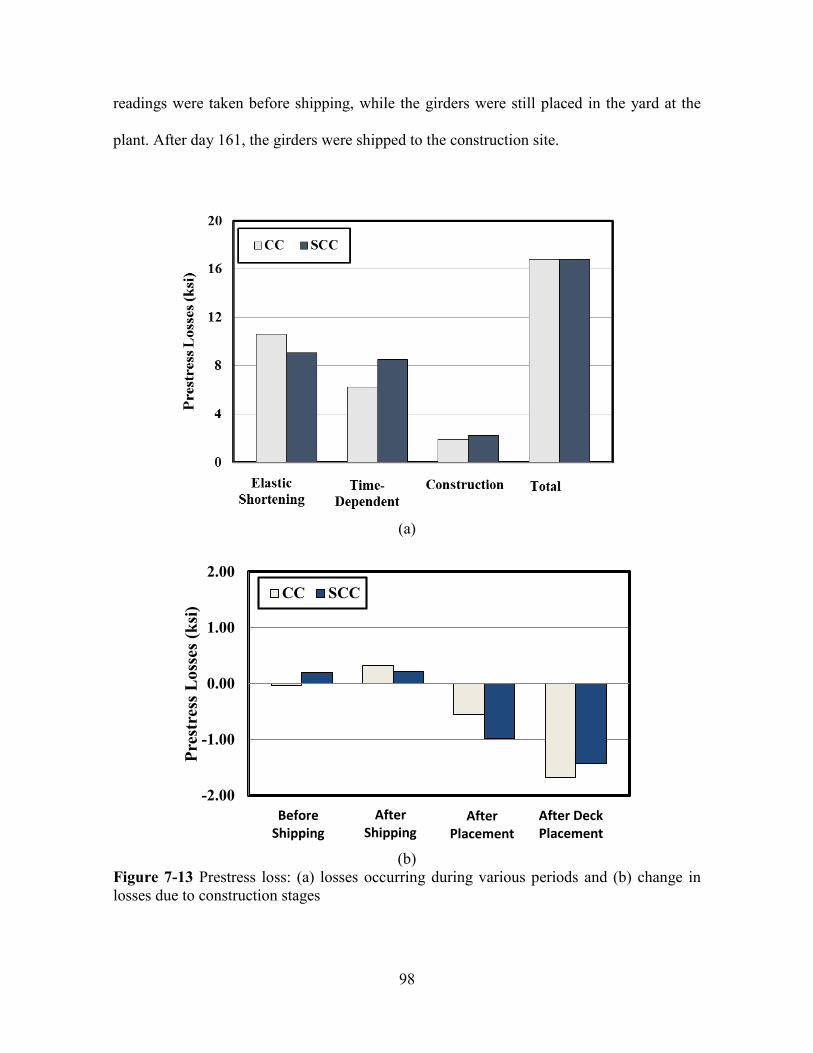
98
readings were taken before shipping, while the girders were still placed in the yard at the
plant. After day 161, the girders were shipped to the construction site.
(a)
(b)
Figure 7-13 Prestress loss: (a) losses occurring during various periods and (b) change in losses due to construction stages
-2.00
-1.00
0.00
1.00
2.00
Pres
tres
s Los
ses (
ksi)
CC SCC
Before Shipping
AfterShipping
After Placement
After Deck Placement

99
Prestress losses after shipping started to decrease with minor jumps due to construction.
Figure 7-13(b) shows a bar graph of the immediate change in prestress losses from one stage
to another, for each of the construction stages. This allows for a detailed analysis of the
isolated effects due to each individual construction. Interestingly, once the girders were
erected and placed in the bridge, a sudden decrease in losses was observed, although support
conditions (i.e., simply supported conditions) were similar at the precast yard, construction
site, and bridge. The decrease might be attributed to the fact that the change in the support
condition (i.e., the girders connected to two anchors to be lifted up using a cable) was made
for the girder erection. Sample pictures for the SCC girder erection and placement can be
seen in Figures 7-14(a) and 7-14(b), while the girder erection details can be seen in Figure 7-
14(c). Deck casting started 35 days after the girders were placed on the bridge, and can be
seen in Figures 7-14(d) through 7-14(f). A decrease in losses was expected due to the action
of the weight of the deck on top of the girders. The decrease in losses was 1.47 ksi and 1.61
ksi for the CC and SCC girder, respectively. It should be noted that the effect of the deck
weight was discussed in Section 2 and illustrated in Figure 2-8 where the deck placement
causes an elastic gain.
Table 7-3 shows a side by side comparison of critical dates for both girders over the 287 day
period of analysis. The strain readings taken at release for the SCC and CC girders were 9.07
ksi and 10.61 ksi; thus, the CC girder exhibited about 17 % higher elastic shortening losses
than the SCC girder. The strain readings taken before shipping for the SCC and CC girders
were 19.76 ksi and 20.26 ksi. These values follow the prior trend with a slight increase. The
readings taken immediately after shipping, for the SCC and CC girders, were 19.97 ksi and
20.58 ksi. These values increased by approximately the same amount as a week of sitting at

100
the plant. This is a little larger increase than would be read if the girders were not moved
from the plant, however, not a large enough change to suggest any error/damage. The
readings taken immediately after the girders were set on the abutments were 18.97 ksi for the
SCC girder and 20.03 ksi for the CC girder. This shows a decrease in losses. When comparing
time-dependent losses, it is observed that CC developed about 4 % higher losses than SCC
girder at day 161 (immediately prior to construction losses). At day 287 the losses are
extremely close with less than 0.3 % difference between the SCC and CC girders.
(a)
(b)
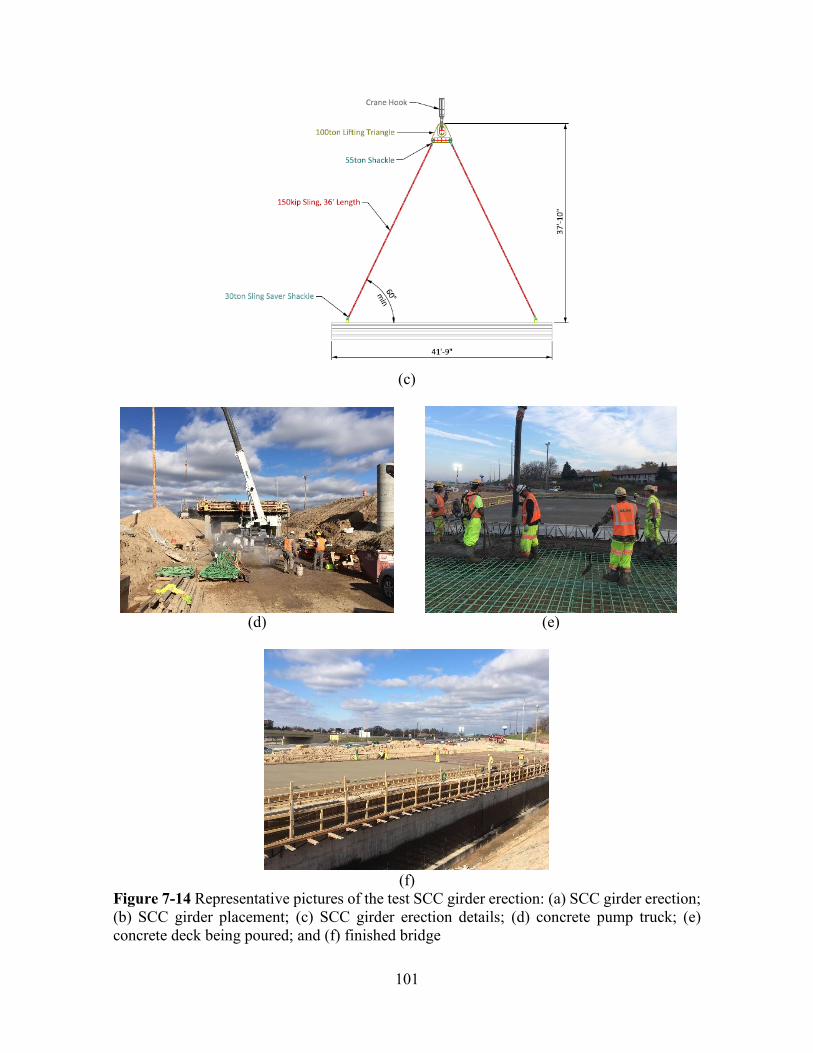
101
(c)
(d)
(e)
(f)
Figure 7-14 Representative pictures of the test SCC girder erection: (a) SCC girder erection; (b) SCC girder placement; (c) SCC girder erection details; (d) concrete pump truck; (e) concrete deck being poured; and (f) finished bridge
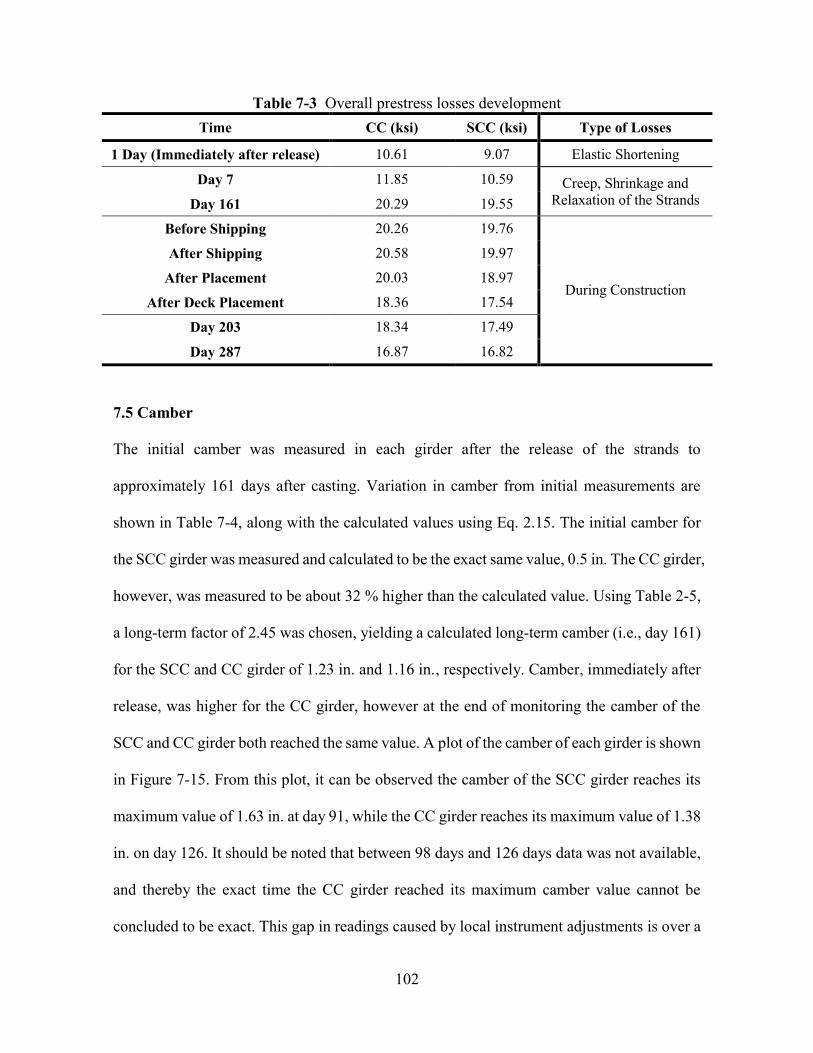
102
Table 7-3 Overall prestress losses development Time CC (ksi) SCC (ksi) Type of Losses
1 Day (Immediately after release) 10.61 9.07 Elastic Shortening
Day 7 11.85 10.59 Creep, Shrinkage and Relaxation of the Strands Day 161 20.29 19.55
Before Shipping 20.26 19.76
During Construction
After Shipping 20.58 19.97
After Placement 20.03 18.97
After Deck Placement 18.36 17.54
Day 203 18.34 17.49
Day 287 16.87 16.82
7.5 Camber
The initial camber was measured in each girder after the release of the strands to
approximately 161 days after casting. Variation in camber from initial measurements are
shown in Table 7-4, along with the calculated values using Eq. 2.15. The initial camber for
the SCC girder was measured and calculated to be the exact same value, 0.5 in. The CC girder,
however, was measured to be about 32 % higher than the calculated value. Using Table 2-5,
a long-term factor of 2.45 was chosen, yielding a calculated long-term camber (i.e., day 161)
for the SCC and CC girder of 1.23 in. and 1.16 in., respectively. Camber, immediately after
release, was higher for the CC girder, however at the end of monitoring the camber of the
SCC and CC girder both reached the same value. A plot of the camber of each girder is shown
in Figure 7-15. From this plot, it can be observed the camber of the SCC girder reaches its
maximum value of 1.63 in. at day 91, while the CC girder reaches its maximum value of 1.38
in. on day 126. It should be noted that between 98 days and 126 days data was not available,
and thereby the exact time the CC girder reached its maximum camber value cannot be
concluded to be exact. This gap in readings caused by local instrument adjustments is over a
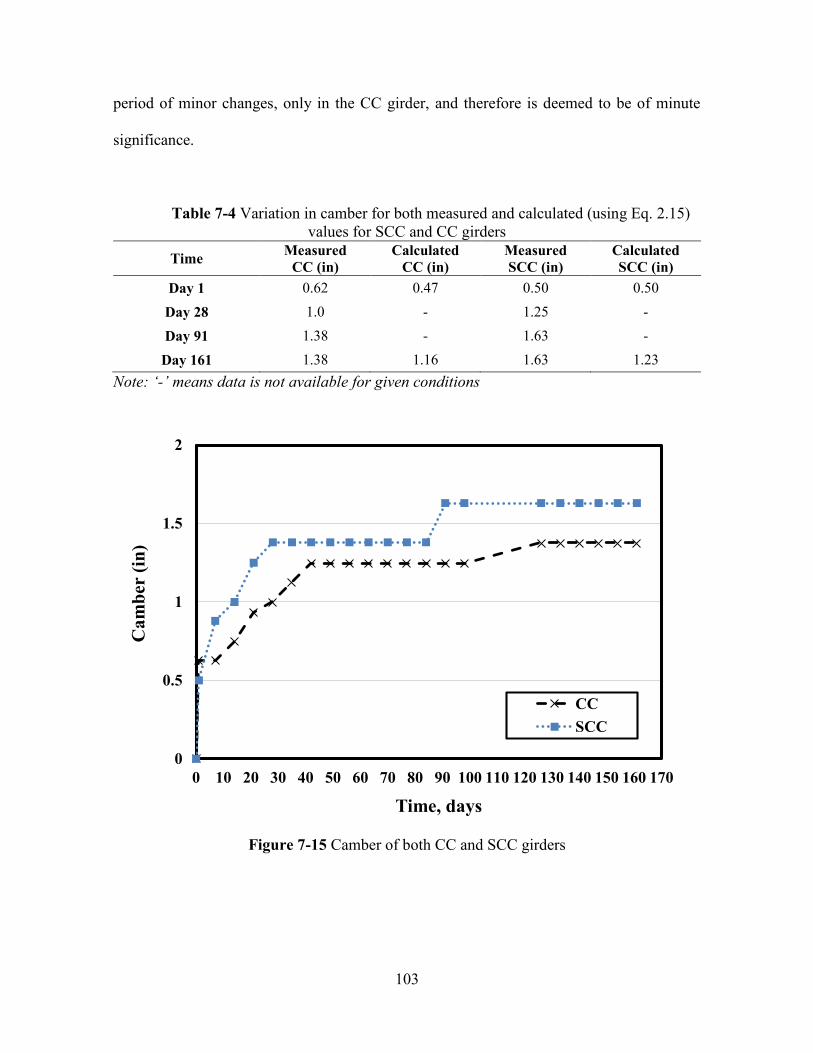
103
period of minor changes, only in the CC girder, and therefore is deemed to be of minute
significance.
Table 7-4 Variation in camber for both measured and calculated (using Eq. 2.15) values for SCC and CC girders
Time Measured CC (in)
Calculated CC (in)
Measured SCC (in)
Calculated SCC (in)
Day 1 0.62 0.47 0.50 0.50
Day 28 1.0 - 1.25 -
Day 91 1.38 - 1.63 -
Day 161 1.38 1.16 1.63 1.23 Note: ‘-’ means data is not available for given conditions
Figure 7-15 Camber of both CC and SCC girders
0
0.5
1
1.5
2
0 10 20 30 40 50 60 70 80 90 100 110 120 130 140 150 160 170
Cam
ber
(in)
Time, days
CCSCC

104
8. Recommendations for SCC Girder Implementation
This section provides motives by the researchers to recommend the implementation of SCC
in Wisconsin DOT projects. Included in this section are a SCC mixture design specification
that was developed based upon the findings throughout this project and recommendations for
SCC girder implementation.
8.1 SCC Mixture Design Specification
1) Description: This section consists of requirements regarding mixture design and test methods for SCC fabrication on prestressed bridge girders.
2) Materials: Materials shall follow section 501.2 of the Wisconsin DOT standard specifications. A proposed mix design should be submitted for approval before application. The contractor should determine the proportions of the mix with the following limitations:
Water cementitious material ratio, w/cm .................................................... 0.35 or less Cement content ................................................................... 800 pounds per cubic yard Sand to Aggregate ratio, S/Agg .................................................................. 0.50 or less Coarse Aggregate:
Size ........................................................................................................ Max of 3/4” Blending ................ 3/8” gradation is allowed up to 40 % of total coarse aggregate Admixtures ......... Must be registered in the list of WisDOT approved products for concrete Air content: Prestressed bridge girders ............................................. 2.0 - 4.0 percent maximum
3) Test Methods: To approve a new SCC mixture submit Slump Flow, J-Ring, Visual
Stability Index (VSI), T20, and Column Segregation. Mixtures that have been approved submit Slump Flow, J-Ring and VSI values for every truck load. 3.1) New Mixtures
(1) Slump Flow Test: Perform slump flow test following ASTM C1611. Target
spread diameter should be between 25” - 28”. If slump flow value is above 28” reject the mixture. Also, the slump flow value shall be ± 2” of contractor target value. T20 value is recommend to range between 2 - 7 seconds.

105
(2) VSI: 0 - 1. (3) J-Ring: Perform the J-Ring Test in accordance to ASTM C1621. J-Ring spread
diameter should be within ± 2” difference compared to slump flow diameter. (4) Column Segregation: Perform the Column Segregation Test according to ASTM
C1610 guidelines. The percent segregation should not exceed 15 %. This test should be performed twice allowing the concrete to sit on the cylinder for both 10 and 40 minutes.
3.2) Approved Mixtures The contractor shall obtain SCC mixtures with the following properties: Slump Flow ................................................................................................... 25” - 28” VSI ......................................................................................................................... 0 - 1 J-Ring .................................................................................................................... ± 2” Columns Segregation ......................................................................................... ≤ 15 %
8.2 Recommendations for SCC Girder Implementation
This study proved that the fabrication of PSC girders, made with SCC from material
resources in Wisconsin, is feasible using the materials and construction techniques of local
precasters. It is anticipated that precasters will have the option of fabricating girders using
SCC, which can lead to cost benefit, simplified construction procedures, reduced vibrator
noise hazard, and improved surface finishing where bugholes may be rarely observed in
comparison to CC girders. However, each precaster has the responsibility to develop SCC
mixtures to meet required performance.
SCC mixtures can be developed by making trial batches to achieve consistent fresh and
hardened properties. A high quality SCC mixture can be used to fabricate a SCC girder,
which is able to produce adequate structural performance in terms of transfer length, camber,

106
and prestress loss. It is expected that a SCC girder may exhibit similar structural performance
as CC girders that have been used in Wisconsin. Based on the project results, the following
recommendations are made:
1) WisDOT should allow the implementation of prestressed SCC bridge girders.
2) Mixture 4, where its material and structural performance was validated
throughout this project, should be accepted by WisDOT for girder production
without repeating all the testing provided in the proposed SCC mixture design
specification. However, it is required that the other trial SCC mixes (e.g.,
Mixtures 2 and 9) be tested and evaluated for their structural performance to
obtain WisDOT permission for their use in girder production.
3) Special provisions should be developed to set performance requirements for the
fabrication of prestressed bridge girders. This project provided criteria
recommended for quality control of new and day-to-day SCC mixtures.
4) Investigation of the implementation of supplemental cementitious materials to
reduce the costs of SCC mixtures should be made to make it more feasible for
local producers.
5) Monitoring of larger full-scale SCC girders is recommended to obtain valuable
information of long-term structural behavior of SCC girders.
107
9. Summary, Conclusions, and Future Work
This project developed a specific Self-Consolidating Concrete (SCC) mixture design
specification for the use of SCC in PSC bridges, and made recommendations on the
fabrication and implementation of prestressed SCC girders in Wisconsin. This section
summarizes significant findings gained from the project, contributions, and outlines future
work required to continue to promote the use of SCC in WisDOT PSC bridge projects.
9.1 Summary and Conclusions
This project was intended to evaluate mixture parameters that a SCC mixture made of local
materials in Wisconsin must satisfy and its specification for the use of SCC in PSC bridges.
To accomplish the objectives, the following tasks were completed: 1) literature review; 2)
DOT survey; 3) precast plant identification; 4) SCC mixture design and laboratory testing;
5) time-dependent characteristic determination; 6) full-scale testing; and 7) recommendations
for Wisconsin SCC girder fabrication. Brief summaries, as necessary, and key findings from
each task include the following:
1) As a result of the comprehensive literature review related to material properties and
structural characteristics of prestressed SCC bridge girders, specific parameters necessary for
the SCC mixture design were determined in collaboration with the WisDOT. The literature
review revealed that SCC has similar, if not higher, compressive strengths compared to
Conventional Concrete (CC). Cement in a SCC mixture may be replaced with fillers to obtain
desirable fresh and hardened properties, although a replacement of cement with fillers may
result in reduction of compressive strengths. The following benefits may be achieved: lower

108
w/c ratio may be utilized to attain higher strengths, SCC is more sensitive to segregation and
shrinkage relative to CC, and prestress losses of SCC girders may be higher than that of CC
girders.
2) The survey indicated that SCC mixtures can be made with materials available in each state
for obtaining the desired performance of prestressed SCC girders. Maximum Size Aggregate
(MSA) should be less than or equal to 0.75 in. to obtain reasonably good passing abilities
and avoid settling. Only cement is preferred to be used for enhancing performance of SCC
mixtures in lieu of combining cement with fillers. The values of MSAs that have been
frequently used by the majority of Departments of Transportation (DOTs) were 0.5 in. and
0.75 in. and w/c ratio varied for each state according to strength needed, but the most frequent
values were within the range of 0.41 to 0.45.
3) Three precast plants in Wisconsin participated in providing local materials needed for SCC
mixtures: County Materials Roberts, County Materials Janesville, and Spancrete. SCC
mixtures made with materials from each plant were adjusted in a laboratory setting by means
of trial batches to attain acceptable workability criteria.
4) Multiple SCC mixtures were designed and tested in stages one and two to evaluate their
fresh and hardened properties. For stage one, a mixture pool consisting of twelve SCC
mixtures with varying mixture parameters (i.e., cement content, w/c, S/Agg, aggregate type
and size, and blending of coarse aggregate) was tested in the SDSU Structures Laboratory.
Note that the properties at fresh state were investigated through Slump Flow, VSI, J-Ring,
109
and Column Segregation tests, while the hardened properties were evaluated through
compressive strength testing. Results specific to the testing at state one can be found below:
Slump flow results showed that, between all twelve mixtures, a range of 22.8 to 26 in.
was found, which was within the acceptable range for slump flow (22 to 28 in.).
Passing ability quantified by the difference in diameter between slump flow and J-
Ring tests revealed that passing ability ranged from 0.25 to 2.25 in. The majority of
the mixtures were less than the maximum passing ability (2 in.).
Segregation measured by the column segregation test found that all the mixtures
satisfied the required segregation percentage (15 %), and the percent segregation
decreased as the percentage of 3/8” coarse aggregate increased.
Compressive strength testing indicated that the strength of all the mixtures ranged from
5221 psi to 8432 psi where about half of the trial exceeded the required compressive
strength.
Through the results at stage one, it was concluded that the trial mixtures having 60 % and
80 % of 3/4” aggregate provided adequate workability and compressive strength necessary
for the production of the PSC girders for the WisDOT. Hence, eleven SCC mixtures made
with only 60 % and 80 % of ¾’’ aggregate were selected at stage two for additional
investigation at the fresh and harden states at certain plants (mixtures 1 through 3 for Roberts,
mixtures 4 through 7 for Janesville, and mixtures 8 through 11 for Spancrete). Particular
results from each plant are included as specified below:
110
The fresh and hardened properties of all the mixtures for Roberts are acceptable based
on the requirements.
The performance was consistently acceptable among all Janesville mixtures in terms
of the fresh and hardened properties.
Passing ability of all the Spancrete mixtures were not as optimal as those obtained
from the mixtures from Roberts and Janesville plants. For hardened property, mixtures
8 and 10 did not reach the required compressive strength at 18 hours.
Based upon the evaluation of the testing results from stage two and discussion with the
Project Oversight Committee (POC), it was recommended that mixtures 1, 2, 4, 6, and 9 be
selected to be tested for the examination of time-dependent material characteristics including
creep and shrinkage.
5) According to the ASTM 512 Standard Test Method, creep testing for all the five mixtures
was completed. Three creep frames were constructed to measure their creep strains, and were
subjected to a consistent compressive load maintained for 280 days. Three cylinders were
fabricated per mixture with three strain measurements on each side of each cylinder. The
average from all three cylinders was utilized to obtain the final strain change at a specific age.
Further, all the measured strains were used to calculate creep coefficients. These values were
then compared against those acquired from the AASHTO and ACI Specifications. Specific
findings from the creep testing include:
111
Creep behavior for the three cylinders of each mixture was generally similar, although
each mixture had different creep values.
Mixtures using cement Type III exhibited higher creep values compared to those with
cement Type I/II, and it was also found that a higher amount of coarse aggregate due
to different S/Agg helped constrain creep deformation in concrete. Specifically,
mixtures consisting of cement Type III and S/Agg of 0.5 (i.e., mixture 9) exhibits the
highest creep strain with a value of 1440 microstrain, while mixtures consisting of
cement Type I/II with S/Agg of 0.45 (i.e., mixture 2) exhibited the lowest creep
showing 1094 microstrain.
The creep model specified by the ACI code overestimated creep coefficients for all
the five mixtures, while the AASHTO model slightly underestimates them.
Following the ASTM 157 Standard Testing, shrinkage tests for two sets of all five SCC
mixtures were completed. The two sets consisted of the same mixture design with one made
at the plant, and the other made at the laboratory. Similar to the creep test, the shrinkage
strains were measured for 280 days. Additionally, the measured shrinkages for each of the
mixtures were compared to those from the AASHTO and ACI codified models. Results
obtained from the test are described as below:
The shrinkage values for all the mixtures ranged from 470 to 900 microstrain at 280
days.
112
At an early age, the slope of the shrinkage plot was steeper for the samples made at
the plant compared to the samples made in the lab. This behavior is attributed to the
curing differences between samples during the first day.
The AASHTO model provided a more accurate prediction of shrinkage at the end of
280 days for all the mixtures compared to the ACI model, which was considerably
conservative for all the mixtures.
6) Two full-scale girders were constructed to determine applicability and feasibility, one
made of SCC and the other made of CC. Many different mixture combinations were
evaluated in this project, but only the most suitable mixture was selected for full-scale testing
of the SCC girder. Both girders were fabricated to the Wisconsin Standard PSC 36W girder
specifications. Vibrating Wire (VW) gages were installed in each of the girders for
monitoring prestress losses spanning a 287 day period, which started at the transfer of
prestress. This time period of analysis allowed for three stages of prestress losses to be
analyzed: 1) elastic shortening, 2) time-dependent, and 3) construction losses. The following
conclusions were drawn from the results for these three stages:
Elastic shortening for the SCC girder was 9.07 ksi, while the CC girder was
approximately 17 % larger with a value of 10.61 ksi.
The final prestress loss for the SCC girder was 8.53 ksi, a near 33 % higher value
than that of CC girder equal to 6.42 ksi.
Construction losses were 2.22 ksi for the SCC girder and 1.90 ksi for the CC girder.

113
The total prestress losses experienced by each girder were 16.89 ksi for the SCC
girder, and 17.03 ksi for the CC girder.
The prestress losses continued to climb until day 161, which is when the girders were
shipped and placed on site, at which point the losses slowly started to decline until
the final recording day 287.
In addition to prestress losses, camber was also monitored for each of the girders. Camber
was recorded for 161 days, starting at transfer of prestress. Both the final camber reading and
the variation in camber were recorded, and the results are as follows:
A final reading for each girder was recorded at 4.5 in., however this value for the
SCC girder at day 91, while the CC girder didn’t reach this until day 126.
The SCC girder climbed to a peak camber faster than the CC girder, which started
with a higher value, but took longer to reach its peak.
The variation in camber was 1.63 in. for the SCC girder and 1.38 in. for the CC girder.
The variations in measured camber for the SCC and CC girders were higher than
those in codified camber, respectively. Therefore, it is recommended to monitor
camber of somewhat larger SCC girders in the precast plant, and to identify any crack
or damage at both ends of each girder applied by transfer of prestress and upward
deflection.
The final full-scale test performed was on the transfer length of each girder. These values
were determined using the 95 % Average Maximum Strain (AMS) method. Measurements

114
were taken at two different times for each girder, immediately after release and 28 days later.
The results from the measurements show:
Immediately after release, the transfer length was 19.0 in. for the SCC girder and 24.0
in. for the CC girder.
At 28 days, the transfer length increased for both girders. The SCC girder increased
1 in. to a final value of 20.0 in., while the CC girder increased 0.5 in. to a final value
of 24.5 in..
Because the AASHTO and ACI specified a transfer length of 36.0 and 30.0 in.,
respectively, both the codified formulas to determine the transfer length for each of
the test girders were considered conservative.
7) Throughout this project, a SCC mixture design specification (Section 8.1) for the high
quality control of SCC to be practical to build prestressed SCC girder bridges in Wisconsin
was established. Technical recommendations for structural performance related to transfer
length, camber, and prestress loss of SCC girders were made. However, it should be noted
that the recommendations were made based on the lab and field data on only one mixture
(i.e., mixture 4) through its full-scale testing. Therefore, there is need to validate any other
mixture before permitting its use in prestressed SCC girder production.
As a final point, it is anticipated that the recommendations for SCC mixture design that
achieves desired performance for use in prestressed SCC girders for WisDOT will be widely
accepted across Wisconsin and utilized for ensuring safety in its construction.

115
9.2 Future Work
Work from this project may be extended through future research in the following fields:
Modifying SCC mixture designs for a better control of creep and shrinkage.
Investigating shear strength of prestressed SCC bridge girders with different
prestressing forces and making relevant design recommendations.
Establishing a comprehensive prestressed SCC bridge girder design guideline by
performing representative load testing on a full-scale SCC girder and a parametric
study with variation in girder size, strength, prestressing force, and loss.
Examining long-term structural behavior of prestressed SCC girder bridges under
service loads using a structural monitoring system.
Determining live load distribution factors (LLDFs) of prestressed SCC girders
considering its prestress loss over time and developing reliable LLDFs formulas that
are compatible to those specified by the AASHTO.
116
References
AASHTO (2014). Bridge design specifications and commentary, American Association of Highway and Transportation Officials (AASHTO), Washington, D.C.
AASHTO (2009).Standard Specification for Size of Aggregate for Road and Bridge Construction, American Association of Highway and Transportation Officials (AASHTO), Washington, D.C.
ACI Committee 209 (2008). “Guide for modeling and calculating shrinkage and creep in hardened concrete.” ACI 209.2R-08, American Concrete Institute, Farmington Hills, Michigan.
ACI Committee 237. (2007). Self-Consolidating Concrete, ACI 237R-07, ACI, Farmington Hills, Mich.
ASTM. (2011). Standard Specification for Portland Cement, ASTM International, West Conshohocken, PA.
ASTM. (2011). Standard specification for Portland cement. ASTM C150. West Conshohocken, PA.
ASTM. (2011). Standard test method for creep of concrete in compression. ASTM C512. West Conshohocken, PA.
ASTM. (2011). Standard test method for length change of hardened hydraulic-cement mortar and concrete. ASTM C157. West Conshohocken, PA.
ASTM. (2011). Standard test method for passing ability of self-consolidating concrete by JRing. ASTM C1621. West Conshohocken, PA.
ASTM. (2011). Standard test method for slump flow of self-consolidating concrete. ASTM C1611. West Conshohocken, PA.
ASTM. (2011). Standard Test Method for Compressive Strength of Cylindrical Concrete Specimens. ASTM C39. West Conshohocken, PA.
ASTM. (2011). Standard test method for Static Modulus of Elasticity and Poisson’s Ratio of Concrete in Compression. ASTM C469. West Conshohocken, PA.
ASTM. (2011). Standard test method for static segregation of self-consolidating concrete using column technique. ASTM C 1610. West Conshohocken, PA.
Attiogbe, E.K., H.T. See, and J.A. Daczko (2006). “Engineering properties of self-consolidating concrete.” Proceedings, The First North American Conference on the Design and Use of Self-Consolidating Concrete, Hanley-Wood, LLC, Addison, Illinois, pp 331-336.
117
Barnes, R. W., Grove, J. W., and Burns, N. H. (2003). “Experimental assessment of factors affecting transfer length.” ACI Struct. J., 100(6), 740–748
Bassem, Andrawes,, Andrew Pozolo, and Zhe Chen (2013). "Development Length Tests of Full-Scale Prestressed Self-Consolidating Concrete Box and I-Girders." Journal of Bridge Engineering 18(11), pp 1209-1218.
Berke, N. S., Cornman, C. R., Jeknavorian, A. A., Knight, G. F., and Wallevik, O. (2003). “The effective use of superplasticizers and viscosity modifying agents in self-consolidating concrete.” Proceedings, The First North American Conference on the Design and Use of Self-Consolidating Concrete, Hanley-Wood, LLC, Addison, Illinois, pp 165-169.
Bonen D. and Shah S. (2004). “Fresh and Hardened Properties of Self-Consolidating Concrete.” Wiley inter science. Structural Engineering Materials, 7(1), pp 14-26.
Burgueno A and Bendert A. (2007). “Experimental Evaluation and Field Monitoring Of Prestressed Box Beams for SCC Demonstration Bridge.” RC-1489. East Lansing, Michigan.
Collepardi, M., A. Borsoi, S. Collepardi, and R. Troli (2005). “Strength, shrinkage and creep of SCC and flowing concrete.” Proceedings, The Second North American Conference on the Design and Use of Self-Consolidating Concrete (SCC), Hanley-Wood, LLC, Addison, Illinois, pp 911-919.
EFNARC. (2006). “Guidelines for Viscosity Modifying Admixtures for Concrete.”
Erkmen, S.F. (2008). “Self-Compacting Concrete (SCC) for Prestressed Bridge Girders.” MN/RC 2008-51. Minneapolis, Minnesota.
JSCE (1998). “Recommendations for Construction Practice of High-Fluidity Concrete.” Japan Society of Civil Engineers.
Kaar, P. H., LaFraugh, R. W., and Mass, M. A. (1963). “Influence of concrete strength on strand transfer length.” PCI J., 8(5), 47–67
Kavanaugh, B. P. (2009). “Creep Behavior of Self-Consolidating Concrete.” Master Thesis. Auburn, Alabama.
Khayat, K.H. (1999). “Workability, testing, and performance of self-consolidating concrete.” ACI Materials Journal¸ 96(3), pp 346-353.
Khayat, H. and Mitchell, D. (2009). "Self-Consolidating Concrete for Precast, Prestressed Concrete Bridge Elements." NCHRP Report 628(1).
Khayat, K.H. and Long, W.J. (2010). “Shrinkage of Precast, Prestressed Self-Consolidating Concrete.” ACI Materials Journal 107(3), pp 230-239.
Long W.J and Khayat, K (2011). Creep of Prestressed Self-Consolidating Concrete. ACI Materials Journal 108(2), pp 128-138.
118
Kim Y., Trejo D., Beth M., Hueste D. and Kim J. (2011). “Experimental Study on Creep and Durability of High-Early-Strength Self-Consolidating Concrete for Precast Elements”. ACI Materials Journal. 108(2): pp 128-138.
Kosmatka, S. H., Kerkhoff, B., and Panarese, W. C. (2002). “Design and control of concrete mixtures”, 14th Ed., Skokie, Illinois.
Labonte, T., and Hamilton, H., III (2005). “Self-consolidating concrete (SCC) structural investigation.” Rep. No 4910 4504 047. Florida Department of Transportation.
Long et al. (2014). “Performance-Based Specifications of Workability Characteristics of Prestressed, Precast Self-Consolidating Concrete”. Journal of Materials, 7(1), pp 2474-2489.
Mamaghani, I., Moretti, C., Sethre, D., and Dockter, B. (2010). “Evaluation of self-consolidating concrete (SCC) for use in North Dakota Transportation Projects.” Grand Forks, North Dakota
Mata, L. (2004). “Implementation of Self-Consolidating Concrete (SCC) for Prestressed Concrete Girders”. FHWA/NC/2006-30. North Carolina.
Mindess, S., Young, J. F., and Darwin, D. (2003). Concrete, 2nd Ed., Prentice-Hall, Inc., Upper Saddle River, New Jersey.
Okamura, H. and Ouchi, M. (1999). “Self-compacting concrete development, present use and future.” First International Symposium on SCC, RILEM publications PRO 7, Stockholm, Sweden.
Oliva, M.G. and Cramer, S. (2008), “Self-consolidating concrete: creep and shrinkage characteristics”, Report, University of Wisconsin.
PCI (2003). TR-6-03 Interim Guidelines for the Use of Self-Consolidating Concrete in Precast/Prestressed Concrete Institute Member Plants, 1st Ed., Chicago, IL.
PCI (2004). PCI Design Handbook, 6th Edition, Chicago, IL.
PCI (2012). Hwang, S, Khatib, R., Lee, H. K., Lee, S., and Khayat, K. H., "Optimization of steam-curing regime for high-strength, self-consolidating concrete for precast, prestressed concrete applications", PCI Journal, 2012, pp.48-62
Pellerin, B., J. Lamotte, C. Gnagne, and C. Canevet (2005). “Use of dedicated admixtures eases the implementation of SCC in the precast industry.” Proceedings, The Second North American Conference on the Design and Use of Self-Consolidating Concrete (SCC), Hanley-Wood, LLC, Addison, Illinois, pp 113-118.
Russell, B. W., and Burns, N. H. (1993). “Design guidelines for transfer, development and debonding of large diameter seven wire strands in pretensioned concrete girders.” Rep. No.1210-5F, Center For Transportation Research, The University of Texas, Austin.
119
Saak, A.W., Jennings, H.M., and Shah, P.S. (2004). “A generalized approach for the determination of yield stress by slump and slump flow.” Cement and Concrete Research; 34(3), pp 363-371.
Shamsad, A., Saheed, K., Mohammed, M. and Azad A. (2014). “Properties of Self-Consolidating Concrete Made Utilizing Alternative Mineral Fillers”. Construction and Building Materials, 68(1), pp 268-276.
Skarendahl, A. (2003). “The present-the future. In: Wallevik O, Nielsson I (eds.) Self-Compacting Concrete, Proceedings of 3rd Intern.” RILEM Symp. RILEM Publications S.A.R.L.: (Aug. 17, 2003).
Sonebi , M., Grünewald, S., and Walraven, J. (2007). “Filling Ability and Passing Ability of Self-Consolidating Concrete”. ACI Materials Journal, 104(2), March-April.
Tadros, M. K., Al-Omaishi, N., Seguirant, S. J., and Gallt, J. G., “Prestress Losses in Pretensioned High-Strength Concrete Bridge Girders,” NCHRP Report 496, Transportation Research Board, Washington, D. C., 2003.
Torres, E., and Seo, J. (2016). “State-of-the-art and practice review and recommended testing protocol: Self-consolidating concrete for prestressed bridge girders.” J. Environ. Civil Eng., 1–22.
Trejo, D. (2008). “Characterization of Self-consolidating Concrete for Design of Precast, Prestressed Bridge Girders”. College Station, TX: Texas Transportation Institute. FHWA/TX-09/0-5134-2. Texas.
Turkel, S. and Kandemir, A. (2010). “Fresh and Hardened Properties of SCC Made with Different Aggregate and Mineral Admixtures”. Journal of Materials in Civil Engineering, 22(1), pp 1025-1032.
Vilanova, A., Gómez J., and Agranati G. (2012). “Mechanical Properties of Self-Consolidating Concrete Using Conventional Concrete Models”. ACI Materials Journal 109(6); pp 587-596.
Wehbe, N., Sigl A., and Boushek, A. (2007). "Application of Self-Consolidating Concrete in Bridge Structures". MPC-11-194, South Dakota State University.
Wehbe, N., Sigl A., Gutzmer, Z., and Stripling, C. (2009). "Structural Performance of Prestressed Self-Consolidating Concrete Bridge Girders Made with Limestone Aggregates”. MPC-08-196, South Dakota State University.

120

121
Appendix A
Summary of DOT Survey Results
Summary of information received by DOT representatives will be briefly explained in the
subsections below. The survey was set up to determine requirements used in other states for
mixture design and fresh and hardened properties. An example of the survey is shown below:

122
Survey on SCC Parameters and Application at Various Departments of Transportation
The goal of this survey is to collect data related to the use of Self-Consolidating Concrete by
different states. The data collected will be analyzed and used to create a SCC mix for the
Wisconsin DOT. This research will be conducted at South Dakota State University.
Information provided by your state would be of great importance for the project success.
Time frame for survey completion is two weeks.
Q1: Does your state have specific mix parameters for the application of Self-Consolidating Concrete (SCC)? If yes, for what applications have SCC been used? (E.g. girders, box culverts, etc.)
Q1.1. If your state has specific SCC mix parameters, please complete the following:
Description: Amount (lbs/yrd3):
a. Type of cement used:
b. Cementitiuos materials used:
c. Coarse Aggregate/Size:
d. Fine Aggregate/Size:
e. Viscosity Modifying Admixture:
f. HRWR:
g. Water:
h. W/C
i. Other Admixtures:

123
Q1.2 Mark the following tests used to determine SCC properties and include acceptable range for each test.
Test: Used: Range/Values:
a. Slump Flow:
b. J-Ring Flow:
c. Column Segregation:
d. Visual Stability Index:
e. L-Box:
f. Compressive Strength:
g. Modulus of Elasticity:
Q2: Does your state have either past or ongoing research on SCC. If yes, please provide details (E.g. website, research report, etc.).
Q3: What is research plan for SCC characteristics and applications?
Q4: Any additional information and comments:
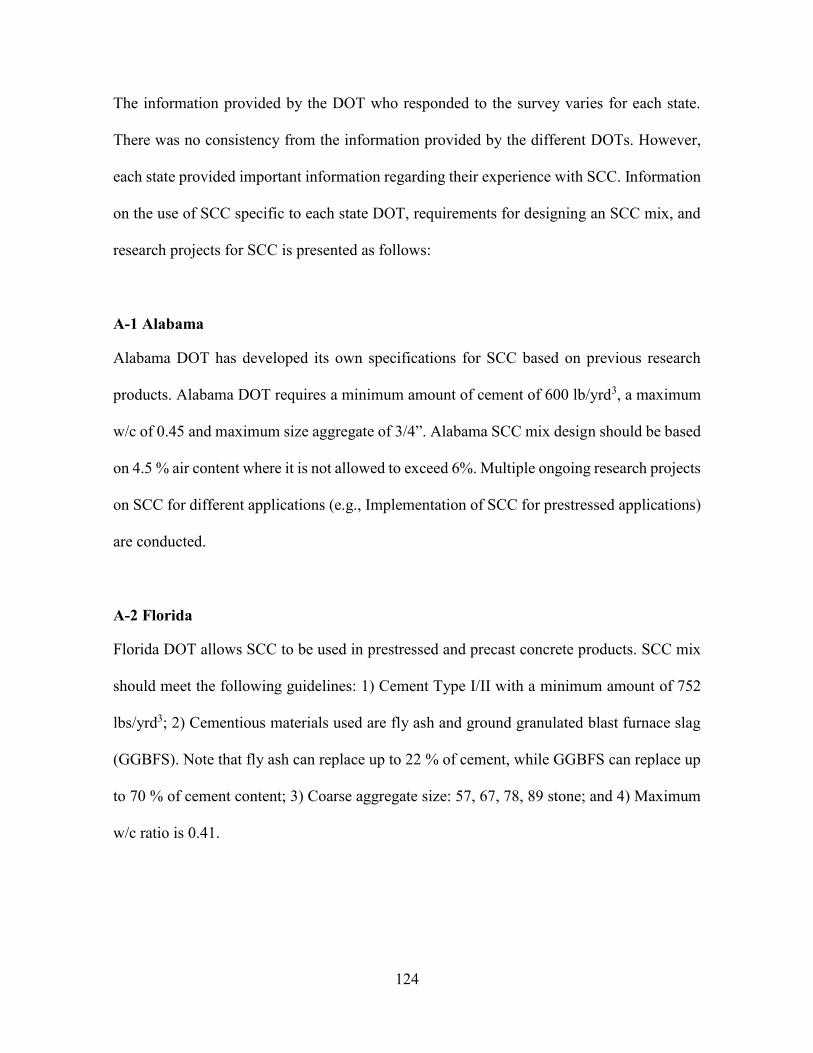
124
The information provided by the DOT who responded to the survey varies for each state.
There was no consistency from the information provided by the different DOTs. However,
each state provided important information regarding their experience with SCC. Information
on the use of SCC specific to each state DOT, requirements for designing an SCC mix, and
research projects for SCC is presented as follows:
A-1 Alabama
Alabama DOT has developed its own specifications for SCC based on previous research
products. Alabama DOT requires a minimum amount of cement of 600 lb/yrd3, a maximum
w/c of 0.45 and maximum size aggregate of 3/4”. Alabama SCC mix design should be based
on 4.5 % air content where it is not allowed to exceed 6%. Multiple ongoing research projects
on SCC for different applications (e.g., Implementation of SCC for prestressed applications)
are conducted.
A-2 Florida
Florida DOT allows SCC to be used in prestressed and precast concrete products. SCC mix
should meet the following guidelines: 1) Cement Type I/II with a minimum amount of 752
lbs/yrd3; 2) Cementious materials used are fly ash and ground granulated blast furnace slag
(GGBFS). Note that fly ash can replace up to 22 % of cement, while GGBFS can replace up
to 70 % of cement content; 3) Coarse aggregate size: 57, 67, 78, 89 stone; and 4) Maximum
w/c ratio is 0.41.
125
A-3 Georgia
Georgia DOT has created special provisions for the application of SCC. Precasters are
responsible of all mix designs, which will be submitted for approval. However, Georgia DOT
requires a minimum compressive stress at 28 days of 5000 psi. Also, the DOT allows the
replacement of cement by fillers which should not exceed 20 %, or if two or more fillers are
used the replacement of cement should be below 40 %. Fillers used by the DOT include fly
ash, granulated iron blast-furnace slag, metakaolin and microsilica.
A-4 Illinois
Illinois DOT has had its own SCC specifications for precast products since 2007. Illinois
DOT requires that every mix should be designed according to the Portland Cement Concrete
Level III Technician. From this specification, it is required that the total cement content
should not exceed 705 lbs/yrd3. Maximum w/c ratio is 0.44. Fine aggregates should not
exceed 50 % by weight of total aggregate used.
A-5 Iowa
Iowa DOT does not have specific SCC mix design, admixture supplier and precaster usually
work together to develop a mix design. However, DOT has developed brief guidelines for
approving and testing SCC mixes. These guidelines recommend aggregate gradation with ¾”
top size aggregate. Sand to total aggregate ratio should be between 0.4 and 0.5. W/c should
be between 0.25 - 0.44. Producers should also be able to demonstrate the compatibility
between HRWR and VMA if used. Once, this requirement are met mix should be submitted
to materials engineer for testing and approval.

126
A-6 Kentucky
Kentucky Transportation Cabinet (KYTC) does not have specifications for SCC; however
they have created steps for the approval of a specific mix. This mix will be submitted to the
materials engineer, where the producer should be able to demonstrate an adequate quality
control plan for SCC. For the mix design its required minimum 564 lbs/yrd3, a maximum w/c
of 0.46 and air content of 6 ± 2%.
A-7 Louisiana
Louisiana does not have specification for SCC. However, they have used for pile end fills.
For this application it was required to have a slump flow between 20” - 28”. Louisiana DOT
currently has research projects for the use of SCC to study slump flow, strength, segregation
potential and washout resistance.
A-8 Michigan
Michigan requirements for SCC: 1) Use Type I or Type III cement; 2) All mixes are to be
designed for a design compressive strength at 28 days of 5500 psi; 3) Level of entrained air
content for all mixes shall be 6 ± 1.5 %. More recommendations for placement and structural
details for girders can be seen in the appendixes.
A-9 Minnesota
Minnesota DOT currently does not have specific applications for SCC. SCC was used on a
couple of projects in which the contractor requested to use it. The SCC was placed in drilled
shafts and some heavily re-enforced cast-in-place structure applications. However, they are
currently working with their precasters to create guidelines for SCC. Minnesota DOT

127
attached to the survey a draft for the SCC specifications. Some of the most relevant
requirements from the draft include: 1) Cement complying with ASTM C 150 Type I or I/II.
Up to a total of 30 percent replacement by mass (weight) with fly ash conforming to ASTM
C618, ground granulated blast furnace slag conforming to ASTM C 989, and/or Silica Fume
conforming to ASTM C 1240 may be used. Replacement with Silica Fume shall not exceed
5 percent of the total cementitious material; 2) the mixture shall be designed and produced at
a w/c of not greater than 0.45; 3) the air content shall be 6.5 percent plus 2.0 percent or minus
1.5 percent at the point of placement; 4) SCC anticipated strength of 4300 psi at 28 days.
A-10 Nebraska
Nebraska has created special provisions for the use of SCC. The contractor has to contact the
Portland Cement Concrete Engineer 3-4 weeks in advance of the use of SCC for the purpose
of a batch trial. Any modification to the mix proposed in the table below will have to be
approved by the concrete engineer and trial batches should be performed. These provisions
include a list of testing methods to determine SCC properties. However, these provisions do
not include accepted range of values for each test.
Cement Fly Ash Total
Cementitious
Sand/Total
Aggregate
Type of
Coarse
Aggregate
Air
Content W/C
Compressive
Strength
(28 day)
607
lbs/yrd3
203
lbs/yrd3 810 lbs/yrd3 75 ± 3 Limestone 6 % 0.37 6000 psi
128
Nebraska has performed research on: 1) Application of Ultra-High Performance Concrete to
Bridge Girders and 2) Bond Strength of Self-Consolidating Concrete for Prestressed
Concrete Applications.
A-11 Nevada
Nevada DOT does not have specific guidelines for SCC or any class of concrete. Nevada
DOT has limits that contractors must meet when submitting mix designs for approval on
NDOT projects. The limits are not included in this report because the limits attached to the
surveys are not compatible with SCC guidelines in other states.
A-12 New York State
New York State DOT (NYS DOT) does not have specific mix parameters for building a SCC
mixture. NYSDOT treats SCC as a performance based application and requires the
contractor/producer to develop a mix for application as well as a quality control plan to
maintain consistency and quality. SCC has been used for repair applications and precast
products. Special notes were attached to the survey explaining test methods. That information
was shown in Table 4.2. Not specific information on materials and proportioning was given
by NYDOT.
A-13 North Carolina
North Carolina has used SCC for girders, box beams, voided slabs and box culverts. North
Carolina has past research to determine the feasibility of SCC. From the research
requirements are applied by North Carolina DOT as follows: 1) Portland Cement Type III or
combination Type I/II; 2) cementitious materials used include fly ash, slag, and silica fume.
129
Replacement amounts vary as needed; 3) coarse aggregate stone size: #57, 67, or 78M; 4)
fine aggregate 2S or 2MS; 5) w/c max 0.40 if strength required is above 6000 psi. If required
strength below 6000 psi then max w/c is 0.46; 6) admixtures are used upon request and mix
performance. Admixtures used are: HRWR, VMA, air-entrainer, retarder, accelerator, and
hydration control admixture.
A-14 Ohio
SCC has specifications for the use of SCC. SCC is used in precast/prestressed functions along
with cast-in-place where there is rebar congestion. Contractors should include a quality
control plan. Ohio specifications for SCC state that a minimum of 520 lbs/yrd3 should be
used. Also, cementitious materials used include fly ash or slag. Fly ash can be used to replace
25 % of cement, while slag can be used to replace 30 %. If slag and fly ash are combined
cement can be replaced up to 50 %. Admixtures can be added upon manufacturer
recommendation; however, admixtures should not be mixed between manufacturers. Ohio
does not have previous or future plans for research on SCC.
A-15 Pennsylvania
PennDOT has been using SCC in precast and prestressed structural components since 2004,
and will start using SCC in field cast caisson/drilled shaft construction. Pennsylvania
specifications for precast concrete products include a section for SCC. This section explains
test methods requirements for SCC, these requirements are shown in table 4.2. Mix design is
in charge of producers and should be approved by the materials engineer.
130
A-16 Rhode Island
Rhode Island DOT (RiDOT) uses SCC for precast structures, abutments, culverts, deck slabs,
beams and cast-in-place (repairs and drilled shafts). RiDOT has developed some guidelines
for the use of SCC. RiDOT permits any concrete class mix with the exception of class B and
Z. Concrete mixes can be modified to SCC. Requirements for the SCC mix include: 1) W/c
should be less than 0.36; 2) Chemical admixture shall be added at a rate that is recommended
by the admixture manufacturer with a tolerance of ± 3 percent by weight. RiDOT is
considering analyzing the w/c maximum value to allow for a wider range in the future.
A-17 South Carolina
SCDOT has no specific mix parameters for SCC. SCDOT had a research project with The
University of South Carolina (USC) a few years ago. The research was concerning the use
of SCC for prestressed girders. DOT representative stated that the precast concrete industry
are hesitant to use SCC for their work; they would rather user higher slump.
A-18 South Dakota
South Dakota DOT has created guidelines for SCC based on quartzite and limestone
aggregates. One research project for each aggregate was performed to study the structural
performance of SCC of prestressed girders with the respective aggregates. South Dakota
DOT guidelines state: 1) Minimum cement content of 700 lb/yrd3; 2) maximum w/c of 0.37;
3) minimum coarse aggregate content of 40 %; 4) entrained air range of 5 to 7.5 %.
131
A-19 Texas
Texas DOT has created SCC specifications as well as a quality control plan. SCC
specifications contain the acceptance range of values for test methods. However, the
specifications received from the DOT do not contain specific values for designing SCC mix.
SCC mix design will be submitted for approval, and several trial batches will be performed
to ensure the performance of the mix. Based on the diversity of aggregates in Texas research
was needed to determine the performance of the mix. Texas DOT sponsored research
regarding “Characterization of Self-Consolidating Concrete for Design f Precast, Prestressed
Bridge Girders”. Texas DOT representative mentioned that new guidelines for SCC will be
used starting March 2015.
A-20 Utah
Utah DOT uses SCC for different applications that include girders, box culverts, noise walls
and other precast applications. Utah DOT has been using SCC in pre-cast applications with
great success for 10 years. A standard specification for SCC has been used since 2012.
Requirements for the SCC mix include: 1) Type III cement and a minimum amount of 611
lbs/yrd3; 2) fly ash class F is used to replace cement, within a range of 20 – 30 % of the total
cementitious materials; 3) coarse aggregate size 3/4” or 1/2”; 4) maximum w/c is 0.4; 5)
admixtures are added as needed to obtain desired performance.
A-21 Virginia
Virginia DOT uses SCC for bridges, beams, drilled shafts, prestressed beams and precast
items. Parameters for SCC follow the same as normal concrete but with a different slump
requirement and different admixtures. The parameters include that the coarse aggregate
132
should not exceed 3/4", not less than 1/5 of the narrowest dimension between the sides of the
forms, and not less than 3/4 of minimum clear spacing between bars tendons or ducts. W/c
maximum value of 0.45. VMA must meet ASTM C494, Type S. Other admixtures are added
as needed, e.g. shrinkage reducing admixtures may be added to control cracking. Virginia
DOT uses SCC for several research projects, currently studying SCC in per caps for bridges.
A-22 Washington
Washington DOT approves the use of SCC for precast applications. Mix should be submitted
for annual approval according to guidelines created by the DOT. These guidelines provide
ranges of accepted values for fresh testing, which were shown in previous section. For precast
products it is required to use Type III cement, however no other requirements are stated in
the specification for the SCC mix. Washington DOT has not had previous research projects
on SCC, and does not plan in having one for now.

133
Appendix B
List of Mixture Designs
Detailed mixture materials and parameters for all 28 different mixtures considered in this
project. Parameters varied between 0.45 and 0.5 for S/Agg, and between 0.35 and 0.33 for
w/c ratio.
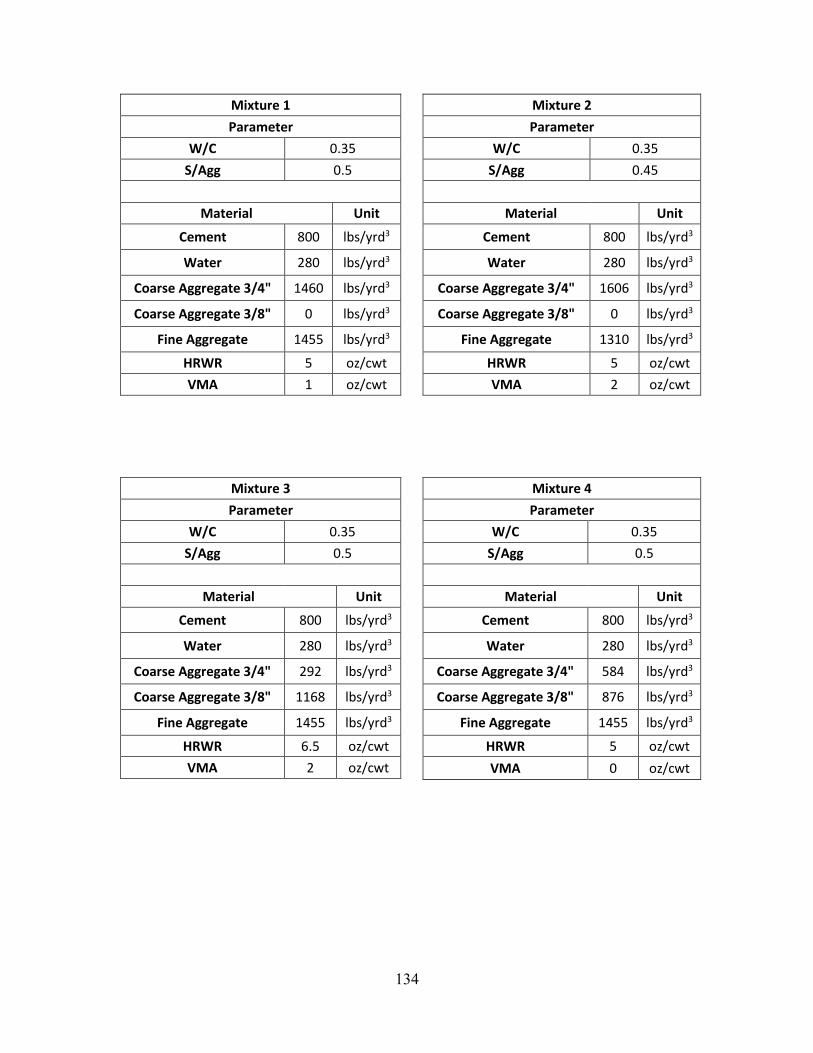
134
Mixture 1
Parameter
W/C 0.35
S/Agg 0.5
Material Unit
Cement 800 lbs/yrd3
Water 280 lbs/yrd3
Coarse Aggregate 3/4" 1460 lbs/yrd3
Coarse Aggregate 3/8" 0 lbs/yrd3
Fine Aggregate 1455 lbs/yrd3
HRWR 5 oz/cwt
VMA 1 oz/cwt
Mixture 2
Parameter
W/C 0.35
S/Agg 0.45
Material Unit
Cement 800 lbs/yrd3
Water 280 lbs/yrd3
Coarse Aggregate 3/4" 1606 lbs/yrd3
Coarse Aggregate 3/8" 0 lbs/yrd3
Fine Aggregate 1310 lbs/yrd3
HRWR 5 oz/cwt
VMA 2 oz/cwt
Mixture 3
Parameter
W/C 0.35
S/Agg 0.5
Material Unit
Cement 800 lbs/yrd3
Water 280 lbs/yrd3
Coarse Aggregate 3/4" 292 lbs/yrd3
Coarse Aggregate 3/8" 1168 lbs/yrd3
Fine Aggregate 1455 lbs/yrd3
HRWR 6.5 oz/cwt
VMA 2 oz/cwt
Mixture 4
Parameter
W/C 0.35
S/Agg 0.5
Material Unit
Cement 800 lbs/yrd3
Water 280 lbs/yrd3
Coarse Aggregate 3/4" 584 lbs/yrd3
Coarse Aggregate 3/8" 876 lbs/yrd3
Fine Aggregate 1455 lbs/yrd3
HRWR 5 oz/cwt
VMA 0 oz/cwt
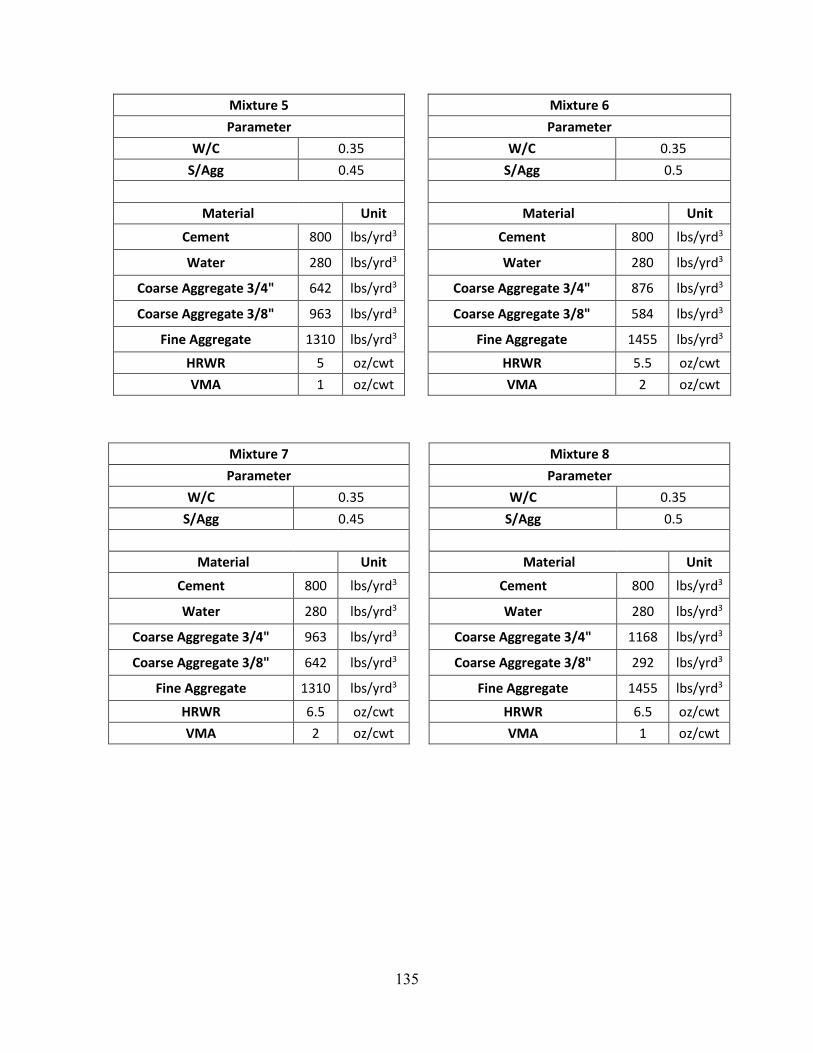
135
Mixture 5
Parameter
W/C 0.35
S/Agg 0.45
Material Unit
Cement 800 lbs/yrd3
Water 280 lbs/yrd3
Coarse Aggregate 3/4" 642 lbs/yrd3
Coarse Aggregate 3/8" 963 lbs/yrd3
Fine Aggregate 1310 lbs/yrd3
HRWR 5 oz/cwt
VMA 1 oz/cwt
Mixture 6
Parameter
W/C 0.35
S/Agg 0.5
Material Unit
Cement 800 lbs/yrd3
Water 280 lbs/yrd3
Coarse Aggregate 3/4" 876 lbs/yrd3
Coarse Aggregate 3/8" 584 lbs/yrd3
Fine Aggregate 1455 lbs/yrd3
HRWR 5.5 oz/cwt
VMA 2 oz/cwt
Mixture 7
Parameter
W/C 0.35
S/Agg 0.45
Material Unit
Cement 800 lbs/yrd3
Water 280 lbs/yrd3
Coarse Aggregate 3/4" 963 lbs/yrd3
Coarse Aggregate 3/8" 642 lbs/yrd3
Fine Aggregate 1310 lbs/yrd3
HRWR 6.5 oz/cwt
VMA 2 oz/cwt
Mixture 8
Parameter
W/C 0.35
S/Agg 0.5
Material Unit
Cement 800 lbs/yrd3
Water 280 lbs/yrd3
Coarse Aggregate 3/4" 1168 lbs/yrd3
Coarse Aggregate 3/8" 292 lbs/yrd3
Fine Aggregate 1455 lbs/yrd3
HRWR 6.5 oz/cwt
VMA 1 oz/cwt
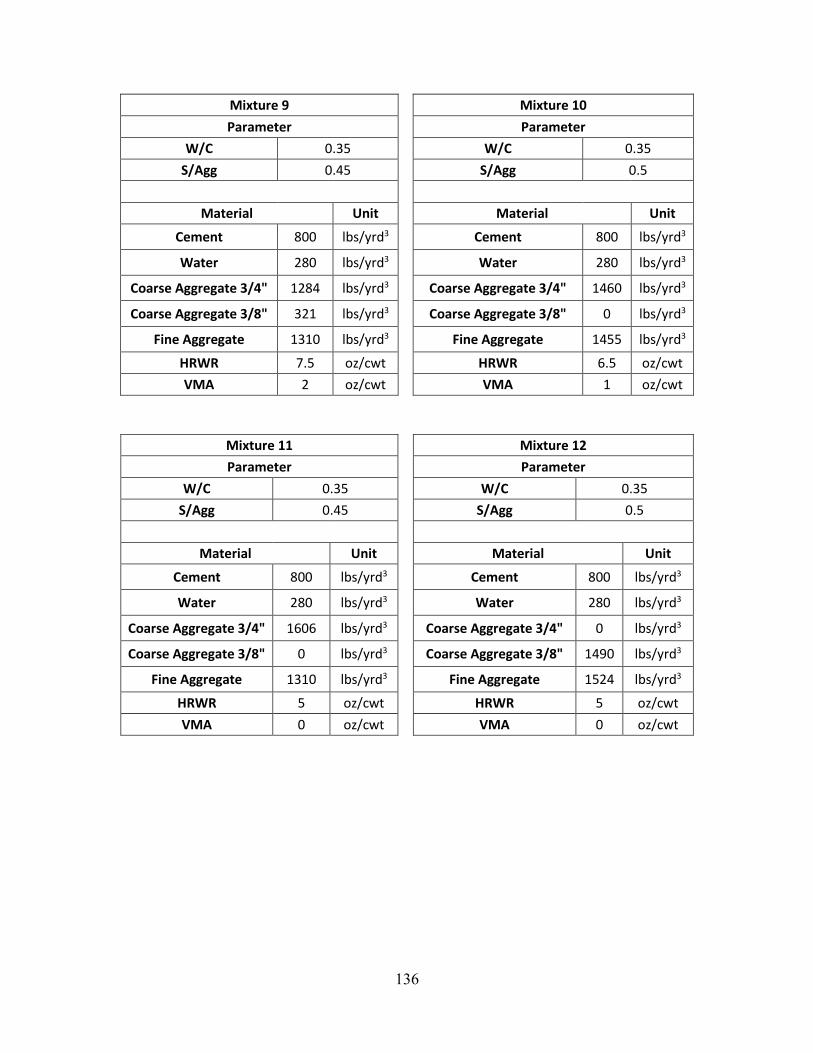
136
Mixture 9
Parameter
W/C 0.35
S/Agg 0.45
Material Unit
Cement 800 lbs/yrd3
Water 280 lbs/yrd3
Coarse Aggregate 3/4" 1284 lbs/yrd3
Coarse Aggregate 3/8" 321 lbs/yrd3
Fine Aggregate 1310 lbs/yrd3
HRWR 7.5 oz/cwt
VMA 2 oz/cwt
Mixture 10
Parameter
W/C 0.35
S/Agg 0.5
Material Unit
Cement 800 lbs/yrd3
Water 280 lbs/yrd3
Coarse Aggregate 3/4" 1460 lbs/yrd3
Coarse Aggregate 3/8" 0 lbs/yrd3
Fine Aggregate 1455 lbs/yrd3
HRWR 6.5 oz/cwt
VMA 1 oz/cwt
Mixture 11
Parameter
W/C 0.35
S/Agg 0.45
Material Unit
Cement 800 lbs/yrd3
Water 280 lbs/yrd3
Coarse Aggregate 3/4" 1606 lbs/yrd3
Coarse Aggregate 3/8" 0 lbs/yrd3
Fine Aggregate 1310 lbs/yrd3
HRWR 5 oz/cwt
VMA 0 oz/cwt
Mixture 12
Parameter
W/C 0.35
S/Agg 0.5
Material Unit
Cement 800 lbs/yrd3
Water 280 lbs/yrd3
Coarse Aggregate 3/4" 0 lbs/yrd3
Coarse Aggregate 3/8" 1490 lbs/yrd3
Fine Aggregate 1524 lbs/yrd3
HRWR 5 oz/cwt
VMA 0 oz/cwt
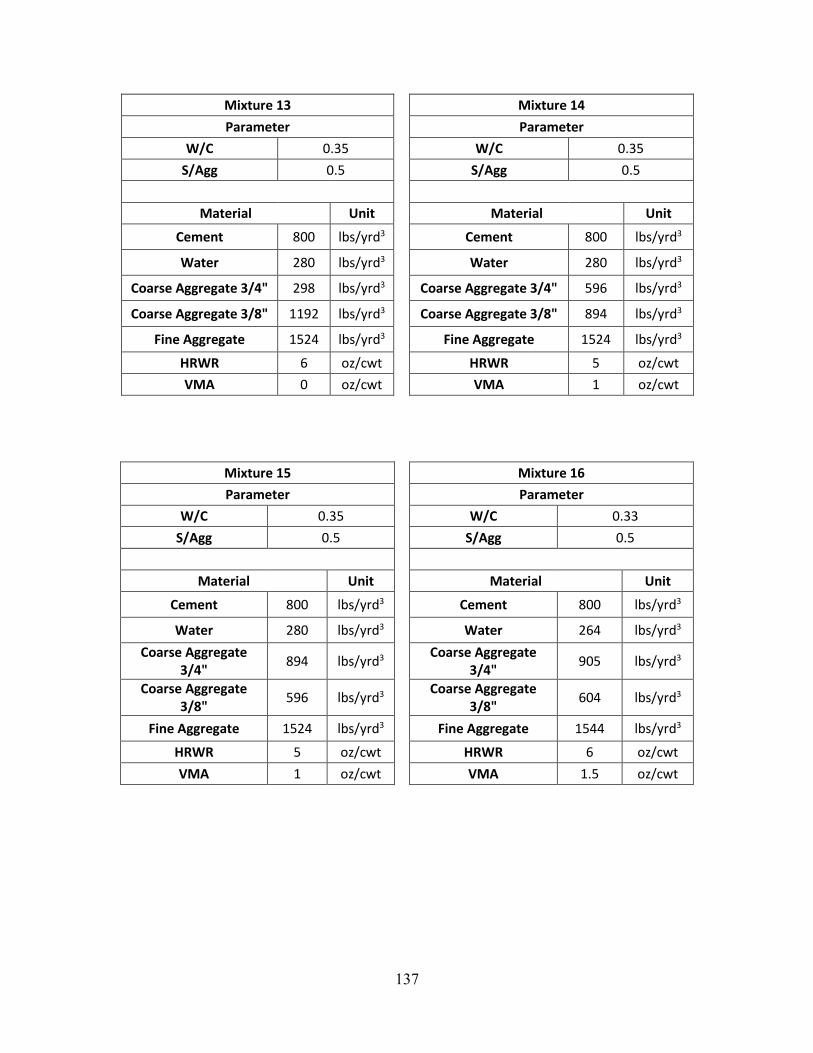
137
Mixture 13
Parameter
W/C 0.35
S/Agg 0.5
Material Unit
Cement 800 lbs/yrd3
Water 280 lbs/yrd3
Coarse Aggregate 3/4" 298 lbs/yrd3
Coarse Aggregate 3/8" 1192 lbs/yrd3
Fine Aggregate 1524 lbs/yrd3
HRWR 6 oz/cwt
VMA 0 oz/cwt
Mixture 14
Parameter
W/C 0.35
S/Agg 0.5
Material Unit
Cement 800 lbs/yrd3
Water 280 lbs/yrd3
Coarse Aggregate 3/4" 596 lbs/yrd3
Coarse Aggregate 3/8" 894 lbs/yrd3
Fine Aggregate 1524 lbs/yrd3
HRWR 5 oz/cwt
VMA 1 oz/cwt
Mixture 15
Parameter
W/C 0.35
S/Agg 0.5
Material Unit
Cement 800 lbs/yrd3
Water 280 lbs/yrd3
Coarse Aggregate 3/4"
894 lbs/yrd3
Coarse Aggregate 3/8"
596 lbs/yrd3
Fine Aggregate 1524 lbs/yrd3
HRWR 5 oz/cwt
VMA 1 oz/cwt
Mixture 16
Parameter
W/C 0.33
S/Agg 0.5
Material Unit
Cement 800 lbs/yrd3
Water 264 lbs/yrd3
Coarse Aggregate 3/4"
905 lbs/yrd3
Coarse Aggregate 3/8"
604 lbs/yrd3
Fine Aggregate 1544 lbs/yrd3
HRWR 6 oz/cwt
VMA 1.5 oz/cwt
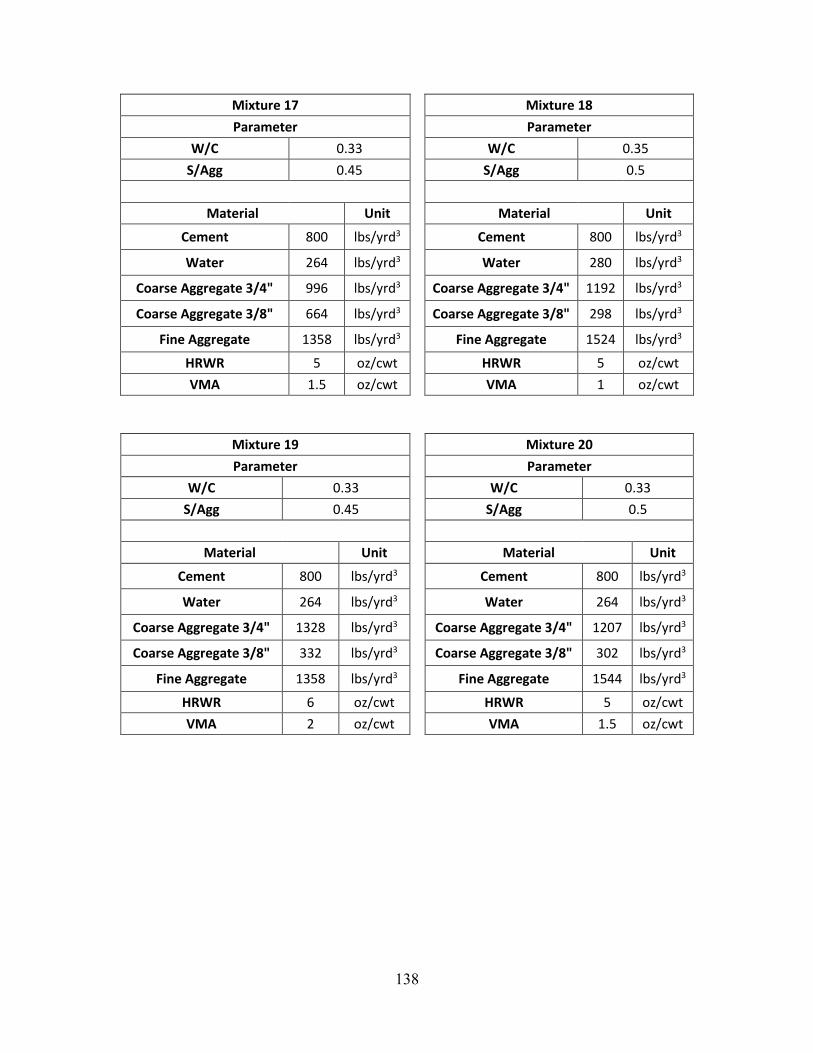
138
Mixture 17
Parameter
W/C 0.33
S/Agg 0.45
Material Unit
Cement 800 lbs/yrd3
Water 264 lbs/yrd3
Coarse Aggregate 3/4" 996 lbs/yrd3
Coarse Aggregate 3/8" 664 lbs/yrd3
Fine Aggregate 1358 lbs/yrd3
HRWR 5 oz/cwt
VMA 1.5 oz/cwt
Mixture 18
Parameter
W/C 0.35
S/Agg 0.5
Material Unit
Cement 800 lbs/yrd3
Water 280 lbs/yrd3
Coarse Aggregate 3/4" 1192 lbs/yrd3
Coarse Aggregate 3/8" 298 lbs/yrd3
Fine Aggregate 1524 lbs/yrd3
HRWR 5 oz/cwt
VMA 1 oz/cwt
Mixture 19
Parameter
W/C 0.33
S/Agg 0.45
Material Unit
Cement 800 lbs/yrd3
Water 264 lbs/yrd3
Coarse Aggregate 3/4" 1328 lbs/yrd3
Coarse Aggregate 3/8" 332 lbs/yrd3
Fine Aggregate 1358 lbs/yrd3
HRWR 6 oz/cwt
VMA 2 oz/cwt
Mixture 20
Parameter
W/C 0.33
S/Agg 0.5
Material Unit
Cement 800 lbs/yrd3
Water 264 lbs/yrd3
Coarse Aggregate 3/4" 1207 lbs/yrd3
Coarse Aggregate 3/8" 302 lbs/yrd3
Fine Aggregate 1544 lbs/yrd3
HRWR 5 oz/cwt
VMA 1.5 oz/cwt
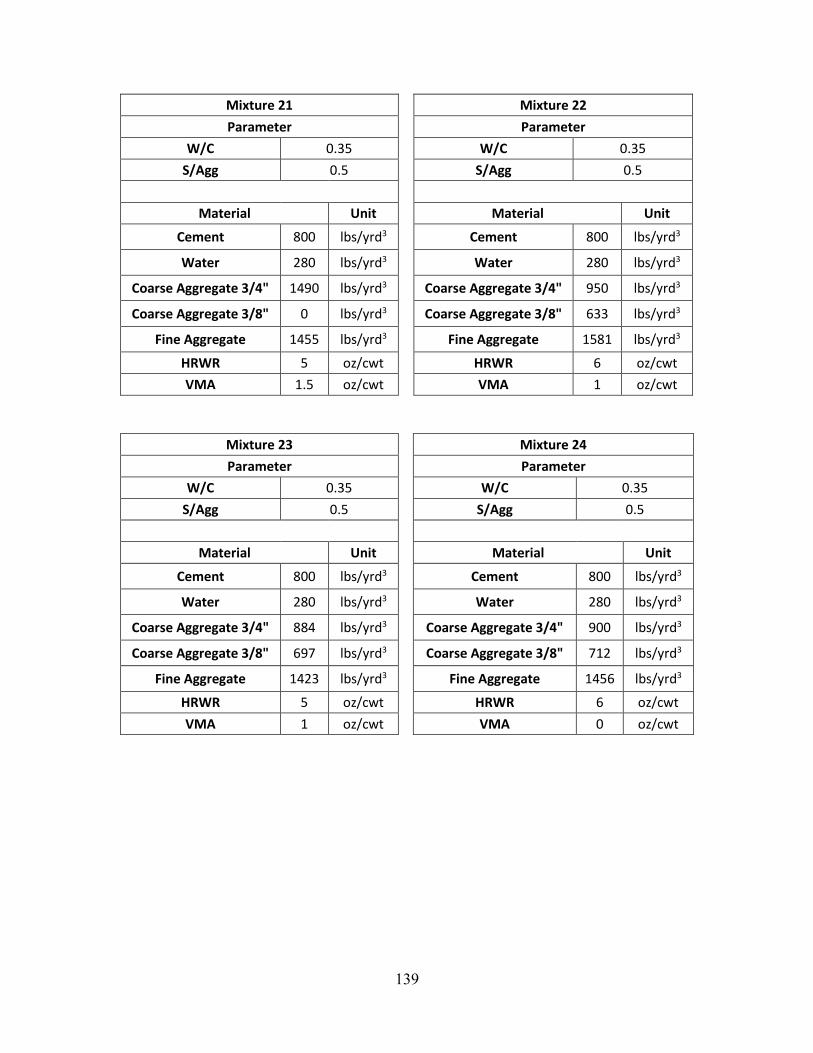
139
Mixture 21
Parameter
W/C 0.35
S/Agg 0.5
Material Unit
Cement 800 lbs/yrd3
Water 280 lbs/yrd3
Coarse Aggregate 3/4" 1490 lbs/yrd3
Coarse Aggregate 3/8" 0 lbs/yrd3
Fine Aggregate 1455 lbs/yrd3
HRWR 5 oz/cwt
VMA 1.5 oz/cwt
Mixture 22
Parameter
W/C 0.35
S/Agg 0.5
Material Unit
Cement 800 lbs/yrd3
Water 280 lbs/yrd3
Coarse Aggregate 3/4" 950 lbs/yrd3
Coarse Aggregate 3/8" 633 lbs/yrd3
Fine Aggregate 1581 lbs/yrd3
HRWR 6 oz/cwt
VMA 1 oz/cwt
Mixture 23
Parameter
W/C 0.35
S/Agg 0.5
Material Unit
Cement 800 lbs/yrd3
Water 280 lbs/yrd3
Coarse Aggregate 3/4" 884 lbs/yrd3
Coarse Aggregate 3/8" 697 lbs/yrd3
Fine Aggregate 1423 lbs/yrd3
HRWR 5 oz/cwt
VMA 1 oz/cwt
Mixture 24
Parameter
W/C 0.35
S/Agg 0.5
Material Unit
Cement 800 lbs/yrd3
Water 280 lbs/yrd3
Coarse Aggregate 3/4" 900 lbs/yrd3
Coarse Aggregate 3/8" 712 lbs/yrd3
Fine Aggregate 1456 lbs/yrd3
HRWR 6 oz/cwt
VMA 0 oz/cwt
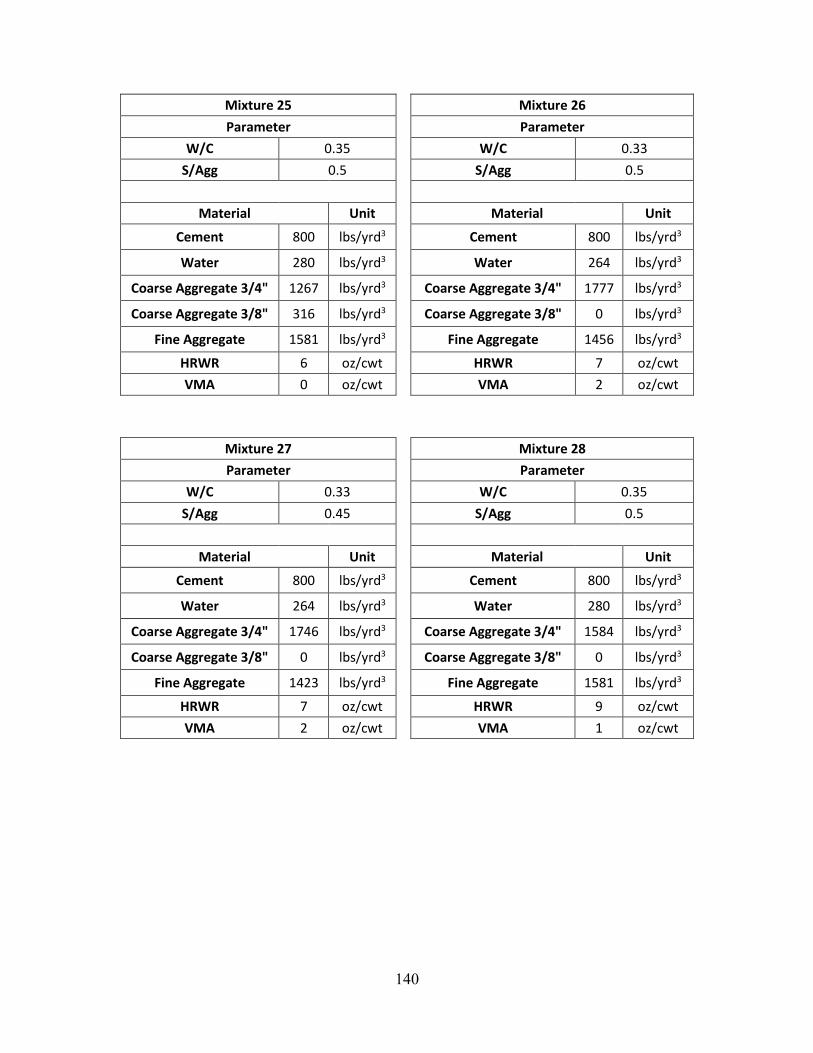
140
Mixture 25
Parameter
W/C 0.35
S/Agg 0.5
Material Unit
Cement 800 lbs/yrd3
Water 280 lbs/yrd3
Coarse Aggregate 3/4" 1267 lbs/yrd3
Coarse Aggregate 3/8" 316 lbs/yrd3
Fine Aggregate 1581 lbs/yrd3
HRWR 6 oz/cwt
VMA 0 oz/cwt
Mixture 26
Parameter
W/C 0.33
S/Agg 0.5
Material Unit
Cement 800 lbs/yrd3
Water 264 lbs/yrd3
Coarse Aggregate 3/4" 1777 lbs/yrd3
Coarse Aggregate 3/8" 0 lbs/yrd3
Fine Aggregate 1456 lbs/yrd3
HRWR 7 oz/cwt
VMA 2 oz/cwt
Mixture 27
Parameter
W/C 0.33
S/Agg 0.45
Material Unit
Cement 800 lbs/yrd3
Water 264 lbs/yrd3
Coarse Aggregate 3/4" 1746 lbs/yrd3
Coarse Aggregate 3/8" 0 lbs/yrd3
Fine Aggregate 1423 lbs/yrd3
HRWR 7 oz/cwt
VMA 2 oz/cwt
Mixture 28
Parameter
W/C 0.35
S/Agg 0.5
Material Unit
Cement 800 lbs/yrd3
Water 280 lbs/yrd3
Coarse Aggregate 3/4" 1584 lbs/yrd3
Coarse Aggregate 3/8" 0 lbs/yrd3
Fine Aggregate 1581 lbs/yrd3
HRWR 9 oz/cwt
VMA 1 oz/cwt

141
Appendix C
Summary of Fresh and Hardened Properties
Fresh and hardened properties for the 28 different mixtures considered in the project are
presented in this appendix. The properties include: Slump Flow, J-Ring, VSI, T20, Column
Segregation, and Compressive Strength for both 18 hours and 28 days.
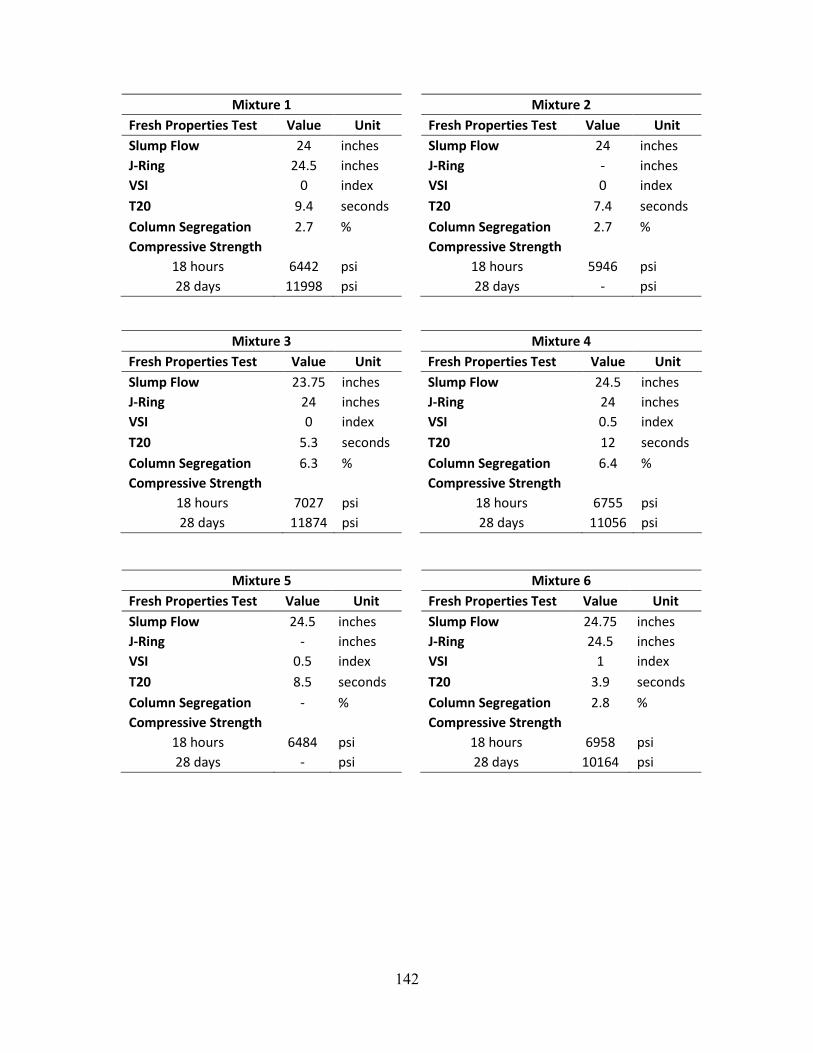
142
Mixture 1
Fresh Properties Test Value Unit
Slump Flow 24 inches
J-Ring 24.5 inches
VSI 0 index
T20 9.4 seconds
Column Segregation 2.7 %
Compressive Strength
18 hours 6442 psi
28 days 11998 psi
Mixture 2
Fresh Properties Test Value Unit
Slump Flow 24 inches
J-Ring - inches
VSI 0 index
T20 7.4 seconds
Column Segregation 2.7 %
Compressive Strength
18 hours 5946 psi
28 days - psi
Mixture 3
Fresh Properties Test Value Unit
Slump Flow 23.75 inches
J-Ring 24 inches
VSI 0 index
T20 5.3 seconds
Column Segregation 6.3 %
Compressive Strength
18 hours 7027 psi
28 days 11874 psi
Mixture 4
Fresh Properties Test Value Unit
Slump Flow 24.5 inches
J-Ring 24 inches
VSI 0.5 index
T20 12 seconds
Column Segregation 6.4 %
Compressive Strength
18 hours 6755 psi
28 days 11056 psi
Mixture 5
Fresh Properties Test Value Unit
Slump Flow 24.5 inches
J-Ring - inches
VSI 0.5 index
T20 8.5 seconds
Column Segregation - %
Compressive Strength
18 hours 6484 psi
28 days - psi
Mixture 6
Fresh Properties Test Value Unit
Slump Flow 24.75 inches
J-Ring 24.5 inches
VSI 1 index
T20 3.9 seconds
Column Segregation 2.8 %
Compressive Strength
18 hours 6958 psi
28 days 10164 psi
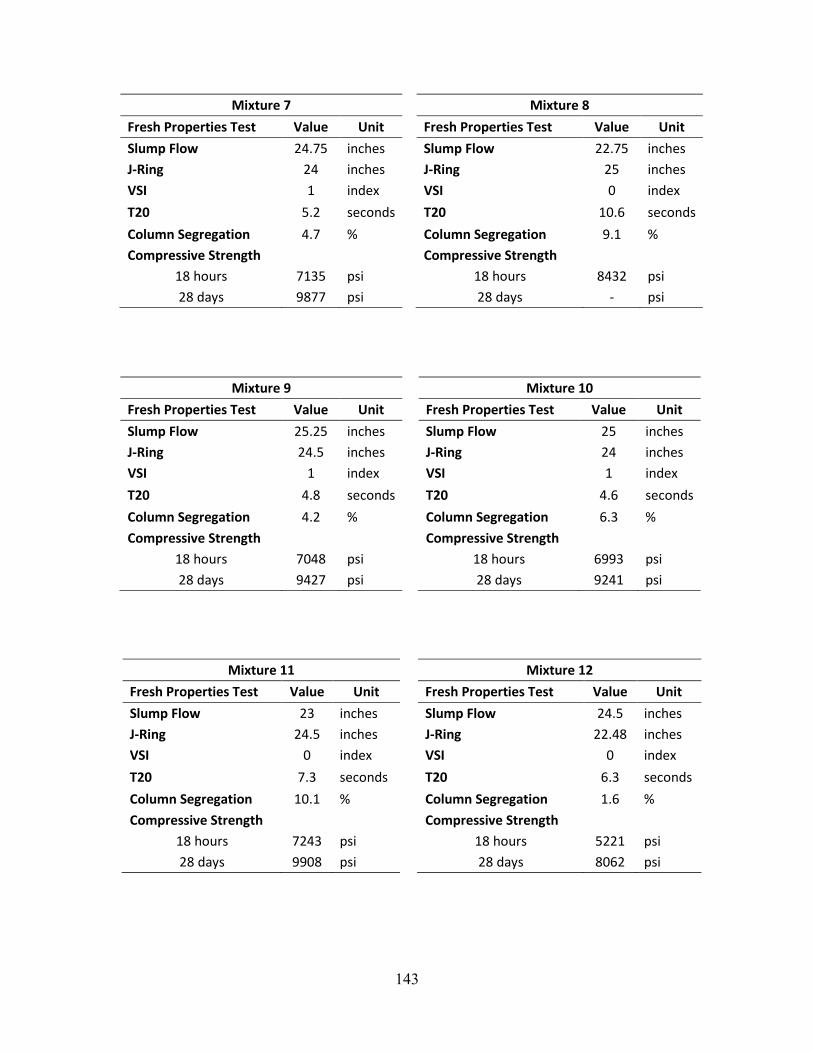
143
Mixture 7
Fresh Properties Test Value Unit
Slump Flow 24.75 inches
J-Ring 24 inches
VSI 1 index
T20 5.2 seconds
Column Segregation 4.7 %
Compressive Strength
18 hours 7135 psi
28 days 9877 psi
Mixture 8
Fresh Properties Test Value Unit
Slump Flow 22.75 inches
J-Ring 25 inches
VSI 0 index
T20 10.6 seconds
Column Segregation 9.1 %
Compressive Strength
18 hours 8432 psi
28 days - psi
Mixture 9
Fresh Properties Test Value Unit
Slump Flow 25.25 inches
J-Ring 24.5 inches
VSI 1 index
T20 4.8 seconds
Column Segregation 4.2 %
Compressive Strength
18 hours 7048 psi
28 days 9427 psi
Mixture 10
Fresh Properties Test Value Unit
Slump Flow 25 inches
J-Ring 24 inches
VSI 1 index
T20 4.6 seconds
Column Segregation 6.3 %
Compressive Strength
18 hours 6993 psi
28 days 9241 psi
Mixture 11
Fresh Properties Test Value Unit
Slump Flow 23 inches
J-Ring 24.5 inches
VSI 0 index
T20 7.3 seconds
Column Segregation 10.1 %
Compressive Strength
18 hours 7243 psi
28 days 9908 psi
Mixture 12
Fresh Properties Test Value Unit
Slump Flow 24.5 inches
J-Ring 22.48 inches
VSI 0 index
T20 6.3 seconds
Column Segregation 1.6 %
Compressive Strength
18 hours 5221 psi
28 days 8062 psi
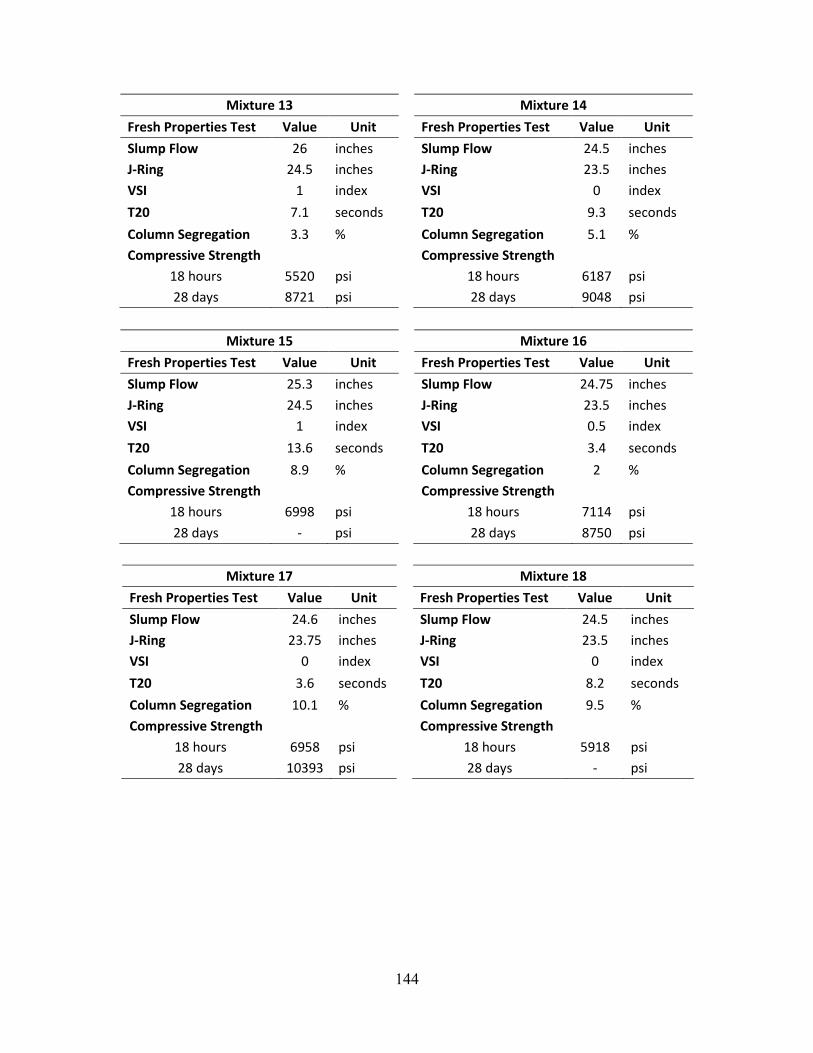
144
Mixture 13
Fresh Properties Test Value Unit
Slump Flow 26 inches
J-Ring 24.5 inches
VSI 1 index
T20 7.1 seconds
Column Segregation 3.3 %
Compressive Strength
18 hours 5520 psi
28 days 8721 psi
Mixture 14
Fresh Properties Test Value Unit
Slump Flow 24.5 inches
J-Ring 23.5 inches
VSI 0 index
T20 9.3 seconds
Column Segregation 5.1 %
Compressive Strength
18 hours 6187 psi
28 days 9048 psi
Mixture 15
Fresh Properties Test Value Unit
Slump Flow 25.3 inches
J-Ring 24.5 inches
VSI 1 index
T20 13.6 seconds
Column Segregation 8.9 %
Compressive Strength
18 hours 6998 psi
28 days - psi
Mixture 16
Fresh Properties Test Value Unit
Slump Flow 24.75 inches
J-Ring 23.5 inches
VSI 0.5 index
T20 3.4 seconds
Column Segregation 2 %
Compressive Strength
18 hours 7114 psi
28 days 8750 psi
Mixture 17
Fresh Properties Test Value Unit
Slump Flow 24.6 inches
J-Ring 23.75 inches
VSI 0 index
T20 3.6 seconds
Column Segregation 10.1 %
Compressive Strength
18 hours 6958 psi
28 days 10393 psi
Mixture 18
Fresh Properties Test Value Unit
Slump Flow 24.5 inches
J-Ring 23.5 inches
VSI 0 index
T20 8.2 seconds
Column Segregation 9.5 %
Compressive Strength
18 hours 5918 psi
28 days - psi
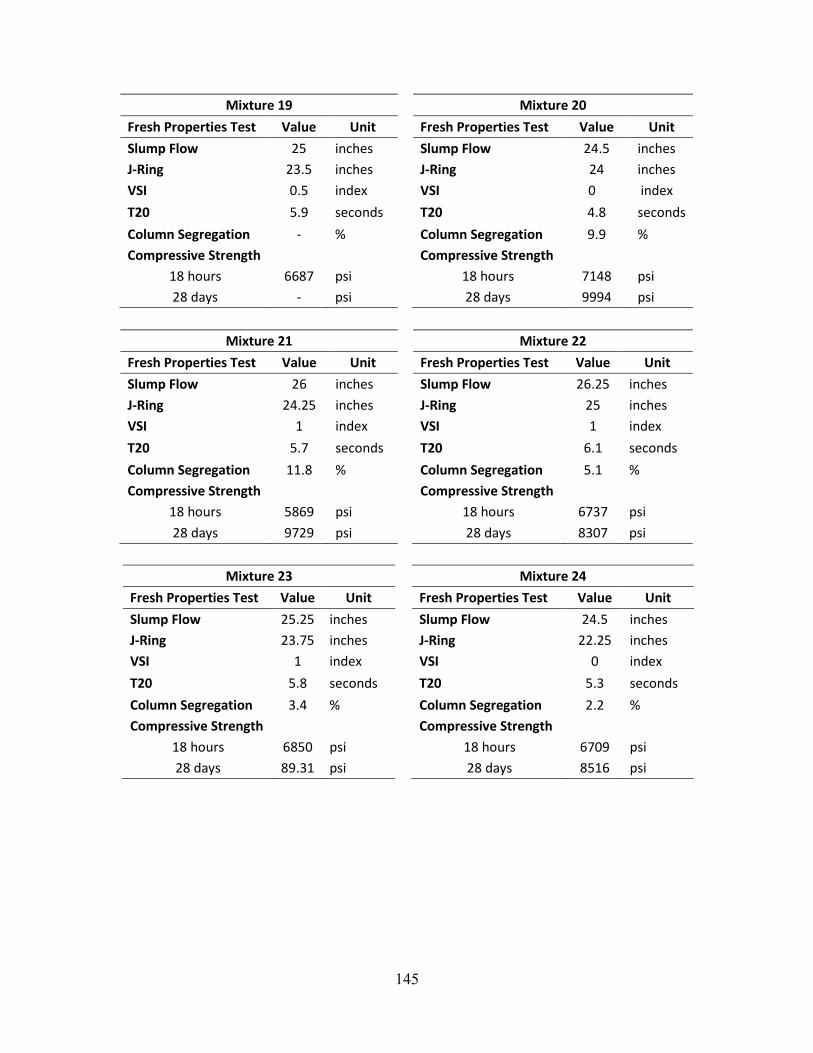
145
Mixture 19
Fresh Properties Test Value Unit
Slump Flow 25 inches
J-Ring 23.5 inches
VSI 0.5 index
T20 5.9 seconds
Column Segregation - %
Compressive Strength
18 hours 6687 psi
28 days - psi
Mixture 20
Fresh Properties Test Value Unit
Slump Flow 24.5 inches
J-Ring 24 inches
VSI 0 index
T20 4.8 seconds
Column Segregation 9.9 %
Compressive Strength
18 hours 7148 psi
28 days 9994 psi
Mixture 21
Fresh Properties Test Value Unit
Slump Flow 26 inches
J-Ring 24.25 inches
VSI 1 index
T20 5.7 seconds
Column Segregation 11.8 %
Compressive Strength
18 hours 5869 psi
28 days 9729 psi
Mixture 22
Fresh Properties Test Value Unit
Slump Flow 26.25 inches
J-Ring 25 inches
VSI 1 index
T20 6.1 seconds
Column Segregation 5.1 %
Compressive Strength
18 hours 6737 psi
28 days 8307 psi
Mixture 23
Fresh Properties Test Value Unit
Slump Flow 25.25 inches
J-Ring 23.75 inches
VSI 1 index
T20 5.8 seconds
Column Segregation 3.4 %
Compressive Strength
18 hours 6850 psi
28 days 89.31 psi
Mixture 24
Fresh Properties Test Value Unit
Slump Flow 24.5 inches
J-Ring 22.25 inches
VSI 0 index
T20 5.3 seconds
Column Segregation 2.2 %
Compressive Strength
18 hours 6709 psi
28 days 8516 psi
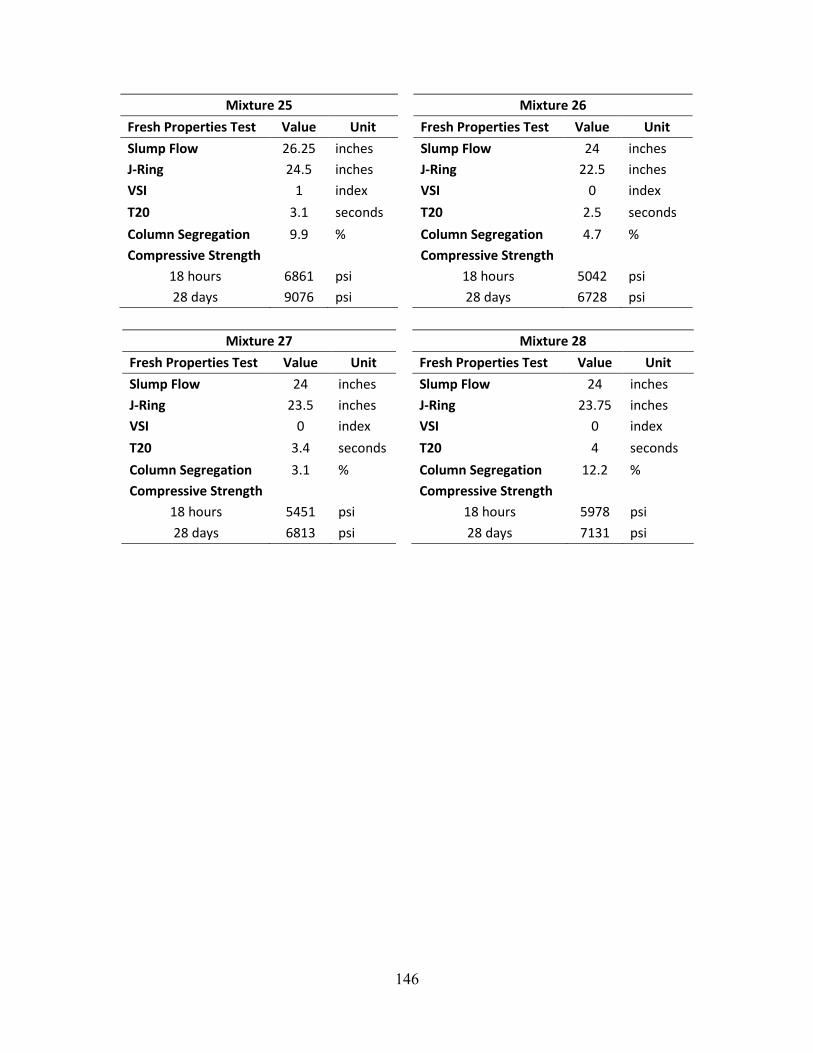
146
Mixture 25
Fresh Properties Test Value Unit
Slump Flow 26.25 inches
J-Ring 24.5 inches
VSI 1 index
T20 3.1 seconds
Column Segregation 9.9 %
Compressive Strength
18 hours 6861 psi
28 days 9076 psi
Mixture 26
Fresh Properties Test Value Unit
Slump Flow 24 inches
J-Ring 22.5 inches
VSI 0 index
T20 2.5 seconds
Column Segregation 4.7 %
Compressive Strength
18 hours 5042 psi
28 days 6728 psi
Mixture 27
Fresh Properties Test Value Unit
Slump Flow 24 inches
J-Ring 23.5 inches
VSI 0 index
T20 3.4 seconds
Column Segregation 3.1 %
Compressive Strength
18 hours 5451 psi
28 days 6813 psi
Mixture 28
Fresh Properties Test Value Unit
Slump Flow 24 inches
J-Ring 23.75 inches
VSI 0 index
T20 4 seconds
Column Segregation 12.2 %
Compressive Strength
18 hours 5978 psi
28 days 7131 psi

147
Appendix D
Creep and Shrinkage Data
Creep and shrinkage readings taken every week for 280 days are tabulated as follows. Note
that there are readings for each of the three cylinders/prisms per mixtures, along with an
average of all three.
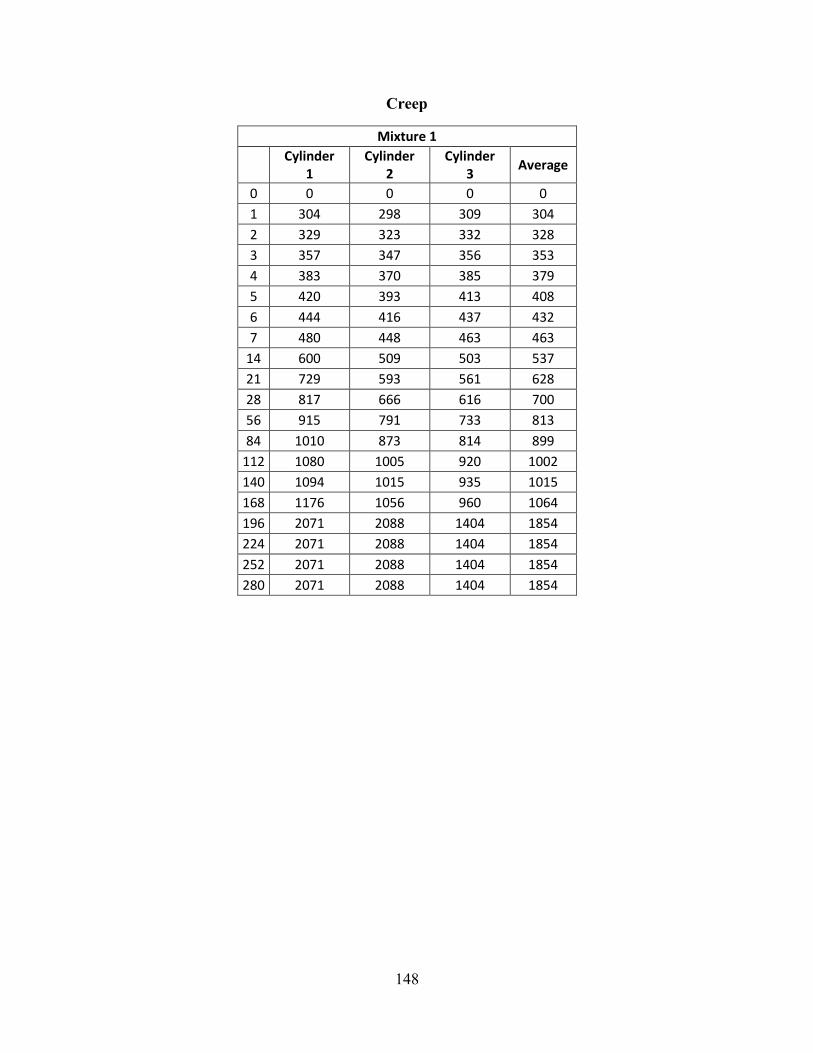
148
Creep
Mixture 1
Cylinder
1 Cylinder
2 Cylinder
3 Average
0 0 0 0 0
1 304 298 309 304
2 329 323 332 328
3 357 347 356 353
4 383 370 385 379
5 420 393 413 408
6 444 416 437 432
7 480 448 463 463
14 600 509 503 537
21 729 593 561 628
28 817 666 616 700
56 915 791 733 813
84 1010 873 814 899
112 1080 1005 920 1002
140 1094 1015 935 1015
168 1176 1056 960 1064
196 2071 2088 1404 1854
224 2071 2088 1404 1854
252 2071 2088 1404 1854
280 2071 2088 1404 1854
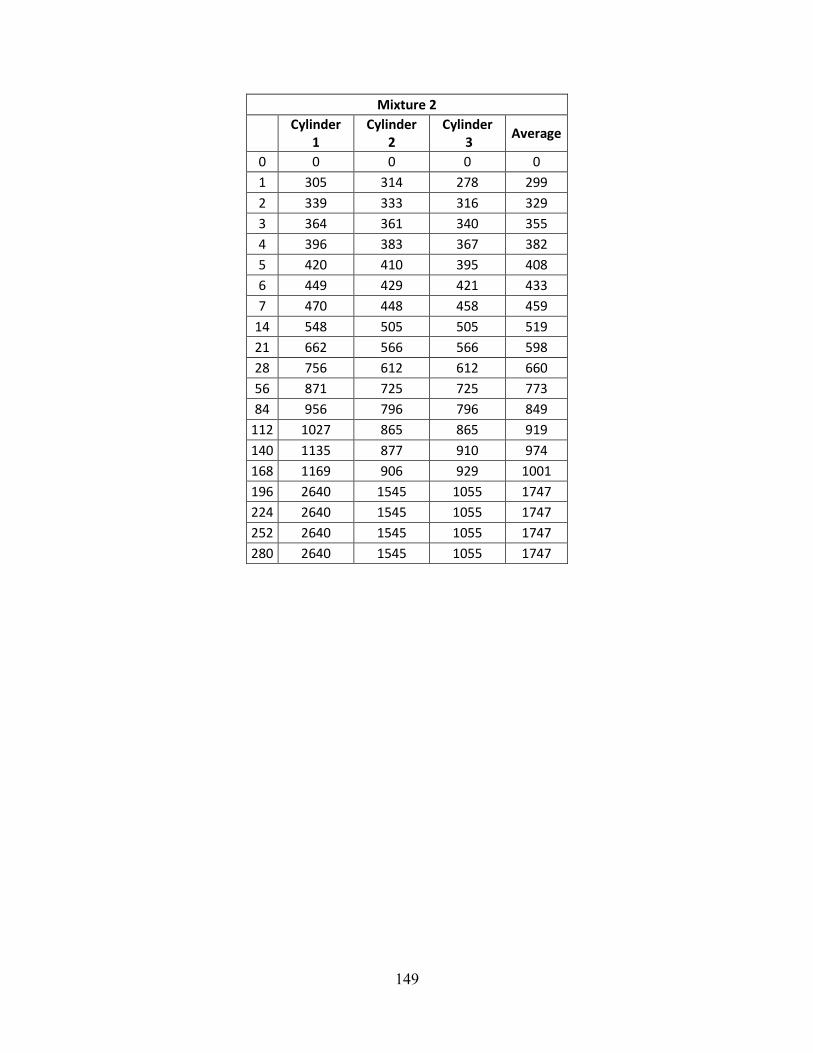
149
Mixture 2
Cylinder
1 Cylinder
2 Cylinder
3 Average
0 0 0 0 0
1 305 314 278 299
2 339 333 316 329
3 364 361 340 355
4 396 383 367 382
5 420 410 395 408
6 449 429 421 433
7 470 448 458 459
14 548 505 505 519
21 662 566 566 598
28 756 612 612 660
56 871 725 725 773
84 956 796 796 849
112 1027 865 865 919
140 1135 877 910 974
168 1169 906 929 1001
196 2640 1545 1055 1747
224 2640 1545 1055 1747
252 2640 1545 1055 1747
280 2640 1545 1055 1747
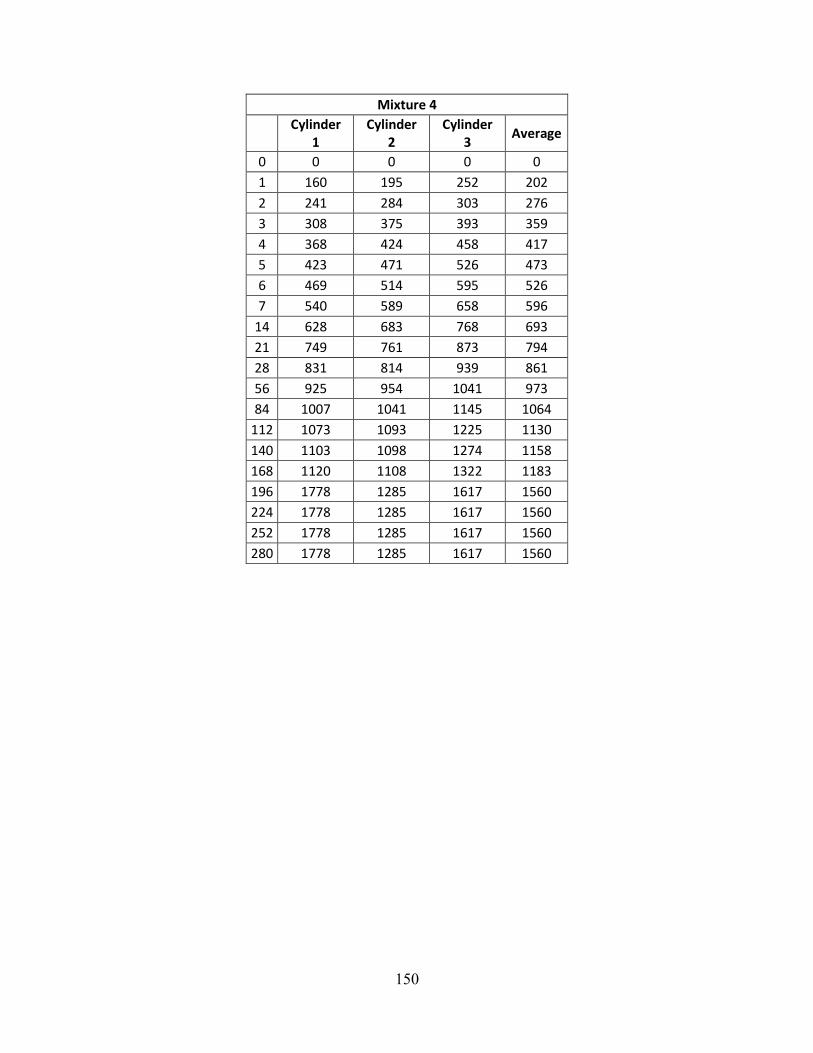
150
Mixture 4
Cylinder
1 Cylinder
2 Cylinder
3 Average
0 0 0 0 0
1 160 195 252 202
2 241 284 303 276
3 308 375 393 359
4 368 424 458 417
5 423 471 526 473
6 469 514 595 526
7 540 589 658 596
14 628 683 768 693
21 749 761 873 794
28 831 814 939 861
56 925 954 1041 973
84 1007 1041 1145 1064
112 1073 1093 1225 1130
140 1103 1098 1274 1158
168 1120 1108 1322 1183
196 1778 1285 1617 1560
224 1778 1285 1617 1560
252 1778 1285 1617 1560
280 1778 1285 1617 1560
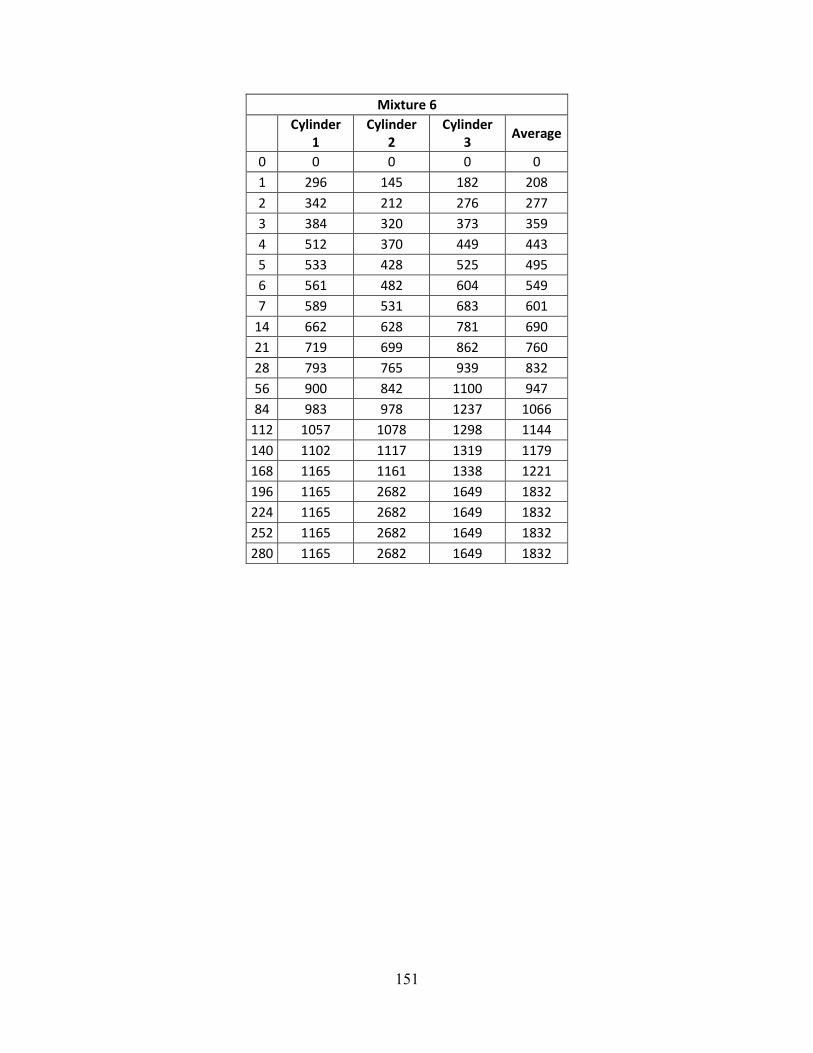
151
Mixture 6
Cylinder
1 Cylinder
2 Cylinder
3 Average
0 0 0 0 0
1 296 145 182 208
2 342 212 276 277
3 384 320 373 359
4 512 370 449 443
5 533 428 525 495
6 561 482 604 549
7 589 531 683 601
14 662 628 781 690
21 719 699 862 760
28 793 765 939 832
56 900 842 1100 947
84 983 978 1237 1066
112 1057 1078 1298 1144
140 1102 1117 1319 1179
168 1165 1161 1338 1221
196 1165 2682 1649 1832
224 1165 2682 1649 1832
252 1165 2682 1649 1832
280 1165 2682 1649 1832
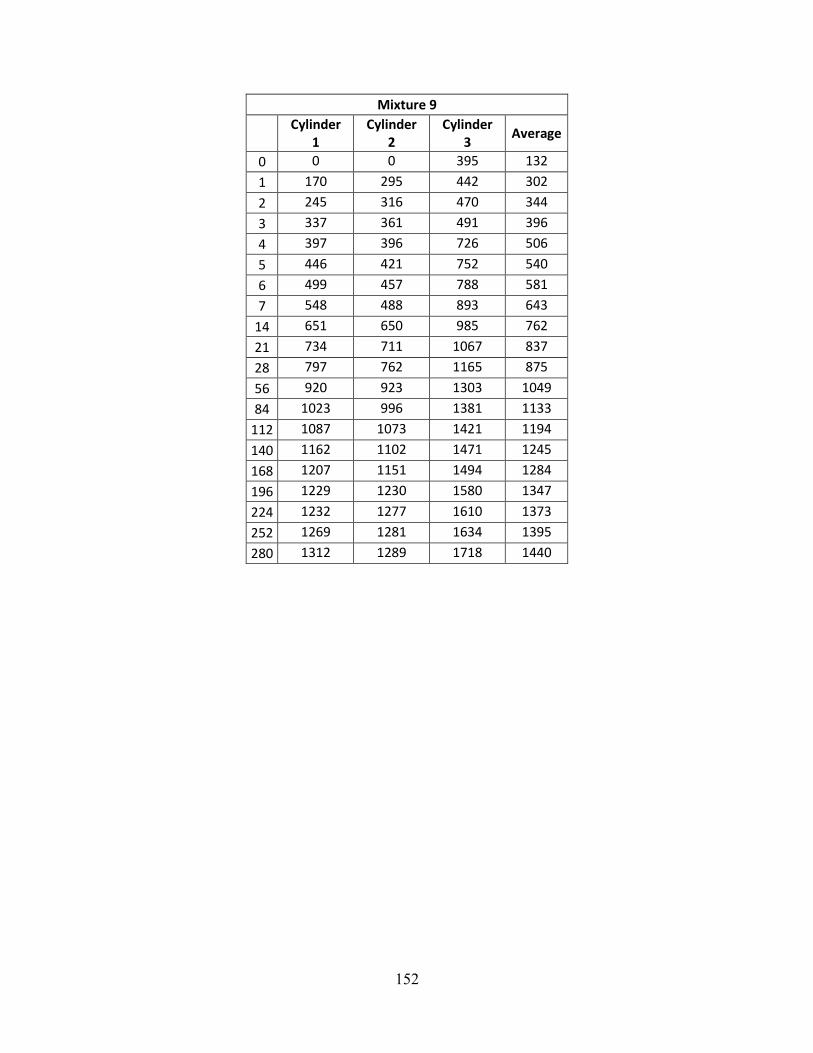
152
Mixture 9
Cylinder
1 Cylinder
2 Cylinder
3 Average
0 0 0 395 132
1 170 295 442 302
2 245 316 470 344
3 337 361 491 396
4 397 396 726 506
5 446 421 752 540
6 499 457 788 581
7 548 488 893 643
14 651 650 985 762
21 734 711 1067 837
28 797 762 1165 875
56 920 923 1303 1049
84 1023 996 1381 1133
112 1087 1073 1421 1194
140 1162 1102 1471 1245
168 1207 1151 1494 1284
196 1229 1230 1580 1347
224 1232 1277 1610 1373
252 1269 1281 1634 1395
280 1312 1289 1718 1440
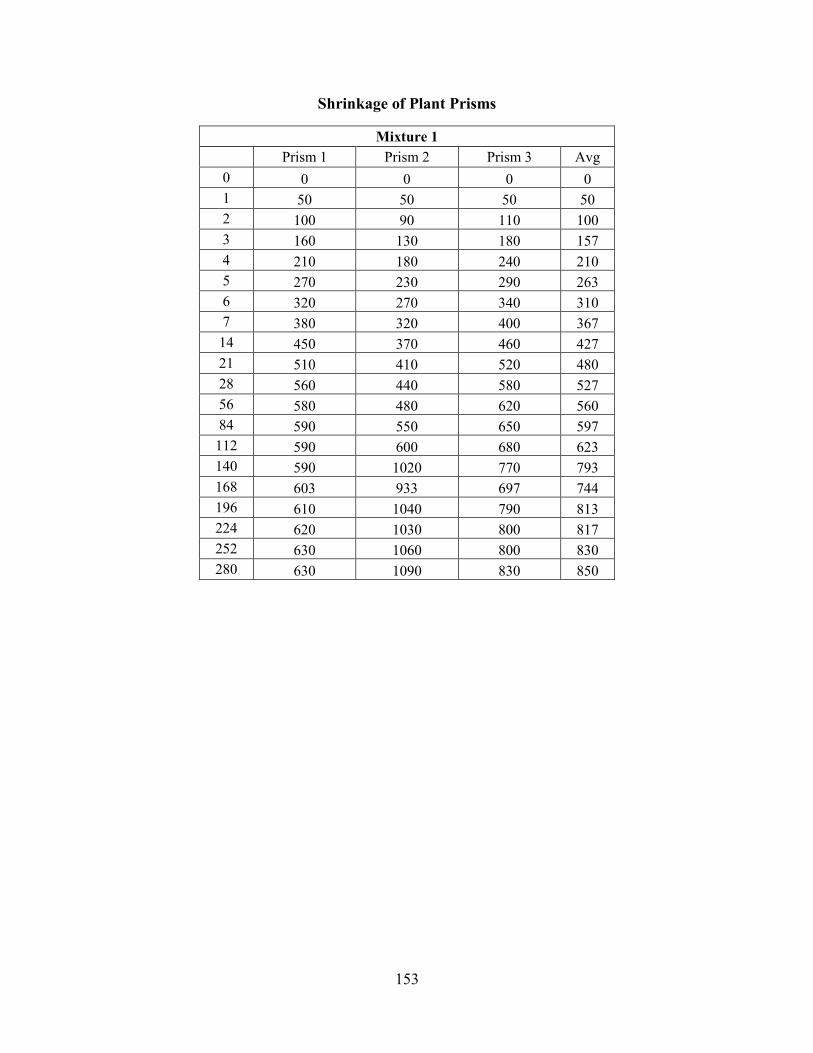
153
Shrinkage of Plant Prisms
Mixture 1 Prism 1 Prism 2 Prism 3 Avg 0 0 0 0 0 1 50 50 50 50 2 100 90 110 100 3 160 130 180 157 4 210 180 240 210 5 270 230 290 263 6 320 270 340 310 7 380 320 400 367 14 450 370 460 427 21 510 410 520 480 28 560 440 580 527 56 580 480 620 560 84 590 550 650 597
112 590 600 680 623 140 590 1020 770 793 168 603 933 697 744 196 610 1040 790 813 224 620 1030 800 817 252 630 1060 800 830 280 630 1090 830 850
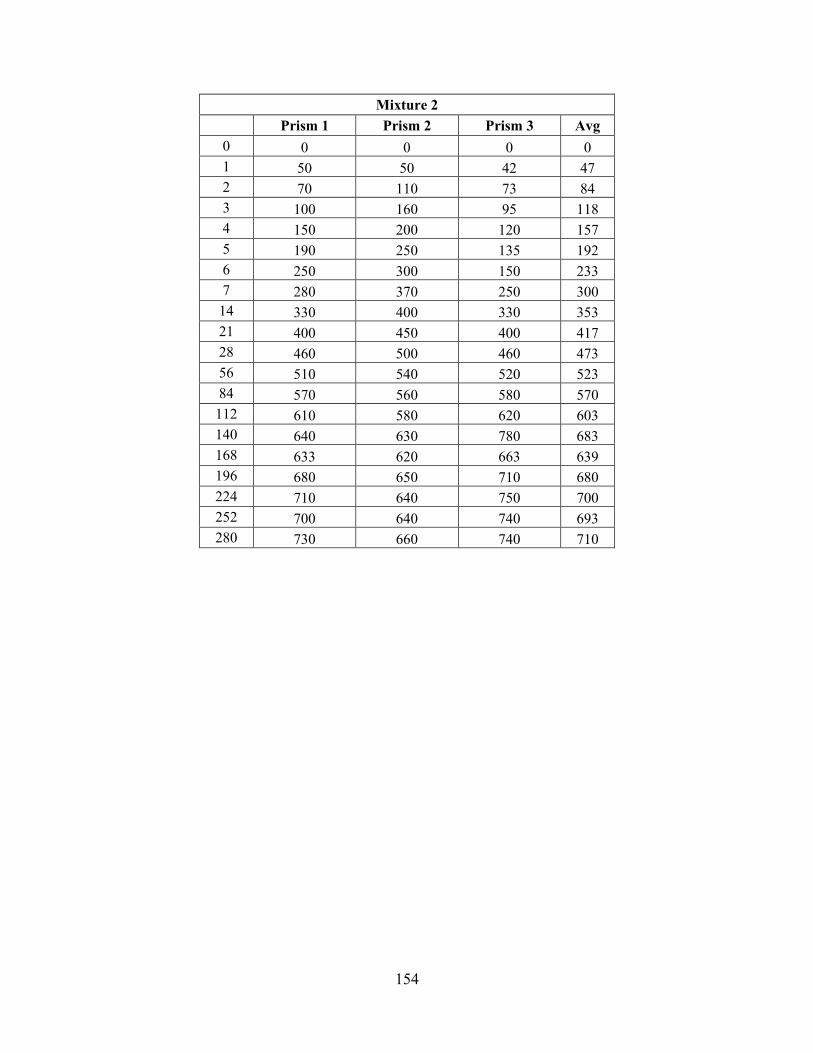
154
Mixture 2 Prism 1 Prism 2 Prism 3 Avg 0 0 0 0 0 1 50 50 42 47 2 70 110 73 84 3 100 160 95 118 4 150 200 120 157 5 190 250 135 192 6 250 300 150 233 7 280 370 250 300 14 330 400 330 353 21 400 450 400 417 28 460 500 460 473 56 510 540 520 523 84 570 560 580 570
112 610 580 620 603 140 640 630 780 683 168 633 620 663 639 196 680 650 710 680 224 710 640 750 700 252 700 640 740 693 280 730 660 740 710
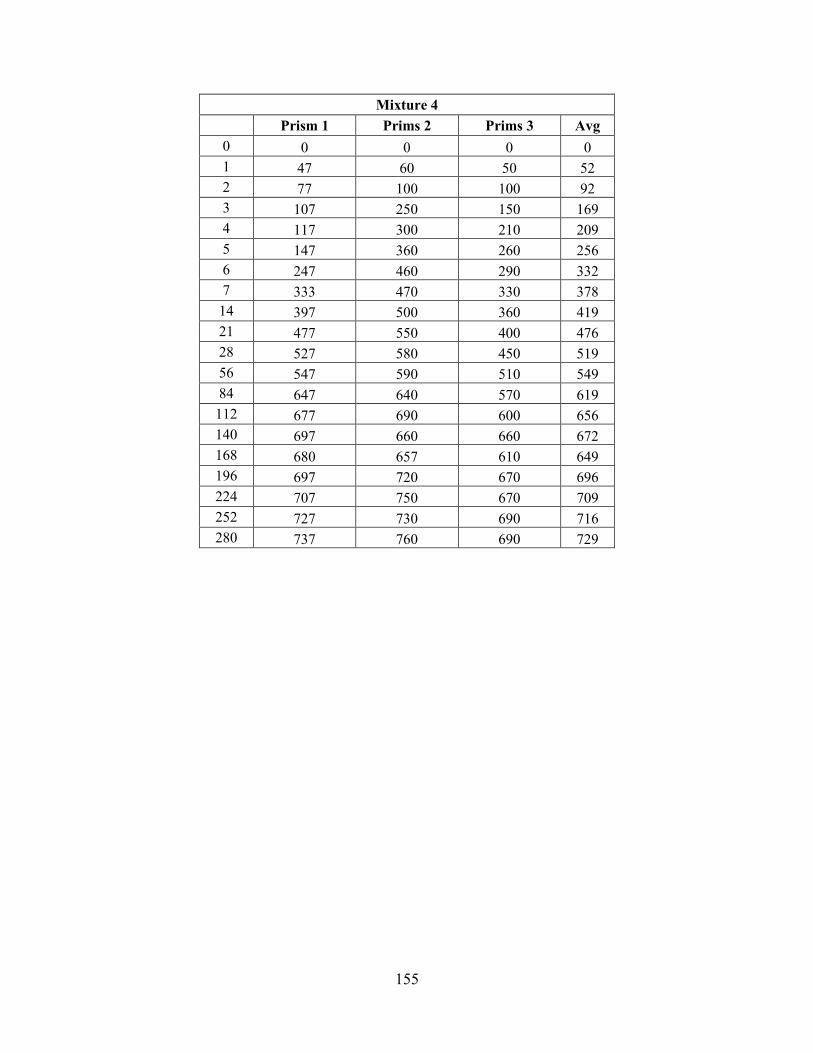
155
Mixture 4 Prism 1 Prims 2 Prims 3 Avg 0 0 0 0 0 1 47 60 50 52 2 77 100 100 92 3 107 250 150 169 4 117 300 210 209 5 147 360 260 256 6 247 460 290 332 7 333 470 330 378 14 397 500 360 419 21 477 550 400 476 28 527 580 450 519 56 547 590 510 549 84 647 640 570 619
112 677 690 600 656 140 697 660 660 672 168 680 657 610 649 196 697 720 670 696 224 707 750 670 709 252 727 730 690 716 280 737 760 690 729
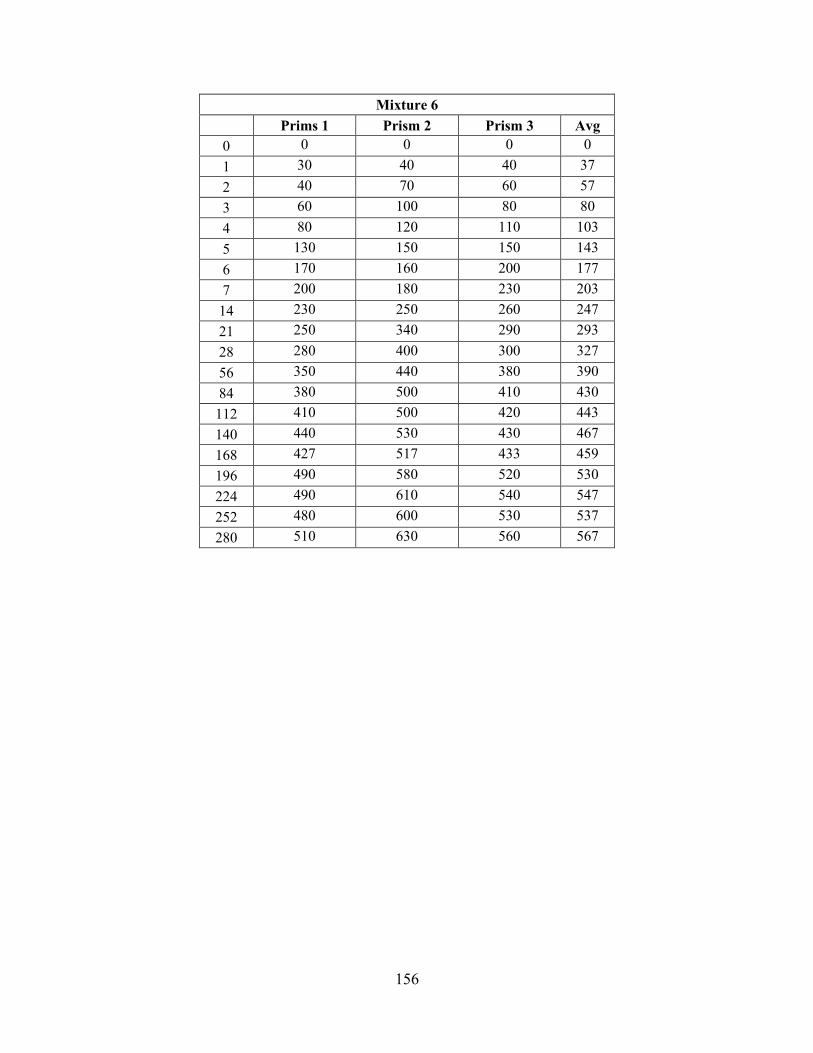
156
Mixture 6 Prims 1 Prism 2 Prism 3 Avg
0 0 0 0 0 1 30 40 40 37 2 40 70 60 57 3 60 100 80 80 4 80 120 110 103 5 130 150 150 143 6 170 160 200 177 7 200 180 230 203 14 230 250 260 247 21 250 340 290 293 28 280 400 300 327 56 350 440 380 390 84 380 500 410 430
112 410 500 420 443 140 440 530 430 467 168 427 517 433 459 196 490 580 520 530 224 490 610 540 547 252 480 600 530 537 280 510 630 560 567
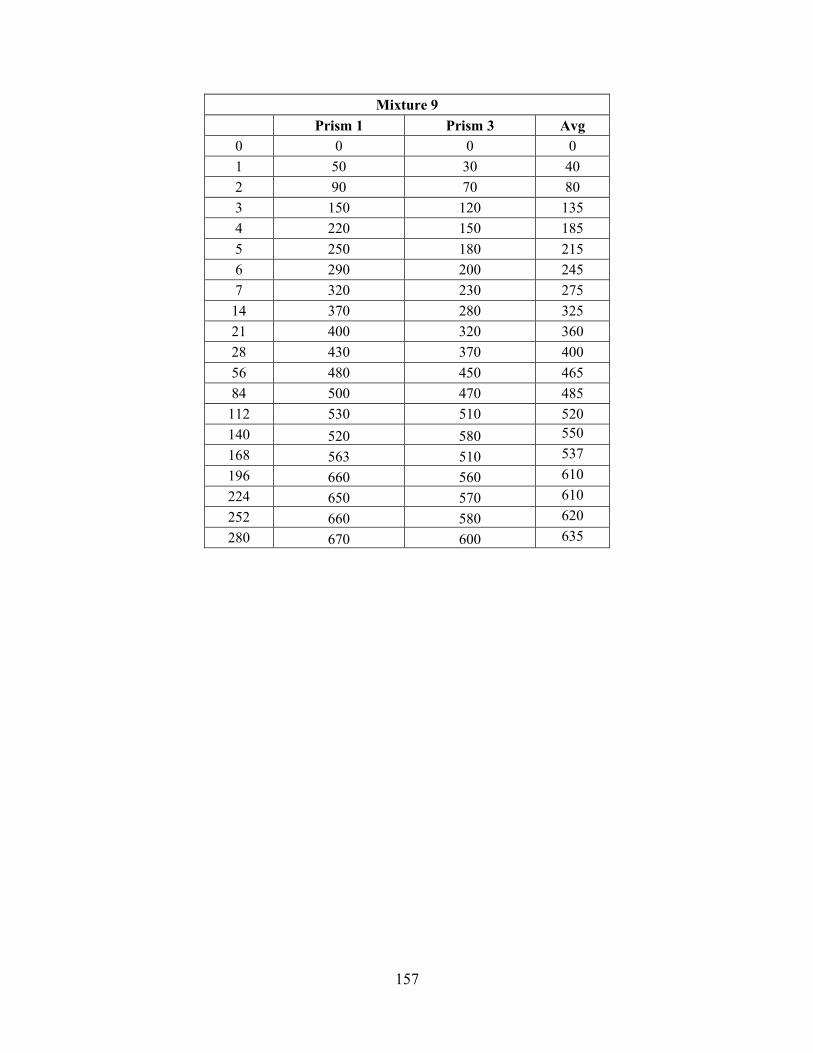
157
Mixture 9 Prism 1 Prism 3 Avg
0 0 0 0 1 50 30 40 2 90 70 80 3 150 120 135 4 220 150 185 5 250 180 215 6 290 200 245 7 320 230 275 14 370 280 325 21 400 320 360 28 430 370 400 56 480 450 465 84 500 470 485 112 530 510 520 140 520 580 550 168 563 510 537 196 660 560 610 224 650 570 610 252 660 580 620 280 670 600 635
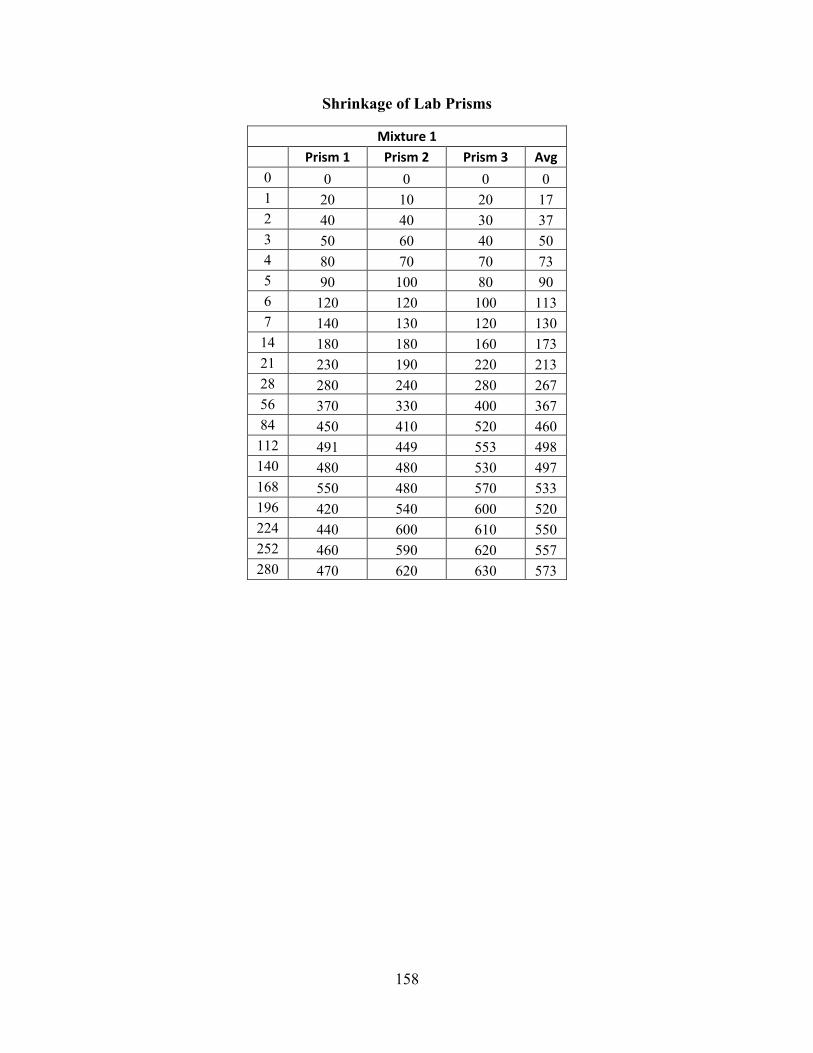
158
Shrinkage of Lab Prisms
Mixture 1
Prism 1 Prism 2 Prism 3 Avg
0 0 0 0 0 1 20 10 20 17 2 40 40 30 37 3 50 60 40 50 4 80 70 70 73 5 90 100 80 90 6 120 120 100 113 7 140 130 120 130 14 180 180 160 173 21 230 190 220 213 28 280 240 280 267 56 370 330 400 367 84 450 410 520 460
112 491 449 553 498 140 480 480 530 497 168 550 480 570 533 196 420 540 600 520 224 440 600 610 550 252 460 590 620 557 280 470 620 630 573
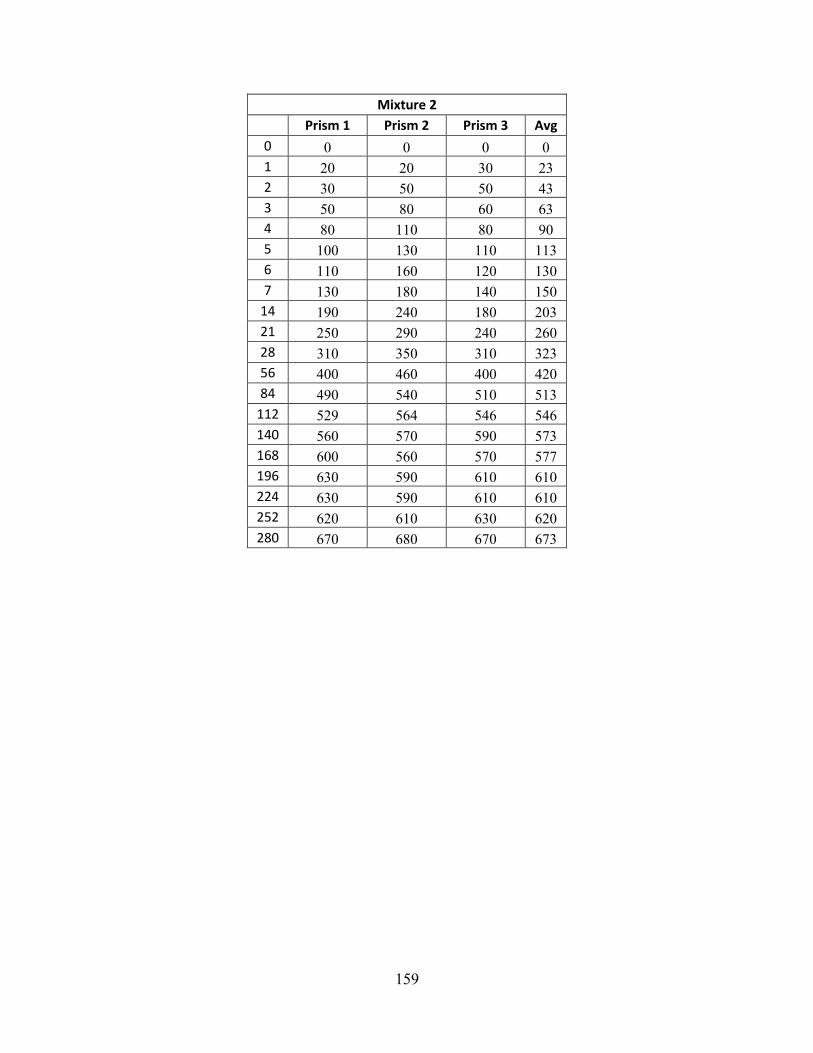
159
Mixture 2
Prism 1 Prism 2 Prism 3 Avg
0 0 0 0 0 1 20 20 30 23 2 30 50 50 43 3 50 80 60 63 4 80 110 80 90 5 100 130 110 113 6 110 160 120 130 7 130 180 140 150
14 190 240 180 203 21 250 290 240 260 28 310 350 310 323 56 400 460 400 420 84 490 540 510 513
112 529 564 546 546 140 560 570 590 573 168 600 560 570 577 196 630 590 610 610 224 630 590 610 610 252 620 610 630 620 280 670 680 670 673

160
Mixture 4
Prism 1 Prims 2 Prims 3 Avg
0 0 0 0 0 1 20 10 20 17 2 60 30 30 40 3 90 50 60 67 4 100 60 80 80 5 120 80 110 103 6 140 110 130 127 7 170 140 160 157
14 220 190 210 207 21 260 230 260 250 28 310 280 340 310 56 483 350 410 414 84 560 470 530 520
112 584 499 552 545 140 600 540 570 570 168 600 540 610 583 196 660 590 590 613 224 660 590 590 613 252 640 610 620 623 280 660 600 640 633
161
Mixture 6
Prims 1 Prism 2 Prism 3 Avg
0 0 0 0 0 1 20 40 40 33 2 50 70 60 60 3 70 100 80 83 4 90 120 110 107 5 100 150 150 133 6 120 160 200 160 7 140 180 230 183
14 210 250 260 240 21 280 340 290 303 28 340 400 300 347 56 480 440 380 433 84 580 500 410 497
112 616 532 427 525 140 540 600 530 557 168 540 660 510 570 196 510 680 550 580 224 530 780 550 620 252 550 880 610 680 280 560 870 600 677
162
Mixture 9
Prism 1 Prism 2 Prism 3 Avg
0 0 0 0 0 1 20 20 40 27 2 40 50 60 50 3 50 70 70 63 4 70 100 90 87 5 100 120 110 110 6 120 140 140 133 7 140 160 240 180
14 190 250 320 253 21 230 300 370 300 28 300 340 410 350 56 370 410 470 417 84 430 460 530 473
112 465 495 556 505 140 550 560 630 580 168 560 620 670 617 196 610 660 760 677 224 610 730 760 700 252 620 700 740 687 280 640 650 710 667

163
Appendix E
Lab Strain Data for Transfer Length and Layout of Gage Instrumentation
Strain readings for eight gages in both the tested girders (i.e., SCC and CC girders). Readings
were taken at initial placement, after tensioning, after pouring, 16 hours after pouring, and
after release, for a total of 28 days. Illustration of strain gage location through cross-section
and top-views of both SCC and CC girders is included herein.
164
Strain Readings
Gage No Gage Channel Initial
After Pouring 16 hr Release
Day Tension 7 14 21 28
SCC-C-1 2.1 0 6126 6117 4500 1500 691 672 624 585 SCC-C-2 1.1 0 3517 3258 2312 1560 750 703 510 508 SCC-C-3 2.8 0 5990 5979 3495 2070 1625 1710 1251 1120 SCC-C-4 2.1 0 2324 2254 2175 1546 1093 1062 1065 1028 SCC-S-1 2.6 0 6100 0 0 0 0 0 0 0 SCC-S-2 2.5 0 5890 5880 3280 825 507 443 231 45 SCC-S-3 1.2 0 5994 5933 1720 1180 -442 -513 -844 987 SCC-S-4 2.3 0 7881 7886 4150 3306 1873 1623 1269 1155 CC-C-1 1.1 0 6292 6234 5273 863 790 660 586 408 CC-C-2 1.9 0 6014 4372 2691 1520 490 485 282 167 CC-C-3 1.8 0 5875 5762 2234 1566 775 730 748 728 CC-C-4 1.7 0 6230 6181 2046 1960 908 802 663 557 CC-S-1 1.6 0 5570 5470 4334 420 -380 -364 -320 -315CC-S-2 1.5 0 6166 0 0 0 0 0 0 0 CC-S-3 1.4 0 2934 2814 2408 870 1114 1113 1065 1065 CC-S-4 1.3 0 5275 5166 2723 2278 1592 1505 1410 1290
Note: gage locations (e.g., SCC-C-1) can be seen in Figure E-1
165
(a)
(b) Top View
(c) Top View
Figure E-1 Layout of gage instrumentation: (a) girder cross section; (b) strain-gage location for SCC girder; and (c) strain-gage location for CC girder
Related Documents