SELF-CONSOLIDATING CONCRETE FOR PRECAST, PRESTRESSED CONCRETE BRIDGE ELEMENTS By Lama Baali February 2009 Department of Civil Engineering and Applied Mechanics McGill University Montreal, Quebec Canada A thesis submitted to McGill University in partial fulfilment of the requirements of the degree of a Masters in Civil Engineering © Lama Baali, 2009

Welcome message from author
This document is posted to help you gain knowledge. Please leave a comment to let me know what you think about it! Share it to your friends and learn new things together.
Transcript
I
SELF-CONSOLIDATING CONCRETE FOR PRECAST,
PRESTRESSED CONCRETE BRIDGE ELEMENTS
By Lama Baali
February 2009
Department of Civil Engineering and Applied Mechanics McGill University Montreal, Quebec
Canada
A thesis submitted to McGill University in partial fulfilment of the requirements of the degree of a Masters in Civil Engineering
© Lama Baali, 2009
I
Abstract
The following thesis presents the results of four full scale beams tests as part of a research program
conducted at McGill University. The purpose is to study the applicability of existing design provisions, in
the American Association of State Highway and Transportation Officials (AASHTO) specifications, for
the use of self-consolidating concrete (SCC) in precast pretensioned bridge girders.
The test specimens had an overall length of 31 ft (9.4m) with a center-to-center span of 29 ft (8.8m). They
were cast in four batches with different concrete attributes: two non air-entrained SCC mixtures and two
high-performance concretes. For each type, compressive strengths of 8,000 and 10,000 psi (55.2 and 69
MPa) with release strengths of 5,000 and 6,250 psi (34.5 and 43 MPa) at 18 hours, respectively, were
tested. Each girder was prestressed with eight Grade 270 seven-wire low-relaxation prestressing strands
of 0.6 in (15.2 mm) diameter. Six of the strands were straight and two were harped twice, 4’-11” (1.5 m)
from mid-span. The specimens were supported on neoprene bearing pads at their ends, and were tested
with two equal point loads located 4’-11” (1.5 m) from mid-span.
This research project demonstrated that the shear failure of the girders exceeded the predicted nominal
shear resistance given by the 2004 AASHTO Specifications. The experimental flexural resistance also
exceeded the predicted nominal resistance.
II
Résumé
Le présent mémoire expose les résultats de quatre poutres pleine grandeur faisant partie intégrante d’une
étude effectuée à l’Université McGill. Le but de cette étude est de valider l’applicabilité des provisions de
conception existantes, de l’Association Américaine des Autoroutes d’État et des Officiers de Transport
(norme AASHTO), pour l’usage de béton autoplaçant (BAP) dans les poutres précontraintes et
préfabriquées de ponts.
Les spécimens testés ont une longueur maximale de 31 pieds (9.4 m) avec une distance du centre au
centre de 29 pieds (8.8 m). Les poutres ont été coulées une à la fois avec différentes sortes de béton: deux
d’entres-elles à partir de béton autoplaçant sans air entrappé, et deux avec du béton haute-performance.
Pour chaque sorte, une résistance compressive de 8,000 et 10,000 psi (55.2 et 69 MPa) avec une
résistance, avant de précontraindre le béton, de 5,000 et 6,250 psi (34.5 et 43 MPa) à 18 heures,
respectivement, ont été testées. Chaque poutre était précontrainte avec huit tendons, grade 270, de 0.6 in
(15.2 mm) de diamètre. Six de ces tendons étaient horizontaux alors que deux étaient inclinés 59 pouces
(1.5 m) de chaque bord de l’axe central. Les spécimens étaient supportés aux deux extrémités sur des pads
de néoprène et étaient testés avec deux charges concentriques situées 59 pouces (1.5 m) de l’axe central.
Cette recherche à démontrer que la capacité en cisaillement des poutres testées excédait les valeurs
nominales prévues par les normes AASHTO 2004. Les valeurs expérimentales de la résistance à la
flexion des poutres aussi excèdent les valeurs nominales prédises.

III
Acknowledgments
The author would like to express deep gratitude to Professor Denis Mitchell for the supervision, guidance
and support throughout this thesis. The author would also like to extend his gratitude to Dr. William Cook
for his significant help during the tests, his patience and his valuable explanations during the writing of
this thesis.
The great help of the technical staff of the Jamieson Structure Laboratory was also very much
appreciated. The assistance of Mareck Przykorski, Ron Sheppard, John Bartczak and Damon Kiperchuck
is greatly appreciated for the successful completion of the experiments. The help of Patrick Moubarak,
Dean MacDougall, Lesley Wake, and Yahya Baali in the laboratory work is deeply appreciated.
Finally, the author would like to thank her parents, Yasser and Hana, her sisters and brothers, Dania,
Roula, Ammar and Yahya, and her brother-in-law, Assad, for always being there for her and always
encouraging her to reach her goals.
Lama Baali, 2009
IV
Table of Contents
Abstract .......................................................................................................................................................... I Résumé ......................................................................................................................................................... II Acknowledgments ....................................................................................................................................... III Table of Contents ........................................................................................................................................ IV
List of Figures ........................................................................................................................................... VII List of Tables .............................................................................................................................................. IX
Chapter 1: Introduction and Literature review .............................................................................................. 1 1.1 Chapter overview ................................................................................................................................ 1
1.2 Shear design ........................................................................................................................................ 1
1.2.1 History behind the shear design ................................................................................................... 2
1.2.2 ACI 318 Building Code (318-08) .............................................................................................. 10
1.2.2.1 Shear strength provided by concrete for nonprestressed members ..................................... 12
1.2.2.2 Shear strength provided by concrete for prestressed members ........................................... 14
1.2.2.3 Minimum shear reinforcement ............................................................................................ 16
1.2.2.4 High strength concrete ........................................................................................................ 17
1.2.3 2004 AASHTO LRFD Bridge design specifications ................................................................. 17
1.2.3.1 Minimum shear reinforcement ............................................................................................ 21
1.2.4 Comparison between ACI method and the AASHTO method .................................................. 22
1.3 Prestressing operations ...................................................................................................................... 24
1.3.1 Historical development of prestressing ...................................................................................... 24
1.3.2 Principle of prestressed concrete ................................................................................................ 25
1.3.3 Different types of prestressing ................................................................................................... 26
1.3.4 Benefits of prestressing .............................................................................................................. 27
1.3.5 Materials of prestressing ............................................................................................................ 27
1.3.5.1 Basic concrete guidelines .................................................................................................... 28
1.3.5.2 Basic steel guidelines .......................................................................................................... 29
1.3.5.3 ACI 318-08 maximum permissible stresses in concrete and reinforcement ....................... 32
1.3.5.4 2004 AASHTO maximum permissible stresses in concrete and reinforcement ................. 33
1.4 Precasting .......................................................................................................................................... 35
V
1.4.1 Benefits of precasting................................................................................................................. 35
1.4.2 Production methods ................................................................................................................... 35
1.4.3 Particularities of precast concrete .............................................................................................. 37
1.4.4 Alireza Mokhtarzadeh and Catherine French’s experiment (2000) ........................................... 38
1.5 Self-consolidating concrete ............................................................................................................... 40
1.5.1 SCC characteristics .................................................................................................................... 40
1.5.2 Testing fresh-state properties of SCC ........................................................................................ 40
1.5.2.1 The Slump flow and T-20 tests ........................................................................................... 41
1.5.2.2 The J-ring test ...................................................................................................................... 42
1.5.2.3 The L-box and filling ability tests ....................................................................................... 42
1.5.2.4 The column segregation test................................................................................................ 43
1.5.2.5 The surface settlement test .................................................................................................. 44
1.5.2.6 The rheology test ................................................................................................................. 44
1.5.3 Comparison between SCC and normal concrete ........................................................................ 46
1.6 Objectives of this Research Program ................................................................................................ 47
Chapter 2: Experimental Program ............................................................................................................... 48 2.1 Design of the beam specimens .......................................................................................................... 48
2.2 Instrumentation and Test Setup ......................................................................................................... 54
2.2.1 Pretensioning operation .............................................................................................................. 54
2.2.2 Casting and steam curing ........................................................................................................... 55
2.2.3 Pretensioning release.................................................................................................................. 61
2.2.3.1 Transfer length measurements ............................................................................................ 61
2.2.3.2 Strand set measurements ..................................................................................................... 64
2.3 Material properties ............................................................................................................................ 65
2.3.1 Concrete material properties ...................................................................................................... 65
2.3.1.1 Mix proportioning of HPC and SCC used for girder casting .............................................. 65
2.3.1.2 Concrete’s mechanical properties field testing program ..................................................... 66
2.3.1.3 Fresh properties of HPC and SCC used for girder casting .................................................. 70
2.3.1.4 Semi-adiabatic temperature measurements ......................................................................... 72
VI
2.3.1.5 Mechanical properties of deck slab concrete ...................................................................... 73
2.3.2 Reinforcing steel and prestressing steel properties .................................................................... 73
2.3.2.1 Reinforcing steel ................................................................................................................. 73
2.3.2.2 Prestressing steel ................................................................................................................. 74
2.4 Test procedure ................................................................................................................................... 75
Chapter 3: Experimental Results................................................................................................................. 79 3.1 Flexural Behaviour ............................................................................................................................ 79
3.1.1 Camber measurements ............................................................................................................... 79
3.1.2 Overall response in flexure ........................................................................................................ 80
3.2 Shear Behaviour ................................................................................................................................ 83
Chapter 4: Analysis and comparison .......................................................................................................... 92 4.1 Flexural Response ............................................................................................................................. 92
4.1.1 Prediction using AASHTO LRFD Bridge design specifications ............................................... 92
4.1.2 Comparison between the flexural behaviour of SCC and HPC concrete ................................... 94
4.2 Shear Response ................................................................................................................................. 94
4.2.1 Prediction using AASHTO LRFD Bridge design specifications ............................................... 94
4.2.2 Comparison between the shear behaviour of SCC and HPC concrete ....................................... 96
Chapter 5: Conclusions ............................................................................................................................... 98 References ................................................................................................................................................. 100
VII
List of Figures
Figure 1: Stress distribution in a reinforced concrete beam containing flexural cracks ................. 3 Figure 2: Design of transverse reinforcement for shear: compression field theory ........................ 6 Figure 3: Average strains in web elements ..................................................................................... 7 Figure 4: Design of transverse reinforcement for shear: modified compression field theory ........ 8 Figure 5: Ideal stress-strain diagram for prestressing steel ........................................................... 30 Figure 6: Prefabrication procedure ............................................................................................... 36 Figure 7: Flame cut unstressed strands at bulkhead ...................................................................... 37 Figure 8: Typical atmospheric steam curing cycle ....................................................................... 38 Figure 9: Slump flow test .............................................................................................................. 41 Figure 10: J-ring test ..................................................................................................................... 42 Figure 11: L-box test ..................................................................................................................... 43 Figure 12: Column segregation test .............................................................................................. 44 Figure 13: Rheology test ............................................................................................................... 46 Figure 14: Section properties of AASHTO type II girders .......................................................... 49 Figure 15 - Details of precast pretensioned AASHTO II girders ................................................. 49 Figure 16: Details of the pretensionning ....................................................................................... 50 Figure 17: Details of non-prestressed reinforcement .................................................................... 52 Figure 18: Details of reinforcing bars in end region ..................................................................... 53 Figure 19: Details of the cross section .......................................................................................... 53 Figure 20: Details of stirrups and interface shear reinforcement .................................................. 54 Figure 21: Jacking of 0.6 in (15.2 mm) diameter strands ............................................................. 55 Figure 22: Reinforcing cage in formwork prior to casting ........................................................... 56 Figure 23: HPC girder casting operation ...................................................................................... 57 Figure 24: SCC girder casting operation ...................................................................................... 57 Figure 25: Steam curing chamber used for AASHTO Type II girders ......................................... 58 Figure 26: Temperature history of chamber and concrete during steam curing – HPC 8,000 psi
(55.2 MPa) ................................................................................................................ 59 Figure 27: Temperature history of chamber and concrete during steam curing – SCC 8,000 psi
(55.2 MPa) ................................................................................................................ 59 Figure 28: Temperature history of chamber and concrete during steam curing – HPC 10,000 psi
(69 MPa) ................................................................................................................... 60 Figure 29: Temperature history of chamber and concrete during steam curing – SCC 10,000psi
(69 MPa) ................................................................................................................... 60 Figure 30: Flame cutting of strands during prestress release ........................................................ 61 Figure 31: Transfer length measuring device ............................................................................... 61 Figure 32: Locations of transfer length strain gauges ................................................................... 62 Figure 33: Measured strains used to estimate transfer length ....................................................... 63 Figure 34: Measurement of strand set ........................................................................................... 64 Figure 35: Temperature rise of concrete under semi-adiabatic conditions ................................... 72 Figure 36: Typical stress-strain relationships for reinforcing No. 3 and No. 5 bars ..................... 74 Figure 37: Typical stress-strain relationship for 0.6 in (15.2 mm) diameter strand ..................... 75 Figure 38: Test setup and locations of LVDTs ............................................................................. 77 Figure 39: Specimen before testing .............................................................................................. 78
VIII
Figure 40: Variation of camber with time ..................................................................................... 79 Figure 41: Moment versus central deflection – Specimen H8 ...................................................... 80 Figure 42: Moment versus central deflection – Specimen S8 ...................................................... 81 Figure 43: Moment versus central deflection – Specimen H10 .................................................... 81 Figure 44: Moment versus central deflection – Specimen S10 .................................................... 82 Figure 45: Moment versus longitudinal strain response at the level of the straight strands ......... 83 Figure 46: Shear versus deflection at load point – Specimen H8 ................................................. 84 Figure 47: Shear versus deflection at load point – Specimen S8 .................................................. 84 Figure 48: Shear versus deflection at load point – Specimen H10 ............................................... 85 Figure 49: Shear versus deflection at load point – Specimen S10 ................................................ 85 Figure 50: Variation in the average vertical strains obtained from the LVDT rosette readings on
the end that failed in shear ........................................................................................ 87 Figure 51: Specimen H8 just before (a) and right after (b) failure ............................................... 88 Figure 52: Specimen S8 just before (a) and right after (b) failure ................................................ 89 Figure 53: Specimen H10 just before (a) and right after (b) failure ............................................. 90 Figure 54: Specimen S10 just before (a) and right after (b) failure .............................................. 91 Figure 55: Comparison of moment versus central deflection responses for the four specimens . 94 Figure 56: Comparison of shear versus deflection at loading point responses for the four
specimens .................................................................................................................. 97
IX
List of Tables
Table 1: ACI 318-08 Design of shear reinforcement .................................................................... 16 Table 2: ACI 318-08 Particular considerations for High Strength Concrete ................................ 17 Table 3: Value of θ and β for sections with transverse reinforcement ...................................... 19 Table 4: Value of θ and β for sections with less than minimum transverse reinforcement ....... 20 Table 5: AASHTO LRFD Shear design reinforcement ................................................................ 21 Table 6: Standard prestressing strands, wires, and bars ................................................................ 31 Table 7: Requirements for prestressing tendons specified by ASTM .......................................... 31 Table 8: Specimen Identification .................................................................................................. 48 Table 9: Summary of 95% AMS transfer lengths ......................................................................... 63 Table 10: Average values of strand set ......................................................................................... 64 Table 11: Mixture proportioning of SCC and HPC for girders .................................................... 65 Table 12: Concrete Compressive Strength of SCC and HPC mixes used for girders ................. 67 Table 13: Elastic Modulus of SCC and HPC mixes used for girders ........................................... 68 Table 14: Flexural Strength of SCC and HPC mixes used for girders ......................................... 69 Table 15: Fresh properties of SCC and HPC mixes used for girders ........................................... 70 Table 16: Concrete temperature under semi-adiabatic conditions ................................................ 72 Table 17: Mixture proportioning and fresh properties of deck slab concrete for all four girders 73 Table 18: Fresh properties of the deck slab concrete .................................................................... 73 Table 19: Average mechanical properties of reinforcing bars ...................................................... 74 Table 20: Typical mechanical properties of prestressing strand ................................................... 75 Table 21: Flexural responses of the specimens ............................................................................. 82 Table 22: Shear responses of the specimens ................................................................................. 86 Table 23: Comparison of flexural responses of four specimens ................................................... 93 Table 24: Comparison of shear responses of four specimens ....................................................... 95 Table 25: Tensile strengths at 56 days .......................................................................................... 95

1
Chapter 1: Introduction and Literature review
The purpose of this thesis is to study the applicability of existing design provisions, in the
American Association of State Highway and Transportation Officials (AASHTO) specifications,
for the use of self-consolidating concrete (SCC) in precast pretensioned bridge girders. The
research program consisted of the construction and testing of four full-scale precast, prestressed
bridge girders with selected Self-Consolidating Concrete (SCC) mixtures and companion high
performance concrete (HPC) specimens. This thesis provides both SI Units and U.S. Customary
Units due to the fact that the research was carried out for the U.S. National Cooperative Highway
Research Program (NCHRP).
1.1 Chapter overview
This chapter presents a review of the literature regarding the various topics that will be studied in
this thesis.
The literature review will begin with a brief history describing the developments in understanding
of shear behaviour and the relevant codes of practice (see Section 1.2).
Section 1.3 will summarize the benefits of prestressing, and will discuss the codes and standards
used for design.
Section 1.4 describes the precasting operations: history, benefits and tradeoffs.
Section 1.5 introduces the concept of Self-Consolidating Concrete (SCC).
Finally, Section 1.6 presents the different objectives of the research program.
1.2 Shear design
This report reviews the literature on the shear problem in reinforced and prestressed concrete
beams, with particular attention devoted to beams constructed with HPC. Section 1.2.1 reviews
the historical development of the research; Section 1.2.2 presents the 318-08 ACI Code (ACI 318
2008); and Section 1.2.3 covers the 2004 AASHTO LRFD (AASHTO 2004) bridge design
specifications. Section 1.2.4 summarizes a study comparing the ACI code approach to that used in
the AASHTO LRFD specifications.
2
1.2.1 History behind the shear design
In the early ages of reinforced concrete studies, pioneers developed two mechanisms for
estimating shear failures in reinforced concrete members. The first mechanism considered
horizontal shear as the basic cause of shear failures (ACI-ASCE Committee 326, 1962). This
seemed a reasonable approach at the time when engineers and researchers were familiar with the
action of web rivets in steel girders and shear-keys in wooden beams, for which shearing stresses
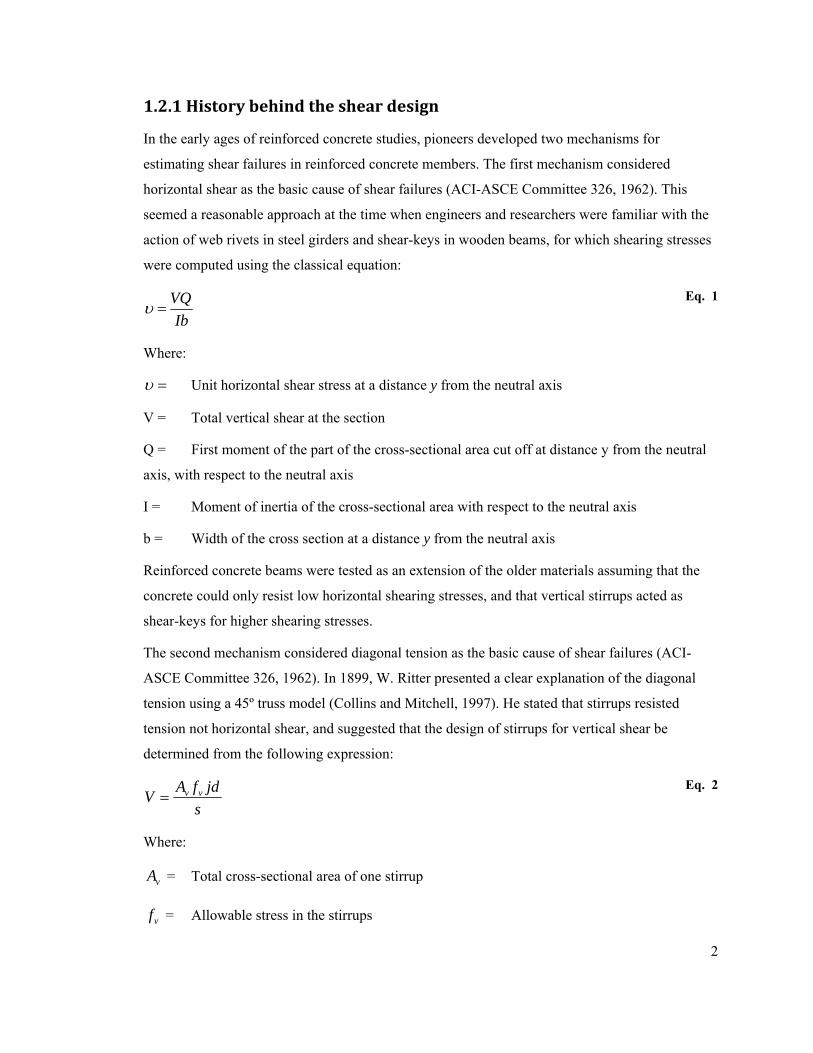
were computed using the classical equation:
IbVQ
=υ Eq. 1
Where:
=υ Unit horizontal shear stress at a distance y from the neutral axis
V = Total vertical shear at the section
Q = First moment of the part of the cross-sectional area cut off at distance y from the neutral
axis, with respect to the neutral axis
I = Moment of inertia of the cross-sectional area with respect to the neutral axis
b = Width of the cross section at a distance y from the neutral axis
Reinforced concrete beams were tested as an extension of the older materials assuming that the
concrete could only resist low horizontal shearing stresses, and that vertical stirrups acted as
shear-keys for higher shearing stresses.
The second mechanism considered diagonal tension as the basic cause of shear failures (ACI-
ASCE Committee 326, 1962). In 1899, W. Ritter presented a clear explanation of the diagonal
tension using a 45º truss model (Collins and Mitchell, 1997). He stated that stirrups resisted
tension not horizontal shear, and suggested that the design of stirrups for vertical shear be
determined from the following expression:
sjdfAV vv=
Eq. 2
Where:
vA = Total cross-sectional area of one stirrup
vf = Allowable stress in the stirrups
3
jd = Internal moment arm
s = Spacing of stirrups in the direction of the axis of the member
Ritter’s design expression for vertical stirrups is identical to that appearing in modern design
specifications of most countries.
Discussions between the proponents of horizontal shear and diagonal tension continued for nearly
a decade until laboratory tests resolved the issue mainly through the efforts of E. Mörsch in
Germany. He pointed out that, if a state of pure shear stress exists, then a tensile stress of equal
magnitude must exist on a 45-degree plane (ACI-ASCE Committee 326, 1962). Mörsch
explained Ritter’s model in more detail. He also predicted that the shear stress would reach its
maximum value at the neutral axis and would remain constant from the neutral axis down to the
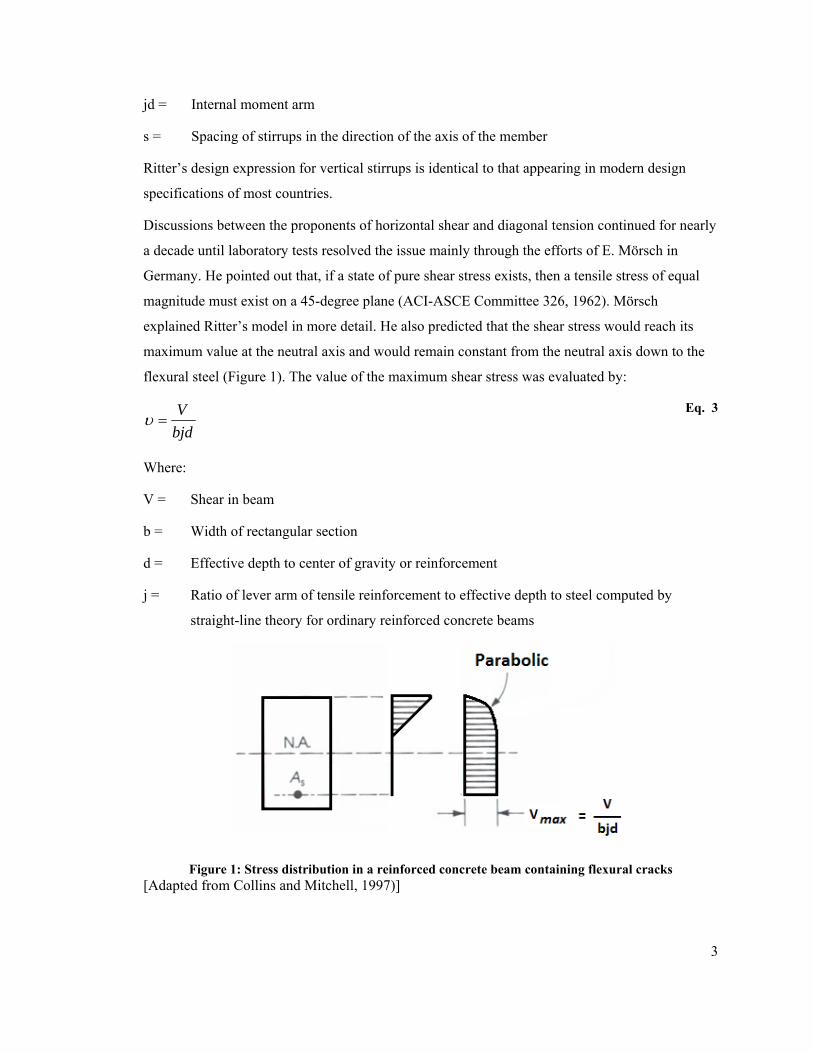
flexural steel (Figure 1). The value of the maximum shear stress was evaluated by:
bjdV
=υ Eq. 3
Where:
V = Shear in beam
b = Width of rectangular section
d = Effective depth to center of gravity or reinforcement
j = Ratio of lever arm of tensile reinforcement to effective depth to steel computed by
straight-line theory for ordinary reinforced concrete beams
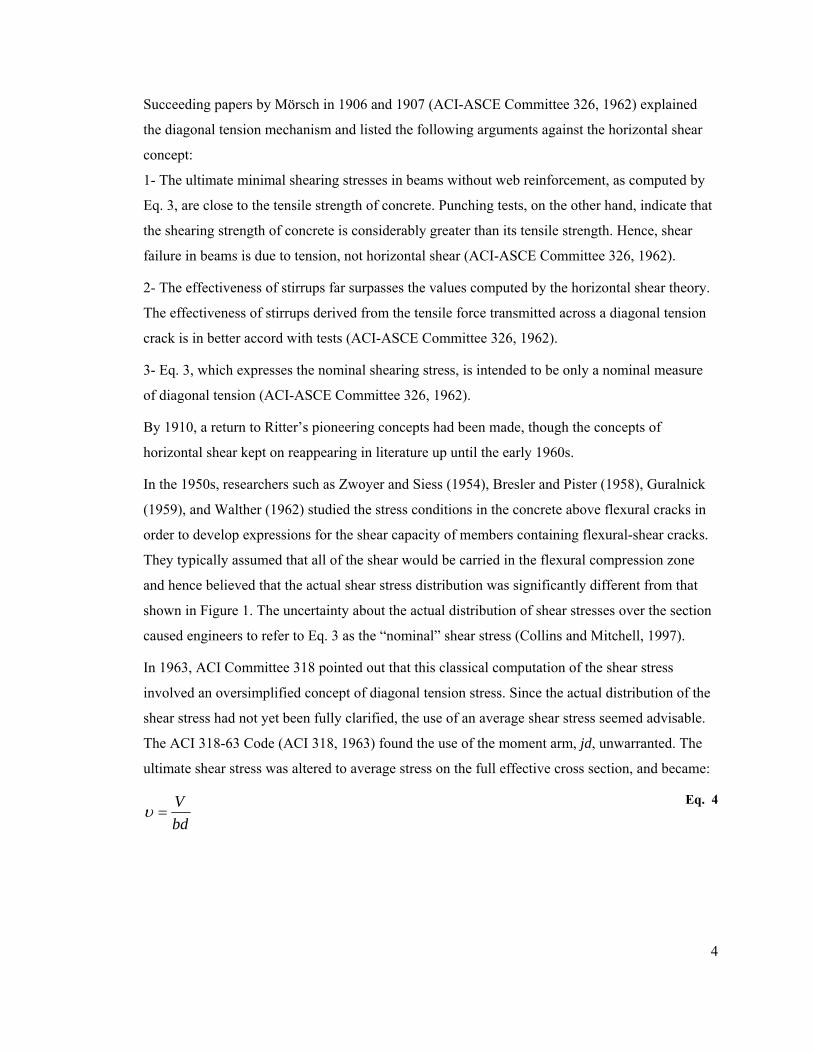
Figure 1: Stress distribution in a reinforced concrete beam containing flexural cracks [Adapted from Collins and Mitchell, 1997)]
4
Succeeding papers by Mörsch in 1906 and 1907 (ACI-ASCE Committee 326, 1962) explained
the diagonal tension mechanism and listed the following arguments against the horizontal shear
concept:
1- The ultimate minimal shearing stresses in beams without web reinforcement, as computed by
Eq. 3, are close to the tensile strength of concrete. Punching tests, on the other hand, indicate that
the shearing strength of concrete is considerably greater than its tensile strength. Hence, shear
failure in beams is due to tension, not horizontal shear (ACI-ASCE Committee 326, 1962).
2- The effectiveness of stirrups far surpasses the values computed by the horizontal shear theory.
The effectiveness of stirrups derived from the tensile force transmitted across a diagonal tension
crack is in better accord with tests (ACI-ASCE Committee 326, 1962).
3- Eq. 3, which expresses the nominal shearing stress, is intended to be only a nominal measure
of diagonal tension (ACI-ASCE Committee 326, 1962).
By 1910, a return to Ritter’s pioneering concepts had been made, though the concepts of
horizontal shear kept on reappearing in literature up until the early 1960s.
In the 1950s, researchers such as Zwoyer and Siess (1954), Bresler and Pister (1958), Guralnick
(1959), and Walther (1962) studied the stress conditions in the concrete above flexural cracks in
order to develop expressions for the shear capacity of members containing flexural-shear cracks.
They typically assumed that all of the shear would be carried in the flexural compression zone
and hence believed that the actual shear stress distribution was significantly different from that
shown in Figure 1. The uncertainty about the actual distribution of shear stresses over the section
caused engineers to refer to Eq. 3 as the “nominal” shear stress (Collins and Mitchell, 1997).
In 1963, ACI Committee 318 pointed out that this classical computation of the shear stress
involved an oversimplified concept of diagonal tension stress. Since the actual distribution of the
shear stress had not yet been fully clarified, the use of an average shear stress seemed advisable.
The ACI 318-63 Code (ACI 318, 1963) found the use of the moment arm, jd, unwarranted. The
ultimate shear stress was altered to average stress on the full effective cross section, and became:
bdV
=υ Eq. 4
5
Where b, previously defined as the “width of rectangular section”, was reduced for I and T-
sections to the width of the web. If the web was to be slightly tapered, an average web width was
to be used in computations.
In addition, Ritter’s equation (Eq. 2) for the design of vertical stirrups was adjusted to:
sdfAV vv=
Eq. 5
The 1963 ACI code also incorporated two empirical equations for nominal shear stress at the
flexure-shear cracking load. Both of these equations were developed by the ACI/ASCE Shear
Committee by reviewing available research. The equations were simplified to ease every-day
design work, and placed as such that the ultimate strength of beams be governed by flexure
failures rather than by shear failures.
The first expression for the nominal shear stress at the flexure-shear cracking load of a reinforced
concrete beam is:
dbfdbMVdfV wcwwc
'' 5.325009.1 ≤⎟⎠⎞
⎜⎝⎛ += ρ (inch-pound system) Eq. 6
dbfdbMVdfV wcwwc
'' 29.01716.0 ≤⎟⎠⎞
⎜⎝⎛ += ρ (mm-Newton system)
Where:
V = External shear at diagonal tension cracking of the section considered
V/M = Ratio of shear to moment at section considered
wρ = Ratio of non-prestressed tension reinforcement = bdAs
The second equation is a simplified version of the first one:
dbfV wc'2= (inch-pound system) Eq. 7
dbfV wc'17.0= (mm-Newton system)
These two equations, valid for members subjected to shear and flexure only, are found in the ACI
318-08 Code.
In 1973, the ACI-ASCE Shear Committee wrote “During the next decade it is hoped that the
design regulations for shear strength can be integrated, simplified and given a physical
6
significance so that designers can approach unusual design problems in a rational manner” (ACI-
ASCE Committee 426, 1973). Nonetheless, in 1984, MacGregor described the shear equations in
the ACI code as “empirical mumbo-jumbo” (MacGregor, 1984).
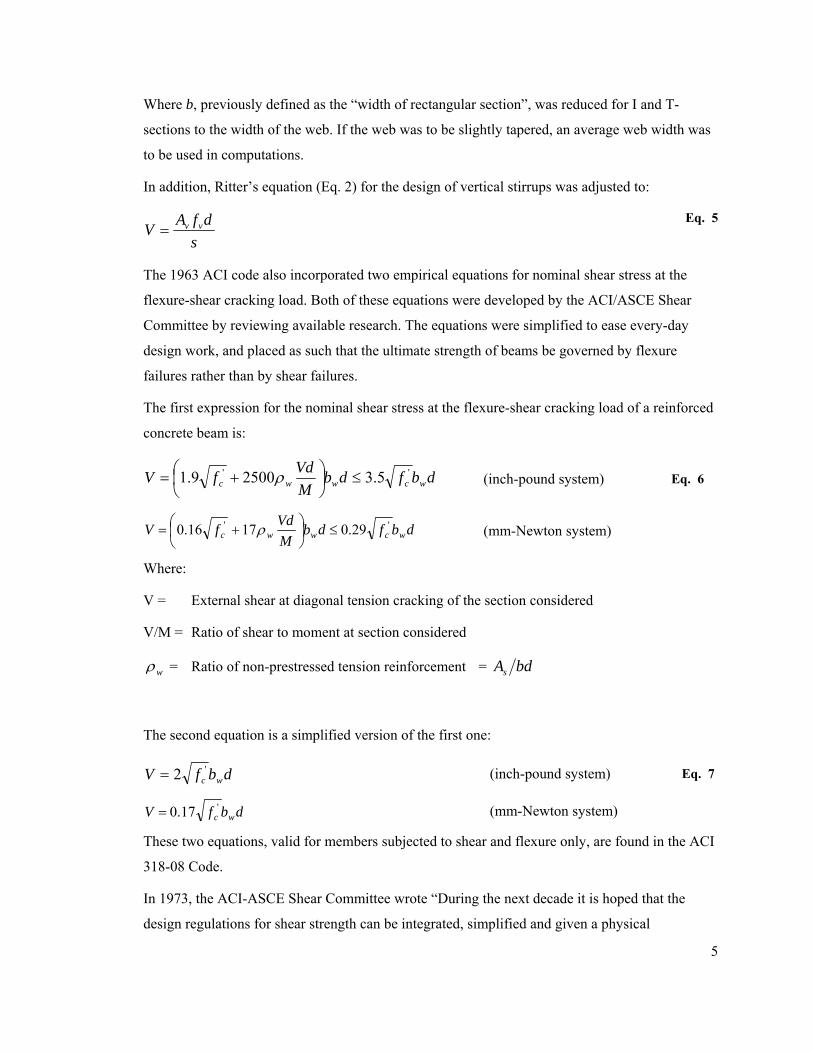
In 1974, a “rational” solution for the design of reinforced concrete beams to resist torsion was
developed by Mitchell and Collins (1974) known as the “compression field theory”. This concept
followed the strain compatibility conditions in the “tension field theory” developed by Wagner
(1929) to describe the post-buckling behaviour of thin webs of steel girders. He assumed that
after buckling, the thin webs would not resist compression and that the shear would be carried by
a field of diagonal tension. The compression field theory is similar to Neilsen’s (Brook and
Brown, 1967) lower bound solution: it described shear behaviour through the entire cracked range
up to failure. The compression field theory idealized the diagonally cracked concrete as a material
with coinciding principal stress and strain axes which develop to satisfy both equilibrium and
compatibility of strains.
Figure 2: Design of transverse reinforcement for shear: compression field theory
[Adapted from Collins and Mitchell, 1997]
The vertical component of the diagonal compressive force in the concrete, which is inclined at the
angle θ to the longitudinal axis, must equal the applied shear force (Figure 2) and hence:
⎟⎠⎞
⎜⎝⎛ +⎟⎟⎠
⎞⎜⎜⎝
⎛=
θθ
tan1tan2 jdb
Vfw
Eq. 8
In turn, the diagonal compression in the concrete transfers vertical forces to the stirrups so that:
θtanjdV
sfA vv =
Eq. 9
7
The longitudinal component of the diagonal compression in the concrete is equilibrated by
tension:
θtanVfAfAN ppxxv =+=
Eq. 10
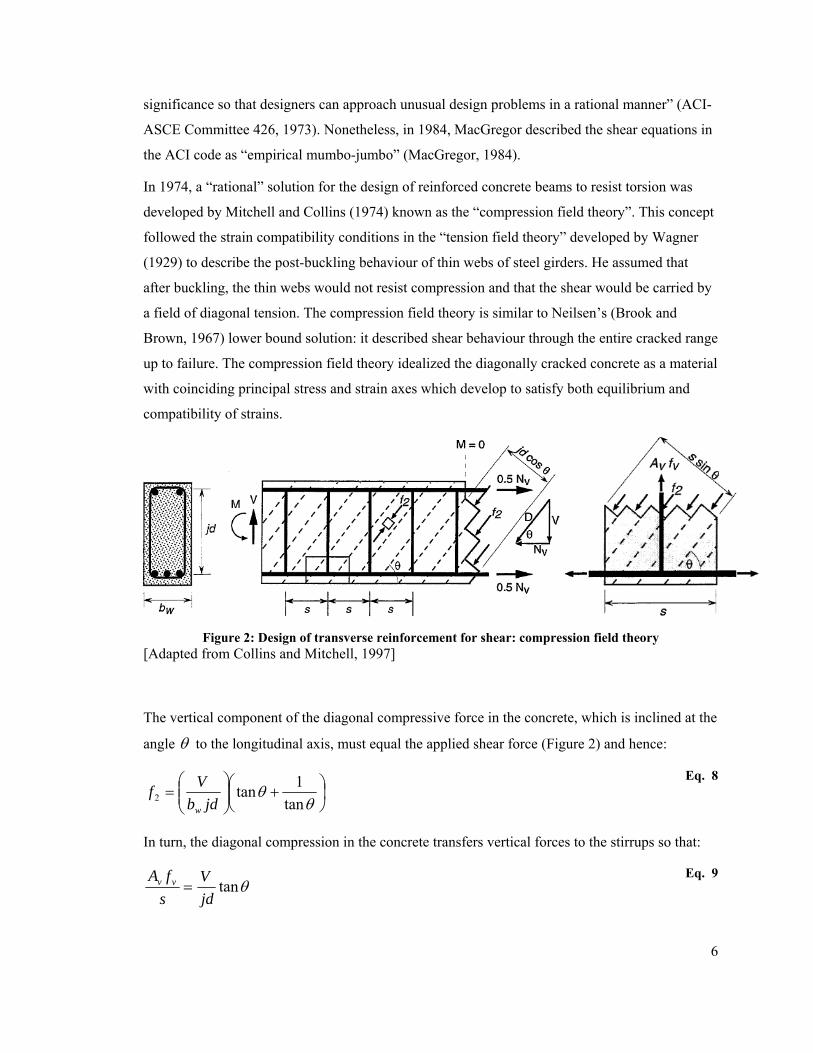
The compression field theory also assumed that concrete, once cracked, carries no tension and
that the shear is carried by a field of diagonal compression. Applying Wagner’s approach to
reinforced concrete resulted in the following expression for the angle of inclination of the
diagonal compression (Figure 3):
2
22tanεεεε
θ−+
=t
x Eq. 11
Figure 3: Average strains in web elements [Adapted from Collins and Mitchell, 1986]
In 1982, Vecchio and Collins tested reinforced concrete panels under biaxial stresses and pure
shear. They found that the principal compressive stress in the concrete, 2f , is a function not only
of the principal compressive strain 2ε , but also of the coexisting principal tensile strain 1ε . In
fact, the concrete web is not only in compression in direction 2, but is also in tension in direction
1. They suggested the following parabolic stress-strain relationship:
⎥⎥⎦
⎤
⎢⎢⎣
⎡⎟⎟⎠
⎞⎜⎜⎝
⎛−⎟⎟
⎠
⎞⎜⎜⎝
⎛=
2
'2
'2
max,22 2cc
ffεε
εε
Eq. 12
Where:
0.11708.01
1'
max,2 ≤+
=εcf
f
Eq. 13
By using these equations, it was possible to predict not only the strength but the load-deformation
response of members loaded in shear. However, it was found that this theory overestimates the
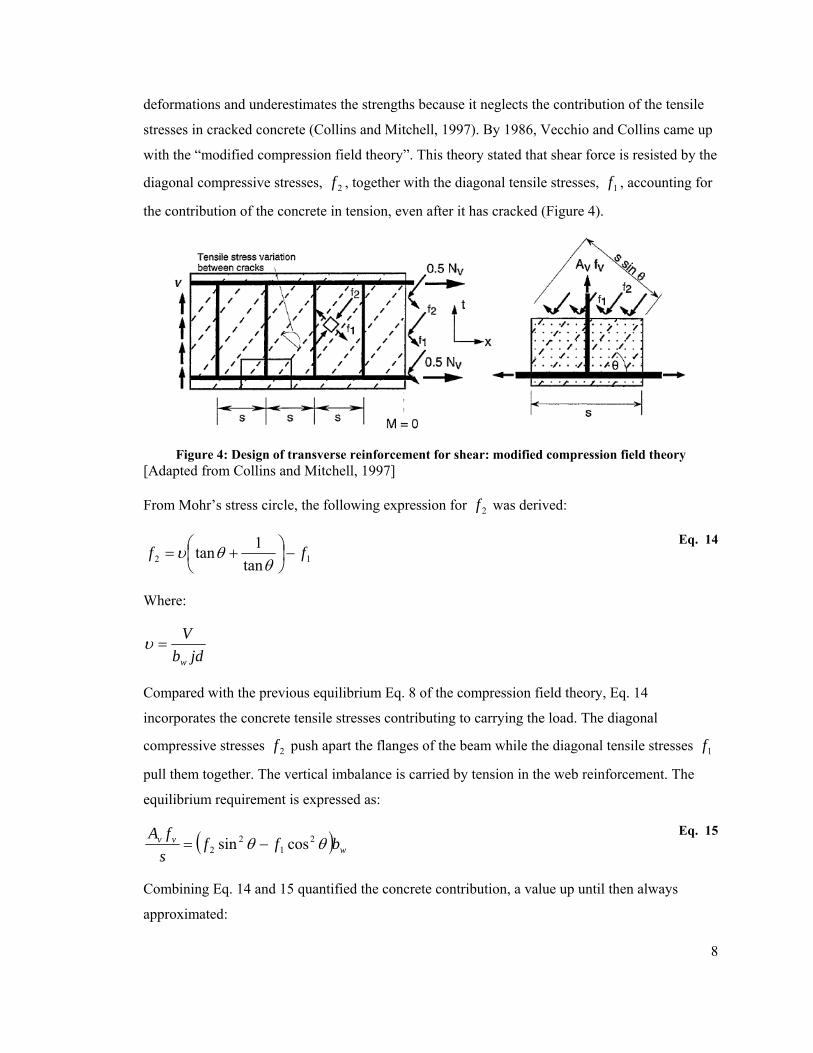
8
deformations and underestimates the strengths because it neglects the contribution of the tensile
stresses in cracked concrete (Collins and Mitchell, 1997). By 1986, Vecchio and Collins came up
with the “modified compression field theory”. This theory stated that shear force is resisted by the
diagonal compressive stresses, 2f , together with the diagonal tensile stresses, 1f , accounting for
the contribution of the concrete in tension, even after it has cracked (Figure 4).
Figure 4: Design of transverse reinforcement for shear: modified compression field theory [Adapted from Collins and Mitchell, 1997]
From Mohr’s stress circle, the following expression for 2f was derived:
12 tan1tan ff −⎟
⎠⎞
⎜⎝⎛ +=
θθυ
Eq. 14
Where:
jdbV
w
=υ
Compared with the previous equilibrium Eq. 8 of the compression field theory, Eq. 14
incorporates the concrete tensile stresses contributing to carrying the load. The diagonal
compressive stresses 2f push apart the flanges of the beam while the diagonal tensile stresses 1f
pull them together. The vertical imbalance is carried by tension in the web reinforcement. The
equilibrium requirement is expressed as:
( ) wvv bff
sfA
θθ 21
22 cossin −=
Eq. 15
Combining Eq. 14 and 15 quantified the concrete contribution, a value up until then always
approximated:
9
θθ cotcot 1 jdbfjdsfA
V wvv +=
Eq. 16
cs VVV +=
V = Steel contribution + Concrete contribution
Eq. 17
In fact, between 1904 and 1922, several hundred reinforced concrete beams were tested by Talbot
at the University of Illinois (Hognestad, 1952) and by Moritz at the University of Wisconsin
(Hognestad, 1952). These tests demonstrated that the stirrup stresses were considerably lower
than those predicted by the 45º truss model. This was due to the neglection of tensile stresses in
the concrete and the choice of 45º for the compressive strut inclination. According to the 45º truss
model, a beam without any transverse reinforcement would have zero shear strength. In order to
account for the contribution of the tensile stresses in the concrete, the first ACI code, in 1910
(ACI 1910) stated:
“In calculating web reinforcement the concrete shall be considered to carry 40 psi (0.275
MPa), the remainder to be provided for by means of web-reinforcement in tension.”
As the typical concrete compressive strength in those days was 2,000 psi (13.8 MPa), this
working stress code permitted concrete tensile stress at working load of '02.0 cf , equating about
'04.0 cf at ultimate.
In 1989, the ACI Code (ACI 318, 1989) separated the shear resistance of a beam into two
components, the “concrete contribution” due to tensile stresses in the concrete and the “steel
contribution” due to tensile stresses in the stirrups.
A number of experiments were conducted to study the influence of concrete strength on the shear
strength of reinforced concrete beams. Mphonde and Frantz (1985) tested 12 reinforced concrete
beams with 'cf ranging from 3,500 to 13,000 psi (24.2 to 89.7 MPa). They concluded that the
ACI Code (Eq. 6, 16 and 17), are conservative for all values of 'cf . Soon after, Elzanati, Nilson
and State (1986) and Nilson (1987) tested 9 reinforced concrete beams with
psifc 500,9' > (65.55 MPa) for shear strength and compared the results with 6 beams of
psifc 800,5' ≤ (40 MPa). They concluded that the ACI Code Equation 6 is unconservative by 10
to 30% for beams combining high strength concrete with medium to high shear span ratios and
typical or relatively low longitudinal steel ratios.
10
In 1989, Johnson and Ramirez (1989) tested 8 rectangular beams with concrete strength ranging
from 5,000 to 10,500 psi (34.5 to 72.5 MPa), and with web reinforcement ratios sv of 0 to 100
psi (0.69 MPa). Their results indicated that the overall reserve shear strength after diagonal
cracking, cfail VV − , diminishes as the concrete compressive strength increases, for a constant
reinforcement ratio. This data was used to justify the ACI 318-89 Code expressions in ∫ 1.2.1.11
which limits 'cf to 10,000 psi (69 MPa) or increases the minimum amount of reinforcement by a
factor equal to 'cf /5,000 psi (34.5 MPa) but less than 3 times the amount provided for concrete
with 'cf < 5,000 psi (34.5 MPa).
Roller and Russell (1990) reviewed 150 tests and confirmed the validity of the ACI Code
equations for shear. They also tested 10 beams with 'cf ranging from 10,500 psi to 18,000 psi
(72.5 to 124.2 MPa), all of which confirmed the findings of Johnson and Ramirez’s research.
Throughout the years, the provision requiring a sudden increase in the minimum amount of
transverse reinforcement for concrete strengths between 10,000 and 15,000 psi (69 and 103.5
MPa) was replaced by a gradual increase in the minimum vA , as 'cf increases.
Despite all the tests done in the past, research is still to be continued. In fact, due to the number of
variables involved, a general shear theory has been evasive. Design has been based on empirical
evidence, resulting in almost as many empirical equations as investigators. This basis has
provided a multitude of design equations for the design of structures in shear. For instance, the
ACI Building Code provides five different equations to evaluate the concrete contribution to
shear resistance for nonprestressed members, and three for prestressed members. To calculate cV
according to the AASHTO design specifications is dependent on the version of specifications
used. In general, the 16th edition conforms to the ACI Building Code. However, the AASHTO
LRFD bridge design specifications have introduced substantially different provisions for shear
design, based on the modified compression field theory.
1.2.2 ACI 318 Building Code (31808)
ACI 318, while generally providing ease in calculation, has been identified as having many
shortcomings including lack of conservatism for lightly reinforced cross-sections, for sections
utilizing high strength concrete, and deep sections.
11
The ACI 318-08 code starts by stipulating that the design shear strength of a member, nVφ , must
be greater that the factored shear, uV :
nu VV φ≤ ACI 11- 1
Where:
=φ Strength reduction factor, taken equal to 0.85 for shear
With the nominal shear strength nV given as:
=nV sc VV + ACI 11- 2
Where:
=cV Nominal shear strength provided by concrete
=sV Nominal shear strength provided by steel
Assuming that all stirrups yield at failure, the shear resisted by the stirrups perpendicular to the
axis is computed by:
sdfA
V ytvs =
ACI 11- 15
Where:
=vA Area of shear reinforcement within spacing s, 2in )( 2mm
=ytf Specified yield strength of transverse reinforcement, psi )(MPa
=sd Number of vertical stirrups spaced s apart, in a beam of d effective depth, crossed by a
45º crack
=d Distance from extreme compression fiber to centroid of the prestressed and
nonprestressed longitudinal tension reinforcement, if any, but need not be taken less than
0.80h
12
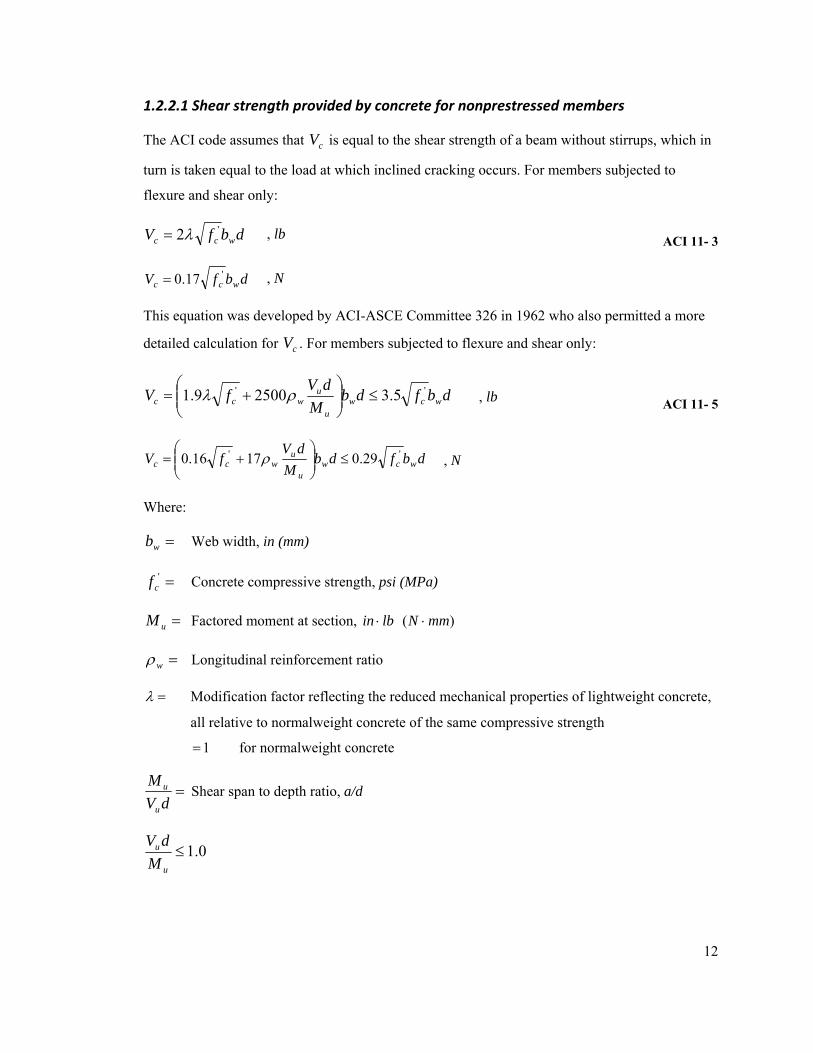
1.2.2.1 Shear strength provided by concrete for nonprestressed members
The ACI code assumes that cV is equal to the shear strength of a beam without stirrups, which in
turn is taken equal to the load at which inclined cracking occurs. For members subjected to
flexure and shear only:
dbfV wcc'2λ= , lb ACI 11- 3
dbfV wcc'17.0= , N
This equation was developed by ACI-ASCE Committee 326 in 1962 who also permitted a more
detailed calculation for cV . For members subjected to flexure and shear only:
dbfdbM
dVfV wcwu
uwcc
'' 5.325009.1 ≤⎟⎟⎠
⎞⎜⎜⎝
⎛+= ρλ , lb ACI 11- 5
dbfdbM
dVfV wcw
u
uwcc
'' 29.01716.0 ≤⎟⎟⎠
⎞⎜⎜⎝
⎛+= ρ , N
Where:
=wb Web width, in (mm)
='cf Concrete compressive strength, psi (MPa)
=uM Factored moment at section, lbin ⋅ )( mmN ⋅
=wρ Longitudinal reinforcement ratio
=λ Modification factor reflecting the reduced mechanical properties of lightweight concrete,
all relative to normalweight concrete of the same compressive strength
1= for normalweight concrete
=dV
M
u
u Shear span to depth ratio, a/d
0.1≤u
u
MdV
13
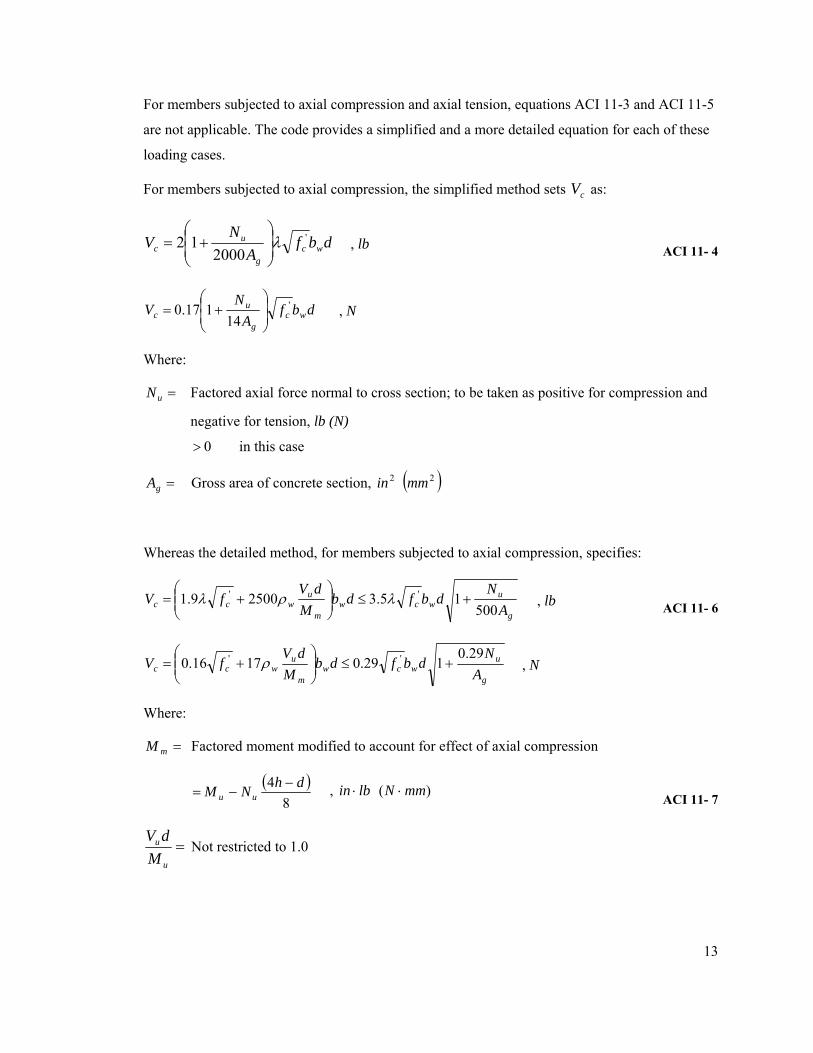
For members subjected to axial compression and axial tension, equations ACI 11-3 and ACI 11-5
are not applicable. The code provides a simplified and a more detailed equation for each of these
loading cases.
For members subjected to axial compression, the simplified method sets cV as:
dbfA
NV wcg
uc
'
200012 λ⎟
⎟⎠
⎞⎜⎜⎝
⎛+= , lb ACI 11- 4
dbfA
NV wc
g
uc
'
14117.0 ⎟
⎟⎠
⎞⎜⎜⎝
⎛+= , N
Where:
=uN Factored axial force normal to cross section; to be taken as positive for compression and
negative for tension, lb (N)
0> in this case
=gA Gross area of concrete section, 2in ( )2mm
Whereas the detailed method, for members subjected to axial compression, specifies:
g
uwcw
m
uwcc A
Ndbfdb
MdV
fV500
15.325009.1 '' +≤⎟⎟⎠
⎞⎜⎜⎝
⎛+= λρλ , lb ACI 11- 6
g
uwcw
m
uwcc A
Ndbfdb
MdV
fV29.0
129.01716.0 '' +≤⎟⎟⎠
⎞⎜⎜⎝
⎛+= ρ , N
Where:
=mM Factored moment modified to account for effect of axial compression
( )8
4 dhNM uu−
−= , lbin ⋅ )( mmN ⋅ ACI 11- 7
=u
u
MdV
Not restricted to 1.0
14
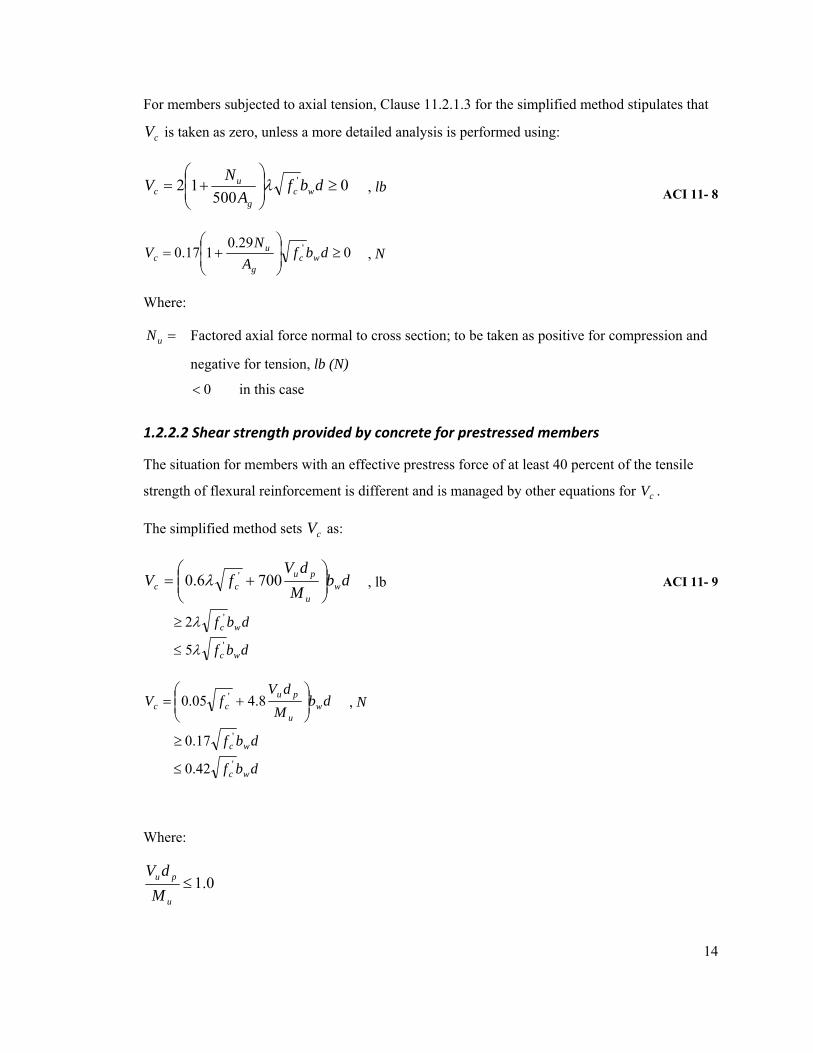
For members subjected to axial tension, Clause 11.2.1.3 for the simplified method stipulates that
cV is taken as zero, unless a more detailed analysis is performed using:
0500
12 ' ≥⎟⎟⎠
⎞⎜⎜⎝
⎛+= dbf
ANV wc
g
uc λ , lb ACI 11- 8
029.0
117.0 ' ≥⎟⎟⎠
⎞⎜⎜⎝
⎛+= dbf
AN
V wcg
uc , N
Where:
=uN Factored axial force normal to cross section; to be taken as positive for compression and
negative for tension, lb (N)
0< in this case
1.2.2.2 Shear strength provided by concrete for prestressed members
The situation for members with an effective prestress force of at least 40 percent of the tensile
strength of flexural reinforcement is different and is managed by other equations for cV .
The simplified method sets cV as:
dbM
dVfV w
u
pucc ⎟⎟
⎠
⎞⎜⎜⎝
⎛+= 7006.0 'λ , lb ACI 11- 9
dbf wc'2λ≥
dbf wc'5λ≤
dbM
dVfV w
u
pucc ⎟⎟
⎠
⎞⎜⎜⎝
⎛+= 8.405.0 ' , N
dbf wc'17.0≥
dbf wc'42.0≤
Where:
0.1≤u
pu
MdV
15
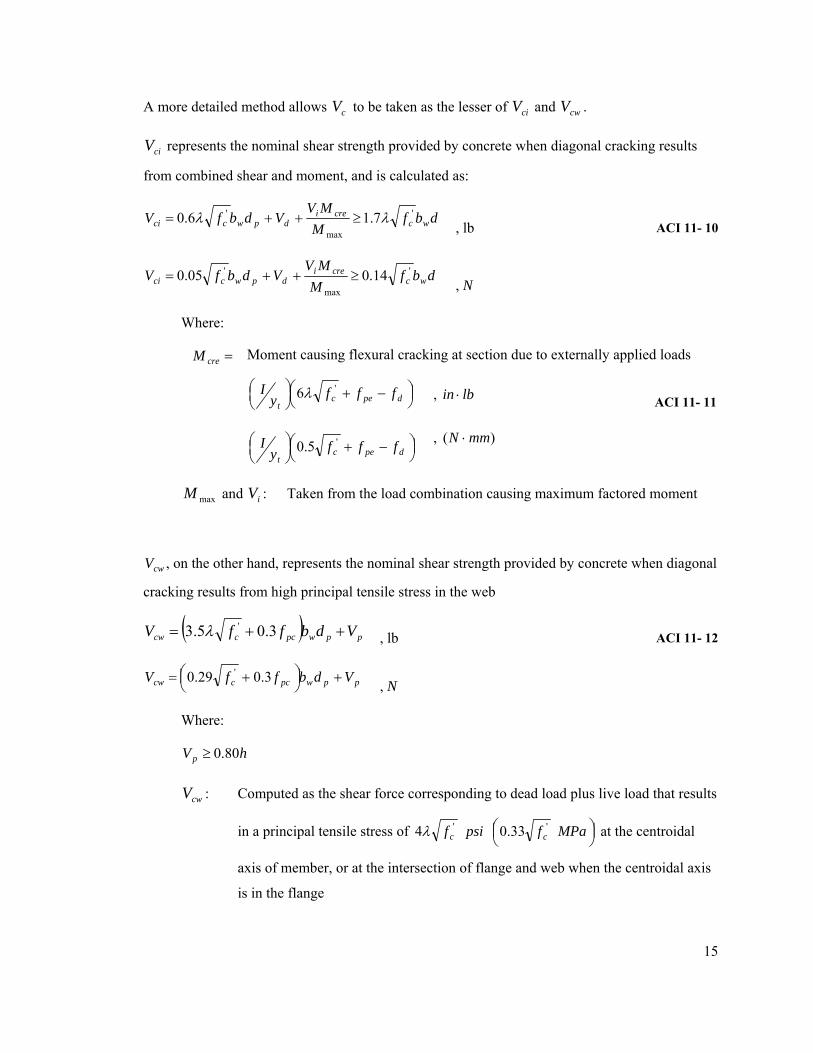
A more detailed method allows cV to be taken as the lesser of ciV and cwV .
ciV represents the nominal shear strength provided by concrete when diagonal cracking results
from combined shear and moment, and is calculated as:
dbfM
MVVdbfV wc
creidpwcci
'
max
' 7.16.0 λλ ≥++=, lb ACI 11- 10
dbfM
MVVdbfV wc
creidpwcci
'
max
' 14.005.0 ≥++= , N
Where:
=creM Moment causing flexural cracking at section due to externally applied loads
⎟⎠⎞⎜
⎝⎛ −+⎟⎠⎞⎜
⎝⎛
dpect
fffyI '6λ , lbin ⋅ ACI 11- 11
⎟⎠⎞⎜
⎝⎛ −+⎟⎠⎞⎜
⎝⎛
dpect
fffyI '5.0 , )( mmN ⋅
maxM and iV : Taken from the load combination causing maximum factored moment
cwV , on the other hand, represents the nominal shear strength provided by concrete when diagonal
cracking results from high principal tensile stress in the web
( ) ppwpcccw VdbffV ++= 3.05.3 'λ , lb ACI 11- 12
ppwpcccw VdbffV +⎟⎠⎞⎜
⎝⎛ += 3.029.0 ' , N
Where:
hVp 80.0≥
cwV : Computed as the shear force corresponding to dead load plus live load that results
in a principal tensile stress of psif c'4λ ⎟
⎠⎞⎜
⎝⎛ MPafc
'33.0 at the centroidal
axis of member, or at the intersection of flange and web when the centroidal axis
is in the flange
16
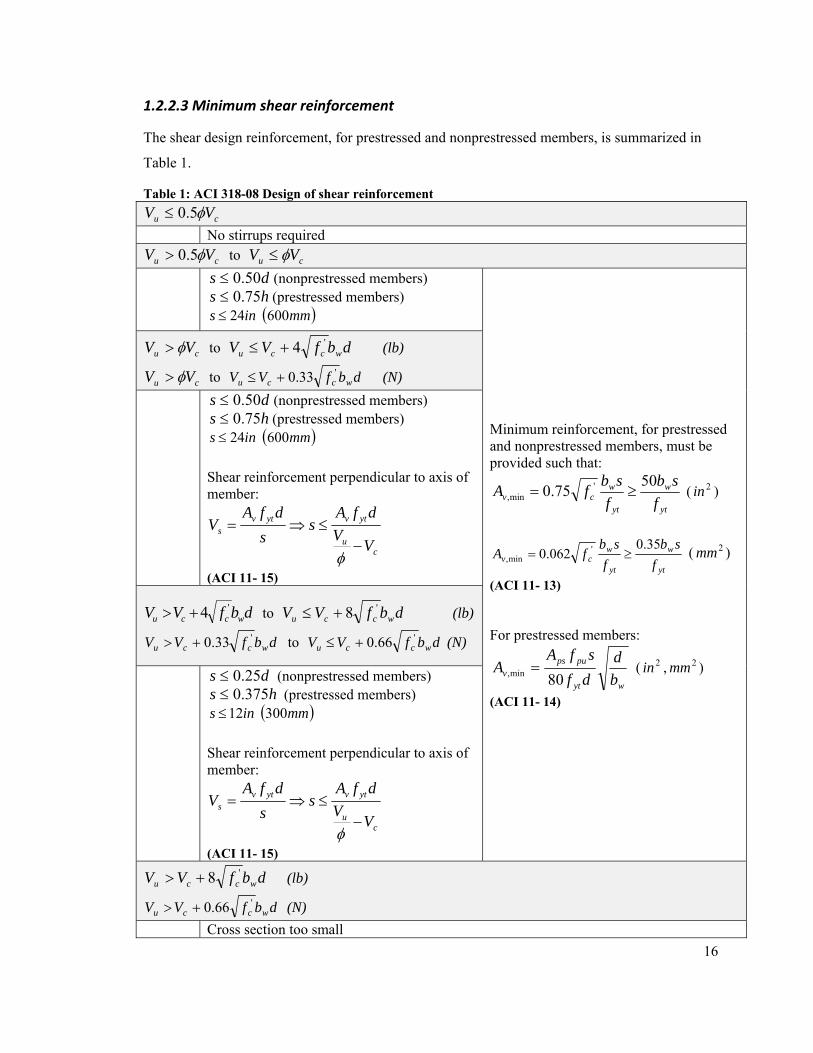
1.2.2.3 Minimum shear reinforcement
The shear design reinforcement, for prestressed and nonprestressed members, is summarized in
Table 1.
Table 1: ACI 318-08 Design of shear reinforcement
cu VV φ5.0≤ No stirrups required
cu VV φ5.0> to cu VV φ≤
ds 50.0≤ (nonprestressed members) hs 75.0≤ (prestressed members) ( )mmins 60024≤
Minimum reinforcement, for prestressed and nonprestressed members, must be provided such that:
yt
w
yt
wcv f
sbf
sbfA 5075.0 'min, ≥= ( 2in )
yt
w
yt
wcv f
sbf
sbfA
35.0062.0 '
min, ≥= ( 2mm )
(ACI 11- 13) For prestressed members:
wyt
pupsv b
ddfsfA
A80min, = ( 2in , 2mm )
(ACI 11- 14)
cu VV φ> to dbfVV wccu'4+≤ (lb)
cu VV φ> to dbfVV wccu'33.0+≤ (N)
ds 50.0≤ (nonprestressed members) hs 75.0≤ (prestressed members) ( )mmins 60024≤
Shear reinforcement perpendicular to axis of member:
cu
ytvytvs
VVdfA
ss
dfAV
−≤⇒=
φ
(ACI 11- 15)
dbfVV wccu'4+> to dbfVV wccu
'8+≤ (lb)
dbfVV wccu'33.0+> to dbfVV wccu
'66.0+≤ (N)
ds 25.0≤ (nonprestressed members) hs 375.0≤ (prestressed members) ( )mmins 30012≤
Shear reinforcement perpendicular to axis of member:
cu
ytvytvs
VVdfA
ss
dfAV
−≤⇒=
φ
(ACI 11- 15)
dbfVV wccu'8+> (lb)
dbfVV wccu'66.0+> (N)
Cross section too small
17
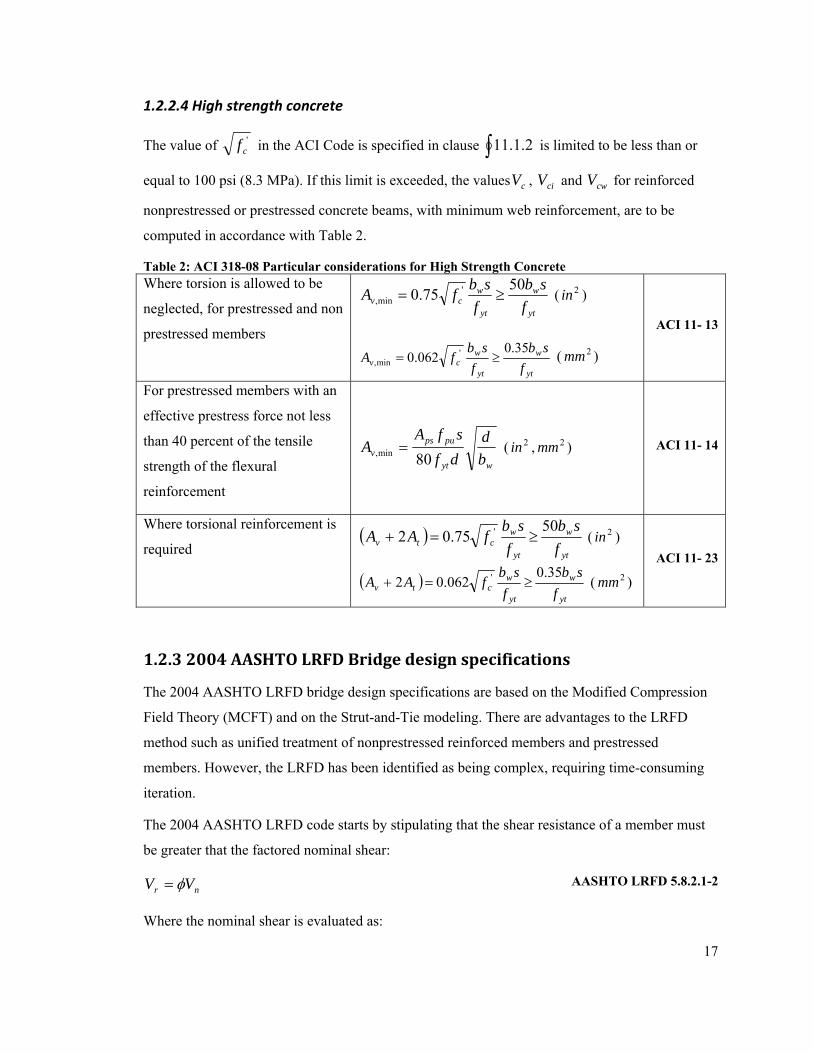
1.2.2.4 High strength concrete
The value of 'cf in the ACI Code is specified in clause ∫ 2.1.11 is limited to be less than or
equal to 100 psi (8.3 MPa). If this limit is exceeded, the values cV , ciV and cwV for reinforced
nonprestressed or prestressed concrete beams, with minimum web reinforcement, are to be
computed in accordance with Table 2.
Table 2: ACI 318-08 Particular considerations for High Strength Concrete Where torsion is allowed to be
neglected, for prestressed and non
prestressed members yt
w
yt
wcv f
sbf
sbfA 5075.0 'min, ≥= ( 2in )
yt
w
yt
wcv f
sbf
sbfA
35.0062.0 '
min, ≥= ( 2mm )
ACI 11- 13
For prestressed members with an
effective prestress force not less
than 40 percent of the tensile
strength of the flexural
reinforcement
wyt
pupsv b
ddfsfA
A80min, = ( 2in , 2mm ) ACI 11- 14
Where torsional reinforcement is
required ( )
yt
w
yt
wctv f
sbf
sbfAA
5075.02 ' ≥=+ ( 2in )
( )yt
w
yt
wctv f
sbf
sbfAA
35.0062.02 ' ≥=+ ( 2mm )
ACI 11- 23
1.2.3 2004 AASHTO LRFD Bridge design specifications
The 2004 AASHTO LRFD bridge design specifications are based on the Modified Compression
Field Theory (MCFT) and on the Strut-and-Tie modeling. There are advantages to the LRFD
method such as unified treatment of nonprestressed reinforced members and prestressed
members. However, the LRFD has been identified as being complex, requiring time-consuming
iteration.
The 2004 AASHTO LRFD code starts by stipulating that the shear resistance of a member must
be greater that the factored nominal shear:
nr VV φ= AASHTO LRFD 5.8.2.1-2
Where the nominal shear is evaluated as:
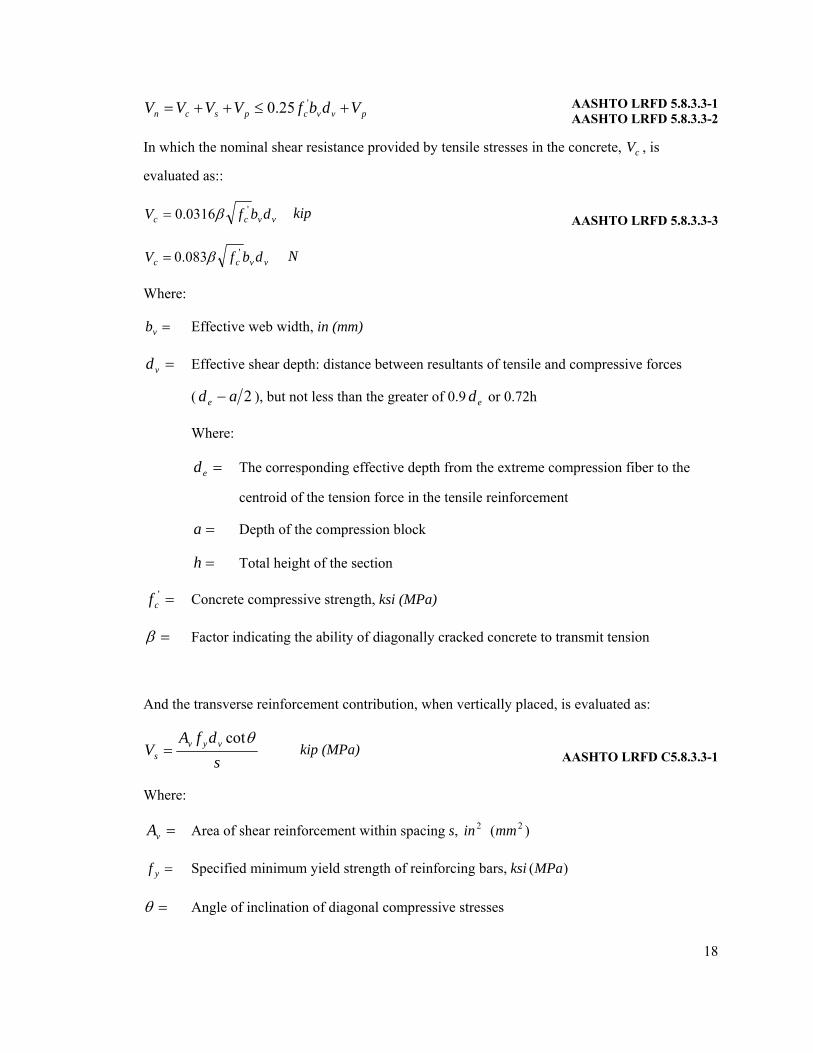
18
pvvcpscn VdbfVVVV +≤++= '25.0 AASHTO LRFD 5.8.3.3-1 AASHTO LRFD 5.8.3.3-2
In which the nominal shear resistance provided by tensile stresses in the concrete, cV , is
evaluated as::
vvcc dbfV '0316.0 β= kip AASHTO LRFD 5.8.3.3-3
vvcc dbfV '083.0 β= N
Where:
=vb Effective web width, in (mm)
=vd Effective shear depth: distance between resultants of tensile and compressive forces
( 2ade − ), but not less than the greater of 0.9 ed or 0.72h
Where:
=ed The corresponding effective depth from the extreme compression fiber to the
centroid of the tension force in the tensile reinforcement
=a Depth of the compression block
=h Total height of the section
='cf Concrete compressive strength, ksi (MPa)
=β Factor indicating the ability of diagonally cracked concrete to transmit tension
And the transverse reinforcement contribution, when vertically placed, is evaluated as:
sdfA
V vyvs
θcot= kip (MPa) AASHTO LRFD C5.8.3.3-1
Where:
=vA Area of shear reinforcement within spacing s, 2in )( 2mm
=yf Specified minimum yield strength of reinforcing bars, ksi )(MPa
=θ Angle of inclination of diagonal compressive stresses
19
The prestressing contribution to shear resistance, pV , is the vertical component of the
prestressing force. It is positive when resisting the applied shear.
The expressions for cV and sV apply to both prestressed and nonprestressed section, with the
terms β and θ depending on the applied loading and the properties of the section. Both of these
values are obtained from tables which depend on whether the section contains the minimum
transverse reinforcement, given by the following equation, or not:
y
vcv f
sbfA '0316.0= , 2in AASHTO LRFD 5.8.2.5-1
y
vcv f
sbfA '083.0= , 2mm
This reinforcement is mandatory where consideration of torsion is required by:
cru TT φ25.0> AASHTO LRFD 5.8.2.1-3
Or where
( )pcu VVV +> φ5.0 AASHTO LRFD 5.8.2.4-1
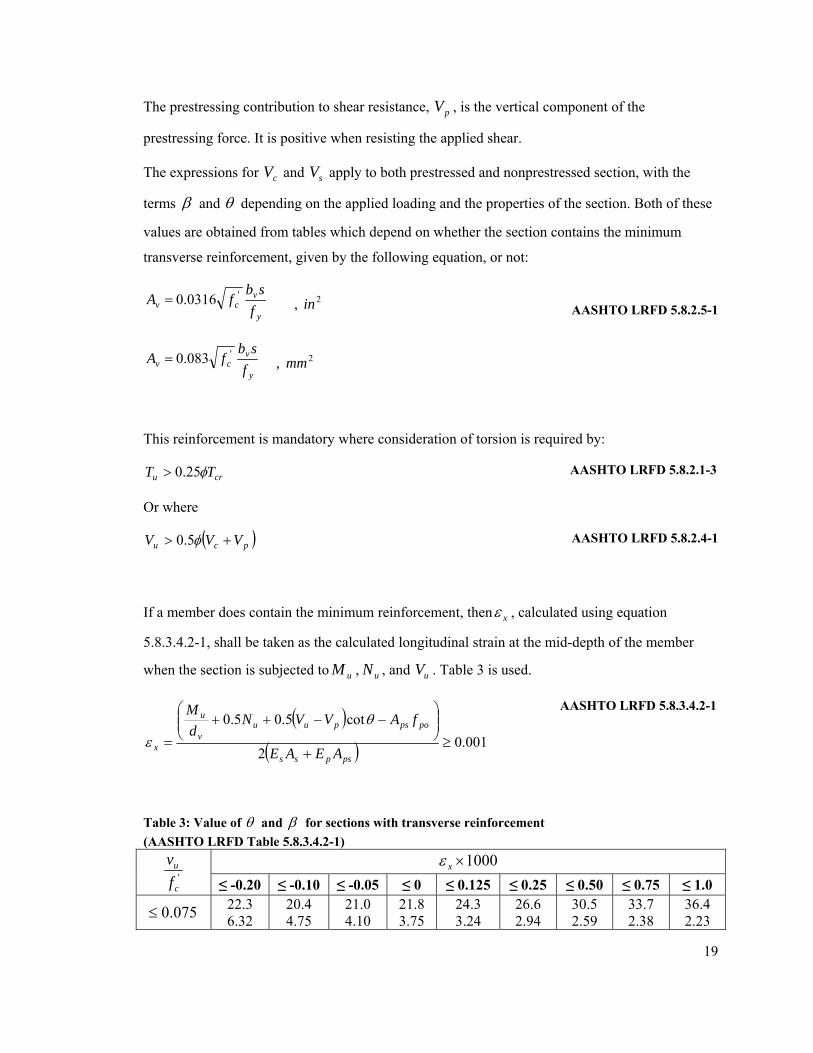
If a member does contain the minimum reinforcement, then xε , calculated using equation
5.8.3.4.2-1, shall be taken as the calculated longitudinal strain at the mid-depth of the member
when the section is subjected to uM , uN , and uV . Table 3 is used.
( )( ) 001.0
2
cot5.05.0≥
+
⎟⎟⎠
⎞⎜⎜⎝
⎛−−++
=pspss
popspuuv
u
x AEAE
fAVVNdM
θε
AASHTO LRFD 5.8.3.4.2-1
Table 3: Value of θ and β for sections with transverse reinforcement (AASHTO LRFD Table 5.8.3.4.2-1)
'c
u
fv
1000×xε
≤ -0.20 ≤ -0.10 ≤ -0.05 ≤ 0 ≤ 0.125 ≤ 0.25 ≤ 0.50 ≤ 0.75 ≤ 1.0
075.0≤ 22.3 6.32
20.4 4.75
21.0 4.10
21.8 3.75
24.3 3.24
26.6 2.94
30.5 2.59
33.7 2.38
36.4 2.23
20
'c
u
fv
1000×xε
≤ -0.20 ≤ -0.10 ≤ -0.05 ≤ 0 ≤ 0.125 ≤ 0.25 ≤ 0.50 ≤ 0.75 ≤ 1.0
100.0≤ 18.1 3.79
20.4 3.38
21.4 3.24
22.5 3.14
24.9 2.91
27.1 2.75
30.8 2.50
34.0 2.32
36.7 2.18
125.0≤ 19.9 3.18
21.9 2.99
22.8 2.94
23.7 2.87
25.9 2.74
27.9 2.62
31.4 2.42
34.4 2.26
37.0 2.13
150.0≤ 21.6 2.88
23.3 2.79
24.2 2.78
25.0 2.72
26.9 2.60
28.8 2.52
32.1 2.36
34.9 2.21
37.3 2.08
175.0≤ 23.2 2.73
24.7 2.66
25.5 2.65
26.2 2.60
28.0 2.52
29.7 2.44
32.7 2.28
35.2 2.14
36.8 1.96
200.0≤ 24.7 2.63
26.1 2.59
26.7 2.52
27.4 2.51
29.0 2.43
30.6 2.37
32.8 2.14
34.5 1.94
36.1 1.79
225.0≤ 26.1 2.53
27.3 2.45
27.9 2.42
28.5 2.40
30.0 2.34
30.8 2.14
32.3 1.86
34.0 1.73
35.7 1.64
250.0≤ 27.5 2.39
28.6 2.39
29.1 2.33
29.7 2.33
30.6 2.12
31.3 1.93
32.8 1.70
34.3 1.58
35.8 1.50
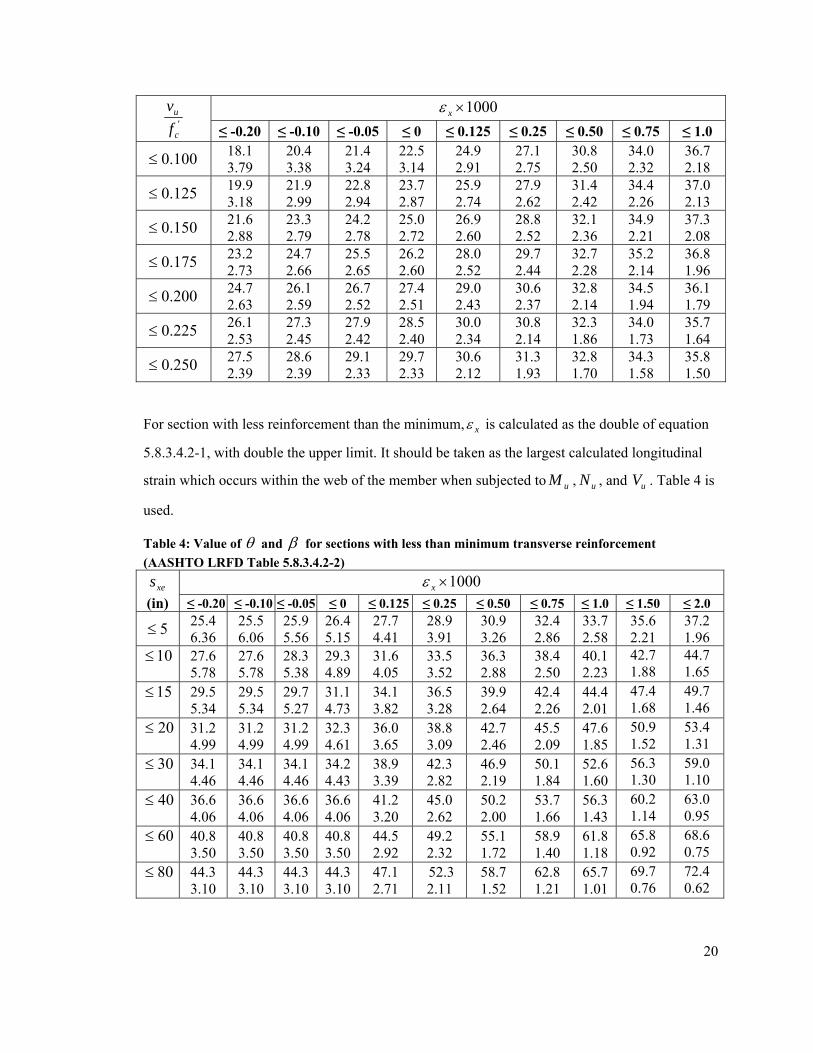
For section with less reinforcement than the minimum, xε is calculated as the double of equation
5.8.3.4.2-1, with double the upper limit. It should be taken as the largest calculated longitudinal
strain which occurs within the web of the member when subjected to uM , uN , and uV . Table 4 is
used.
Table 4: Value of θ and β for sections with less than minimum transverse reinforcement (AASHTO LRFD Table 5.8.3.4.2-2)
xes (in)
1000×xε ≤ -0.20 ≤ -0.10 ≤ -0.05 ≤ 0 ≤ 0.125 ≤ 0.25 ≤ 0.50 ≤ 0.75 ≤ 1.0 ≤ 1.50 ≤ 2.0
5≤ 25.4 6.36
25.5 6.06
25.9 5.56
26.4 5.15
27.7 4.41
28.9 3.91
30.9 3.26
32.4 2.86
33.7 2.58
35.6 2.21
37.2 1.96
10≤
27.6 5.78
27.6 5.78
28.3 5.38
29.3 4.89
31.6 4.05
33.5 3.52
36.3 2.88
38.4 2.50
40.1 2.23
42.7 1.88
44.7 1.65
15≤
29.5 5.34
29.5 5.34
29.7 5.27
31.1 4.73
34.1 3.82
36.5 3.28
39.9 2.64
42.4 2.26
44.4 2.01
47.4 1.68
49.7 1.46
20≤
31.2 4.99
31.2 4.99
31.2 4.99
32.3 4.61
36.0 3.65
38.8 3.09
42.7 2.46
45.5 2.09
47.6 1.85
50.9 1.52
53.4 1.31
30≤
34.1 4.46
34.1 4.46
34.1 4.46
34.2 4.43
38.9 3.39
42.3 2.82
46.9 2.19
50.1 1.84
52.6 1.60
56.3 1.30
59.0 1.10
40≤
36.6 4.06
36.6 4.06
36.6 4.06
36.6 4.06
41.2 3.20
45.0 2.62
50.2 2.00
53.7 1.66
56.3 1.43
60.2 1.14
63.0 0.95
60≤
40.8 3.50
40.8 3.50
40.8 3.50
40.8 3.50
44.5 2.92
49.2 2.32
55.1 1.72
58.9 1.40
61.8 1.18
65.8 0.92
68.6 0.75
80≤
44.3 3.10
44.3 3.10
44.3 3.10
44.3 3.10
47.1 2.71
52.3 2.11
58.7 1.52
62.8 1.21
65.7 1.01
69.7 0.76
72.4 0.62
21
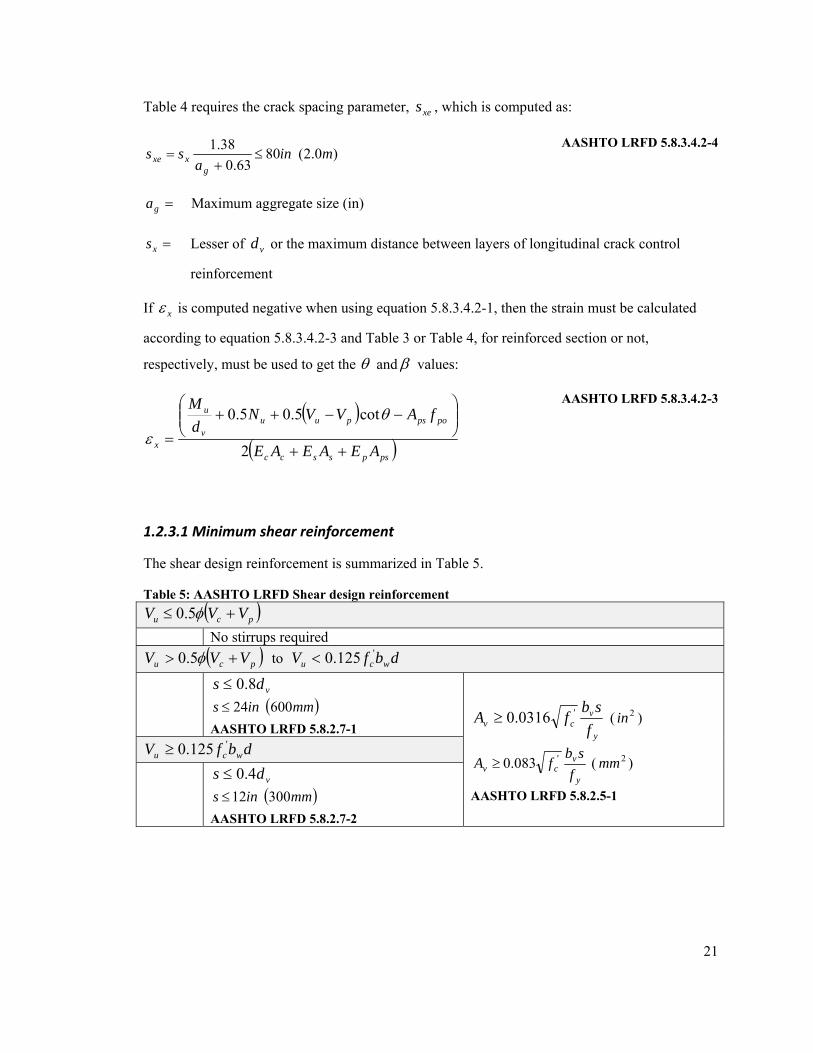
Table 4 requires the crack spacing parameter, xes , which is computed as:
)0.2(8063.0
38.1 mina
ssg
xxe ≤+
= AASHTO LRFD 5.8.3.4.2-4
=ga Maximum aggregate size (in)
=xs Lesser of vd or the maximum distance between layers of longitudinal crack control
reinforcement
If xε is computed negative when using equation 5.8.3.4.2-1, then the strain must be calculated
according to equation 5.8.3.4.2-3 and Table 3 or Table 4, for reinforced section or not,
respectively, must be used to get the θ and β values:
( )( )pspsscc
popspuuv
u
x AEAEAE
fAVVNdM
++
⎟⎟⎠
⎞⎜⎜⎝
⎛−−++
=2
cot5.05.0 θε
AASHTO LRFD 5.8.3.4.2-3
1.2.3.1 Minimum shear reinforcement
The shear design reinforcement is summarized in Table 5.
Table 5: AASHTO LRFD Shear design reinforcement ( )pcu VVV +≤ φ5.0
No stirrups required ( )pcu VVV +> φ5.0 to dbfV wcu
'125.0<
vds 8.0≤ ( )mmins 60024≤
AASHTO LRFD 5.8.2.7-1 y
vcv f
sbfA '0316.0≥ ( 2in )
y
vcv f
sbfA '083.0≥ ( 2mm )
AASHTO LRFD 5.8.2.5-1
dbfV wcu'125.0≥
vds 4.0≤ ( )mmins 30012≤
AASHTO LRFD 5.8.2.7-2
22
1.2.4 Comparison between ACI method and the AASHTO method
Shahawy and Batchelor (1996) performed full scale tests of 20 AASHTO Type II pretensioned
concrete girders and compared the measured shear strength with the values predicted by the 1989
AASHTO Standard Specifications, which uses the ACI method, and the 1994 AASHTO LRFD
Specifications, which uses the modified compression field theory.
The main variable of the study were the amounts of shear reinforcement, shear span and strand
diameter. Six girders were designed according to the provisions of the ACI method and were
provided with the required (R) shear reinforcement. The other 14 girders had various shear
reinforcement vρ ranging from 0 to 3R. Thirteen girders were 41 feet (12.5 m) long, two girders
were 25 feet (7.6 m) long and the other five girders were 21 feet (6.4 m) long. Both, the girder
and the cast-in-place concrete slab, were designed for a 28-day cylinder concrete strength of
6,000 psi (41.4 MPa).
Shahawy and Batchelor’s results indicate that the 1989 Standard (comparable to the current ACI)
provides excellent predictions for girders having shear reinforcement R < vρ < 3R and
conservative estimates for girders with 0 < vρ < R. On the other hand, the LRFD Code
considerably overestimates the shear strength of over-designed girders (2R < vρ < 3R) and
grossly underestimates the shear strength of under-designed girders (0 < vρ < R/2). The latter
suggests that the LRFD estimate for cV is too low. For Rv =ρ , although both approaches
provided conservative estimates, Shahawy and Batchelor found the 1989 Standard to provide
better values than the LRFD Code.
Note that as vρ increases from R to 3R, the shear strength only increases slightly. This justifies
the imposition of a cap on shear reinforcement. The code required the upper limit to prevent the
concrete in the web from crushing prior to yielding of the shear reinforcement. However, in
Shahawy and Batchelor’s experiments, the maximum amount of shear reinforcement was
significantly exceeded without any sign of concrete crushing in the web at failure. At the
maximum specified shear reinforcement, the 1989 Standard compared very well with test results
while the LRFD Code significantly overestimated the shear strength, suggesting that the LRFD
limit is too high.
In regions near supports, the LRFD Code predicts higher values of shear strength than does the
1989 Standard, because the LRFD Code assumes smaller strut angles compared to the 1989

23
Standard, which uses °= 45θ . However, away from the support regions, the concrete
contribution cV is relatively small compared to the shear reinforcement sV , and θ approaches
°45 in both codes. The LRFD Code underestimates cV in these regions, thereby resulting in
lower predicted shear strength than provided by the 1989 Standard.
Shahawy and Batchelor (1996) recognized the appeal of the greater rationality of the modified
compression field theory but questioned if the increased complexity and the greater discrepancy
with test results justify the extensive changes to the code.
24
1.3 Prestressing operations
One of the major advancements in bridge construction in the United States in the second half of
the twentieth century was the development and use of prestressed concrete. Prestressed concrete
bridges offered a broad range of engineering solutions and a variety of aesthetic opportunities.
The following sections describe the history of its development (Section 1.3.1), the structural
concept behind prestressing (Section 1.3.2), the different procedure put in place (Section 1.3.3),
the benefits (Section 1.3.4), and the materials needed and their behaviour (Section 1.3.5).
1.3.1 Historical development of prestressing
Prestressing concrete dates back to 1872 when P. Henry Jackson, an engineer from California,
patented a prestressing system that used a tie rod to construct beams and arches from individual
blocks. His effort was followed in 1888 by C.W. Doehring who obtained a patent in Germany for
prestressing slabs with metal wires. However, none on these early attempts were successful
because of the loss of prestress with time (Nawy, 1996).
After a long lapse of time during which little progress was made, P.E. Dill, of Nebraska,
recognized the effect of the shrinkage and creep of concrete on the loss of prestress. In fact, low
initial jacking stress, combined with high creep and shrinkage of the concrete, eroded the bulk of
the prestressing force applied to the structure, leaving the steel practically ineffective. He
subsequently developed the idea that successive post-tensioning of unbonded rods would
compensate for the time-dependent loss of stress in the rods (Nawy, 1996).
Prestressing continued to develop in particular through the ingenuity of Eugene Freyssinet, of
France, who proposed in 1926 through 1928 methods to overcome prestress losses by the use of
high-strength steels and improved concrete with lower shrinkage and creep (Collins and Mitchell,
1997). Freyssinet is generally considered the father of modern prestressing, and it was his six
bridges across the Marne, in France, built between 1945 and 1950, which established the
technique (Hewson, 2003).
After World War II, it became necessary to reconstruct in a prompt manner many of the main
bridges that were destroyed by war activities. While Eugene Freyssinet continued to design many
new prestressed concrete bridges, Gustave Magnel developed the technique on several notable
structures in Belgium. Y. Guyon of Paris extensively developed and used the concept of
prestressing for the design and construction of numerous bridges in western and central Europe.
25
In Germany, Russia and United States, Fritz Leonhardt, V. Mikhailov and T.Y. Lin were
respectively the leading exponent of prestressed concrete (Nawy, 1996 and Hewson, 2003).
In 1939, Freyssinet introduced the now well-known and well-accepted Freyssinet system
comprising the conical wedge anchor for 12-wire tendons (Nawy, 1996). After 1945, other
systems, such as those produced by Magnel-Blaton, BBRV and Lee-McCall began to appear, as
prestressing of concrete became popular. The early prestressing systems used were comprised of
wires usually 0.2 in (5 mm) or 0.28 in (7 mm) diameter, tensioned and anchored by a gripping
device at the ends that transferred the load to the concrete (Hewson, 2003).
By the early 1960s, the wires were being assembled into strands and anchored by wedges onto an
anchor cone cast into the concrete. This led to the development of the ‘7-wires’ strand, most
commonly used today (Nawy, 1996). Also at this time, large capacity jacks were developed
capable of tensioning large multi-strand cables in one operation. Those tendons began to
dominate the market (Hewson, 2003).
These twentieth-century developments have led to the extensive use of prestressing throughout
the world. Today, buildings, underground structures, towers, stadia, floating storages, offshore
structures, power stations, nuclear reactor vessels, and numerous types of bridge systems all use
prestressed concrete (Collins and Mitchell, 1997 and Nawy, 1996).
1.3.2 Principle of prestressed concrete
In simple terms, prestressing means not only preparing a structure to receive a load by improving
its resistance, but also modifying the behaviour of the members and structures in such way as to
make them more suitable for their intended purposes (Benaim, 2008). Similarly to non-
prestressed concrete, prestressed concrete contains steel reinforcement. The difference lies in the
fact that some of the reinforcement is made out of high-strength steel, tensioned prior to the
application of external loads. This tensioning precompresses the surrounding concrete, allowing it
to resist higher loads prior to cracking (Collins and Mitchell, 1997). It is important to note
however that prestressed member results from self-equilibrating internal stresses: steel is
tensioned and concrete is compressed. The overall prestressed system, alone, is in equilibrium
and no external forces are exerted on it (Collins and Mitchell, 1997).
There are significant differences in principle between reinforced concrete and prestressed
concrete. In the design of reinforced concrete beams, it is assumed that the tensile strength of the
concrete is negligible, and the tensile forces created by the bending moments are resisted by
26
reinforcement, to which the forces are transferred by bond. Cracking and, to a large extent,
deflections are irrecoverable in ordinary reinforced concrete with relatively poor bond between
the steel and concrete, though with high-strength concrete and good bond a substantial degree of
recovery may take place. The reinforcement usually exerts no forces on the member on its own
account (Abeles and Bardhan-Roy, 1981). In prestressed concrete, on the other hand, the primary
purpose of the prestressing steel is to apply a force to the concrete, either by bond or by the means
of special anchoring devices. Hence, the whole of the concrete can be made to act structurally.
The steel required to produce the prestressing force is thus used actively to preload the member.
Cracking and deflections are recoverable to a higher degree (Abeles and Bardhan-Roy, 1981).
Despite the significant differences, there are basic similarities between reinforced and prestressed
concrete. In fact, as the prestress becomes zero, the behaviour of the prestressed member becomes
almost the same as that of a reinforced concrete member. Under overload conditions, as soon as
the flexural strength of the concrete has been exceeded, prestressed concrete behaves in a matter
similar to reinforced concrete, and at the ultimate load or collapse condition of a flexural member,
the tensile and compressive resistances required to withstand these conditions are the same for
both reinforced and prestressed members (Abeles and Bardhan-Roy, 1981).
1.3.3 Different types of prestressing
Prestressing can be applied in two different procedures: pretension and post-tension.
Pretensioning was developed in 1938 by the German engineer E. Hoyer. It involves tensioning
the cables before the concrete is cast and anchoring them to a strengthened mould (Collins and
Mitchell, 1997). Once the concrete has hardened, the cables are released, and retain their tension
by their adherence to the concrete. The tension of tendon is transferred to the concrete increasing
its compression and creating a positive camber. This technique is used principally for the
construction of relatively short span bridge using standard bridge beams (Gerwick, 1993).
Post-tensioning was the procedure used by Freyssinet (Collins and Mitchell, 1997). It consists in
feeding the reinforcing tendons through ducts encased in concrete. Once the concrete cures and
the forms are removed, the tendons are anchored at one end and stressed by jacks reacting against
the concrete at the other end. When the tendons reach the required tension, they are then locked to
the concrete by anchors (Gerwick, 1993).
27
1.3.4 Benefits of prestressing
The possibility of avoiding permanent cracks is one of the major advantages of prestressed
structures. The improved durability, compared to reinforced concrete, is also useful particularly in
members exposed to corrosive atmospheres or aggressive ground conditions, and in marine
structures (Abeles and Bardhan-Roy, 1981).
In addition, much less steel is required, since the weight of the high-strength prestressing steel is
only a fraction of the weight of reinforcement which it replaces. The cross-section of the member
can be smaller, since the whole of the concrete is put to structural use; and the resistance of beams
to shearing and flexural cracks is considerably increased. It is therefore possible to design longer
spans or cantilevers using comparatively shallow and slender sections (Abeles and Bardhan-Roy,
1981). In general, the depth of a prestressed concrete member is usually about 65 to 80 percent
the depth of the equivalent reinforced concrete member. A prestressed member, when compared
with an equivalent reinforced concrete member, requires less concrete, and about 20 to 35 percent
of the amount of steel (Nawy, 1996). The difference in initial cost is, however, not proportional to
the difference in weights of the materials. Steel and concrete, in a prestressed concrete member,
need to have higher strengths and higher quality. The unit costs of such materials are therefore
higher than those required for reinforced concrete construction. Formwork and moulds may be
more expensive, however the forms are reuseable for standard sections, and the additional cost of
prestressing operation itself must be considered. In general, there is little difference between the
initial costs of reinforced and prestressed members provided that large numbers of prestressed
units are required (Abeles and Bardhan-Roy, 1981).
The indirect savings which accrue from prestressed units are often substantial and should be taken
fully into account. They include the reduction, or total avoidance, of maintenance and longer
working life due to the greater durability of the material arising from the absence of permanently
opened cracks; the reduction in the dead weight imposed on the supporting members, and
foundations; the achievement of longer spans and fewer supports; and the reduction in the
structural depths of members (Abeles and Bardhan-Roy, 1981).
1.3.5 Materials of prestressing
As mentioned earlier, materials used in prestressed members require higher strengths and quality.
The basic necessities are outlined in the following section.
28
1.3.5.1 Basic concrete guidelines
Strength and endurance are the two major qualities in prestressed concrete structures. Long-term
effects, such as creep and shrinkage, reduce the prestressing forces. Hence, measures have to be
taken to ensure strict quality control and quality assurance at various stages of production and
construction as well as maintenance (Gerwick, 1993).
Cement and cementitious materials
The almost-universal cementing material for prestressed concrete is Portland cement, Type I, II,
III, or a modification of these. The first type is standard and has relatively wide tolerances in its
chemical constituents. Type II is controlled as to the amount of tricalcium aluminate (C3A), the
percentage of alkalis, and the fineness of grind. It is moderately low in heat generation, and
moderately sulfate-resistant. Type III has a high early strength. The cement is usually selected on
the basis of rapid early strength, minimum shrinkage, durability, and economy.
In prestressed concrete, higher strengths are required and are achievable by decreasing the
water/cement ratios. This decrease also reduces the creep and shrinkage as well as the concrete
permeability and hence minimizes the probability of corrosion of the reinforcement and long-term
deterioration of the concrete itself (Gerwick, 1993).
In order to increase the workability of concrete without jeopardizing the strength and
permeability, High-Range Water-Reducing Admixtures (HRWRA), known as “superplasticizers”,
are introduced to the mix. They make concrete flow with a slump of 8 to 10 inches (200 to 250
mm), with a water/cement ratio below 0.4. Supplementary cementitious materials, such as silica
fume, fly ash and granulate blast furnace slag, are used to enhance rheological and mechanical
properties such as the durability characteristics of the concrete.
Aggregates
In the attempt to get moderately high-strength concrete, the maximum size of coarse aggregate is
somewhat limited to ¾ inch (20 mm) for most applications. Besides limiting the size, aggregates
should be inert, hard, nonporous, non-expansive, clean and should have appropriate shape and
grading. They should not contain deleterious amounts of substances such as salts, sulfates, or
organic compounds. In fact, aggregates influence the strength and durability, and play an
important role in the creep, shrinkage and thermal properties of the concrete. Their proper criteria
are also important: gravel and crushed rock are both used successfully. For normal high-strength
concrete, gravel will give better workability and compatibility at low water/cement ratios. For
29
extremely high-strength concrete, crushed rock of proper angularity is superior but requires very
intensive vibration to achieve proper compaction (Gerwick, 1993).
Water
Until recently the standard requirement for water was merely that it be potable. However, water
used in prestressed work should be more definitely restricted in salt, silt, and organic contents.
Water may be added to the mix in the form of crushed ice, in order to reduce the temperature of
the fresh concrete mix. This would also reduce the maximum temperature during hydration and
thermal strains. In extremely hot weather, the mix can be cooled even further by injecting liquid
nitrogen, and in cold weather, the mixing water may be heated. The optimal temperature of the
fresh mix is from 40 ºF to 50 ºF (4 to 10 ºC). Water should not be introduced to the mix hotter
than 90 ºF (32 ºC) (Gerwick, 1993).
1.3.5.2 Basic steel guidelines
Steel for prestressed concrete must have high tensile strength and adequate ductility. Tendons
must also have the ability to sustain indefinitely a high state of stress with little loss due to
relaxation, corrosion and fatigue. An ideal stress-strain diagram for prestressing steel which meets
the following requirements is shown in Figure 5:
1- The needed high tensile stress must be accompanied by only a small amount of creep.
This is achieved if the permanent elongation at the working stress is small, and the type
of steel for which the stress-strain diagram is linear for a large portion of the ultimate
load is used. This property is measured by the stress which produces a certain permanent
deformation (usually 0.2 percent) on the first loading. Steel suitable for prestressing
should have a high proof stress (Abeles and Bardhan-Roy, 1981).
2- An ultimate elongation of considerable magnitude should be obtained in order to reduce
as much as possible the chance of sudden fracture. Such elongation, with adequate bond,
for prestressing wire and strand should range between 3 and 5 percent (Abeles and
Bardhan-Roy, 1981).

30
Figure 5: Ideal stress-strain diagram for prestressing steel [Adapted from Abeles and Bardhan-Roy, 1981]
Cold-drawn steel wire, alloy steel wire and bars have these attributes and are most common
materials for tendons. Cold-drawn steel wire is produced in diameters up to 0.276 inch (0.7 mm).
It has ultimate strength ranging from 250 to 300 ksi (1,725 to 2,070 MPa), and moduli of
elasticity about 29,000 ksi (200 MPa).
Since the bond between smooth wires and concrete is low, weaving several wires into a strand
gives a tendon of substantial capacity and excellent bonding capacity. Seven-wire strand is widely
used both in pretensioning and post-tensioning. Strands are manufactured in diameters of 0.25 to
0.6 inch (6 to 15.2 mm). The most commonly used ones are the 0.6 in (15.2 mm) strand
(Gerwick, 1993).
The properties of standard prestressing strands, wires, and bars conforming to the American
Society for Testing and Materials (ASTM) Standard A416, A421, and A722, or to CSA Standard
G279, are given in Table 6. Table 7 presents the required characteristics of prestressing tendons
as specified by the ASTM Standards.
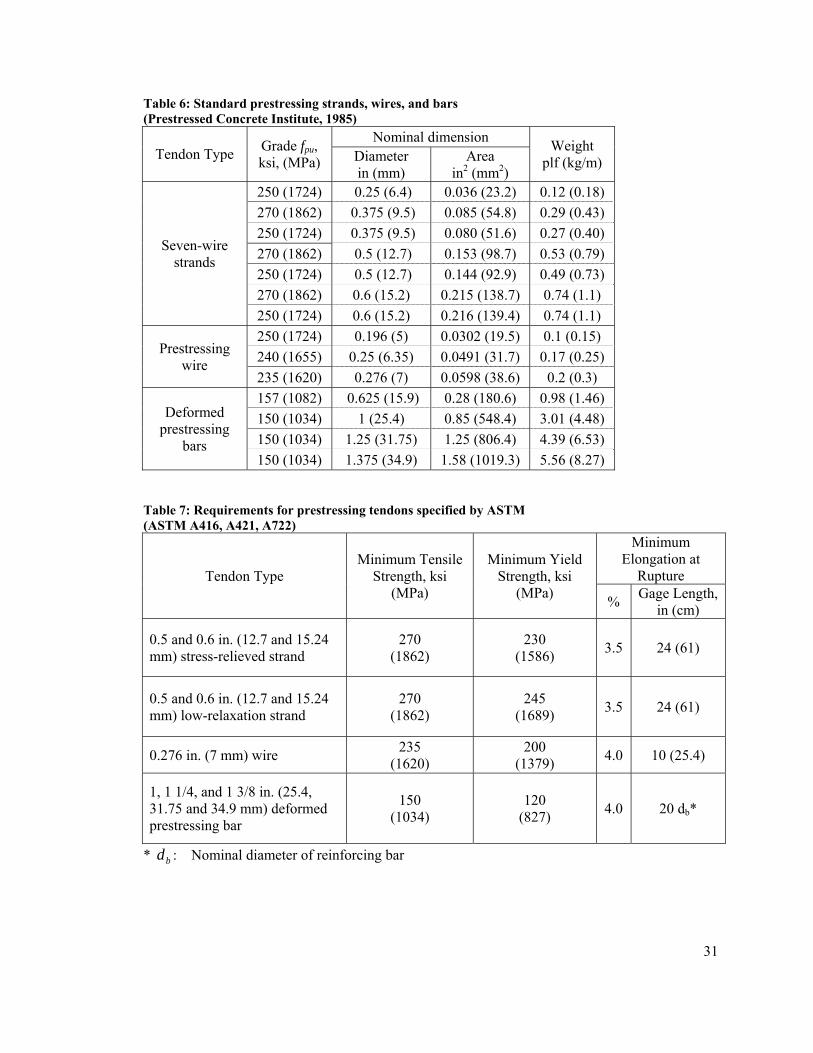
31
Table 6: Standard prestressing strands, wires, and bars (Prestressed Concrete Institute, 1985)
Tendon Type Grade fpu, ksi, (MPa)
Nominal dimension Weight plf (kg/m) Diameter
in (mm) Area
in2 (mm2)
Seven-wire strands
250 (1724) 0.25 (6.4) 0.036 (23.2) 0.12 (0.18) 270 (1862) 0.375 (9.5) 0.085 (54.8) 0.29 (0.43) 250 (1724) 0.375 (9.5) 0.080 (51.6) 0.27 (0.40) 270 (1862) 0.5 (12.7) 0.153 (98.7) 0.53 (0.79) 250 (1724) 0.5 (12.7) 0.144 (92.9) 0.49 (0.73) 270 (1862) 0.6 (15.2) 0.215 (138.7) 0.74 (1.1) 250 (1724) 0.6 (15.2) 0.216 (139.4) 0.74 (1.1)
Prestressing wire
250 (1724) 0.196 (5) 0.0302 (19.5) 0.1 (0.15) 240 (1655) 0.25 (6.35) 0.0491 (31.7) 0.17 (0.25) 235 (1620) 0.276 (7) 0.0598 (38.6) 0.2 (0.3)
Deformed prestressing
bars
157 (1082) 0.625 (15.9) 0.28 (180.6) 0.98 (1.46) 150 (1034) 1 (25.4) 0.85 (548.4) 3.01 (4.48) 150 (1034) 1.25 (31.75) 1.25 (806.4) 4.39 (6.53) 150 (1034) 1.375 (34.9) 1.58 (1019.3) 5.56 (8.27)
Table 7: Requirements for prestressing tendons specified by ASTM (ASTM A416, A421, A722)
Tendon Type Minimum Tensile
Strength, ksi (MPa)
Minimum Yield Strength, ksi
(MPa)
Minimum Elongation at
Rupture
% Gage Length, in (cm)
0.5 and 0.6 in. (12.7 and 15.24 mm) stress-relieved strand
270 (1862)
230 (1586) 3.5 24 (61)
0.5 and 0.6 in. (12.7 and 15.24 mm) low-relaxation strand
270 (1862)
245 (1689) 3.5 24 (61)
0.276 in. (7 mm) wire 235 (1620)
200 (1379) 4.0 10 (25.4)
1, 1 1/4, and 1 3/8 in. (25.4, 31.75 and 34.9 mm) deformed prestressing bar
150 (1034)
120 (827) 4.0 20 db*
* bd : Nominal diameter of reinforcing bar
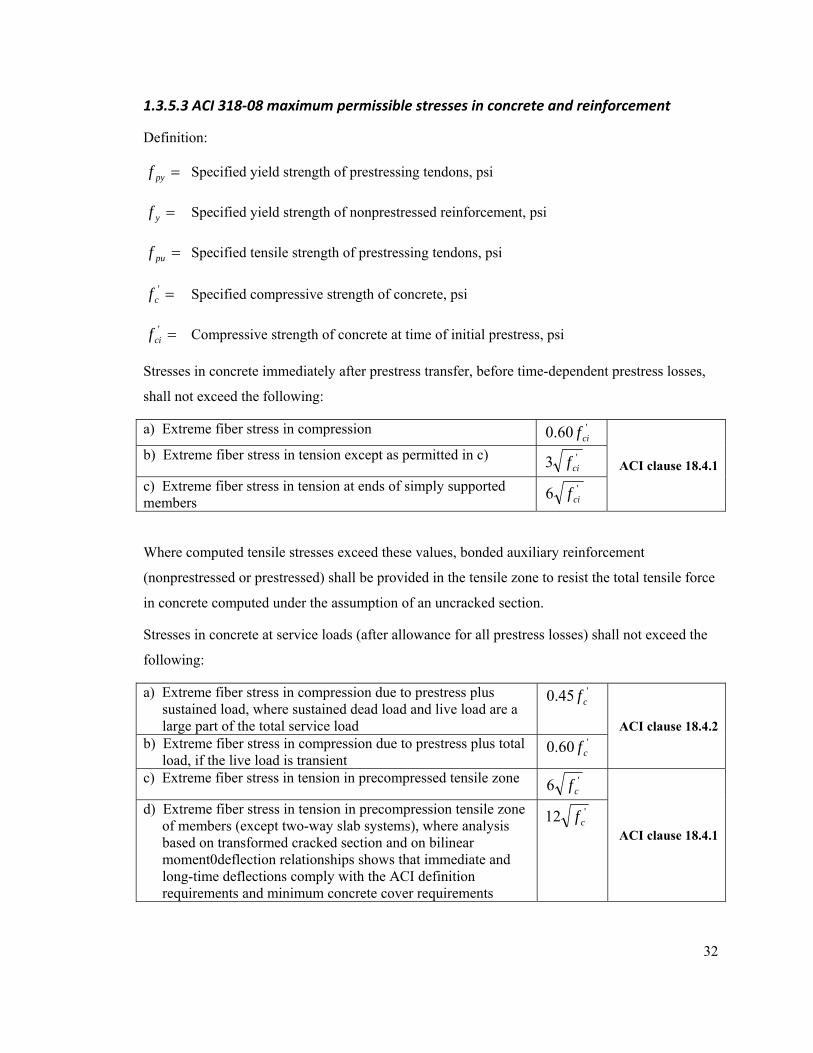
32
1.3.5.3 ACI 318‐08 maximum permissible stresses in concrete and reinforcement
Definition:
=pyf Specified yield strength of prestressing tendons, psi
=yf Specified yield strength of nonprestressed reinforcement, psi
=puf Specified tensile strength of prestressing tendons, psi
='cf Specified compressive strength of concrete, psi
='cif Compressive strength of concrete at time of initial prestress, psi
Stresses in concrete immediately after prestress transfer, before time-dependent prestress losses,
shall not exceed the following:
a) Extreme fiber stress in compression '60.0 cif
ACI clause 18.4.1 b) Extreme fiber stress in tension except as permitted in c) '3 cif c) Extreme fiber stress in tension at ends of simply supported members
'6 cif
Where computed tensile stresses exceed these values, bonded auxiliary reinforcement
(nonprestressed or prestressed) shall be provided in the tensile zone to resist the total tensile force
in concrete computed under the assumption of an uncracked section.
Stresses in concrete at service loads (after allowance for all prestress losses) shall not exceed the
following:
a) Extreme fiber stress in compression due to prestress plus sustained load, where sustained dead load and live load are a large part of the total service load
'45.0 cf
ACI clause 18.4.2 b) Extreme fiber stress in compression due to prestress plus total
load, if the live load is transient '60.0 cf
c) Extreme fiber stress in tension in precompressed tensile zone '6 cf
ACI clause 18.4.1
d) Extreme fiber stress in tension in precompression tensile zone of members (except two-way slab systems), where analysis based on transformed cracked section and on bilinear moment0deflection relationships shows that immediate and long-time deflections comply with the ACI definition requirements and minimum concrete cover requirements
'12 cf
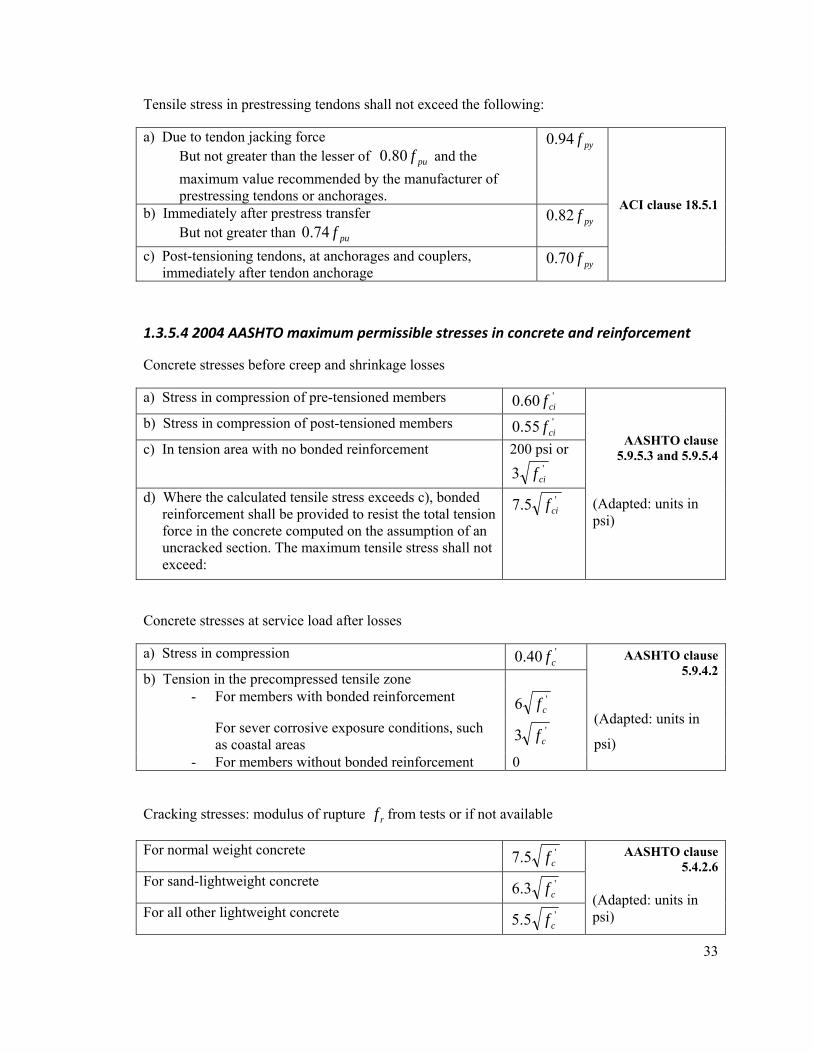
33
Tensile stress in prestressing tendons shall not exceed the following:
a) Due to tendon jacking force But not greater than the lesser of puf80.0 and the maximum value recommended by the manufacturer of prestressing tendons or anchorages.
pyf94.0
ACI clause 18.5.1 b) Immediately after prestress transfer But not greater than puf74.0
pyf82.0
c) Post-tensioning tendons, at anchorages and couplers, immediately after tendon anchorage
pyf70.0
1.3.5.4 2004 AASHTO maximum permissible stresses in concrete and reinforcement
Concrete stresses before creep and shrinkage losses
a) Stress in compression of pre-tensioned members '60.0 cif
AASHTO clause 5.9.5.3 and 5.9.5.4
(Adapted: units in psi)
b) Stress in compression of post-tensioned members '55.0 cif c) In tension area with no bonded reinforcement 200 psi or
'3 cif d) Where the calculated tensile stress exceeds c), bonded
reinforcement shall be provided to resist the total tension force in the concrete computed on the assumption of an uncracked section. The maximum tensile stress shall not exceed:
'5.7 cif
Concrete stresses at service load after losses
a) Stress in compression '40.0 cf AASHTO clause 5.9.4.2
(Adapted: units in
psi)
b) Tension in the precompressed tensile zone - For members with bonded reinforcement '6 cf
For sever corrosive exposure conditions, such as coastal areas
'3 cf
- For members without bonded reinforcement 0
Cracking stresses: modulus of rupture rf from tests or if not available
For normal weight concrete '5.7 cf AASHTO clause 5.4.2.6
(Adapted: units in psi)
For sand-lightweight concrete '3.6 cf For all other lightweight concrete '5.5 cf
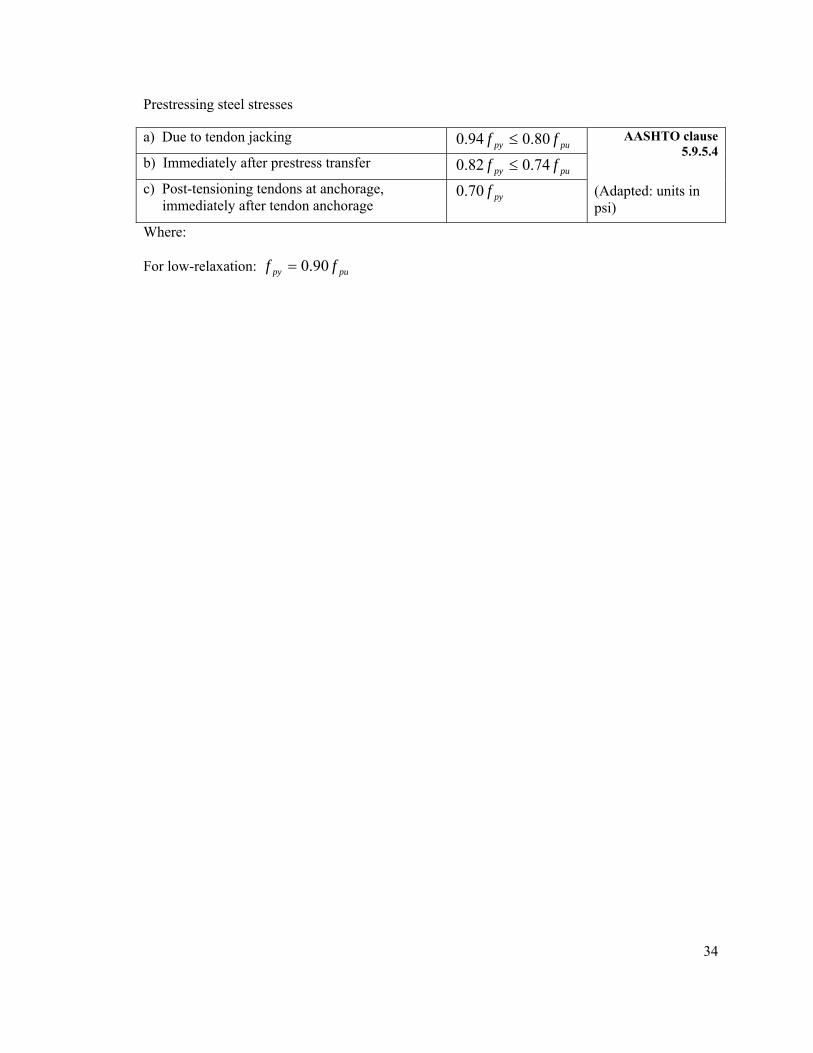
34
Prestressing steel stresses
a) Due to tendon jacking pupy ff 80.094.0 ≤ AASHTO clause
5.9.5.4 (Adapted: units in psi)
b) Immediately after prestress transfer pupy ff 74.082.0 ≤
c) Post-tensioning tendons at anchorage, immediately after tendon anchorage
pyf70.0
Where:
For low-relaxation: pupy ff 90.0=
35
1.4 Precasting
The following sections will look into the benefits of precasting, also known as prefabrication
(Section 1.4.1), the general method used in precast shops (Section 1.4.2), and the few techniques
used to make this practice efficient (Section 1.4.3). Section 1.4.4 presents a research conducted by
Mokhtarzadeh and French (2000) comparing different HPC attributes and mixtures.
1.4.1 Benefits of precasting
In 2001, the AASHTO Technology Implementation Group chose prefabricated bridge elements
and systems as one of the innovative technologies that promised the highest payoff. The FHWA
(Federal Highway Administration) – through its Innovative Bridge Research and Construction
program and the Resource Center – also championed prefabrication for accelerated construction.
Their vision was to solve bridge deterioration with accelerated construction through increased
prefabrication. As a matter of fact, prefabrication technology carries many advantages for bridge
owners, engineers, builders, and the traveling public (Naito, Brunn, Parent and Tate, 2005).
In the case of precast construction there are savings in formwork assembly, concrete casting, and
curing offsite in the controlled environment of a precast plant. In addition to the more rapid
construction on site, the quality of the components is improved, translating into lower longer
service life and lower life-cycle costs. Shipment of precast components to the job site rather than
cast-in-place construction also reduces transportation costs and the impact on the environment
(Naito, Brunn, Parent and Tate, 2005).
From a design point of view, fewer constraints, such as extreme elevations, long stretches over
water, and tight urban work zones, are to be considered and overcome. Safety is also improved
because of the reduced time exposure for workers and public who travel through construction
zones. Moreover, prefabricating takes elements and systems out of the critical path of a project
schedule (Naito, Brunn, Parent and Tate, 2005).
All factors put together, prefabrication makes some bridge design, whether involving a new
construction or rehabilitation, more feasible, affordable and constructible.
1.4.2 Production methods
Precasting plants follow a conventional method of fabrication. In order to be productive and
competitive, a cycle should not take more than 24 hours to be completed. It involves setting up
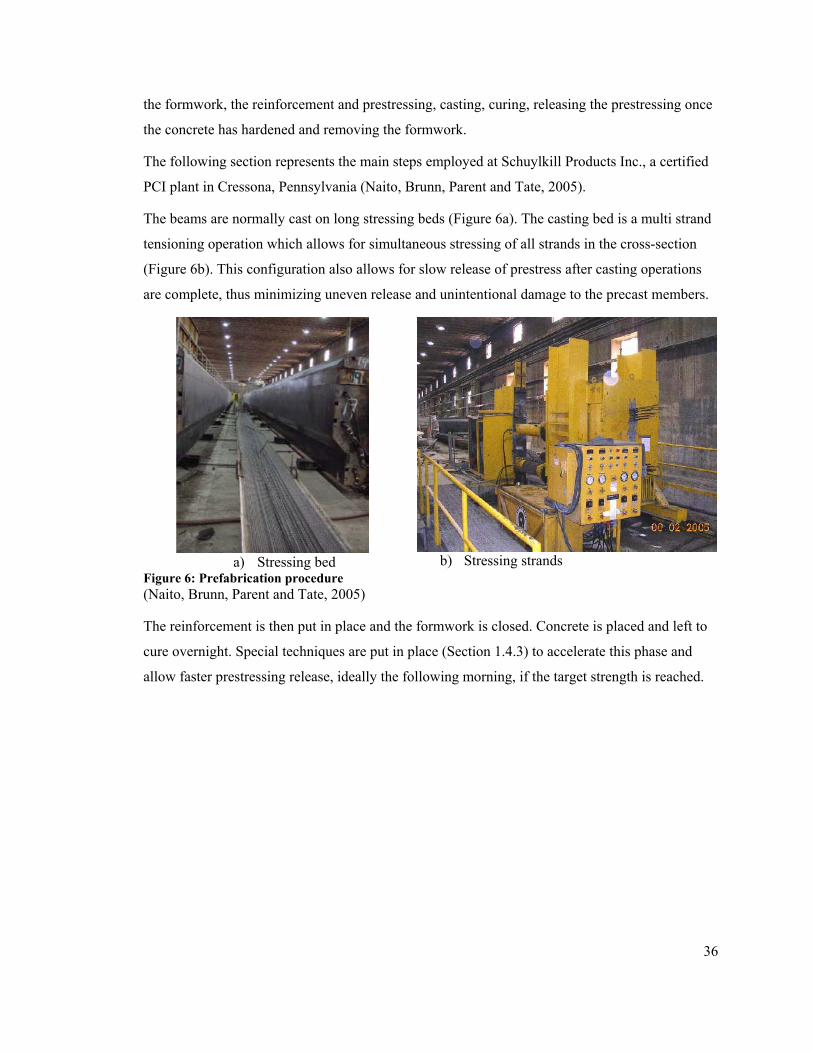
36
the formwork, the reinforcement and prestressing, casting, curing, releasing the prestressing once
the concrete has hardened and removing the formwork.
The following section represents the main steps employed at Schuylkill Products Inc., a certified
PCI plant in Cressona, Pennsylvania (Naito, Brunn, Parent and Tate, 2005).
The beams are normally cast on long stressing beds (Figure 6a). The casting bed is a multi strand
tensioning operation which allows for simultaneous stressing of all strands in the cross-section
(Figure 6b). This configuration also allows for slow release of prestress after casting operations
are complete, thus minimizing uneven release and unintentional damage to the precast members.
a) Stressing bed
b) Stressing strands
Figure 6: Prefabrication procedure (Naito, Brunn, Parent and Tate, 2005)
The reinforcement is then put in place and the formwork is closed. Concrete is placed and left to
cure overnight. Special techniques are put in place (Section 1.4.3) to accelerate this phase and
allow faster prestressing release, ideally the following morning, if the target strength is reached.
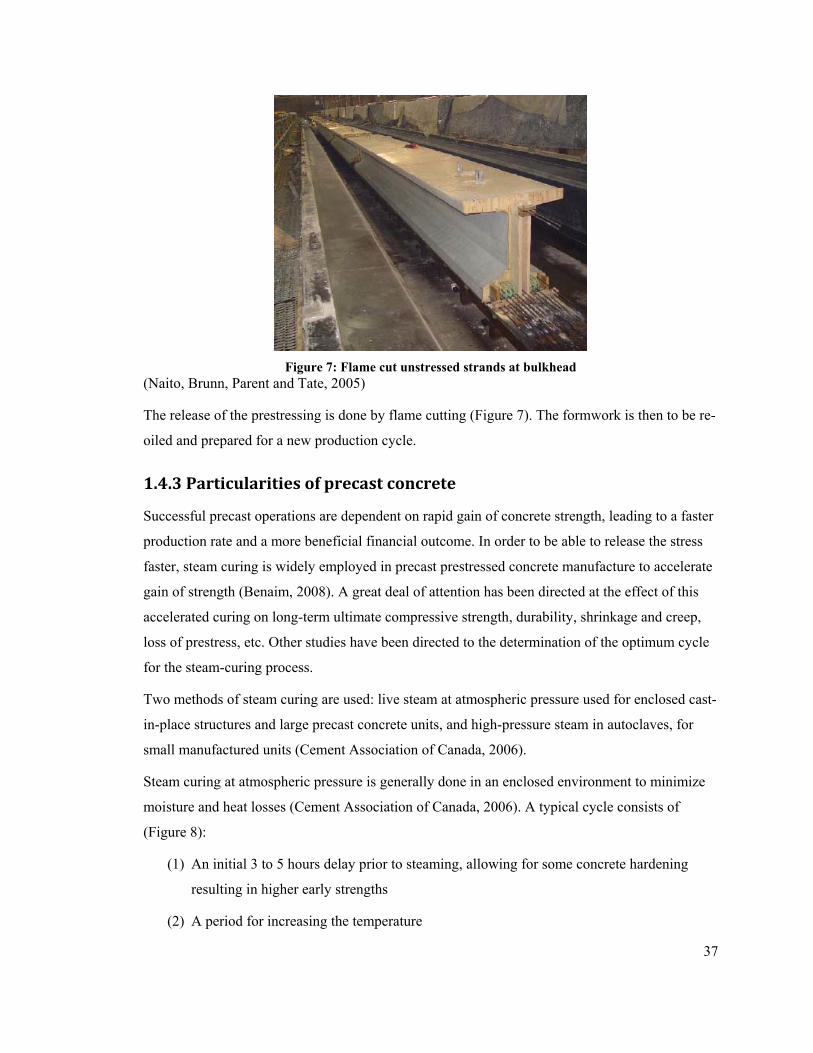
37
Figure 7: Flame cut unstressed strands at bulkhead
(Naito, Brunn, Parent and Tate, 2005)
The release of the prestressing is done by flame cutting (Figure 7). The formwork is then to be re-
oiled and prepared for a new production cycle.
1.4.3 Particularities of precast concrete
Successful precast operations are dependent on rapid gain of concrete strength, leading to a faster
production rate and a more beneficial financial outcome. In order to be able to release the stress
faster, steam curing is widely employed in precast prestressed concrete manufacture to accelerate
gain of strength (Benaim, 2008). A great deal of attention has been directed at the effect of this
accelerated curing on long-term ultimate compressive strength, durability, shrinkage and creep,
loss of prestress, etc. Other studies have been directed to the determination of the optimum cycle
for the steam-curing process.
Two methods of steam curing are used: live steam at atmospheric pressure used for enclosed cast-
in-place structures and large precast concrete units, and high-pressure steam in autoclaves, for
small manufactured units (Cement Association of Canada, 2006).
Steam curing at atmospheric pressure is generally done in an enclosed environment to minimize
moisture and heat losses (Cement Association of Canada, 2006). A typical cycle consists of
(Figure 8):
(1) An initial 3 to 5 hours delay prior to steaming, allowing for some concrete hardening
resulting in higher early strengths
(2) A period for increasing the temperature
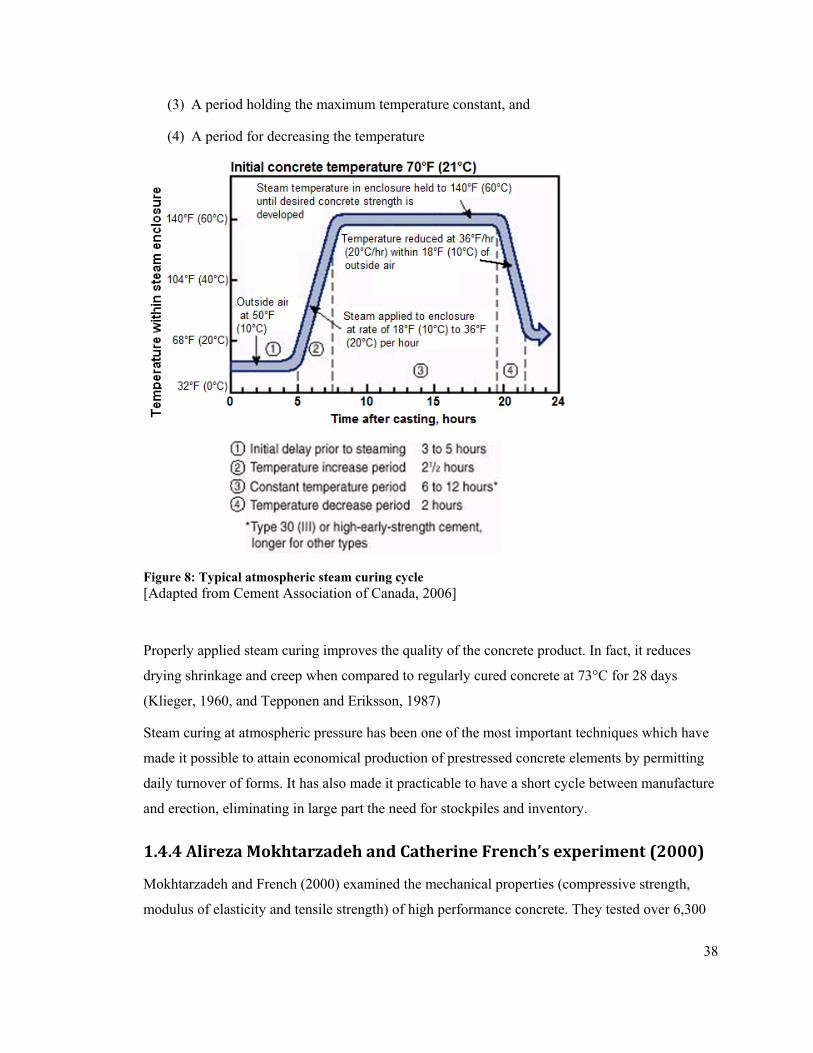
38
(3) A period holding the maximum temperature constant, and
(4) A period for decreasing the temperature
Figure 8: Typical atmospheric steam curing cycle [Adapted from Cement Association of Canada, 2006]
Properly applied steam curing improves the quality of the concrete product. In fact, it reduces
drying shrinkage and creep when compared to regularly cured concrete at 73°C for 28 days
(Klieger, 1960, and Tepponen and Eriksson, 1987)
Steam curing at atmospheric pressure has been one of the most important techniques which have
made it possible to attain economical production of prestressed concrete elements by permitting
daily turnover of forms. It has also made it practicable to have a short cycle between manufacture
and erection, eliminating in large part the need for stockpiles and inventory.
1.4.4 Alireza Mokhtarzadeh and Catherine French’s experiment (2000)
Mokhtarzadeh and French (2000) examined the mechanical properties (compressive strength,
modulus of elasticity and tensile strength) of high performance concrete. They tested over 6,300
39
specimens from 142 HPC mixtures with 28-day compressive strengths in range of 8,000 to
18,600 psi (55.2 to 128.2 MPa). The material variables included the following:
- Composition of cementitious material: ASTM C 150 portlant cement and combinations of
ASTM C 68 Class C fly ash and silica fume different percentages
- Type and brand of cement (Types I and III from two different brands)
- Type of silica fume: dry-densified and slurry
- Type and brand of superplasticizer: five types
- Type and source of coarse aggregates: high and low-absorption limestone, granites, round
and crushed river gravel
- Aggregate gradation
- Maximum aggregate size: ½ and ¾ in (12.7 and 19 mm)
For each specimen cured in standard lime-saturated water, a companion specimen was heat-cured
in a monitored electronically-controlled environmental chamber. After casting, the curing routine
was: 3 hours at room temperature followed by a 2.5 hours period to increase the temperature from
120°F to 160°F (49°C to 71°C); the temperature was then to be kept constant over 12 hours to
finally return to room temperature over a 2 hours period.
Heat-cured specimens yielded higher early-age compressive strengths than moist-cured
specimens. At later ages, however, continuous application of moisture resulted in the continued
increase in compressive strength of moist-cured specimens, whereas the strength of the heat-cured
specimens levelled off.
Mokhtarzadeh and French also showed that moist-curing was essential for getting full advantage
of using fly ash in a mixture. In the absence of adequate moisture, any benefit from inclusion of
fly ash was limited to grain refinement of the cement matrix. Moist-cured specimens also proved
to have an increasing modulus of elasticity with time. In fact, at 182 and 365 days of age, moist-
cured cylinders had, 106 and 108% of the 28-day compressive strength value, whereas the heat-
cured were only at 94 and 96%, respectively.
The compressive strength developed at early ages was higher for moist-cured concrete made with
rapid hardening portlant cement (Type III) than for ordinary portlant cement (Type I).
40
1.5 Selfconsolidating concrete
Concrete placement in precast plants can be time consuming and lead to unsatisfactory results if
vibrations are not done properly. One innovative solution may lie in the use of a highly flowable
self-consolidating concrete (SCC) mix.
1.5.1 SCC characteristics
SCC is a non-segregating concrete that can flow and fill formwork without any mechanical
vibration. This highly flowable concrete was developed in Japan in the1980s as a solution to
improve the constructability of reinforced concrete structures (Ozyildirim and Lane, 2003). Since
no mechanical vibration is needed when placing this concrete, significant savings in labour costs
and construction time can be achieved. SCC also has the potential of increasing durability and
quality resulting in a lower cost of construction. Further advantages include noise reduction
during construction and a reduction of surface defects leading to a more appealing architectural
finish (Gurjar, 2004).
A typical SCC mix is designed by ensuring a proper flowability and viscosity in the fresh state
(Ozyildirim and Lane, 2003). Flowability is normally achieved by using high-range water-
reducing admixtures (HRWRA) while viscosity is ensured by using a proper selection of fines
and aggregates and by using a viscosity modifying admixture (VMA). The flowability of the
product allows for placement in members with high amount of reinforcement congestion. The use
of conventional concretes in this situation would require significant mechanical vibration and
could result in a risk of honeycomb formation.
On the other hand, self-consolidating concrete also has the potential of lowering the permeability
of the concrete resulting in reduced durability and an increase of the life-cycle costs.
1.5.2 Testing freshstate properties of SCC
Several methods can be used to evaluate the various properties of SCC in the fresh state. Tests
can be broadly split into two categories: free flow tests and restricted flow tests. These procedures
enable an assessment of the filling ability, passing ability, and segregation resistance of SCC.
Among the most common tests for assessing the free deformability of SCC is the slump flow test.
Methods that are typically used to assess the restricted deformability include the L-box and the J-
ring tests. Other tests, such as column segregation, surface settlement and rheology tests are
covered in the following section.
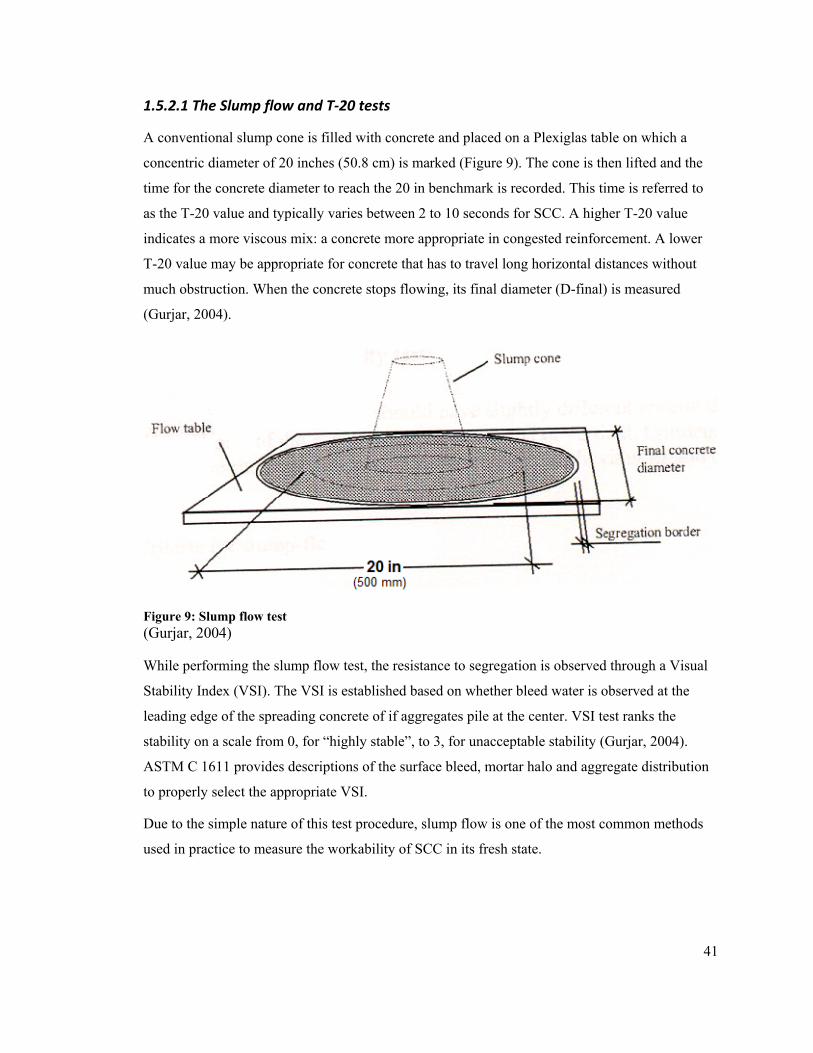
41
1.5.2.1 The Slump flow and T‐20 tests
A conventional slump cone is filled with concrete and placed on a Plexiglas table on which a
concentric diameter of 20 inches (50.8 cm) is marked (Figure 9). The cone is then lifted and the
time for the concrete diameter to reach the 20 in benchmark is recorded. This time is referred to
as the T-20 value and typically varies between 2 to 10 seconds for SCC. A higher T-20 value
indicates a more viscous mix: a concrete more appropriate in congested reinforcement. A lower
T-20 value may be appropriate for concrete that has to travel long horizontal distances without
much obstruction. When the concrete stops flowing, its final diameter (D-final) is measured
(Gurjar, 2004).
Figure 9: Slump flow test (Gurjar, 2004)
While performing the slump flow test, the resistance to segregation is observed through a Visual
Stability Index (VSI). The VSI is established based on whether bleed water is observed at the
leading edge of the spreading concrete of if aggregates pile at the center. VSI test ranks the
stability on a scale from 0, for “highly stable”, to 3, for unacceptable stability (Gurjar, 2004).
ASTM C 1611 provides descriptions of the surface bleed, mortar halo and aggregate distribution
to properly select the appropriate VSI.
Due to the simple nature of this test procedure, slump flow is one of the most common methods
used in practice to measure the workability of SCC in its fresh state.
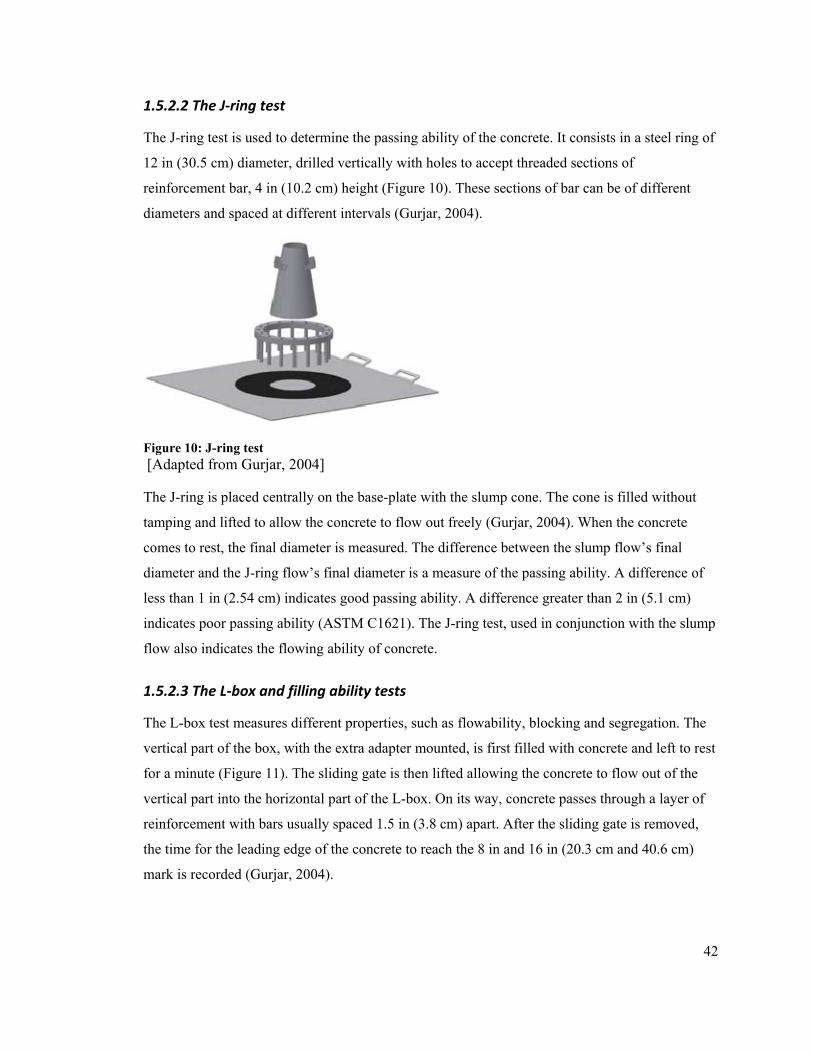
42
1.5.2.2 The J‐ring test
The J-ring test is used to determine the passing ability of the concrete. It consists in a steel ring of
12 in (30.5 cm) diameter, drilled vertically with holes to accept threaded sections of
reinforcement bar, 4 in (10.2 cm) height (Figure 10). These sections of bar can be of different
diameters and spaced at different intervals (Gurjar, 2004).
Figure 10: J-ring test [Adapted from Gurjar, 2004]
The J-ring is placed centrally on the base-plate with the slump cone. The cone is filled without
tamping and lifted to allow the concrete to flow out freely (Gurjar, 2004). When the concrete
comes to rest, the final diameter is measured. The difference between the slump flow’s final
diameter and the J-ring flow’s final diameter is a measure of the passing ability. A difference of
less than 1 in (2.54 cm) indicates good passing ability. A difference greater than 2 in (5.1 cm)
indicates poor passing ability (ASTM C1621). The J-ring test, used in conjunction with the slump
flow also indicates the flowing ability of concrete.
1.5.2.3 The L‐box and filling ability tests
The L-box test measures different properties, such as flowability, blocking and segregation. The
vertical part of the box, with the extra adapter mounted, is first filled with concrete and left to rest
for a minute (Figure 11). The sliding gate is then lifted allowing the concrete to flow out of the
vertical part into the horizontal part of the L-box. On its way, concrete passes through a layer of
reinforcement with bars usually spaced 1.5 in (3.8 cm) apart. After the sliding gate is removed,
the time for the leading edge of the concrete to reach the 8 in and 16 in (20.3 cm and 40.6 cm)
mark is recorded (Gurjar, 2004).
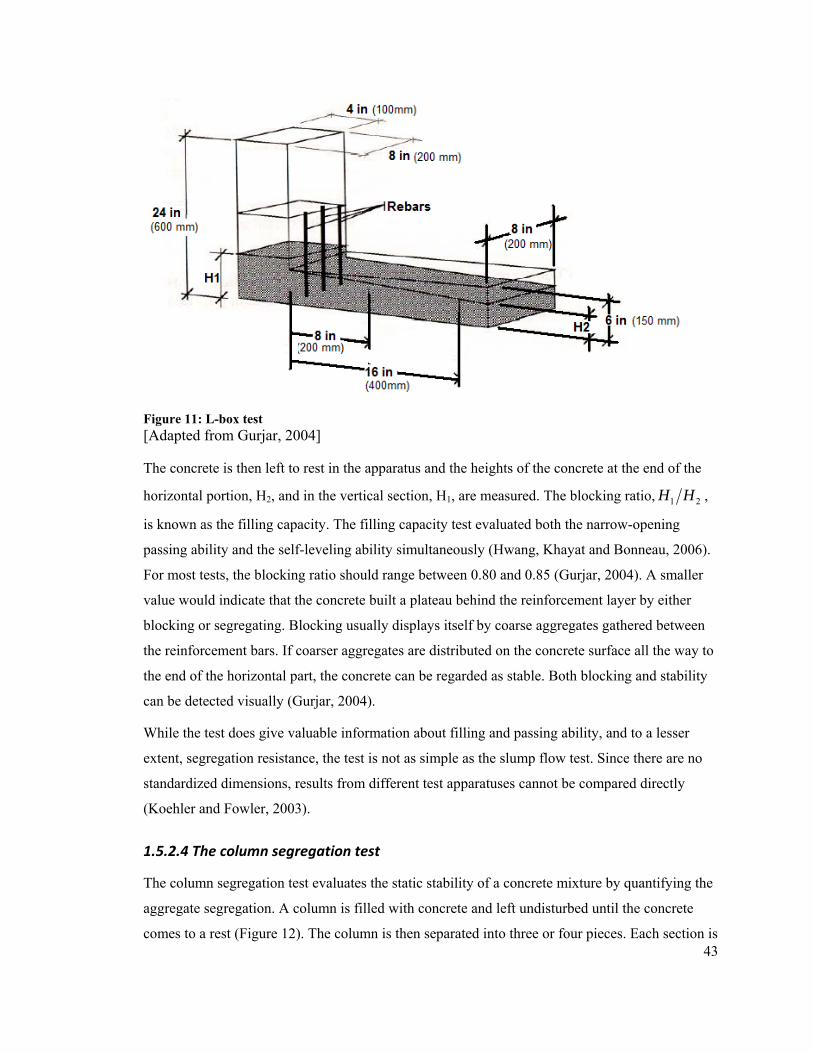
43
Figure 11: L-box test [Adapted from Gurjar, 2004]
The concrete is then left to rest in the apparatus and the heights of the concrete at the end of the
horizontal portion, H2, and in the vertical section, H1, are measured. The blocking ratio, 21 HH ,
is known as the filling capacity. The filling capacity test evaluated both the narrow-opening
passing ability and the self-leveling ability simultaneously (Hwang, Khayat and Bonneau, 2006).
For most tests, the blocking ratio should range between 0.80 and 0.85 (Gurjar, 2004). A smaller
value would indicate that the concrete built a plateau behind the reinforcement layer by either
blocking or segregating. Blocking usually displays itself by coarse aggregates gathered between
the reinforcement bars. If coarser aggregates are distributed on the concrete surface all the way to
the end of the horizontal part, the concrete can be regarded as stable. Both blocking and stability
can be detected visually (Gurjar, 2004).
While the test does give valuable information about filling and passing ability, and to a lesser
extent, segregation resistance, the test is not as simple as the slump flow test. Since there are no
standardized dimensions, results from different test apparatuses cannot be compared directly
(Koehler and Fowler, 2003).
1.5.2.4 The column segregation test
The column segregation test evaluates the static stability of a concrete mixture by quantifying the
aggregate segregation. A column is filled with concrete and left undisturbed until the concrete
comes to a rest (Figure 12). The column is then separated into three or four pieces. Each section is
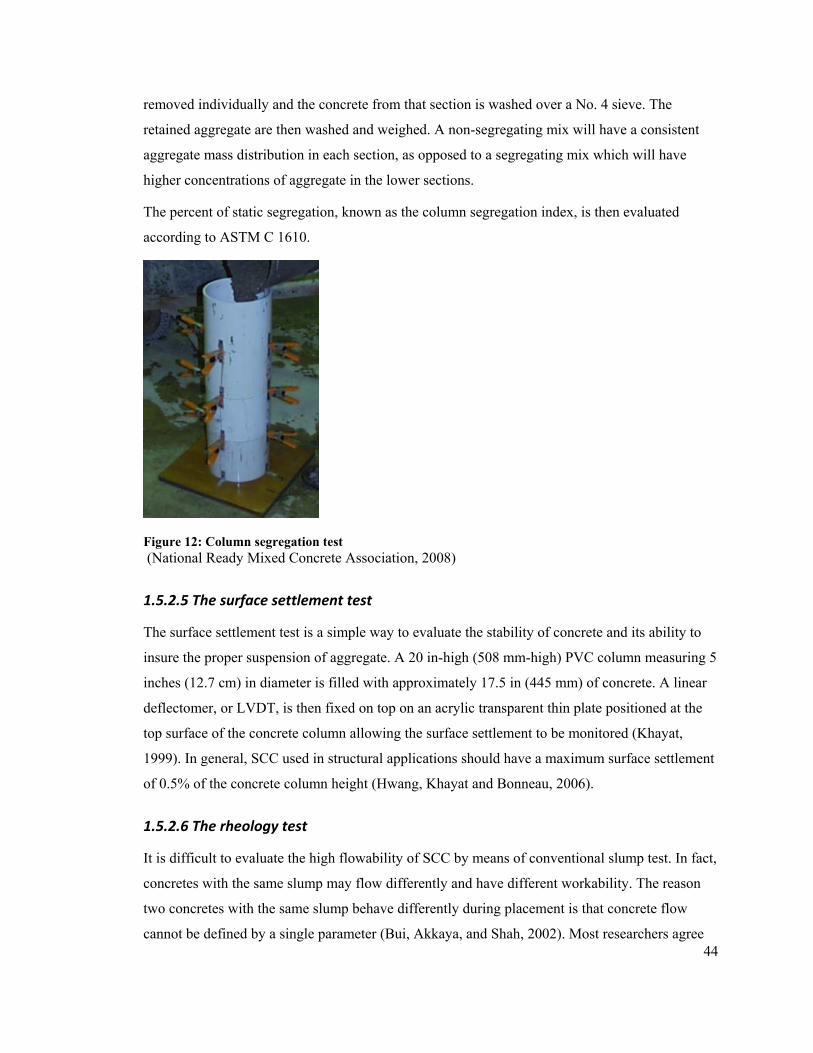
44
removed individually and the concrete from that section is washed over a No. 4 sieve. The
retained aggregate are then washed and weighed. A non-segregating mix will have a consistent
aggregate mass distribution in each section, as opposed to a segregating mix which will have
higher concentrations of aggregate in the lower sections.
The percent of static segregation, known as the column segregation index, is then evaluated
according to ASTM C 1610.
Figure 12: Column segregation test (National Ready Mixed Concrete Association, 2008)
1.5.2.5 The surface settlement test
The surface settlement test is a simple way to evaluate the stability of concrete and its ability to
insure the proper suspension of aggregate. A 20 in-high (508 mm-high) PVC column measuring 5
inches (12.7 cm) in diameter is filled with approximately 17.5 in (445 mm) of concrete. A linear
deflectomer, or LVDT, is then fixed on top on an acrylic transparent thin plate positioned at the
top surface of the concrete column allowing the surface settlement to be monitored (Khayat,
1999). In general, SCC used in structural applications should have a maximum surface settlement
of 0.5% of the concrete column height (Hwang, Khayat and Bonneau, 2006).
1.5.2.6 The rheology test
It is difficult to evaluate the high flowability of SCC by means of conventional slump test. In fact,
concretes with the same slump may flow differently and have different workability. The reason
two concretes with the same slump behave differently during placement is that concrete flow
cannot be defined by a single parameter (Bui, Akkaya, and Shah, 2002). Most researchers agree
45
that the flow of concrete can be described reasonably well using a Bingham equation, a linear
function of the shear stress (the concrete response) versus shear rate (Banfill, et al., 2000):
•
= γητ
Where:
=τ Shear stress
=η •+γ
τμ o = Viscosity of the Bingham fluid ( )sPa ⋅
=μ Plastic velocity ( )sPa ⋅
=oτ Yield value ( )Pa
=•
γ Rate of shear ( )s1
The yield stress and the plastic viscosity are two parameters provided by the Bingham equation.
The yield stress correlates reasonably well with the slump value, but the plastic viscosity cannot
be measured using the slump test. In fact, plastic viscosity governs the concrete flow behaviour
once the flow has started, i.e., after the yield stress is overcome. The existence of the plastic
viscosity justifies the different behaviours of concrete, with the same slump, during placements
(Banfill, et al., 2000).
The parameters needed in Bingham equation are measured using an instrumented and automated
apparatus, known as rheometer (Figure 13). This instrument, developed in Canada by D. Beaupré
and S. Mindess, was developed from the Tattershall MK III. It is applicable to concretes with a
large range of workability, and has been successfully used for SCC, HPC, pumped concrete, dry
and wet-process shotcrete, fiber reinforced concrete, and normal concrete. It has also been used
on a few job sites as a mean of quality control.
The apparatus is fully automated and uses a data acquisition system to drive an impeller rotating
in fresh concrete. The test parameters are easy to modify in order to produce any required test
sequence. The analysis of the results is also automated and the rheological parameters, yield
stress and plastic viscosity, are displayed on the computer screen, along with the coefficient of
correlation from the linear Bingham behaviour.
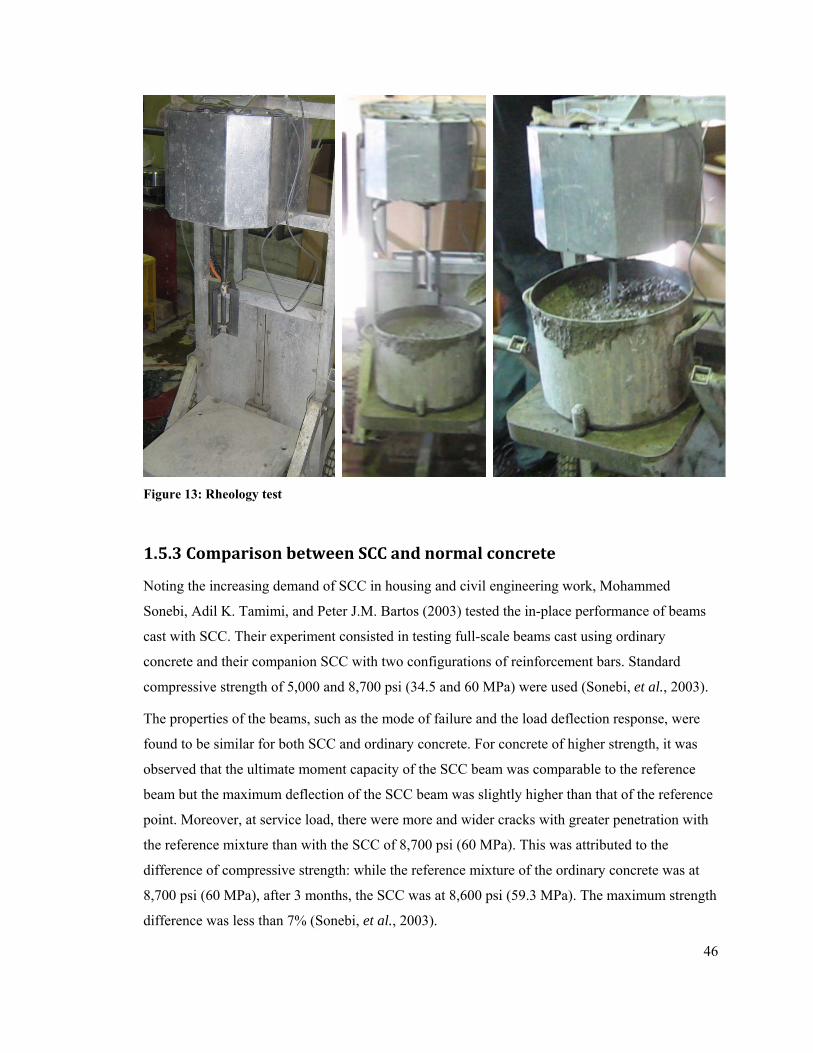
46
Figure 13: Rheology test
1.5.3 Comparison between SCC and normal concrete
Noting the increasing demand of SCC in housing and civil engineering work, Mohammed
Sonebi, Adil K. Tamimi, and Peter J.M. Bartos (2003) tested the in-place performance of beams
cast with SCC. Their experiment consisted in testing full-scale beams cast using ordinary
concrete and their companion SCC with two configurations of reinforcement bars. Standard
compressive strength of 5,000 and 8,700 psi (34.5 and 60 MPa) were used (Sonebi, et al., 2003).
The properties of the beams, such as the mode of failure and the load deflection response, were
found to be similar for both SCC and ordinary concrete. For concrete of higher strength, it was
observed that the ultimate moment capacity of the SCC beam was comparable to the reference
beam but the maximum deflection of the SCC beam was slightly higher than that of the reference
point. Moreover, at service load, there were more and wider cracks with greater penetration with
the reference mixture than with the SCC of 8,700 psi (60 MPa). This was attributed to the
difference of compressive strength: while the reference mixture of the ordinary concrete was at
8,700 psi (60 MPa), after 3 months, the SCC was at 8,600 psi (59.3 MPa). The maximum strength
difference was less than 7% (Sonebi, et al., 2003).

47
1.6 Objectives of this Research Program
The main objective of this research program is to investigate the applicability of existing design
provisions provided by the AASHTO specifications, for the use of SCC in precast pretensioned
bridge girders. The following aspects will be examined:
• The effect of SCC on the ease of casting, surface quality, heat generation, etc.
• The effect of SCC on the shear capacity
• The effect of SCC on crack formation
• The effect of high strength SCC on the shear capacity
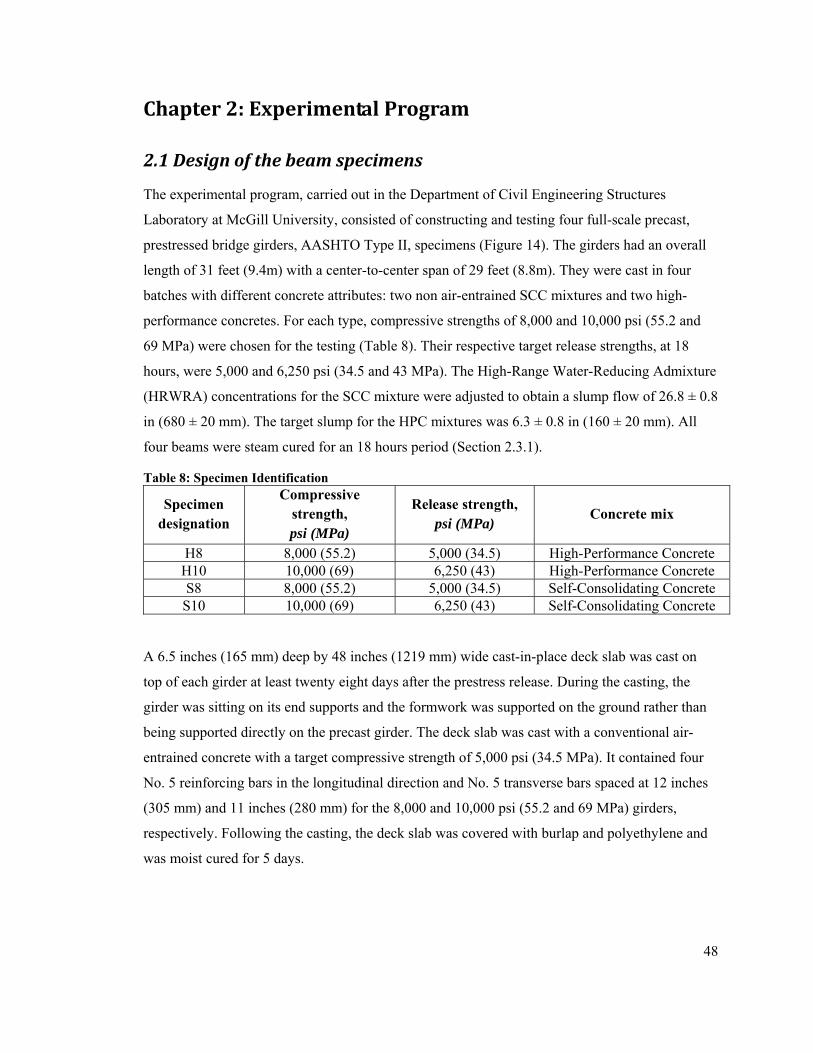
48
Chapter 2: Experimental Program
2.1 Design of the beam specimens
The experimental program, carried out in the Department of Civil Engineering Structures
Laboratory at McGill University, consisted of constructing and testing four full-scale precast,
prestressed bridge girders, AASHTO Type II, specimens (Figure 14). The girders had an overall
length of 31 feet (9.4m) with a center-to-center span of 29 feet (8.8m). They were cast in four
batches with different concrete attributes: two non air-entrained SCC mixtures and two high-
performance concretes. For each type, compressive strengths of 8,000 and 10,000 psi (55.2 and
69 MPa) were chosen for the testing (Table 8). Their respective target release strengths, at 18
hours, were 5,000 and 6,250 psi (34.5 and 43 MPa). The High-Range Water-Reducing Admixture
(HRWRA) concentrations for the SCC mixture were adjusted to obtain a slump flow of 26.8 ± 0.8
in (680 ± 20 mm). The target slump for the HPC mixtures was 6.3 ± 0.8 in (160 ± 20 mm). All
four beams were steam cured for an 18 hours period (Section 2.3.1).
Table 8: Specimen Identification
Specimen designation
Compressive strength, psi (MPa)
Release strength, psi (MPa)
Concrete mix
H8 8,000 (55.2) 5,000 (34.5) High-Performance Concrete H10 10,000 (69) 6,250 (43) High-Performance Concrete S8 8,000 (55.2) 5,000 (34.5) Self-Consolidating Concrete S10 10,000 (69) 6,250 (43) Self-Consolidating Concrete
A 6.5 inches (165 mm) deep by 48 inches (1219 mm) wide cast-in-place deck slab was cast on
top of each girder at least twenty eight days after the prestress release. During the casting, the
girder was sitting on its end supports and the formwork was supported on the ground rather than
being supported directly on the precast girder. The deck slab was cast with a conventional air-
entrained concrete with a target compressive strength of 5,000 psi (34.5 MPa). It contained four
No. 5 reinforcing bars in the longitudinal direction and No. 5 transverse bars spaced at 12 inches
(305 mm) and 11 inches (280 mm) for the 8,000 and 10,000 psi (55.2 and 69 MPa) girders,
respectively. Following the casting, the deck slab was covered with burlap and polyethylene and
was moist cured for 5 days.
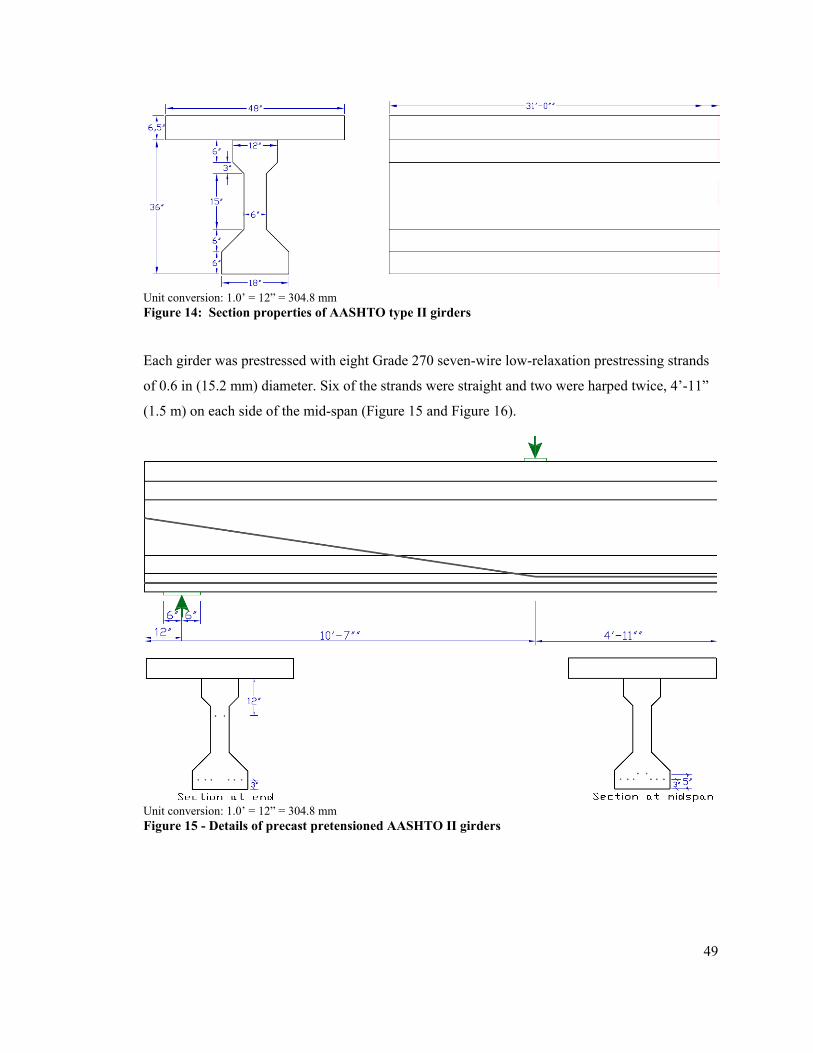
49
Unit conversion: 1.0’ = 12” = 304.8 mm Figure 14: Section properties of AASHTO type II girders
Each girder was prestressed with eight Grade 270 seven-wire low-relaxation prestressing strands
of 0.6 in (15.2 mm) diameter. Six of the strands were straight and two were harped twice, 4’-11”
(1.5 m) on each side of the mid-span (Figure 15 and Figure 16).
Unit conversion: 1.0’ = 12” = 304.8 mm Figure 15 - Details of precast pretensioned AASHTO II girders
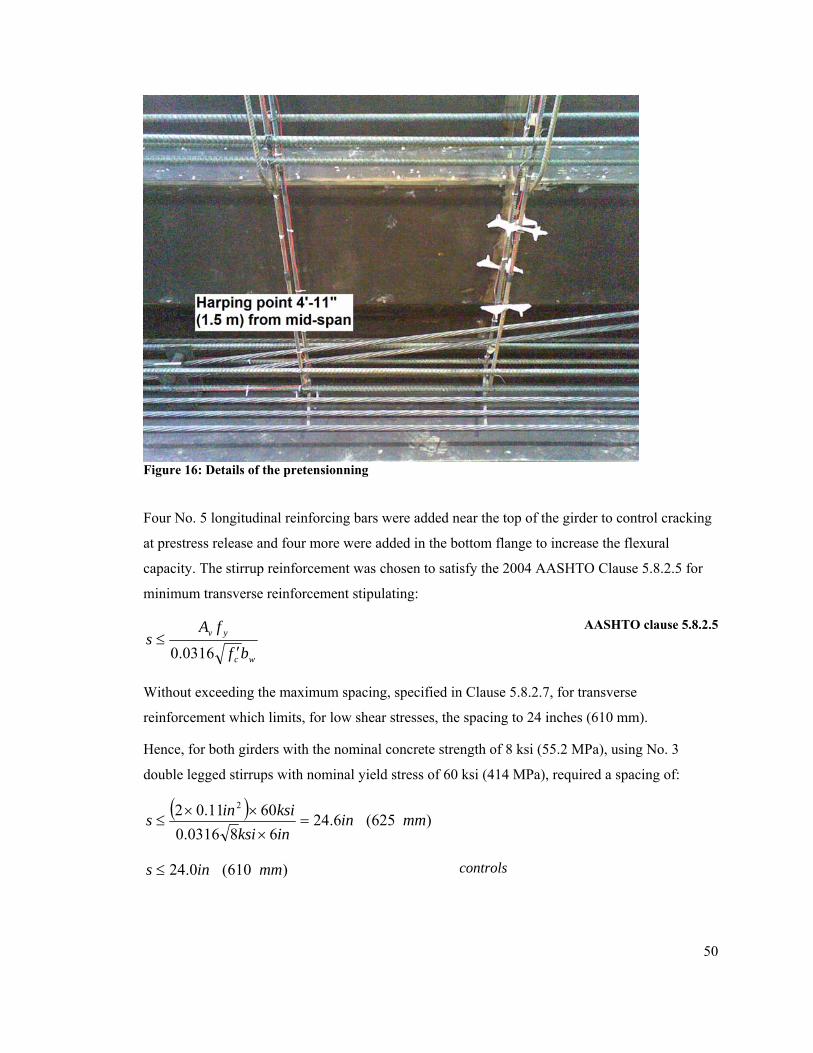
50
Figure 16: Details of the pretensionning
Four No. 5 longitudinal reinforcing bars were added near the top of the girder to control cracking
at prestress release and four more were added in the bottom flange to increase the flexural
capacity. The stirrup reinforcement was chosen to satisfy the 2004 AASHTO Clause 5.8.2.5 for
minimum transverse reinforcement stipulating:
wc
yv
bf
fAs
′≤
0316.0
AASHTO clause 5.8.2.5
Without exceeding the maximum spacing, specified in Clause 5.8.2.7, for transverse
reinforcement which limits, for low shear stresses, the spacing to 24 inches (610 mm).
Hence, for both girders with the nominal concrete strength of 8 ksi (55.2 MPa), using No. 3
double legged stirrups with nominal yield stress of 60 ksi (414 MPa), required a spacing of:
( ) )625(6.24680316.0
6011.02 2
mmininksiksiins =
×××
≤
)610(0.24 mmins ≤ controls
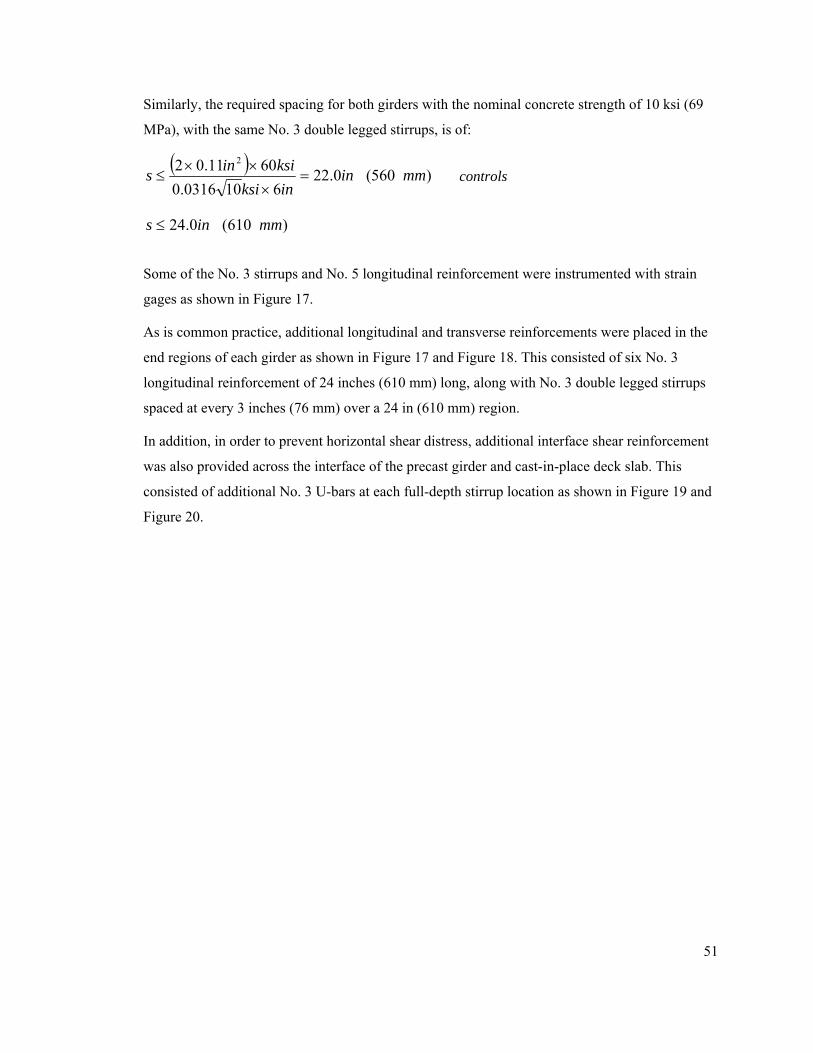
51
Similarly, the required spacing for both girders with the nominal concrete strength of 10 ksi (69
MPa), with the same No. 3 double legged stirrups, is of:
( ) )560(0.226100316.0
6011.02 2
mmininksiksiins =
×××
≤ controls
)610(0.24 mmins ≤
Some of the No. 3 stirrups and No. 5 longitudinal reinforcement were instrumented with strain
gages as shown in Figure 17.
As is common practice, additional longitudinal and transverse reinforcements were placed in the
end regions of each girder as shown in Figure 17 and Figure 18. This consisted of six No. 3
longitudinal reinforcement of 24 inches (610 mm) long, along with No. 3 double legged stirrups
spaced at every 3 inches (76 mm) over a 24 in (610 mm) region.
In addition, in order to prevent horizontal shear distress, additional interface shear reinforcement
was also provided across the interface of the precast girder and cast-in-place deck slab. This
consisted of additional No. 3 U-bars at each full-depth stirrup location as shown in Figure 19 and
Figure 20.
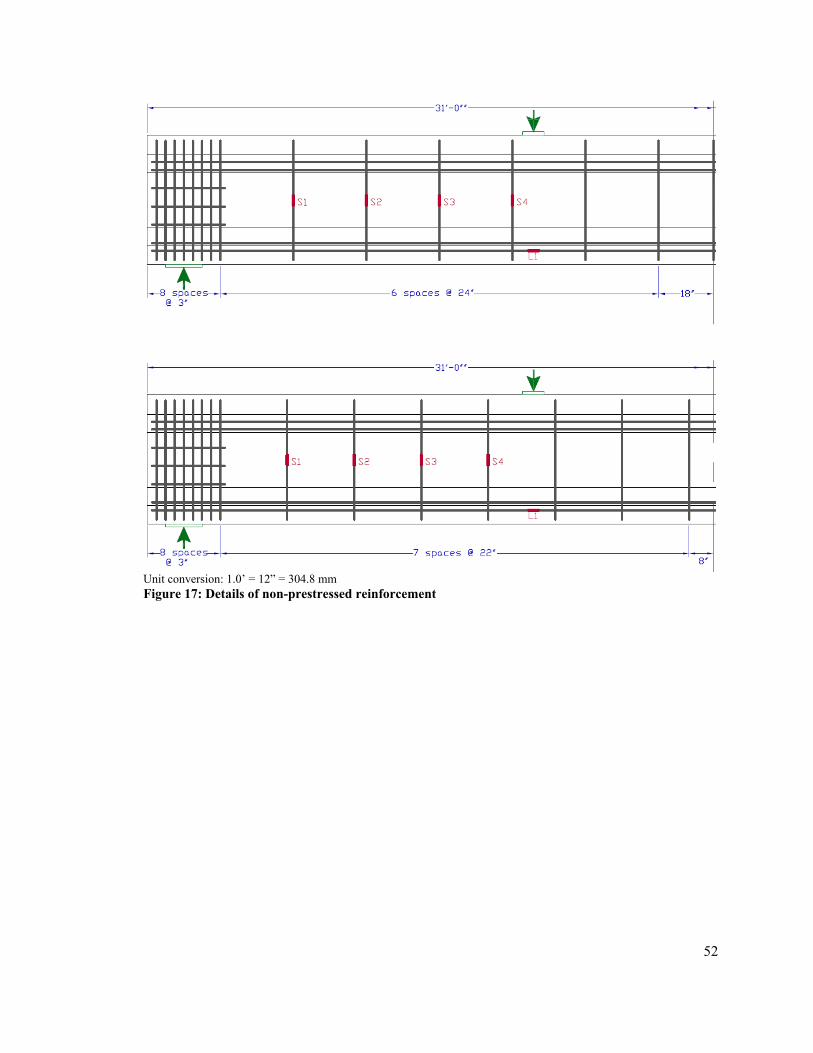
52
Unit conversion: 1.0’ = 12” = 304.8 mm Figure 17: Details of non-prestressed reinforcement
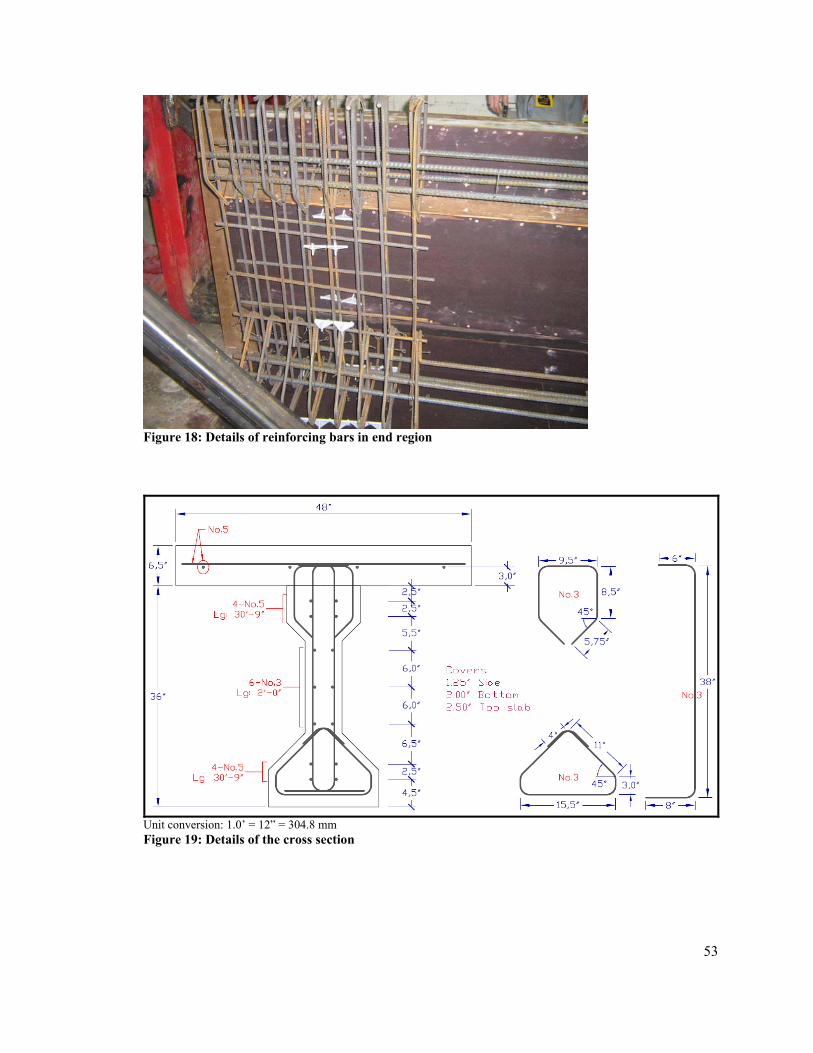
53
Figure 18: Details of reinforcing bars in end region
Unit conversion: 1.0’ = 12” = 304.8 mm Figure 19: Details of the cross section
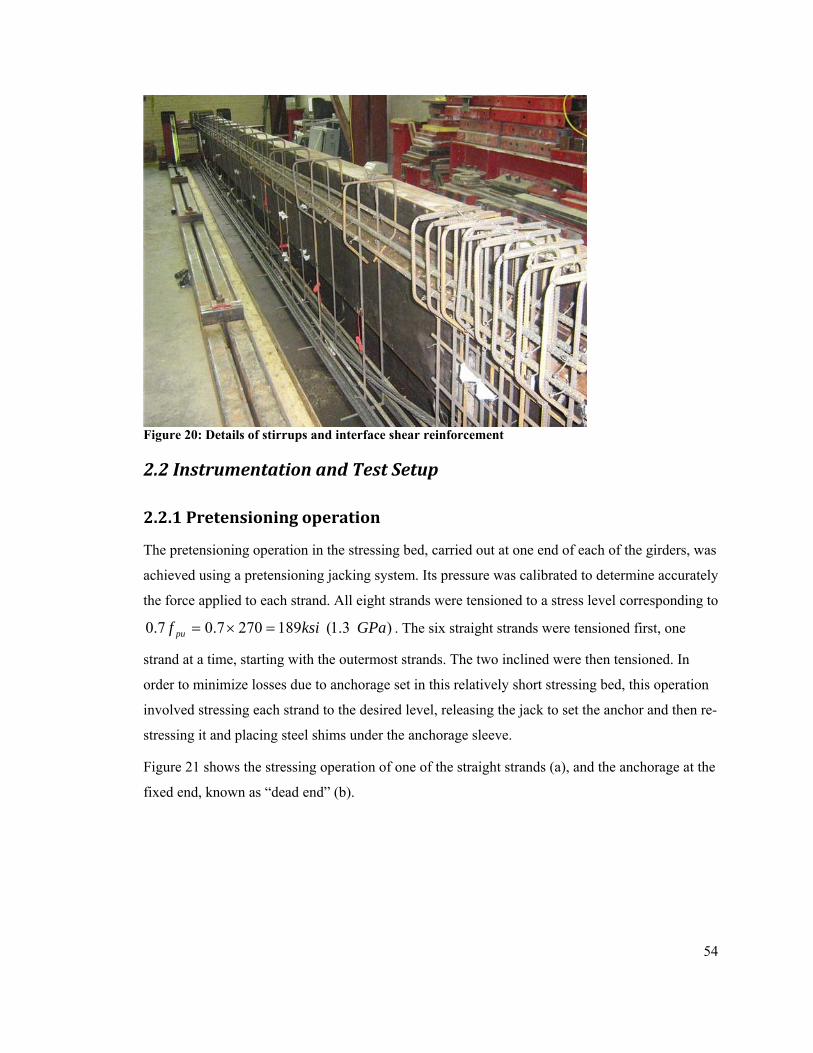
54
Figure 20: Details of stirrups and interface shear reinforcement
2.2 Instrumentation and Test Setup
2.2.1 Pretensioning operation
The pretensioning operation in the stressing bed, carried out at one end of each of the girders, was
achieved using a pretensioning jacking system. Its pressure was calibrated to determine accurately
the force applied to each strand. All eight strands were tensioned to a stress level corresponding to
)3.1(1892707.07.0 GPaksif pu =×= . The six straight strands were tensioned first, one
strand at a time, starting with the outermost strands. The two inclined were then tensioned. In
order to minimize losses due to anchorage set in this relatively short stressing bed, this operation
involved stressing each strand to the desired level, releasing the jack to set the anchor and then re-
stressing it and placing steel shims under the anchorage sleeve.
Figure 21 shows the stressing operation of one of the straight strands (a), and the anchorage at the
fixed end, known as “dead end” (b).
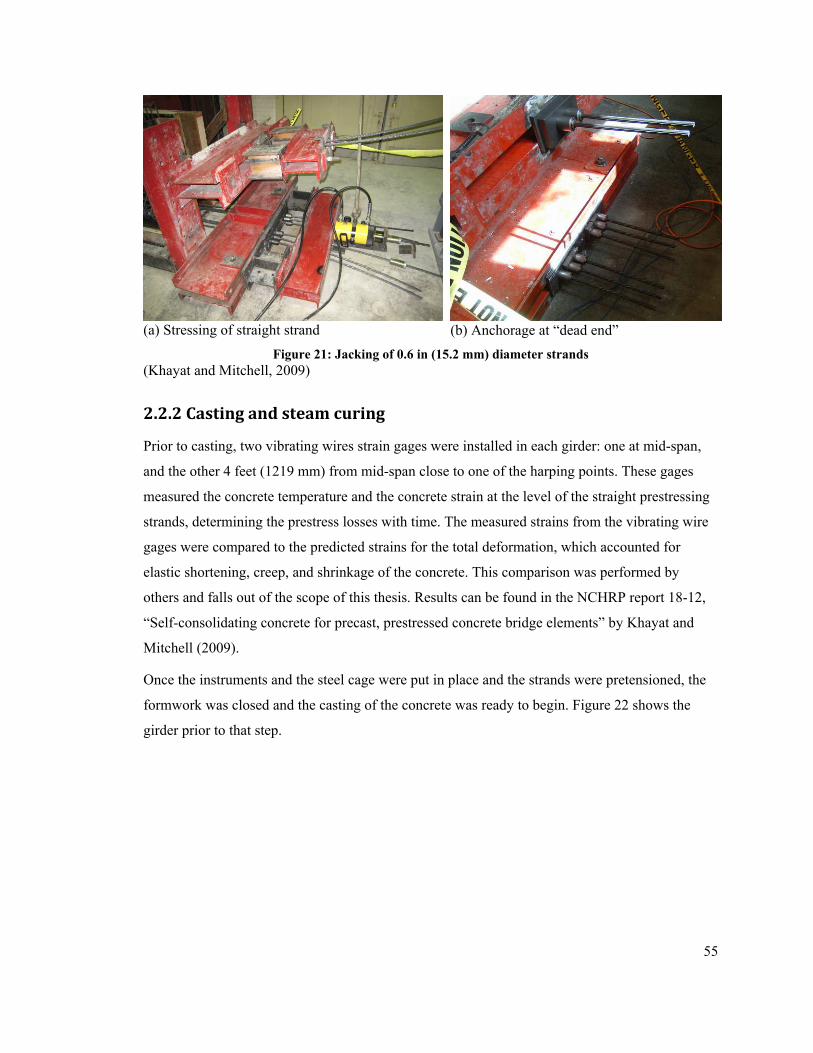
55
(a) Stressing of straight strand (b) Anchorage at “dead end” Figure 21: Jacking of 0.6 in (15.2 mm) diameter strands
(Khayat and Mitchell, 2009)
2.2.2 Casting and steam curing
Prior to casting, two vibrating wires strain gages were installed in each girder: one at mid-span,
and the other 4 feet (1219 mm) from mid-span close to one of the harping points. These gages
measured the concrete temperature and the concrete strain at the level of the straight prestressing
strands, determining the prestress losses with time. The measured strains from the vibrating wire
gages were compared to the predicted strains for the total deformation, which accounted for
elastic shortening, creep, and shrinkage of the concrete. This comparison was performed by
others and falls out of the scope of this thesis. Results can be found in the NCHRP report 18-12,
“Self-consolidating concrete for precast, prestressed concrete bridge elements” by Khayat and
Mitchell (2009).
Once the instruments and the steel cage were put in place and the strands were pretensioned, the
formwork was closed and the casting of the concrete was ready to begin. Figure 22 shows the
girder prior to that step.
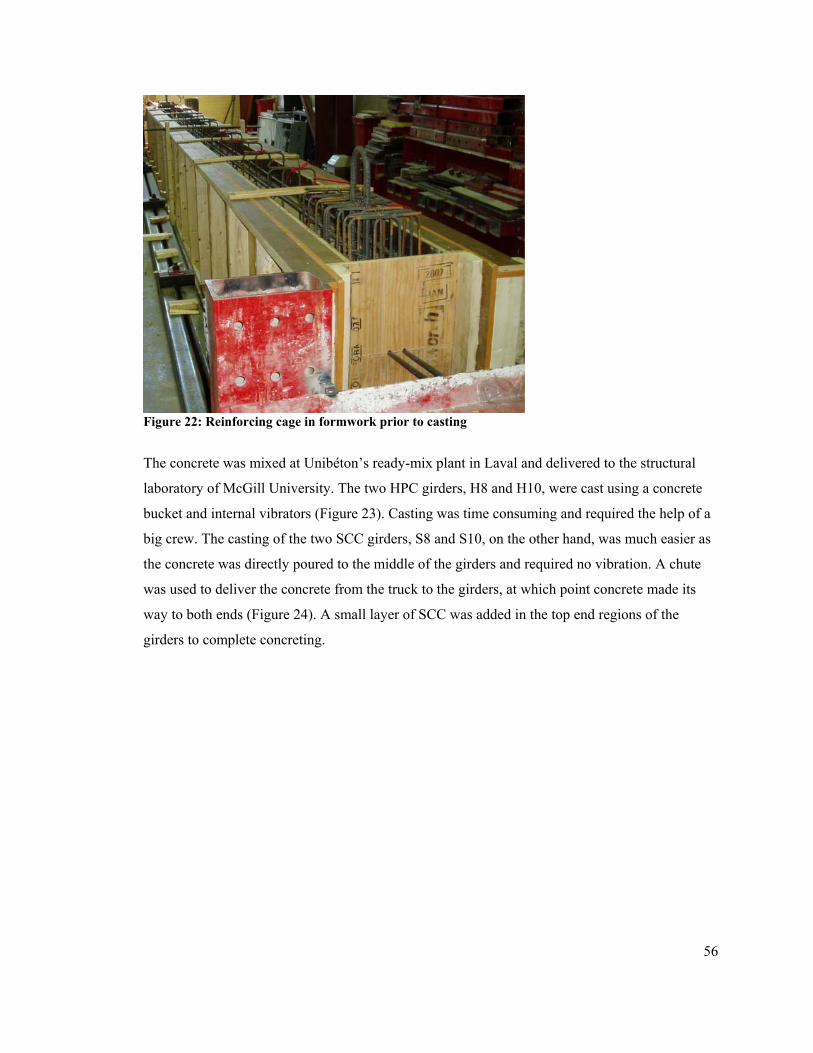
56
Figure 22: Reinforcing cage in formwork prior to casting
The concrete was mixed at Unibéton’s ready-mix plant in Laval and delivered to the structural
laboratory of McGill University. The two HPC girders, H8 and H10, were cast using a concrete
bucket and internal vibrators (Figure 23). Casting was time consuming and required the help of a
big crew. The casting of the two SCC girders, S8 and S10, on the other hand, was much easier as
the concrete was directly poured to the middle of the girders and required no vibration. A chute
was used to deliver the concrete from the truck to the girders, at which point concrete made its
way to both ends (Figure 24). A small layer of SCC was added in the top end regions of the
girders to complete concreting.
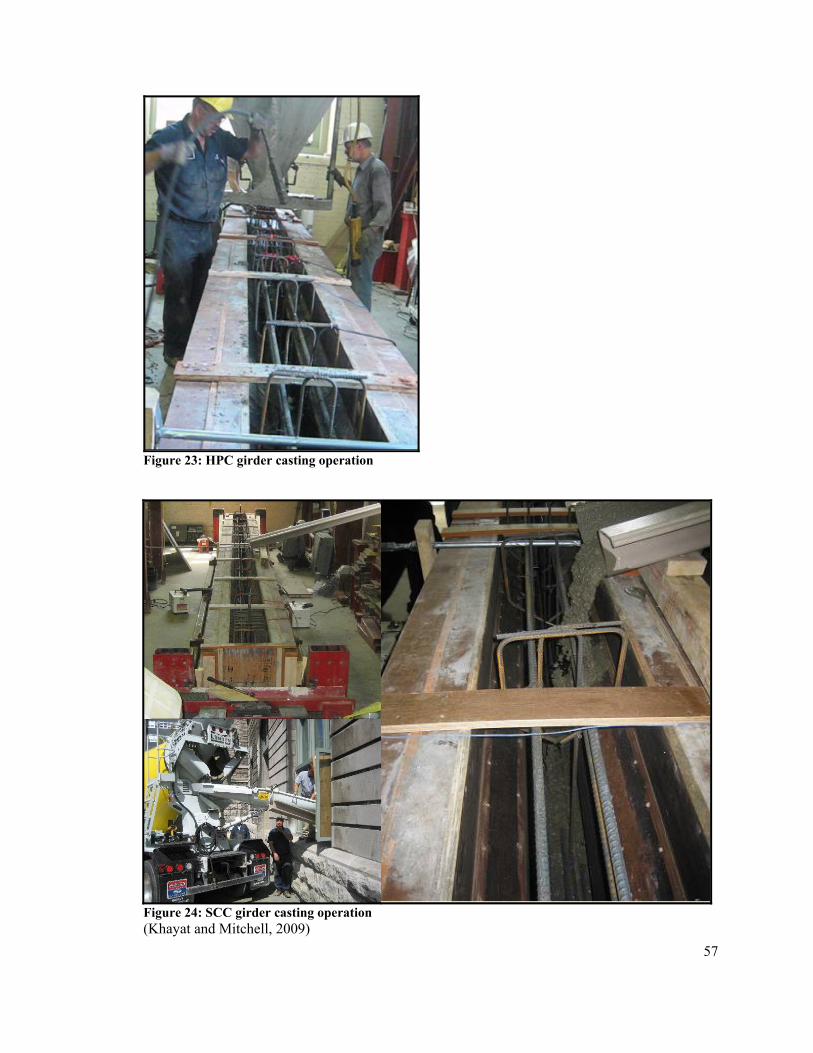
57
Figure 23: HPC girder casting operation
Figure 24: SCC girder casting operation (Khayat and Mitchell, 2009)
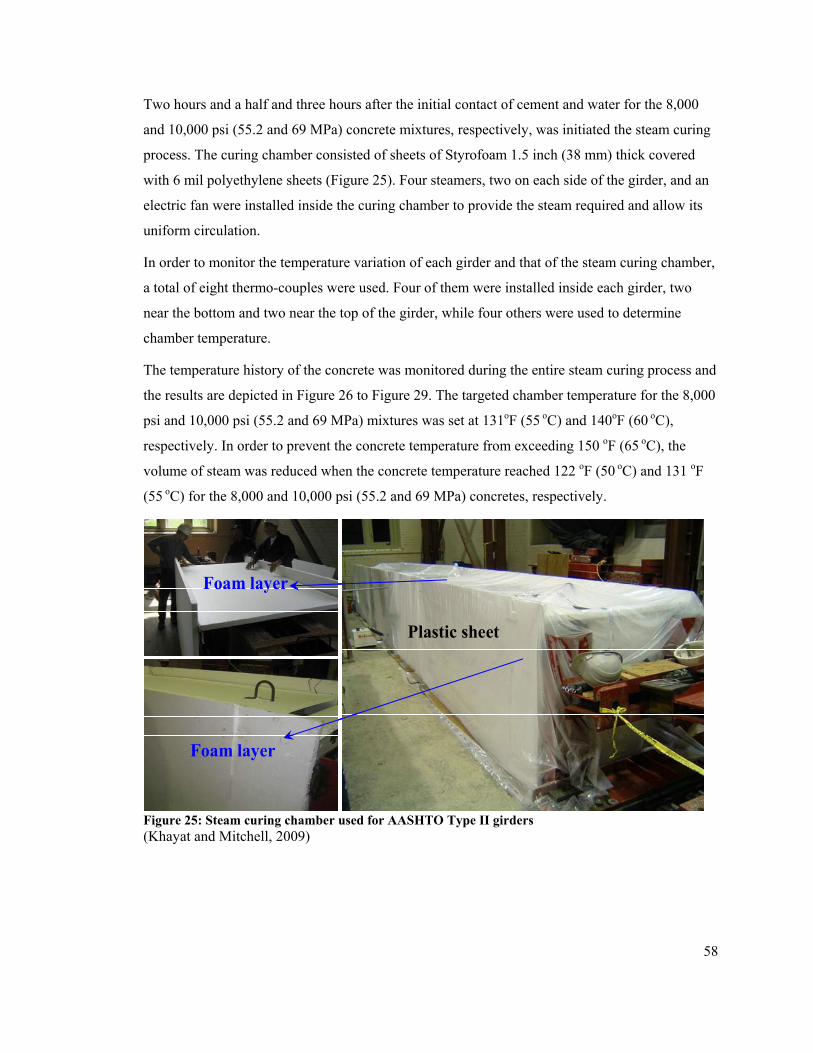
58
Two hours and a half and three hours after the initial contact of cement and water for the 8,000
and 10,000 psi (55.2 and 69 MPa) concrete mixtures, respectively, was initiated the steam curing
process. The curing chamber consisted of sheets of Styrofoam 1.5 inch (38 mm) thick covered
with 6 mil polyethylene sheets (Figure 25). Four steamers, two on each side of the girder, and an
electric fan were installed inside the curing chamber to provide the steam required and allow its
uniform circulation.
In order to monitor the temperature variation of each girder and that of the steam curing chamber,
a total of eight thermo-couples were used. Four of them were installed inside each girder, two
near the bottom and two near the top of the girder, while four others were used to determine
chamber temperature.
The temperature history of the concrete was monitored during the entire steam curing process and
the results are depicted in Figure 26 to Figure 29. The targeted chamber temperature for the 8,000
psi and 10,000 psi (55.2 and 69 MPa) mixtures was set at 131oF (55 oC) and 140oF (60 oC),
respectively. In order to prevent the concrete temperature from exceeding 150 oF (65 oC), the
volume of steam was reduced when the concrete temperature reached 122 oF (50 oC) and 131 oF
(55 oC) for the 8,000 and 10,000 psi (55.2 and 69 MPa) concretes, respectively.
Foam layer
Foam layer
Plastic sheet
Foam layer
Foam layer
Plastic sheet
Figure 25: Steam curing chamber used for AASHTO Type II girders (Khayat and Mitchell, 2009)
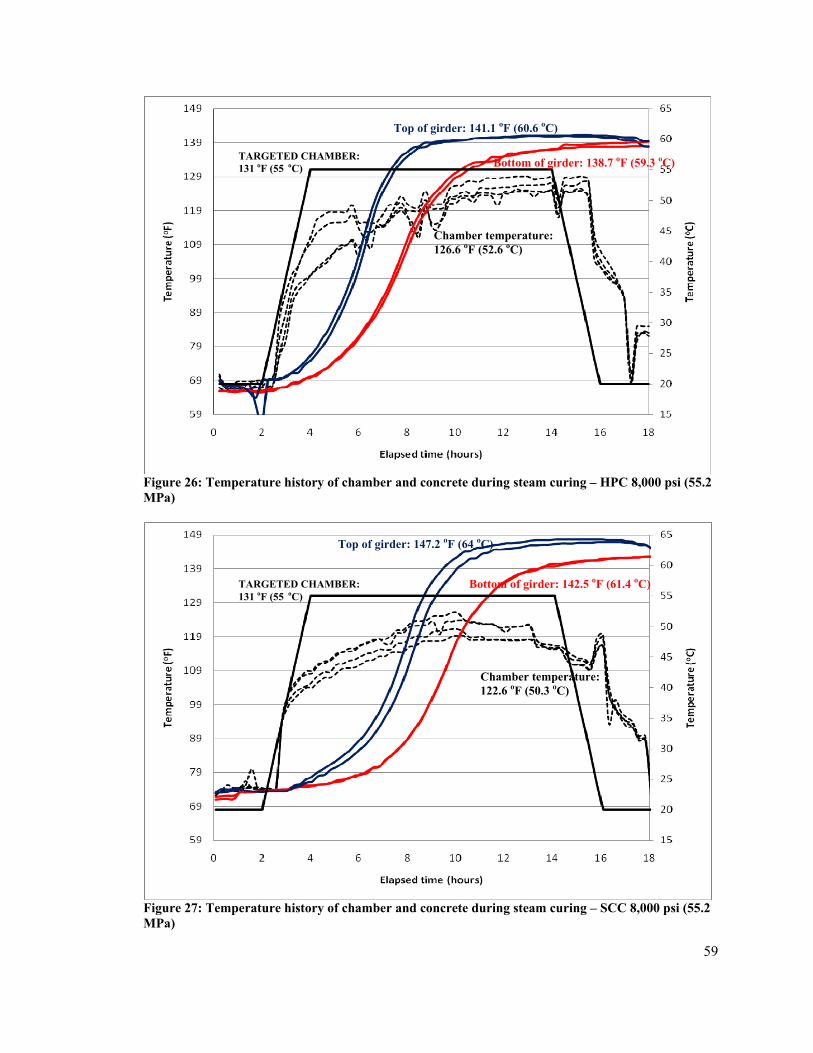
59
Figure 26: Temperature history of chamber and concrete during steam curing – HPC 8,000 psi (55.2 MPa)
Figure 27: Temperature history of chamber and concrete during steam curing – SCC 8,000 psi (55.2 MPa)
TARGETED CHAMBER: 131 oF (55 oC)
Top of girder: 141.1 oF (60.6 oC)
Bottom of girder: 138.7 oF (59.3 oC)
Chamber temperature: 126.6 oF (52.6 oC)
Top of girder: 147.2 oF (64 oC)
Bottom of girder: 142.5 oF (61.4 oC)
Chamber temperature: 122.6 oF (50.3 oC)
TARGETED CHAMBER: 131 oF (55 oC)
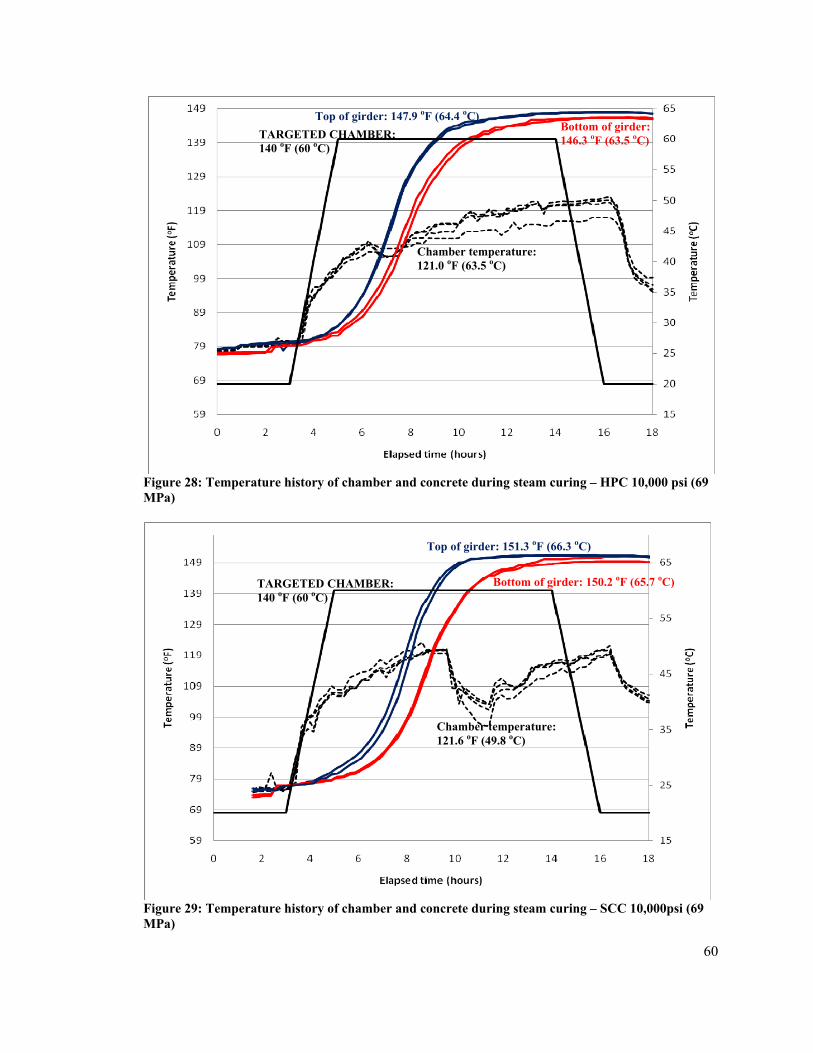
60
Figure 28: Temperature history of chamber and concrete during steam curing – HPC 10,000 psi (69 MPa)
Figure 29: Temperature history of chamber and concrete during steam curing – SCC 10,000psi (69 MPa)
TARGETED CHAMBER: 140 oF (60 oC)
Top of girder: 147.9 oF (64.4 oC)Bottom of girder: 146.3 oF (63.5 oC)
Chamber temperature: 121.0 oF (63.5 oC)
TARGETED CHAMBER: 140 oF (60 oC)
Top of girder: 151.3 oF (66.3 oC)
Bottom of girder: 150.2 oF (65.7 oC)
Chamber temperature: 121.6 oF (49.8 oC)
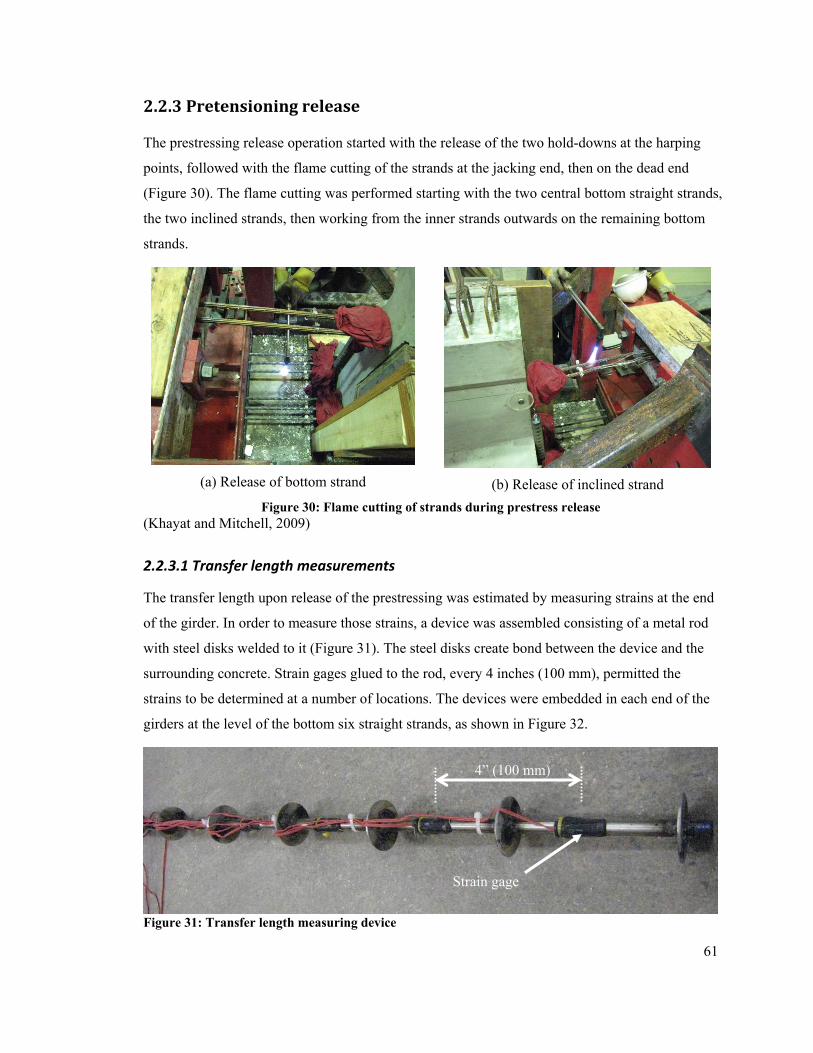
61
2.2.3 Pretensioning release
The prestressing release operation started with the release of the two hold-downs at the harping
points, followed with the flame cutting of the strands at the jacking end, then on the dead end
(Figure 30). The flame cutting was performed starting with the two central bottom straight strands,
the two inclined strands, then working from the inner strands outwards on the remaining bottom
strands.
(a) Release of bottom strand
(b) Release of inclined strand
Figure 30: Flame cutting of strands during prestress release (Khayat and Mitchell, 2009)
2.2.3.1 Transfer length measurements
The transfer length upon release of the prestressing was estimated by measuring strains at the end
of the girder. In order to measure those strains, a device was assembled consisting of a metal rod
with steel disks welded to it (Figure 31). The steel disks create bond between the device and the
surrounding concrete. Strain gages glued to the rod, every 4 inches (100 mm), permitted the
strains to be determined at a number of locations. The devices were embedded in each end of the
girders at the level of the bottom six straight strands, as shown in Figure 32.
Figure 31: Transfer length measuring device
Strain gage
4” (100 mm)
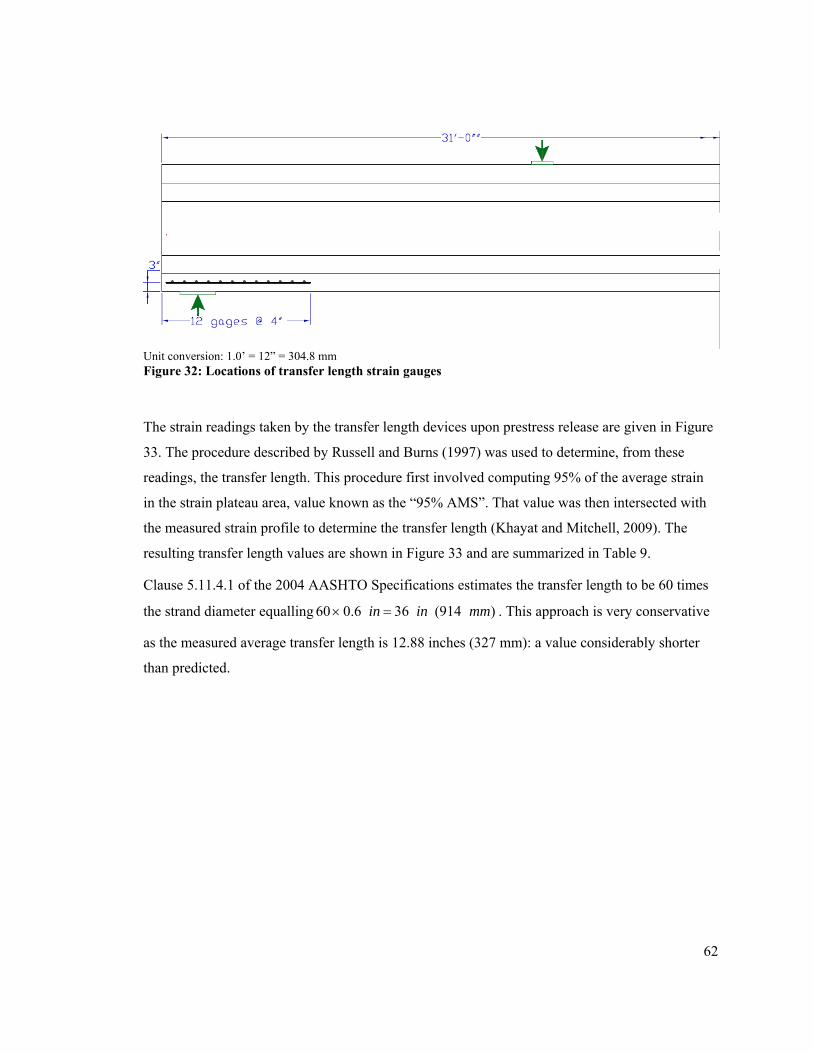
62
Unit conversion: 1.0’ = 12” = 304.8 mm Figure 32: Locations of transfer length strain gauges
The strain readings taken by the transfer length devices upon prestress release are given in Figure
33. The procedure described by Russell and Burns (1997) was used to determine, from these
readings, the transfer length. This procedure first involved computing 95% of the average strain
in the strain plateau area, value known as the “95% AMS”. That value was then intersected with
the measured strain profile to determine the transfer length (Khayat and Mitchell, 2009). The
resulting transfer length values are shown in Figure 33 and are summarized in Table 9.
Clause 5.11.4.1 of the 2004 AASHTO Specifications estimates the transfer length to be 60 times
the strand diameter equalling )914(366.060 mminin =× . This approach is very conservative
as the measured average transfer length is 12.88 inches (327 mm): a value considerably shorter
than predicted.
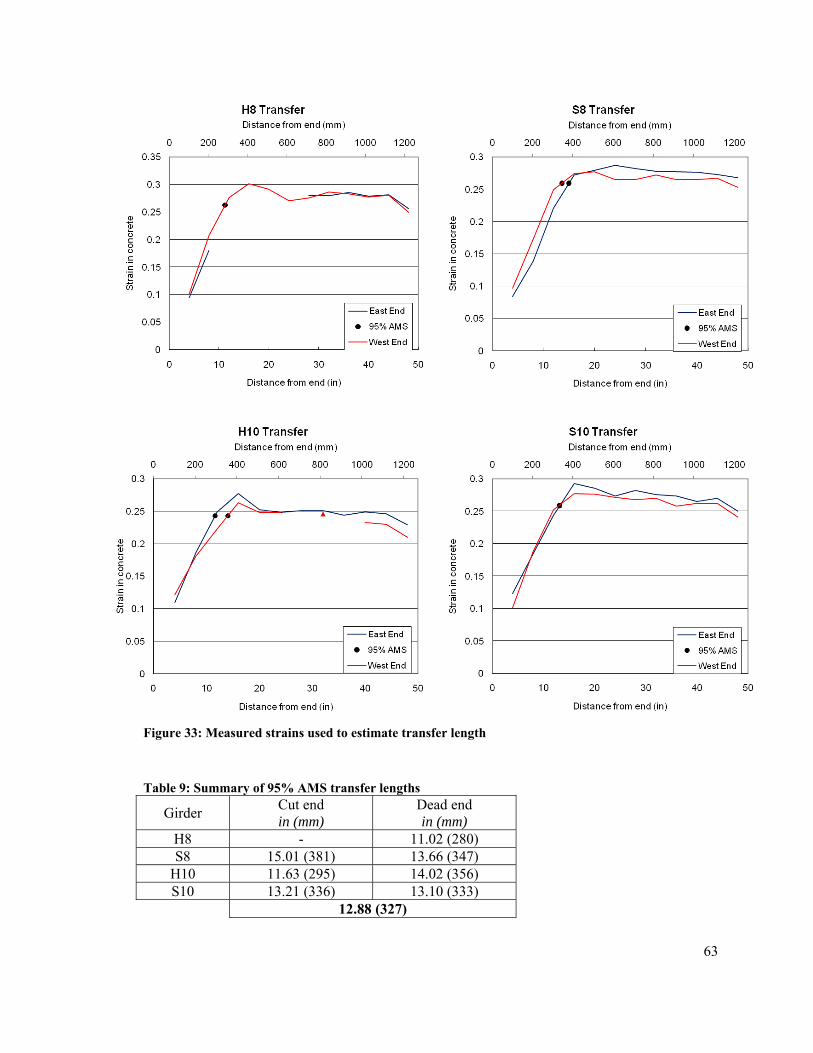
63
Figure 33: Measured strains used to estimate transfer length
Table 9: Summary of 95% AMS transfer lengths
Girder Cut end in (mm)
Dead end in (mm)
H8 - 11.02 (280) S8 15.01 (381) 13.66 (347)
H10 11.63 (295) 14.02 (356) S10 13.21 (336) 13.10 (333)
12.88 (327)
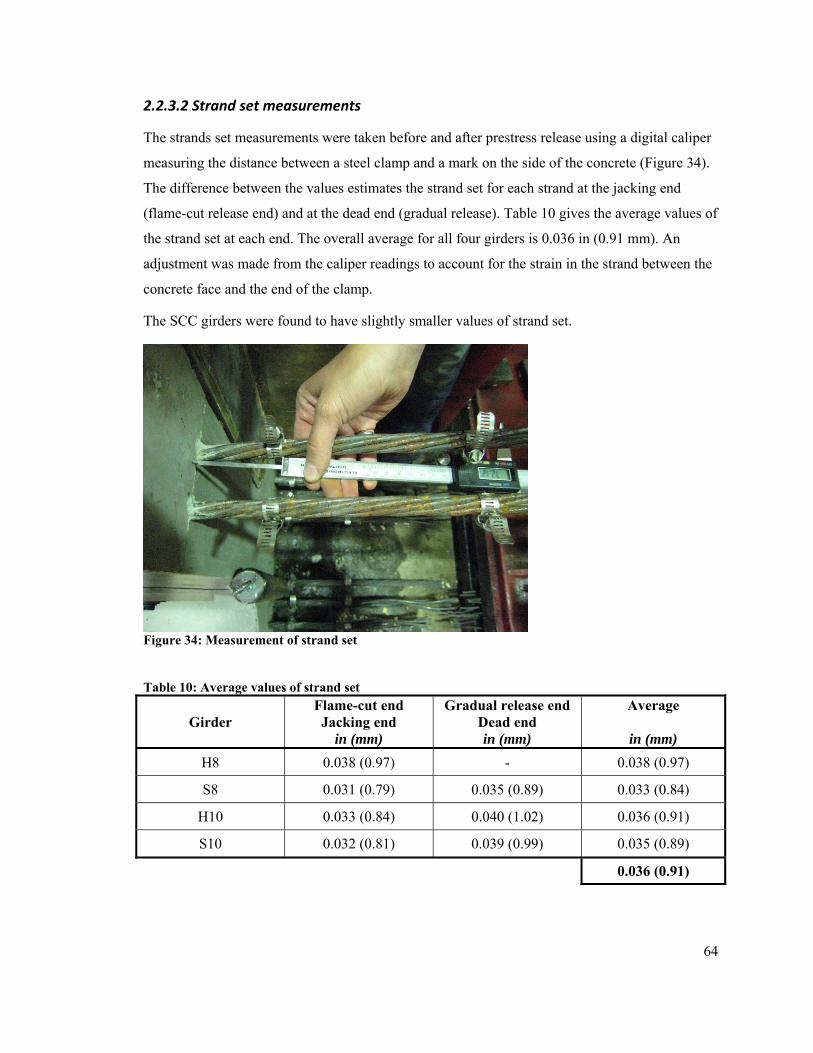
64
2.2.3.2 Strand set measurements
The strands set measurements were taken before and after prestress release using a digital caliper
measuring the distance between a steel clamp and a mark on the side of the concrete (Figure 34).
The difference between the values estimates the strand set for each strand at the jacking end
(flame-cut release end) and at the dead end (gradual release). Table 10 gives the average values of
the strand set at each end. The overall average for all four girders is 0.036 in (0.91 mm). An
adjustment was made from the caliper readings to account for the strain in the strand between the
concrete face and the end of the clamp.
The SCC girders were found to have slightly smaller values of strand set.
Figure 34: Measurement of strand set
Table 10: Average values of strand set
Girder Flame-cut end
Jacking end in (mm)
Gradual release end Dead end in (mm)
Average
in (mm) H8 0.038 (0.97) - 0.038 (0.97)
S8 0.031 (0.79) 0.035 (0.89) 0.033 (0.84)
H10 0.033 (0.84) 0.040 (1.02) 0.036 (0.91)
S10 0.032 (0.81) 0.039 (0.99) 0.035 (0.89)
0.036 (0.91)
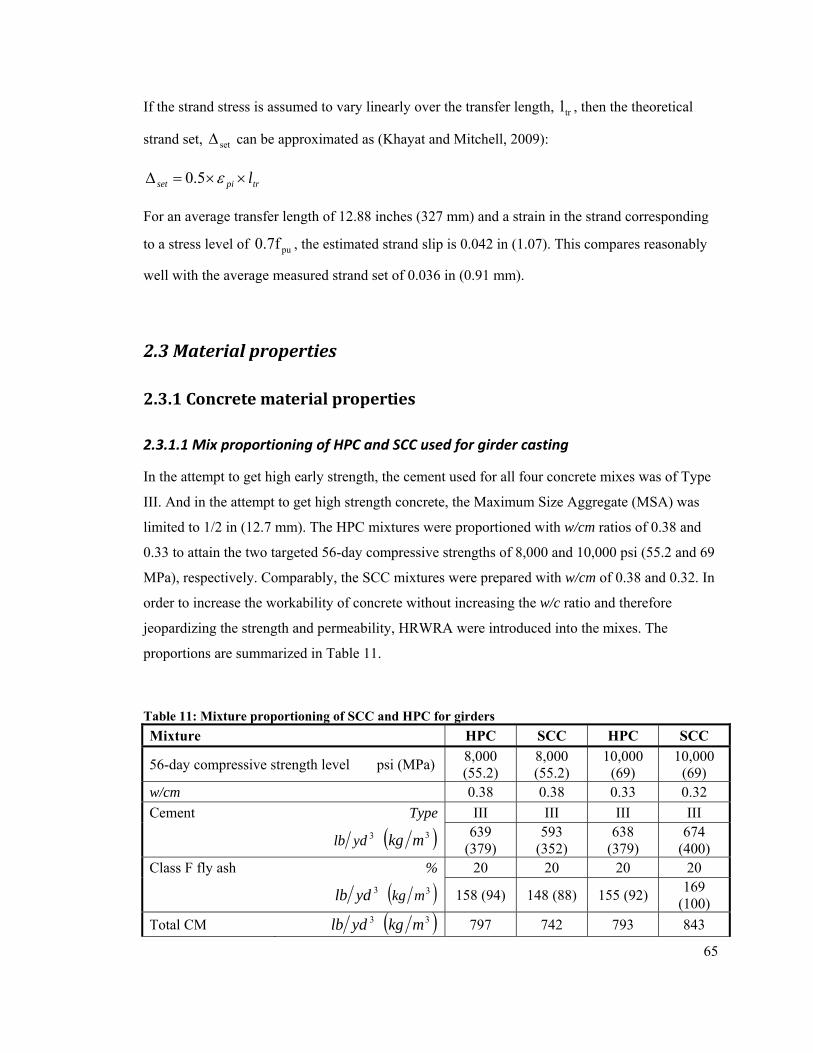
65
If the strand stress is assumed to vary linearly over the transfer length, trl , then the theoretical
strand set, setΔ can be approximated as (Khayat and Mitchell, 2009):
trpiset l××=Δ ε5.0
For an average transfer length of 12.88 inches (327 mm) and a strain in the strand corresponding
to a stress level of pu0.7f , the estimated strand slip is 0.042 in (1.07). This compares reasonably
well with the average measured strand set of 0.036 in (0.91 mm).
2.3 Material properties
2.3.1 Concrete material properties
2.3.1.1 Mix proportioning of HPC and SCC used for girder casting
In the attempt to get high early strength, the cement used for all four concrete mixes was of Type
III. And in the attempt to get high strength concrete, the Maximum Size Aggregate (MSA) was
limited to 1/2 in (12.7 mm). The HPC mixtures were proportioned with w/cm ratios of 0.38 and
0.33 to attain the two targeted 56-day compressive strengths of 8,000 and 10,000 psi (55.2 and 69
MPa), respectively. Comparably, the SCC mixtures were prepared with w/cm of 0.38 and 0.32. In
order to increase the workability of concrete without increasing the w/c ratio and therefore
jeopardizing the strength and permeability, HRWRA were introduced into the mixes. The
proportions are summarized in Table 11.
Table 11: Mixture proportioning of SCC and HPC for girders Mixture HPC SCC HPC SCC
56-day compressive strength level psi (MPa) 8,000 (55.2)
8,000 (55.2)
10,000 (69)
10,000 (69)
w/cm 0.38 0.38 0.33 0.32 Cement Type III III III III
3ydlb ( )3mkg 639 (379)
593 (352)
638 (379)
674 (400)
Class F fly ash % 20 20 20 20 3ydlb ( )3mkg 158 (94) 148 (88) 155 (92) 169
(100) Total CM 3ydlb ( )3mkg 797 742 793 843
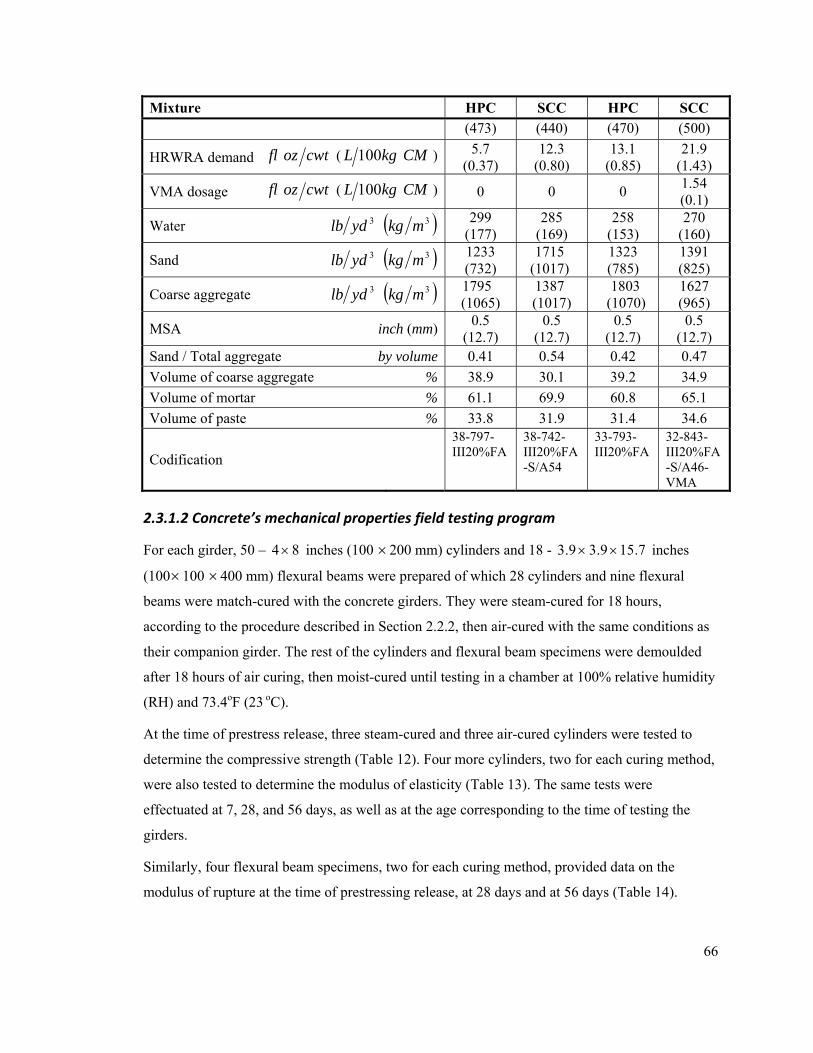
66
Mixture HPC SCC HPC SCC (473) (440) (470) (500)
HRWRA demand cwtozfl ( CMkgL 100 ) 5.7 (0.37)
12.3 (0.80)
13.1 (0.85)
21.9 (1.43)
VMA dosage cwtozfl ( CMkgL 100 ) 0 0 0 1.54 (0.1)
Water 3ydlb ( )3mkg 299 (177)
285 (169)
258 (153)
270 (160)
Sand 3ydlb ( )3mkg 1233 (732)
1715 (1017)
1323 (785)
1391 (825)
Coarse aggregate 3ydlb ( )3mkg 1795 (1065)
1387 (1017)
1803 (1070)
1627 (965)
MSA inch (mm) 0.5 (12.7)
0.5 (12.7)
0.5 (12.7)
0.5 (12.7)
Sand / Total aggregate by volume 0.41 0.54 0.42 0.47 Volume of coarse aggregate % 38.9 30.1 39.2 34.9 Volume of mortar % 61.1 69.9 60.8 65.1 Volume of paste % 33.8 31.9 31.4 34.6
Codification
38-797-III20%FA
38-742-III20%FA-S/A54
33-793-III20%FA
32-843-III20%FA-S/A46-VMA
2.3.1.2 Concrete’s mechanical properties field testing program
For each girder, 50 – 84× inches (100 ×200 mm) cylinders and 18 - 7.159.39.3 ×× inches
(100×100 ×400 mm) flexural beams were prepared of which 28 cylinders and nine flexural
beams were match-cured with the concrete girders. They were steam-cured for 18 hours,
according to the procedure described in Section 2.2.2, then air-cured with the same conditions as
their companion girder. The rest of the cylinders and flexural beam specimens were demoulded
after 18 hours of air curing, then moist-cured until testing in a chamber at 100% relative humidity
(RH) and 73.4oF (23 oC).
At the time of prestress release, three steam-cured and three air-cured cylinders were tested to
determine the compressive strength (Table 12). Four more cylinders, two for each curing method,
were also tested to determine the modulus of elasticity (Table 13). The same tests were
effectuated at 7, 28, and 56 days, as well as at the age corresponding to the time of testing the
girders.
Similarly, four flexural beam specimens, two for each curing method, provided data on the
modulus of rupture at the time of prestressing release, at 28 days and at 56 days (Table 14).
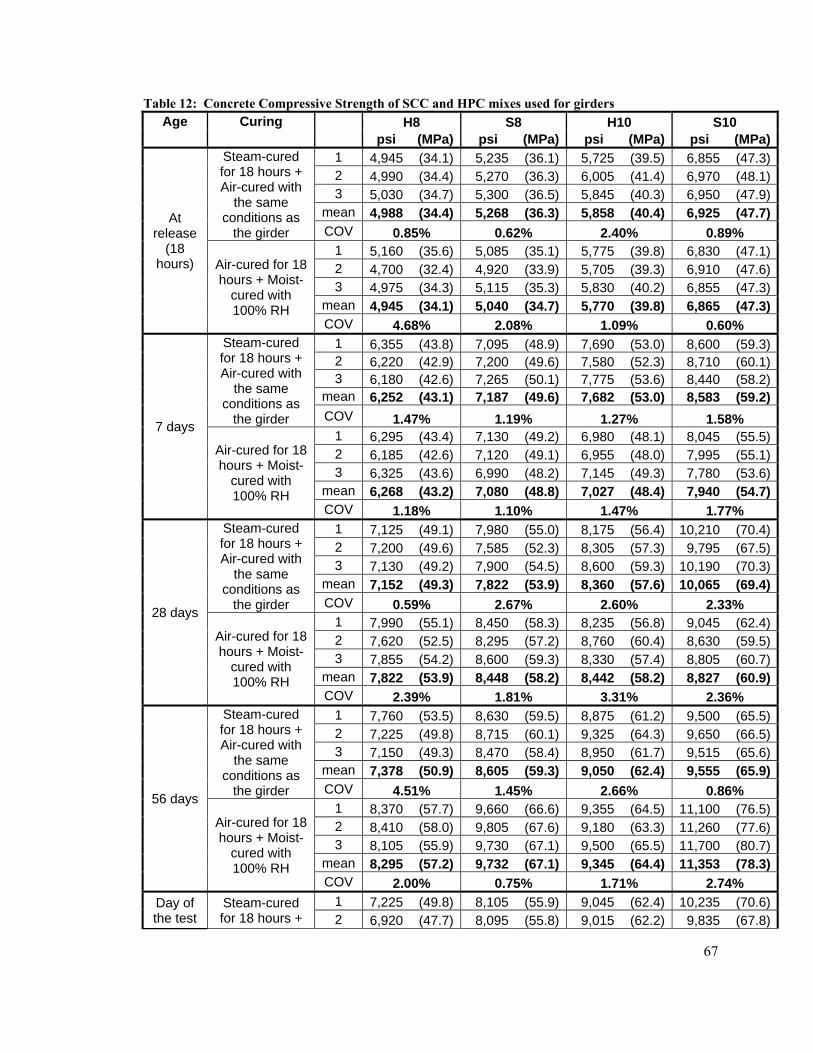
67
Table 12: Concrete Compressive Strength of SCC and HPC mixes used for girders Age Curing H8 S8 H10 S10
psi (MPa) psi (MPa) psi (MPa) psi (MPa)
At release
(18 hours)
Steam-cured for 18 hours + Air-cured with
the same conditions as
the girder
1 4,945 (34.1) 5,235 (36.1) 5,725 (39.5) 6,855 (47.3)2 4,990 (34.4) 5,270 (36.3) 6,005 (41.4) 6,970 (48.1)3 5,030 (34.7) 5,300 (36.5) 5,845 (40.3) 6,950 (47.9)
mean 4,988 (34.4) 5,268 (36.3) 5,858 (40.4) 6,925 (47.7)COV 0.85% 0.62% 2.40% 0.89%
Air-cured for 18 hours + Moist-
cured with 100% RH
1 5,160 (35.6) 5,085 (35.1) 5,775 (39.8) 6,830 (47.1)2 4,700 (32.4) 4,920 (33.9) 5,705 (39.3) 6,910 (47.6)3 4,975 (34.3) 5,115 (35.3) 5,830 (40.2) 6,855 (47.3)
mean 4,945 (34.1) 5,040 (34.7) 5,770 (39.8) 6,865 (47.3)COV 4.68% 2.08% 1.09% 0.60%
7 days
Steam-cured for 18 hours + Air-cured with
the same conditions as
the girder
1 6,355 (43.8) 7,095 (48.9) 7,690 (53.0) 8,600 (59.3)2 6,220 (42.9) 7,200 (49.6) 7,580 (52.3) 8,710 (60.1)3 6,180 (42.6) 7,265 (50.1) 7,775 (53.6) 8,440 (58.2)
mean 6,252 (43.1) 7,187 (49.6) 7,682 (53.0) 8,583 (59.2)COV 1.47% 1.19% 1.27% 1.58%
Air-cured for 18 hours + Moist-
cured with 100% RH
1 6,295 (43.4) 7,130 (49.2) 6,980 (48.1) 8,045 (55.5)2 6,185 (42.6) 7,120 (49.1) 6,955 (48.0) 7,995 (55.1)3 6,325 (43.6) 6,990 (48.2) 7,145 (49.3) 7,780 (53.6)
mean 6,268 (43.2) 7,080 (48.8) 7,027 (48.4) 7,940 (54.7)COV 1.18% 1.10% 1.47% 1.77%
28 days
Steam-cured for 18 hours + Air-cured with
the same conditions as
the girder
1 7,125 (49.1) 7,980 (55.0) 8,175 (56.4) 10,210 (70.4)2 7,200 (49.6) 7,585 (52.3) 8,305 (57.3) 9,795 (67.5)3 7,130 (49.2) 7,900 (54.5) 8,600 (59.3) 10,190 (70.3)
mean 7,152 (49.3) 7,822 (53.9) 8,360 (57.6) 10,065 (69.4)COV 0.59% 2.67% 2.60% 2.33%
Air-cured for 18 hours + Moist-
cured with 100% RH
1 7,990 (55.1) 8,450 (58.3) 8,235 (56.8) 9,045 (62.4)2 7,620 (52.5) 8,295 (57.2) 8,760 (60.4) 8,630 (59.5)3 7,855 (54.2) 8,600 (59.3) 8,330 (57.4) 8,805 (60.7)
mean 7,822 (53.9) 8,448 (58.2) 8,442 (58.2) 8,827 (60.9)COV 2.39% 1.81% 3.31% 2.36%
56 days
Steam-cured for 18 hours + Air-cured with
the same conditions as
the girder
1 7,760 (53.5) 8,630 (59.5) 8,875 (61.2) 9,500 (65.5)2 7,225 (49.8) 8,715 (60.1) 9,325 (64.3) 9,650 (66.5)3 7,150 (49.3) 8,470 (58.4) 8,950 (61.7) 9,515 (65.6)
mean 7,378 (50.9) 8,605 (59.3) 9,050 (62.4) 9,555 (65.9)COV 4.51% 1.45% 2.66% 0.86%
Air-cured for 18 hours + Moist-
cured with 100% RH
1 8,370 (57.7) 9,660 (66.6) 9,355 (64.5) 11,100 (76.5)2 8,410 (58.0) 9,805 (67.6) 9,180 (63.3) 11,260 (77.6)3 8,105 (55.9) 9,730 (67.1) 9,500 (65.5) 11,700 (80.7)
mean 8,295 (57.2) 9,732 (67.1) 9,345 (64.4) 11,353 (78.3)COV 2.00% 0.75% 1.71% 2.74%
Day of the test
Steam-cured for 18 hours +
1 7,225 (49.8) 8,105 (55.9) 9,045 (62.4) 10,235 (70.6)2 6,920 (47.7) 8,095 (55.8) 9,015 (62.2) 9,835 (67.8)
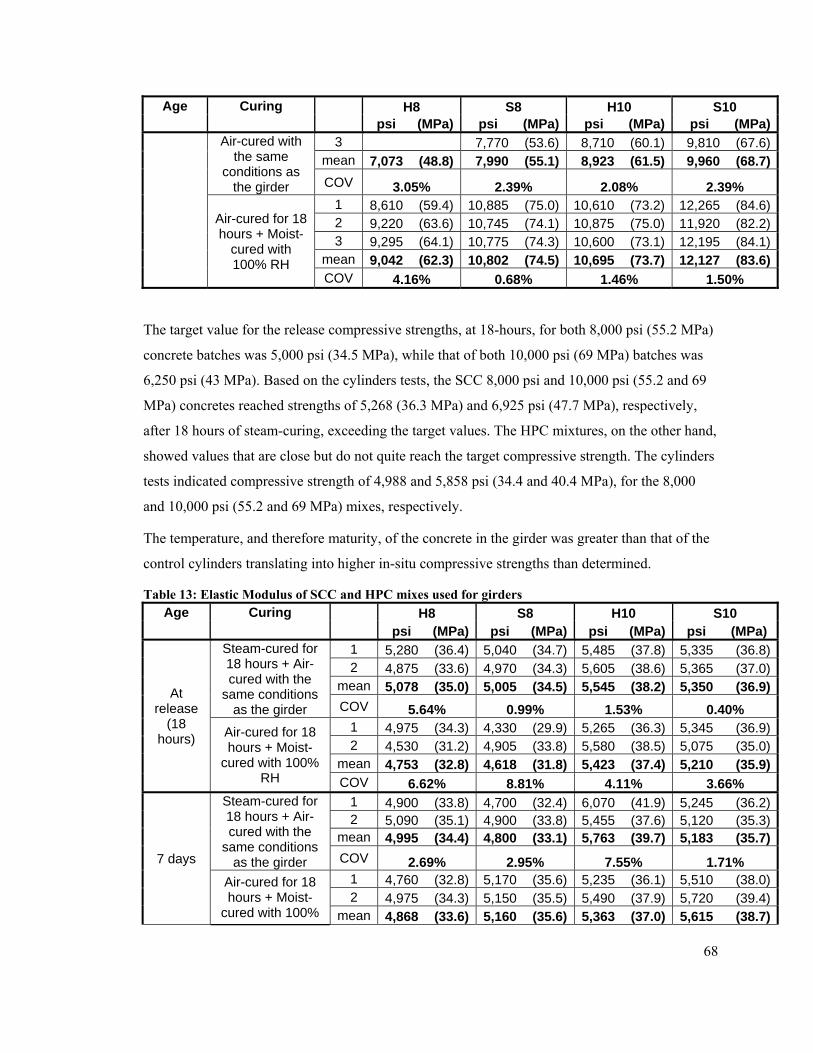
68
Age Curing H8 S8 H10 S10 psi (MPa) psi (MPa) psi (MPa) psi (MPa)
Air-cured with the same
conditions as the girder
3 7,770 (53.6) 8,710 (60.1) 9,810 (67.6)mean 7,073 (48.8) 7,990 (55.1) 8,923 (61.5) 9,960 (68.7)COV 3.05% 2.39% 2.08% 2.39%
Air-cured for 18 hours + Moist-
cured with 100% RH
1 8,610 (59.4) 10,885 (75.0) 10,610 (73.2) 12,265 (84.6)2 9,220 (63.6) 10,745 (74.1) 10,875 (75.0) 11,920 (82.2)3 9,295 (64.1) 10,775 (74.3) 10,600 (73.1) 12,195 (84.1)
mean 9,042 (62.3) 10,802 (74.5) 10,695 (73.7) 12,127 (83.6)COV 4.16% 0.68% 1.46% 1.50%
The target value for the release compressive strengths, at 18-hours, for both 8,000 psi (55.2 MPa)
concrete batches was 5,000 psi (34.5 MPa), while that of both 10,000 psi (69 MPa) batches was
6,250 psi (43 MPa). Based on the cylinders tests, the SCC 8,000 psi and 10,000 psi (55.2 and 69
MPa) concretes reached strengths of 5,268 (36.3 MPa) and 6,925 psi (47.7 MPa), respectively,
after 18 hours of steam-curing, exceeding the target values. The HPC mixtures, on the other hand,
showed values that are close but do not quite reach the target compressive strength. The cylinders
tests indicated compressive strength of 4,988 and 5,858 psi (34.4 and 40.4 MPa), for the 8,000
and 10,000 psi (55.2 and 69 MPa) mixes, respectively.
The temperature, and therefore maturity, of the concrete in the girder was greater than that of the
control cylinders translating into higher in-situ compressive strengths than determined.
Table 13: Elastic Modulus of SCC and HPC mixes used for girders Age Curing H8 S8 H10 S10
psi (MPa) psi (MPa) psi (MPa) psi (MPa)
At release
(18 hours)
Steam-cured for 18 hours + Air-cured with the
same conditions as the girder
1 5,280 (36.4) 5,040 (34.7) 5,485 (37.8) 5,335 (36.8)2 4,875 (33.6) 4,970 (34.3) 5,605 (38.6) 5,365 (37.0)
mean 5,078 (35.0) 5,005 (34.5) 5,545 (38.2) 5,350 (36.9)COV 5.64% 0.99% 1.53% 0.40%
Air-cured for 18 hours + Moist-
cured with 100% RH
1 4,975 (34.3) 4,330 (29.9) 5,265 (36.3) 5,345 (36.9)2 4,530 (31.2) 4,905 (33.8) 5,580 (38.5) 5,075 (35.0)
mean 4,753 (32.8) 4,618 (31.8) 5,423 (37.4) 5,210 (35.9)COV 6.62% 8.81% 4.11% 3.66%
7 days
Steam-cured for 18 hours + Air-cured with the
same conditions as the girder
1 4,900 (33.8) 4,700 (32.4) 6,070 (41.9) 5,245 (36.2)2 5,090 (35.1) 4,900 (33.8) 5,455 (37.6) 5,120 (35.3)
mean 4,995 (34.4) 4,800 (33.1) 5,763 (39.7) 5,183 (35.7)COV 2.69% 2.95% 7.55% 1.71%
Air-cured for 18 hours + Moist-
cured with 100%
1 4,760 (32.8) 5,170 (35.6) 5,235 (36.1) 5,510 (38.0)2 4,975 (34.3) 5,150 (35.5) 5,490 (37.9) 5,720 (39.4)
mean 4,868 (33.6) 5,160 (35.6) 5,363 (37.0) 5,615 (38.7)
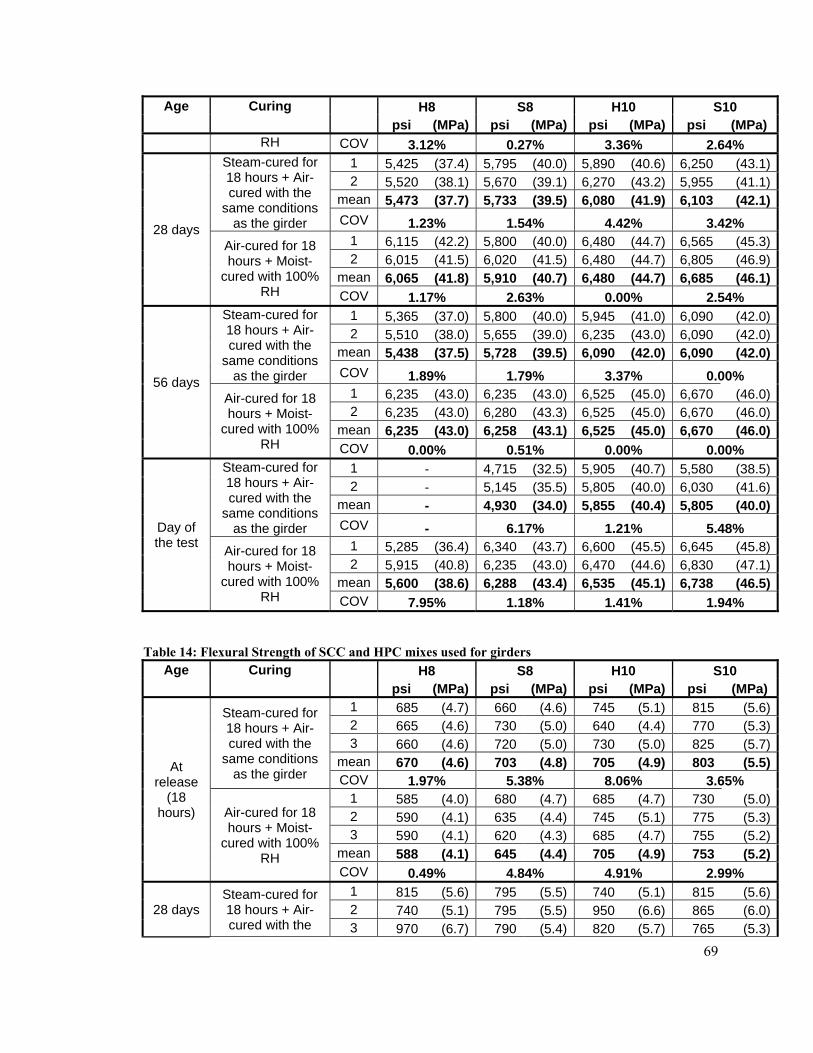
69
Age Curing H8 S8 H10 S10 psi (MPa) psi (MPa) psi (MPa) psi (MPa)
RH COV 3.12% 0.27% 3.36% 2.64%
28 days
Steam-cured for 18 hours + Air-cured with the
same conditions as the girder
1 5,425 (37.4) 5,795 (40.0) 5,890 (40.6) 6,250 (43.1)2 5,520 (38.1) 5,670 (39.1) 6,270 (43.2) 5,955 (41.1)
mean 5,473 (37.7) 5,733 (39.5) 6,080 (41.9) 6,103 (42.1)COV 1.23% 1.54% 4.42% 3.42%
Air-cured for 18 hours + Moist-
cured with 100% RH
1 6,115 (42.2) 5,800 (40.0) 6,480 (44.7) 6,565 (45.3)2 6,015 (41.5) 6,020 (41.5) 6,480 (44.7) 6,805 (46.9)
mean 6,065 (41.8) 5,910 (40.7) 6,480 (44.7) 6,685 (46.1)COV 1.17% 2.63% 0.00% 2.54%
56 days
Steam-cured for 18 hours + Air-cured with the
same conditions as the girder
1 5,365 (37.0) 5,800 (40.0) 5,945 (41.0) 6,090 (42.0)2 5,510 (38.0) 5,655 (39.0) 6,235 (43.0) 6,090 (42.0)
mean 5,438 (37.5) 5,728 (39.5) 6,090 (42.0) 6,090 (42.0)COV 1.89% 1.79% 3.37% 0.00%
Air-cured for 18 hours + Moist-
cured with 100% RH
1 6,235 (43.0) 6,235 (43.0) 6,525 (45.0) 6,670 (46.0)2 6,235 (43.0) 6,280 (43.3) 6,525 (45.0) 6,670 (46.0)
mean 6,235 (43.0) 6,258 (43.1) 6,525 (45.0) 6,670 (46.0)COV 0.00% 0.51% 0.00% 0.00%
Day of the test
Steam-cured for 18 hours + Air-cured with the
same conditions as the girder
1 - 4,715 (32.5) 5,905 (40.7) 5,580 (38.5)2 - 5,145 (35.5) 5,805 (40.0) 6,030 (41.6)
mean - 4,930 (34.0) 5,855 (40.4) 5,805 (40.0)COV - 6.17% 1.21% 5.48%
Air-cured for 18 hours + Moist-
cured with 100% RH
1 5,285 (36.4) 6,340 (43.7) 6,600 (45.5) 6,645 (45.8)2 5,915 (40.8) 6,235 (43.0) 6,470 (44.6) 6,830 (47.1)
mean 5,600 (38.6) 6,288 (43.4) 6,535 (45.1) 6,738 (46.5)COV 7.95% 1.18% 1.41% 1.94%
Table 14: Flexural Strength of SCC and HPC mixes used for girders Age Curing H8 S8 H10 S10
psi (MPa) psi (MPa) psi (MPa) psi (MPa)
At release
(18 hours)
Steam-cured for 18 hours + Air-cured with the
same conditions as the girder
1 685 (4.7) 660 (4.6) 745 (5.1) 815 (5.6)2 665 (4.6) 730 (5.0) 640 (4.4) 770 (5.3)3 660 (4.6) 720 (5.0) 730 (5.0) 825 (5.7)
mean 670 (4.6) 703 (4.8) 705 (4.9) 803 (5.5)COV 1.97% 5.38% 8.06% 3.65%
Air-cured for 18 hours + Moist-
cured with 100% RH
1 585 (4.0) 680 (4.7) 685 (4.7) 730 (5.0)2 590 (4.1) 635 (4.4) 745 (5.1) 775 (5.3)3 590 (4.1) 620 (4.3) 685 (4.7) 755 (5.2)
mean 588 (4.1) 645 (4.4) 705 (4.9) 753 (5.2)COV 0.49% 4.84% 4.91% 2.99%
28 days Steam-cured for 18 hours + Air-cured with the
1 815 (5.6) 795 (5.5) 740 (5.1) 815 (5.6)2 740 (5.1) 795 (5.5) 950 (6.6) 865 (6.0)3 970 (6.7) 790 (5.4) 820 (5.7) 765 (5.3)
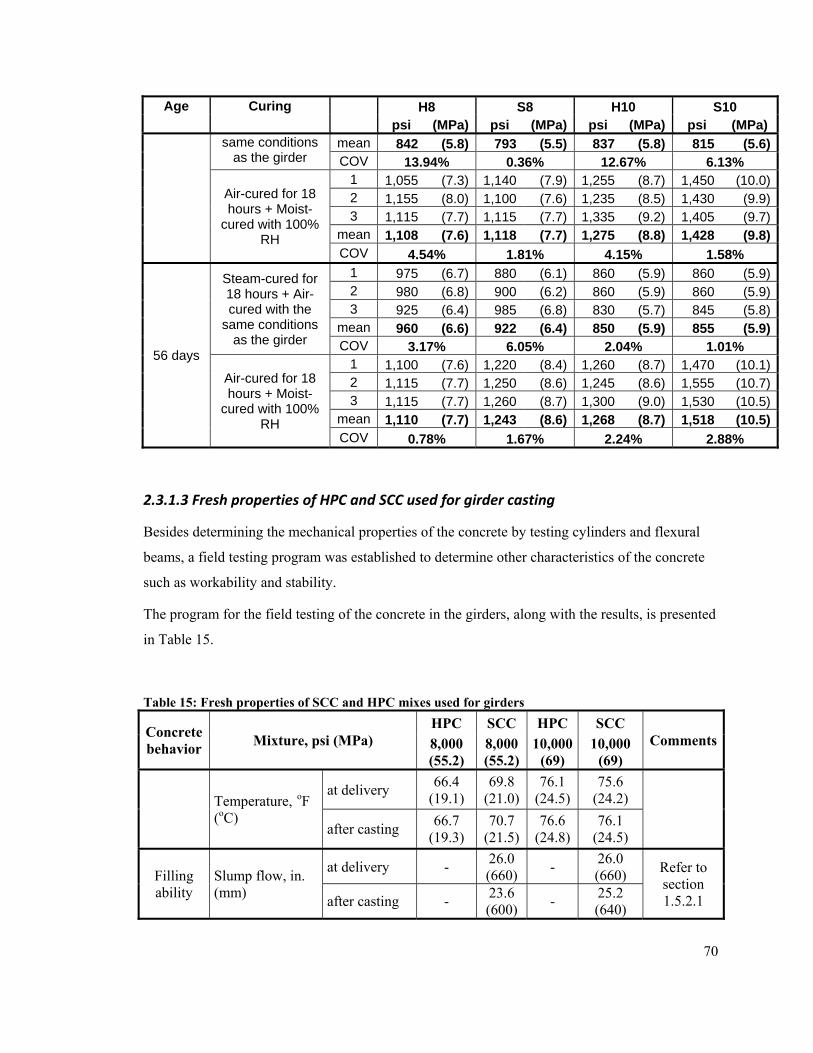
70
Age Curing H8 S8 H10 S10 psi (MPa) psi (MPa) psi (MPa) psi (MPa)
same conditions as the girder
mean 842 (5.8) 793 (5.5) 837 (5.8) 815 (5.6)COV 13.94% 0.36% 12.67% 6.13%
Air-cured for 18 hours + Moist-
cured with 100% RH
1 1,055 (7.3) 1,140 (7.9) 1,255 (8.7) 1,450 (10.0)2 1,155 (8.0) 1,100 (7.6) 1,235 (8.5) 1,430 (9.9)3 1,115 (7.7) 1,115 (7.7) 1,335 (9.2) 1,405 (9.7)
mean 1,108 (7.6) 1,118 (7.7) 1,275 (8.8) 1,428 (9.8)COV 4.54% 1.81% 4.15% 1.58%
56 days
Steam-cured for 18 hours + Air-cured with the
same conditions as the girder
1 975 (6.7) 880 (6.1) 860 (5.9) 860 (5.9)2 980 (6.8) 900 (6.2) 860 (5.9) 860 (5.9)3 925 (6.4) 985 (6.8) 830 (5.7) 845 (5.8)
mean 960 (6.6) 922 (6.4) 850 (5.9) 855 (5.9)COV 3.17% 6.05% 2.04% 1.01%
Air-cured for 18 hours + Moist-
cured with 100% RH
1 1,100 (7.6) 1,220 (8.4) 1,260 (8.7) 1,470 (10.1)2 1,115 (7.7) 1,250 (8.6) 1,245 (8.6) 1,555 (10.7)3 1,115 (7.7) 1,260 (8.7) 1,300 (9.0) 1,530 (10.5)
mean 1,110 (7.7) 1,243 (8.6) 1,268 (8.7) 1,518 (10.5)COV 0.78% 1.67% 2.24% 2.88%
2.3.1.3 Fresh properties of HPC and SCC used for girder casting
Besides determining the mechanical properties of the concrete by testing cylinders and flexural
beams, a field testing program was established to determine other characteristics of the concrete
such as workability and stability.
The program for the field testing of the concrete in the girders, along with the results, is presented
in Table 15.
Table 15: Fresh properties of SCC and HPC mixes used for girders
Concrete behavior Mixture, psi (MPa)
HPC SCC HPC SCC Comments8,000
(55.2) 8,000 (55.2)
10,000 (69)
10,000 (69)
Temperature, oF (oC)
at delivery 66.4 (19.1)
69.8 (21.0)
76.1 (24.5)
75.6 (24.2)
after casting 66.7
(19.3) 70.7
(21.5) 76.6
(24.8) 76.1
(24.5)
Filling ability
Slump flow, in. (mm)
at delivery - 26.0 (660) - 26.0
(660) Refer to section 1.5.2.1 after casting - 23.6
(600) - 25.2 (640)
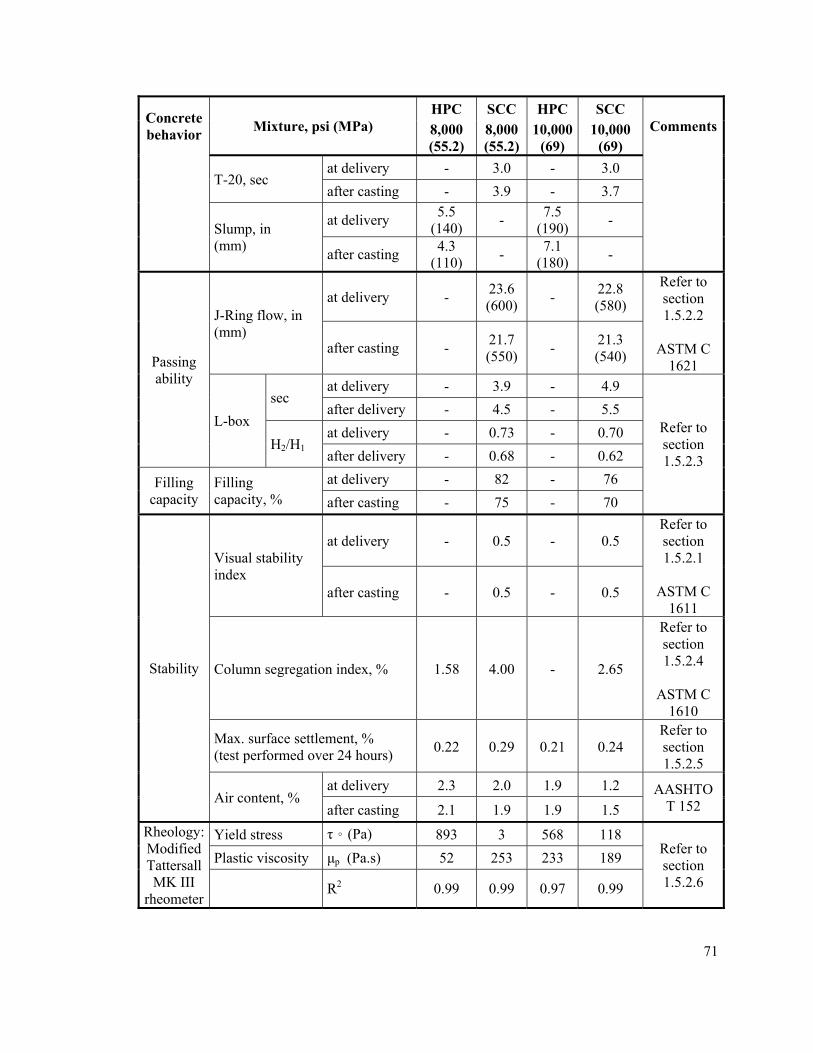
71
Concrete behavior Mixture, psi (MPa)
HPC SCC HPC SCC Comments8,000
(55.2) 8,000 (55.2)
10,000 (69)
10,000 (69)
T-20, sec at delivery - 3.0 - 3.0 after casting - 3.9 - 3.7
Slump, in (mm)
at delivery 5.5 (140) - 7.5
(190) -
after casting 4.3 (110) - 7.1
(180) -
Passing ability
J-Ring flow, in (mm)
at delivery - 23.6 (600) - 22.8
(580)
Refer to section 1.5.2.2
ASTM C
1621 after casting - 21.7
(550) - 21.3 (540)
L-box sec
at delivery - 3.9 - 4.9
Refer to section 1.5.2.3
after delivery - 4.5 - 5.5
H2/H1 at delivery - 0.73 - 0.70 after delivery - 0.68 - 0.62
Filling capacity
Filling capacity, %
at delivery - 82 - 76 after casting - 75 - 70
Stability
Visual stability index
at delivery - 0.5 - 0.5 Refer to section 1.5.2.1
ASTM C
1611 after casting - 0.5 - 0.5
Column segregation index, % 1.58 4.00 - 2.65
Refer to section 1.5.2.4
ASTM C
1610
Max. surface settlement, % (test performed over 24 hours) 0.22 0.29 0.21 0.24
Refer to section 1.5.2.5
Air content, % at delivery 2.3 2.0 1.9 1.2 AASHTO
T 152 after casting 2.1 1.9 1.9 1.5 Rheology: Modified Tattersall MK III
rheometer
Yield stress τ。(Pa) 893 3 568 118 Refer to section 1.5.2.6
Plastic viscosity μp (Pa.s) 52 253 233 189
R2 0.99 0.99 0.97 0.99
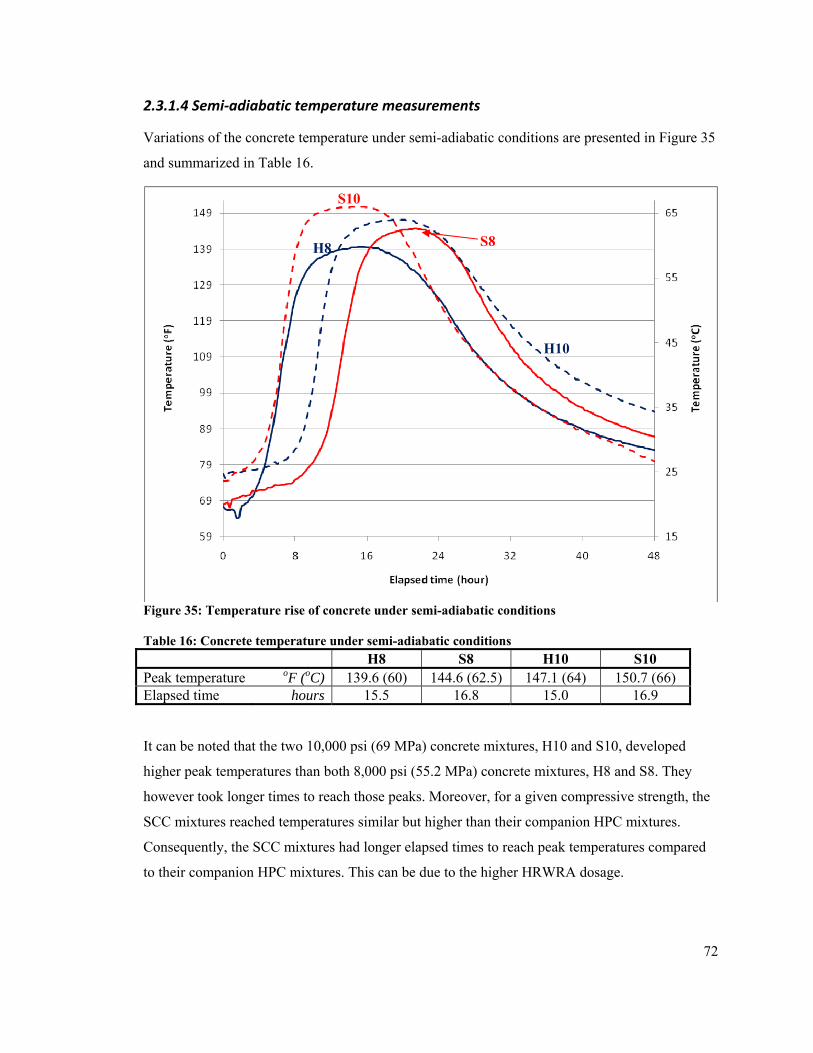
72
2.3.1.4 Semi‐adiabatic temperature measurements
Variations of the concrete temperature under semi-adiabatic conditions are presented in Figure 35
and summarized in Table 16.
Figure 35: Temperature rise of concrete under semi-adiabatic conditions Table 16: Concrete temperature under semi-adiabatic conditions
H8 S8 H10 S10 Peak temperature oF (oC) 139.6 (60) 144.6 (62.5) 147.1 (64) 150.7 (66) Elapsed time hours 15.5 16.8 15.0 16.9
It can be noted that the two 10,000 psi (69 MPa) concrete mixtures, H10 and S10, developed
higher peak temperatures than both 8,000 psi (55.2 MPa) concrete mixtures, H8 and S8. They
however took longer times to reach those peaks. Moreover, for a given compressive strength, the
SCC mixtures reached temperatures similar but higher than their companion HPC mixtures.
Consequently, the SCC mixtures had longer elapsed times to reach peak temperatures compared
to their companion HPC mixtures. This can be due to the higher HRWRA dosage.
H8
H10
S8
S10
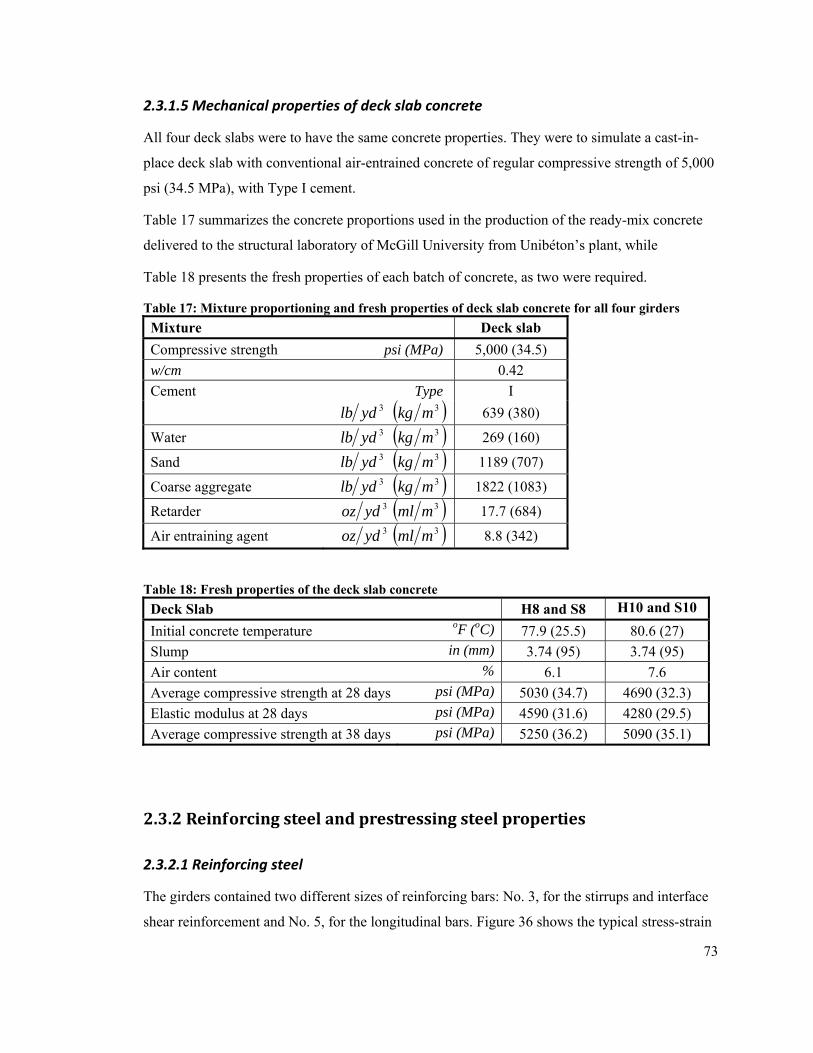
73
2.3.1.5 Mechanical properties of deck slab concrete
All four deck slabs were to have the same concrete properties. They were to simulate a cast-in-
place deck slab with conventional air-entrained concrete of regular compressive strength of 5,000
psi (34.5 MPa), with Type I cement.
Table 17 summarizes the concrete proportions used in the production of the ready-mix concrete
delivered to the structural laboratory of McGill University from Unibéton’s plant, while
Table 18 presents the fresh properties of each batch of concrete, as two were required.
Table 17: Mixture proportioning and fresh properties of deck slab concrete for all four girders Mixture Deck slab Compressive strength psi (MPa) 5,000 (34.5) w/cm 0.42 Cement Type I 3ydlb ( )3mkg 639 (380)
Water 3ydlb ( )3mkg 269 (160)
Sand 3ydlb ( )3mkg 1189 (707)
Coarse aggregate 3ydlb ( )3mkg 1822 (1083)
Retarder 3ydoz ( )3mml 17.7 (684)
Air entraining agent 3ydoz ( )3mml 8.8 (342)
Table 18: Fresh properties of the deck slab concrete Deck Slab H8 and S8 H10 and S10 Initial concrete temperature oF (oC) 77.9 (25.5) 80.6 (27) Slump in (mm) 3.74 (95) 3.74 (95) Air content % 6.1 7.6 Average compressive strength at 28 days psi (MPa) 5030 (34.7) 4690 (32.3) Elastic modulus at 28 days psi (MPa) 4590 (31.6) 4280 (29.5) Average compressive strength at 38 days psi (MPa) 5250 (36.2) 5090 (35.1)
2.3.2 Reinforcing steel and prestressing steel properties
2.3.2.1 Reinforcing steel
The girders contained two different sizes of reinforcing bars: No. 3, for the stirrups and interface
shear reinforcement and No. 5, for the longitudinal bars. Figure 36 shows the typical stress-strain
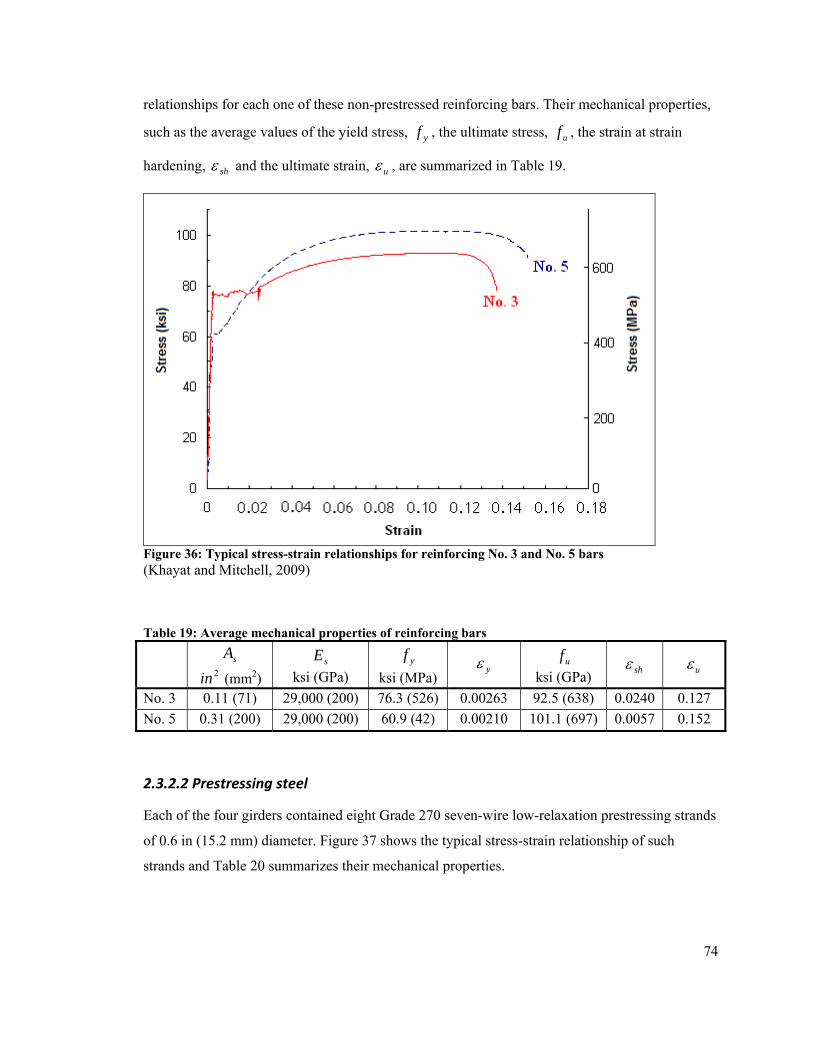
74
relationships for each one of these non-prestressed reinforcing bars. Their mechanical properties,
such as the average values of the yield stress, yf , the ultimate stress, uf , the strain at strain
hardening, shε and the ultimate strain, uε , are summarized in Table 19.
Figure 36: Typical stress-strain relationships for reinforcing No. 3 and No. 5 bars (Khayat and Mitchell, 2009)
Table 19: Average mechanical properties of reinforcing bars
sA 2in (mm2)
sE ksi (GPa)
yf ksi (MPa)
yε uf ksi (GPa) shε uε
No. 3 0.11 (71) 29,000 (200) 76.3 (526) 0.00263 92.5 (638) 0.0240 0.127 No. 5 0.31 (200) 29,000 (200) 60.9 (42) 0.00210 101.1 (697) 0.0057 0.152
2.3.2.2 Prestressing steel
Each of the four girders contained eight Grade 270 seven-wire low-relaxation prestressing strands
of 0.6 in (15.2 mm) diameter. Figure 37 shows the typical stress-strain relationship of such
strands and Table 20 summarizes their mechanical properties.
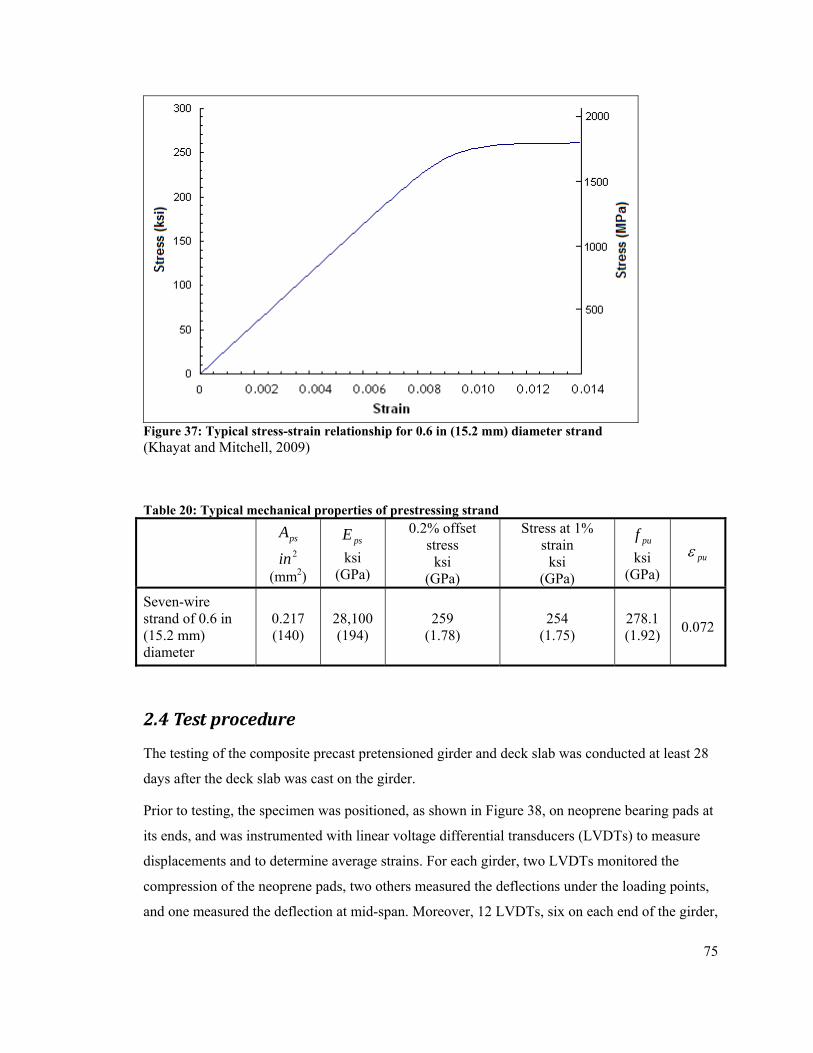
75
Figure 37: Typical stress-strain relationship for 0.6 in (15.2 mm) diameter strand (Khayat and Mitchell, 2009)
Table 20: Typical mechanical properties of prestressing strand
psA 2in
(mm2)
psE ksi
(GPa)
0.2% offset stress
ksi (GPa)
Stress at 1% strain
ksi (GPa)
puf ksi
(GPa) puε
Seven-wire strand of 0.6 in (15.2 mm) diameter
0.217 (140)
28,100 (194)
259 (1.78)
254 (1.75)
278.1 (1.92) 0.072
2.4 Test procedure
The testing of the composite precast pretensioned girder and deck slab was conducted at least 28
days after the deck slab was cast on the girder.
Prior to testing, the specimen was positioned, as shown in Figure 38, on neoprene bearing pads at
its ends, and was instrumented with linear voltage differential transducers (LVDTs) to measure
displacements and to determine average strains. For each girder, two LVDTs monitored the
compression of the neoprene pads, two others measured the deflections under the loading points,
and one measured the deflection at mid-span. Moreover, 12 LVDTs, six on each end of the girder,
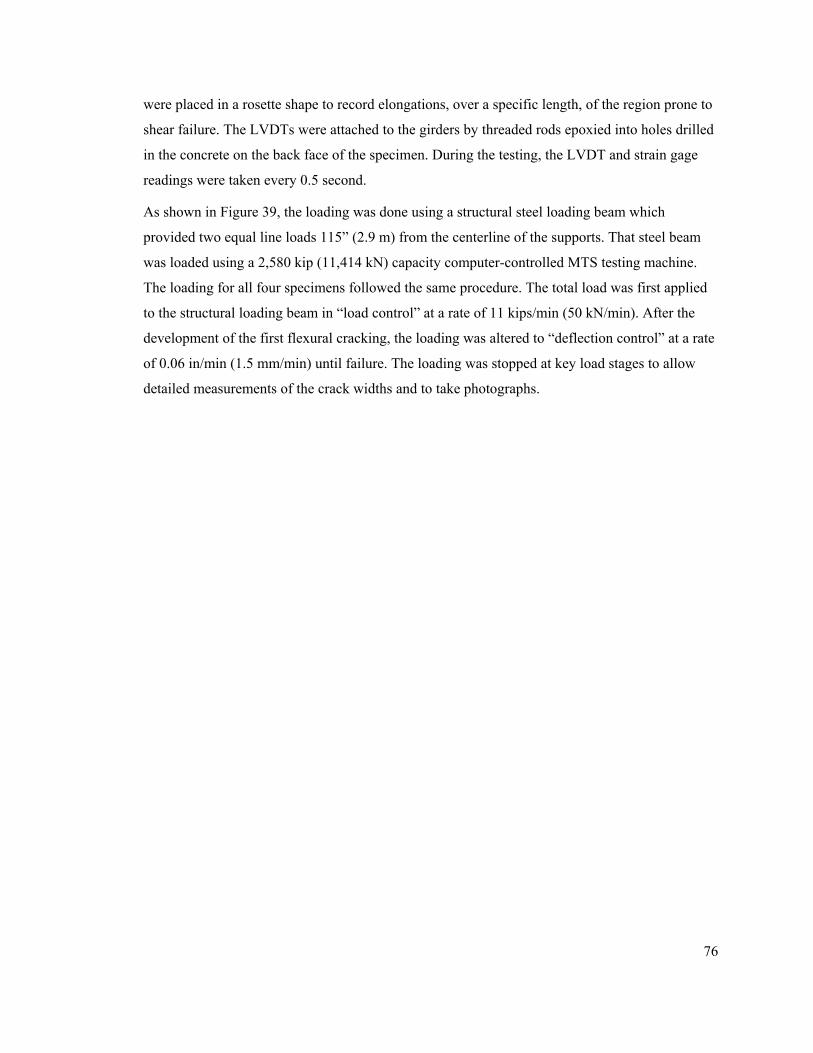
76
were placed in a rosette shape to record elongations, over a specific length, of the region prone to
shear failure. The LVDTs were attached to the girders by threaded rods epoxied into holes drilled
in the concrete on the back face of the specimen. During the testing, the LVDT and strain gage
readings were taken every 0.5 second.
As shown in Figure 39, the loading was done using a structural steel loading beam which
provided two equal line loads 115” (2.9 m) from the centerline of the supports. That steel beam
was loaded using a 2,580 kip (11,414 kN) capacity computer-controlled MTS testing machine.
The loading for all four specimens followed the same procedure. The total load was first applied
to the structural loading beam in “load control” at a rate of 11 kips/min (50 kN/min). After the
development of the first flexural cracking, the loading was altered to “deflection control” at a rate
of 0.06 in/min (1.5 mm/min) until failure. The loading was stopped at key load stages to allow
detailed measurements of the crack widths and to take photographs.
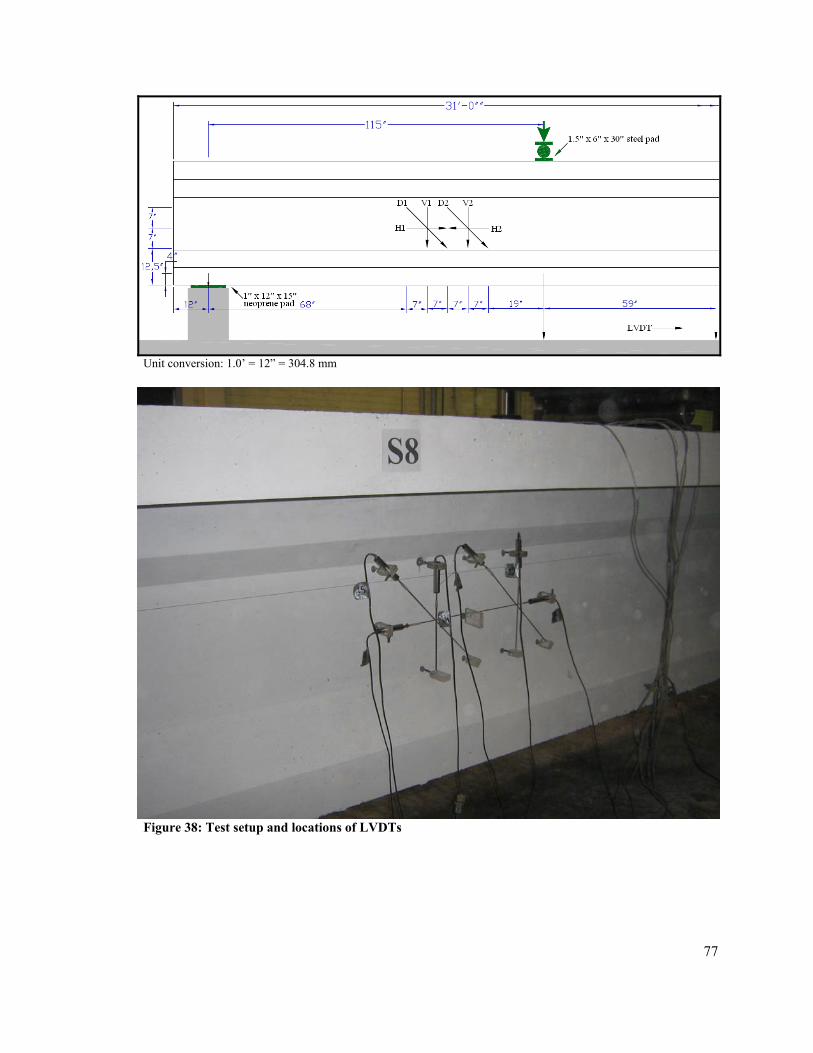
77
Unit conversion: 1.0’ = 12” = 304.8 mm
Figure 38: Test setup and locations of LVDTs
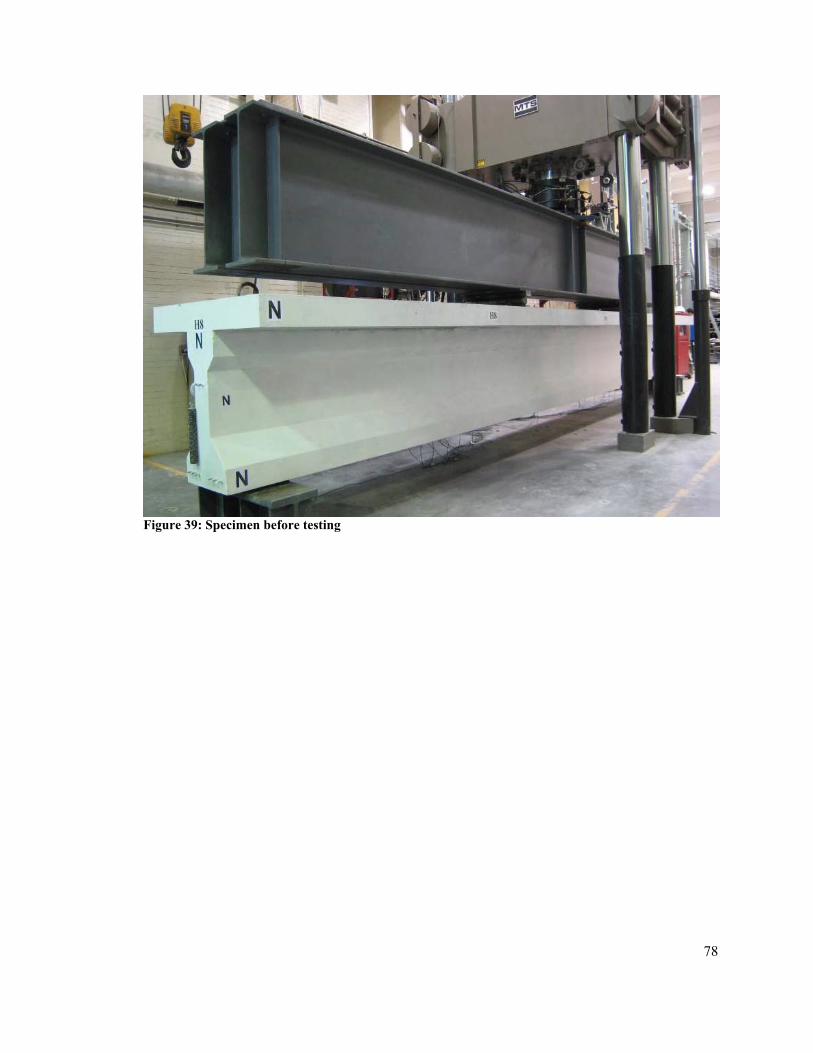
78
Figure 39: Specimen before testing
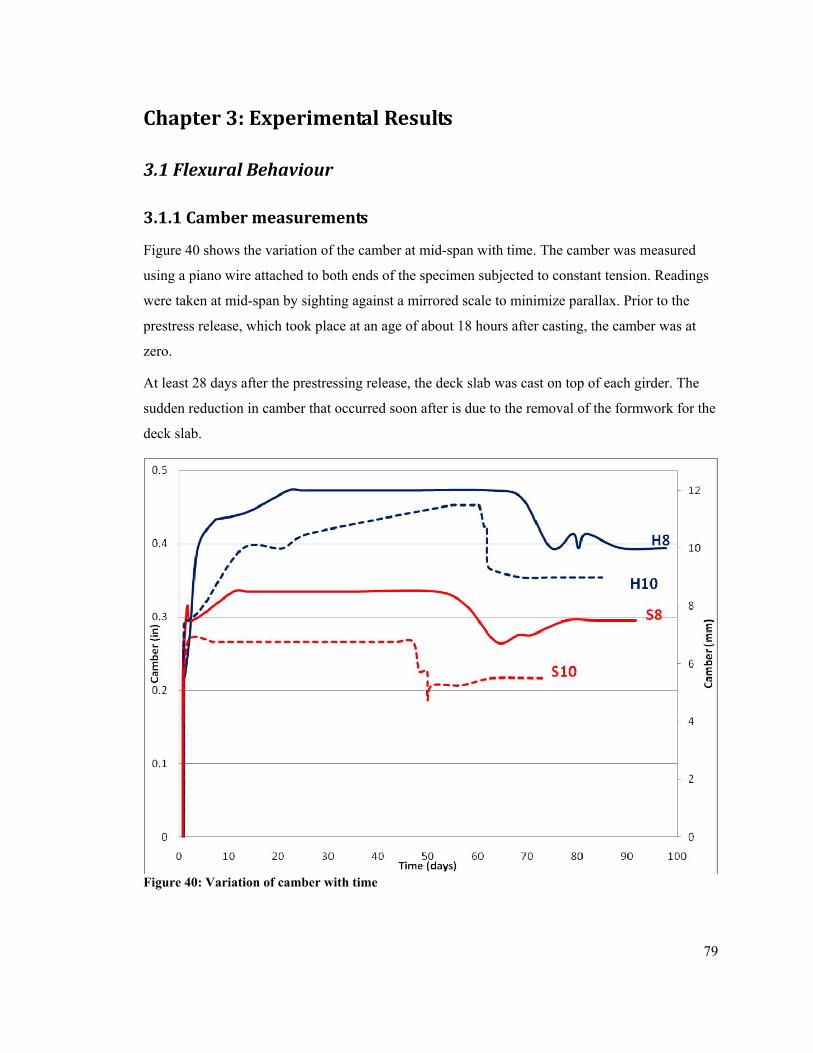
79
Chapter 3: Experimental Results
3.1 Flexural Behaviour
3.1.1 Camber measurements
Figure 40 shows the variation of the camber at mid-span with time. The camber was measured
using a piano wire attached to both ends of the specimen subjected to constant tension. Readings
were taken at mid-span by sighting against a mirrored scale to minimize parallax. Prior to the
prestress release, which took place at an age of about 18 hours after casting, the camber was at
zero.
At least 28 days after the prestressing release, the deck slab was cast on top of each girder. The
sudden reduction in camber that occurred soon after is due to the removal of the formwork for the
deck slab.
Figure 40: Variation of camber with time
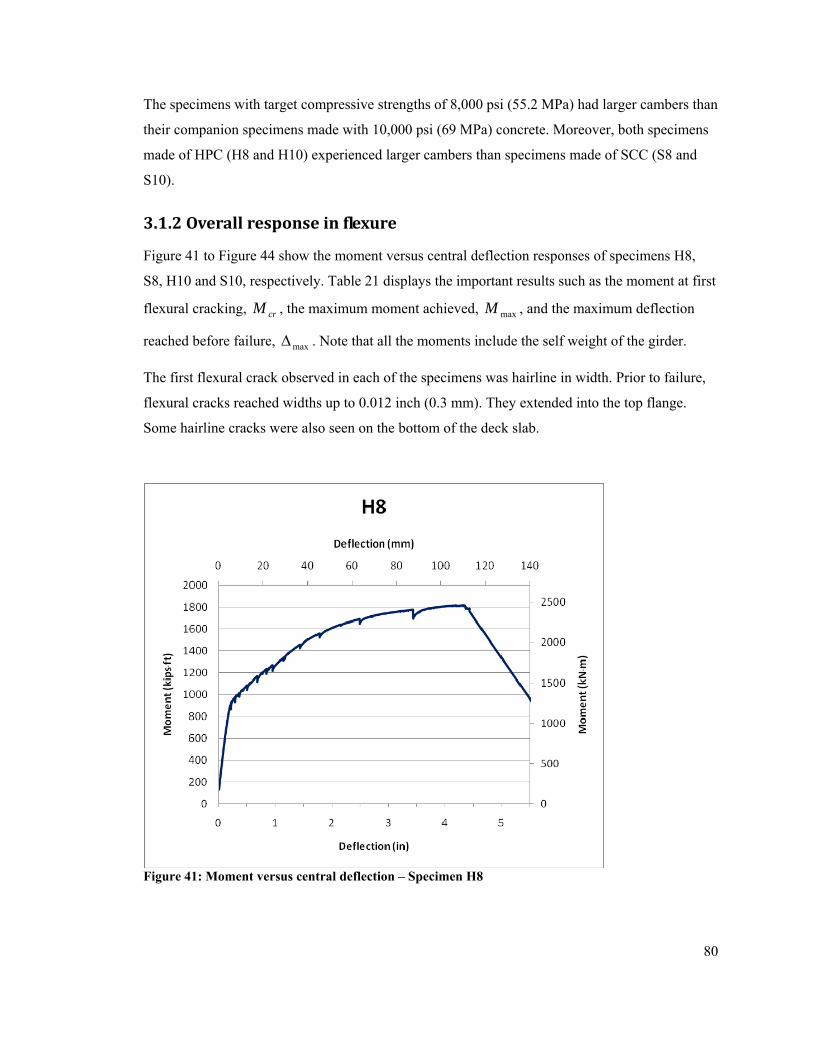
80
The specimens with target compressive strengths of 8,000 psi (55.2 MPa) had larger cambers than
their companion specimens made with 10,000 psi (69 MPa) concrete. Moreover, both specimens
made of HPC (H8 and H10) experienced larger cambers than specimens made of SCC (S8 and
S10).
3.1.2 Overall response in flexure
Figure 41 to Figure 44 show the moment versus central deflection responses of specimens H8,
S8, H10 and S10, respectively. Table 21 displays the important results such as the moment at first
flexural cracking, crM , the maximum moment achieved, maxM , and the maximum deflection
reached before failure, maxΔ . Note that all the moments include the self weight of the girder.
The first flexural crack observed in each of the specimens was hairline in width. Prior to failure,
flexural cracks reached widths up to 0.012 inch (0.3 mm). They extended into the top flange.
Some hairline cracks were also seen on the bottom of the deck slab.
Figure 41: Moment versus central deflection – Specimen H8
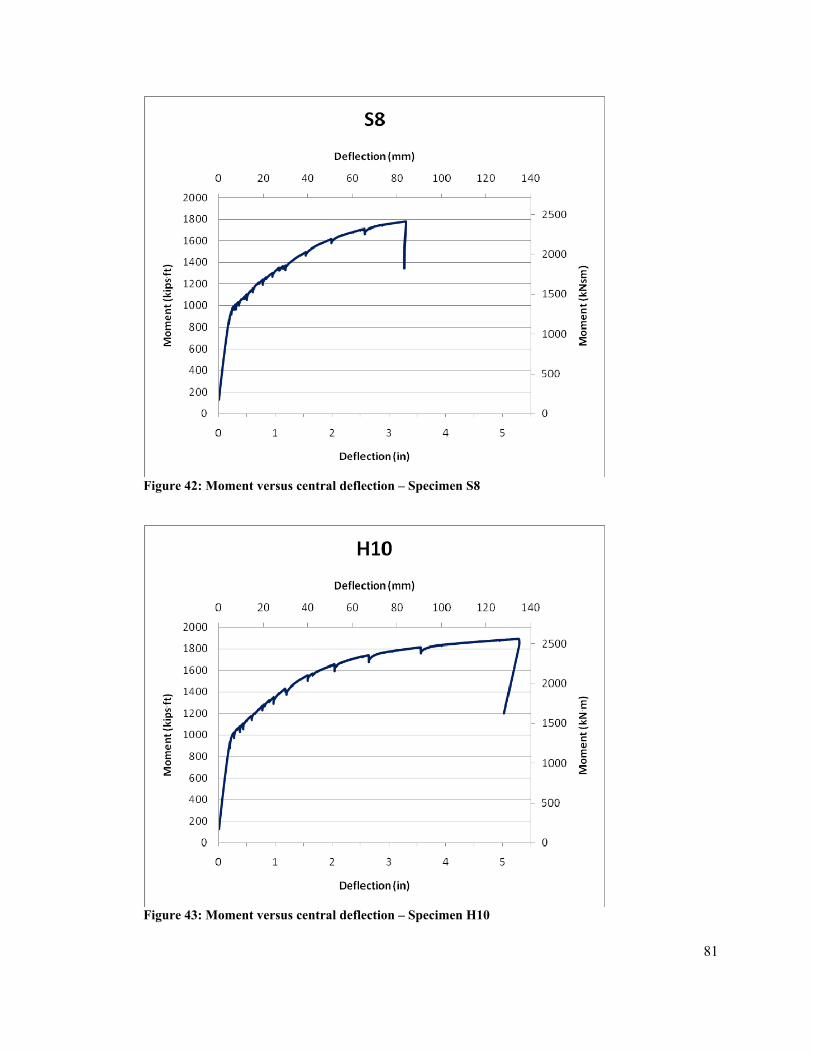
81
Figure 42: Moment versus central deflection – Specimen S8
Figure 43: Moment versus central deflection – Specimen H10
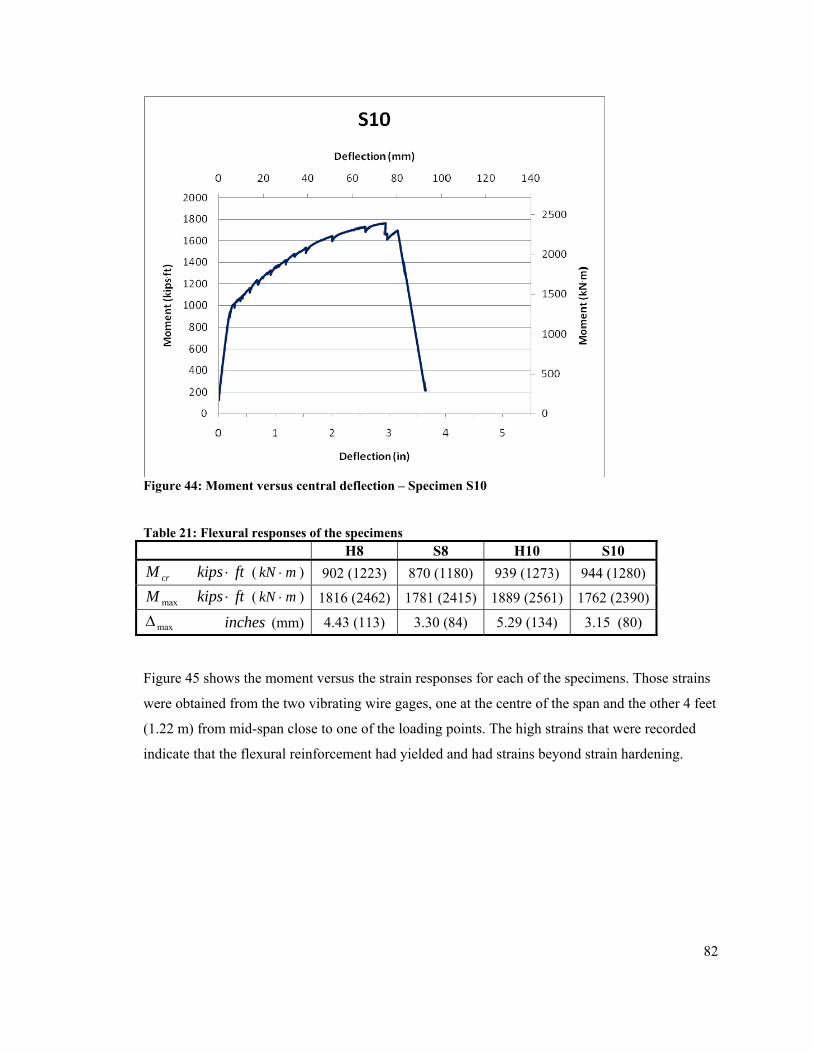
82
Figure 44: Moment versus central deflection – Specimen S10
Table 21: Flexural responses of the specimens H8 S8 H10 S10
crM ftkips ⋅ ( mkN ⋅ ) 902 (1223) 870 (1180) 939 (1273) 944 (1280)
maxM ftkips ⋅ ( mkN ⋅ ) 1816 (2462) 1781 (2415) 1889 (2561) 1762 (2390)
maxΔ inches (mm) 4.43 (113) 3.30 (84) 5.29 (134) 3.15 (80)
Figure 45 shows the moment versus the strain responses for each of the specimens. Those strains
were obtained from the two vibrating wire gages, one at the centre of the span and the other 4 feet
(1.22 m) from mid-span close to one of the loading points. The high strains that were recorded
indicate that the flexural reinforcement had yielded and had strains beyond strain hardening.
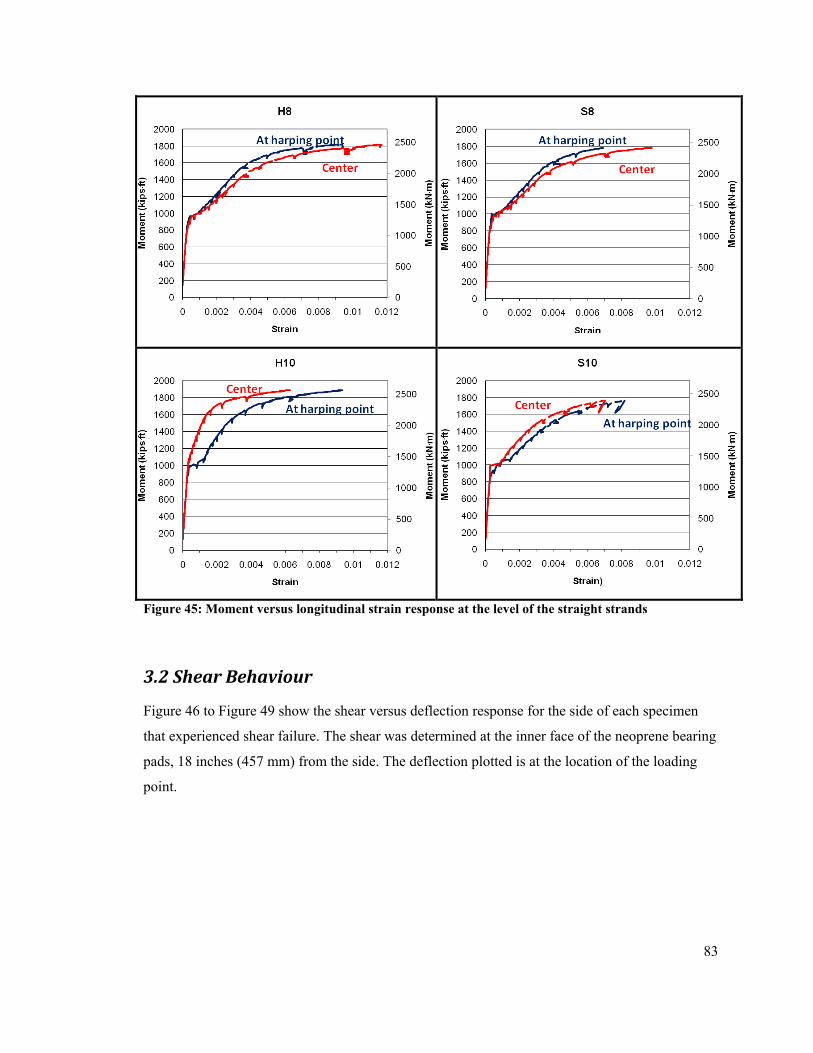
83
Figure 45: Moment versus longitudinal strain response at the level of the straight strands
3.2 Shear Behaviour
Figure 46 to Figure 49 show the shear versus deflection response for the side of each specimen
that experienced shear failure. The shear was determined at the inner face of the neoprene bearing
pads, 18 inches (457 mm) from the side. The deflection plotted is at the location of the loading
point.
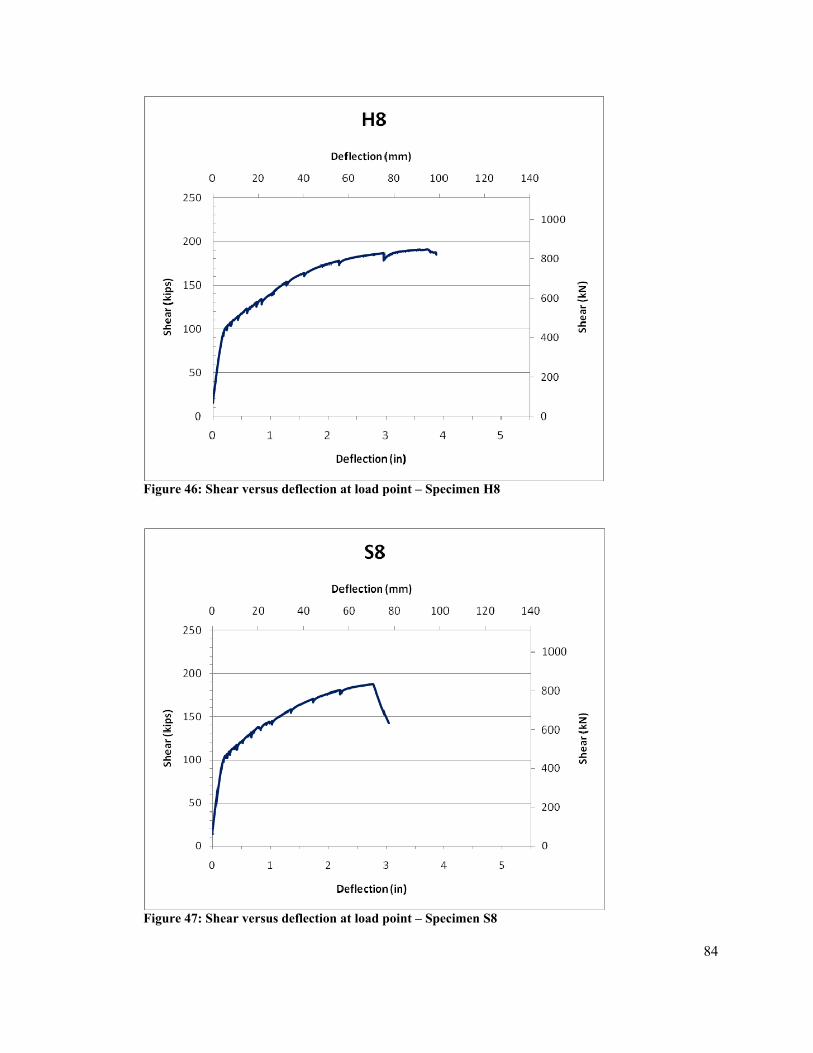
84
Figure 46: Shear versus deflection at load point – Specimen H8
Figure 47: Shear versus deflection at load point – Specimen S8
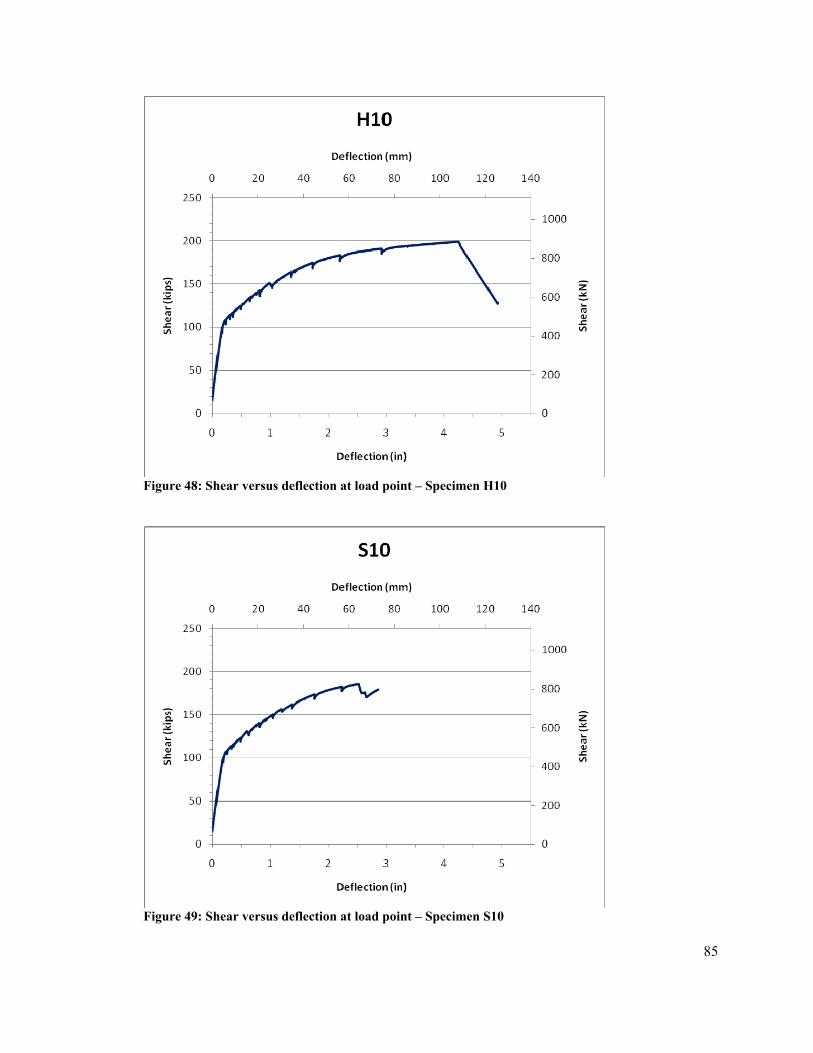
85
Figure 48: Shear versus deflection at load point – Specimen H10
Figure 49: Shear versus deflection at load point – Specimen S10
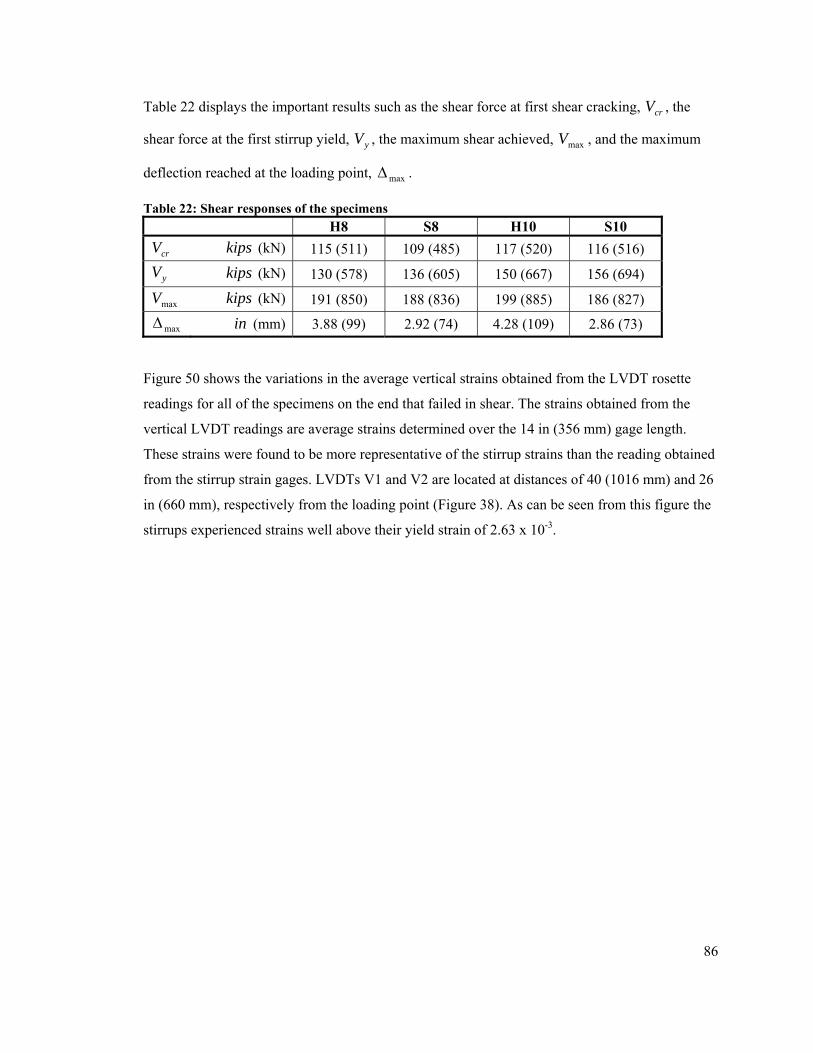
86
Table 22 displays the important results such as the shear force at first shear cracking, crV , the
shear force at the first stirrup yield, yV , the maximum shear achieved, maxV , and the maximum
deflection reached at the loading point, maxΔ .
Table 22: Shear responses of the specimens H8 S8 H10 S10
crV kips (kN) 115 (511) 109 (485) 117 (520) 116 (516)
yV kips (kN) 130 (578) 136 (605) 150 (667) 156 (694)
maxV kips (kN) 191 (850) 188 (836) 199 (885) 186 (827)
maxΔ in (mm) 3.88 (99) 2.92 (74) 4.28 (109) 2.86 (73)
Figure 50 shows the variations in the average vertical strains obtained from the LVDT rosette
readings for all of the specimens on the end that failed in shear. The strains obtained from the
vertical LVDT readings are average strains determined over the 14 in (356 mm) gage length.
These strains were found to be more representative of the stirrup strains than the reading obtained
from the stirrup strain gages. LVDTs V1 and V2 are located at distances of 40 (1016 mm) and 26
in (660 mm), respectively from the loading point (Figure 38). As can be seen from this figure the
stirrups experienced strains well above their yield strain of 2.63 x 10⁻³.
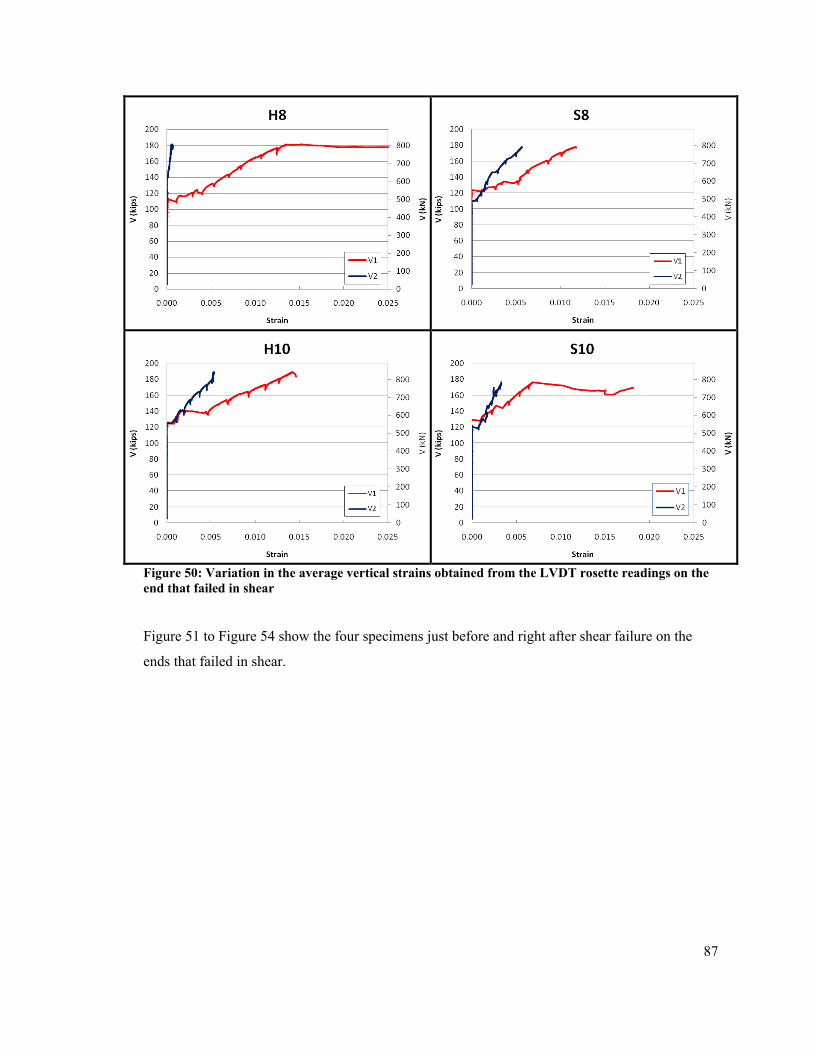
87
Figure 50: Variation in the average vertical strains obtained from the LVDT rosette readings on the end that failed in shear
Figure 51 to Figure 54 show the four specimens just before and right after shear failure on the
ends that failed in shear.
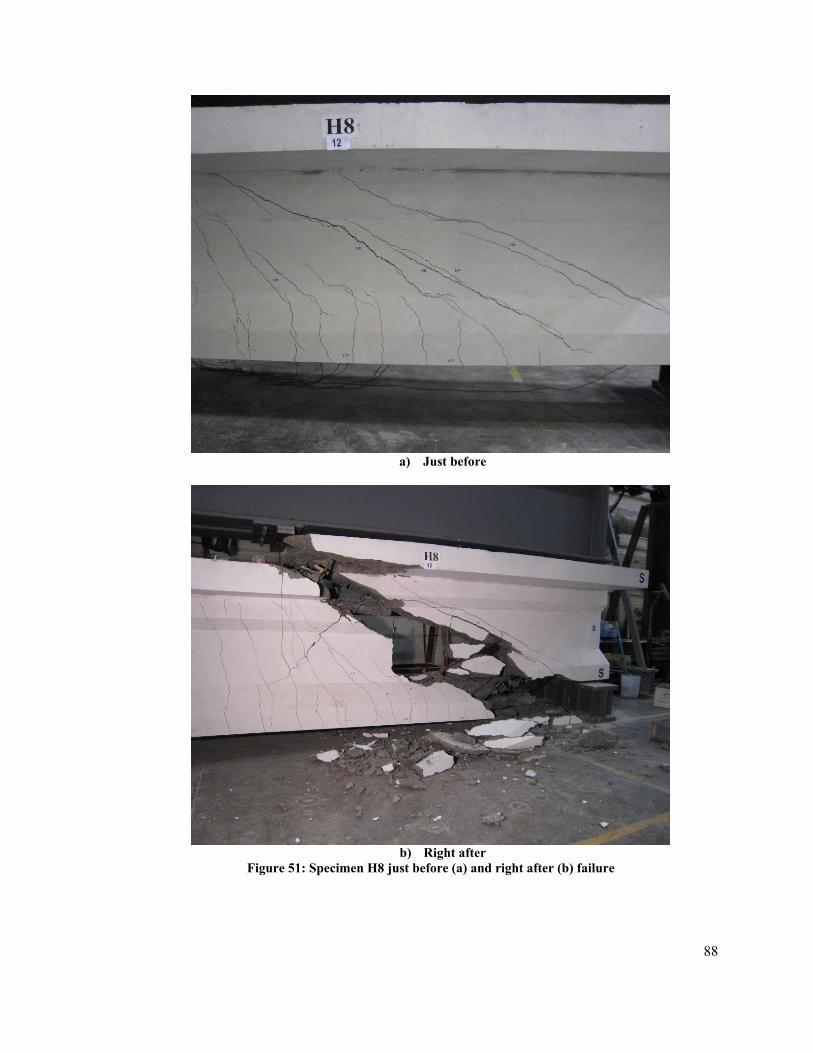
88
a) Just before
b) Right after
Figure 51: Specimen H8 just before (a) and right after (b) failure
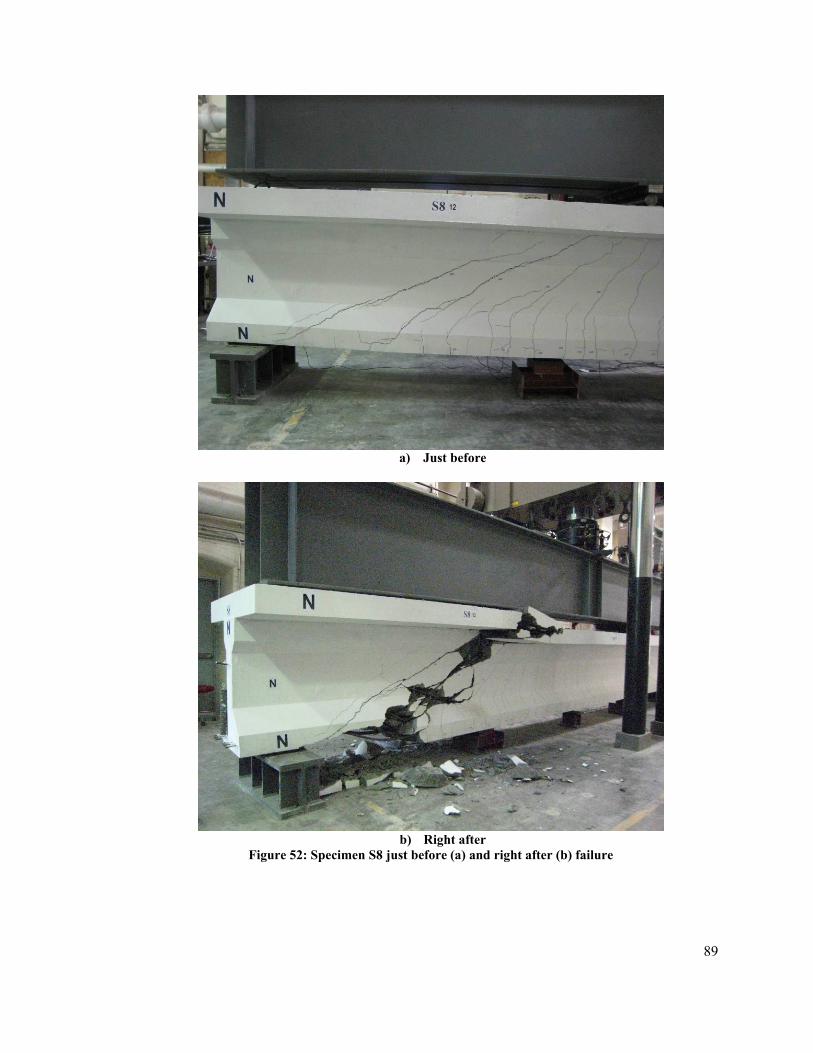
89
a) Just before
b) Right after
Figure 52: Specimen S8 just before (a) and right after (b) failure
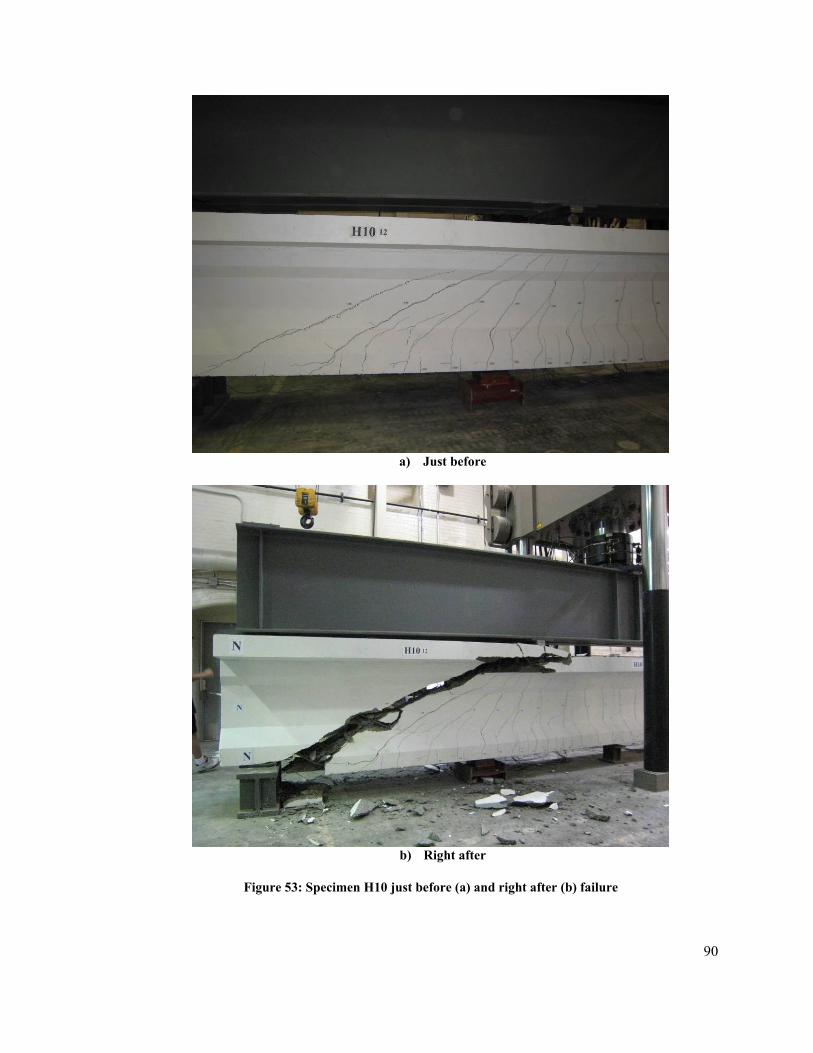
90
a) Just before
b) Right after
Figure 53: Specimen H10 just before (a) and right after (b) failure
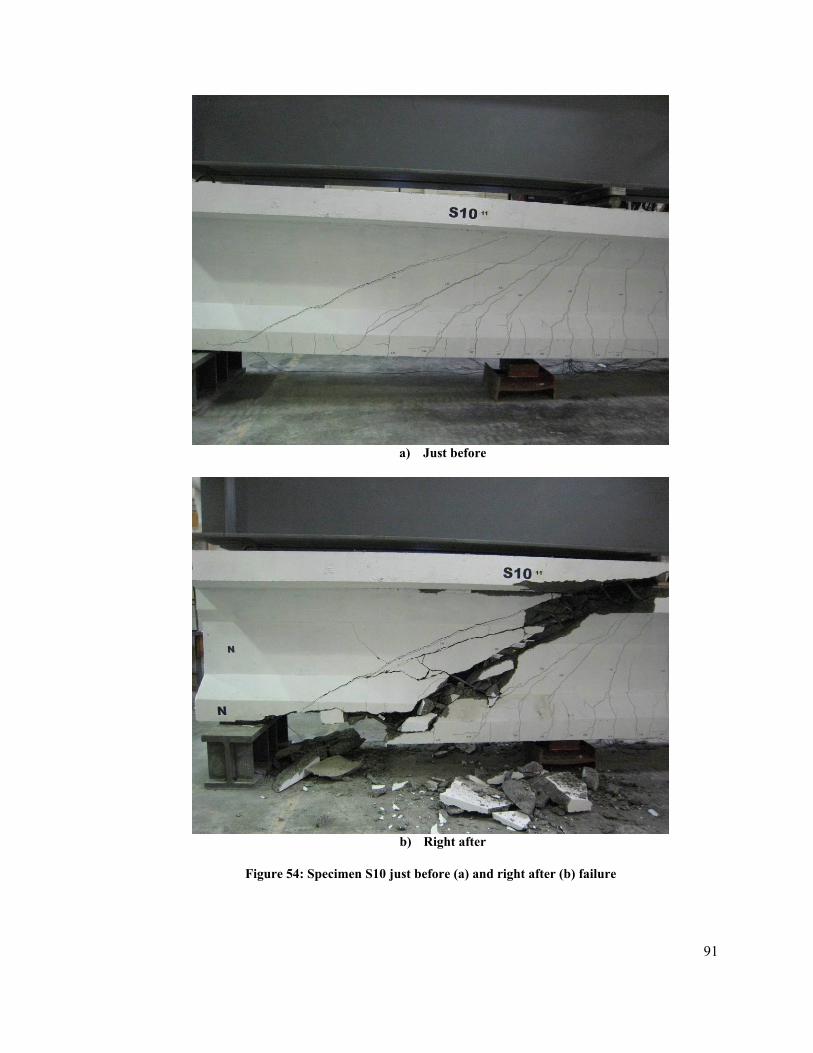
91
a) Just before
b) Right after
Figure 54: Specimen S10 just before (a) and right after (b) failure
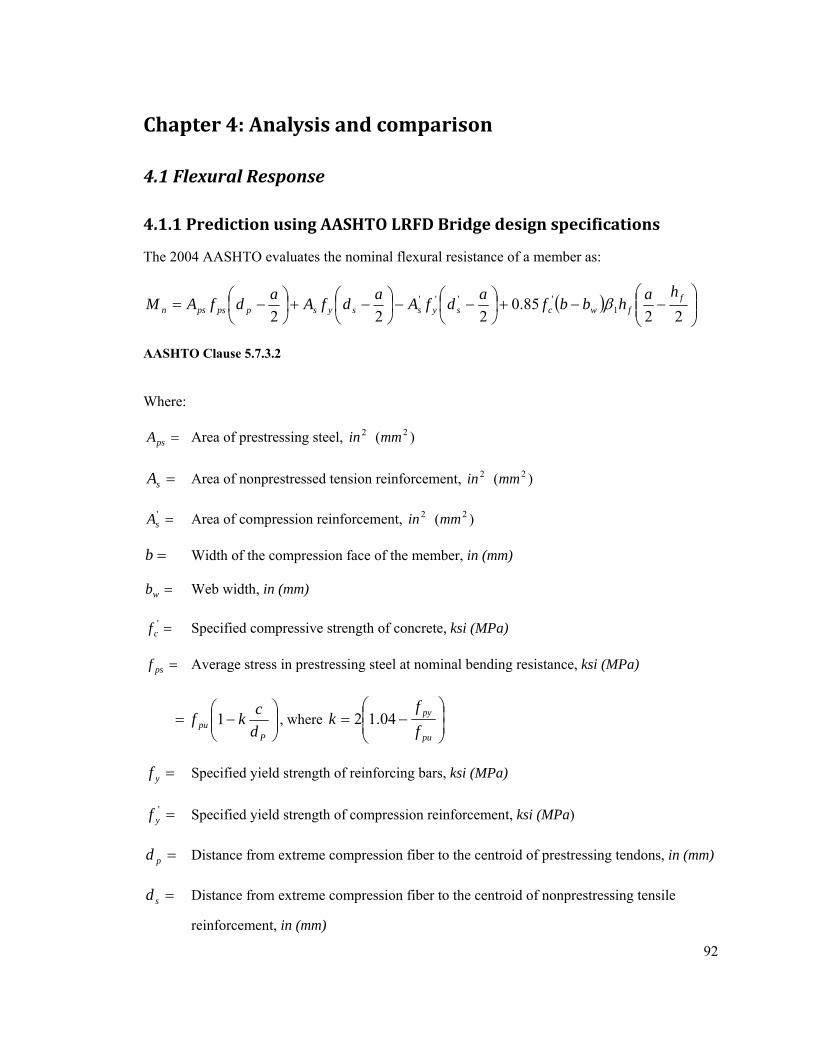
92
Chapter 4: Analysis and comparison
4.1 Flexural Response
4.1.1 Prediction using AASHTO LRFD Bridge design specifications
The 2004 AASHTO evaluates the nominal flexural resistance of a member as:
( ) ⎟⎟⎠
⎞⎜⎜⎝
⎛−−+⎟
⎠⎞
⎜⎝⎛ −−⎟
⎠⎞
⎜⎝⎛ −+⎟
⎠⎞
⎜⎝⎛ −=
2285.0
222 1'''' f
fwcsyssysppspsn
hahbbfadfAadfAadfAM β
AASHTO Clause 5.7.3.2
Where:
=psA Area of prestressing steel, 2in )( 2mm
=sA Area of nonprestressed tension reinforcement, 2in )( 2mm
='sA Area of compression reinforcement, 2in )( 2mm
=b Width of the compression face of the member, in (mm)
=wb Web width, in (mm)
='cf Specified compressive strength of concrete, ksi (MPa)
=psf Average stress in prestressing steel at nominal bending resistance, ksi (MPa)
⎟⎟⎠
⎞⎜⎜⎝
⎛−=
Ppu d
ckf 1 , where ⎟⎟⎠
⎞⎜⎜⎝
⎛−=
pu
py
ff
k 04.12
=yf Specified yield strength of reinforcing bars, ksi (MPa)
='yf Specified yield strength of compression reinforcement, ksi (MPa)
=pd Distance from extreme compression fiber to the centroid of prestressing tendons, in (mm)
=sd Distance from extreme compression fiber to the centroid of nonprestressing tensile
reinforcement, in (mm)
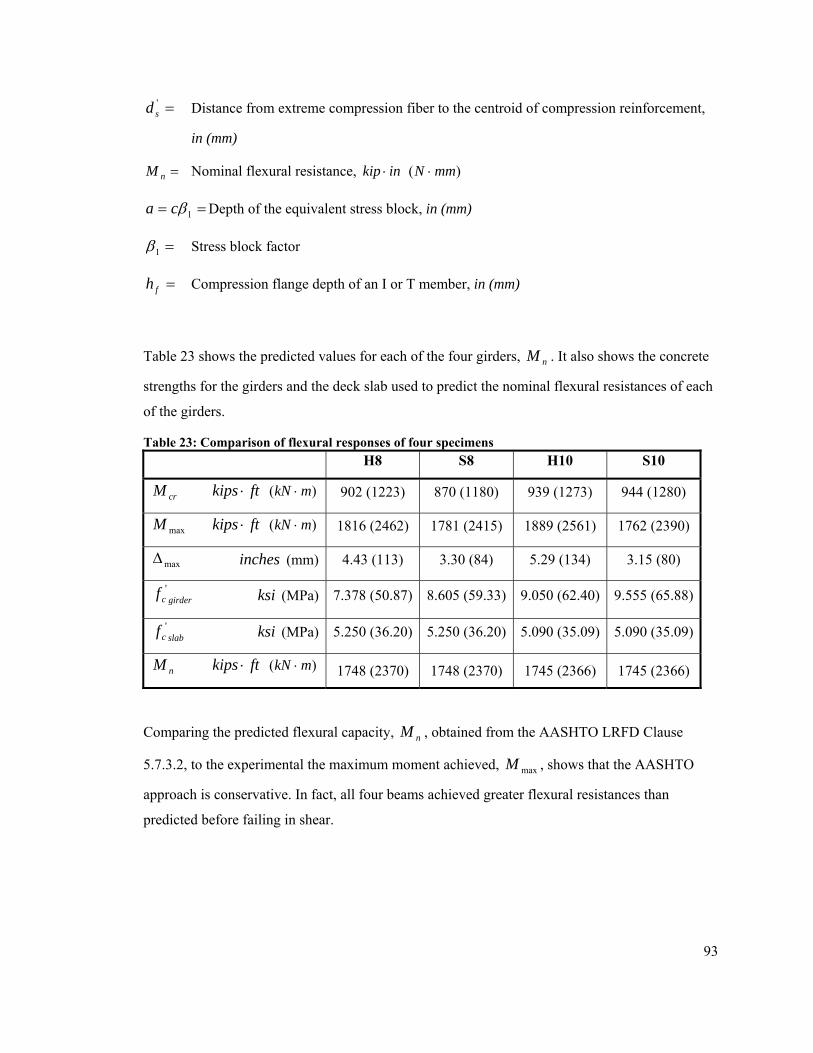
93
='sd Distance from extreme compression fiber to the centroid of compression reinforcement,
in (mm)
=nM Nominal flexural resistance, inkip ⋅ )( mmN ⋅
== 1βca Depth of the equivalent stress block, in (mm)
=1β Stress block factor
=fh Compression flange depth of an I or T member, in (mm)
Table 23 shows the predicted values for each of the four girders, nM . It also shows the concrete
strengths for the girders and the deck slab used to predict the nominal flexural resistances of each
of the girders.
Table 23: Comparison of flexural responses of four specimens H8 S8 H10 S10
crM ftkips ⋅ )( mkN ⋅ 902 (1223) 870 (1180) 939 (1273) 944 (1280)
maxM ftkips ⋅ )( mkN ⋅ 1816 (2462) 1781 (2415) 1889 (2561) 1762 (2390)
maxΔ inches (mm) 4.43 (113) 3.30 (84) 5.29 (134) 3.15 (80)
girdercf ' ksi (MPa) 7.378 (50.87) 8.605 (59.33) 9.050 (62.40) 9.555 (65.88)
slabcf ' ksi (MPa) 5.250 (36.20) 5.250 (36.20) 5.090 (35.09) 5.090 (35.09)
nM ftkips ⋅ )( mkN ⋅ 1748 (2370) 1748 (2370) 1745 (2366) 1745 (2366)
Comparing the predicted flexural capacity, nM , obtained from the AASHTO LRFD Clause
5.7.3.2, to the experimental the maximum moment achieved, maxM , shows that the AASHTO
approach is conservative. In fact, all four beams achieved greater flexural resistances than
predicted before failing in shear.
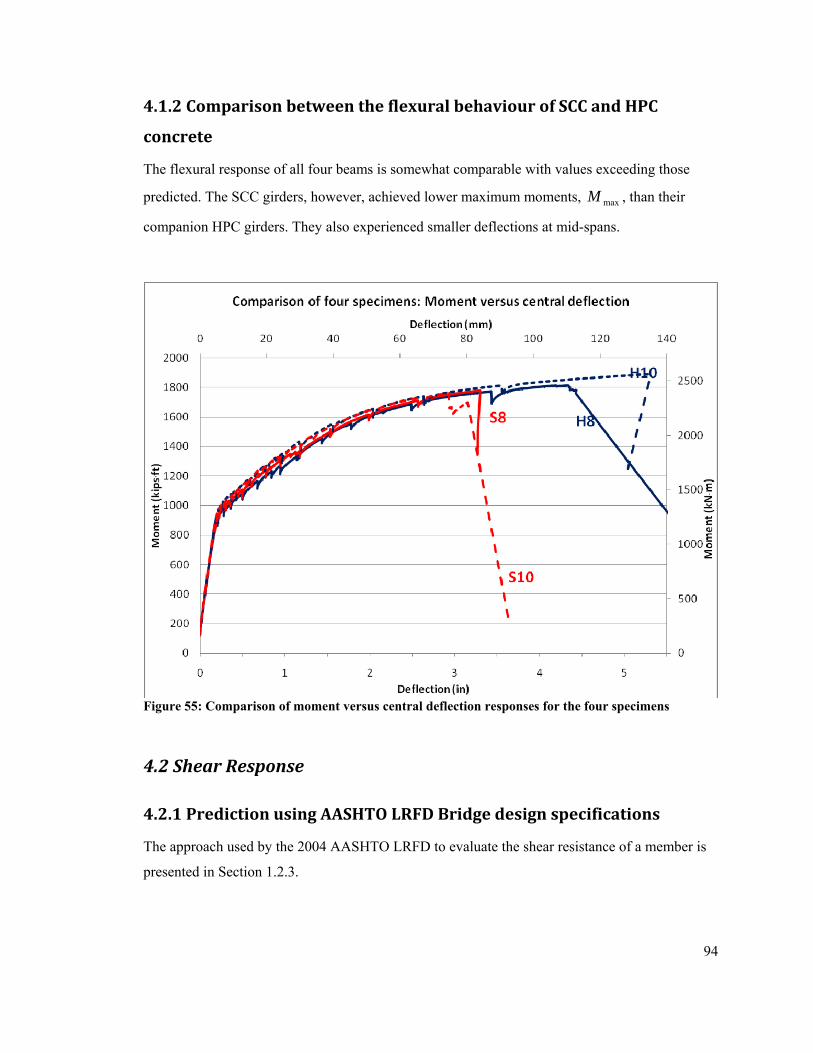
94
4.1.2 Comparison between the flexural behaviour of SCC and HPC
concrete
The flexural response of all four beams is somewhat comparable with values exceeding those
predicted. The SCC girders, however, achieved lower maximum moments, maxM , than their
companion HPC girders. They also experienced smaller deflections at mid-spans.
Figure 55: Comparison of moment versus central deflection responses for the four specimens
4.2 Shear Response
4.2.1 Prediction using AASHTO LRFD Bridge design specifications
The approach used by the 2004 AASHTO LRFD to evaluate the shear resistance of a member is
presented in Section 1.2.3.
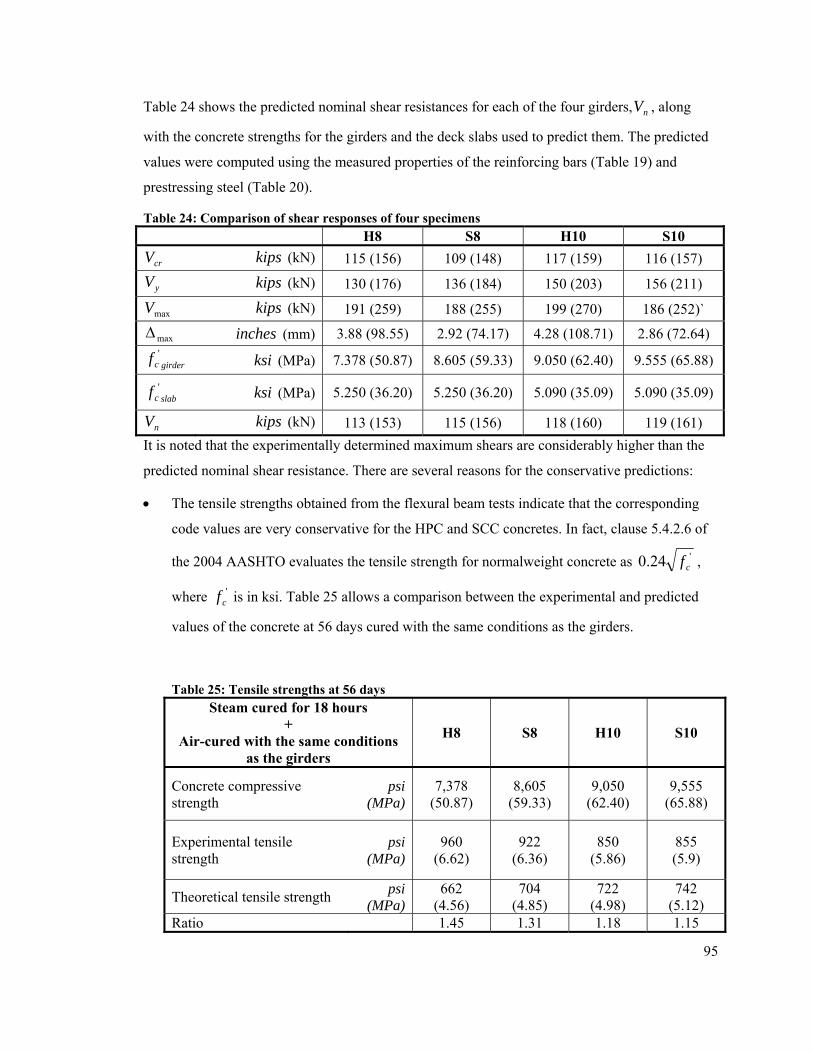
95
Table 24 shows the predicted nominal shear resistances for each of the four girders, nV , along
with the concrete strengths for the girders and the deck slabs used to predict them. The predicted
values were computed using the measured properties of the reinforcing bars (Table 19) and
prestressing steel (Table 20).
Table 24: Comparison of shear responses of four specimens H8 S8 H10 S10
crV kips (kN) 115 (156) 109 (148) 117 (159) 116 (157)
yV kips (kN) 130 (176) 136 (184) 150 (203) 156 (211)
maxV kips (kN) 191 (259) 188 (255) 199 (270) 186 (252)`
maxΔ inches (mm) 3.88 (98.55) 2.92 (74.17) 4.28 (108.71) 2.86 (72.64)
girdercf ' ksi (MPa) 7.378 (50.87) 8.605 (59.33) 9.050 (62.40) 9.555 (65.88)
slabcf ' ksi (MPa) 5.250 (36.20) 5.250 (36.20) 5.090 (35.09) 5.090 (35.09)
nV kips (kN) 113 (153) 115 (156) 118 (160) 119 (161) It is noted that the experimentally determined maximum shears are considerably higher than the
predicted nominal shear resistance. There are several reasons for the conservative predictions:
• The tensile strengths obtained from the flexural beam tests indicate that the corresponding
code values are very conservative for the HPC and SCC concretes. In fact, clause 5.4.2.6 of
the 2004 AASHTO evaluates the tensile strength for normalweight concrete as '24.0 cf ,
where 'cf is in ksi. Table 25 allows a comparison between the experimental and predicted
values of the concrete at 56 days cured with the same conditions as the girders.
Table 25: Tensile strengths at 56 days Steam cured for 18 hours
+ Air-cured with the same conditions
as the girders
H8 S8 H10 S10
Concrete compressive strength
psi(MPa)
7,378 (50.87)
8,605 (59.33)
9,050 (62.40)
9,555 (65.88)
Experimental tensile strength
psi (MPa)
960 (6.62)
922 (6.36)
850 (5.86)
855 (5.9)
Theoretical tensile strength psi (MPa)
662 (4.56)
704 (4.85)
722 (4.98)
742 (5.12)
Ratio 1.45 1.31 1.18 1.15
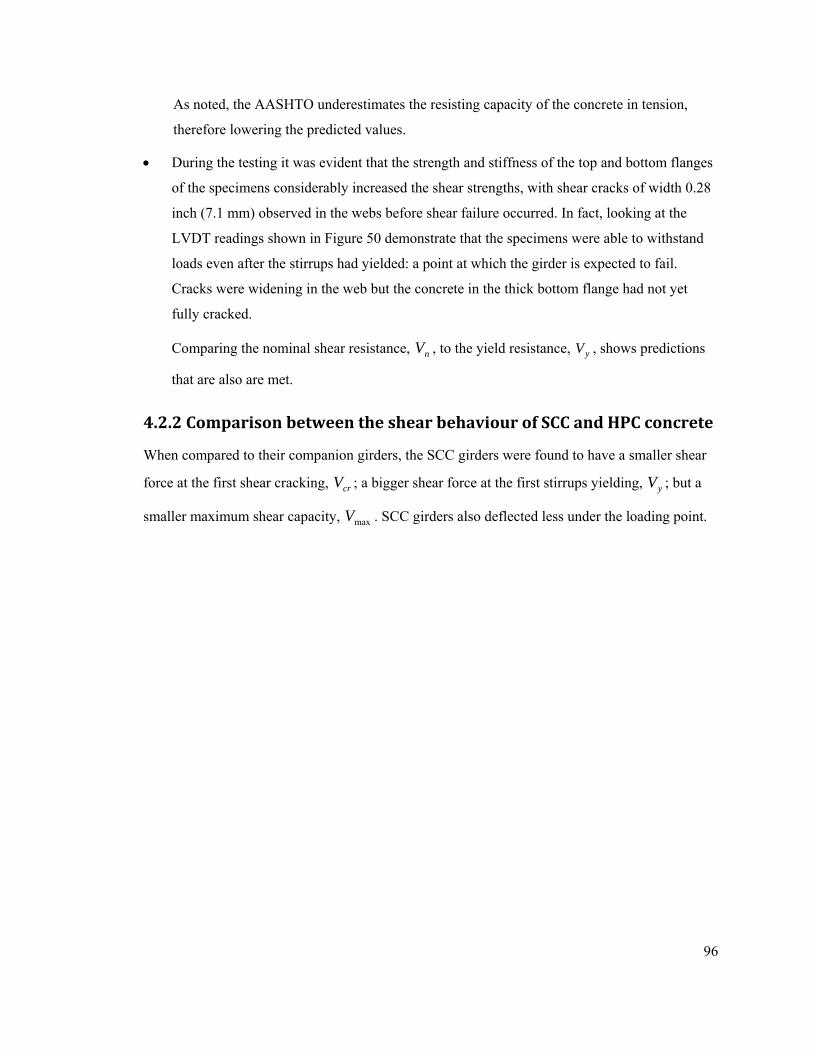
96
As noted, the AASHTO underestimates the resisting capacity of the concrete in tension,
therefore lowering the predicted values.
• During the testing it was evident that the strength and stiffness of the top and bottom flanges
of the specimens considerably increased the shear strengths, with shear cracks of width 0.28
inch (7.1 mm) observed in the webs before shear failure occurred. In fact, looking at the
LVDT readings shown in Figure 50 demonstrate that the specimens were able to withstand
loads even after the stirrups had yielded: a point at which the girder is expected to fail.
Cracks were widening in the web but the concrete in the thick bottom flange had not yet
fully cracked.
Comparing the nominal shear resistance, nV , to the yield resistance, yV , shows predictions
that are also are met.
4.2.2 Comparison between the shear behaviour of SCC and HPC concrete
When compared to their companion girders, the SCC girders were found to have a smaller shear
force at the first shear cracking, crV ; a bigger shear force at the first stirrups yielding, yV ; but a
smaller maximum shear capacity, maxV . SCC girders also deflected less under the loading point.
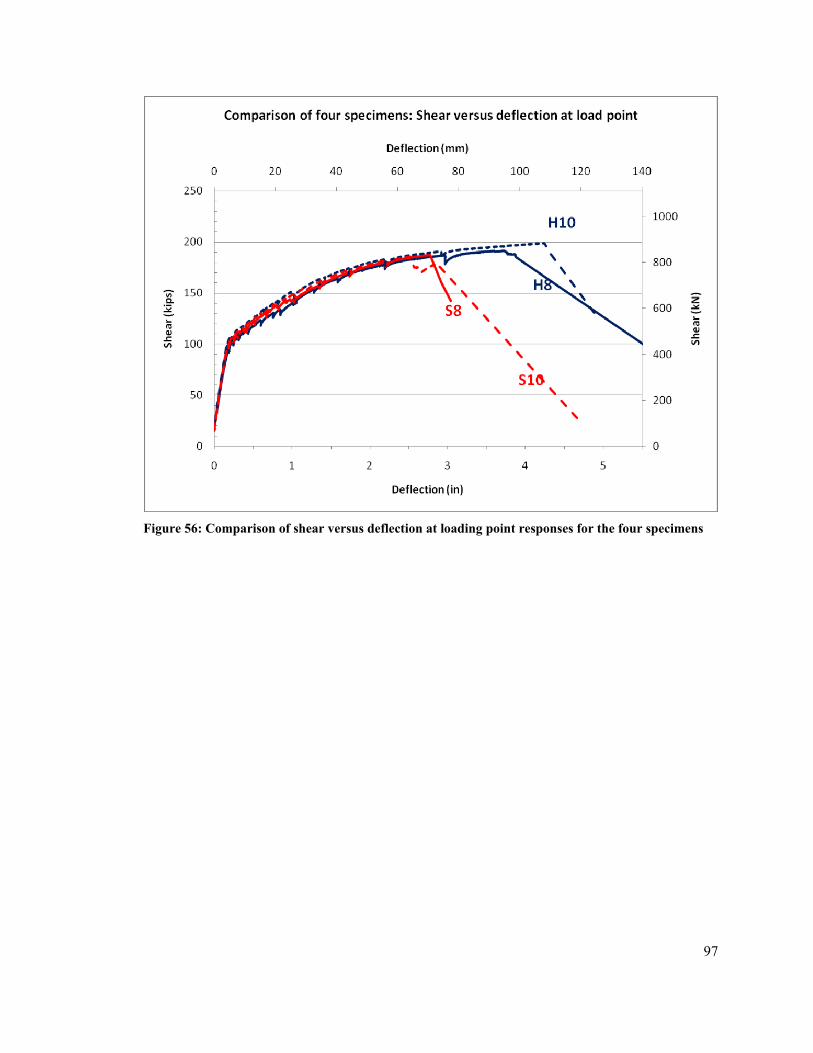
97
Figure 56: Comparison of shear versus deflection at loading point responses for the four specimens
98
Chapter 5: Conclusions
The following conclusions arise from the construction and testing of the precast pretensioned
girders:
• The placement of the SCC mixture was successful: with casting only from one location at
mid-span of the girders, the concrete made its way to both ends without leaving any voids
even in areas of congested reinforcing steel. Moreover, there were fewer “bug holes” in the
SCC concrete than the HPC.
• There was no visible segregation of the concrete in all four specimens.
• During the steam-curing operation, the target chamber temperatures of 131 oF (55 oC) and 140
oF (60 oC) for both 8,000 and both 10,000 psi (55.2 and 69 MPa) concrete mixture,
respectively, was not achieved. The maximum concrete temperature reached, however, was
below the maximum temperature allowed of 150 oF (65.6 oC).
• The target compressive strengths at 18-hours, required for the prestress release, of both SCC
mixtures were met. The HPC mixtures showed values below but were very close to their target
strengths.
• The transfer lengths found for all four concrete types and mixtures were similar. Moreover,
they were all considerably shorter than values predicted by the ACI 318-08 Code and the 2004
AASHTO Specifications.
• The cracking moments were similar for the SCC girders and their companion HPC girders.
The uncracked and cracked stiffnesses for all four girders were similar, although the SCC
girders experienced slightly lower maximum moments.
• The HPC girders experienced flexural resistances which exceeded the predicted nominal
resistance using the 2004 AASHTO Specifications. For the 8,000 and 10,000 psi (55.2 and 69
MPa) concrete girders, the experimental flexural resistances exceeded the predicted
resistances by 3.8% and 8.3%, respectively.
• The SCC girders also experienced flexural resistances which exceeded the predicted nominal
resistance using the 2004 AASHTO Specifications. For the 8,000 and 10,000 psi (55.2 and 69
MPa) concrete girders, the experimental flexural resistances exceeded the predicted ones by
1.9% and by less than 0.1%, respectively.
99
• All four girders failed in shear after developing a significant number of wide shear cracks. The
maximum shear crack widths before failure were greater than 0.24 inch (6.1 mm). The stirrups
developed significant strains, beyond strain hardening, with the stirrups rupturing at failure.
• The cracking and maximum shears were similar for all four girders, although the SCC girders
experienced slightly lower resistances.
• The HPC and SCC girders experienced failure shears which exceeded the predicted nominal
resistance using the 2004 AASHTO Specifications. The experimental shear failures exceeded
the predicted values by 56% to 69%. This increased shear resistance was probably due to the
strength and stiffness of the top and bottom flanges of the AASHTO girders.
• The HPC girders experienced higher deflections and hence higher ductilities than their
companion SCC girders.
• The lower shear resistance and lower ductility experienced by the SCC girders is probably due
to the lower volume of coarse aggregate, which reduces aggregate interlock and results in a
lower energy absorption capability on the sliding shear failure plane.
100
References
AASHTO (American Association of State Highway and Transportation Officials) (2004). “LRFD Bridge Design Specifications,” 3rd edition, 1450 pp.
Abeles, P.W. and Bardhan-Roy, B.K. (1981). “Presstressed Concrete Designer’s Handbook,” Third edition, A Viewpoint Publication, 556 pp.
ACI (American Concrete Institute) (1989). “Building Code Requirements for Reinforced Concrete and Commentary,” ACI 318R-89.
ACI (American Concrete Institute) (1910). “Standard Building Regulations for the Use of Reinforced Concrete,” NACU Standard No.4.
ACI (American Concrete Institute) (2008). “ACI Building Code Requirements for Structural Concrete and Commentary,” ACI 318-08, 471 pp.
ACI‐ASCE Committee 326. “Shear and Diagonal Tension”, ACI Journal, Vol. 59, Jan., Feb., and Mar. 1962, pp. 1‐30, 277‐344, and 352‐396.
ACI-ASCE Committee 426. “Shear Strength of Reinforced Concrete Members”, Journal of the structural division, ASCE, V.99, No ST6, June 1973, pp. 1091-1187.
ACI Committee 318 (1963). “Commentary on Building Code Requirements for Reinforced Concrete”, Report of ACI Committee 318, Standard building code.
American Society of Testing and Materials, “Specification for Uncoated 7-Wire Stress-Relieved Steel Strand for Prestressed Concrete,” ASTM A416-85, ASTM, Philadelphia, 1985.
American Society of Testing and Materials, “Standard Specification for Uncoated Stress-Relieved Steel Wires for Prestressed Concrete,” ASTM A421-80, ASTM, Philadelphia, 1980.
American Society of Testing and Materials, “Standard Specification for High-Strength Steel Bar for Prestressed Concrete,” ASTM A722-75, ASTM, Philadelphia, 1981.
American Society of Testing and Materials, “Standard Test Method for Passing Ability of Self-Consolidating Concrete by J-Ring,” ASTM C1621, ASTM, Philadelphia, 2008.
Banfill, P., Beaupre, D., Chapdelaine, P., Nachbaur, L., Sedran, T., Wallevik, O., Wallevik, J.E. (2000). “Comparison of Concrete Rheometers: International Tests at LCPC,” Nantes, France, October 2000, 157 pp.
Benaim, Robert (2008). “The Design of Prestressed Concrete Bridges – Concepts and Principles,” Taylor & Francis Group, 581 pp.
Bentz, Evan C. (2000). “Manual Membrane-2000 Response-2000 Triax-2000 Shell-2000,” University of Toronto, 85 pp.
Bresler, B., and Pister, K.S., “Strength of Concrete under Combined Stresses,” ACI Journal, Proceedings Vol. 55, No. 3, Sept. 1958, pp. 321-345.
101
Brook, R.B.S., and Brown, R.F. (1967). “A Lower Bound for the Delta-Nielson Number,” RAND Corporation, 20 pp.
Bui, Van K., Akkaya, Yilmaz and Shah, Surendra P. (2002). “Rheological Model for Self-Consolidating Concrete,” ACI Materials Journal, Proceedings Vol. 99, No. 6, Nov.-Dec. 2002, pp.549-559.
Collins, Micheal P. and Mitchell, Denis (1986). “A Rational Approach to Shear Design – The 1984 Canadian Code Provisions,” ACI Journal, Nov-Dec 1986.
Collins, M.P, and Mitchell, D. (1997), “Prestressed Concrete Structures,” Response Publications, 766 pp.
Cement Association of Canada (2006). “Autoclave Steam Curing and Atmospheric Steam Curing,” Retrieved on September 21, 2008 from: http://www.cement.ca/cement.nsf/e/ 54453B27D4742406852568AA005CAC55?OpenDocument
Elzanaty, A.H., Nilson, A.H., and Slate, F.O. (1986). “Shear Capacity of Reinforced Concrete Beams using High Strength Concrete,” ACI Journal, Proceedings Vol. 83, No. 2, Mar.-Apr. 1986, pp. 290-296.
Gerwick, Ben C. (1993). “Construction of Prestressed Concrete Structures,” Second edition, A Wiley Interscience Publication, 591 pp.
Guralnick, S.A., “Shear Strength of Reinforced Concrete Beams,” Journal of the Structural Division, ASCE, Vol. 85, No. ST1, Jan 1959, pp. 1-42.
Gurjar, A. (2004). “Mix Design and Testing of Self-Consolidating Concrete using Florida Materials,” Daytona Beach, The Florida Department of Transportation, 113 pp.
Hewson, Nigel R. (2003). “Prestressed Concrete Bridge: Design and Construction,” Thomas Telford, 371 pp.
Honestad, E., “What do we know about Diagonal Tension in Web Reinforcement in Concrete” University of Illinois Engineering Experiment Station, Circular Series, No. 64, 1954, 47 pp.
Hwang, Soo-Duck, Khayat, Kamal H. and Bonneau, Olivier (2006). “Performance-Based Specifications of Self-Consolidating Concrete Used in Structural Applications,” ACI Material Journal, Vol. 103, No. 2, Mar.-Apr. 2006, pp. 121-130.
Johnson, M.K., and Ramirez, J.A. (1989). “Minimum Shear Reinforcement in Beams with Higher Strength Concrete,” ACI Journal, Proceedings Vol. 86, No. 4, Jul.-Aug. 1989, pp. 378-382
Khayat, K.H. (1999). “Workability, Testing, and Performance of Self-Consolidating Concrete,” ACI Materials Journal, Proceedings Vol. 96, No. 3, May-June 1999, pp. 346-353.
Khayat, Kamal Henri and Mitchell, Denis (2009). “Self Consolidating Concrete for Precast, Prestressed Concrete Bridge Elements,” Transportation Research Board, NCHRP report 18-12, Issue number 628, 101pp.
102
Klieger, Paul (1960). “Some Aspects of Durability and Volume Change of Concrete for Prestressing,” Research Department Bulletin RX118, Portland Cement Association, http://www.portcement.org/pdf_files/RX118.pdf, 15 pp.
Koehler, E. and Fowler, D. (2003). “Summary of Concrete Workability Test Methods,” Austin, International Center for Aggregates Research, University of Texas at Austin.
MacGregor, J. G., “Challenges and Changes in the Design of Concrete Structures”, Concrete International: Design & Construction, V.6, No.2, Feb. 1984, pp. 48-52.
Mitchell, D, and Collins M.P. (1974). “Diagonal Compression Field Theory – A Rational Model for Structural Concrete in Pure Torsion.” ACI Journal, Proceedings Vol. 71, Aug. 1974, pp. 396-408.
Mphonde, A.G., and Frantz, G.C. (1985). “Shear Tests of High and Low Strength Concrete Beams with Stirrups,” ACI Journal, Proceedings Vol. 87, No. 10 on High Strength Concrete, pp. 179-196.
Naito, C., Brunn, G., Parent, G., and Tate, T. (2005). “Comparative Performance of High Early Strength and Self Consolidated Concrete for Use in Precast Bridge Beam Construction,” ATLSS Report, No. 05-03, May 2005, 102 pp.
National Ready Mixed Concrete Association (2008). “Testing Innovation: other Methods in Segregation Measurements,” http://www.selfconsolidatingconcrete.org/Advanced%20Topics/testing-%202b.htm
Nawy, Edward G. (1996). “Prestressed concrete – A fundamental approach,” Second edition, Prentice Hall International Series in Civil Engineering and Engineering Mechanics, 789 pp.
Nilson, A.H. (1987). “High Strength Concrete: An Overview of Cornell Research,” Proceedings of Symposium on Utilization of High Strength Concrete, Stavanger, Norway, June 1987, pp. 27-38
Ozyildirim, C. and Lane, D.S. (2003). “Final Report: Evaluation of Self-Consolidating Concrete,” Charlottesville, Virginia Transportation Research Council.
Prestressed Concrete Institute (1985). “PCI Design Handbook: Precast and Prestressed Concrete,” 3rd edition, PCI, Chicago, 1985.
RESPONSE 2000 Version 1.0.5, Bentz, Evan C., University of Toronto, Ontario, Canada.
Roller, J.J., and Russell, H.G. (1990). “Shear Strength of High Strength Concrete Beams with Web Reinforcement,” ACI Journal, Proceedings Vol. 87, No. 2, Mar.-Apr. 1990, pp. 191-198.
Russell, B.W. and Burns, N.H. (1997). “Measurement of Transfer Lengths on Pretensioned Concrete Elements”, Journal of Structural Engineering, ASCE, Vol. 123, No. 5, May 1997, pp. 541-549.
103
Shahawy, M.A and Batchelor, B. DeV (1996). “Shear Behaviour of Full-Scale Prestressed Concrete Girder: Comparison between AASHTO Specifications and LRFD Code.” PCI Journal, Proceedings Vol. 41, No. 3, May-June 1996, pp. 48-53.
Sonebi, Mohammed, Tamimi, Adil K., and Bartor Peter J.M. (2003). “Performance and Cracking Behavior of Reinforced Beams Cast with Self-Consolidating Concrete,” ACI Materials Journal, Proceedings Vol. 100, No. 6, Nov.-Dec. 2003, pp. 492-500.
Tepponen, Pirjo, and Eriksson, Bo-Erik (1987). "Damages in Concrete Railway Sleepers in Finland," Nordic Concrete Research, Publication No. 6, The Nordic Concrete Federation, Oslo, 1987.
Vecchio, F.J., and Collins, M.P. (1982). “The Response of Reinforced Concrete to In-Place Shear and Normal Stresses,” Department of Civil Engineering, University of Toronto, March 1982, 332 pp.
Vecchio, F.J., and Collins, M.P. (1986). “The Modified Compression Field Theory for Reinforced Concrete Elements Subjected to Shear,” ACI Journal, Proceedings Vol. 83, No. 2, Mar.-Apr. 1986, pp. 219-231.
Wagner, H. (1929). “Metal Beams with Very Thin Webs,” Zeitshrift fur Flugtechnik und Motorluftshiffahr, Vol. 20, No. 8 to 12.
Walther, R., “Calculation of the Shear Strength of Reinforced and Prestressed Concrete Beams by the Shear Failure Theory,” Translation 110, Cement and Concrete Association from Beton und Stahlbetonbau, Vol. 57, No. 11, Nov. 1962, pp. 261-271.
Zwoyer, E.M, an Siess, C.P., “Ultimate Strength in Shear of Simply Supported Prestressed Concrete Beams without Web Reinforcement,” ACI Journal, Proceedings Vol. 51, Oct 1984, pp. 181-200.
Related Documents