SELF ADAPTING OPS DASHBOARDS Barry Krawchuk | Research Scientist September 25, 2017 | Washington, DC

Welcome message from author
This document is posted to help you gain knowledge. Please leave a comment to let me know what you think about it! Share it to your friends and learn new things together.
Transcript

SELF ADAPTING OPS DASHBOARDS
Barry Krawchuk | Research Scientist
September 25, 2017 | Washington, DC

During the course of this presentation, we may make forward-looking statements regarding future events or the expected performance of the company. We caution you that such statements reflect our current expectations and estimates based on factors currently known to us and that actual events or results could differ materially. For important factors that may cause actual results to differ from those contained in our forward-looking statements, please review our filings with the SEC.
The forward-looking statements made in this presentation are being made as of the time and date of its live presentation. If reviewed after its live presentation, this presentation may not contain current or accurate information. We do not assume any obligation to update any forward looking statements we may make. In addition, any information about our roadmap outlines our general product direction and is subject to change at any time without notice. It is for informational purposes only and shall not be incorporated into any contract or other commitment. Splunk undertakes no obligation either to develop the features or functionality described or to include any such feature or functionality in a future release.
Splunk, Splunk>, Listen to Your Data, The Engine for Machine Data, Splunk Cloud, Splunk Light and SPL are trademarks and registered trademarks of Splunk Inc. in the United States and other countries. All other brand names, product names, or trademarks belong to their respective owners. © 2017 Splunk Inc. All rights reserved.
Forward-Looking Statements
THIS SLIDE IS REQUIRED FOR ALL 3 PARTY PRESENTATIONS.
▶ Integration of NYS Information Technology• 55 State Agencies• 10,000 Servers• 144,000 Employees
“A computer lover’s heaven with every kind of software and computer you could ever want”
Information Technology Services
New York State

© 2017 SPLUNK INC.
A voice in the corner of the office
“It’s a Love Hate Relationship.”
© 2017 SPLUNK INC.
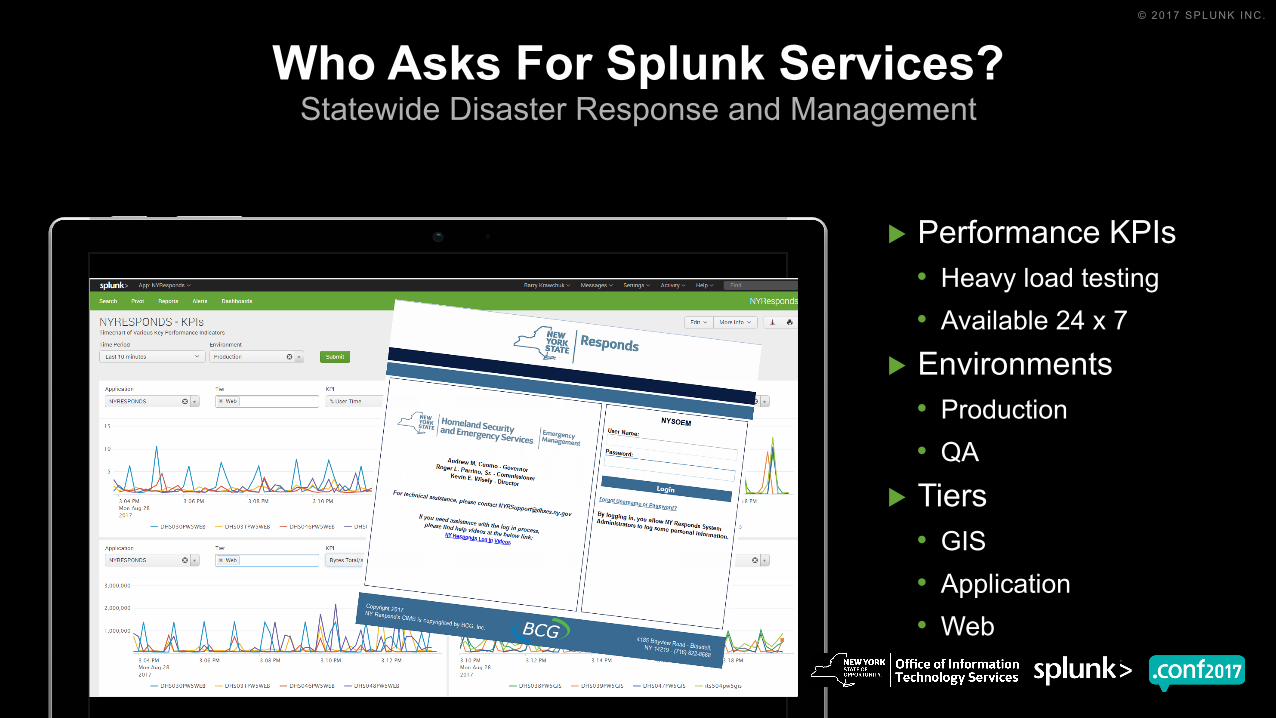
▶ Performance KPIs• Heavy load testing• Available 24 x 7
▶ Environments• Production• QA
▶ Tiers• GIS• Application• Web
Who Asks For Splunk Services?Statewide Disaster Response and Management

© 2017 SPLUNK INC.
▶ Performance KPIs▶ Errors and Usage▶ Environments
• 67 hosts• PROD, QA & DEV
▶ Tiers• datapower, ftp, mail• mq, was, wbm, wpo,
wps• web
Who Asks For Splunk Services?NYS Integrated Justice Information Portal
© 2017 SPLUNK INC.
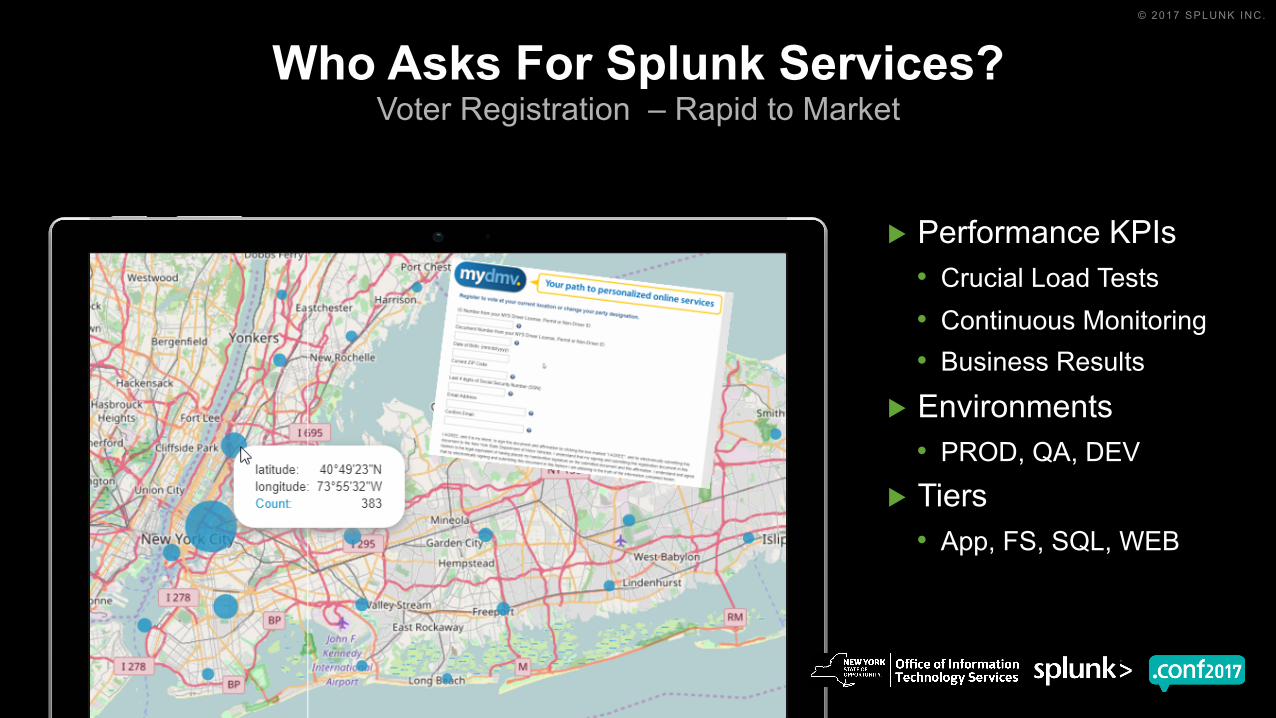
▶ Performance KPIs• Crucial Load Tests• Continuous Monitoring• Business Results
▶ Environments• PROD, QA, DEV
▶ Tiers• App, FS, SQL, WEB
Who Asks For Splunk Services? Voter Registration – Rapid to Market

▶ By now it should be clear:• NYS has a large demand for Splunk Services
− Many agencies, many applications− Critical business delivery requirements− Streamlined request system
• Requests will be very diverse• Speed, speed, speed
Information Technology SystemsSplunk Team

© 2017 SPLUNK INC.
▶ Performance KPIs• Processor Time• Bandwidth Utilization• Page Faults• Disk Free
Standard OPS Dashboard - WindowsDeployed into the Password Manager Application

© 2017 SPLUNK INC.
▶ Select Collection of Hosts by Function• Time • Environment
− Prod, QA etc
• Tier− Db, Web, App
The Use Case (civil service) is sensed automatically by being in the APP
Standard OPS Dashboard - UNIXDeployed into the Password Manager Application

© 2017 SPLUNK INC.
1. ONBOARD lookup that organizes the hosts the way the user wants to see them.
2. SPLUNK_APPS lookup that ties the current APP name to the hosts needed.
3. Auto-sensing javascript in dashboards that knows the current APP.
Make OPS dashboards auto sensing
How?

▶ Details about hosts, sources and sourcetypes▶ Categorize hosts by:
• Environment• Middleware Tier
▶ Business case justifying resources• Security requirements• Retention• Estimate of size
▶ Accept responsibility to inform Splunk Team of changes
Splunk Service RequestITSM Service Request – Open to All

Tier2
Tier3
Tier1
Application – Use Case – Splunk APPLike Motor Voter, Pub1075, Excelsior, Biztalk, Aspera, DNS, Tivoli …
Environment – Stage of DevelopmentLike Prod, Dev, Staging, Test, QA …
Tier – Software ClassificationLike DB, Web, WAS, app … Multiply connected.
Use Case HierarchyThe hosts can be grouped into three levels
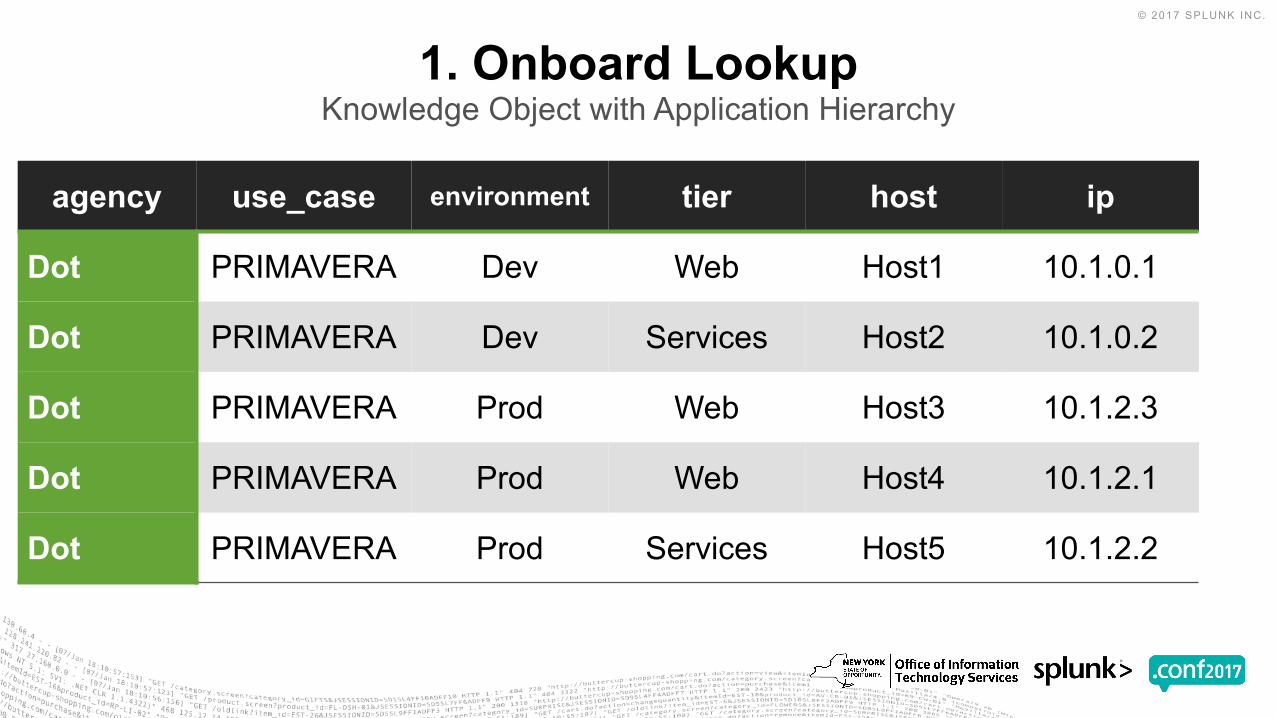
agency use_case environment tier host ip
Dot PRIMAVERA Dev Web Host1 10.1.0.1
Dot PRIMAVERA Dev Services Host2 10.1.0.2
Dot PRIMAVERA Prod Web Host3 10.1.2.3
Dot PRIMAVERA Prod Web Host4 10.1.2.1
Dot PRIMAVERA Prod Services Host5 10.1.2.2
1. Onboard LookupKnowledge Object with Application Hierarchy

▶ Lookup Advantages over Tag• Global Knowledge Object• Easy to setup, change, test and deploy • Uses database tools to manage changes
Lookup table can be used to setup a search to find which hosts are not reporting data
ONBOARDImplemented by a Global Lookup

Local App Name use_case
Justice_center JUSTICE
Primavera PRIMAVERA
Hesc EXCELSIOR
Hunt_fish_ny HUNTFISH
Biztalk BIZTALK
2. SPLUNK_APPS LookupZips the local APP name to Use Case

▶ To sense the current APP name, insert reference in the first line of the simple XML
<form script="set_app_token.js"> …
• Creates $app$ token• See Define Custom Tokens in Splunk 6.x Dashboard Examples• Built into Splunk 6.6
3. Autosense APP NameImplemented by JavaScript
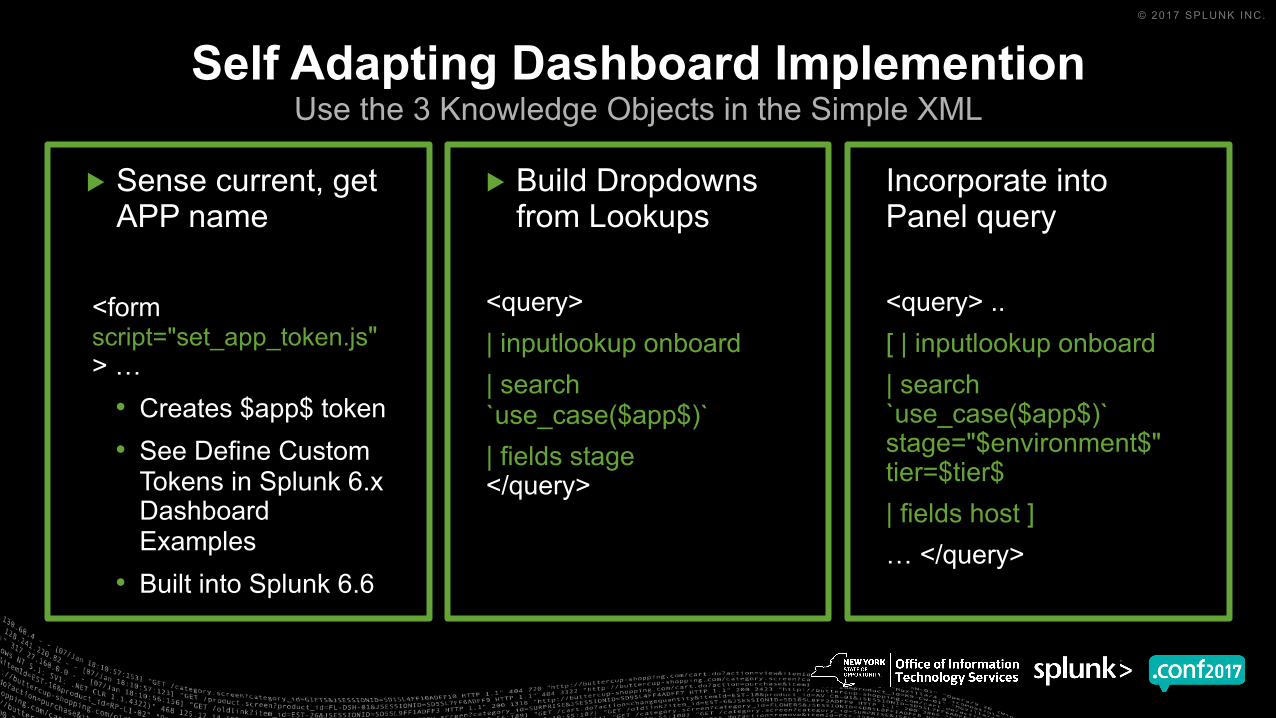
▶ Sense current, get APP name
<form script="set_app_token.js"> …
• Creates $app$ token• See Define Custom
Tokens in Splunk 6.x Dashboard Examples
• Built into Splunk 6.6
▶ Build Dropdowns from Lookups
<query>| inputlookup onboard | search `use_case($app$)` | fields stage</query>
Incorporate into Panel query
<query> ..[ | inputlookup onboard | search `use_case($app$)` stage="$environment$" tier=$tier$ | fields host ]… </query>
Self Adapting Dashboard ImplementionUse the 3 Knowledge Objects in the Simple XML

© 2017 SPLUNK INC.
So How Is It Fast and Easy?
We make the dashboard into a template!

© 2017 SPLUNK INC.
▶ Provisos:• ONBOARD Loaded
− use_case− environment− tier
− hosts
• SPLUNK_APP Loaded− splunk_app− use_case
New APP CreationStandard OPS Dashboard Deployed Immediately
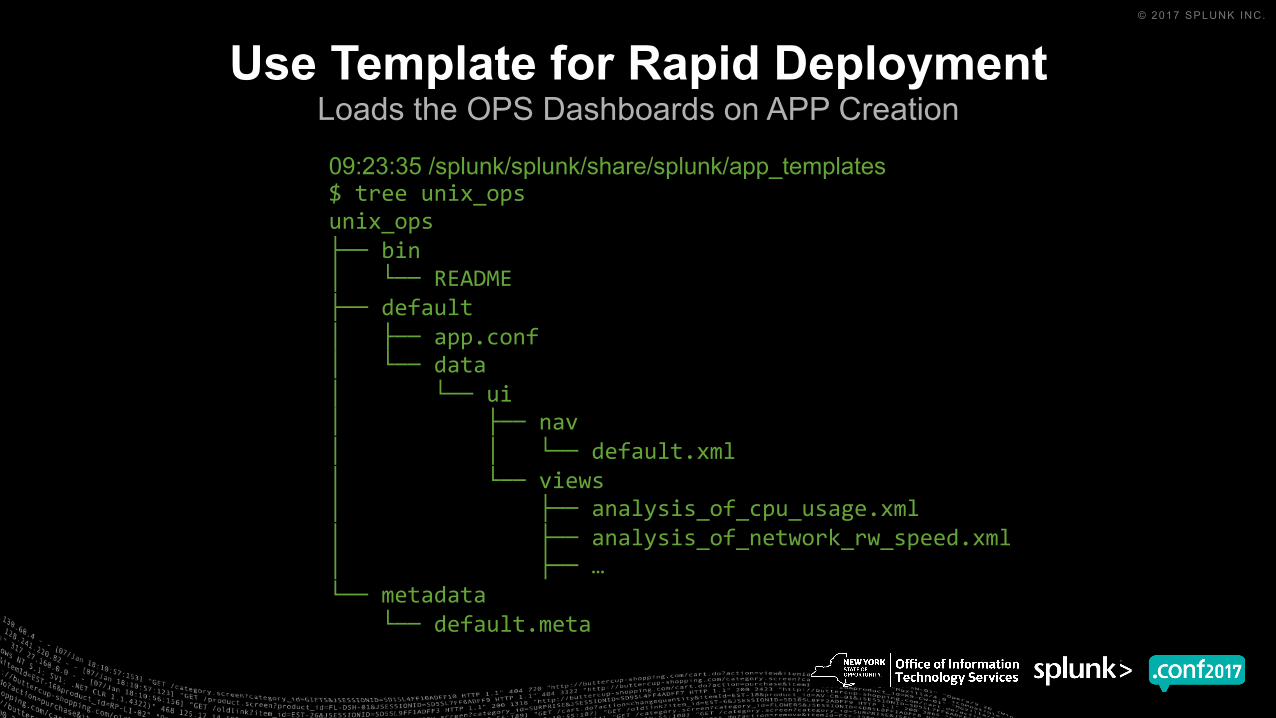
Use Template for Rapid DeploymentLoads the OPS Dashboards on APP Creation09:23:35 /splunk/splunk/share/splunk/app_templates$ tree unix_opsunix_ops├── bin│ └── README├── default│ ├── app.conf│ └── data│ └── ui│ ├── nav│ │ └── default.xml│ └── views│ ├── analysis_of_cpu_usage.xml│ ├── analysis_of_network_rw_speed.xml│ ├── … └── metadata
└── default.meta

▶ Value created as soon as the data arrives.
▶ Users do not have to create the standard dashboards.
▶ OPS dashboards are same across all applications for consistent comparison.
▶ Dashboard creation is automated. Fewer errors and more time for new features.
ResultsDeploying Standard OPS Dashboards

Splunk TeamNew York State
Office of Information Technology SystemsBarry Krawchuk, Research ScientistContact: [email protected]
@thebarryk

© 2017 SPLUNK INC.
Don't forget to rate this session in the .conf2017 mobile app

APPENDIXSome additional details

▶ Admins: Jason Mantor and Ulrike Pohlig▶ Developers: Jeff Irving, Bruce Shattuck▶ Onboarding: Susan Brownell▶ Network Developer: Craig Stillwell▶ Intern: Christopher Mitchell
AcknowledgementsSplunk Team

© 2017 SPLUNK INC.
Use current app and lookups to populate the
dropdown menus
Fill the Dropdowns

© 2017 SPLUNK INC.
Use the dropdown tokens to complete the
search
Build the Query

▶ Include all the children drilldown dashboards• If a Library app is used the user gets confused when the app context changes
▶ Make children dashboards invisible unless they can standalone. Prevent user from clicking it in dashboard list.
• <form isVisible=“false”>
▶ Protect all the dashboards from change in default.meta• access = read : [*], write : [admin]
Template GuidelinesHints

▶ Create serverclass for each set standard dashboards• serverClass:searchhead_std_apps• Populate with searchhead to receive standard dashboard
▶ Create serverclass app for each installed app• app:aspera• Etc …
▶ On deployment server in ..deployment-apps/• Create folder aspera• cp -r of production folder unix_ops (softlink?)
Modification of Standard OPSUse Deployment Server

▶ Server load, database connects▶ SCOM and/or Tivoli Alerts▶ ITSM changes/ incidents/ request▶ IPS Warnings and Threats▶ Certificate status▶ CIM compliance▶ KPI collection for ITSI glass tables▶ Standard dashboards for Web Servers
FutureAdditional OPS Dashboards
Related Documents