Selective Constraint on Human Pre-mRNA Splicing by Protein Structural Properties Jean-Christophe Gelly 1,2,3,4 , Hsuan-Yu Lin 5 , Alexandre G. de Brevern 1,2,3,4, * ,y , Trees-Juen Chuang 6, * ,y , and Feng-Chi Chen 5,7,8, * ,y 1 INSERM, UMR-S 665, Dynamique des Structures et Interactions des Macromole ´ cules Biologiques (DSIMB), Paris, France 2 Universite ´ Paris Diderot, Sorbonne Paris Cite ´ , Paris, France 3 Institut National de la Transfusion Sanguine (INTS), Paris, Paris, France 4 GR-Ex, Laboratoire d’Excellence, Paris, France 5 Division of Biostatistics and Bioinformatics, Institute of Population Health Sciences, National Health Research Institutes, Zhunan, Miaoli County, Taiwan 6 Physical and Computational Genomics Division, Genomics Research Center, Academia Sinica, Taipei, Taiwan 7 Department of Biological Science and Technology, National Chiao Tung University, Hsinchu, Taiwan 8 Department of Dentistry, China Medical University, Taichung, Taiwan *Corresponding authors: E-mail: [email protected], [email protected], [email protected]. y These authors equally contributed to this work. Accepted: August 20, 2012 Abstract Alternative splicing (AS) is a major mechanism of increasing proteome diversity in complex organisms. Different AS transcript isoforms may be translated into peptide sequences of significantly different lengths and amino acid compositions. One important question, then, is how AS is constrained by protein structural requirements while peptide sequences may be significantly changed in AS events. Here, we address this issue by examining whether the intactness of three-dimensional protein structural units (compact units in protein structures, namely protein units [PUs]) tends to be preserved in AS events in human. We show that PUs tend to occur in constitutively spliced exons and to overlap constitutive exon boundaries. Furthermore, when PUs are located at the boundaries between two alternatively spliced exons (ASEs), these neighboring ASEs tend to co-occur in different transcript isoforms. In addition, such PU-spanned ASE pairs tend to have a higher frequency of being included in transcript isoforms. ASE regions that overlap with PUs also have lower nonsynonymous-to-synonymous substitution rate ratios than those that do not overlap with PUs, indicating stronger negative selection pressure in PU-overlapped ASE regions. Of note, we show that PUs have protein domain- and structural orderness-independent effects on messenger RNA (mRNA) splicing. Overall, our results suggest that fine-scale protein structural requirements have significant influences on the splicing patterns of human mRNAs. Key words: protein unit, alternative splicing, protein structural constraint. Introduction Correct folding of a protein into its native three-dimensional (3D) structure is critical for normal protein functions. The mo- lecular mechanism responsible for protein folding is not fully understood and remains one of the most fundamental prob- lems in biological sciences. Nowadays, more than 1,000 different structural domains have been identified and deposited in protein structural databases, for example, SCOP (Structural Classification of Proteins) (Murzin et al. 1995; Andreeva et al. 2008), DDBASE (DIAL Derived Domain Database) (Vinayagam et al. 2003), PDP (Protein Domain Parser) (Alexandrov and Shindyalov 2003), CATH (Class, Archi- tecture, Topology, and Homologous superfamily) (Orengo et al. 1997; Cuff et al. 2011), or FSSP (Families of Structurally Similar Proteins) (Holm and Sander 1994). Since the beginning of the 1970s, extensive efforts have been made to decompose 3D protein structures into smaller structural units for a better resolution of biologically meaningful elements (Wetlaufer GBE ß The Author(s) 2012. Published by Oxford University Press on behalf of the Society for Molecular Biology and Evolution. This is an Open Access article distributed under the terms of the Creative Commons Attribution License (http://creativecommons.org/licenses/by-nc/3.0/), which permits unrestricted non-commercial, distribution, and reproduction in any medium, provided the original work is properly cited. For commercial re-use, please contact [email protected]. 842 Genome Biol. Evol. 4(9):842–851. doi:10.1093/gbe/evs071 Advance Access publication August 30, 2012

Welcome message from author
This document is posted to help you gain knowledge. Please leave a comment to let me know what you think about it! Share it to your friends and learn new things together.
Transcript

Selective Constraint on Human Pre-mRNA Splicing by
Protein Structural Properties
Jean-Christophe Gelly1,2,3,4, Hsuan-Yu Lin5, Alexandre G. de Brevern1,2,3,4,*,y, Trees-Juen Chuang6,*,y, andFeng-Chi Chen5,7,8,*,y
1INSERM, UMR-S 665, Dynamique des Structures et Interactions des Macromolecules Biologiques (DSIMB), Paris, France2Universite Paris Diderot, Sorbonne Paris Cite, Paris, France3Institut National de la Transfusion Sanguine (INTS), Paris, Paris, France4GR-Ex, Laboratoire d’Excellence, Paris, France5Division of Biostatistics and Bioinformatics, Institute of Population Health Sciences, National Health Research Institutes, Zhunan, Miaoli County,
Taiwan6Physical and Computational Genomics Division, Genomics Research Center, Academia Sinica, Taipei, Taiwan7Department of Biological Science and Technology, National Chiao Tung University, Hsinchu, Taiwan8Department of Dentistry, China Medical University, Taichung, Taiwan
*Corresponding authors: E-mail: [email protected], [email protected], [email protected] authors equally contributed to this work.
Accepted: August 20, 2012
Abstract
Alternative splicing (AS) is amajormechanismof increasingproteomediversity in complexorganisms.DifferentAS transcript isoforms
may be translated into peptide sequences of significantly different lengths and amino acid compositions. One important question,
then, is how AS is constrained by protein structural requirements while peptide sequences may be significantly changed in AS events.
Here, we address this issue by examining whether the intactness of three-dimensional protein structural units (compact units in
protein structures, namely protein units [PUs]) tends to be preserved in AS events in human. We show that PUs tend to occur in
constitutively spliced exons and to overlap constitutive exon boundaries. Furthermore, when PUs are located at the boundaries
between two alternatively spliced exons (ASEs), these neighboring ASEs tend to co-occur in different transcript isoforms. In addition,
suchPU-spannedASEpairs tendtohaveahigher frequencyofbeing included in transcript isoforms.ASEregions thatoverlapwithPUs
also have lower nonsynonymous-to-synonymous substitution rate ratios than those that do not overlap with PUs, indicating stronger
negative selection pressure in PU-overlapped ASE regions. Of note, we show that PUs have protein domain- and structural
orderness-independent effects on messenger RNA (mRNA) splicing. Overall, our results suggest that fine-scale protein structural
requirements have significant influences on the splicing patterns of human mRNAs.
Key words: protein unit, alternative splicing, protein structural constraint.
Introduction
Correct folding of a protein into its native three-dimensional
(3D) structure is critical for normal protein functions. The mo-
lecular mechanism responsible for protein folding is not fully
understood and remains one of the most fundamental prob-
lems in biological sciences. Nowadays, more than 1,000
different structural domains have been identified and
deposited in protein structural databases, for example, SCOP
(Structural Classification of Proteins) (Murzin et al. 1995;
Andreeva et al. 2008), DDBASE (DIAL Derived Domain
Database) (Vinayagam et al. 2003), PDP (Protein Domain
Parser) (Alexandrov and Shindyalov 2003), CATH (Class, Archi-
tecture, Topology, and Homologous superfamily) (Orengo
et al. 1997; Cuff et al. 2011), or FSSP (Families of Structurally
Similar Proteins) (Holm and Sander 1994). Since the beginning
of the 1970s, extensive efforts have been made to decompose
3D protein structures into smaller structural units for a better
resolution of biologically meaningful elements (Wetlaufer
GBE
� The Author(s) 2012. Published by Oxford University Press on behalf of the Society for Molecular Biology and Evolution.
This is an Open Access article distributed under the terms of the Creative Commons Attribution License (http://creativecommons.org/licenses/by-nc/3.0/), which permits unrestricted
non-commercial, distribution, and reproduction in any medium, provided the original work is properly cited. For commercial re-use, please contact [email protected].
842 Genome Biol. Evol. 4(9):842–851. doi:10.1093/gbe/evs071 Advance Access publication August 30, 2012
1973; Wetlaufer and Ristow 1973; Rossman and Liljas 1974).
Among theses elements, protein structural domains are espe-
cially described and studied (Wetlaufer and Ristow 1973; Hol-
land et al. 2006; Xu et al. 2006). Such subdivisions of protein
sequences have important implications for evolutionary stu-
dies. For example, structurally ordered peptide regions are
known to evolve more slowly than disordered regions
(Brown et al. 2010), for the former usually contain more func-
tional protein domains (Ponting and Russell 2002) and are
supposedly subject to stronger functional constraints.
Recently, a novel approach—protein peeling—has been pro-
posed to divide 3D peptide structures into small structural
units, termed protein units (PUs) (Gelly, de Brevern, et al.
2006; Gelly and de Brevern 2011). A PU corresponds to a
protein sequence fragment with a high number of intraunit
contacts between residues. A protein is cut into a series of PUs
maximizing these numbers, whereas the number of contacts
between PUs is minimized, thus creating highly compact PUs
(Gelly and de Brevern 2011).
PUs are composed of consecutive amino acid sequences.
Because the consecutiveness of protein sequences may
change with protein isoforms that result from alternative
splicing (AS) of messenger RNAs (mRNAs), AS may have
the potential to drastically change protein structures. To
date, only a small number of protein isoform structures
(fewer than 10) can be found in Protein Data Bank (PDB;
Stetefeld and Ruegg 2005). Researchers have linked some
structural properties (e.g., protein termini) to AS events
(Birzele et al. 2008). However, the effects of AS on 3D protein
structures and the related selective constraints remain
underexplored.
One previous study done by Panchenko et al. (1996)
compared substructures named “foldons” to exons. The au-
thors showed that on a limited set of 16 proteins, exons cor-
respond with foldons. Foldons are isolated from protein
structures using an energetic criterion. These structural units
differ from PUs in terms of size and frequency of occurrence
along protein sequences, although they do share some similar
properties with PUs. The small number of proteins examined,
however, cannot support the general applicability of their
findings. Tress et al. (2007) suggested that the spectrum of
conventional enzymatic or structural functions is unlikely to be
substantially extended through AS events. In addition, previ-
ous analyses have shown that AS rarely changes protein do-
mains but can significantly modify protein structures (Birzele
et al. 2008; Menon et al. 2011). Therefore, the commonly
used protein domains may not provide clear signals in view
of selective constraint on AS, possibly because they are gen-
erally of huge size. Meanwhile, PUs, which are intermediates
between protein domains and local protein conformations,
could be better adjusted to AS than domains because of
their smaller sizes and are thus more appropriate for studying
the correlation between AS and protein structure. For ex-
ample, when a PU overlaps an exon–exon boundary, it may
occasionally be disrupted when the exon–exon junction is
altered by AS. We reason that if PUs are biologically important,
such disruptions should be avoided. In other words, the build-
ing blocks of 3D structural units (i.e., PUs) should be arranged
at the one-dimensional level (exon–exon junctions) in such a
pattern that maintains the intactness of the structural units.
Accordingly, we generated the following hypotheses: 1) PUs
tend to occur in constitutively spliced exons (CSEs; i.e., exons
that are always included in different transcript isoforms), so
that AS may not cause the exclusion of these structural units;
2) when PUs cross exon boundaries, these boundaries tend to
always occur in different transcript isoforms (in other words,
these boundaries tend to be “constitutive boundaries”);
3) when PUs cross the exon boundaries flanked by pairs of
alternatively spliced exons (ASEs; i.e., exons that are occasion-
ally excluded from some transcript isoforms), these ASE pairs
tend to co-occur in transcript isoforms; 4) PU-spanned ASE–
ASE pairs tend to have a higher frequency of being included in
different transcript isoforms; and 5) PU-spanned ASE regions
tend to evolve more slowly than non-PU-spanned ASE
regions.
To examine these hypotheses, we decomposed the avail-
able human 3D protein structures into PUs, and mapped these
PUs onto the corresponding transcripts. Our results show that
PUs have significant influences on the pattern of AS and the
evolution of exons in human. These observations suggest that
the selective constraints on fine-scale structural units (i.e., PUs)
and regulations of mRNA splicing may be concordant with
each other.
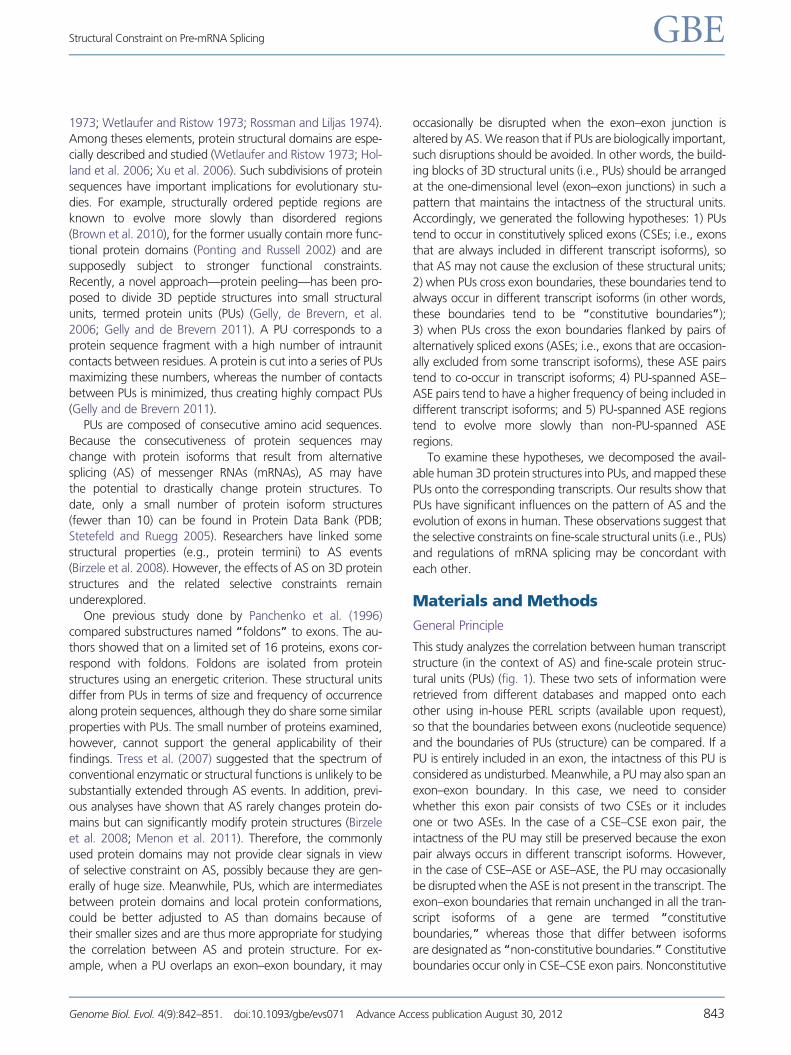
Materials and Methods
General Principle
This study analyzes the correlation between human transcript
structure (in the context of AS) and fine-scale protein struc-
tural units (PUs) (fig. 1). These two sets of information were
retrieved from different databases and mapped onto each
other using in-house PERL scripts (available upon request),
so that the boundaries between exons (nucleotide sequence)
and the boundaries of PUs (structure) can be compared. If a
PU is entirely included in an exon, the intactness of this PU is
considered as undisturbed. Meanwhile, a PU may also span an
exon–exon boundary. In this case, we need to consider
whether this exon pair consists of two CSEs or it includes
one or two ASEs. In the case of a CSE–CSE exon pair, the
intactness of the PU may still be preserved because the exon
pair always occurs in different transcript isoforms. However,
in the case of CSE–ASE or ASE–ASE, the PU may occasionally
be disrupted when the ASE is not present in the transcript. The
exon–exon boundaries that remain unchanged in all the tran-
script isoforms of a gene are termed “constitutive
boundaries,” whereas those that differ between isoforms
are designated as “non-constitutive boundaries.” Constitutive
boundaries occur only in CSE–CSE exon pairs. Nonconstitutive
Structural Constraint on Pre-mRNA Splicing GBE
Genome Biol. Evol. 4(9):842–851. doi:10.1093/gbe/evs071 Advance Access publication August 30, 2012 843
boundaries occur mostly in CSE–ASE and ASE–ASE exon pairs,
but in rare cases, they may also occur in CSE–CSE exon pairs
(when one or both of the CSEs have alternative 50- or 30-exon
boundaries).
Protein Structures and the Definition of PUs
The 3D structures of human proteins were downloaded from
the PDB (http://www.pdb.org, last accessed Sept. 9, 2012)
(PDB Release of Tuesday, April 12, 2011) (Bernstein et al.
1977). We then filtered the structures to keep only those ob-
tained from X-ray experiments and those that share no more
than 95% of sequence identity with each other (to avoid re-
dundancy) using the PICSES webserver (Wang and Dunbrack
2005). In the end, we obtained 5,563 protein structures. The
PUs were generated using a local Protein Peeling 3D server
(www.dsimb.inserm.fr/dsimb_tools/peeling3/, last accessed
Sept. 9, 2012) (Gelly and de Brevern 2011). For the algorithm,
the protein structures are described as a succession of a
carbon atom of each residue. The distances between Ca are
translated into contact probabilities using a logistic function.
Protein Peeling only uses this contact probability matrix.
An optimization procedure, based on the Matthews’ coeffi-
cient of correlation between contact probability submatrices,
defines optimal cutting points that separate the examined
region into two or three PUs. The process is iterated until
the compactness of the resulting PUs reaches a given limit.
Default parameters of Protein Peeling (Gelly, Etchebest, et al.
2006) were used in this study.
Mapping Exons to PUs
The retrieved PDB peptide chains were BLASTP aligned against
the human known proteins annotated in the Ensembl data-
base (Release 61; www.ensembl.org, last accessed Sept. 9,
2012) to identify the corresponding Ensembl peptide se-
quences. To ensure the accuracy of this cross-database map-
ping, we required that the alignable length be �95% of the
Ensembl sequence, and the query and target sequences be at
least 95% identical. The Ensembl transcripts that correspond
to the identified Ensembl peptides were retrieved for the ana-
lysis of transcript structure. We required that the Ensembl
transcript sequences contain a start codon at the 50-end and
a stop codon at the 30-end of the coding sequence to ensure
that the sequences are complete. In the end, we obtained
2,946 human transcripts (genes), which include 34,949
coding exons. To analyze AS events, we also retrieved the
9,342 known transcript isoforms (with known protein prod-
ucts and the start and stop codons) encoded by the 2,946
genes. Among the analyzed genes, 690 encode only one
known transcript. On average, each gene in this data set
has �3.2 (9,342/2,946) transcript isoforms. The distribution
of the number of transcript isoforms per gene is illustrated in
supplementary figure S1, Supplementary Material online. To
control for the effects of protein domains on transcript struc-
ture, we also retrieved the Pfam domain information from the
Ensembl database (Release 61). An in-house PERL script was
used to analyze the retrieved Ensembl known transcripts to
classify exons into CSEs and ASEs and to calculate the
FIG. 1.—The general principle of this study.
Gelly et al. GBE
844 Genome Biol. Evol. 4(9):842–851. doi:10.1093/gbe/evs071 Advance Access publication August 30, 2012

weighted exon frequency (WEF, explained in the next section).
The identified Ensembl peptide sequences were aligned with
their PDB sequence partners using MUSCLE 3.7 (Edgar 2004)
with default parameters. The corresponding exon boundaries
were then mapped onto the protein structures (and the PUs
within) according to the alignment files.
Definition of WEF
WEF is the length-weighted average of the frequency an exon
occurs in alternatively spliced transcript isoforms (supplemen-
tary fig. S2, Supplementary Material online). Briefly, the fre-
quency of an exon was defined as the proportion of transcript
isoforms that include this exon. Therefore, by definition, CSEs
should have an exon frequency of 100%. As CSEs appear to
be important for the structures and normal functions of the
proteins where they belong, we reason that exons with a high
frequency may be biologically important, which is actually
supported by our recent study (Chen, Liao, et al. 2012).
However, because exons from different transcript isoforms
usually partially overlap with each other (supplementary fig.
S2, Supplementary Material online), the “frequency” of an
exon may be difficult to define. Therefore, we divided each
exon into several subregions according to how it overlaps with
exons from different transcript isoforms. The WEF was defined
as the length-weighted average of the frequencies of such
subregions.
Computation of Observed/Expected (O/E) Ratio ofPU-Containing Exons and PU-Spanned Exon Boundaries
To examine whether the intactness of PUs tends to be pre-
served, we calculated the O/E ratios of exons that contain
complete PUs (PU-containing exons) and the O/E ratios of
exon boundaries that overlap with a PU (PU-spanned exon
boundaries). The expected numbers of PU-containing exons
were calculated with reference to the percentages of CSEs
(31.6%) and ASEs (68.4%) observed in our data set
(table 1). Specifically, the total number of PU-containing
exons is 9,130 (3,674 CSEs + 5,456 ASEs). The expected
number of CSEs that contain PUs is 9,130*31.6%¼ 2,885.
Similarly, the observed number of ASEs that contain PUs is
9,130*68.4%¼ 6,245. The O/E ratio is simply the observed
number divided by the expected number of CSEs (or ASEs).
The O/E ratios for PU-spanned exon boundaries were
computed in a similar way. An O/E ratio larger than one indi-
cates that the event of interest occurs more frequently than
expected.
Estimation of Evolutionary Rates and Prediction ofIntrinsically Disordered Amino Acid Residues
The nucleotide sequences, peptide sequences, and orthology
information of human–mouse one-to-one orthologous genes
were downloaded from the Ensembl database (Release 61).
The human peptide sequences analyzed in this study were
aligned against the peptide isoforms encoded by the mouse
orthologous genes using MUSCLE 3.7 (Edgar 2004) with de-
fault parameters. For each human peptide, the longest align-
able mouse peptide was selected. The peptide sequence
alignments were back translated to nucleotide sequences,
and the exon boundaries were delineated with reference to
the human transcript annotations. The “orthologous exonic
regions” thus obtained were then submitted to the Codeml
package of PAML 4 (Yang 2007) for estimations of nonsynon-
ymous substitution rate (dN), synonymous substitution rate
(dS), and the dN/dS ratio. Of note, to ensure data quality, we
required that the alignable exonic sequence length be �90%
of the human exon. Intrinsically disordered amino acid resi-
dues were predicted by using DISOPRED 2.4 (Ward et al.
2004) with default parameters. The statistical tests (�2
and Wilcoxon rank sum tests) were done by using the R
package (R Core Team 2012). The �2 tests were conducted
with default parameters (with continuity correction
[“correct¼ TRUE”]), and the P values were exact P values
(“simulate.p.value¼ FALSE”). The Wilcoxon rank sum tests
were also conducted using default parameters (with continu-
ity correction; P values were calculated according to a normal
approximation).
The same procedure was then performed on the basis of
the known human genes (according to the human genome
version hg 19) of the UCSC (University of California Santa
Cruz) Genome Browser (http://genome.ucsc.edu, last
accessed Sept. 9, 2012).
Analysis of Covariance
To disentangle the effects of PU overlapping and structural
disorderness (or Pfam domain overlapping) on the evolution-
ary rates of protein subregions, we applied the analysis of
Table 1
The Numbers (Percentages) of CSEs and ASEs That Contain Complete PUs
No. Analyzed Exons No. Observeda No. Expectedb O/Ec
CSE 11,033 (31.6%) 3,674 2,885 1.27
ASE 23,916 (68.4%) 5,456 6,245 0.87
aObserved number of exons that contain complete PUs.bExpected number of exons that contain complete PUs. For CSEs: (3,674 + 5,456)*0.316¼ 2,885; for ASEs: (3,674 + 5,456)*0.684¼ 6,245.cNo. observed/No. expected.
Structural Constraint on Pre-mRNA Splicing GBE
Genome Biol. Evol. 4(9):842–851. doi:10.1093/gbe/evs071 Advance Access publication August 30, 2012 845
covariance (ANCOVA) (McDonald 2009) with the following
equation:
Y ¼ �0 + �1X1 + �2X2 + �12X1X2 + " ð1Þ
Where Y is the evolutionary measurement of interest (dN/dS,
dN, or dS); X1 indicates whether the region of interest overlaps
with a PU (X1¼1 if it does, otherwise X1¼0); X2 is the pro-
portion of structurally disordered region predicted by
DISOPRED 2.4 (or the proportion of Pfam domain as anno-
tated by Ensembl); and X1X2 is the interaction term between
the two variables.
Therefore, for PU-overlapped regions,
ðY jX1 ¼ 1Þ ¼ ð�0 + �1Þ + ð�2 + �12ÞX2 + " ð2Þ
Whereas for non-PU-overlapped regions,
ðY jX1 ¼ 0Þ ¼ �0 + �2X2 + " ð3Þ
If �12 6¼0, the regression slopes for PU-overlapped regions
and non-PU-overlapped regions would be considered as dif-
ferent. Alternatively, if �12�0 but �1 6¼ 0, the intercepts of the
two regression lines would be considered as different. In either
case, the factor of PU overlapping and the proportion of struc-
turally disordered regions (or Pfam domain) would be
regarded as having independent effects on the evolutionary
measurement of interest (McDonald 2009; Chen, Pan, et al.
2012). ANCOVA was conducted by using the R package with
default parameters.
Results
PUs Tend to Occur in CSEs
According to the cross-database comparison of Ensembl and
human protein structures from PDB, we retrieved 34,949
exons that can be mapped to PU-containing peptides.
Approximately two-thirds of these exons are ASEs and
one-third are CSEs (table 1). The distribution of CSEs is fairly
even across the examined peptides and so is the distribution of
PUs except that PUs seem to occur less frequently at both
termini of a peptide (supplementary fig. S3, Supplementary
Material online). We first examined whether PUs tend to fall
completely within CSEs (so that they can always be included in
the translated peptide sequences). Indeed, as presented in
table 1, the observed-to-expected (O/E) ratio of PU-containing
CSEs (1.27) is larger than unity, whereas the O/E ratio of ASEs
is smaller than 1 (0.87). The proportions of CSEs and ASEs that
contain PUs differ significantly from expected (P<2.2E�16,
by �2 test). Of note, CSEs may occasionally change their
boundaries, which may also disrupt PUs. However, only a
small percentage (3.7%¼135/3,674) of the examined CSEs
have such a “boundary effect” on the PUs within. The differ-
ence between CSEs and ASEs in table 1 remains highly signifi-
cant even if we remove these 135 CSEs. Meanwhile, CSEs are
more likely to correspond to structurally ordered protein
regions than ASEs. This preference may potentially bias our
results because PUs may be more readily identifiable in struc-
turally ordered protein regions. We thus conducted the above
analysis for CSEs and ASEs that correspond to structurally
ordered protein regions. We actually obtained a similar
result (supplementary table S1, Supplementary Material
online). This result supports our hypothesis that PUs are bio-
logically important, so that they have a higher-than-expected
probability of always occurring in mRNAs (and thus the protein
products).
Next, we compared the weighted exon frequencies (WEFs;
see Materials and Methods) between ASEs that contain PUs
and those that do not. Following the logic described earlier, if
PUs are biologically important, ASEs that contain PUs may be
more frequently included in transcript isoforms (with a higher
WEF) than those that do not. Indeed, our analysis indicates
that PU-containing ASEs have a significantly higher WEF (me-
dian¼ 0.54) than non-PU-containing ASEs (median¼ 0.50)
(P< 2.2E�16, by the Wilcoxon rank sum test).
The Intactness of PUs Tends to Be Preserved Even WhenThey Cross Exon Boundaries
Because PUs usually cross exon boundaries, we analyzed
whether the PU-spanned exon boundaries also tend to be
“fixed” in different AS isoforms, so that the disruption of
cross-exon boundary PUs can be avoided. To this end, we
examined the O/E ratios of “constitutive exon boundaries”and “non-constitutive exon boundaries” that overlap with
PUs. A constitutive exon boundary is defined as an exon–
exon junction that does not shift its position and always
occurs in transcript isoforms. If either of the flanking exons
changes its border at the junction, or becomes absent in any
of the isoforms, the exon boundary is considered as noncon-
stitutive (see Materials and Methods). Of note, in the previous
section, we examined whether PUs tend to be 100% included
in CSEs (table 1). In that analysis, PUs that partially overlap
exons were not considered. By contrast, for the current ana-
lysis, we examine whether PUs tend to be located at consti-
tutive boundaries. In other words, only PUs that partially
overlap exons are examined here. Biologically, these two ana-
lyses also differ from each other. AS may lead to complete loss
of a PU if it is included entirely in an ASE. In comparison,
splicing events may delete only part of a PU if it is located at
a nonconstitutive boundary. In the latter case, we do not
know whether the residual PU fragment is still important for
the structure of the resulting peptide.
Interestingly, as presented in table 2, the O/E ratio of
PU-spanned constitutive exon boundary is larger than 1
(1.16), whereas the ratio of PU-spanned nonconstitutive
exon boundary is smaller than 1 (0.94). PUs are significantly
enriched at constitutive boundaries (P value<2.2 E-16, by �2
test). Therefore, PUs not only occur more frequently
within CSEs but also tend to occur at constitutive exon
Gelly et al. GBE
846 Genome Biol. Evol. 4(9):842–851. doi:10.1093/gbe/evs071 Advance Access publication August 30, 2012
boundaries and to avoid nonconstitutive exon boundaries.
These observations suggest that the intactness of PUs tends
to be preserved in AS events, lending further support for the
biological importance of these structural units.
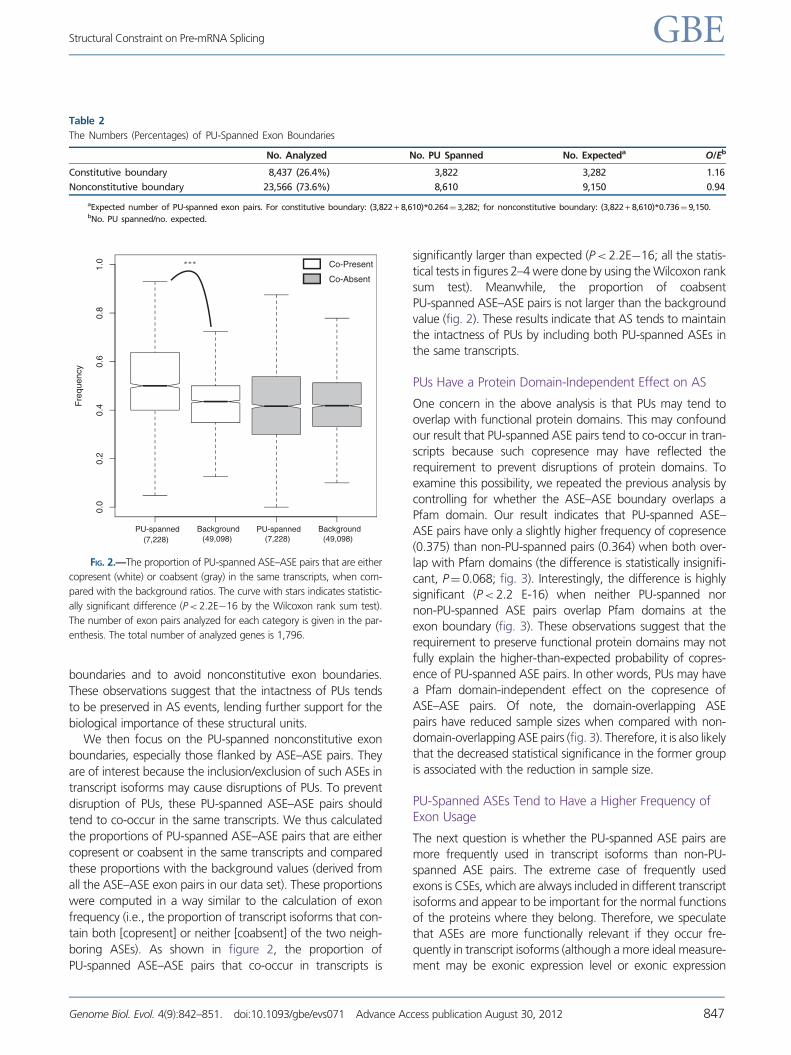
We then focus on the PU-spanned nonconstitutive exon
boundaries, especially those flanked by ASE–ASE pairs. They
are of interest because the inclusion/exclusion of such ASEs in
transcript isoforms may cause disruptions of PUs. To prevent
disruption of PUs, these PU-spanned ASE–ASE pairs should
tend to co-occur in the same transcripts. We thus calculated
the proportions of PU-spanned ASE–ASE pairs that are either
copresent or coabsent in the same transcripts and compared
these proportions with the background values (derived from
all the ASE–ASE exon pairs in our data set). These proportions
were computed in a way similar to the calculation of exon
frequency (i.e., the proportion of transcript isoforms that con-
tain both [copresent] or neither [coabsent] of the two neigh-
boring ASEs). As shown in figure 2, the proportion of
PU-spanned ASE–ASE pairs that co-occur in transcripts is
significantly larger than expected (P< 2.2E�16; all the statis-
tical tests in figures 2–4 were done by using the Wilcoxon rank
sum test). Meanwhile, the proportion of coabsent
PU-spanned ASE–ASE pairs is not larger than the background
value (fig. 2). These results indicate that AS tends to maintain
the intactness of PUs by including both PU-spanned ASEs in
the same transcripts.
PUs Have a Protein Domain-Independent Effect on AS
One concern in the above analysis is that PUs may tend to
overlap with functional protein domains. This may confound
our result that PU-spanned ASE pairs tend to co-occur in tran-
scripts because such copresence may have reflected the
requirement to prevent disruptions of protein domains. To
examine this possibility, we repeated the previous analysis by
controlling for whether the ASE–ASE boundary overlaps a
Pfam domain. Our result indicates that PU-spanned ASE–
ASE pairs have only a slightly higher frequency of copresence
(0.375) than non-PU-spanned pairs (0.364) when both over-
lap with Pfam domains (the difference is statistically insignifi-
cant, P¼ 0.068; fig. 3). Interestingly, the difference is highly
significant (P<2.2 E-16) when neither PU-spanned nor
non-PU-spanned ASE pairs overlap Pfam domains at the
exon boundary (fig. 3). These observations suggest that the
requirement to preserve functional protein domains may not
fully explain the higher-than-expected probability of copres-
ence of PU-spanned ASE pairs. In other words, PUs may have
a Pfam domain-independent effect on the copresence of
ASE–ASE pairs. Of note, the domain-overlapping ASE
pairs have reduced sample sizes when compared with non-
domain-overlapping ASE pairs (fig. 3). Therefore, it is also likely
that the decreased statistical significance in the former group
is associated with the reduction in sample size.
PU-Spanned ASEs Tend to Have a Higher Frequency ofExon Usage
The next question is whether the PU-spanned ASE pairs are
more frequently used in transcript isoforms than non-PU-
spanned ASE pairs. The extreme case of frequently used
exons is CSEs, which are always included in different transcript
isoforms and appear to be important for the normal functions
of the proteins where they belong. Therefore, we speculate
that ASEs are more functionally relevant if they occur fre-
quently in transcript isoforms (although a more ideal measure-
ment may be exonic expression level or exonic expression
0.0
0.2
0.4
0.6
0.8
1.0
PU-spanned Background PU-spanned Background
Fre
quen
cy
Co-Present
Co-Absent
(7,228) (7,228)(49,098) (49,098)
FIG. 2.—The proportion of PU-spanned ASE–ASE pairs that are either
copresent (white) or coabsent (gray) in the same transcripts, when com-
pared with the background ratios. The curve with stars indicates statistic-
ally significant difference (P< 2.2E�16 by the Wilcoxon rank sum test).
The number of exon pairs analyzed for each category is given in the par-
enthesis. The total number of analyzed genes is 1,796.
Table 2
The Numbers (Percentages) of PU-Spanned Exon Boundaries
No. Analyzed No. PU Spanned No. Expecteda O/Eb
Constitutive boundary 8,437 (26.4%) 3,822 3,282 1.16
Nonconstitutive boundary 23,566 (73.6%) 8,610 9,150 0.94
aExpected number of PU-spanned exon pairs. For constitutive boundary: (3,822 + 8,610)*0.264¼ 3,282; for nonconstitutive boundary: (3,822 + 8,610)*0.736¼ 9,150.bNo. PU spanned/no. expected.
Structural Constraint on Pre-mRNA Splicing GBE
Genome Biol. Evol. 4(9):842–851. doi:10.1093/gbe/evs071 Advance Access publication August 30, 2012 847

breadth). To this end, we compared the WEFs of the
PU-spanned and non-PU-spanned exon pairs. As shown in
figure 4, the WEFs of PU-spanned ASE–ASE pairs are signifi-
cantly higher than those of non-PU-spanned ASE–ASE pairs
(P< 2.2E�16). Considering that protein domain and the pro-
portion of structurally disordered regions may also confound
this result, we performed the same analysis by separately con-
trolling for Pfam domain overlapping and structural orderness
and obtained similar results (supplementary fig. S4A and B,
Supplementary Material online; both P<2.2E�16). These ob-
servations indicate that PU-spanned ASEs have higher WEFs
regardless of whether the ASEs overlap with Pfam domains/
structurally ordered regions or not.
One potential bias in the above analyses is that the defin-
ition of CSEs and ASEs may differ with data sources. We thus
retrieved the known human transcripts from the UCSC
Genome Browser and conducted the analyses again. The
results remain similar (supplementary tables S2 and S3 and
figs. S5 and S6, Supplementary Material online).
PUs Have Structural Orderness- and ProteinDomain-Independent Effects on the Evolution of ASEs
Finally, we are interested to know whether PU-overlapped
exonic regions evolve at the same rate as non-PU-overlapped
regions. If PUs are biologically important, PU-overlapped
regions are expected to evolve more slowly than non-PU-
overlapped regions. We thus retrieved human–mouse ortho-
logous exons and divided the exons into PU-overlapped and
non-PU-overlapped regions. Of note, only ASEs are included in
this analysis because CSEs are usually evolutionarily more con-
served. Also note that the boundaries of PUs and exons differ
from each other in most of the cases. We thus separately
concatenated the PU-overlapped and non-PU-overlapped
ASE regions (regardless of the exon boundaries) in the same
transcripts for calculations of dN, dS, and the dN/dS ratio. It is
worth noting that the number of peptides analyzed here is
decreased to 506 because of the requirements for high data
quality (the human–mouse alignable sequence length must be
�90% of the human sequence length; see Materials and
Methods) and for the simultaneous occurrences of multiple
biological features (PU/non-PU, ordered/disordered region,
and Pfam domain/non-Pfam domain). Because the factor of
structural orderness may confound the analysis, we employed
ANCOVA to clarify whether PU overlapping has a structural
orderness-independent effect on each of the three evolution-
ary measurements (see Materials and Methods). As presented
in table 3, for dN/dS and dN, �12 does not deviate significantly
from zero (table 3). However, �1 is significantly smaller than 0
in both of the cases, indicating a structural disorderness-
independent effect of PU overlapping in decreasing these
two evolutionary measurements. Of note, �2 in the analysis
for dN does not significantly deviate from 0 possibly because of
the reduced sample size. In comparison, for dS, neither �12 nor
0.0
0.2
0.4
0.6
0.8
1.0
PU-spanned Non-PU-spanned PU-spanned Non-PU-spanned
Fre
quen
cy o
f co-
pres
ence
Domain-overlapping
Non-domain-overlapping
(3,379) (1,850) (3,576) (11,114)
FIG. 3.—The proportion of PU-spanned ASE–ASE pairs that are copre-
sent in the same transcripts when Pfam domain overlapping is controlled.
The curve with stars indicates statistically significant difference
(P< 2.2E�16 by the Wilcoxon rank sum test). The number of exon pairs
analyzed for each category is given in the parenthesis.
0.0
0.2
0.4
0.6
0.8
1.0
PU SpannedASE/ASE
Non-PU SpannedASE/ASE
Wei
ghte
d E
xon
Fre
quen
cy(42,104) (27,640)
FIG. 4.—The distributions of weighted exon frequency of PU-spanned
ASE–ASE and non-PU-spanned ASE–ASE pairs. Note that the WEFs
(weighted exon frequencies) were averaged for the two ASEs of each
ASE–ASE pair. The curve with stars indicates statistically significant differ-
ence (P<2.2E�16 by the Wilcoxon rank sum test). The number of exon
pairs analyzed for each category is given in the parenthesis.
Gelly et al. GBE
848 Genome Biol. Evol. 4(9):842–851. doi:10.1093/gbe/evs071 Advance Access publication August 30, 2012
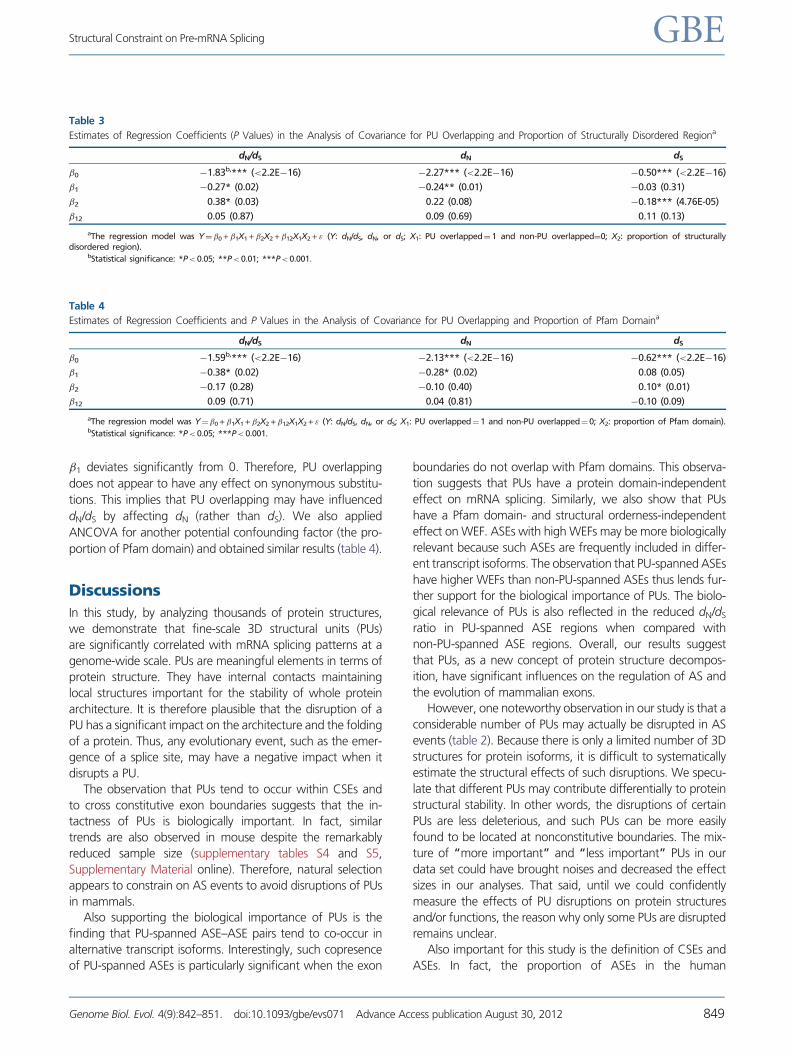
�1 deviates significantly from 0. Therefore, PU overlapping
does not appear to have any effect on synonymous substitu-
tions. This implies that PU overlapping may have influenced
dN/dS by affecting dN (rather than dS). We also applied
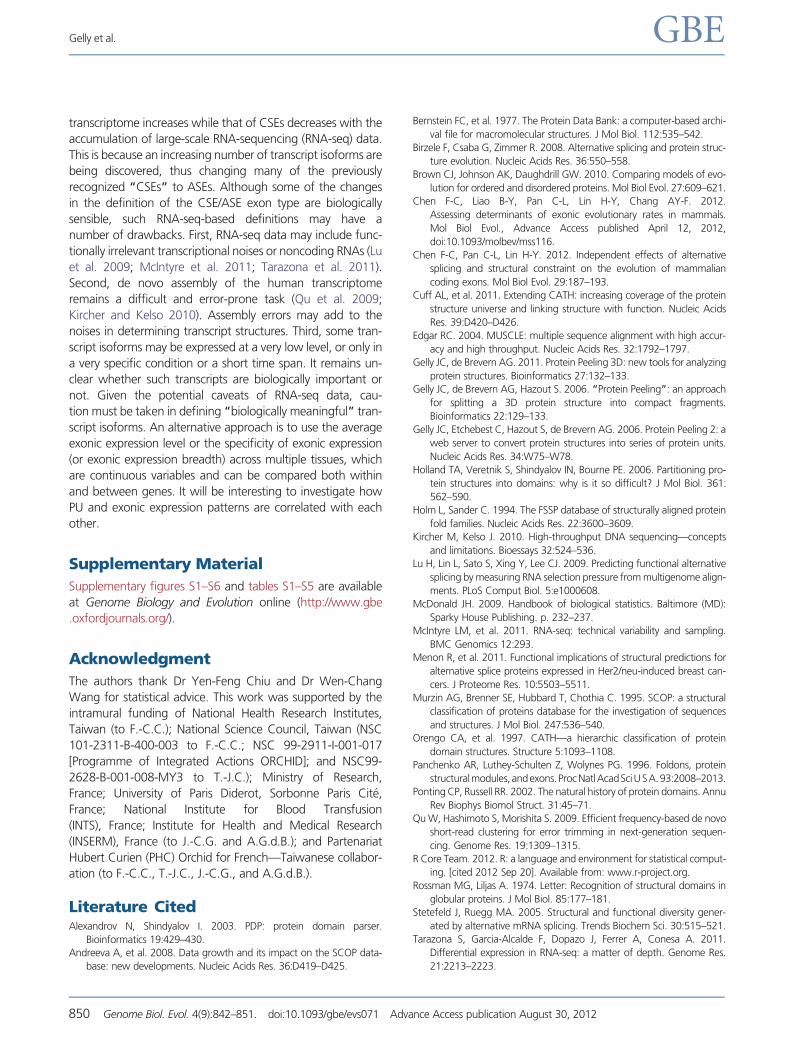
ANCOVA for another potential confounding factor (the pro-
portion of Pfam domain) and obtained similar results (table 4).
Discussions
In this study, by analyzing thousands of protein structures,
we demonstrate that fine-scale 3D structural units (PUs)
are significantly correlated with mRNA splicing patterns at a
genome-wide scale. PUs are meaningful elements in terms of
protein structure. They have internal contacts maintaining
local structures important for the stability of whole protein
architecture. It is therefore plausible that the disruption of a
PU has a significant impact on the architecture and the folding
of a protein. Thus, any evolutionary event, such as the emer-
gence of a splice site, may have a negative impact when it
disrupts a PU.
The observation that PUs tend to occur within CSEs and
to cross constitutive exon boundaries suggests that the in-
tactness of PUs is biologically important. In fact, similar
trends are also observed in mouse despite the remarkably
reduced sample size (supplementary tables S4 and S5,
Supplementary Material online). Therefore, natural selection
appears to constrain on AS events to avoid disruptions of PUs
in mammals.
Also supporting the biological importance of PUs is the
finding that PU-spanned ASE–ASE pairs tend to co-occur in
alternative transcript isoforms. Interestingly, such copresence
of PU-spanned ASEs is particularly significant when the exon
boundaries do not overlap with Pfam domains. This observa-
tion suggests that PUs have a protein domain-independent
effect on mRNA splicing. Similarly, we also show that PUs
have a Pfam domain- and structural orderness-independent
effect on WEF. ASEs with high WEFs may be more biologically
relevant because such ASEs are frequently included in differ-
ent transcript isoforms. The observation that PU-spanned ASEs
have higher WEFs than non-PU-spanned ASEs thus lends fur-
ther support for the biological importance of PUs. The biolo-
gical relevance of PUs is also reflected in the reduced dN/dS
ratio in PU-spanned ASE regions when compared with
non-PU-spanned ASE regions. Overall, our results suggest
that PUs, as a new concept of protein structure decompos-
ition, have significant influences on the regulation of AS and
the evolution of mammalian exons.
However, one noteworthy observation in our study is that a
considerable number of PUs may actually be disrupted in AS
events (table 2). Because there is only a limited number of 3D
structures for protein isoforms, it is difficult to systematically
estimate the structural effects of such disruptions. We specu-
late that different PUs may contribute differentially to protein
structural stability. In other words, the disruptions of certain
PUs are less deleterious, and such PUs can be more easily
found to be located at nonconstitutive boundaries. The mix-
ture of “more important” and “less important” PUs in our
data set could have brought noises and decreased the effect
sizes in our analyses. That said, until we could confidently
measure the effects of PU disruptions on protein structures
and/or functions, the reason why only some PUs are disrupted
remains unclear.
Also important for this study is the definition of CSEs and
ASEs. In fact, the proportion of ASEs in the human
Table 3
Estimates of Regression Coefficients (P Values) in the Analysis of Covariance for PU Overlapping and Proportion of Structurally Disordered Regiona
dN/dS dN dS
�0 �1.83b,*** (<2.2E�16) �2.27*** (<2.2E�16) �0.50*** (<2.2E�16)
�1 �0.27* (0.02) �0.24** (0.01) �0.03 (0.31)
�2 0.38* (0.03) 0.22 (0.08) �0.18*** (4.76E-05)
�12 0.05 (0.87) 0.09 (0.69) 0.11 (0.13)
aThe regression model was Y¼�0 +�1X1 +�2X2 +�12X1X2 + " (Y: dN/dS, dN, or dS; X1: PU overlapped¼ 1 and non-PU overlapped¼0; X2: proportion of structurallydisordered region).
bStatistical significance: *P< 0.05; **P< 0.01; ***P< 0.001.
Table 4
Estimates of Regression Coefficients and P Values in the Analysis of Covariance for PU Overlapping and Proportion of Pfam Domaina
dN/dS dN dS
�0 �1.59b,*** (<2.2E�16) �2.13*** (<2.2E�16) �0.62*** (<2.2E�16)
�1 �0.38* (0.02) �0.28* (0.02) 0.08 (0.05)
�2 �0.17 (0.28) �0.10 (0.40) 0.10* (0.01)
�12 0.09 (0.71) 0.04 (0.81) �0.10 (0.09)
aThe regression model was Y¼�0 +�1X1 +�2X2 +�12X1X2 + " (Y: dN/dS, dN, or dS; X1: PU overlapped¼ 1 and non-PU overlapped¼ 0; X2: proportion of Pfam domain).bStatistical significance: *P< 0.05; ***P< 0.001.
Structural Constraint on Pre-mRNA Splicing GBE
Genome Biol. Evol. 4(9):842–851. doi:10.1093/gbe/evs071 Advance Access publication August 30, 2012 849
transcriptome increases while that of CSEs decreases with the
accumulation of large-scale RNA-sequencing (RNA-seq) data.
This is because an increasing number of transcript isoforms are
being discovered, thus changing many of the previously
recognized “CSEs” to ASEs. Although some of the changes
in the definition of the CSE/ASE exon type are biologically
sensible, such RNA-seq-based definitions may have a
number of drawbacks. First, RNA-seq data may include func-
tionally irrelevant transcriptional noises or noncoding RNAs (Lu
et al. 2009; McIntyre et al. 2011; Tarazona et al. 2011).
Second, de novo assembly of the human transcriptome
remains a difficult and error-prone task (Qu et al. 2009;
Kircher and Kelso 2010). Assembly errors may add to the
noises in determining transcript structures. Third, some tran-
script isoforms may be expressed at a very low level, or only in
a very specific condition or a short time span. It remains un-
clear whether such transcripts are biologically important or
not. Given the potential caveats of RNA-seq data, cau-
tion must be taken in defining “biologically meaningful” tran-
script isoforms. An alternative approach is to use the average
exonic expression level or the specificity of exonic expression
(or exonic expression breadth) across multiple tissues, which
are continuous variables and can be compared both within
and between genes. It will be interesting to investigate how
PU and exonic expression patterns are correlated with each
other.
Supplementary Material
Supplementary figures S1–S6 and tables S1–S5 are available
at Genome Biology and Evolution online (http://www.gbe
.oxfordjournals.org/).
Acknowledgment
The authors thank Dr Yen-Feng Chiu and Dr Wen-Chang
Wang for statistical advice. This work was supported by the
intramural funding of National Health Research Institutes,
Taiwan (to F.-C.C.); National Science Council, Taiwan (NSC
101-2311-B-400-003 to F.-C.C.; NSC 99-2911-I-001-017
[Programme of Integrated Actions ORCHID]; and NSC99-
2628-B-001-008-MY3 to T.-J.C.); Ministry of Research,
France; University of Paris Diderot, Sorbonne Paris Cite,
France; National Institute for Blood Transfusion
(INTS), France; Institute for Health and Medical Research
(INSERM), France (to J.-C.G. and A.G.d.B.); and Partenariat
Hubert Curien (PHC) Orchid for French—Taiwanese collabor-
ation (to F.-C.C., T.-J.C., J.-C.G., and A.G.d.B.).
Literature CitedAlexandrov N, Shindyalov I. 2003. PDP: protein domain parser.
Bioinformatics 19:429–430.
Andreeva A, et al. 2008. Data growth and its impact on the SCOP data-
base: new developments. Nucleic Acids Res. 36:D419–D425.
Bernstein FC, et al. 1977. The Protein Data Bank: a computer-based archi-
val file for macromolecular structures. J Mol Biol. 112:535–542.
Birzele F, Csaba G, Zimmer R. 2008. Alternative splicing and protein struc-
ture evolution. Nucleic Acids Res. 36:550–558.
Brown CJ, Johnson AK, Daughdrill GW. 2010. Comparing models of evo-
lution for ordered and disordered proteins. Mol Biol Evol. 27:609–621.
Chen F-C, Liao B-Y, Pan C-L, Lin H-Y, Chang AY-F. 2012.
Assessing determinants of exonic evolutionary rates in mammals.
Mol Biol Evol., Advance Access published April 12, 2012,
doi:10.1093/molbev/mss116.
Chen F-C, Pan C-L, Lin H-Y. 2012. Independent effects of alternative
splicing and structural constraint on the evolution of mammalian
coding exons. Mol Biol Evol. 29:187–193.
Cuff AL, et al. 2011. Extending CATH: increasing coverage of the protein
structure universe and linking structure with function. Nucleic Acids
Res. 39:D420–D426.
Edgar RC. 2004. MUSCLE: multiple sequence alignment with high accur-
acy and high throughput. Nucleic Acids Res. 32:1792–1797.
Gelly JC, de Brevern AG. 2011. Protein Peeling 3D: new tools for analyzing
protein structures. Bioinformatics 27:132–133.
Gelly JC, de Brevern AG, Hazout S. 2006. “Protein Peeling”: an approach
for splitting a 3D protein structure into compact fragments.
Bioinformatics 22:129–133.
Gelly JC, Etchebest C, Hazout S, de Brevern AG. 2006. Protein Peeling 2: a
web server to convert protein structures into series of protein units.
Nucleic Acids Res. 34:W75–W78.
Holland TA, Veretnik S, Shindyalov IN, Bourne PE. 2006. Partitioning pro-
tein structures into domains: why is it so difficult? J Mol Biol. 361:
562–590.
Holm L, Sander C. 1994. The FSSP database of structurally aligned protein
fold families. Nucleic Acids Res. 22:3600–3609.
Kircher M, Kelso J. 2010. High-throughput DNA sequencing—concepts
and limitations. Bioessays 32:524–536.
Lu H, Lin L, Sato S, Xing Y, Lee CJ. 2009. Predicting functional alternative
splicing by measuring RNA selection pressure from multigenome align-
ments. PLoS Comput Biol. 5:e1000608.
McDonald JH. 2009. Handbook of biological statistics. Baltimore (MD):
Sparky House Publishing. p. 232–237.
McIntyre LM, et al. 2011. RNA-seq: technical variability and sampling.
BMC Genomics 12:293.
Menon R, et al. 2011. Functional implications of structural predictions for
alternative splice proteins expressed in Her2/neu-induced breast can-
cers. J Proteome Res. 10:5503–5511.
Murzin AG, Brenner SE, Hubbard T, Chothia C. 1995. SCOP: a structural
classification of proteins database for the investigation of sequences
and structures. J Mol Biol. 247:536–540.
Orengo CA, et al. 1997. CATH—a hierarchic classification of protein
domain structures. Structure 5:1093–1108.
Panchenko AR, Luthey-Schulten Z, Wolynes PG. 1996. Foldons, protein
structuralmodules,andexons.ProcNatlAcadSciUSA.93:2008–2013.
Ponting CP, Russell RR. 2002. The natural history of protein domains. Annu
Rev Biophys Biomol Struct. 31:45–71.
Qu W, Hashimoto S, Morishita S. 2009. Efficient frequency-based de novo
short-read clustering for error trimming in next-generation sequen-
cing. Genome Res. 19:1309–1315.
R Core Team. 2012. R: a language and environment for statistical comput-
ing. [cited 2012 Sep 20]. Available from: www.r-project.org.
Rossman MG, Liljas A. 1974. Letter: Recognition of structural domains in
globular proteins. J Mol Biol. 85:177–181.
Stetefeld J, Ruegg MA. 2005. Structural and functional diversity gener-
ated by alternative mRNA splicing. Trends Biochem Sci. 30:515–521.
Tarazona S, Garcia-Alcalde F, Dopazo J, Ferrer A, Conesa A. 2011.
Differential expression in RNA-seq: a matter of depth. Genome Res.
21:2213–2223.
Gelly et al. GBE
850 Genome Biol. Evol. 4(9):842–851. doi:10.1093/gbe/evs071 Advance Access publication August 30, 2012

Tress ML, et al. 2007. The implications of alternative splicing in the
ENCODE protein complement. Proc Natl Acad Sci U S A. 104:
5495–5500.
Vinayagam A, et al. 2003. DDBASE2.0: updated domain database with
improved identification of structural domains. Bioinformatics 19:
1760–1764.
Wang G, Dunbrack RL Jr. 2005. PISCES: recent improvements to a PDB
sequence culling server. Nucleic Acids Res. 33:W94–W98.
Ward JJ, McGuffin LJ, Bryson K, Buxton BF, Jones DT. 2004. The DISOPRED
server for the prediction of protein disorder. Bioinformatics 20:
2138–2139.
Wetlaufer DB. 1973. Nucleation, rapid folding, and globular intrachain
regions in proteins. Proc Natl Acad Sci U S A. 70:697–701.
Wetlaufer DB, Ristow S. 1973. Acquisition of three-dimensional structure
of proteins. Annu Rev Biochem. 42:135–158.
Xu Y, Xu D, Liang J. 2006. Computational methods for protein structure
prediction and modeling. New York: Springer.
Yang Z. 2007. PAML 4: phylogenetic analysis by maximum likelihood.
Mol Biol Evol. 24:1586–1591.
Associate editor: John Archibald
Structural Constraint on Pre-mRNA Splicing GBE
Genome Biol. Evol. 4(9):842–851. doi:10.1093/gbe/evs071 Advance Access publication August 30, 2012 851
Related Documents


