Commissioned by: © 2011, Battelle for Kids Selecting Growth Measures: A Guide for Education Leaders

Welcome message from author
This document is posted to help you gain knowledge. Please leave a comment to let me know what you think about it! Share it to your friends and learn new things together.
Transcript

Commissioned by:
© 2011, Battelle for Kids
Selecting Growth Measures: A Guide for Education Leaders

TABLE OF CONTENTS
Introduction..............................................................................................................3
School Accountabilty and the Need for Growth Measures .........................3
Purpose of the Guide ...........................................................................................4
The Spectrum of Growth and Value-Added Models .........................................5
Exploring 7 Key Considerations in the Selection of a Growth Model .............7
1. Intended Uses ...................................................................................................7
2. Inputs for Analysis ...........................................................................................9
3. Measurement Error and Uncertainty ..........................................................11
4. Results and Outputs ........................................................................................14
5. Communications, Training, and Support ....................................................16
6. Experience, Expertise, and Capacity ..........................................................17
7. Costs .................................................................................................................18
Conclusion..............................................................................................................19
Resources and Support ........................................................................................20
Acknowledgements ..............................................................................................21
References .............................................................................................................21
Selecting Growth Measures:A Guide for Education Leaders
© 2011, Battelle for Kids
2
Every child deserves to receive a quality education that prepares him or her for the future. While educating a child takes commitment on many levels, school systems and educators play a particularly critical role in influencing a child’s opportunities and success. How, then, do we measure the effectiveness of schools and educators?
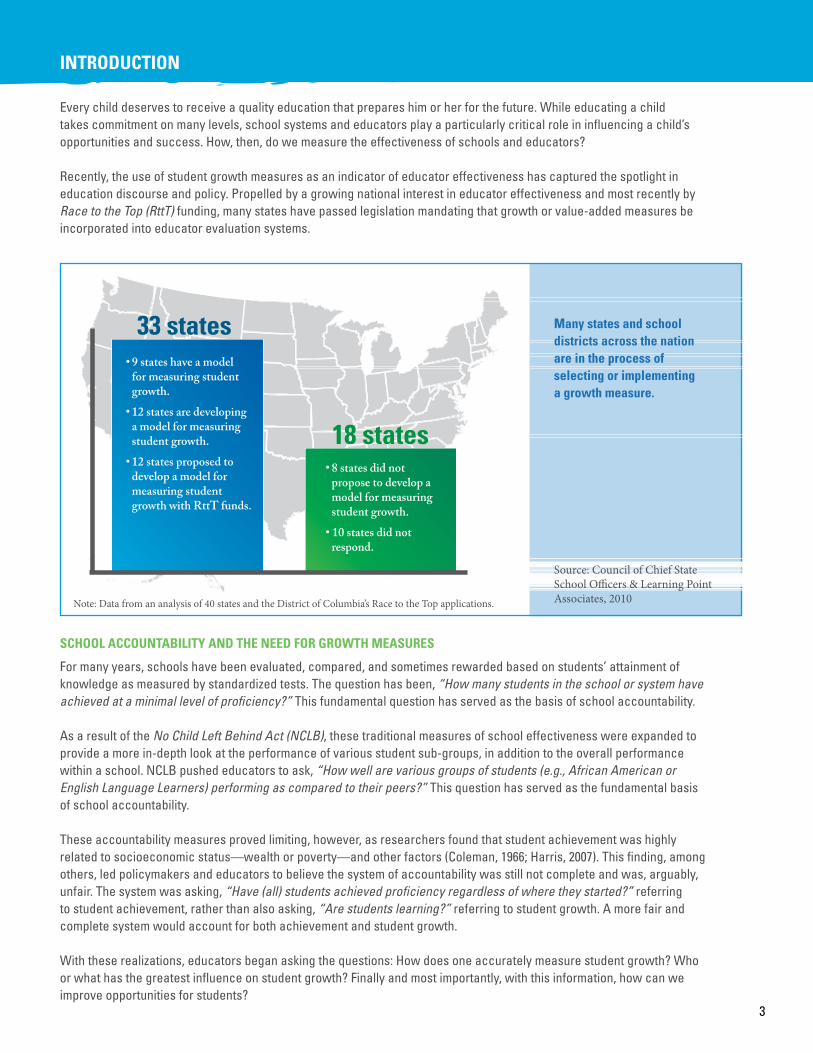
Recently, the use of student growth measures as an indicator of educator effectiveness has captured the spotlight in education discourse and policy. Propelled by a growing national interest in educator effectiveness and most recently byRace to the Top (RttT) funding, many states have passed legislation mandating that growth or value-added measures be incorporated into educator evaluation systems.
33 states
18 states
Many states and school districts across the nation are in the process of selecting or implementing a growth measure.
INTRODUCTION
SCHOOL ACCOUNTABILITY AND THE NEED FOR GROWTH MEASURES
For many years, schools have been evaluated, compared, and sometimes rewarded based on students’ attainment of knowledge as measured by standardized tests. The question has been, “How many students in the school or system have achieved at a minimal level of proficiency?” This fundamental question has served as the basis of school accountability.
As a result of the No Child Left Behind Act (NCLB), these traditional measures of school effectiveness were expanded to provide a more in-depth look at the performance of various student sub-groups, in addition to the overall performance within a school. NCLB pushed educators to ask, “How well are various groups of students (e.g., African American or English Language Learners) performing as compared to their peers?” This question has served as the fundamental basis of school accountability.
These accountability measures proved limiting, however, as researchers found that student achievement was highly related to socioeconomic status—wealth or poverty—and other factors (Coleman, 1966; Harris, 2007). This finding, among others, led policymakers and educators to believe the system of accountability was still not complete and was, arguably, unfair. The system was asking, “Have (all) students achieved proficiency regardless of where they started?” referring to student achievement, rather than also asking, “Are students learning?” referring to student growth. A more fair and complete system would account for both achievement and student growth.
With these realizations, educators began asking the questions: How does one accurately measure student growth? Who or what has the greatest influence on student growth? Finally and most importantly, with this information, how can we improve opportunities for students?
•9stateshaveamodelformeasuringstudentgrowth.•12statesaredevelopingamodelformeasuringstudentgrowth.•12statesproposedtodevelopamodelformeasuringstudentgrowthwithRttTfunds.
•8statesdidnotproposetodevelopamodelformeasuringstudentgrowth.•10statesdidnotrespond.
Note: Data from an analysis of 40 states and the District of Columbia’s Race to the Top applications.
Source: Council of Chief State School Officers & Learning Point Associates, 2010
3

PURPOSE OF THIS GUIDE
To date, much of what has been written about measuring student growth and estimating educator effectiveness has focused on highly technical descriptions of the statistical models. While this information is important, many state and district leaders are daunted by the technical considerations around selecting and defending the use of a reliable measure of student academic growth.Additionally, many are not prepared with a comprehensive framework for making and communicating that decision.
Commissioned by the Bill & Melinda Gates Foundation, Battelle for Kids developed Selecting Growth Measures: A Guide for Education Leaders to help policymakers and educators address several key considerations for making informed decisions when selecting a growth measure.
The benefits of measuring growth have the potential to change the way we view school, principal, and teacher effectiveness in a powerful way. However, hasty adoption of a growth measure—without careful examination and thorough understanding of the different models and their uses and assumptions—can have serious implications on how successful a state or district is in harnessing this power for improvement.
Whether your state or district is just beginning this journey by discussing whether you should consider using growth measures; has already committed to implementing a growth measure, but is unsure of how to select a model; or has a model in place, but would like to revisit your model selection, this guide will help you to become an informed consumer of growth measures.
While not meant to include every nuance, question, or decision point, we hope this guide supports your decision-making process by providing definitions of several types of growth measures and seven key considerations, including: 1. Intended Uses;2. Inputs for Analysis;3. Measurement Error and Uncertainty;4. Results and Outputs;5. Communications, Training, and Support;6. Experience, Expertise, and Capacity; and7. Cost.
This guide is not designed to recommend or lead you
toward a specific model or provider. Rather, its
purpose is to provide you a framework for decision-making when considering
growth measures.
Online Resources: In addition to this guide, a growing library of resources, including information from several leading growth model providers, worksheets, and more, are available to support your learning at www.edgrowthmeasures.org.
4

Growth, in its simplest form, is a comparison of the test results of a student or group of students between two points in time where a positive difference would imply growth. If you analyze how a group of students performed at a school, in a program, or with a teacher, relative to a standard (e.g., compared to a baseline in a prior year or relative to other schools or educators), then you begin to produce information that differentiates growth and implies varying levels of effectiveness—areas of strength and opportunities for improvement. While seemingly simple, there are several policy, technical, and adaptive issues to address.
Growth measures come in various forms that differ in approach and design. You don’t necessarily need to understand the specific mathematical or statistical techniques economists and statisticians use in the models, but it is important to be comfortable discussing the educational assumptions within models, some terminology used to describe various models, and the importance of certain decision points to ensure alignment with your state or district’s goals. There are a spectrum of models that measure student growth and estimate educator effectiveness, ranging from simple comparisons of student achievement, to descriptive analyses, to complex statistical models that estimate or make inferences about educator effectiveness. Often, you hear the terms “growth model” and “value-added” used interchangeably. This guide makes some distinctions between the two.
These models vary greatly in several areas:
• Thepurposeforwhichtheyweredeveloped;
• Theassumptionsmadebymodelprovidersabouttheeducationalenvironmentsfor which they were developed; and
• Themathematical/statisticalapproachesandtechniquesusedtoestimatestudentgrowth or value-added.
Simple growth models describe the academic growth of a group of students between two points in time without directly making assumptions about the influence of schools or educators on that growth.
This is accomplished by comparing students’ achievement, in a given subject, to their achievement the prior year. These models typically use limited student test data in the analysis and do not attempt to control for other factors (e.g., measurement error, student demographics, or other attributes). Simple growth models are fairly easy for educators to understand and often can be run internally by state or local experts.
Value-added models attempt to estimate the influence of schools or classrooms on the academic growth rates of a group of students with statistical confidence. For example, if the school estimate is positive, it is interpreted that the performance of the school is greater than average or typical and therefore “value is added.”
By nature, these models are more complex than simple growth models and rarely can be run internally without a statistician or economist on staff. Not all value-added models are the same because they often are designed to analyze a specific part of the educational system, such as pre-service programs, school or district factors, or teacher or classroom factors. These models employ various statistical approaches and use differing amounts or types of data in the analysis.
THE SPECTRUM OF GROWTH AND VALUE-ADDED MODELS
Simple growth models were designed to describe the change
in academic achievement of students and were not
designed to make inferences about educator effectiveness.
There are significant potential risks associated with using
these measures for purposes of determining educator
effectiveness.
5

TYPES OF GROWTH AND VALUE-ADDED MODELS
Simple Growth Models
In its most basic form, a growth model describes the difference between two achievement test scores for the same students. This typically has been defined as the change in student scores in a particular subject from one year to the next (e.g., third grade math in 2011 and fourth grade math in 2012). Others have even defined growth as the change in the percent proficient from one year to the next.
These comparison models typically require tests to be scored on the same scale and be aligned from one grade to the next. However, some models have begun to use simple statistical techniques to attempt to handle variations in test scales to create better confidence in the comparison of year-over-year results.
Simple growth models:• Canberuninternallybythedistrictorstate;• Typicallyrequirestableandreliabletestscales;• Areimpactedsignificantlybymissingstudenttestdataandtheerrorofmeasurementintheassessments;and• Cannotaccountforothereducationalfactorsthatmayinfluencestudentlearning.
Simple Value-Added Models
Simple value-added models use statistical approaches to create a prediction of student scores using limited prior student data such as last year’s test scores in a given subject. By comparing the predicted achievement of a group of students to their actual achievement, a measure or estimate of effect is produced. If the measure is positive, then value is added. If students score as predicted, then the estimate is zero. If students score below predictions, then the estimate is negative. These models can yield comparative results of schools or classrooms that perform above, at, or below predictions (or expectations) of growth.
Simple value-added models:• Canberuninternallybythedistrictorstate;• Typicallyrequirestableandreliabletestscales;• Areimpactedsignificantlybymissingstudenttestdataandtheerrorofmeasurementintheassessments;and• Cannotaccountforothereducationalfactorsthatmayinfluencestudentlearning.
Student Growth Percentile Models
Student growth percentiles measure how much a student’s performance has improved from one year to the next relative to his or her academic peers. Academic peers are typically defined as all students who made a certain score the previous year, or in some cases, students with similar test scores based on multiple prior years of data. The model compares the range of those peer students’ scores in the current year and describes the change in terms of a growth percentile.
When comparing that percentile to the median, inferences can be made for students who performed better, similar, or worse than their peers.Thus, the results tend to describe a student’s performance relative to his or her peers, and can be aggregated at various levels to furtherdescribe the performance of a school or classroom relative to other schools or classrooms.
Student growth percentile models:• Canoftenberuninternallybythedistrictorstate;• Mayusemultiplepriordatapoints;• Maybeabletoincludeothervariablestoaccountforothereducationalfactors;and• Canbeaggregatedatvariouseducationallevelstomakeinferencesaboutschoolandeducatoreffectiveness.
Advanced Value-Added Models
Complex value-added models typically develop their estimates of students’ achievement using multiple prior test scores (in the same subject or in subjects shown to have a relationship to another subject). They often include other school or student factors in an attempt to more reliably estimate the influence of educators on student learning.
Complex value-added models employ more sophisticated statistical approaches to minimize the effect of external factors and improve the reliability of their estimates. The most sophisticated models apply strategies to handle missing student test data, measurement error associated with the tests, multiple educators sharing instructional responsibility, and many other factors in an attempt to produce the most reliable estimates of effectiveness. These models regularly produce information about the confidence in the value-added estimate to better inform conclusions that can be made from the data.
Advanced value-added models:• Cannot typically be run internally by the district or state;• Usemultiplepriordatapoints;• Produceestimatesatvariouseducationallevelstomakeinferencesaboutschoolandeducatoreffectiveness;and• Typicallyincludeothervariablestoaccountforothereducationalfactors. 6

As you engage in discussions about selecting a growth model, understand that there is not a perfect model or right choice for all situations. You must carefully weigh potential trade-offs with the political, technical, and adaptive challenges you may face.
The following seven key considerations are designed to help guide your selection of the growth measure that would be best suited for your organization.
7 Key Considerations
1. Intended Uses2. Inputs for Analysis 3. Measurement Error and Uncertainty 4. Results and Outputs 5. Communications, Training, and Support6. Experience, Expertise, and Capacity 7. Costs
A supporting worksheet to help you engage in discussion around these considerations is available at www.edgrowthmeasures.org.
We encourage you to explore and discuss each consideration in the context of your state or district’s environment as you begin to select a growth measure.
Measures of student growth are being used for a variety of purposes across the country. These uses range from low-stakes professional feedback to high-stakes decisions about the future of schools or educators.
Oftentimes, it is advantageous to first apply growth measures to low-stakes decisions, offering educators time to understand and feel comfortable with this new measure. Then, educators can learn how to respond to the data and use the information for improvement prior to facing high-stakes uses. Most districts that have found success with growth measures have been strategic in how they introduced the measure in their systems.
Your current short-term and long-term uses of this information and the expected outcomes should be clear. Districts and states are using growth measures in powerful ways to inform various education decisions, such as:
• School improvement: Growth measures can help identify strengths, challenges and opportunities for improvement at various levels throughout the system. For example, district-level results can be influenced from a variety of central services, such as curriculum and instruction, gifted and talented, special education, and more. School-level results can be indicative of instructional leadership, teacher-team collaboration, and hiring decisions. Teacher and classroom results can identify needs for differentiated instruction or other research-based practices leading to improved student learning (e.g., formative instructional practices).
• System accountability: Growth measures can be used for formal accountability reporting at the state or district levels to recognize districts or schools that are producing gains in student learning or appear to be on-track to proficiency or higher levels of achievement. The public and media also may use growth measures to monitor the effectiveness of their schools to increase confidence and support for their neighborhood or state school system and ensure the return on investment of their education dollars.
EXPLORING 7 KEY CONSIDERATIONS IN THE SELECTION OF A GROWTH MODEL
1CONSIDERATION #1: INTENDED USESWhat are your intended uses and outcomes for growth measures?
7

• Evaluationofeducatoreffectiveness:Growth measures can be used as a component of performance evaluations for teachers, principals, superintendents, and other school employees. It’s important to carefully consider the inferences and conclusions made. For example:
Does overall growth in the majority of schools, subjects, and grades infer effective leadership of the superintendent?
Does overall growth at a school in the majority of subjects and grades, staffed with highly effective teachers, infer an effective principal?
Does three years of consistent performance beyond expectations with students infer an effective teacher?
Does the overall advancement of English Language Learners in the district infer an effective bilingual program?
While growth measures can help inform those answers, it would be a disservice to the profession to distill the complexities of teaching and learning to a single measure.
• Humancapital: Models capable of providing reliable estimates of growth or value-added at the classroom or school levels can inform decisions around career opportunities for educators. Teachers may be selected for opportunities suchasmaster/mentorteacherroles,grantedtenureortransfers,andaffordedadditional compensation opportunities.
• Teacherplacement: Placing effective teachers where they can best impact students is an important consideration. The equitable distribution of teaching effectiveness is a strategy to close achievement gaps. Some researchers support using information from growth measures to leverage teachers’ strengths (e.g., with traditionally low-achieving students or with students of low socioeconomic status) to maximize their impact on students.
• Researchandprogramevaluation: Student growth measures can be used to identify effective educator practices and academic programs. Models that can offer insight about the impact particular teachers have on student growth can be used to evaluate teacher pre-service and certification programs as well. Good measures of student outcomes help you to understand what you should be doing, what you should keep doing, and what you should stop doing.
It’s Important Because...
The most significant factor in selecting a growth model is how the information will be used to inform education decisions. Certain models may be more appropriate for specific uses. Ensure that the model your district or state selects is capable of reliably producing the type of information you need to inform the decisions you intend to make.
This consideration, along with the others described in this guide, become increasingly important as the stakes become greater and the analysis moves to the classroom level. The greater the stakes, the more confidence you need to have in the accuracy and precision of estimates that the measure produces.
Guiding Your Discussion
Growth estimates can be used for a variety of purposes (e.g., school improvement, system accountability, human capital decisions, etc.). How do you want to use the model(s)? What decisions do you hope the results will help you to make now and in the future? Discuss with your leadership team. 8
Growth models use a variety of data as inputs in their computations. For each of these inputs, there are several important considerations, challenges, and decision points. This guide introduces some, but not all, of the technical challenges in measuring student academic growth and estimating educator effectiveness. The challenges discussed below are central to understanding the different approaches and assumptions made by the model providers and why a certain level of sophistication is necessary to produce valid and reliable growth measures.
TESTS AND TEST CHARACTERISTICS
While many inputs may go into growth models, the availability and use of high-quality tests are essential. Growth models, in some way or another, rely on tests of students’ knowledge in a particular subject or content area. Most states and districts use annual state assessments to provide that data. As a result, many states or districts are limited to growth measures in grades four through eight in reading and mathematics.
Education leaders may employ additional assessments to expand the analysis into other grades and subjects, including the high school level. Some districts use test results from norm-referenced assessments and curriculum-based assessments along with the state assessments in their analysis. Districts are even exploring options in non-core academic subjects by using alternative types of assessments.
Havingappropriatetestsinavarietyofsubjectsand/orgradelevelswillinfluencethe selection and applicability of various growth models. For example, simpler growth models may not be valid for determining growth in Algebra II from a prior general math score. A general math test may not be an appropriate gauge of the effectiveness of an Algebra II teacher.
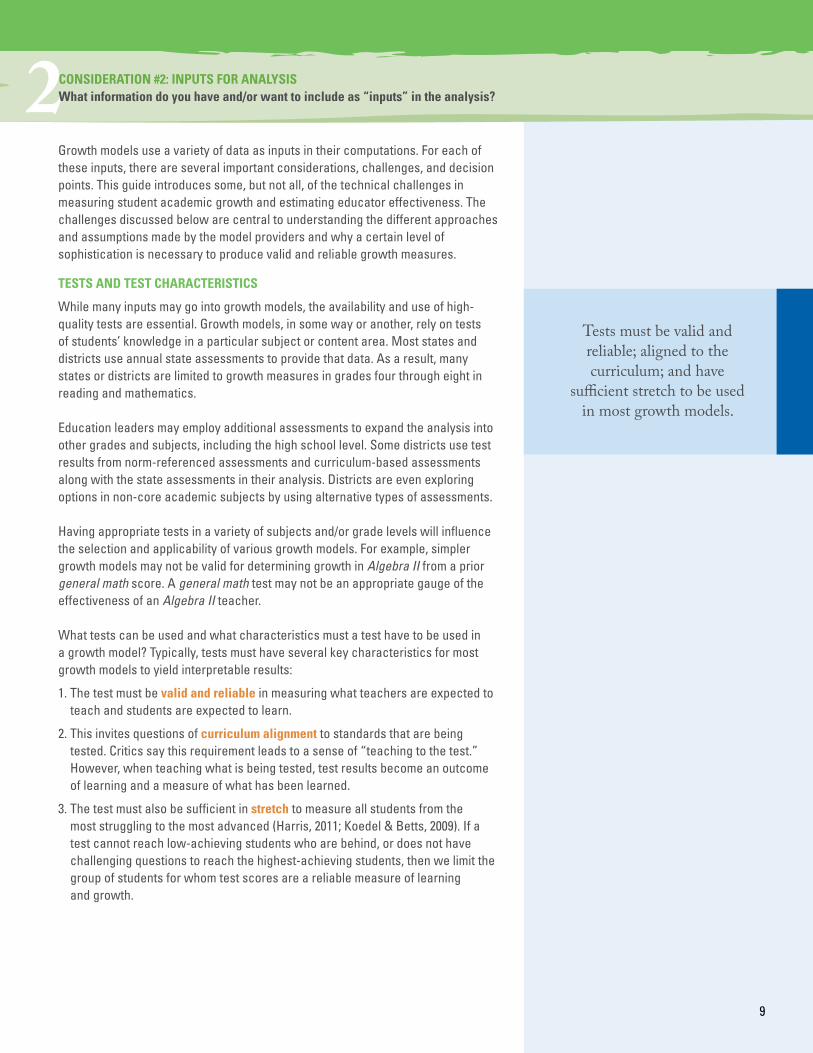
What tests can be used and what characteristics must a test have to be used in a growth model? Typically, tests must have several key characteristics for most growth models to yield interpretable results:
1. The test must be valid and reliable in measuring what teachers are expected to teach and students are expected to learn.
2. This invites questions of curriculum alignment to standards that are being tested. Critics say this requirement leads to a sense of “teaching to the test.” However, when teaching what is being tested, test results become an outcome of learning and a measure of what has been learned.
3. The test must also be sufficient in stretch to measure all students from the most struggling to the most advanced (Harris, 2011; Koedel & Betts, 2009). If a test cannot reach low-achieving students who are behind, or does not have challenging questions to reach the highest-achieving students, then we limit the group of students for whom test scores are a reliable measure of learning and growth.
Tests must be valid and reliable; aligned to the curriculum; and have
sufficient stretch to be used in most growth models.
2CONSIDERATION #2: INPUTS FOR ANALYSISWhat information do you have and/or want to include as “inputs” in the analysis?
9

STUDENT CHARACTERISTICS AND OTHER ATTRIBUTES
There is much debate among researchers and model providers around the inclusion of student characteristics and other attributes in growth model analyses(McCaffrey, Lockwood, Koretz, Louis & Hamilton, 2004). These characteristics can be basic demographics, such as gender, race, and socio-economic status, or expanded characteristics, such as student attendance, credit status, gifted, EnglishLanguage Learners, or cognitive disabilities. While adding more information in a model may help to solidify relationships between what a teacher does and what a student learns, there is a risk of building an overly complex model that can no longer distill what a school or district is trying to measure.
So, what variables matter? The jury is out, but following are a few variables for further discussion.
Demographics
Let’s examine race as an example of a demographic characteristic to understand why these variables may or may not matter in growth models.
A core belief by some model providers is that information, such as race, gender, and other factors, is constant and therefore represented in the test scores—current and prior. For example, an Asian male student is Asian and male in his current test score and also Asian and male in his prior scores. Therefore, race and gender information are represented within the test results. They argue that creating a mathematical “fix” or control for differences in the race of students would be inappropriate because it would control for race twice (in the model and test result). Further, these model providers argue that these controls create different growth expectations for students of various races.
Others argue that school systems produce different results and are differentially effective with populations of students based on their race. Being aware of the magnitude of these varying effects is important in order to close the achievement gap and communicate clearly to educators in the system that we need to improve our effectiveness with students of a particular race. According to this argument, incorporating race into the model levels the playing field for schools or teachers with disproportionate populations of students of different races.
Some model providers offer a middle ground by not mathematically controlling for race, but address the characteristic by producing reports that show differential effects or diagnostic information by race.
Other Attributes
There are other factors that are associated with student test data. Some model providers decide whether or not to incorporate characteristics based on a teacher’s ability to control or influence that characteristic. In the case of race, a racial characteristic is not something within a teacher’s control or influence. Another example is the amount of instructional time, which is set by the school and therefore not within a teacher’s control. While an interesting research question (e.g., Does longer instructional time produce greater results with students?), it may or may not be a factor to include in the growth model.
Another attribute that carries forward with students is the lingering effect of prior educators. Does coming from a highly effective fourth grade math teacher’s class impact a student’s learning in fifth grade math or beyond? If so, what is the magnitude of this effect and how long does that effect last? While certainly not a demographic characteristic, it is an attribute that may affect a student’s score and it is important to consider how or if it should be included in your model. 10

It’s Important Because...
As model providers try to control for more of the factors that could influence the reliability of their growth estimates, models become increasingly complex. The more complex a model becomes, the more difficult it can be to accurately communicate how the results are calculated.
It is not clear if there is a “right” answer to the question of how student demographics or other characteristics should be included in a model. What is clear is that it is an important consideration and a decision you should make prior to selecting a growth model.
Guiding Your Discussion
Growth models depend on a variety of data sources, such as test results and student background information, to compute growth estimates. What information does your organization have available to include in an analysis? Are the state or local assessments valid and reliable and aligned with the standards being taught? What student characteristics will you want to discuss with a model provider about possibly including in the analysis? Discuss with your leadership team.
Whether commercially- or locally-developed, tests attempt to capture a student’s knowledge in a given subject. While much care is taken to measure knowledge, it is not as straightforward as other measurements, such as student height for example. With student height, accurate and precise measures (e.g., inches) and instruments (e.g., rulers) exist. We can measure height multiple times and yield similar results.
In testing knowledge, however, precisely measuring how much “math” a student knows poses a challenge. Have you ever taken a test, received your results, and felt that your score is not representative of what you know? You may have had a bad test day. Or, the test could have been worded in ways you did not completely understand. Or, what was tested might not have been what was taught in class.
Even with the best test design, there is still a level of measurement error in the test that a given score represents a true score. Error in this sense is not that the test is wrong, but is a recognition that the results are not perfect.
Measurement error is just one example of error and uncertainty that growth models attempt to address. Many models report their level of uncertainty by producing a standard error or representing the result with a confidence interval (a range of values plus or minus the most likely value).
You may have encountered confidence intervals before. Surveys and polls typically publish statistics in the format “40 percent plus or minus 2 percent,” for example. The confidence interval in this example indicates the result is likely 40 percent, but could be as low as 38 percent or as high as 42 percent.
Further, with error around two years of student test results, the magnitude of the error in growth model results could be amplified. Some of the more complex models are able to incorporate estimates of measurement error to create more accurate growth calculations.
ModelDataChallenges• Student characteristics• Prior teacher influence• Measurement error• Missing test records• Years of test results• Student linkages and mobility
3CONSIDERATION #3: MEASUREMENT ERROR AND UNCERTAINTYHow does a potential growth model handle measurement error and uncertainty?
11
UNIT OF ANALYSIS: THE ‘N’ FACTOR
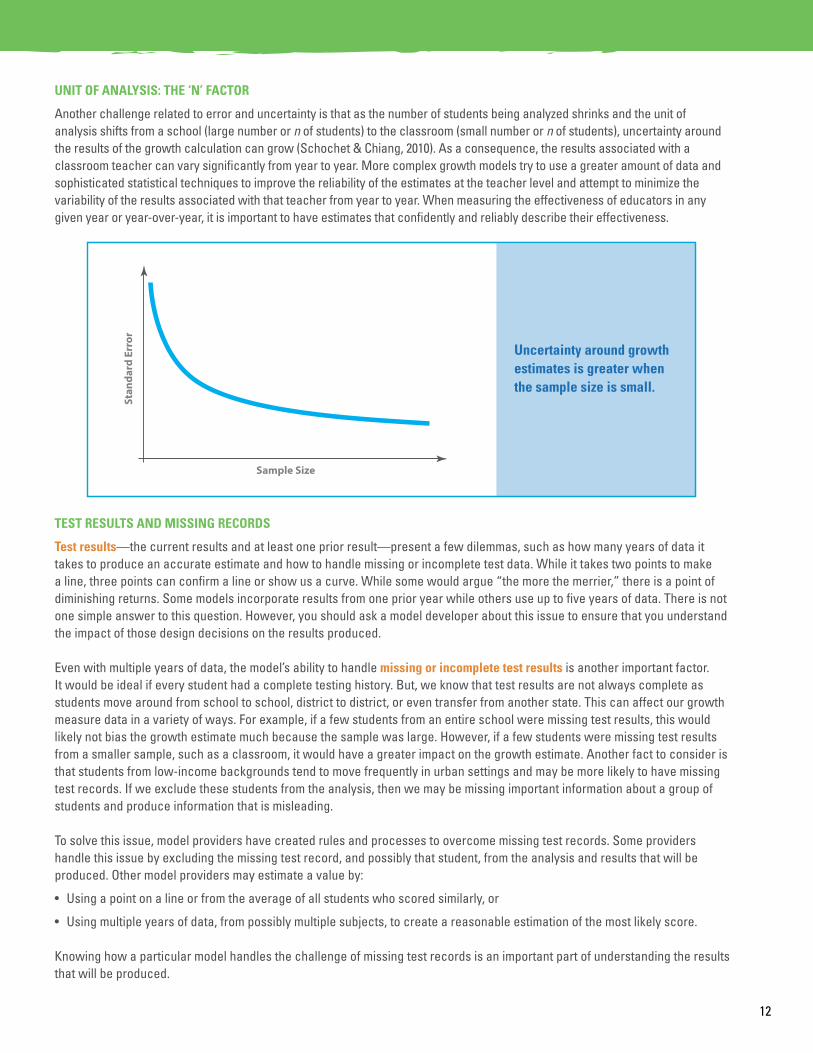
Another challenge related to error and uncertainty is that as the number of students being analyzed shrinks and the unit of analysis shifts from a school (large number or n of students) to the classroom (small number or n of students), uncertainty around the results of the growth calculation can grow (Schochet & Chiang, 2010). As a consequence, the results associated with a classroom teacher can vary significantly from year to year. More complex growth models try to use a greater amount of data and sophisticated statistical techniques to improve the reliability of the estimates at the teacher level and attempt to minimize the variability of the results associated with that teacher from year to year. When measuring the effectiveness of educators in any given year or year-over-year, it is important to have estimates that confidently and reliably describe their effectiveness.
TEST RESULTS AND MISSING RECORDS
Test results—the current results and at least one prior result—present a few dilemmas, such as how many years of data it takes to produce an accurate estimate and how to handle missing or incomplete test data. While it takes two points to make a line, three points can confirm a line or show us a curve. While some would argue “the more the merrier,” there is a point of diminishing returns. Some models incorporate results from one prior year while others use up to five years of data. There is not one simple answer to this question. However, you should ask a model developer about this issue to ensure that you understand the impact of those design decisions on the results produced.
Even with multiple years of data, the model’s ability to handle missing or incomplete test results is another important factor.It would be ideal if every student had a complete testing history. But, we know that test results are not always complete as students move around from school to school, district to district, or even transfer from another state. This can affect our growth measure data in a variety of ways. For example, if a few students from an entire school were missing test results, this would likely not bias the growth estimate much because the sample was large. However, if a few students were missing test results from a smaller sample, such as a classroom, it would have a greater impact on the growth estimate. Another fact to consider is that students from low-income backgrounds tend to move frequently in urban settings and may be more likely to have missing test records. If we exclude these students from the analysis, then we may be missing important information about a group of students and produce information that is misleading.
To solve this issue, model providers have created rules and processes to overcome missing test records. Some providers handle this issue by excluding the missing test record, and possibly that student, from the analysis and results that will be produced. Other model providers may estimate a value by:
• Usingapointonalineorfromtheaverageofallstudentswhoscoredsimilarly,or
• Usingmultipleyearsofdata,frompossiblymultiplesubjects,tocreateareasonableestimationofthemostlikelyscore.
Knowing how a particular model handles the challenge of missing test records is an important part of understanding the results that will be produced.
Stan
dard
Err
or
Sample Size
Uncertainty around growth estimates is greater when the sample size is small.
12

STUDENT LINKAGES AND MOBILITY
In a given year, students often receive instruction from multiple teachers for various reasons, such as:
• Studentmobilityacrossschools—studentschangeschoolsduringtheyear.
• Studentmobilityacrossclassrooms—teachersregrouporreassignstudentstoother classrooms for instructional reasons; students change schedules.
• Sharedinstruction—morethanoneteacherisresponsibleforastudent’slearning in a given subject.
To accurately understand a teacher’s influence on a student, it is important to identify which teacher taught what subject to a particular student (Battelle for Kids, 2009). Some models can handle more information about the “link” between teachers and students and can attribute portions of the school year to multiple teachers.
The challenge of accurately capturing all of the variables that describe the relationships among teachers and students within schools is complex. You need to understand how your growth model addresses these complexities, especially the influence of multiple educators on a student’s learning throughout the year.
It’s Important Because...
There are many ways growth models deal with error and uncertainty. A few are highlighted in this guide. You should discuss this with potential model providers or researchers to determine how they identify error and how they approach handling this statistical uncertainty to yield real confidence about effectiveness. If you plan to use the results to inform high-stakes human capital decisions, then it is especially important to ensure you have confidence in the results.
Guiding Your Discussion
What questions would you ask a provider about how their model handles measurement error and uncertainty? What concerns do you have? Do you believe student linkages and mobility are issues your district or state will need your growth model to address? Discuss with your leadership team.
13

4One of the most important considerations to address is the type of information you want a growth model to provide. The primary outputs of growth models are estimates of a group of students’ academic progress compared to other groups of students and the level of certainty around those estimates. These estimates can be aggregated or disaggregated at various educational levels to provide information for a variety of uses. Additionally, trends in individual student growth or projections to future high-stakes assessments also may be available as a result of the analysis.
To further address this consideration, review your intended uses (addressed in Consideration #1) and the questions you hope to answer. When you match your needs with the resultant outputs, your reporting will bring clarity to your improvement efforts.
For example, to gauge the effectiveness of a teacher, your model may need to produce information such as an estimate of effectiveness in each grade and subject taught, overall estimates in a grade or subject, and possibly an overall (or composite) estimate for all grades and subjects taught. Additionally, you want to report other information important in understanding a statistic such as the standard error or the confidence interval, as well as the number of students analyzed.
To help a teacher further identify areas for improvement, you may also need results for different levels of effectiveness with students by subgroup, including prior achievement level, English Language Learner status, students with a disability, or other characteristics that may be useful to a teacher to diagnose his or her varying levels of effectiveness.
While this wealth of information has the potential to be overwhelming, thoughtful design can help format the information in ways that are easy to understand while not sacrificing the integrity of the information. For example, several states and districts have chosen to present this information using data terms already in use in their system, such as percentiles, scale units of the test, or performance categories similar to those used in teacher evaluation. Commonly, models have used “stoplight” reporting (i.e., red, yellow, green). In other words, reporting the information in terms that teachers and others may be familiar with eases the burden of interpreting the results.
As a framework for determining the type of information you want a model to produce,consider the following questions of interest to various stakeholders posed by Yen, 2007:• Parents Did my child make a year’s worth of progress in a year? Is my child growing appropriately toward meeting state standards? Is my child growing as much in math as reading? Did my child grow as much this year as last year?
• Teachers Did my students make a year’s worth of progress in a year? Did my students grow appropriately toward meeting state standards? How close are my students to becoming proficient? Are there students with unusually low growth who need special attention?
• Administrators Didthestudentsinourdistrict/schoolmakeayear’sworthofprogressinall
content areas? Are our students growing appropriately toward meeting state standards? Doesthisschool/programshowasmuchgrowthasthatone? Can I measure student growth even for students who do not change
proficiency categories? Can I pool together results from different grades to draw summary conclusions?
CONSIDERATION #4: RESULTS AND OUTPUTSWhat types of results, outputs, or information do you want and in what format?
14

INFORMATION ACCESS, DISPLAY, AND REPORTING
There are a variety of ways to deliver and display growth estimates such as via Web-based or print, static or interactive reports.
Some model providers offer standard reporting, helpful guides for interpretation, and even interactive searches that allow you to query the data and create customized reports. Some providers also offer tables, charts, and other visuals to help you communicate results.
Additionally, growth estimates and other information produced may be delivered in a basic data file for you to use for a number of purposes. Many states and local systems intend to incorporate growth data into their longitudinal data warehouses to display on teacher or school effectiveness dashboards, include as a component of evaluation, or use in the computation of performance pay. However you choose to use the information, be mindful of the technology infrastructure required and the timelines you have for releasing information and any privacy or security requirements.
INFORMATION HANDLING
In addition to the standard types of reports you make available, consider whether you want to be able to:
• Customizereportsforvariousstakeholders;
• Manipulateandquerythedatatoanswernewquestions;
• Re-rosterstudentsatthebeginningoftheschoolyeartoprovideteachersaccess to their students’ past data; or
• Accessdatafromthemodelprovidertointegratewithacurrentlongitudinaldata warehouse.
It’s Important Because...
Successful implementation and use of these new measures are dependent on educators’ ability to access understandable, relevant, timely, and reliable information to guide decision making. Having an understanding internally of the types of information your state or district wants a model to produce is important so that you can communicate these needs with a model provider.
Guiding Your Discussion
Considering the educational uses you defined, what types of information do you need a model to produce? What types of reporting would make the information most useful for educators and other stakeholders? In what formats do you want to receive the results? Who should have access to the information? Discuss with your leadership team.
15

5Because student growth or value-added results are vastly different from any other type of data currently available to education stakeholders, it’s important to effectively prepare them to understand this information. Consider the level of communications, training, and support your stakeholders will need to appropriately interpret and use the results.
Your principals, teachers, and other employees, school board and local union leaders, parents, and other community members will need different types of information and levels of support. Without training and an effective communications strategy to engage and gain your stakeholders’ support, the measure’s potential for positive change may not be realized.
Following are some support services you may need:
• Basictrainingandsupport:Basic support includes training users to access reports (e.g., account set-up and password creation, account log-in, setting appropriate permissions, etc.) and navigate and interpret reports, including understanding the limitations of the growth estimates.
• Technicaltraining: Prepare how you will inform your stakeholders about the growth model’s analytical assumptions and processes and respond to questions related to the model’s technical calculations.
• Communicationssupport: Communications support includes assisting with internal and external messaging; developing communications materials, such as presentations, FAQs, letters, and online resources to engage and inform your stakeholders; and presenting to a variety of audiences in order to build trust in your state or district’s interpretation of estimates and intended use of the results.
• Professionaldevelopment: Helping teachers, principals, and other employees understand the value of using student growth estimates for educational improvement and accountability is critical to gain support for their use. Your state or district should plan to teach these individuals how to appropriately interpret and use growth estimates for improvement and to inform human resource decisions.
• Advocacy:Some model providers may provide technical consultation around appropriate applications of the measure; help a state or district consider new ways to use the information; and serve as an advisor when using the estimates for policy decisions, designing program evaluations, or conducting research. Who will advocate for growth measures and assist with communications when reports about student growth become part of public discourse about school and educator effectiveness is something to consider.
It’s Important Because...
Growth data has the potential to be an incredibly valuable tool to inform various educational-improvement efforts. However, most educators have little to no experience using and interpreting these results. Unless stakeholders understand and develop trust in the measure, its use will be limited.
Guiding Your Discussion
Communicating, interpreting, and supporting the use of growth or value-added information can be challenging for district leaders. What level of communications, training, and support do you anticipate needing from your model provider to ensure effective implementation? How familiar with growth models are stakeholders in your system? Discuss with your leadership team.
CONSIDERATION #5: COMMUNICATIONS, TRAINING, AND SUPPORTWhat types of communications, training, and support will you need to be successful?
16

6Implementing growth measures—especially for the purpose of examining educator effectiveness—is a challenge in any environment. It is important to consider the experience, expertise, and capacity you will need from internal resources as well as an external model provider in order for your organization to be successful.
While you may not need economists or statisticians on staff, internal capacity must be considered. State or district staff must have the ability and will to drive implementation decisions and oversee any work with an external provider to ensure success. If undertaking the analysis internally, your state or district should still consider outside support in the way of an external review of your systems, methods, and processes to ensure your models are behaving as expected and producing valid results.
If you choose to work with an external model provider, you need to be able to trust that the provider you select can handle the complexities and challenges inherent in implementing a growth model. Model providers who understand the educational context, have experience with data quality problems in education, including issues with assessments (e.g., scaling), and have evidence of successful implementation similar in scope will help you feel more confident. Additionally, you should ensure that you have a provider partner that can help you answer research questions or unforeseen issues that arise.
A model provider’s analytic expertise can be an important factor to consider, but is sometimes difficult to judge. An independent, external review of a provider’s approach or model may be important if you have to defend your model choice or the use of the measure for high-stakes decisions. Contacting other states or local school systems that have had success with a provider can also help guide your judgment of a provider’s analytic expertise.
Capacity of an external provider is an important factor as well. Consider carefully the service level you desire and ensure common understanding of what is necessary by both parties to succeed. Do model providers have adequate staff and technical capacity to ensure timely delivery of your analysis and reporting? Timing is important. You need to feel confident that you will receive the results you need— when you need them.
It’s Important Because...
Your choice of a growth model will have significant impact on your state or district, students, and employees. It also may draw attention from the public and media. It is important that you have the internal capacity and support of an external provider to successfully implement growth model analysis.
Guiding Your Discussion
What factors in your educational environment could influence successful implementation of a growth or value-added model? Have you determined your potential model provider’s analytical expertise, experience in a similar environment, and capacity to provide timely delivery? Discuss with your leadership team.
CONSIDERATION #6: EXPERIENCE, EXPERTISE, AND CAPACITYWhat experience, expertise, and capacity do you need to implement growth measures?
17

7As with any investment, the financial costs to implement and sustain a program are important to consider. Education spending is scrutinized, so you need to be prepared to explain the short- and long-term costs of implementing a growth model. You also need to be able to make a sound argument for spending public dollars on these measures.
Prior to making your selection, you need to understand the total cost associated with implementing a growth model in your state or district, such as:
• Policymakersorcommitteeschargedwithdecisionmaking;
• Projectmanagementstaffresponsibleforimplementingthework(includingoverseeing service providers);
• Technologyinfrastructure,includingcollectingandcleaningdata,conductingtheanalysis, and providing reporting;
• Professionaldevelopmenttobuildthecapacitytousetheinformation;and
• Ongoingcommunicationandsupport.
Be aware that model providers may price services in different ways. Common pricing models are per student included in the analysis, per school in a district, and estimated personnel time required to deliver these services.
If you choose to run the analysis internally, then you need to budget funds for a software license and technology infrastructure, including additional servers and personnel to run the applications and provide support and training.
To make the investment worthwhile, consider how you will ensure financial sustainability for the continued use of growth data. Remember to account for internal personnel and infrastructure, as well as available funding, to determine whether you could eventually conduct the analysis in-house, or if you need a long-term partnership with a provider.
Pricing for the analysis is just one part of the total cost of implementation. You need to consider the time and personnel your organization has to invest to make the implementation successful. Also consider the upgrades to your technology infrastructure that may be necessary. Be sure you are comparing “apples to apples” as you consider providers, their models, and the training and support your organization will need.
It’s Important Because...
Cost is a driving force in any purchasing decision. The total cost associated with implementing a growth or value-added model and your ability to sustain state or district use of the model are important considerations.
Guiding Your Discussion
What is your internal capacity and what resources do you have to support the implementation of a growth model? What services might need to be outsourced? What are your anticipated costs for initial implementation as well as ongoing options for sustainability? Discuss with your leadership team.
CONSIDERATION #7: COSTSWhat costs are involved in implementing student growth measures, both short- and long-term?
18

As you go through this decision-making process, remember that there is not a perfect model for measuring student academic progress or estimating educator effectiveness. Growth and value-added models come in a variety of forms and suit various uses and contexts differently.
However, growth measures used in conjunction with more traditional indicators of school success, can inform school improvement efforts in meaningful ways. The sophistication of these models will only continue to improve, as will the information they produce. While there will likely be continued questions about the efficacy of these models for high-stakes decisions, growing evidence suggests that these models can be a catalyst for improving the educational system and creating more opportunities for students.
The seven key considerations outlined in this guide and the effort required to carefully address them with your leadership team may seem daunting. However, we assure you that the time taken to make informed and thoughtful decisions related to the selection of a model will be well spent. As those states and school districts that already have implemented a growth model will tell you, the value of growth estimates can be powerful for improving teaching and education programs in your system.
Getting to Work
This guide offers a great deal of information to build your understanding of student growth models. Now it’s your turn to embark on this important work. Using this guide and the supporting resources online as a framework, your task now is to begin the discussion and decision-making process in your state or district. We hope this resource will be useful as you begin the process of thoughtfully selecting a model that best fits your state or school system’s educational environment.
Now is the time to begin this journey to improve teaching and accelerate the academic progress of all of the students you serve!
CONCLUSION
19

A variety of resources are available online at www.edgrowthmeasures.org to support you in this journey, including:•AdownloadablecopyofSelecting Growth Measures: A Guide for Education Leaders•Worksheetstofacilitateyourselectionofamodel Guiding Your Discussion—Step 1 Reviewing Providers—Step 2
• Informationprovideddirectlyfromagrowinglistofmodelproviders,suchas: Education Strategy Consulting, Inc. Mathematica Policy Research, Inc. SAS Institute, Inc. Value-Added Analysis Network Value-Added Research Center at University of Wisconsin-Madison
In addition, www.BattelleforKids.org offers examples of case studies and white papers of relevance to this educational improvement strategy.
RESOURCES AND SUPPORT
20

REFERENCES
Battelle for Kids. (2009). The importance of accurately linking instruction to students to determine teacher effectiveness.Columbus, Ohio: Battelle for Kids.
Council of Chief State School Officers & Learning Point Associates. (2010). Measures of student growth: Emerging trends reflected in the state phase 1 Race to the Top applications. Washington, DC: Council of Chief State School Officers.
Coleman, J. (1966). Equality of educational opportunity (Report No.OE-38000). Washington, DC: U.S. Department of Health,Education, and Welfare, Office of Education.
Harris, D. N. (2011). Value-added measures in education: What every educator needs to know. Cambridge, MA: HarvardEducation Press.
Harris, D. N. (2007). High flying schools, student disadvantage and the logic of NCLB. American Journal of Education, 113:367–94.
Koedel, C., & Betts, J. (2009). Value-added to what? How a ceiling in the testing instrument influences value-added estimation.NBER Working Paper 14778. Cambridge, MA: National Bureau of Economic Research.
McCaffrey, D. F., Lockwood, J. R., Koretz, D., Louis, T. A., & Hamilton, L. (2004). Models for value-added modeling of teacher effects. Journal of Educational and Behavioral Statistics, 29(1): 67–101
Schochet, P. Z., & Hanley S. C. (2010). Error rates in measuring teacher and school performance based on student test score gains (NCEE 2010-4004). Washington, DC: National Center for Education Evaluation and Regional Assistance, Institute ofEducation Sciences, U.S. Department of Education.
Yen, W. M. (2007). Vertical scaling and No Child Left Behind. In N. J.Dorans, M. Pommerich, & P. W. Holland (Eds.). Linking and aligning scores and scales. New York, NY: Springer.
Battelle for Kids would like to thank the many people who contributed to the development of thisresource for educators and policymakers.
ACKNOWLEDGEMENTS
21

Battelle for Kids is a national, not-for-profit organization thatprovides strategic counsel and innovative solutions for today’s
complex educational-improvement challenges.Our mission-driven team of education, technology, communications,
and business professionals specializes in creating strategiesthat advance the development of human capital, the use of
strategic measures, the implementation of effective practices, andcommunication with all stakeholders in schools.
We partner with state departments of education, school districts,and education-focused organizations to advance these strategies
with the shared goals of: improving teaching effectiveness andstudent progress; informing instructional practice in real time;
recognizing and rewarding teaching excellence; and aligning goalsand maximizing impact in schools.
www.BattelleforKids.org
©2011, Battelle for Kids
22
Related Documents