2012 Plastics Manufacturing in Selangor 2011/12 The plastics manufacturing sector of Selangor easily accounts for more than 1/3 of the total annual sales volume. Being home to more than 340 companies registered with the Malaysian Plastics Manufacturers Association approximately 1/5 of the whole industry are located in Selangor. With a strong automotive, consumer electronics and food industry at the doorstep, plastics manufacturer benefit from domestic and overseas demand alike. This report will introduce the current investment environment and economic developments relevant to plastic manufacturers. In particular, the report offers insights into the market structure in Malaysia and the state of Selangor, the general market segmentation and takes into consideration main target industries in the chapter on trends and developments. Selangor’s Plastics Manufacturing beats global crisis 2011/12

Welcome message from author
This document is posted to help you gain knowledge. Please leave a comment to let me know what you think about it! Share it to your friends and learn new things together.
Transcript

2012
Plastics Manufacturing in Selangor 2011/12 The plastics manufacturing sector of Selangor easily accounts for more than 1/3 of the total annual sales volume. Being home to more than 340 companies registered with the Malaysian Plastics Manufacturers Association approximately 1/5 of the whole industry are located in Selangor. With a strong automotive, consumer electronics and food industry at the doorstep, plastics manufacturer benefit from domestic and overseas demand alike. This report will introduce the current investment environment and economic developments relevant to plastic manufacturers. In particular, the report offers insights into the market structure in Malaysia and the state of Selangor, the general market segmentation and takes into consideration main target industries in the chapter on trends and developments.
Selangor’s Plastics Manufacturing beats global crisis 2011/12

Selangor’s Plastic Industry 2011/12
2
Malaysia Selangor Rank in Malaysia
Population 29m 5.6m 1 GDP (2010) 559,554m
(100%) 128,815m (23.03%)
1
GDP Growth (2010) 7.2% 10.8% 1
Number of Investment Projects (2010)
41 (100%) 11.7 (28.5%) 1
Workforce (2010) 13.1 million (100%) 2.82 million (21.5%) 1 Percentage of Total in
Malaysia Plastics Companies 1,500 (estimate) 340 (estimate) 22.6 % Sales Volume (2011) RM
16.1 billion 6.2 billion (of 175 registered companies)
38.5 %
Investment in Plastics Manufacturing (2012) RM
1.109 billion 341.8 million 30.8 %
Exports (2011) RM 10.1 billion 3.1 billion (estimate) 30.6 %
Workforce 70,000 27,000 38.5 % Largest Companies in Selangor by Turnover
Scientex Packaging Film Sdn Bhd Teck See Plastic Great Wall Plastic Industries Berhad
RM 600 million RM 603 million RM 308 million
Useful Contacts Malaysian Plastics Manufacturers Association: www.mpma.org.my Malaysian Investment Development Authority: www.mida.gov.my SIRIM Berhad: www.sirim.my
Report on Plastics Manufacturing in Selangor – Summary 2012
Selangor 39% Other
States-‐ Malaysia 61%
Sales Volume of Plastics Manufacturing in
2011/12 Selangor 23%
Other States -‐ Malaysia 77%
Plastics Manufacturers in Malaysia -‐ 2011/12
Diagram 1 Source: MPMA 2011/2012 Diagram 2 Source: MPMA 2011/2012
Selangor’s Plastic Industry 2011/12
3
Table of Contents 1. Market Structure – Selangor’s Plastics Manufacturer ............... 4
1.1 The Industry in Malaysia .................................................... 4
1.2 Why to invest in Selangor? ................................................ 5
1.3 Selangor’s Plastics Manufacturing Sector .......................... 6
2. Trends and Development – Main Target Industries .................. 9
2.1 Automotive Sector .............................................................. 9
2.2 Electronic and Electrical Sector ....................................... 10
2.3 Packaging Sector ............................................................. 12
3. Main Sources .......................................................................... 13

Selangor’s Plastic Industry 2011/12
4
1. Market Structure – Selangor’s Plastics Manufacturer
1.1 The Industry in Malaysia Malaysian plastics manufacturers have been recovering swiftly from a severe slump in 2009 and were increasing turnover as well as sales already in 2010 almost to pre-crisis levels. With a sales of RM 15.8 billion in 2010, the plastic manufacturing of the country has been achieving healthy growth rates of up to 8.2 % and were prospering on increasing demand from Europe and Japan in particular. Main driving forces for the continuous growth in the recent years were packaging materials and products as well as industrial films. Furthermore, the shift of E&E production, especially of televisions and air-conditioners, to Malaysia and strong demand from the automotive sector contributed to the on-going positive industry growth.
Diagram 3 Market Segments Plastic Manufacturing 2010/11, Malaysian Plastics Manufacturers Association 2012
As the pie chart above displays, packaging remains the main product category for Malaysian plastics companies, while other activities such as E&E, household products and automotive products have become more important in recent years. This complies with the observation of additional demand in Europe and Japan, which still refers mainly to packaging materials, e.g. for the food industries. Moving forward to 2012, the third quarter demonstrated considerable growth rates of up to 11% in the plastics sector, while the fourth
2%
7% 11%
10%
26%
42%
2%
Major Market Segments for Plastic Products in Malaysia 2010/11
Agriculture
Construction
Automotive
Household
E&E
Packaging
Others Source: MPMA 2011/12
Selangor’s Plastic Industry 2011/12
5
quarter went down to 5.2 %. Similar statements can be made about several of the target industries of plastic manufacturing, which were able to maintain growth trends and expand by 16% to 17% in September 2012, e.g. automotive. Generally, transport equipment continued in 2012 a strong performance with a 4th quarter growth rate of about 10%. In addition, the exports of many related products, including E&E, rose by 7.6 % on month to month base and about 4.5% on year to year base in September. E&E exports remain highly volatile with a severe drop in December 2012, but a rise of 4.7% in January 2013. Recent data from February 2013 indicated another drop. Consequently, the wide range of clients domestically as well as overseas offer an excellent bolster, however severe competition from China has started to pose a severe threat and challenge in 2013. Many observers expect a consolidation of the industry, since upgrades are required to remain competitive. These upgrades of machinery, further automation and process engineering are usually too expensive for many of the smaller players, who might not be able to compete with China. Currently, there are more than 1,500 companies related to the plastics industry in Malaysia. About 1/3 of these companies are mainly exporting their products, while the home market also offers demand, since E&E and also the local automotive sector have created a large customer base requiring diverse plastics products. While the national perspective can paint a picture of a favourable environment, the following chapter will break it down to state level.
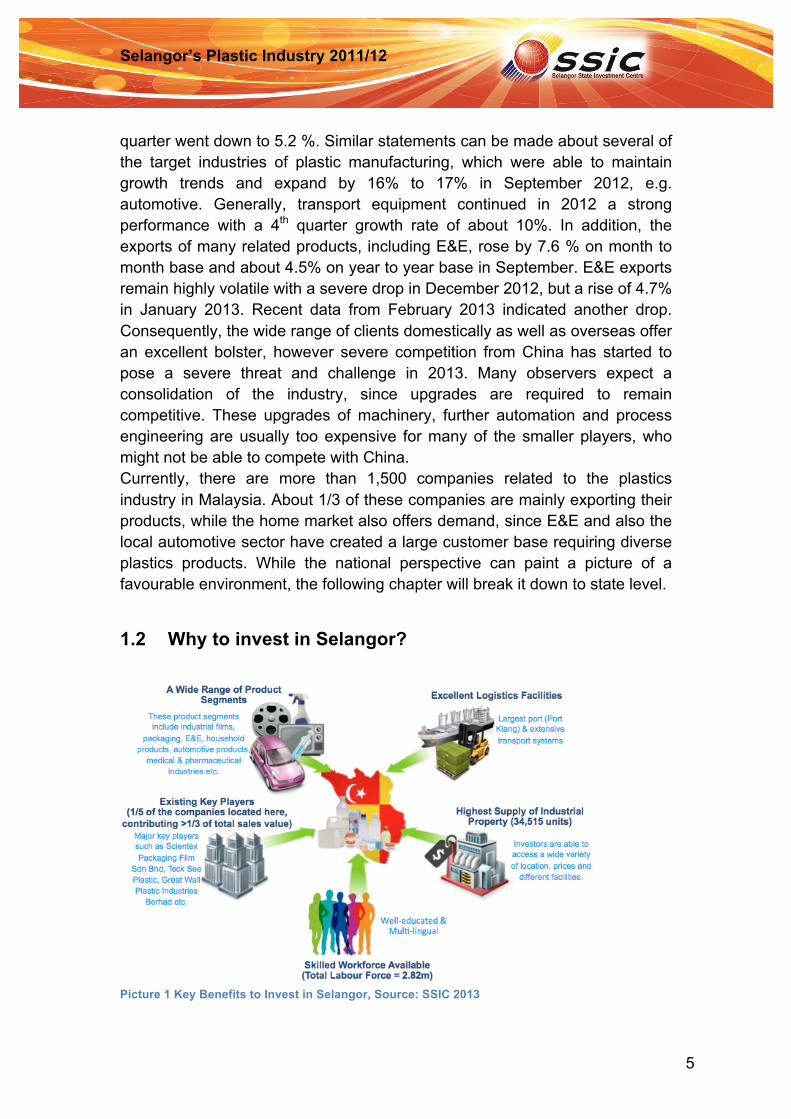
1.2 Why to invest in Selangor?
Picture 1 Key Benefits to Invest in Selangor, Source: SSIC 2013
Selangor’s Plastic Industry 2011/12
6
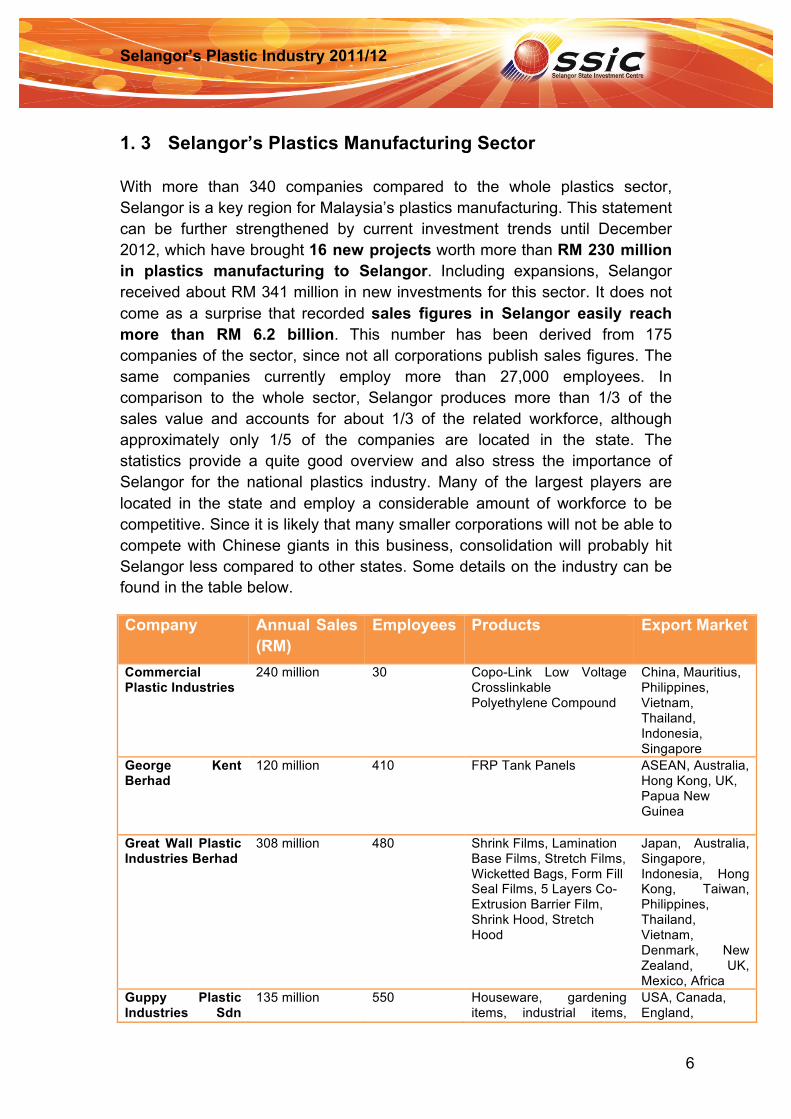
1. 3 Selangor’s Plastics Manufacturing Sector With more than 340 companies compared to the whole plastics sector, Selangor is a key region for Malaysia’s plastics manufacturing. This statement can be further strengthened by current investment trends until December 2012, which have brought 16 new projects worth more than RM 230 million in plastics manufacturing to Selangor. Including expansions, Selangor received about RM 341 million in new investments for this sector. It does not come as a surprise that recorded sales figures in Selangor easily reach more than RM 6.2 billion. This number has been derived from 175 companies of the sector, since not all corporations publish sales figures. The same companies currently employ more than 27,000 employees. In comparison to the whole sector, Selangor produces more than 1/3 of the sales value and accounts for about 1/3 of the related workforce, although approximately only 1/5 of the companies are located in the state. The statistics provide a quite good overview and also stress the importance of Selangor for the national plastics industry. Many of the largest players are located in the state and employ a considerable amount of workforce to be competitive. Since it is likely that many smaller corporations will not be able to compete with Chinese giants in this business, consolidation will probably hit Selangor less compared to other states. Some details on the industry can be found in the table below.
Company Annual Sales (RM)
Employees Products Export Market
Commercial Plastic Industries
240 million 30 Copo-Link Low Voltage Crosslinkable Polyethylene Compound
China, Mauritius, Philippines, Vietnam, Thailand, Indonesia, Singapore
George Kent Berhad
120 million 410 FRP Tank Panels ASEAN, Australia, Hong Kong, UK, Papua New Guinea
Great Wall Plastic Industries Berhad
308 million 480 Shrink Films, Lamination Base Films, Stretch Films, Wicketted Bags, Form Fill Seal Films, 5 Layers Co-Extrusion Barrier Film, Shrink Hood, Stretch Hood
Japan, Australia, Singapore, Indonesia, Hong Kong, Taiwan, Philippines, Thailand, Vietnam, Denmark, New Zealand, UK, Mexico, Africa
Guppy Plastic Industries Sdn
135 million 550 Houseware, gardening items, industrial items,
USA, Canada, England,
Selangor’s Plastic Industry 2011/12
7
Bhd Auto parts, E&E parts, semicon-packaging, pet products
Germany, Australia, New Zealand, South East Asia, France, Dubai, Jordan, Egypt, Saudi Arabia, Denmark, Netherlands, Poland
HICOM Teck See Manufacturing Malaysia Sdn Bhd
225 million 540 Automotive: Bumper, Bum other interior/exterior plastic parts
n/a
JPK Sdn Bhd 105 million 650 Auto parts, E&E parts, components and accessory, telco accessories and switches. Furniture appliances and parts, medical appliances
USA, Europe, Southeast Asia, China
Meditop Corp Sdn Bhd
118 million 1020 Medical Disposables such as extension tubes, scalp vein sets, infusion sets, pvc catheters, IV catheters, urinary bags, nelaton catheters, suction catheters, angiography tubes, 3-way stopcok, spinal needles, plastic syringes, g-bottles
Japan, India, Singapore, Indonesia, Philippines, Hong Kong, Taiwan, Europe, Africa, Middle East
Nylex (Malaysia) Berhad
130 million 400 PVC Films and sheets, imitation leather of PVC in sheets, PVC leathercloth and coated fabrics, plastic geocompsites and rotomoulded products
South East Asia, Middle East, Europe, USA, China, South Africa, India, Australia, New Zealand
Poly Carriers Industries Sdn Bhd
190 million 300 Shopping Bags, T-shirt bags, fashion bags, garbage bags, bag on role, PE sheets and films, agri-films, flexi packaging products, biodegradable bags, construction films
UK, Japan, Australia, New Zealand, France, Ireland, Africa, Reunion Island, Eastern Europe, Spain
Ralco Plastic Sdn Bhd
110 million 360 Heavy duty industrial drum, jerrycan, pails, bottles, boxes, containers, with UN marking and approval, cover or cap with clip-on/press-on/screw type or sealed type for industrial/
Hong Kong, Philippins, Papua New Guinea, Singapore, Australia

Selangor’s Plastic Industry 2011/12
8
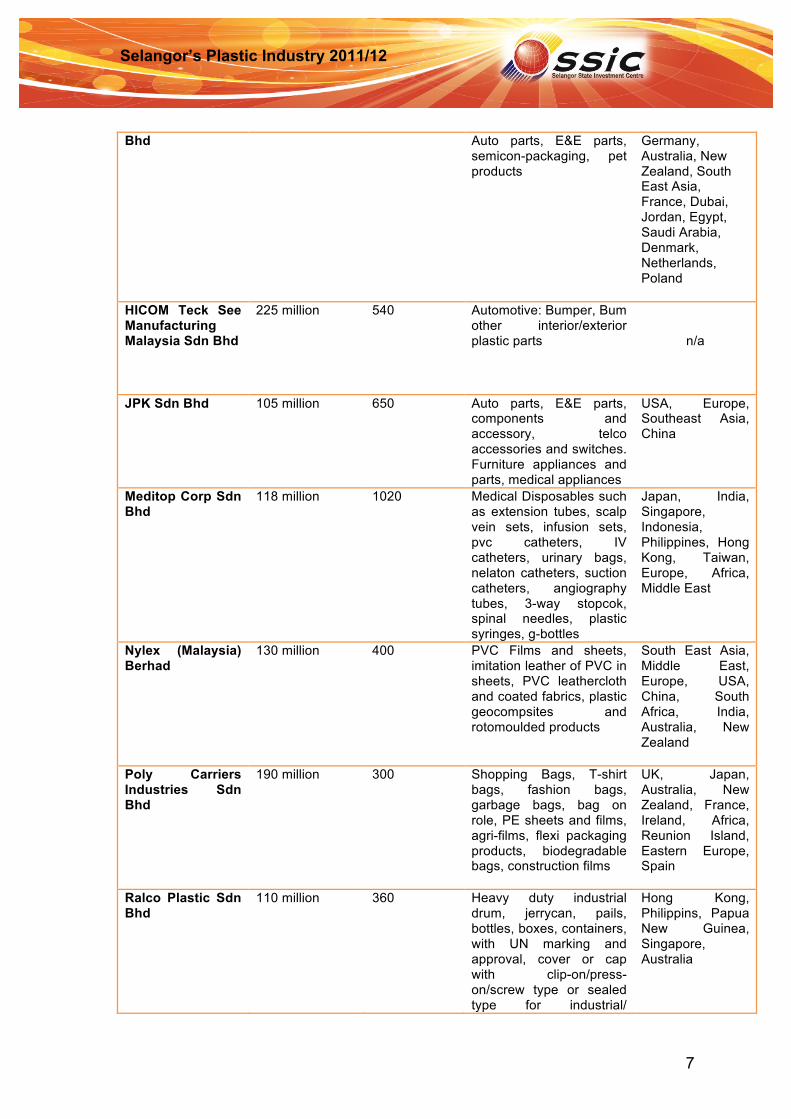
Table 1 Source: Malaysian Plastics Manufacturers Association 2012
Analysing the table above, companies such as Scientex or Teck See Plastic are employing more than 3,000 people and contribute RM 1.2 billion in sales value to the industry. These large players are both located here in Selangor and produce combined 10 % of the industry sales value. Some of the other players such as HICOM, Great Wall Plastics or Commercial Plastic Industries add easily another RM 700 million growing the current sales value almost to RM 2 billion. Product-wise, Selangor offers a wide range of different segments. Similar to the national product segments, industrial films and packaging play a major role, while also E&E, household and automotive products are strongly represented. The earlier mentioned manufacturers cover auto parts, E&E casings as well as different containers and storage systems made from plastic, while industrial films and packaging materials as well as medical and household products were included in the list. Since Selangor’s medical and pharmaceutical industries are growing, new client groups are emerging and shape the plastics industry in their own way.
agrochem, petrochem, industrial chemicals, detergent, paints food, beverages, and drinking water industry, products for medical and pharma industries
Scientex Packaging Film Sdn Bhd
600 million 660 Sheets, PVC leather cloth, stretch film, TPO, PP foam sheets, PVC rigist film, PP woven laminated bags, FIBC, blister packaging, PP strapping band
n/a
Teck See Plastic 603 million 2,143 E&E products, auto products, plastic pallets, heavy duty industrial containers
Singapore, Indonesia, Thailand, Vietnam, Japan, India, Spain, South Africa
Selangor’s Plastic Industry 2011/12
9
2. Trends and Development – Main Target Industries
2.1 Automotive Sector
Selangor has been a hub for the local automotive sector as well as parts and components manufacturers for many years. With about 11%, this sector is one of the main product segments for plastics manufacturing. Positive trends prevailed overall in 2012, having large automotive manufacturers, including the national car manufacturer Proton and Perodua located in the state. In 2012, the transportation equipment sector experienced a hike in investments of 39 projects worth RM 4.9 billion. With a potential employment of more than 7,000
new jobs, the sector is the biggest investor and a driving force of the local economy. While it also includes subsectors such as shipbuilding or aerospace, the main focus for this chapter will be on automotive manufacturing.
Table 2 Source: Department of Statistics 2012
Statistics prove that the production of motor vehicles in Malaysia experienced even in 2012 a steady growth rate. In a rather sluggish 2012, motor vehicles
Picture 2 Proton Logo, National Car of Malaysia
Selangor’s Plastic Industry 2011/12
10
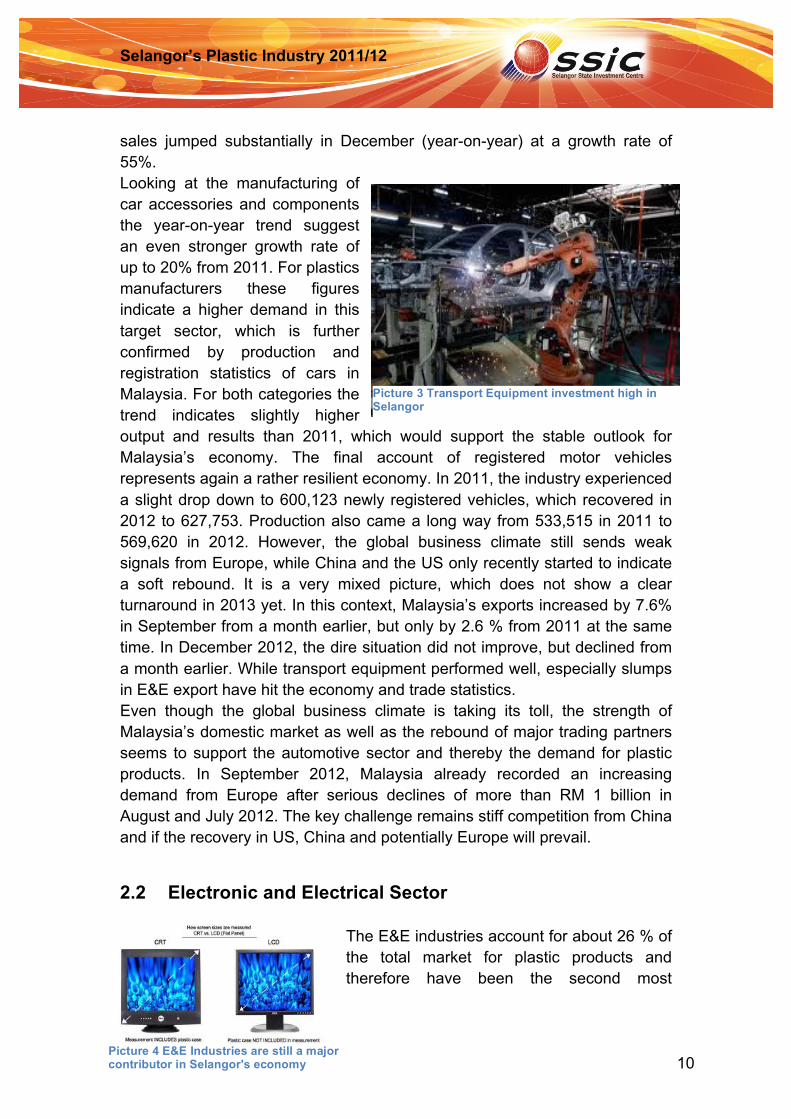
sales jumped substantially in December (year-on-year) at a growth rate of 55%. Looking at the manufacturing of car accessories and components the year-on-year trend suggest an even stronger growth rate of up to 20% from 2011. For plastics manufacturers these figures indicate a higher demand in this target sector, which is further confirmed by production and registration statistics of cars in Malaysia. For both categories the trend indicates slightly higher output and results than 2011, which would support the stable outlook for Malaysia’s economy. The final account of registered motor vehicles represents again a rather resilient economy. In 2011, the industry experienced a slight drop down to 600,123 newly registered vehicles, which recovered in 2012 to 627,753. Production also came a long way from 533,515 in 2011 to 569,620 in 2012. However, the global business climate still sends weak signals from Europe, while China and the US only recently started to indicate a soft rebound. It is a very mixed picture, which does not show a clear turnaround in 2013 yet. In this context, Malaysia’s exports increased by 7.6% in September from a month earlier, but only by 2.6 % from 2011 at the same time. In December 2012, the dire situation did not improve, but declined from a month earlier. While transport equipment performed well, especially slumps in E&E export have hit the economy and trade statistics. Even though the global business climate is taking its toll, the strength of Malaysia’s domestic market as well as the rebound of major trading partners seems to support the automotive sector and thereby the demand for plastic products. In September 2012, Malaysia already recorded an increasing demand from Europe after serious declines of more than RM 1 billion in August and July 2012. The key challenge remains stiff competition from China and if the recovery in US, China and potentially Europe will prevail.
2.2 Electronic and Electrical Sector
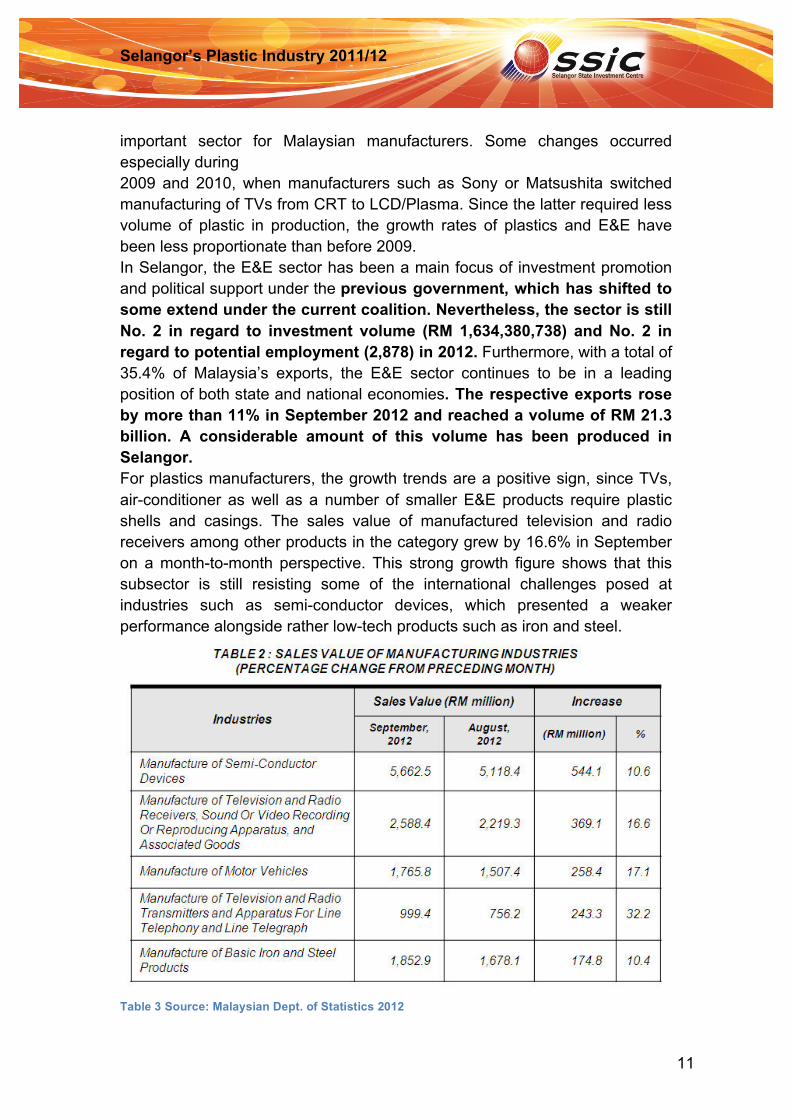
The E&E industries account for about 26 % of the total market for plastic products and therefore have been the second most
Picture 3 Transport Equipment investment high in Selangor
Picture 4 E&E Industries are still a major contributor in Selangor's economy
Selangor’s Plastic Industry 2011/12
11
important sector for Malaysian manufacturers. Some changes occurred especially during 2009 and 2010, when manufacturers such as Sony or Matsushita switched manufacturing of TVs from CRT to LCD/Plasma. Since the latter required less volume of plastic in production, the growth rates of plastics and E&E have been less proportionate than before 2009. In Selangor, the E&E sector has been a main focus of investment promotion and political support under the previous government, which has shifted to some extend under the current coalition. Nevertheless, the sector is still No. 2 in regard to investment volume (RM 1,634,380,738) and No. 2 in regard to potential employment (2,878) in 2012. Furthermore, with a total of 35.4% of Malaysia’s exports, the E&E sector continues to be in a leading position of both state and national economies. The respective exports rose by more than 11% in September 2012 and reached a volume of RM 21.3 billion. A considerable amount of this volume has been produced in Selangor. For plastics manufacturers, the growth trends are a positive sign, since TVs, air-conditioner as well as a number of smaller E&E products require plastic shells and casings. The sales value of manufactured television and radio receivers among other products in the category grew by 16.6% in September on a month-to-month perspective. This strong growth figure shows that this subsector is still resisting some of the international challenges posed at industries such as semi-conductor devices, which presented a weaker performance alongside rather low-tech products such as iron and steel.
Table 3 Source: Malaysian Dept. of Statistics 2012

Selangor’s Plastic Industry 2011/12
12
2.3 Packaging Sector With 42% market share, the product category of packaging is obviously the biggest and most dominant segment of the plastics industry in Malaysia and Selangor. 35% of the total plastic exports are plastic bags, bottles and casings, while another 36% are films, sheets and strips, which together amount to more than RM 7 billion.
HS Code
Prod. Cat. Apr May Jun Jul Aug Sept Jan-Sept 2012
3917 Tubes, Pipes And Hoses,
24,820.7 26,671.2 26,870.1 31,528.8 24,786.7 27,008.5 230,862.9
3918 Floor Coverings Of Plastics, Whether Or Not Self-Adhesive,
3,151.4 5,252.9 5,823.7 6,126.0 2,933.4 6,088.8 38,102.1
3919 Self-Adhesive Plates, Sheets, Film, Foil, Tape, Strip And Other Flat Shapes, Of Plastics,.
37,416.7 32,527.0 37,792.3 37,661.0 27,717.9 35,776.5 300,325.4
3920 Other Plates, Sheets, Film, Foil And Strip, Of Plastics,
239,202.8 239,468.0 228,063.8 220,292.6 217,314.4 227,205.2 2,064,240.3
3921 Other Plates, Sheets, Film, Foil And Strip, Of Plastics.
40,381.4 42,885.4 39,413.7 43,121.3 35,651.5 39,276.4 356,319.0
3922 Baths, Shower-Baths, Wash-Basins, Bidets, Lavatory Pans and similar
3,194.4 5,202.0 4,588.3 4,636.9 3,593.9 5,046.1 36,340.8
3923 Articles For The Conveyance Or Packing Of Goods
292,889.0 302,306.2 302,710.7 310,399.7 277,570.9 290,625.2 2,595,208.1
3924 Tableware, Kitchenware, Other Household Articles And Toilet Articles, Of Plastics.
23,652.5 25,152.2 24,821.1 23,654.4 24,311.3 23,129.1 210,723.0
3925 Builders' Ware Of Plastics,
13,929.5 15,306.1 19,552.6 16,707.8 13,436.2 14,181.7 146,912.6
3926 Other Articles Of Plastics
162,109.3 180,535.0 171,544.7 165,884.7 158,364.0 153,885.6 1,511,854.0
Total All Products 840,747.7 875,306.0 861,181.0 860,013.2 785,680.2 822,223.1 7,490,888.2 * All Values in RM ‘000
Table 4 Malaysian Plastics Ext. Trade, 2-3 Q 2012, Source: Malaysian Dept. of Statistics 2012

Selangor’s Plastic Industry 2011/12
13
For 2012, the statistics maintain similar levels to 2009-2010. Major plastic products combined, Malaysia has already exported about RM 7.4 billion until September 2012 and seems to be on track for a stable year. Packaging products amount to about RM 2.5 billion and probably hit at the end of the year similar levels like in 2010. Other major contributors to Malaysia’s plastic exports are plastic films, strips, sheets, foils and similar materials with another RM 2 billion of trade value until September 2012.
Main challenges for most of these product groups were the relatively lower demand from Europe in recent months. Major packaging manufacturers such as China and Thailand were suffering form high anti-dumping measures in the past, which was advantageous for Malaysia and supported Malaysian companies in taking over market shares. Since
Europe currently suffers from a sovereign debt crisis, consumer sentiment marks very low as well as the overall business activities. As a consequence, the plastics industry in Malaysia experienced lower demand during the summer months as the table above illustrates. For 2013, the opportunities to achieve growth depend largely on the rebound of major trading partners as well as a continuing demand from domestic producers. For the latter, export and a sluggish global economy pose a serious threat, too. Consequently, any outlook for plastics manufacturing must take the weakness in Europe and a recent dip in Japan seriously. The weak global economy is posing challenges to achieve healthy growth rates, although some positive signals in China and the US give reason for hope. A soft global rebound and the swift recovery from the 2009 slump indicate a stronger plastics industry and more sustainable growth rates in Malaysia.
3. Main Sources • Bank Negara Malaysia (2012): http://www.bnm.gov.my • Malaysian Automotive Association (2012): www.maa.org.my • Malaysian Department of Statistics (2011/12): http://www.statistics.gov.my/ • Malaysia Investment Development Authority (2012): www.mida.gov.my
Picture 5 Plastic Packaging from Malaysia
Selangor’s Plastic Industry 2011/12
14
• Malaysian Plastics Manufacturers Association (2011/12): www.mpma.org.my
• Malaysia External Trade and Development Corporation (2012): www.matrade.gov.my
• The Electrical and Electronics Association of Malaysia (2012): www.teeam.com
Related Documents