ORIGINAL RESEARCH FUNCTIONAL Seizure Frequency Can Alter Brain Connectivity: Evidence from Resting-State fMRI R.D. Bharath, S. Sinha, R. Panda, K. Raghavendra, L. George, G. Chaitanya, A. Gupta, and P. Satishchandra ABSTRACT BACKGROUND AND PURPOSE: The frequency of seizures is an important factor that can alter functional brain connectivity. Analysis of this factor in patients with epilepsy is complex because of disease- and medication-induced confounders. Because patients with hot-water epilepsy generally are not on long-term drug therapy, we used seed-based connectivity analysis in these patients to assess connectivity changes associated with seizure frequency without confounding from antiepileptic drugs. MATERIALS AND METHODS: Resting-state fMRI data from 36 patients with hot-water epilepsy (18 with frequent seizures [2 per month] and 18 with infrequent seizures [2 per month]) and 18 healthy age- and sex-matched controls were analyzed for seed-to-voxel connec- tivity by using 106 seeds. Voxel wise paired t-test analysis (P .005, corrected for false-discovery rate) was used to identify significant intergroup differences between these groups. RESULTS: Connectivity analysis revealed significant differences between the 2 groups (P .001). Patients in the frequent-seizure group had increased connectivity within the medial temporal structures and widespread areas of poor connectivity, even involving the default mode network, in comparison with those in the infrequent-seizure group. Patients in the infrequent-seizure group had focal abnormalities with increased default mode network connectivity and decreased left entorhinal cortex connectivity. CONCLUSIONS: The results of this study suggest that seizure frequency can alter functional brain connectivity, which can be visualized by using resting-state fMRI. Imaging features such as diffuse network abnormalities, involvement of the default mode network, and recruitment of medial temporal lobe structures were seen only in patients with frequent seizures. Future studies in more common epilepsy groups, however, will be required to further establish this finding. ABBREVIATIONS: DMN default mode network; HWE hot-water epilepsy; PCC posterior cingulate cortex; FDR false-discovery rate B ehind the unquestionable clinical and electroencephalo- graphic manifestations of an epileptic seizure, there lie several molecular, metabolic, cellular, and hemodynamic events that al- ter the function of the brain in a complex manner. These altera- tions may be transient, but many such events can have a cumula- tive effect, resulting in psychological and memory deficits, personality changes, and reduced functioning in patients with epilepsy. Advances in neurophysiology, functional imaging, and computational neurosciences have made it possible to derive models mathematically to describe such complex diseases. Disease-state network analysis with resting-state fMRI is be- coming increasingly popular because of its superior spatial reso- lution, nondependence on task, ease of acquisition, and ability to visualize whole-brain functional networks, which are amenable to long-term changes related to disease states. 1 Application of con- nectivity principles to these data has promoted research in various aspects of epileptic seizures, and there has been overwhelming report of decreased connectivity around the seizure-onset zone 2-6 and the default mode network (DMN) by several groups. 7,8 In 2012, Jehi 7 and Morgan et al 9 reported that connectivity patterns were different in patients with right and left mesial temporal scle- rosis and that there was decreased connectivity between the re- gions of the DMN and the hippocampus and amygdala in patients with mesial temporal sclerosis. Similarly, hemispheric connectiv- ity analysis in patients with unilateral mesial temporal sclerosis revealed decreased local and intrahemispheric connectivity and Received September 16, 2014; accepted after revision February 25, 2015. From the Departments of Neuroimaging and Interventional Radiology (R.D.B., R.P., L.G., A.G.) and Neurology (S.S., K.R., G.C., P.S.) and Advanced Brain Imaging Facility (R.D.B., R.P.), Cognitive Neuroscience Center, National Institute of Mental Health and Neuro Sciences, Bangalore, Karnataka, India Please address correspondence to P. Satishchandra, DM, FRCP, National Institute of Mental Health and Neuro Sciences, Hosur Rd, Bangalore, Karnataka, India; e-mail: [email protected]; [email protected]; @CNSresearchers Evidence-Based Medicine Level 2. http://dx.doi.org/10.3174/ajnr.A4373 1890 Bharath Oct 2015 www.ajnr.org

Welcome message from author
This document is posted to help you gain knowledge. Please leave a comment to let me know what you think about it! Share it to your friends and learn new things together.
Transcript

ORIGINAL RESEARCHFUNCTIONAL
Seizure Frequency Can Alter Brain Connectivity: Evidence fromResting-State fMRI
R.D. Bharath, S. Sinha, R. Panda, K. Raghavendra, L. George, G. Chaitanya, A. Gupta, and P. Satishchandra
ABSTRACT
BACKGROUND AND PURPOSE: The frequency of seizures is an important factor that can alter functional brain connectivity. Analysis ofthis factor in patients with epilepsy is complex because of disease- and medication-induced confounders. Because patients with hot-waterepilepsy generally are not on long-term drug therapy, we used seed-based connectivity analysis in these patients to assess connectivitychanges associated with seizure frequency without confounding from antiepileptic drugs.
MATERIALS AND METHODS: Resting-state fMRI data from 36 patients with hot-water epilepsy (18 with frequent seizures [�2 per month]and 18 with infrequent seizures [�2 per month]) and 18 healthy age- and sex-matched controls were analyzed for seed-to-voxel connec-tivity by using 106 seeds. Voxel wise paired t-test analysis (P � .005, corrected for false-discovery rate) was used to identify significantintergroup differences between these groups.
RESULTS: Connectivity analysis revealed significant differences between the 2 groups (P � .001). Patients in the frequent-seizure grouphad increased connectivity within the medial temporal structures and widespread areas of poor connectivity, even involving the defaultmode network, in comparison with those in the infrequent-seizure group. Patients in the infrequent-seizure group had focal abnormalitieswith increased default mode network connectivity and decreased left entorhinal cortex connectivity.
CONCLUSIONS: The results of this study suggest that seizure frequency can alter functional brain connectivity, which can be visualizedby using resting-state fMRI. Imaging features such as diffuse network abnormalities, involvement of the default mode network, andrecruitment of medial temporal lobe structures were seen only in patients with frequent seizures. Future studies in more common epilepsygroups, however, will be required to further establish this finding.
ABBREVIATIONS: DMN � default mode network; HWE � hot-water epilepsy; PCC � posterior cingulate cortex; FDR � false-discovery rate
Behind the unquestionable clinical and electroencephalo-
graphic manifestations of an epileptic seizure, there lie several
molecular, metabolic, cellular, and hemodynamic events that al-
ter the function of the brain in a complex manner. These altera-
tions may be transient, but many such events can have a cumula-
tive effect, resulting in psychological and memory deficits,
personality changes, and reduced functioning in patients with
epilepsy. Advances in neurophysiology, functional imaging, and
computational neurosciences have made it possible to derive
models mathematically to describe such complex diseases.
Disease-state network analysis with resting-state fMRI is be-
coming increasingly popular because of its superior spatial reso-
lution, nondependence on task, ease of acquisition, and ability to
visualize whole-brain functional networks, which are amenable to
long-term changes related to disease states.1 Application of con-
nectivity principles to these data has promoted research in various
aspects of epileptic seizures, and there has been overwhelming
report of decreased connectivity around the seizure-onset zone2-6
and the default mode network (DMN) by several groups.7,8 In
2012, Jehi7 and Morgan et al9 reported that connectivity patterns
were different in patients with right and left mesial temporal scle-
rosis and that there was decreased connectivity between the re-
gions of the DMN and the hippocampus and amygdala in patients
with mesial temporal sclerosis. Similarly, hemispheric connectiv-
ity analysis in patients with unilateral mesial temporal sclerosis
revealed decreased local and intrahemispheric connectivity and
Received September 16, 2014; accepted after revision February 25, 2015.
From the Departments of Neuroimaging and Interventional Radiology (R.D.B., R.P.,L.G., A.G.) and Neurology (S.S., K.R., G.C., P.S.) and Advanced Brain Imaging Facility(R.D.B., R.P.), Cognitive Neuroscience Center, National Institute of Mental Healthand Neuro Sciences, Bangalore, Karnataka, India
Please address correspondence to P. Satishchandra, DM, FRCP, National Instituteof Mental Health and Neuro Sciences, Hosur Rd, Bangalore, Karnataka, India;e-mail: [email protected]; [email protected]; @CNSresearchers
Evidence-Based Medicine Level 2.
http://dx.doi.org/10.3174/ajnr.A4373
1890 Bharath Oct 2015 www.ajnr.org
increased interhemispheric connectivity.10 In contradistinction
to the aforementioned results, there have been reports on in-
creased hippocampal connectivity that was presumed to be a
compensatory mechanism because it linearly correlated with a
disease duration of �10 years.1-4,6 Graph-theory analysis of rest-
ing-state fMRI data from patients with epilepsy also revealed de-
creased functional nodal topologic properties of the DMN that
were positively correlated with disease duration.8,11-14 Regional ho-
mogeneity analysis of resting-state fMRI data was even used as a
presurgical tool for seizure identification in patients with MR-nega-
tive focal epilepsy.15 Thus, various models of data analysis have
helped in understanding epilepsy further, and now there is increasing
interest in using these models to reclassify epilepsy as a focal epilep-
togenic area10,15 or as a network of seizure-generating areas.16-18
Gower’s clinical observation that “seizures beget seizures” in
1881 triggered several studies, especially animal models that ad-
dressed the genesis of epilepsy. Kindling is a phenomenon in
which the repetition of subconvulsive electrical stimuli results in a
progressive epileptic state and an increased frequency of sei-
zures.19,20 Kindling is a continuous temporal process that remod-
els the mechanisms and circuits in the brain. Early changes, be-
ginning with modulation of presynaptic and postsynaptic
functioning in glutamate, N-methyl-D-aspartate, and �-amino-3-
hydroxy-5-methyl-4-isoxazolepropionic acid receptors, and late
changes, including mossy fiber sprouting, synaptogenesis/neurogen-
esis, and neurotrophic factor regulation, are known to occur as a
result of kindling.20-22 The increased risk for seizure recurrence with
increasing numbers of seizures was first demonstrated clinically by
Hauser and Lee.23 The effects of seizure frequency and chronic epi-
lepsy have been studied sparsely by using imaging techniques.1 For
example, Widjaja et al24 found no significant correlation with seizure
frequency, age of seizure onset, or duration of epilepsy in a group of
children with medically refractory epilepsy.
Apart from other disease-related confounders such as type of
seizure, duration of epilepsy, age of onset, family history of epi-
lepsy, etc, each of which can induce connectivity differences inde-
pendently, a major limitation of interpreting the results of func-
tional connectivity in patients with epilepsy is the use of
antiepileptic drugs. Patients with hot-water epilepsy (HWE) pres-
ent with a history of complex partial seizures clinically suggestive
of temporal lobe onset with or without secondary generalization.
Most patients are drug naive at their first evaluation, which pro-
vided us an opportunity to study networks that were affected by
seizure frequency and matched for other disease-related con-
founders but not antiepileptic drugs. On the basis of the phenom-
enon of kindling, we hypothesized that seizures can alter brain
connectivity and that the frequency of seizures can influence the
magnitude of this alteration. We predicted that patients with a
higher seizure frequency would have widespread changes in com-
parison with patients with a lower seizure frequency. We used
seed-to-voxel– based resting-state fMRI connectivity in 36 drug-
naive patients with HWE who were comparable in terms of vari-
ous factors such as age, sex, education, and epilepsy-related con-
founders. We hope that such quantifiable noninvasive in vivo
evidence further enhances knowledge of the etiopathogenesis of
HWE and, if applicable to refractory epilepsy, can identify such
patients early to avoid time-consuming trial-and-error methods
of pharmacotherapy and facilitate early intervention to minimize
cognitive deficits.
MATERIALS AND METHODSThis prospective study was conducted at a university hospital, a
major tertiary care referral center for neurologic disorders. Writ-
ten informed consent was obtained from each participant, and the
study was approved by the institutional ethics committee of the
National Institute of Mental Health and Neuro Sciences.
Participants. The participants were 36 drug-naive patients with
HWE (male-to-female ratio, 3:1; mean age [� standard devia-
tion], 28.86 � 10.07 years) who were categorized into 1 of 2
groups: 18 patients (mean age, 29.06 � 9.61 years; mean age at
first seizure, 22.61 � 8.39 years; mean duration of epilepsy, 6.56 �
6.48 years) with a seizure frequency of �2 per month were as-
signed to the frequent-seizure group, and another 18 patients
(mean age, 28.67 � 10.78 years; mean age at first seizure, 20.69 �
10.36 years; mean duration, 7.39 � 9.76 years) with a seizure
frequency of �2 per month were assigned to the infrequent-
seizure group. The diagnosis of reflex HWE was based on criteria
of the Commission of the International League Against Epilepsy.25,26
Recruitment and evaluation were carried out under the supervi-
sion of 2 epileptologists (P.S. and S.S.). The demographic and
phenotypic details were recorded. Eighteen healthy controls
(male-to-female ratio, 3:1; mean age, 29.1 � 9 years) matched in
terms of age, sex, and years of education were recruited from the
hospital staff. Only healthy participants who did not have any
history of neurologic or psychiatric illnesses were enrolled in the
study. Morphologic evaluation of brain MR imaging including
the hippocampus revealed that none of the participants had any
structural abnormalities. Patients with diffuse EEG abnormalities
and frequent interictal epileptiform discharges were excluded
from the analysis. Statistical analysis for the demographic vari-
ables using the independent-sample t test for continuous variables
and the �2 test for categoric variables revealed no significant dif-
ferences between the control and patient groups other than sei-
zure frequency.
Image Acquisition. All the participants underwent resting-state
fMRI and structural MR imaging by using a 3T Skyra MR scanner
(Siemens, Erlangen, Germany) with a 20-channel head coil. Foam
pads were used to reduce head motion. The acquisition parame-
ters for EPI using blood oxygen level– dependent contrast were as
follows: volumes, 185; TR, 3000 ms; TE, 30 ms; sections, 34;
section thickness, 4 mm; FOV, 192 � 192 mm; resolution,
64 � 64; refocusing pulse, 90°; and voxel size, 3 � 3 � 4 mm.
The total time of acquisition for resting-state fMRI was 9 min-
utes 24 seconds. Anatomic images were acquired by using a 3D
T1-weighted MPRAGE sequence in 192 sections with a TR of
1900 ms, a TE of 2.43 ms, a TI of 900 ms, an FOV of 256 � 256,
a resolution of 256 � 256, and a section thickness of 1 mm.
Axial FLAIR, T2, and gradient sequences were used to rule out
structural abnormalities.
Image Analysis
Preprocessing. The functional and structural MR imaging pre-
processing was performed by using statistical parametric map-
AJNR Am J Neuroradiol 36:1890 –98 Oct 2015 www.ajnr.org 1891

ping (SPM8; http://www.fil.ion.ucl.ac.uk/spm/software/spm8/).
To maintain the magnetization equilibrium in the brain, the first
5 images were discarded. The data were realigned for motion
correction by registration to the mean image. Each of the sub-
jects’ functional images were transformed to the Montreal
Neurological Institute standard space by using the deforma-
tion field derived in the new segmentation procedure (voxel
size, 3 � 3 � 3 mm) and smoothed with a Gaussian kernel of 6
mm at full width at half maximum. In addition to these steps,
the structural data were segmented for gray matter, white mat-
ter, and CSF to remove the effects of head motion and WM and
CSF noise reduction and for bias correction of magnetization
in homogeneity.
Anatomic Parcellation. The fMRI data were segmented into 106
anatomic ROIs on the basis of a Talairach atlas for whole brain
regions (47 Brodmann areas, cerebellar tonsils, pyramis, and the
posterior and anterior thalami of both the hemispheres) by using
the anatomically labeled template reported by Tzourio-Mazoyer
et al27 in 2002 and per several previous studies.28,29
Functional Connectivity Analysis. A seed-to-voxel– based func-
tional connectivity analysis was performed by computing the
temporal correlation between the blood oxygen level– dependent
signals to create a correlation matrix showing connectivity from
the seed region to all other voxels in the brain by using the func-
tional connectivity toolbox (CONN, version 13.L) implemented
in SPM8 (http://www.nitrc.org/projects/conn; cited by Whit-
field-Gabrieli and Ford, 2012)30 and was used to create individual
subject seed-to-voxel connectivity maps. The preprocessed im-
ages were used for seed-based connectivity analysis. Motion cor-
rection was performed by using rigid-body transformation. We
used 3 translational and 3 rotational parameters as covariates.
Because the spontaneous, coherent, and low-frequency fluctua-
tions of the blood oxygen level– dependent signal are used for
resting-state fMRI analyses, the blood oxygen level– dependent
time-series for each subject was extracted and bandpass filtered
(0.009 – 0.09 Hz). Because neural activa-
tion is localized to gray matter, fluctua-
tions in white matter and CSF regions
should primarily reflect signals of non-
neural origin, such as cardiac or respira-
tory fluctuations. Hence, WM- and
CSF-related physiologic noise source re-
duction was carried out by using the
CompCor algorithm.31,32 The seed
ROIs consisted of 3-mm-radius spheres
centered on Montreal Neurological In-
stitute coordinates used to identify the
corresponding networks. Bivariate anal-
ysis was performed between each pair of
ROIs. The general linear modeling was
designed with canonical hemodynamic
response function to determine signifi-
cant connections30 at the individual
level (first-level analysis). The connec-
tivity maps were estimated for correlat-
ing seed region signals with voxel signals throughout the whole
brain, thereby creating seed region–to-voxel Fisher-transformed
connectivity maps. Second-level random-effects analysis was used
to create within-group statistical parameter maps for each net-
work and to examine connectivity differences between groups.
The group mean effects were estimated for the 3 groups.
Statistical AnalysisVoxel wise paired t-test analyses between the 1) infrequent-sei-
zure and control groups, 2) frequent-seizure and control groups,
and 3) frequent-seizure and infrequent-seizure groups were per-
formed to detect regions with significant intergroup differences.
Between-group statistical parameter maps were thresholded at a
whole-brain cluster-level– corrected � value of .05 for a voxel wise
P value of �.005 with false-discovery rate (FDR) correction,33
which was more stringent than the required adjusted P value of
�.017.
RESULTSThe demographic and phenotypic details of the patients are pro-
vided in Table 1. At the time of recruitment, each patient was drug
naive and had never been prescribed antiepileptic drugs. On av-
erage, there was a gap of 10.5 � 7.5 days between the last seizure
and MR imaging (frequent-seizure group, 10.6 � 7.5 days; infre-
quent-seizure group, 9.38 � 6.9 days). These differences between
the groups were not statistically significant (P � .753). Only 2
patients in the infrequent-seizure group revealed focal EEG ab-
normalities as spike-and-wave epileptiform discharges over the
right temporo-occipital region. A family history of seizures was
present in 6 patients in the frequent-seizure group and 5 patients
in the infrequent-seizure group. Most were complex partial sei-
zures or secondarily generalized tonic-clonic seizures (Table 1).
Among all the demographic variables, only the frequency of sei-
zures was statistically significant when the independent-sample t
test was used (P � .001). The seed-to-voxel– based connectivity
analysis revealed that patients in the frequent-seizure group had a
widespread decrease in connectivity, predominantly involving the
Table 1: Demographic and clinical features of 2 groups (with frequent or infrequentseizures) of patients with HWE
Clinical FeatureFrequent-SeizureGroup (>2/mo)
Infrequent-SeizureGroup (≤2/mo) P Value
Male/female ratio, n 14:4 13:5 .700Mean (�SD) age at evaluation, y 29.06 � 9.86 28.67 � 10.78 .910Mean (�SD) age at onset, y 22.61 � 8.39 20.69 � 10.36 .546Mean (�SD) duration of illness, y 6.56 � 6.48 7.39 � 9.76 .546HWE attacks per month �.0001
Mean (�SD) 2.61 � 0.69 0.62 � 0.52Median (range) 2.5 (2–4) 0.43 (0.02–1.66) �.0001
1:1 episodes, n (%)a 8 (44.4) 1 (5.6) .717Family history of any type of epilepsy, n (%) 6 (33) 5 (27) .463History of febrile convulsion, n 1 0Family history of HWE, n (%) 4 (22) 1 (5.6)Self-induction phenomena, n (%) 2 (11.1) 2 (11.1)Abnormal EEG, n 0 2 (11.1)Focal abnormalities in EEG, n 0 2Mean (�SD) time between last seizure and
fMRI, days10.6 � 7.5 9.38 � 6.9 .735
Complex partial seizures, n 12 10Generalized tonic-clonic seizures, n 6 8
a Patients who were having seizures every time they took a hot-water bath.
1892 Bharath Oct 2015 www.ajnr.org

parietal lobes and the DMN, whereas those in the infrequent-
seizure group had only a focal decrease in entorhinal connectivity.
It is interesting to note that patients in the frequent-seizure group
had increased visual cortex, entorhinal, and perirhinal connec-
tions, whereas those in the infrequent-seizure group had in-
creased DMN connectivity compared to the healthy controls. The
details of the various subgroup analyses are given below.
Frequent-Seizure Group versus Healthy ControlsIn the analysis of healthy controls versus the frequent-seizure
group, it was found that patients had significantly decreased con-
nections of the posterior cingulate cortex (PCC) with the angular
gyrus, temporopolar region, and medial prefrontal cortex (P �
.001). Various seeds in the left parietal lobe also showed signifi-
cantly (FDR-corrected P � .001) decreased connections with bi-
lateral motor cortices, the dorsal frontal cortex, superior temporal
lobes, and cerebellar tonsils. The right dorsal frontal cortex had
significantly (FDR-corrected P � .005) decreased connections
with the bilateral superior temporal gyrus. It was interesting to
note that patients in the frequent-seizure group also had signifi-
cantly (P � .005) increased connections of primary and secondary
visual cortices to the precuneus. The mean images of the connec-
tivity analyses of the most significant ROIs are presented in the
composite Fig 1, and the areas are detailed in Table 2.
Infrequent-Seizure Group versus Healthy ControlsThe patients in the infrequent-seizure group were similar to the
healthy controls in most of the connections. Only the left poste-
rior entorhinal cortex showed a significant (FDR-corrected
P � .005) decrease in connectivity with the left fusiform gyrus.
Patients in the infrequent-seizure group had increased connec-
tions of the DMN with the PCC and of the anterior prefrontal
cortex. There was also increased connectivity of the anterior cin-
gulate cortex with the superior temporal region. It should be
noted that patients with infrequent seizures had no areas with
decreased connections to the DMN. The mean image-of-connec-
tivity analysis of these ROIs is presented in the composite Fig 1,
and the most significant areas are listed in Table 3.
Frequent- versus Infrequent-Seizure GroupThe patients in the frequent-seizure group were significantly
(FDR-corrected P � .001) different from those in the infrequent-
seizure group in their left parietal and PCC connections. The most
significant (FDR-corrected P � .001) among these areas were the
connections of the left angular gyrus, precuneus, and left parietal
lobes with the PCC and medial prefrontal cortex. The left somato-
sensory cortex, bilateral premotor cortex, and left lower parietal
lobe also showed significant (FDR-corrected P � .005) decreased
connections. The bilateral prefrontal cortex, right superior frontal
gyrus, and dorsal frontal cortex also revealed significant (FDR-
corrected P � .005) decreased connections with the superior and
middle temporal gyrus. The anterior cingulate showed significant
decreased connections with the left piriform cortex. The patients
with frequent seizures had a significant (FDR-corrected P � .005)
increase in connections within the temporal lobes bilaterally in-
volving the seizure-prone entorhinal, perirhinal with primary au-
ditory cortex bilaterally. The mean image-of-connectivity analysis
of these ROIs is presented in the composite Fig 1, and the most
significant areas are listed in Table 4.
DMN ConnectivityTo assess the functional connectivity differences encompassing
the DMN, seed-based connectivity analysis of the PCC (FDR-
corrected P � .001) was performed for each of the 3 groups. Pa-
tients in the infrequent-seizure group revealed increased DMN
connectivity with increased connections between the anterior
prefrontal lobe, PCC, anterior cingulate cortex, and medial tem-
poral lobe in comparison with those in the healthy controls. Pa-
tients in the frequent-seizure group had poor connections of the
PCC seed with no connectivity to the anterior cingulate, medial
frontal, bilateral parietal, or temporal lobes. These differences are
highlighted in Fig 2.
DISCUSSIONThe exact etiopathogenesis of hot-water epilepsy is not clear, but
several factors, including genetic factors, environmental factors,
consanguineous marriage, and a habit of taking baths in water at
a high temperature, have been postulated as probable reasons.34
We conducted a study to evaluate the functional connectivity in 2
groups of patients with HWE. Initially, we performed a seed-
based analysis to understand connectivity patterns in 106 brain
seeds of the Talairach coordinates with all the voxels in the brain
to determine which of the seeds are significantly involved in pa-
tients with HWE and also to decipher how they differ between
patients in the frequent-seizure group and those in the infre-
quent-seizure group. In patients with frequent seizures, we noted
highly significantly reduced connectivity within several temporal
and frontoparietal regions and increased temporal region connec-
tions. In patients with infrequent seizures, the disruptions were
much less widespread and involved predominantly the temporal
regions. Subsequent analysis of the DMN showed a grossly re-
duced connectivity of the DMN in the frequent-seizure group
compared with increased connections in the infrequent-seizure
group.
The connectivity differences could mean inherent differences
between the groups. These differences could suggest disease focus,
or could be indicators of disease progression and associated com-
pensatory mechanisms. We found that there were several areas of
decreased connectivity with associated decreased connectivity of
the DMN, as found by many other researchers7-8,14,35,36 and as
has been observed in children with refractory epilepsy,24 which is
known to correlate with disease duration.6,14 Decreased connec-
tivity was limited to the temporal lobes in patients with infrequent
seizures and was widespread and involved the frontal, parietal,
and temporal lobes, thalamus, and cerebellum in patients with
frequent seizures. Because evidence of decreased connectivity has
also been associated with several neuropsychiatric diseases such as
dementia, stroke, traumatic brain injury, depression, and schizo-
phrenia, it is possible that decreased connectivity might be indic-
ative of the cognitive and social deficits associated with the disease
together with the disease burden. We found that patients in the
frequent-seizure group had increased connections within the
temporal lobes bilaterally involving the seizure-prone medial
temporal structure and bilateral primary auditory cortex, and
AJNR Am J Neuroradiol 36:1890 –98 Oct 2015 www.ajnr.org 1893
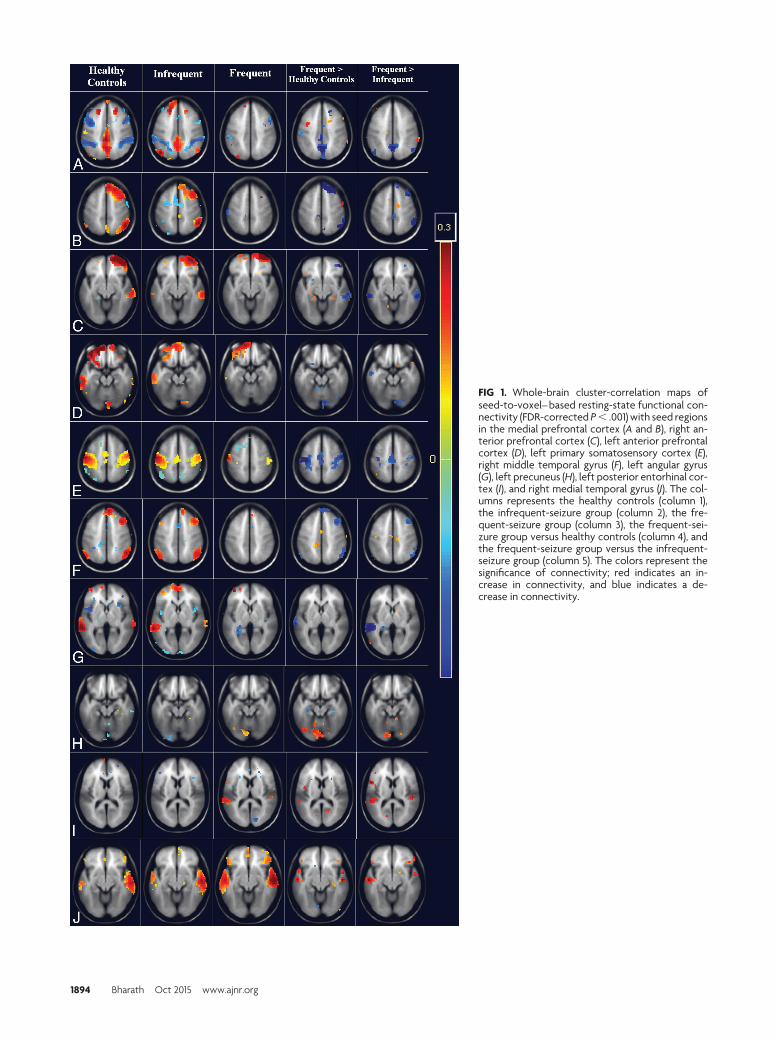
FIG 1. Whole-brain cluster-correlation maps ofseed-to-voxel– based resting-state functional con-nectivity (FDR-corrected P � .001) with seed regionsin the medial prefrontal cortex (A and B), right an-terior prefrontal cortex (C), left anterior prefrontalcortex (D), left primary somatosensory cortex (E),right middle temporal gyrus (F), left angular gyrus(G), left precuneus (H), left posterior entorhinal cor-tex (I), and right medial temporal gyrus (J). The col-umns represents the healthy controls (column 1),the infrequent-seizure group (column 2), the fre-quent-seizure group (column 3), the frequent-sei-zure group versus healthy controls (column 4), andthe frequent-seizure group versus the infrequent-seizure group (column 5). The colors represent thesignificance of connectivity; red indicates an in-crease in connectivity, and blue indicates a de-crease in connectivity.
1894 Bharath Oct 2015 www.ajnr.org

those in the infrequent-seizure group had increased connections
of the DMN. Observations of increased connectivity with other
types of epilepsy, such as in the medial temporal lobes with mesial
temporal sclerosis,8,10 the lateral orbitofrontal lobes with absence
seizures,37 and frontal lobes with idiopathic generalized epi-
lepsy,38,39 make us surmise that increased connections are prob-
ably more specific to understand epileptogenesis. Previous studies
also pointed to a temporal lobe origin in 67%–100% of patients
Table 2: Seed-to-voxel– based connectivity results in the frequent-seizure and healthy control groups
Seed Region Connectivity RegionP Value
(FDR Corrected)Cluster Size
(No. of Voxels) � Valuea T Valueb
Posterior cingulate cortex L angular gyrus (decreased) .0003 381 �0.21 6.84L temporopolar region (decreased) .0009 325 �0.24 7.11Medial prefrontal cortex (decreased) .0009 247 �0.15 6.14L lateral parietal cortex (decreased) .002 92 �0.15 4.96L inferior parietal cortex (decreased) .002 52 �0.13 4.64L superior temporal cortex (decreased) .005 37 �0.21 5.22
L primary somatosensory cortex R primary motor cortex (decreased) .001 336 �0.22 8.70L primary motor cortex (decreased) .001 187 �0.17 6.51
L superior temporal gyrus L precuneus (decreased) .002 112 �0.11 5.79R dorsal frontal cortex (decreased) .005 77 �0.11 5.82
L primary auditory cortex R premotor cortex (decreased) .005 94 �0.17 6.87R dorsal frontal cortex R and L superior temporal gyrus (decreased) .005 117 �0.12 5.86L lateral parietal cortex R cerebellar tonsil (decreased) .005 43 �0.09 5.13Medial prefrontal cortex L and R dorsal posterior cingulate cortex (decreased) .005 166 �0.11 5.52
L primary somatosensory cortex (decreased) .005 137 �0.11 6.19R medial temporal gyrus R temporopolar region (increased) .005 146 0.17 7.96
R posterior entorhinal cortex (increased) .005 108 0.17 6.28L precuneus L secondary visual cortex (increased) .001 121 0.15 7.78
L primary visual cortex (increased) .003 83 0.13 5.49
Note:—L indicates left hemisphere; R, right hemisphere.a � values represent Fisher-transformed correlation coefficient values.b T values represent the strength of connectivity between the source seed region and correlated-voxels regions.
Table 3: Seed-to-voxel– based connectivity results in the infrequent-seizure and healthy control groups
Seed Region Connectivity RegionP Value
(FDR Corrected)Cluster Size
(No. of Voxels) � Valuea T Valueb
L posterior entorhinal cortex L fusiform gyrus (decreased) .004 140 �0.15 6.73L anterior prefrontal cortex L ventral posterior cingulate cortex (increased) .003 136 0.12 7.34
L dorsal posterior cingulate cortex (increased) .005 74 0.10 6.17R anterior cingulate cortex R posterior superior temporal gyrus (increased) .002 172 0.10 6.82
Note:—L indicates left hemisphere; R, right hemisphere.a � values represent Fisher-transformed correlation coefficient values.b T values represent the strength of connectivity between the source seed region and correlated-voxels regions.
Table 4: Seed-to-voxel– based connectivity results in the frequent- and infrequent-seizure groups
Seed Region Connectivity RegionP Value
(FDR Corrected)Cluster Size
(No. of Voxels) � Valuea T Valueb
Medial prefrontal cortex Precuneus (decreased) .00004 279 �0.19 9.76Posterior cingulate cortex (decreased) .00004 347 �0.25 5.72
R anterior prefrontal cortex R dorsal frontal cortex (decreased) .005 284 �0.27 9.17R middle temporal gyrus (decreased) .005 147 �0.18 6.13
L anterior prefrontal cortex L middle temporal gyrus (decreased) .005 92 �0.11 5.57Posterior cingulate cortex (decreased) .005 110 �0.10 5.43L pyramis (decreased) .005 122 �0.14 6.02
L primary somatosensory cortex R premotor cortex (decreased) .0001 192 �0.26 9.31L premotor cortex (decreased) .002 148 �0.18 8.66
L angular gyrus L superior temporal gyrus (decreased) .002 108 �0.11 6.63Anterior cingulate L piriform cortex (decreased) .005 56 �0.11 5.39L lateral parietal cortices Precuneus (decreased) .0006 309 �0.18 8.17
L somatosensory association area (decreased) .003 164 �0.13 7.96Posterior cingulate cortex L angular gyrus (decreased) .00006 321 �0.17 7.84
L inferior parietal cortex (decreased) .0009 191 �0.16 6.52L thalamus R somatosensory association cortex (decreased) .009 78 �0.11 4.67L posterior and anterior entorhinal
cortexR primary auditory cortex (increased) .005 112 0.10 5.34
L primary auditory cortex (increased) .005 93 0.11 5.71
Note:—L indicates left hemisphere; R, right hemisphere.a � values represent Fisher-transformed correlation coefficient values.b T values represent the strength of connectivity between the source seed region and correlated-voxels regions.
AJNR Am J Neuroradiol 36:1890 –98 Oct 2015 www.ajnr.org 1895

with HWE.40-42 Interictal EEG results are usually normal in most
of the cases, but a few case studies showed localized temporal lobe
discharges.41,43 Isolated case reports of associated hippocampal
sclerosis have also been reported. In a recent study that involved 5
patients with HWE, 2 of 3 patients who underwent ictal SPECT
had hyperperfusion in the temporal region,44 and an fMRI-EEG
study in 1 patient revealed frontoparietal occipital abnormali-
ties.45 Studies in rat models have found widespread kindling and
hippocampal mossy fiber sprouting in hot-water–induced hyper-
thermic seizures at temperature ranges known to precipitate
HWE in humans.46 Thus, the evidence of increased connectivity
of the temporal lobe in patients in the frequent-seizure group in this
study supports the temporal lobe focus of HWE seen in the literature,
and the absence of it in the infrequent-seizure group could indicate
that this phenomenon is probably associated with disease progres-
sion. There have been few reports of increased DMN connectivity in
patients with epilepsy.6,14 Our findings of differential DMN connec-
tivity, which was increased in the infrequent-seizure group and de-
creased in the frequent-seizure group, directly supports the reports
by Bettus et al2 and Greicius et al47 of increasing DMN connectivity as
a compensatory mechanism. Hence, we presume that increasing
DMN connectivity is a protective response and might indicate good
seizure control in patients with epilepsy.
In this study, an attempt was made to overcome the widely
accepted limitation of antiepileptic drugs on network connectiv-
ity, and it needs to be noted that the potential effect of interictal
discharges on the network was not assessed because we did not
record simultaneous EEG with fMRI. However, because only 2
patients in the infrequent-seizure group had 1–2 focal spike-and-
wave discharges in routine EEG, it might be of lesser significance
in our study. Per the design of the study, we performed seed-based
connectivity analysis in only certain regions of the brain. It is
possible that there are many more areas that have been excluded
because of the threshold and ranges applied. There was no at-
tempt to overcome the limitations of parcellation algorithms,
thresholding effects, or confounders caused by physiologic mo-
tion correction on resting-state fMRI. It is also possible that plac-
ing these patients into multiple lower- or higher-frequency
groups rather than into 2 dichotomized groups might have re-
vealed varying frequency-specific connectivity patterns. Addi-
tional studies should address these factors to detect early and po-
tentially reversible connectivity abnormalities.
CONCLUSIONSThis network analysis of 36 patients with hot-water epilepsy re-
vealed that repeated seizures affect brain connectivity and that
patients with frequent seizures have widespread connectivity
changes, involvement of the DMN, and recruitment of several
seizure-prone areas in the medial temporal lobes bilaterally.
Whether in the future one could predict the course of chronic
epilepsy on the basis of these findings requires further studies on
groups of patients with more common epilepsy types.
ACKNOWLEDGMENTSWe acknowledge the support of the Department of Science and
Technology, Government of India, for providing the 3T MR im-
aging scanner exclusively for research in the field of neurosci-
ences. We acknowledge that the data analysis was greatly bene-
FIG 2. Whole-brain cluster-correlation maps of seed-to-voxel–based resting-state functional connectivity for the PCC seed region (FDR-correctedP � .001). Shown is DMN connectivity using PCC seed at 3 different axial levels: at the level of ventricles in the top row, midbrain in the middle row, andthe cerebellum in the bottom row for healthy controls (A), the infrequent-seizure group (B), the frequent-seizure group (C), the infrequent-seizuregroup versus healthy controls (D), the frequent-seizure group versus healthy controls (E), and the infrequent-seizure group versus the frequent-seizuregroup (F). The colors represent the significance of connectivity; red indicates an increase in connectivity, and blue indicates a decrease in connectivity.
1896 Bharath Oct 2015 www.ajnr.org
fited by our interactions with Bharat Biswal and his team at the
New Jersey Institute of Technology. We thank all the patients who
participated in this study without expecting anything in return.
We are grateful to the staff, especially the radiographers (at the
Neuroimaging and Interventional Radiology, National Institute
of Mental Health and Neuro Sciences, India) for their odd-hour
support during data collection.
REFERENCES1. Morgan VL, Rogers BP, Sonmezturk HH, et al. Cross hippocampal
influence in mesial temporal lobe epilepsy measured with hightemporal resolution functional magnetic resonance imaging. Epi-lepsia 2011;52:1741– 49 CrossRef Medline
2. Bettus G, Guedj E, Joyeux F, et al. Decreased basal fMRI functionalconnectivity in epileptogenic networks and contralateral compen-satory mechanisms. Hum Brain Mapp 2009;30:1580 –91 CrossRefMedline
3. Bettus G, Bartolomei F, Confort-Gouny S, et al. Role of resting statefunctional connectivity MRI in presurgical investigation of mesialtemporal lobe epilepsy. J Neurol Neurosurg Psychiatry 2010;81:1147–54 CrossRef Medline
4. Pereira FR, Alessio A, Sercheli MS, et al. Asymmetrical hippocampalconnectivity in mesial temporal lobe epilepsy: evidence from rest-ing state fMRI. BMC Neurosci 2010;11:66 CrossRef Medline
5. Pittau F, Grova C, Moeller F, et al. Patterns of altered functionalconnectivity in mesial temporal lobe epilepsy. Epilepsia 2012;53:1013–23 CrossRef Medline
6. Zhang Z, Lu G, Zhong Y, et al. Altered spontaneous neuronal activ-ity of the default-mode network in mesial temporal lobe epilepsy.Brain Res 2010;1323:152– 60 CrossRef Medline
7. Jehi LE. Functional connectivity in mesial temporal lobeepilepsy: a dynamic concept. Epilepsy Curr 2012;12:238 – 40CrossRef Medline
8. Liao W, Zhang Z, Pan Z, et al. Altered functional connectivity andsmall-world in mesial temporal lobe epilepsy. PLoS One 2010;5:e8525 CrossRef Medline
9. Morgan VL, Sonmezturk HH, Gore JC, et al. Lateralization of tem-poral lobe epilepsy using resting functional magnetic resonanceimaging connectivity of hippocampal networks. Epilepsia 2012;53:1628 –35 CrossRef Medline
10. Maccotta L, He BJ, Snyder AZ, et al. Impaired and facilitated func-tional networks in temporal lobe epilepsy. Neuroimage Clin 2013;2:862–72 CrossRef Medline
11. van Dellen E, Douw L, Baayen JC, et al. Long-term effects of tempo-ral lobe epilepsy on local neural networks: a graph theoretical anal-ysis of corticography recordings. PLoS One 2009;4:e8081 CrossRefMedline
12. Zhang Z, Lu G, Zhong Y, et al. fMRI study of mesial temporal lobeepilepsy using amplitude of low-frequency fluctuation analysis.Hum Brain Mapp 2010;31:1851– 61 CrossRef Medline
13. Vlooswijk MC, Jansen JF, Majoie HJ, et al. Functional connectivityand language impairment in cryptogenic localization-related epi-lepsy. Neurology 2010;75:395– 402 CrossRef Medline
14. Wang Z, Lu G, Zhang Z, et al. Altered resting state networks inepileptic patients with generalized tonic-clonic seizures. Brain Res2011;1374:134 – 41 CrossRef Medline
15. Weaver KE, Chaovalitwongse WA, Novotny EJ, et al. Local func-tional connectivity as a pre-surgical tool for seizure focus identifi-cation in non-lesion, focal epilepsy. Front Neurol 2013;4:43 CrossRefMedline
16. Fahoum F, Lopes R, Pittau F, et al. Widespread epileptic networks infocal epilepsies: EEG-fMRI study. Epilepsia 2012;53:1618 –27CrossRef Medline
17. Laufs H, Lengler U, Hamandi K, et al. Linking generalized spike-and-wave discharges and resting state brain activity by using EEG/
fMRI in a patient with absence seizures. Epilepsia 2006;47:444 – 48CrossRef Medline
18. Moeller F, LeVan P, Muhle H, et al. Absence seizures: individualpatterns revealed by EEG-fMRI. Epilepsia 2010;51:2000 –10 CrossRefMedline
19. Walker MC, White HS, Sander JW. Disease modification in partialepilepsy. Brain 2002;125:1937–50 CrossRef Medline
20. Morimoto K, Fahnestock M, Racine RJ. Kindling and status epilep-ticus models of epilepsy: rewiring the brain. Prog Neurobiol 2004;73:1– 60 CrossRef Medline
21. Cavazos JE, Golarai G, Sutula TP. Mossy fiber synaptic reorganiza-tion induced by kindling: time course of development, progression,and permanence. J Neurosci 1991;11:2795– 803 Medline
22. Sutula T, Koch J, Golarai G, et al. NMDA receptor dependence ofkindling and mossy fiber sprouting: evidence that the NMDA re-ceptor regulates patterning of hippocampal circuits in the adultbrain. J Neurosci 1996;16:7398 – 406 Medline
23. Hauser WA, Lee JR. Do seizures beget seizures? Prog Brain Res 2002;135:215–19 CrossRef Medline
24. Widjaja E, Zamyadi M, Raybaud C, et al. Impaired default modenetwork on resting-state fMRI in children with medically refrac-tory epilepsy. AJNR Am J Neuroradiol 2013;34:552–57 CrossRefMedline
25. Berg AT, Berkovic SF, Brodie MJ, et al. Revised terminology andconcepts for organization of seizures and epilepsies: report of theILAE Commission on Classification and Terminology, 2005–2009.Epilepsia 2010;51:676 – 85 CrossRef Medline
26. Fisher RS, Acevedo C, Arzimanoglou A, et al. ILAE official report: apractical clinical definition of epilepsy. Epilepsia 2014;55:475– 82CrossRef Medline
27. Tzourio-Mazoyer N, Landeau B, Papathanassiou D, et al. Automatedanatomical labeling of activations in SPM using a macroscopic an-atomical parcellation of the MNI MRI single-subject brain. Neuro-image 2002;15:273– 89 CrossRef Medline
28. Fornito A, Zalesky A, Bullmore ET. Network scaling effects in graphanalytic studies of human resting-state fMRI data. Front Syst Neu-rosci 2010;4:22 CrossRef Medline
29. Zalesky A, Fornito A, Harding IH, et al. Whole-brain anatomicalnetworks: does the choice of nodes matter? Neuroimage 2010;50:970 – 83 CrossRef Medline
30. Whitfield-Gabrieli S, Ford JM. Default mode network activity andconnectivity in psychopathology. Annu Rev Clin Psychol 2012;8:49 –76 CrossRef Medline
31. Behzadi Y, Restom K, Liau J, et al. A component based noise correc-tion method (CompCor) for BOLD and perfusion based fMRI. Neu-roimage 2007;37:90 –101 CrossRef Medline
32. Whitfield-Gabrieli S, Nieto-Castanon A. Conn: a functional connec-tivity toolbox for correlated and anticorrelated brain networks.Brain Connect 2012;2:125– 41 CrossRef Medline
33. Woodward ND, Rogers B, Heckers S. Functional resting-state net-works are differentially affected in schizophrenia. Schizophr Res2011;130:86 –93 CrossRef Medline
34. Satishchandra P. Hot-water epilepsy. Epilepsia 2003;44:29 –32CrossRef Medline
35. Luo C, Li Q, Lai Y, et al. Altered functional connectivity in defaultmode network in absence epilepsy: a resting-state fMRI study. HumBrain Mapp 2011;32:438 – 49 CrossRef Medline
36. Luo C, Li Q, Xia Y, et al. Resting state basal ganglia network inidiopathic generalized epilepsy. Hum Brain Mapp 2012;33:1279 –94CrossRef Medline
37. Bai X, Guo J, Killory B, et al. Resting functional connectivity be-tween the hemispheres in childhood absence epilepsy. Neurology2011;76:1960 – 67 CrossRef Medline
38. Killory BD, Bai X, Negishi M, et al. Impaired attention and networkconnectivity in childhood absence epilepsy. Neuroimage 2011;56:2209 –17 CrossRef Medline
39. Maneshi M, Moeller F, Fahoum F, et al. Resting-state connectivity ofthe sustained attention network correlates with disease duration in
AJNR Am J Neuroradiol 36:1890 –98 Oct 2015 www.ajnr.org 1897

idiopathic generalized epilepsy. PLoS One 2012;7:e50359 CrossRefMedline
40. Satishchandra P, Shivaramakrishana A, Kaliaperumal VG, et al. Hot-water epilepsy: a variant of reflex epilepsy in southern India. Epilep-sia 1988;29:52–56 CrossRef Medline
41. Satishchandra P, Ullal GR, Shankar SK. Hot water epilepsy. Adv Neu-rol 1998;75:283–93 Medline
42. Szymonowicz W, Meloff K. Hot water epilepsy. Can J Neurol Sci1978;5:247–51 Medline
43. Meghana A, Sinha S, Sathyaprabha TN, et al. Hot water epilepsyclinical profile and treatment—a prospective study. Epilepsy Res2012;102:160 – 66 CrossRef Medline
44. Patel M, Satishchandra P, Saini J, et al. Eating epilepsy: phenotype,
MRI, SPECT and video-EEG observations. Epilepsy Res 2013;107:115–20 CrossRef Medline
45. Sandhya M, Bharath RD, Panda R, et al. Understanding the patho-physiology of reflex epilepsy using simultaneous EEG-fMRI. Epilep-tic Disord 2014;16:19 –29 CrossRef Medline
46. Ullal GR, Satishchandra P, Kalladka D, et al. Kindling & mossyfibre sprouting in the rat hippocampus following hot water in-duced hyperthermic seizures. Indian J Med Res 2006;124:331– 42Medline
47. Greicius MD, Flores BH, Menon V, et al. Resting-state functionalconnectivity in major depression: abnormally increased contribu-tions from subgenual cingulate cortex and thalamus. Biol Psychiatry2007;62:429 –37 CrossRef Medline
1898 Bharath Oct 2015 www.ajnr.org
Related Documents