Seite 1 4. Juni 2009 The Challenge of Power System Operation with Large Amounts of Wind Power Dr. Kurt Rohrig IWES Institut für Windenergie und Energiesystemtechnik Bremerhaven/Kassel Germany [email protected] e.de Introduction Wind Power Plant Capabilities Grid Planning and Operation European Energy Markets Renewable Model Region Harz

Seite 1 4. Juni 2009 The Challenge of Power System Operation with Large Amounts of Wind Power Dr. Kurt Rohrig IWES Institut für Windenergie und Energiesystemtechnik.
Dec 11, 2015
Welcome message from author
This document is posted to help you gain knowledge. Please leave a comment to let me know what you think about it! Share it to your friends and learn new things together.
Transcript
Seite 1
4.
Jun
i 2
00
9
The Challenge of Power System Operationwith Large Amounts of Wind Power
Dr. Kurt Rohrig
IWES Institut für Windenergie und Energiesystemtechnik Bremerhaven/KasselGermany
IntroductionWind Power Plant CapabilitiesGrid Planning and OperationEuropean Energy MarketsRenewable Model Region Harz
Seite 2
4.
Jun
i 2
00
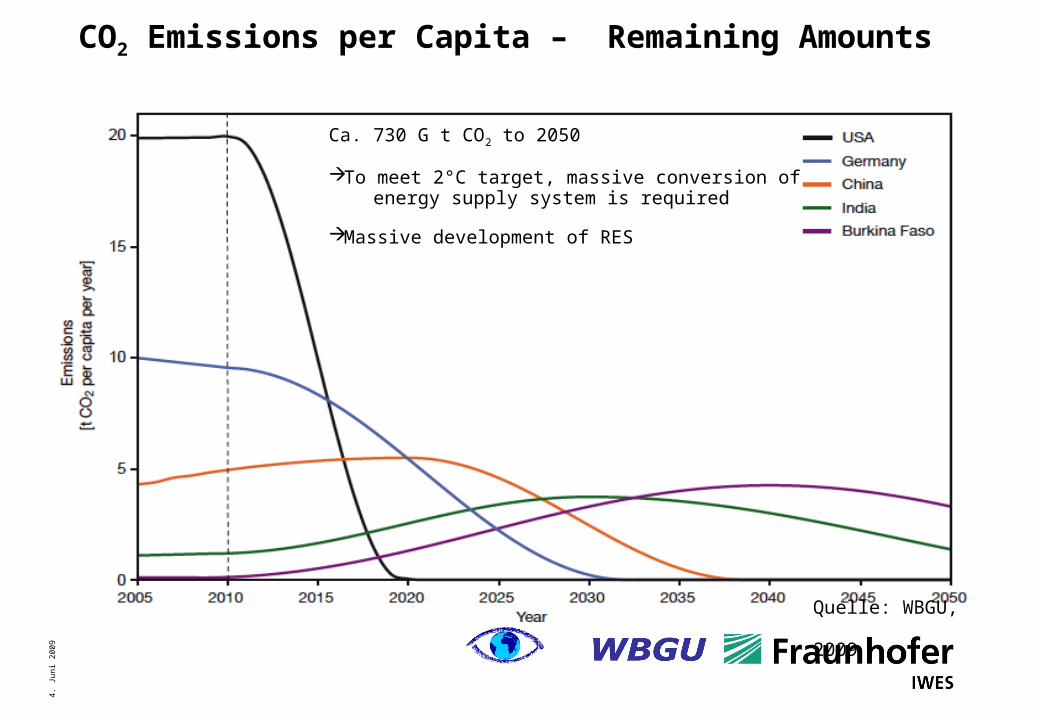
9CO2 Emissions per Capita – Remaining Amounts
Quelle: WBGU, 2009
Ca. 730 G t CO2 to 2050
To meet 2°C target, massive conversion of energy supply system is required
Massive development of RES

Seite 3
4.
Jun
i 2
00
9
Wind Power Plant Capabilities – Operate Wind Farms like Conventional Power Plants
Sustainable Grid Planning and improved Operation
European Energy Markets and Business Models
Main Challenges of Wind Energy Deployment
Seite 4
4.
Jun
i 2
00
9
44
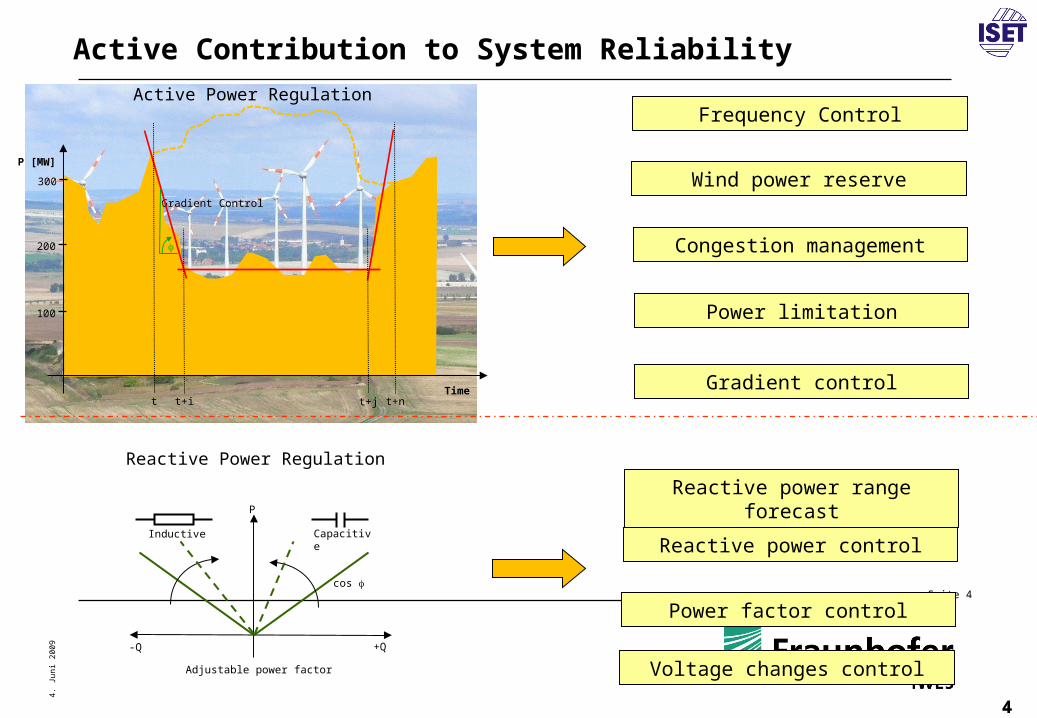
Active Power Regulation
Gradient Control
Timet
P [MW]
300
200
100
t+i t+j t+n
Reactive Power Regulation
P
+Q-Q
cos
CapacitiveInductive
Adjustable power factor
Reactive power range forecast
Reactive power control
Power factor control
Voltage changes control
Wind power reserve
Congestion management
Power limitation
Gradient control
Frequency Control
Active Contribution to System Reliability
Seite 5
4.
Jun
i 2
00
9
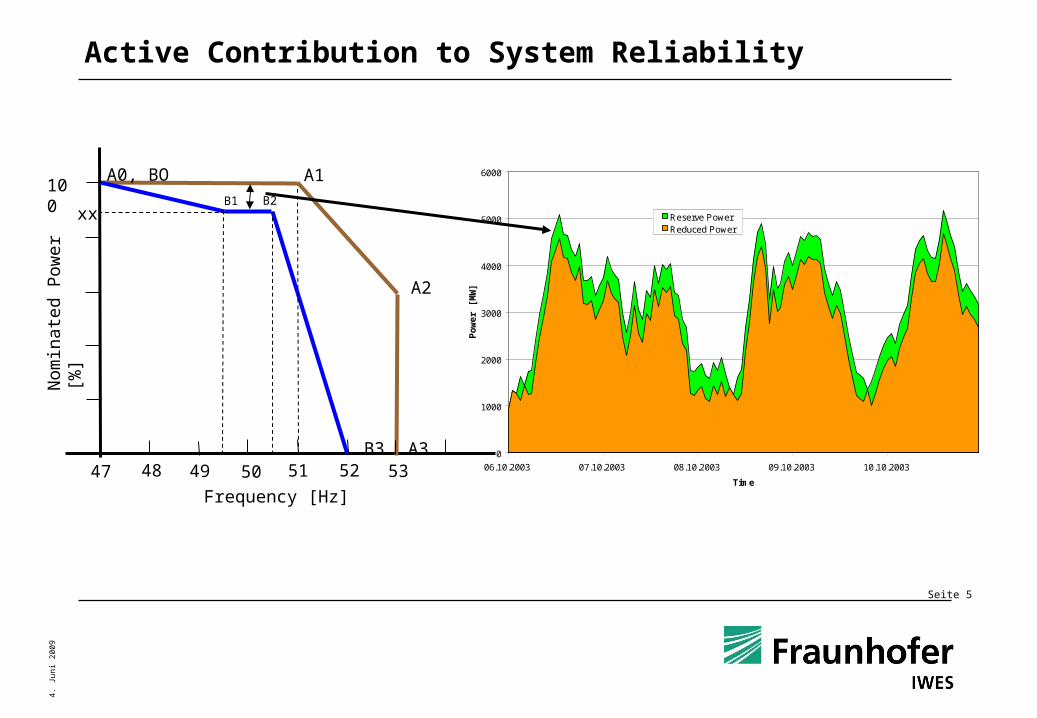
A1
A2
A0, BO
B1 B2100
5047 48 49 51 52 53B3 A3
xx
Nom
inat
ed P
ower
[%]
Frequency [Hz]
Active Contribution to System Reliability
0
1000
2000
3000
4000
5000
6000
06.10.2003 07.10.2003 08.10.2003 09.10.2003 10.10.2003
TimeP
ow
er [
MW
]
Reserve PowerReduced Power
Seite 6
4.
Jun
i 2
00
9
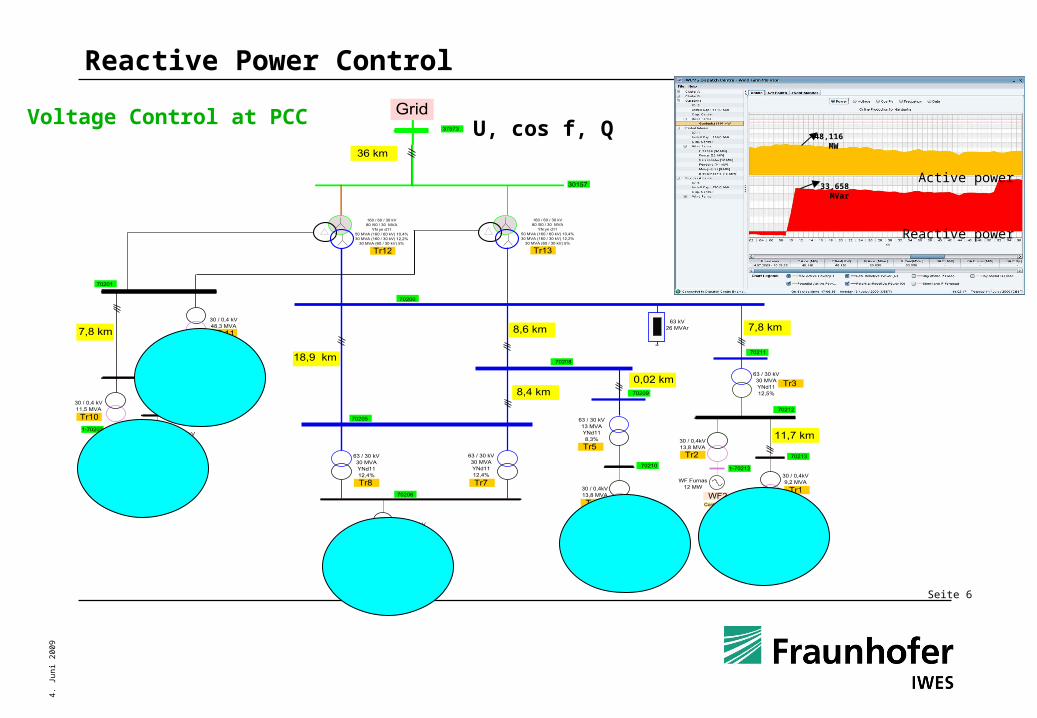
Reactive Power Control
U, cos f, QVoltage Control at PCC
Active power
Reactive power
48,116 MW
33,658 MVar
Seite 7
4.
Jun
i 2
00
9
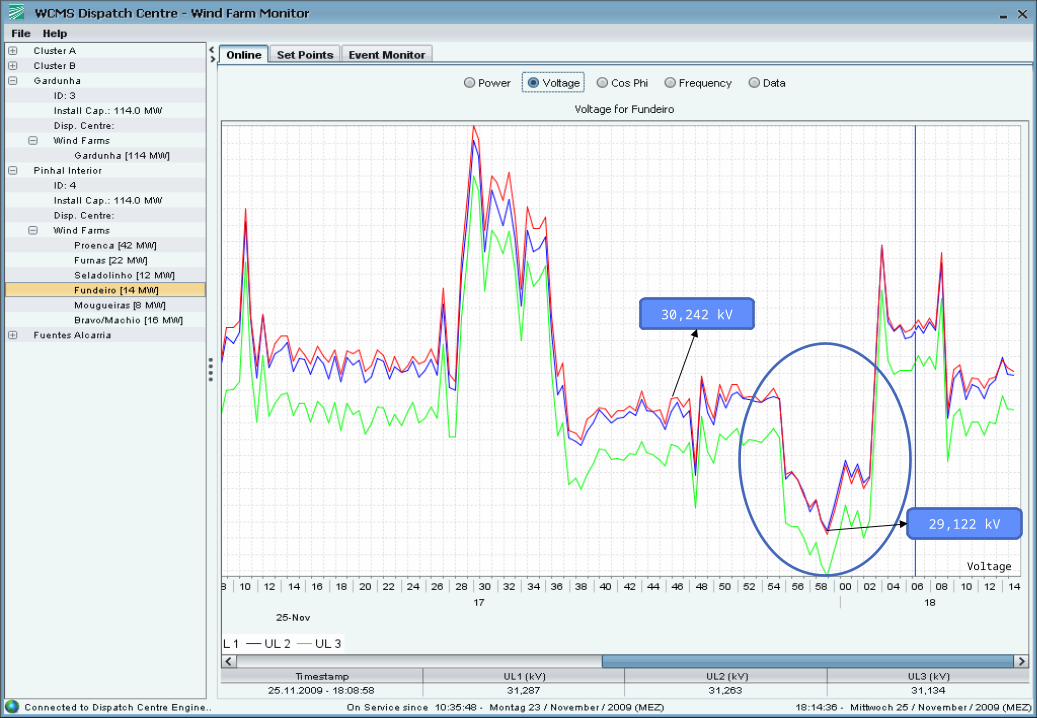
Voltage Control
Voltage
30,242 kV
29,122 kV
Seite 8
4.
Jun
i 2
00
9
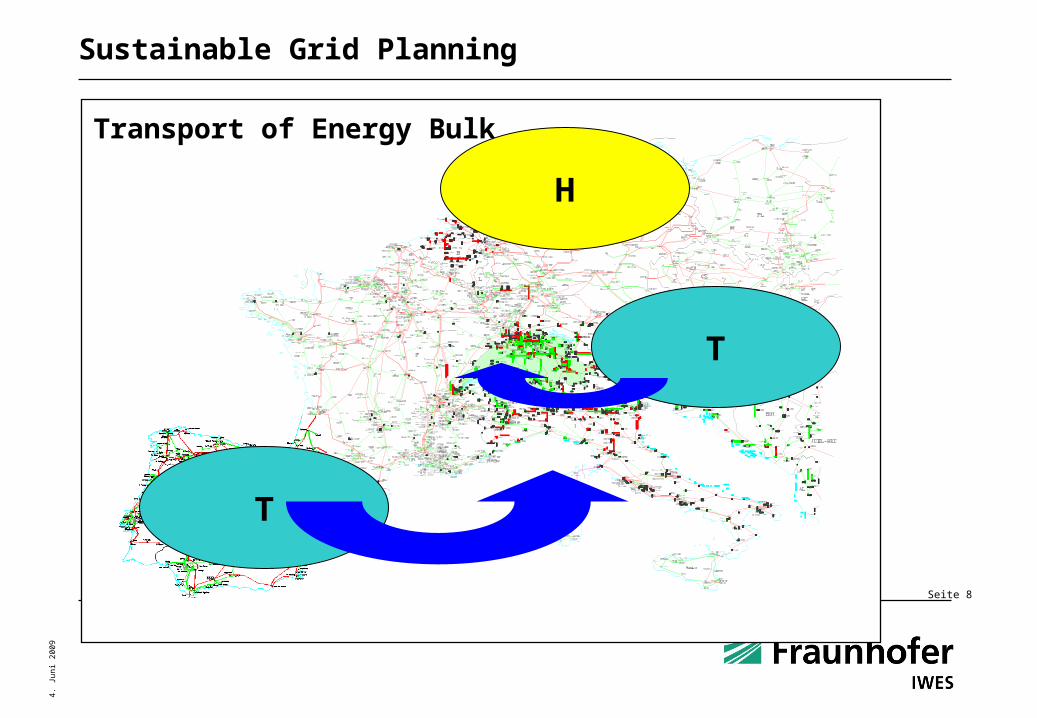
Reelle Netzteile 380/220kV
Transport of Energy Bulk
T
T
H
Sustainable Grid Planning
Seite 9
4.
Jun
i 2
00
9
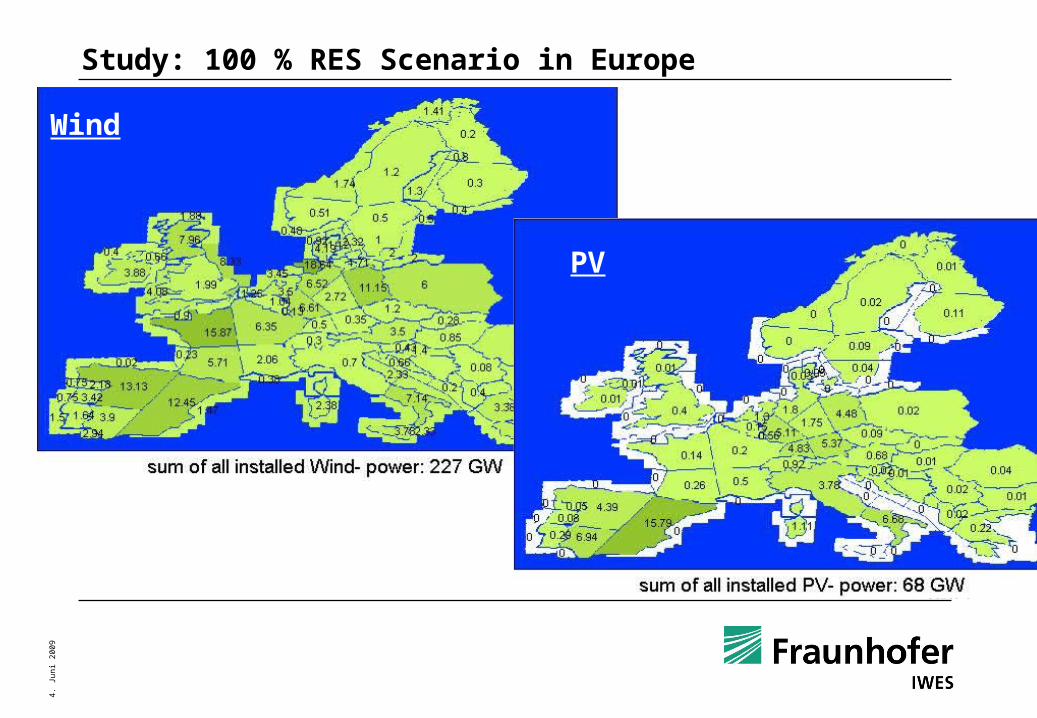
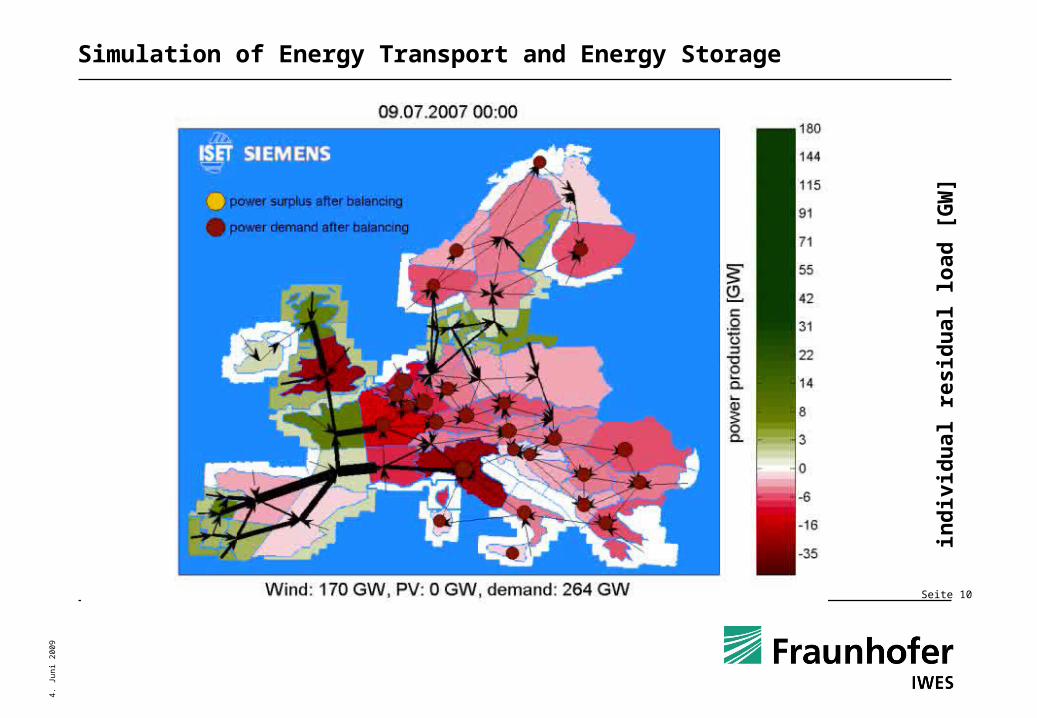
Study: 100 % RES Scenario in Europe
Wind
PV
Seite 10
4.
Jun
i 2
00
9Simulation of Energy Transport and Energy Storage
ind
ivid
ual
res
idu
al lo
ad [
GW
]
Seite 11
4.
Jun
i 2
00
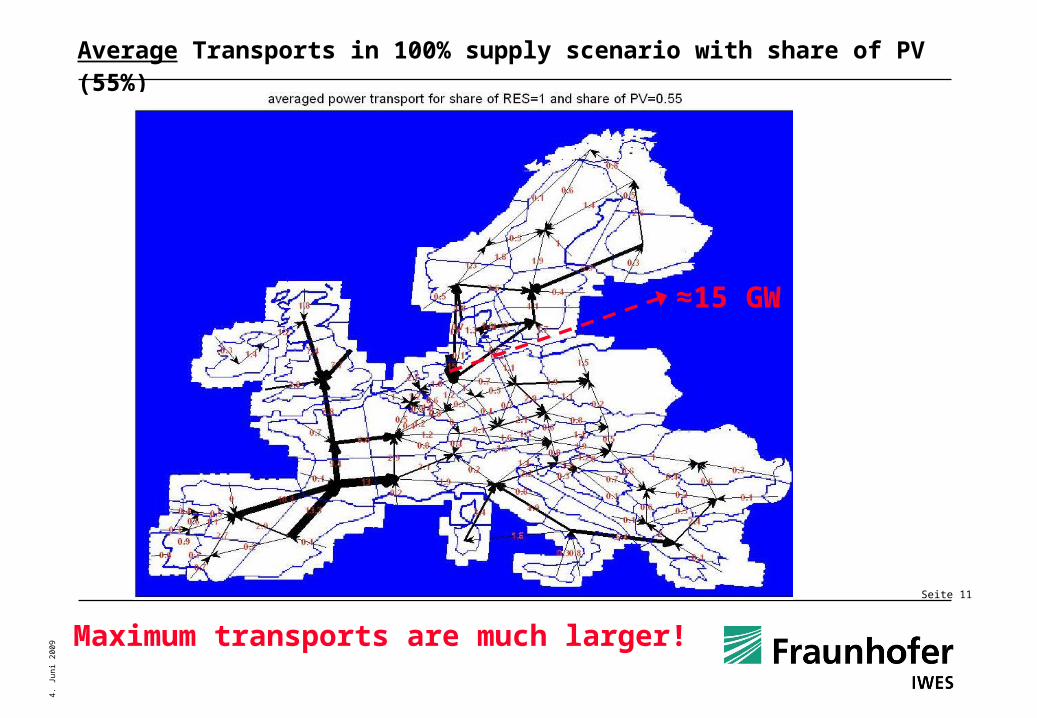
9Average Transports in 100% supply scenario with share of PV (55%)
≈15 GW
Maximum transports are much larger!
Seite 12
4.
Jun
i 2
00
9
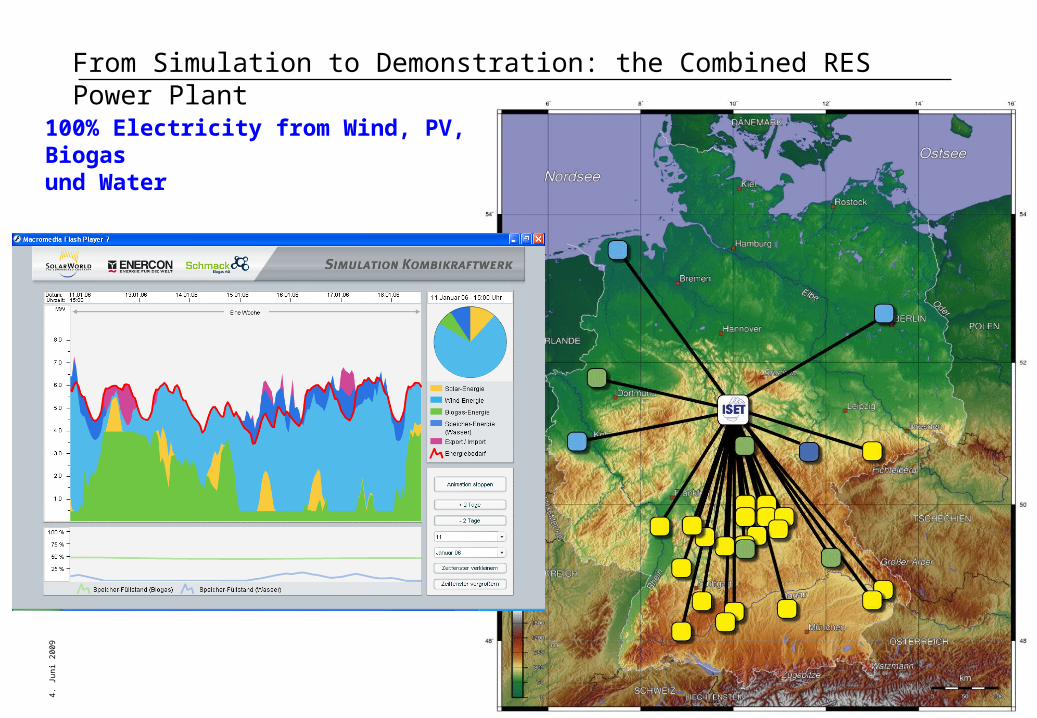
100% Electricity from Wind, PV, Biogasund Water
From Simulation to Demonstration: the Combined RES Power Plant
Seite 13
4.
Jun
i 2
00
9
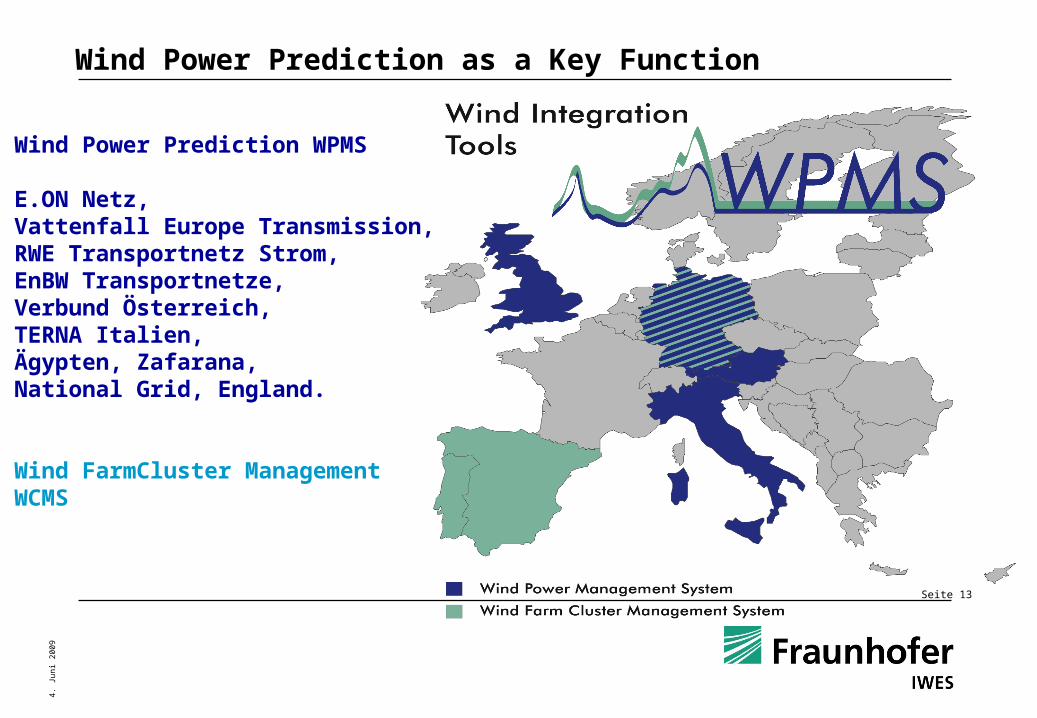
Wind Power Prediction WPMS
E.ON Netz, Vattenfall Europe Transmission,RWE Transportnetz Strom, EnBW Transportnetze,Verbund Österreich,TERNA Italien,Ägypten, Zafarana,National Grid, England.
Wind FarmCluster ManagementWCMS
Wind Power Prediction as a Key Function
Seite 14
4.
Jun
i 2
00
9
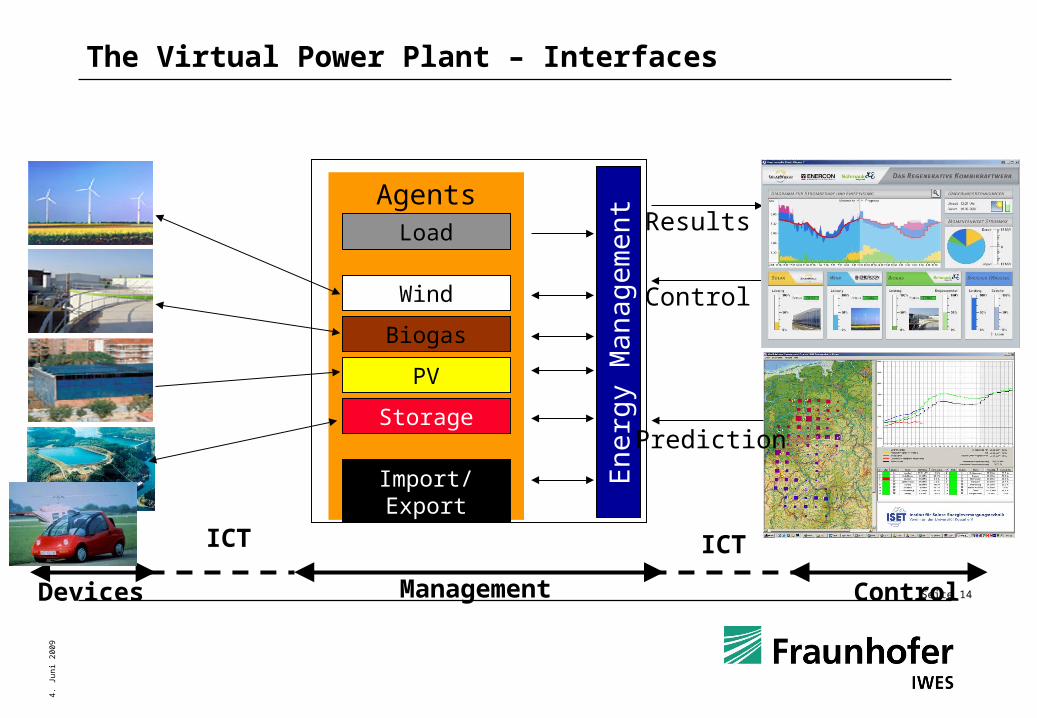
Devices
AgentsLoad
Wind
Biogas
Import/Export
PV
Storage
Results
Control
Management Control
ICT ICT
Ene
rgy
Man
agem
ent
The Virtual Power Plant – Interfaces
Prediction
Seite 15
4.
Jun
i 2
00
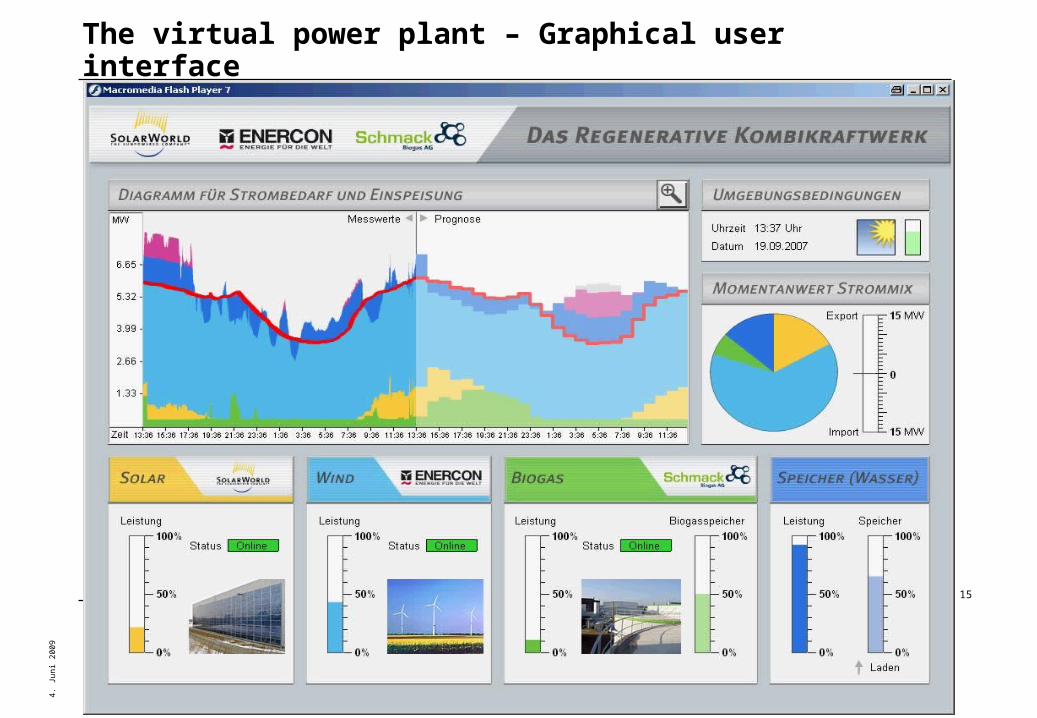
9The virtual power plant – Graphical user interface
Seite 16
4.
Jun
i 2
00
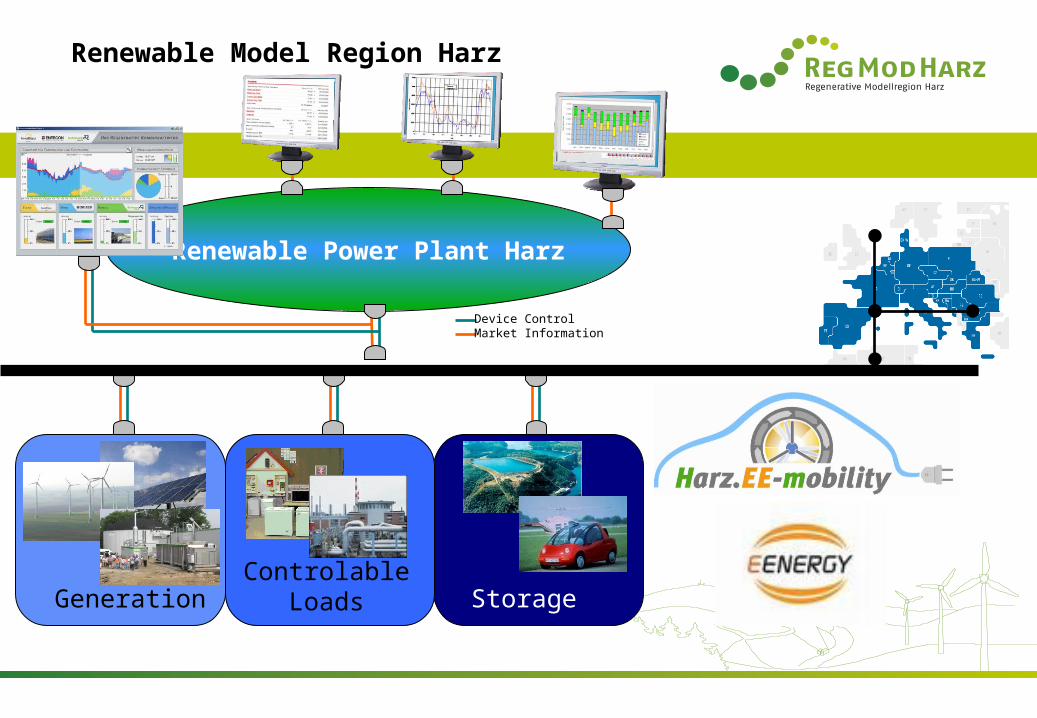
9Renewable Model Region Harz
Renewable Power Plant Harz
GenerationControlable
Loads Storage
Device ControlMarket Information
Seite 17
4.
Jun
i 2
00
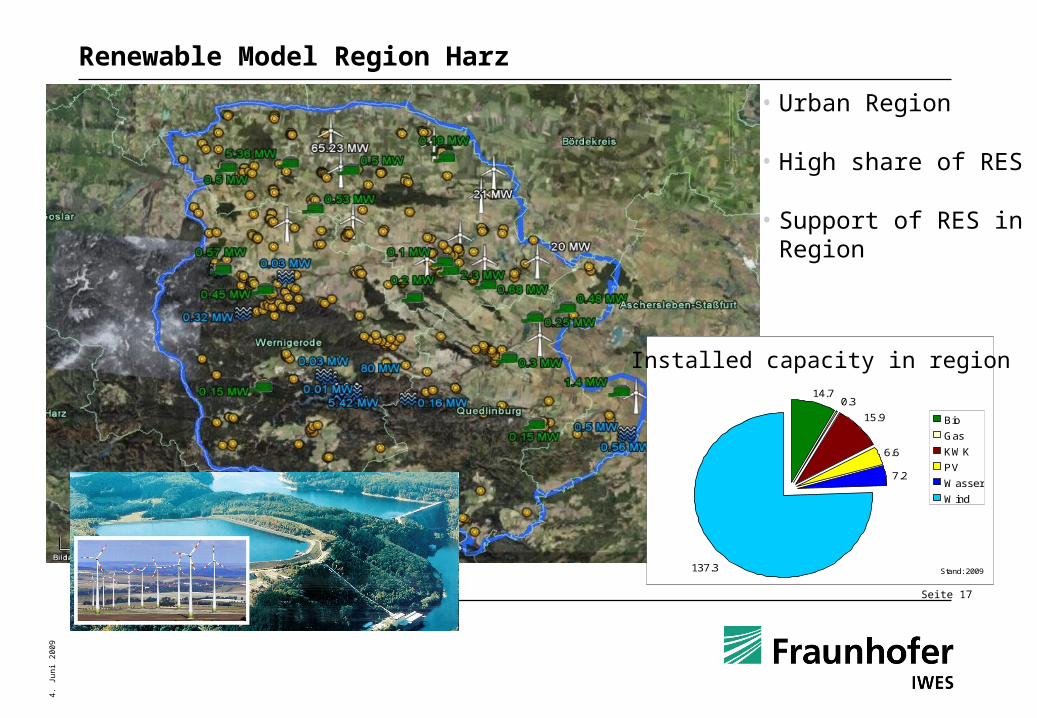
9Renewable Model Region Harz
• Urban Region
• High share of RES
• Support of RES in Region
Installierte Leistung [MW]EEG- und KWK-Anlagen im LK Harz
14.70.3
15.9
6.6
7.2
137.3
Bio
Gas
KWK
PV
Wasser
Wind
Stand: 2009
Installed capacity in region
Seite 18
4.
Jun
i 2
00
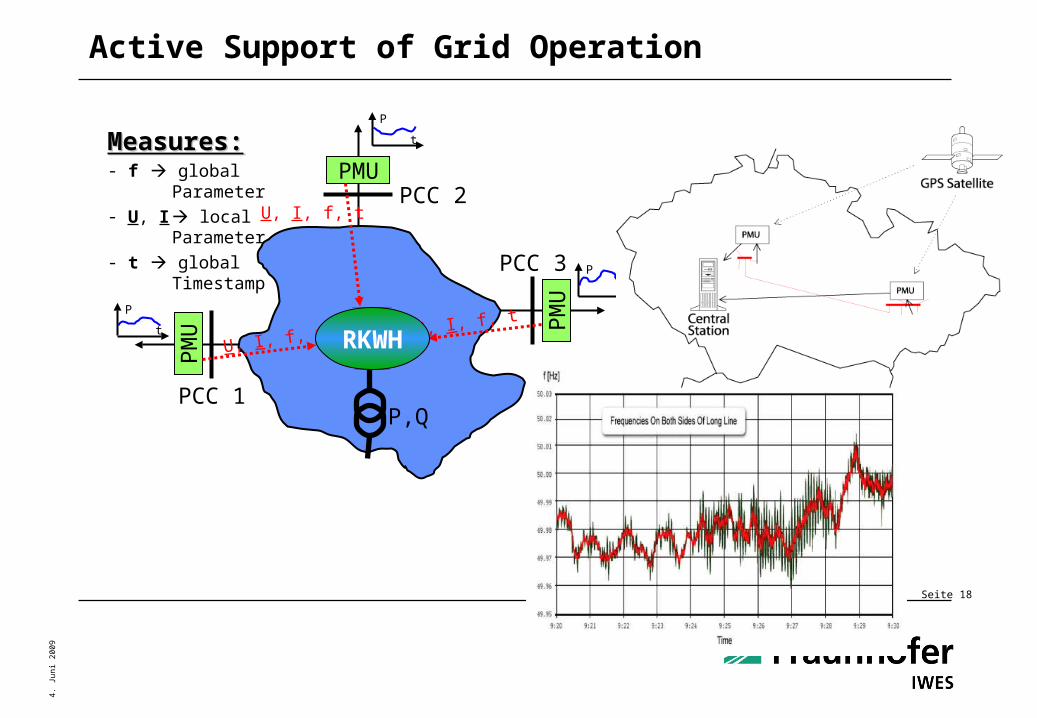
9Active Support of Grid Operation
PMUP
MU
PCC 1
PCC 2
PCC 3
PM
U
U, I, f, t
U, I, f, tU, I, f, t
t
P
t
P
t
P
Measures:Measures:- f global
Parameter- U, I local
Parameter- t global
Timestamp
P,Q
RKWH

Seite 19
4.
Jun
i 2
00
9
Thank You for Your Attention
Related Documents