Seismic retrofitting of an HV circuit breaker using base isolation with wire ropes. Part 2: Shaking-table test validation S. Alessandri a , R. Giannini a , F. Paolacci a,⇑ , M. Amoretti b , A. Freddo b a Roma Tre University, Rome, Italy b Terna Rete Italia, Sviluppo Rete Ingegneria, Rome, Italy article info Article history: Available online xxxx Keywords: HV equipment Circuit breaker Seismic isolation Wire rope isolators abstract This paper addresses the experimental characterisation of a base-isolation system for the seismic qual- ification, of High Voltage (HV) ceramic circuit breakers, in accordance with the European standard CEI EN 62271-207. The adopted solution is based on an innovative application of wire rope isolators. The results of a preliminary investigation of an HV circuit breaker, which was base-isolated with wire ropes, were previously illustrated in a companion paper in which the effectiveness of this isolation system was analytically demonstrated. To validate these results, a shake table test campaign has been performed that includes the performance analysis of two optimal isolation system configurations. The results, which are illustrated in this paper, show both the effectiveness of this isolation system and the reliability of the pro- posed FE model. Ó 2015 Elsevier Ltd. All rights reserved. 1. Introduction The experiences gained from recent earthquakes show that some substation components are extremely vulnerable. Direct and indirect losses that result from their damage are sometimes significant, which can dramatically affect the overall system relia- bility and the substation resilience. Thus, in the past, many research programs were initiated to increase the knowledge about the seismic response of HV equipment [3,8,11,20,22]. The dynamic behaviours of isolated and non-isolated HV equip- ment have been investigated in the past mainly through shaking- table and hybrid tests, although a limited number of experimental investigations have been performed. For example, Kircher et al. [13] investigated the dynamic properties of an ATB 7 circuit breaker mounted on GAPEC seismic isolators. Gilani et al. [9] anal- ysed a 230-kV disconnect by performing triaxial earthquake tests according to IEEE 693 [12] to estimate the response of 230 kV dis- connect switches mounted on elevated support frames of different flexibilities. Ersoy et al. [5] performed and analytical and experi- mental studies of transformers isolated with friction pendulum system. Murota et al. [18] proposed and designed two base isola- tion systems for the protection of electrical transformers: the first system was a combination of sliding bearings and low-damping rubber bearings, and the second was a segmented high-damping rubber bearing system (SHRB). Oikonomou et al. [19] investigated the effectiveness of friction pendulum isolators using a shaking test campaign on an ABB 196/230 kV bushing. More recently, Günay and Mosalam [10] and Mosalam and Günay [17] executed a parametric study using real-time hybrid simulation tests. They conducted these tests on a smart shaking table with electrical insu- lator posts. This evaluated the effect of the support structure damping and stiffness on the response of the disconnect switches with two different insulator materials: porcelain and polymer insulator posts. As a general result, the high vulnerability of these elements was proven, and the use of proper seismic protection sys- tems appears necessary. In this respect, a base isolation system for the seismic protec- tion of circuit breakers against earthquakes of large intensity was designed. The proposed system is based on wire ropes. The mechanical flexibility of these dampers and the friction among the wires provide the device with optimal mechanical isolation properties in all principal directions [21]. In fact, the base isolation of HV electric substation components based on wire rope isolators has been previously considered [23,1,4,15,14]. The experimental results confirmed that wire-ropes are suitable for the base isolation for electrical equipment. In a companion paper [7], the preliminary analysis and design of this base isolation system was reported, and the effectiveness in reducing the seismic response of a 380 kV circuit breaker was demonstrated using numerical analysis with simplified models, which were calibrated through a series of experimental tests on ceramic components and joints. Based on http://dx.doi.org/10.1016/j.engstruct.2015.03.031 0141-0296/Ó 2015 Elsevier Ltd. All rights reserved. ⇑ Corresponding author. E-mail addresses: [email protected] (S. Alessandri), renato.gianni- [email protected] (R. Giannini), [email protected] (F. Paolacci), marilena. [email protected] (M. Amoretti), [email protected] (A. Freddo). Engineering Structures xxx (2015) xxx–xxx Contents lists available at ScienceDirect Engineering Structures journal homepage: www.elsevier.com/locate/engstruct Please cite this article in press as: Alessandri S et al. Seismic retrofitting of an HV circuit breaker using base isolation with wire ropes. Part 2: Shaking-table test validation. Eng Struct (2015), http://dx.doi.org/10.1016/j.engstruct.2015.03.031

Welcome message from author
This document is posted to help you gain knowledge. Please leave a comment to let me know what you think about it! Share it to your friends and learn new things together.
Transcript
Engineering Structures xxx (2015) xxx–xxx
Contents lists available at ScienceDirect
Engineering Structures
journal homepage: www.elsevier .com/ locate /engstruct
Seismic retrofitting of an HV circuit breaker using base isolation withwire ropes. Part 2: Shaking-table test validation
http://dx.doi.org/10.1016/j.engstruct.2015.03.0310141-0296/� 2015 Elsevier Ltd. All rights reserved.
⇑ Corresponding author.E-mail addresses: [email protected] (S. Alessandri), renato.gianni-
[email protected] (R. Giannini), [email protected] (F. Paolacci), [email protected] (M. Amoretti), [email protected] (A. Freddo).
Please cite this article in press as: Alessandri S et al. Seismic retrofitting of an HV circuit breaker using base isolation with wire ropes. Part 2: Shakintest validation. Eng Struct (2015), http://dx.doi.org/10.1016/j.engstruct.2015.03.031
S. Alessandri a, R. Giannini a, F. Paolacci a,⇑, M. Amoretti b, A. Freddo b
a Roma Tre University, Rome, Italyb Terna Rete Italia, Sviluppo Rete Ingegneria, Rome, Italy
a r t i c l e i n f o
Article history:Available online xxxx
Keywords:HV equipmentCircuit breakerSeismic isolationWire rope isolators
a b s t r a c t
This paper addresses the experimental characterisation of a base-isolation system for the seismic qual-ification, of High Voltage (HV) ceramic circuit breakers, in accordance with the European standard CEIEN 62271-207. The adopted solution is based on an innovative application of wire rope isolators. Theresults of a preliminary investigation of an HV circuit breaker, which was base-isolated with wire ropes,were previously illustrated in a companion paper in which the effectiveness of this isolation system wasanalytically demonstrated. To validate these results, a shake table test campaign has been performed thatincludes the performance analysis of two optimal isolation system configurations. The results, which areillustrated in this paper, show both the effectiveness of this isolation system and the reliability of the pro-posed FE model.
� 2015 Elsevier Ltd. All rights reserved.
1. Introduction
The experiences gained from recent earthquakes show thatsome substation components are extremely vulnerable. Directand indirect losses that result from their damage are sometimessignificant, which can dramatically affect the overall system relia-bility and the substation resilience. Thus, in the past, manyresearch programs were initiated to increase the knowledge aboutthe seismic response of HV equipment [3,8,11,20,22].
The dynamic behaviours of isolated and non-isolated HV equip-ment have been investigated in the past mainly through shaking-table and hybrid tests, although a limited number of experimentalinvestigations have been performed. For example, Kircher et al.[13] investigated the dynamic properties of an ATB 7 circuitbreaker mounted on GAPEC seismic isolators. Gilani et al. [9] anal-ysed a 230-kV disconnect by performing triaxial earthquake testsaccording to IEEE 693 [12] to estimate the response of 230 kV dis-connect switches mounted on elevated support frames of differentflexibilities. Ersoy et al. [5] performed and analytical and experi-mental studies of transformers isolated with friction pendulumsystem. Murota et al. [18] proposed and designed two base isola-tion systems for the protection of electrical transformers: the firstsystem was a combination of sliding bearings and low-damping
rubber bearings, and the second was a segmented high-dampingrubber bearing system (SHRB). Oikonomou et al. [19] investigatedthe effectiveness of friction pendulum isolators using a shakingtest campaign on an ABB 196/230 kV bushing. More recently,Günay and Mosalam [10] and Mosalam and Günay [17] executeda parametric study using real-time hybrid simulation tests. Theyconducted these tests on a smart shaking table with electrical insu-lator posts. This evaluated the effect of the support structuredamping and stiffness on the response of the disconnect switcheswith two different insulator materials: porcelain and polymerinsulator posts. As a general result, the high vulnerability of theseelements was proven, and the use of proper seismic protection sys-tems appears necessary.
In this respect, a base isolation system for the seismic protec-tion of circuit breakers against earthquakes of large intensity wasdesigned. The proposed system is based on wire ropes. Themechanical flexibility of these dampers and the friction amongthe wires provide the device with optimal mechanical isolationproperties in all principal directions [21]. In fact, the base isolationof HV electric substation components based on wire rope isolatorshas been previously considered [23,1,4,15,14]. The experimentalresults confirmed that wire-ropes are suitable for the base isolationfor electrical equipment. In a companion paper [7], the preliminaryanalysis and design of this base isolation system was reported, andthe effectiveness in reducing the seismic response of a 380 kVcircuit breaker was demonstrated using numerical analysis withsimplified models, which were calibrated through a series ofexperimental tests on ceramic components and joints. Based on
g-table
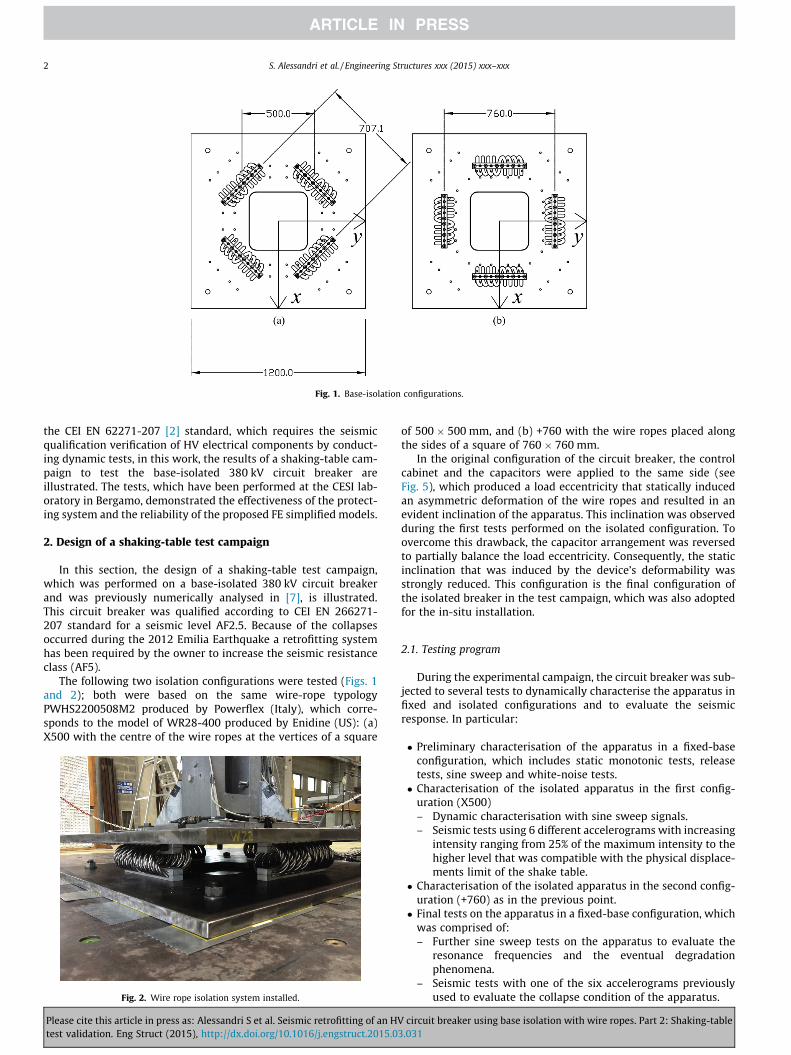
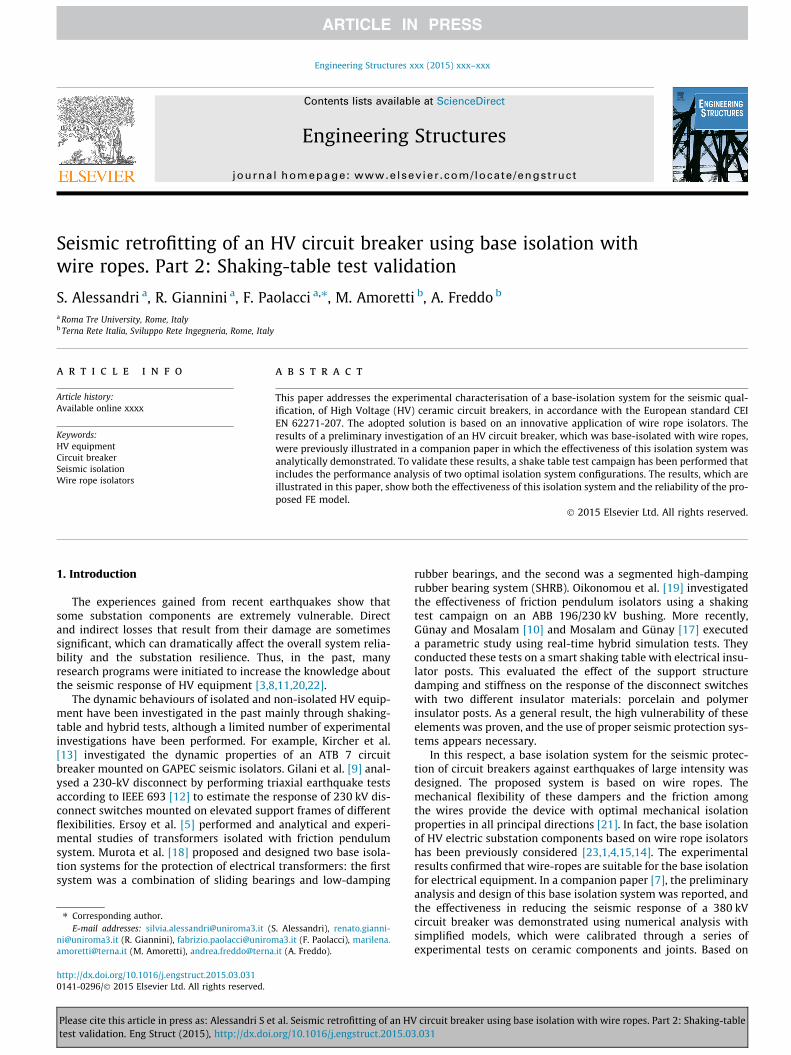
Fig. 1. Base-isolation configurations.
2 S. Alessandri et al. / Engineering Structures xxx (2015) xxx–xxx
the CEI EN 62271-207 [2] standard, which requires the seismicqualification verification of HV electrical components by conduct-ing dynamic tests, in this work, the results of a shaking-table cam-paign to test the base-isolated 380 kV circuit breaker areillustrated. The tests, which have been performed at the CESI lab-oratory in Bergamo, demonstrated the effectiveness of the protect-ing system and the reliability of the proposed FE simplified models.
2. Design of a shaking-table test campaign
In this section, the design of a shaking-table test campaign,which was performed on a base-isolated 380 kV circuit breakerand was previously numerically analysed in [7], is illustrated.This circuit breaker was qualified according to CEI EN 266271-207 standard for a seismic level AF2.5. Because of the collapsesoccurred during the 2012 Emilia Earthquake a retrofitting systemhas been required by the owner to increase the seismic resistanceclass (AF5).
The following two isolation configurations were tested (Figs. 1and 2); both were based on the same wire-rope typologyPWHS2200508M2 produced by Powerflex (Italy), which corre-sponds to the model of WR28-400 produced by Enidine (US): (a)X500 with the centre of the wire ropes at the vertices of a square
Fig. 2. Wire rope isolation system installed.
Please cite this article in press as: Alessandri S et al. Seismic retrofitting of an HVtest validation. Eng Struct (2015), http://dx.doi.org/10.1016/j.engstruct.2015.0
of 500 � 500 mm, and (b) +760 with the wire ropes placed alongthe sides of a square of 760 � 760 mm.
In the original configuration of the circuit breaker, the controlcabinet and the capacitors were applied to the same side (seeFig. 5), which produced a load eccentricity that statically inducedan asymmetric deformation of the wire ropes and resulted in anevident inclination of the apparatus. This inclination was observedduring the first tests performed on the isolated configuration. Toovercome this drawback, the capacitor arrangement was reversedto partially balance the load eccentricity. Consequently, the staticinclination that was induced by the device’s deformability wasstrongly reduced. This configuration is the final configuration ofthe isolated breaker in the test campaign, which was also adoptedfor the in-situ installation.
2.1. Testing program
During the experimental campaign, the circuit breaker was sub-jected to several tests to dynamically characterise the apparatus infixed and isolated configurations and to evaluate the seismicresponse. In particular:
� Preliminary characterisation of the apparatus in a fixed-baseconfiguration, which includes static monotonic tests, releasetests, sine sweep and white-noise tests.� Characterisation of the isolated apparatus in the first config-
uration (X500)– Dynamic characterisation with sine sweep signals.– Seismic tests using 6 different accelerograms with increasing
intensity ranging from 25% of the maximum intensity to thehigher level that was compatible with the physical displace-ments limit of the shake table.
� Characterisation of the isolated apparatus in the second config-uration (+760) as in the previous point.� Final tests on the apparatus in a fixed-base configuration, which
was comprised of:– Further sine sweep tests on the apparatus to evaluate the
resonance frequencies and the eventual degradationphenomena.
– Seismic tests with one of the six accelerograms previouslyused to evaluate the collapse condition of the apparatus.
circuit breaker using base isolation with wire ropes. Part 2: Shaking-table3.031
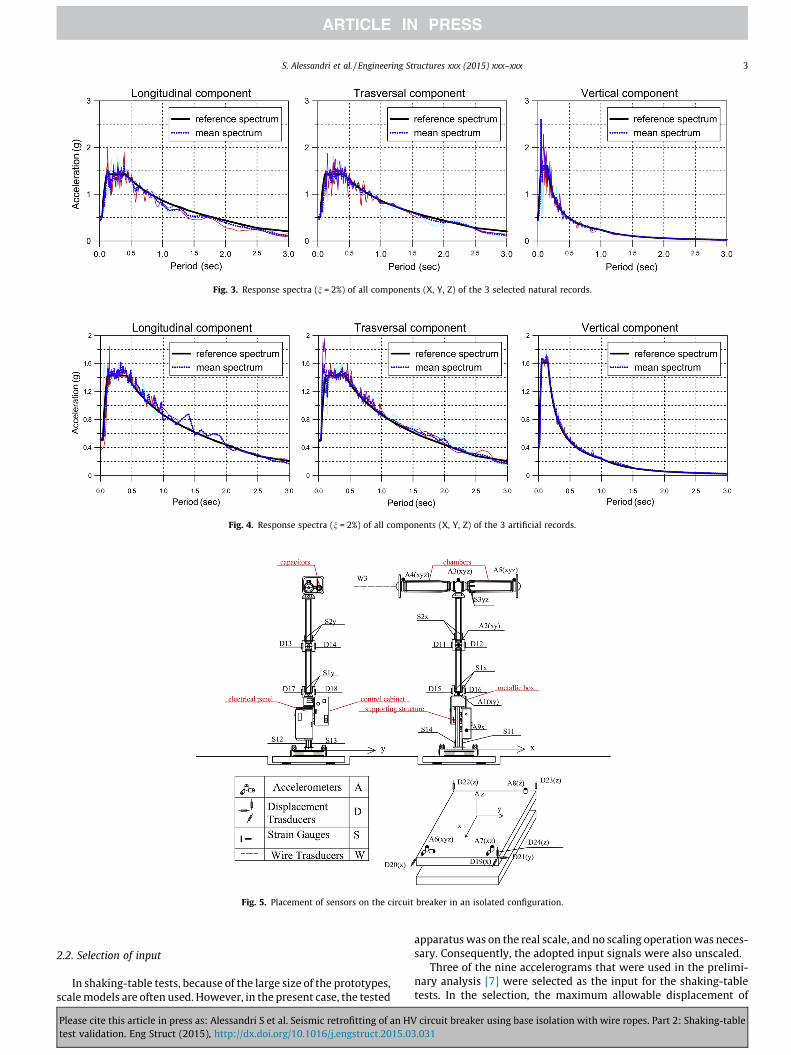
Fig. 3. Response spectra (n = 2%) of all components (X, Y, Z) of the 3 selected natural records.
Fig. 4. Response spectra (n = 2%) of all components (X, Y, Z) of the 3 artificial records.
Fig. 5. Placement of sensors on the circuit breaker in an isolated configuration.
S. Alessandri et al. / Engineering Structures xxx (2015) xxx–xxx 3
2.2. Selection of input
In shaking-table tests, because of the large size of the prototypes,scale models are often used. However, in the present case, the tested
Please cite this article in press as: Alessandri S et al. Seismic retrofitting of an HVtest validation. Eng Struct (2015), http://dx.doi.org/10.1016/j.engstruct.2015.03
apparatus was on the real scale, and no scaling operation was neces-sary. Consequently, the adopted input signals were also unscaled.
Three of the nine accelerograms that were used in the prelimi-nary analysis [7] were selected as the input for the shaking-tabletests. In the selection, the maximum allowable displacement of
circuit breaker using base isolation with wire ropes. Part 2: Shaking-table.031
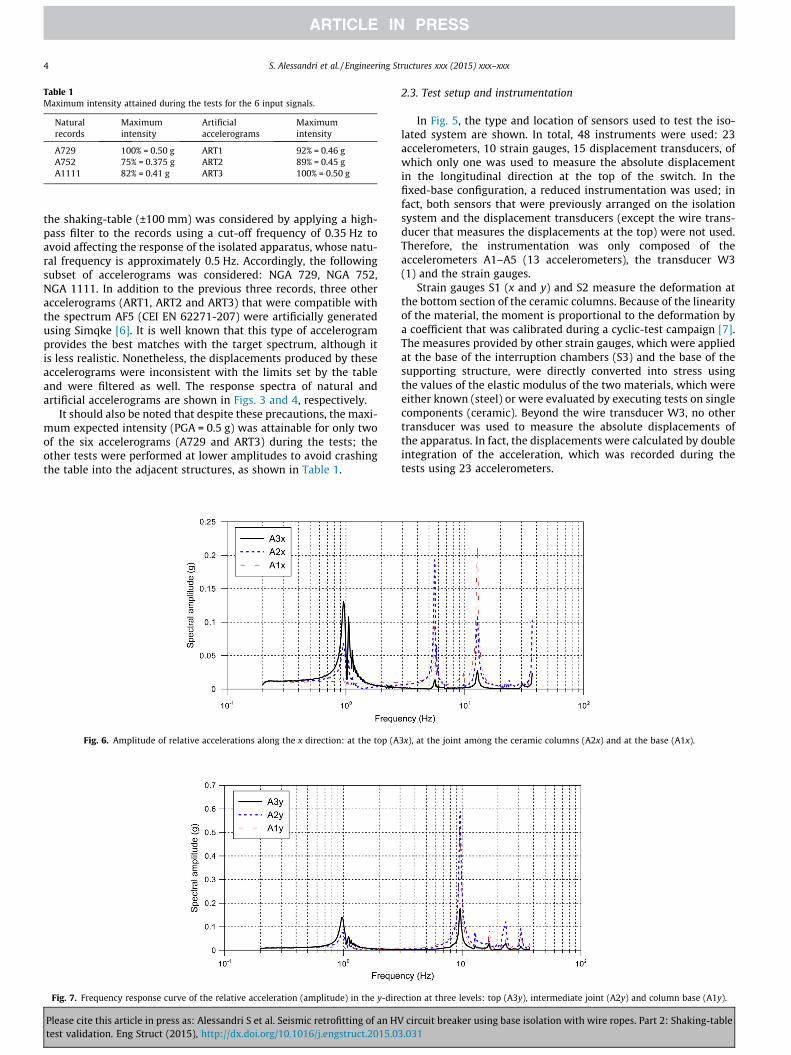
Table 1Maximum intensity attained during the tests for the 6 input signals.
Naturalrecords
Maximumintensity
Artificialaccelerograms
Maximumintensity
A729 100% = 0.50 g ART1 92% = 0.46 gA752 75% = 0.375 g ART2 89% = 0.45 gA1111 82% = 0.41 g ART3 100% = 0.50 g
4 S. Alessandri et al. / Engineering Structures xxx (2015) xxx–xxx
the shaking-table (±100 mm) was considered by applying a high-pass filter to the records using a cut-off frequency of 0.35 Hz toavoid affecting the response of the isolated apparatus, whose natu-ral frequency is approximately 0.5 Hz. Accordingly, the followingsubset of accelerograms was considered: NGA 729, NGA 752,NGA 1111. In addition to the previous three records, three otheraccelerograms (ART1, ART2 and ART3) that were compatible withthe spectrum AF5 (CEI EN 62271-207) were artificially generatedusing Simqke [6]. It is well known that this type of accelerogramprovides the best matches with the target spectrum, although itis less realistic. Nonetheless, the displacements produced by theseaccelerograms were inconsistent with the limits set by the tableand were filtered as well. The response spectra of natural andartificial accelerograms are shown in Figs. 3 and 4, respectively.
It should also be noted that despite these precautions, the maxi-mum expected intensity (PGA = 0.5 g) was attainable for only twoof the six accelerograms (A729 and ART3) during the tests; theother tests were performed at lower amplitudes to avoid crashingthe table into the adjacent structures, as shown in Table 1.
Fig. 6. Amplitude of relative accelerations along the x direction: at the top (A
Fig. 7. Frequency response curve of the relative acceleration (amplitude) in the y-dire
Please cite this article in press as: Alessandri S et al. Seismic retrofitting of an HVtest validation. Eng Struct (2015), http://dx.doi.org/10.1016/j.engstruct.2015.0
2.3. Test setup and instrumentation
In Fig. 5, the type and location of sensors used to test the iso-lated system are shown. In total, 48 instruments were used: 23accelerometers, 10 strain gauges, 15 displacement transducers, ofwhich only one was used to measure the absolute displacementin the longitudinal direction at the top of the switch. In thefixed-base configuration, a reduced instrumentation was used; infact, both sensors that were previously arranged on the isolationsystem and the displacement transducers (except the wire trans-ducer that measures the displacements at the top) were not used.Therefore, the instrumentation was only composed of theaccelerometers A1–A5 (13 accelerometers), the transducer W3(1) and the strain gauges.
Strain gauges S1 (x and y) and S2 measure the deformation atthe bottom section of the ceramic columns. Because of the linearityof the material, the moment is proportional to the deformation bya coefficient that was calibrated during a cyclic-test campaign [7].The measures provided by other strain gauges, which were appliedat the base of the interruption chambers (S3) and the base of thesupporting structure, were directly converted into stress usingthe values of the elastic modulus of the two materials, which wereeither known (steel) or were evaluated by executing tests on singlecomponents (ceramic). Beyond the wire transducer W3, no othertransducer was used to measure the absolute displacements ofthe apparatus. In fact, the displacements were calculated by doubleintegration of the acceleration, which was recorded during thetests using 23 accelerometers.
3x), at the joint among the ceramic columns (A2x) and at the base (A1x).
ction at three levels: top (A3y), intermediate joint (A2y) and column base (A1y).
circuit breaker using base isolation with wire ropes. Part 2: Shaking-table3.031
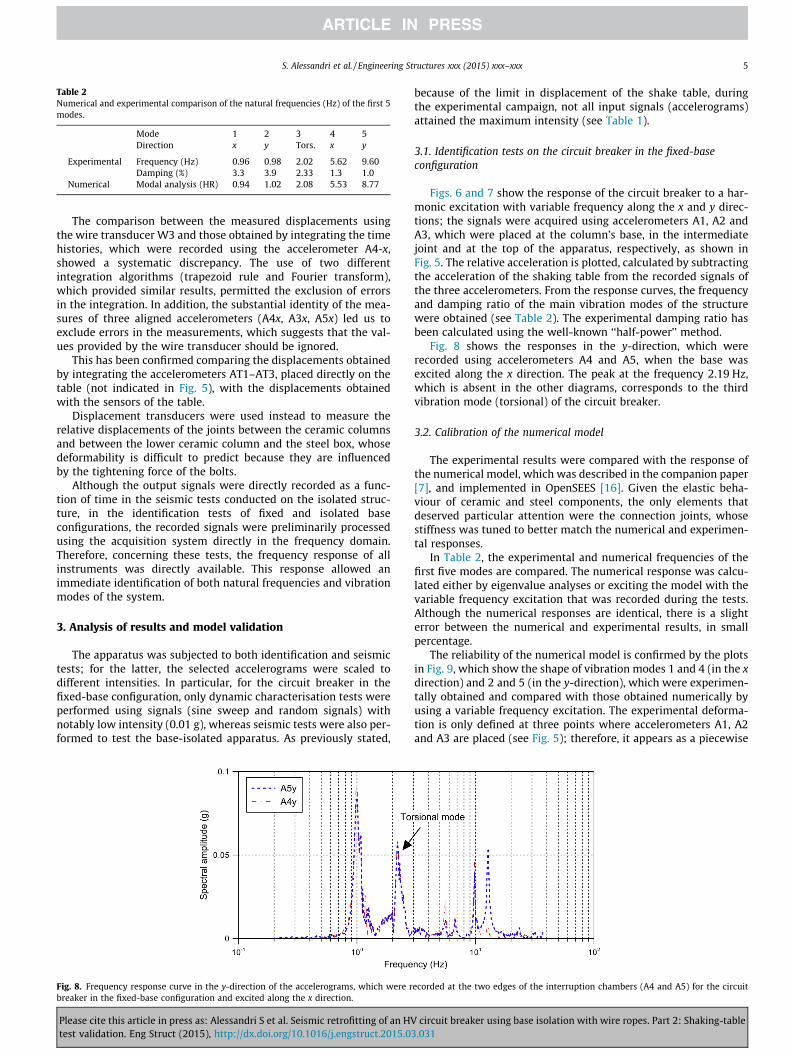
Table 2Numerical and experimental comparison of the natural frequencies (Hz) of the first 5modes.
Mode 1 2 3 4 5Direction x y Tors. x y
Experimental Frequency (Hz) 0.96 0.98 2.02 5.62 9.60Damping (%) 3.3 3.9 2.33 1.3 1.0
Numerical Modal analysis (HR) 0.94 1.02 2.08 5.53 8.77
S. Alessandri et al. / Engineering Structures xxx (2015) xxx–xxx 5
The comparison between the measured displacements usingthe wire transducer W3 and those obtained by integrating the timehistories, which were recorded using the accelerometer A4-x,showed a systematic discrepancy. The use of two differentintegration algorithms (trapezoid rule and Fourier transform),which provided similar results, permitted the exclusion of errorsin the integration. In addition, the substantial identity of the mea-sures of three aligned accelerometers (A4x, A3x, A5x) led us toexclude errors in the measurements, which suggests that the val-ues provided by the wire transducer should be ignored.
This has been confirmed comparing the displacements obtainedby integrating the accelerometers AT1–AT3, placed directly on thetable (not indicated in Fig. 5), with the displacements obtainedwith the sensors of the table.
Displacement transducers were used instead to measure therelative displacements of the joints between the ceramic columnsand between the lower ceramic column and the steel box, whosedeformability is difficult to predict because they are influencedby the tightening force of the bolts.
Although the output signals were directly recorded as a func-tion of time in the seismic tests conducted on the isolated struc-ture, in the identification tests of fixed and isolated baseconfigurations, the recorded signals were preliminarily processedusing the acquisition system directly in the frequency domain.Therefore, concerning these tests, the frequency response of allinstruments was directly available. This response allowed animmediate identification of both natural frequencies and vibrationmodes of the system.
3. Analysis of results and model validation
The apparatus was subjected to both identification and seismictests; for the latter, the selected accelerograms were scaled todifferent intensities. In particular, for the circuit breaker in thefixed-base configuration, only dynamic characterisation tests wereperformed using signals (sine sweep and random signals) withnotably low intensity (0.01 g), whereas seismic tests were also per-formed to test the base-isolated apparatus. As previously stated,
Fig. 8. Frequency response curve in the y-direction of the accelerograms, which were rbreaker in the fixed-base configuration and excited along the x direction.
Please cite this article in press as: Alessandri S et al. Seismic retrofitting of an HVtest validation. Eng Struct (2015), http://dx.doi.org/10.1016/j.engstruct.2015.03
because of the limit in displacement of the shake table, duringthe experimental campaign, not all input signals (accelerograms)attained the maximum intensity (see Table 1).
3.1. Identification tests on the circuit breaker in the fixed-baseconfiguration
Figs. 6 and 7 show the response of the circuit breaker to a har-monic excitation with variable frequency along the x and y direc-tions; the signals were acquired using accelerometers A1, A2 andA3, which were placed at the column’s base, in the intermediatejoint and at the top of the apparatus, respectively, as shown inFig. 5. The relative acceleration is plotted, calculated by subtractingthe acceleration of the shaking table from the recorded signals ofthe three accelerometers. From the response curves, the frequencyand damping ratio of the main vibration modes of the structurewere obtained (see Table 2). The experimental damping ratio hasbeen calculated using the well-known ‘‘half-power’’ method.
Fig. 8 shows the responses in the y-direction, which wererecorded using accelerometers A4 and A5, when the base wasexcited along the x direction. The peak at the frequency 2.19 Hz,which is absent in the other diagrams, corresponds to the thirdvibration mode (torsional) of the circuit breaker.
3.2. Calibration of the numerical model
The experimental results were compared with the response ofthe numerical model, which was described in the companion paper[7], and implemented in OpenSEES [16]. Given the elastic beha-viour of ceramic and steel components, the only elements thatdeserved particular attention were the connection joints, whosestiffness was tuned to better match the numerical and experimen-tal responses.
In Table 2, the experimental and numerical frequencies of thefirst five modes are compared. The numerical response was calcu-lated either by eigenvalue analyses or exciting the model with thevariable frequency excitation that was recorded during the tests.Although the numerical responses are identical, there is a slighterror between the numerical and experimental results, in smallpercentage.
The reliability of the numerical model is confirmed by the plotsin Fig. 9, which show the shape of vibration modes 1 and 4 (in the xdirection) and 2 and 5 (in the y-direction), which were experimen-tally obtained and compared with those obtained numerically byusing a variable frequency excitation. The experimental deforma-tion is only defined at three points where accelerometers A1, A2and A3 are placed (see Fig. 5); therefore, it appears as a piecewise
ecorded at the two edges of the interruption chambers (A4 and A5) for the circuit
circuit breaker using base isolation with wire ropes. Part 2: Shaking-table.031
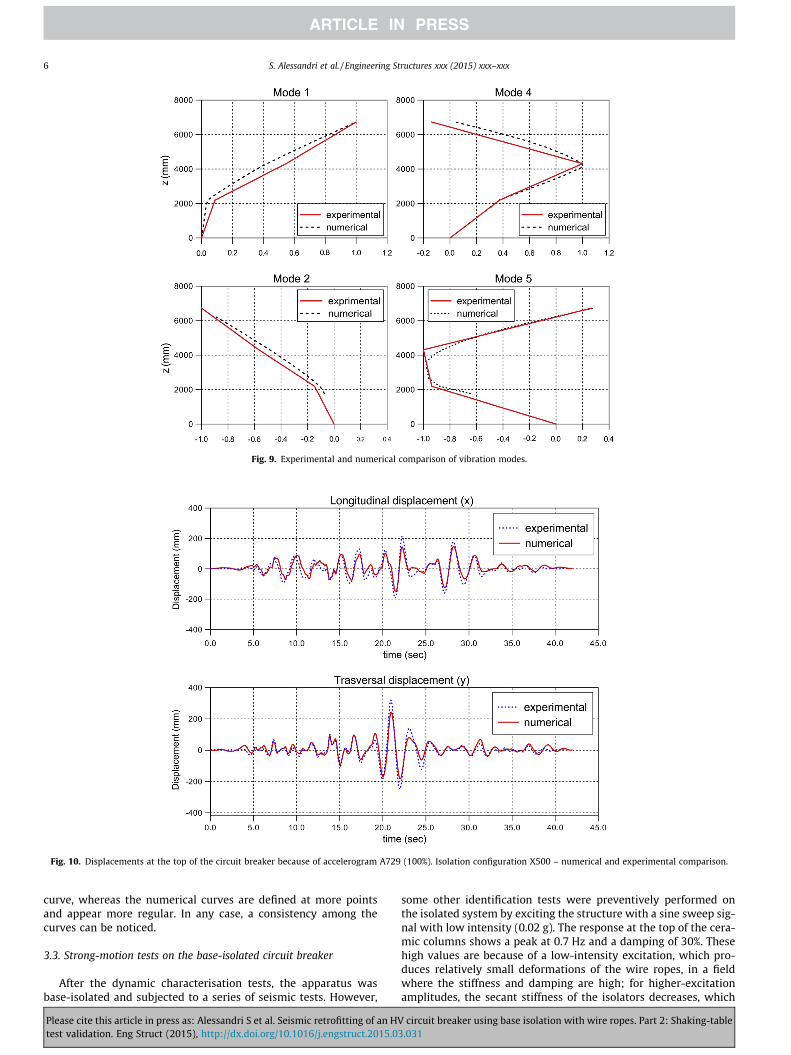
Fig. 9. Experimental and numerical comparison of vibration modes.
Fig. 10. Displacements at the top of the circuit breaker because of accelerogram A729 (100%). Isolation configuration X500 – numerical and experimental comparison.
6 S. Alessandri et al. / Engineering Structures xxx (2015) xxx–xxx
curve, whereas the numerical curves are defined at more pointsand appear more regular. In any case, a consistency among thecurves can be noticed.
3.3. Strong-motion tests on the base-isolated circuit breaker
After the dynamic characterisation tests, the apparatus wasbase-isolated and subjected to a series of seismic tests. However,
Please cite this article in press as: Alessandri S et al. Seismic retrofitting of an HVtest validation. Eng Struct (2015), http://dx.doi.org/10.1016/j.engstruct.2015.0
some other identification tests were preventively performed onthe isolated system by exciting the structure with a sine sweep sig-nal with low intensity (0.02 g). The response at the top of the cera-mic columns shows a peak at 0.7 Hz and a damping of 30%. Thesehigh values are because of a low-intensity excitation, which pro-duces relatively small deformations of the wire ropes, in a fieldwhere the stiffness and damping are high; for higher-excitationamplitudes, the secant stiffness of the isolators decreases, which
circuit breaker using base isolation with wire ropes. Part 2: Shaking-table3.031
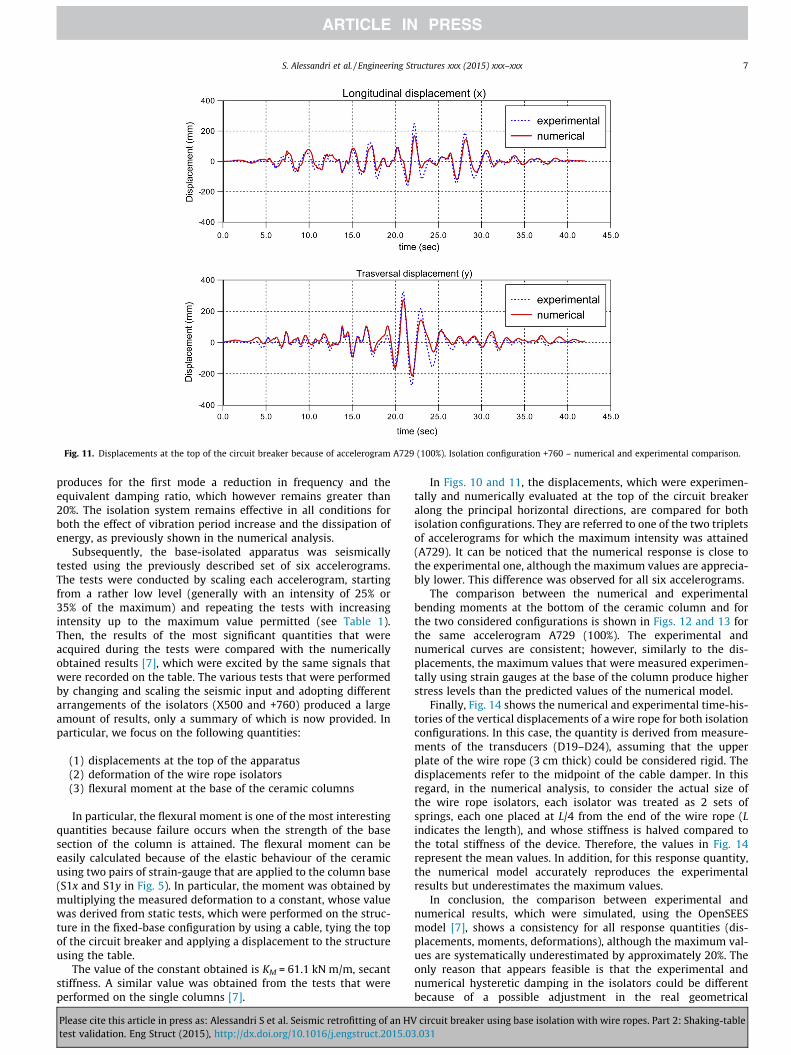
Fig. 11. Displacements at the top of the circuit breaker because of accelerogram A729 (100%). Isolation configuration +760 – numerical and experimental comparison.
S. Alessandri et al. / Engineering Structures xxx (2015) xxx–xxx 7
produces for the first mode a reduction in frequency and theequivalent damping ratio, which however remains greater than20%. The isolation system remains effective in all conditions forboth the effect of vibration period increase and the dissipation ofenergy, as previously shown in the numerical analysis.
Subsequently, the base-isolated apparatus was seismicallytested using the previously described set of six accelerograms.The tests were conducted by scaling each accelerogram, startingfrom a rather low level (generally with an intensity of 25% or35% of the maximum) and repeating the tests with increasingintensity up to the maximum value permitted (see Table 1).Then, the results of the most significant quantities that wereacquired during the tests were compared with the numericallyobtained results [7], which were excited by the same signals thatwere recorded on the table. The various tests that were performedby changing and scaling the seismic input and adopting differentarrangements of the isolators (X500 and +760) produced a largeamount of results, only a summary of which is now provided. Inparticular, we focus on the following quantities:
(1) displacements at the top of the apparatus(2) deformation of the wire rope isolators(3) flexural moment at the base of the ceramic columns
In particular, the flexural moment is one of the most interestingquantities because failure occurs when the strength of the basesection of the column is attained. The flexural moment can beeasily calculated because of the elastic behaviour of the ceramicusing two pairs of strain-gauge that are applied to the column base(S1x and S1y in Fig. 5). In particular, the moment was obtained bymultiplying the measured deformation to a constant, whose valuewas derived from static tests, which were performed on the struc-ture in the fixed-base configuration by using a cable, tying the topof the circuit breaker and applying a displacement to the structureusing the table.
The value of the constant obtained is KM = 61.1 kN m/m, secantstiffness. A similar value was obtained from the tests that wereperformed on the single columns [7].
Please cite this article in press as: Alessandri S et al. Seismic retrofitting of an HVtest validation. Eng Struct (2015), http://dx.doi.org/10.1016/j.engstruct.2015.03
In Figs. 10 and 11, the displacements, which were experimen-tally and numerically evaluated at the top of the circuit breakeralong the principal horizontal directions, are compared for bothisolation configurations. They are referred to one of the two tripletsof accelerograms for which the maximum intensity was attained(A729). It can be noticed that the numerical response is close tothe experimental one, although the maximum values are apprecia-bly lower. This difference was observed for all six accelerograms.
The comparison between the numerical and experimentalbending moments at the bottom of the ceramic column and forthe two considered configurations is shown in Figs. 12 and 13 forthe same accelerogram A729 (100%). The experimental andnumerical curves are consistent; however, similarly to the dis-placements, the maximum values that were measured experimen-tally using strain gauges at the base of the column produce higherstress levels than the predicted values of the numerical model.
Finally, Fig. 14 shows the numerical and experimental time-his-tories of the vertical displacements of a wire rope for both isolationconfigurations. In this case, the quantity is derived from measure-ments of the transducers (D19–D24), assuming that the upperplate of the wire rope (3 cm thick) could be considered rigid. Thedisplacements refer to the midpoint of the cable damper. In thisregard, in the numerical analysis, to consider the actual size ofthe wire rope isolators, each isolator was treated as 2 sets ofsprings, each one placed at L/4 from the end of the wire rope (Lindicates the length), and whose stiffness is halved compared tothe total stiffness of the device. Therefore, the values in Fig. 14represent the mean values. In addition, for this response quantity,the numerical model accurately reproduces the experimentalresults but underestimates the maximum values.
In conclusion, the comparison between experimental andnumerical results, which were simulated, using the OpenSEESmodel [7], shows a consistency for all response quantities (dis-placements, moments, deformations), although the maximum val-ues are systematically underestimated by approximately 20%. Theonly reason that appears feasible is that the experimental andnumerical hysteretic damping in the isolators could be differentbecause of a possible adjustment in the real geometrical
circuit breaker using base isolation with wire ropes. Part 2: Shaking-table.031
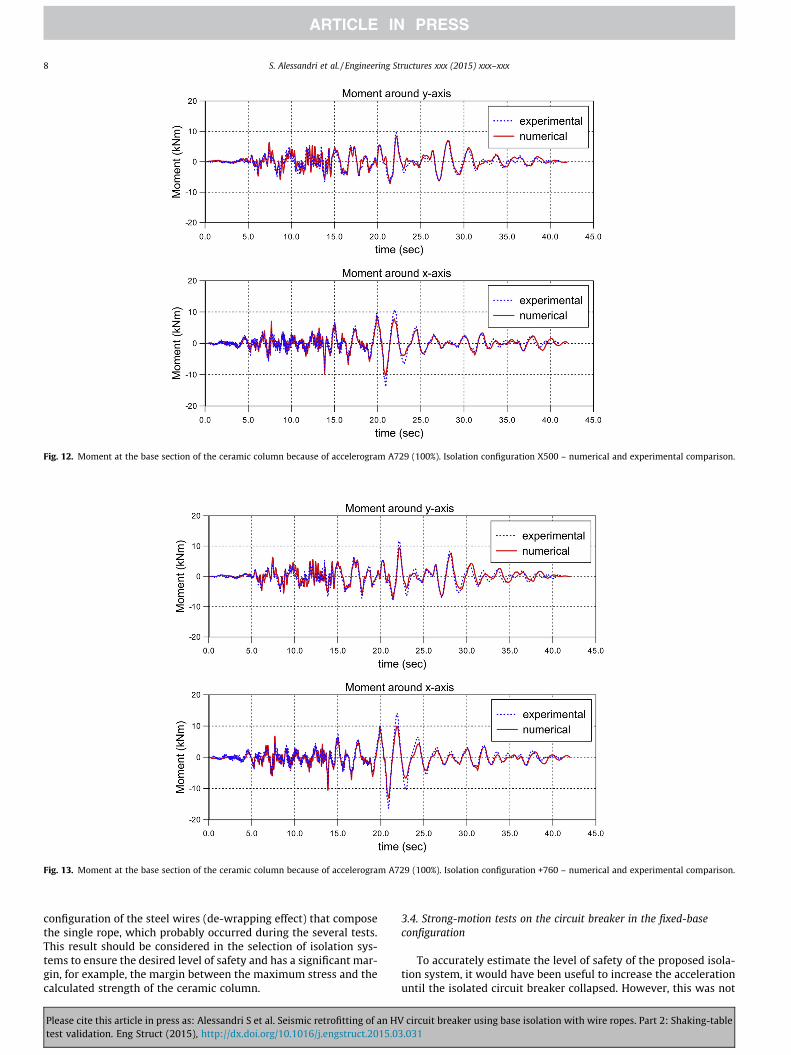
Fig. 12. Moment at the base section of the ceramic column because of accelerogram A729 (100%). Isolation configuration X500 – numerical and experimental comparison.
Fig. 13. Moment at the base section of the ceramic column because of accelerogram A729 (100%). Isolation configuration +760 – numerical and experimental comparison.
8 S. Alessandri et al. / Engineering Structures xxx (2015) xxx–xxx
configuration of the steel wires (de-wrapping effect) that composethe single rope, which probably occurred during the several tests.This result should be considered in the selection of isolation sys-tems to ensure the desired level of safety and has a significant mar-gin, for example, the margin between the maximum stress and thecalculated strength of the ceramic column.
Please cite this article in press as: Alessandri S et al. Seismic retrofitting of an HVtest validation. Eng Struct (2015), http://dx.doi.org/10.1016/j.engstruct.2015.0
3.4. Strong-motion tests on the circuit breaker in the fixed-baseconfiguration
To accurately estimate the level of safety of the proposed isola-tion system, it would have been useful to increase the accelerationuntil the isolated circuit breaker collapsed. However, this was not
circuit breaker using base isolation with wire ropes. Part 2: Shaking-table3.031
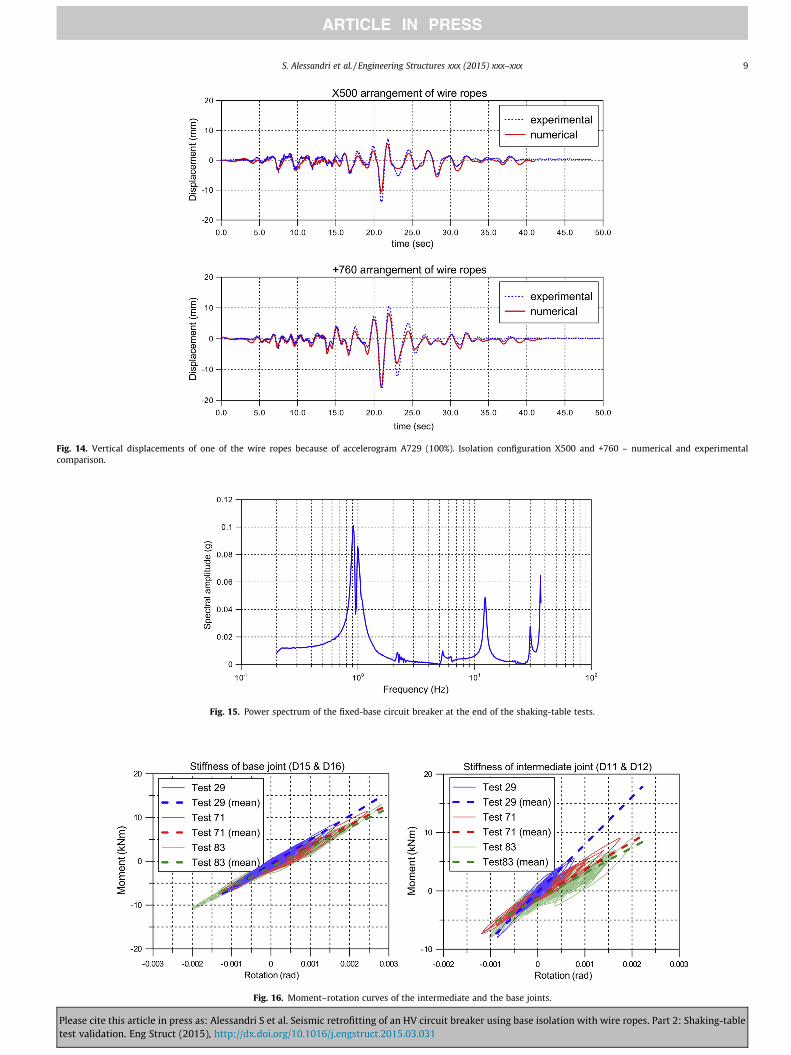
Fig. 14. Vertical displacements of one of the wire ropes because of accelerogram A729 (100%). Isolation configuration X500 and +760 – numerical and experimentalcomparison.
Fig. 15. Power spectrum of the fixed-base circuit breaker at the end of the shaking-table tests.
Fig. 16. Moment–rotation curves of the intermediate and the base joints.
S. Alessandri et al. / Engineering Structures xxx (2015) xxx–xxx 9
Please cite this article in press as: Alessandri S et al. Seismic retrofitting of an HV circuit breaker using base isolation with wire ropes. Part 2: Shaking-tabletest validation. Eng Struct (2015), http://dx.doi.org/10.1016/j.engstruct.2015.03.031
10 S. Alessandri et al. / Engineering Structures xxx (2015) xxx–xxx
possible because of the maximum capacity of the shaking table,particularly in terms of displacements. Therefore, the structure inthe fixed-based configuration was collapsed to validate the resultsof the static tests that were conducted at Roma Tre University andthe numerical analysis. The structure was solicited by the artifi-cially generated accelerogram ART3, which perfectly matched thetarget design spectrum.
Fig. 17. Stiffness reduction of the intermediate and base joints during the testsequence.
Fig. 18. Moment at the bottom section of the
Please cite this article in press as: Alessandri S et al. Seismic retrofitting of an HVtest validation. Eng Struct (2015), http://dx.doi.org/10.1016/j.engstruct.2015.0
Before the seismic testing, a dynamic characterisation of theapparatus was performed using a sine sweep signal, which excitedthe systems along the x direction. The spectrum, which is shown inFig. 15, shows that the resonance frequency of the first mode isnow slightly decreased: from 0.96 Hz to 0.91 Hz, which demon-strates that in some element, a loss of stiffness occurred, whichwas evidently produced by numerous shakings in the seismic tests.
Excluding that degradation may have affected neither the cera-mic elements nor the support steel structure, we paid attention tothe flange joints of the columns. As a measure of stiffness of thejoints, the difference among the relative displacements of the con-nected elements, which were recorded by transducers D11 andD12 for the intermediate joint and D15 and D16 for the base joint,was acquired. In Fig. 16, the moment–rotation relationship at dif-ferent stages of the experiment is shown. Test 29 corresponds tothe first series of tests for the X isolation configuration, beforethe change of position of the capacitors, with accelerogram A729(100%). Test 71 was instead performed with the same accelero-gram but in the final configuration of capacitors. Finally, test 83corresponds to the last series of seismic tests for the isolated struc-ture with wire rope in the cross configuration. The moments areobtained multiplying by KM the strains recorded by strain gaugesS2x and S1x for the intermediate and the base joints, respectively,
ceramic column during the collapse test.
circuit breaker using base isolation with wire ropes. Part 2: Shaking-table3.031
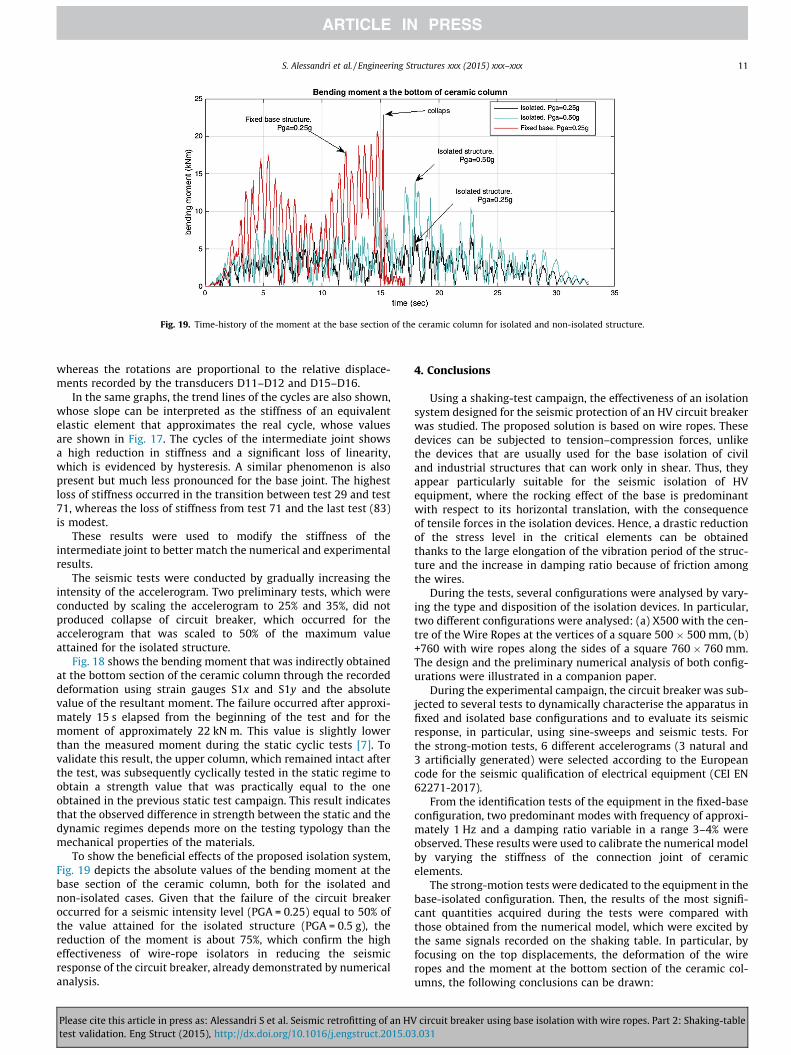
Fig. 19. Time-history of the moment at the base section of the ceramic column for isolated and non-isolated structure.
S. Alessandri et al. / Engineering Structures xxx (2015) xxx–xxx 11
whereas the rotations are proportional to the relative displace-ments recorded by the transducers D11–D12 and D15–D16.
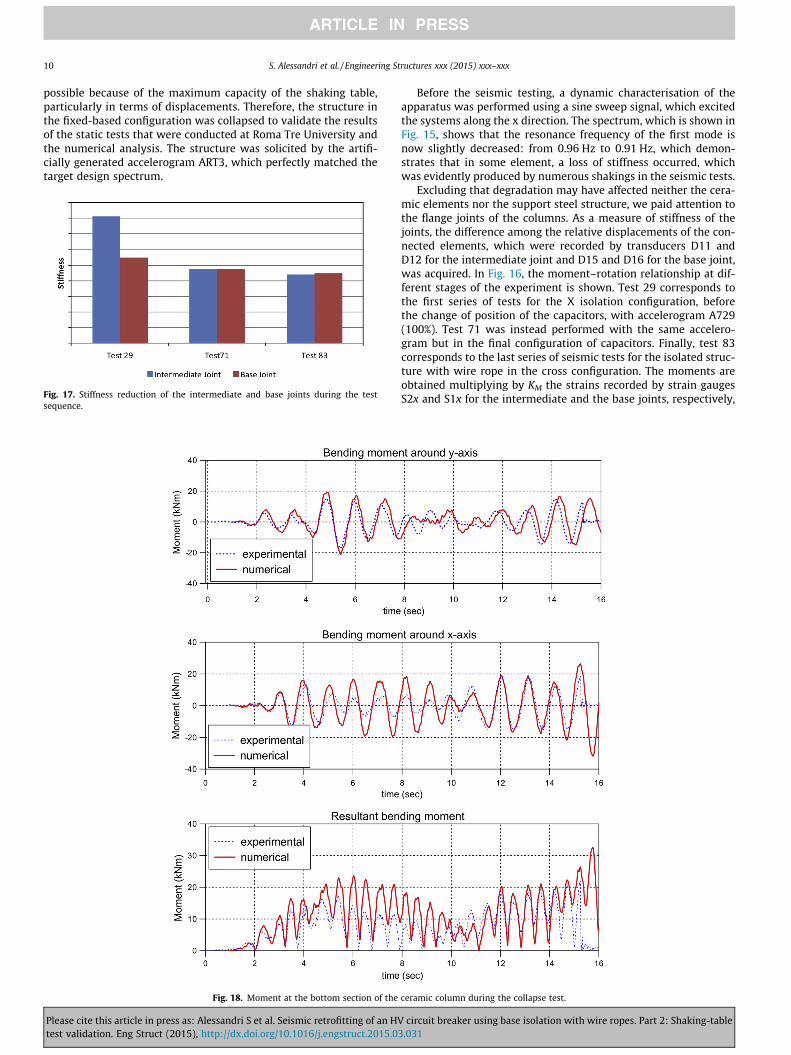
In the same graphs, the trend lines of the cycles are also shown,whose slope can be interpreted as the stiffness of an equivalentelastic element that approximates the real cycle, whose valuesare shown in Fig. 17. The cycles of the intermediate joint showsa high reduction in stiffness and a significant loss of linearity,which is evidenced by hysteresis. A similar phenomenon is alsopresent but much less pronounced for the base joint. The highestloss of stiffness occurred in the transition between test 29 and test71, whereas the loss of stiffness from test 71 and the last test (83)is modest.
These results were used to modify the stiffness of theintermediate joint to better match the numerical and experimentalresults.
The seismic tests were conducted by gradually increasing theintensity of the accelerogram. Two preliminary tests, which wereconducted by scaling the accelerogram to 25% and 35%, did notproduced collapse of circuit breaker, which occurred for theaccelerogram that was scaled to 50% of the maximum valueattained for the isolated structure.
Fig. 18 shows the bending moment that was indirectly obtainedat the bottom section of the ceramic column through the recordeddeformation using strain gauges S1x and S1y and the absolutevalue of the resultant moment. The failure occurred after approxi-mately 15 s elapsed from the beginning of the test and for themoment of approximately 22 kN m. This value is slightly lowerthan the measured moment during the static cyclic tests [7]. Tovalidate this result, the upper column, which remained intact afterthe test, was subsequently cyclically tested in the static regime toobtain a strength value that was practically equal to the oneobtained in the previous static test campaign. This result indicatesthat the observed difference in strength between the static and thedynamic regimes depends more on the testing typology than themechanical properties of the materials.
To show the beneficial effects of the proposed isolation system,Fig. 19 depicts the absolute values of the bending moment at thebase section of the ceramic column, both for the isolated andnon-isolated cases. Given that the failure of the circuit breakeroccurred for a seismic intensity level (PGA = 0.25) equal to 50% ofthe value attained for the isolated structure (PGA = 0.5 g), thereduction of the moment is about 75%, which confirm the higheffectiveness of wire-rope isolators in reducing the seismicresponse of the circuit breaker, already demonstrated by numericalanalysis.
Please cite this article in press as: Alessandri S et al. Seismic retrofitting of an HVtest validation. Eng Struct (2015), http://dx.doi.org/10.1016/j.engstruct.2015.03
4. Conclusions
Using a shaking-test campaign, the effectiveness of an isolationsystem designed for the seismic protection of an HV circuit breakerwas studied. The proposed solution is based on wire ropes. Thesedevices can be subjected to tension–compression forces, unlikethe devices that are usually used for the base isolation of civiland industrial structures that can work only in shear. Thus, theyappear particularly suitable for the seismic isolation of HVequipment, where the rocking effect of the base is predominantwith respect to its horizontal translation, with the consequenceof tensile forces in the isolation devices. Hence, a drastic reductionof the stress level in the critical elements can be obtainedthanks to the large elongation of the vibration period of the struc-ture and the increase in damping ratio because of friction amongthe wires.
During the tests, several configurations were analysed by vary-ing the type and disposition of the isolation devices. In particular,two different configurations were analysed: (a) X500 with the cen-tre of the Wire Ropes at the vertices of a square 500 � 500 mm, (b)+760 with wire ropes along the sides of a square 760 � 760 mm.The design and the preliminary numerical analysis of both config-urations were illustrated in a companion paper.
During the experimental campaign, the circuit breaker was sub-jected to several tests to dynamically characterise the apparatus infixed and isolated base configurations and to evaluate its seismicresponse, in particular, using sine-sweeps and seismic tests. Forthe strong-motion tests, 6 different accelerograms (3 natural and3 artificially generated) were selected according to the Europeancode for the seismic qualification of electrical equipment (CEI EN62271-2017).
From the identification tests of the equipment in the fixed-baseconfiguration, two predominant modes with frequency of approxi-mately 1 Hz and a damping ratio variable in a range 3–4% wereobserved. These results were used to calibrate the numerical modelby varying the stiffness of the connection joint of ceramicelements.
The strong-motion tests were dedicated to the equipment in thebase-isolated configuration. Then, the results of the most signifi-cant quantities acquired during the tests were compared withthose obtained from the numerical model, which were excited bythe same signals recorded on the shaking table. In particular, byfocusing on the top displacements, the deformation of the wireropes and the moment at the bottom section of the ceramic col-umns, the following conclusions can be drawn:
circuit breaker using base isolation with wire ropes. Part 2: Shaking-table.031
12 S. Alessandri et al. / Engineering Structures xxx (2015) xxx–xxx
� Numerical and experimental results were similar, althoughtheir maximum values were appreciably different with anunderestimation of the real results. This difference wasobserved for all six accelerograms.� A consistency between the experimental and numerical
moments at the bottom section of the ceramic column has beenobserved; however, similar to the displacements, the maximumvalues that were experimentally measured using the straingauges (S11–S14) produced higher stress levels than thenumerically predicted values.� The vertical displacements of wire ropes that were measured
during the tests are satisfactorily reproduced by the numericalmodel, although the maximum values were underestimatedagain.
Thus, the comparison between experimental and numericalresults, which were simulated using the OpenSEES model, showeda consistency for all response quantities (displacements, moments,and deformations), although the maximum values were systemati-cally underestimated as approximately 20%. This result should beconsidered in the selection of the isolation system to ensure thedesired safety level and to widen the margin between the maxi-mum stress and the calculated strength of the ceramic column.
Finally, to demonstrate the high effectiveness of the isolationsystem, a collapse test of the HV circuit breaker in a fixed-base con-figuration was performed. The comparison of the response in termsof maximum moment at the bottom section of the ceramic column,recorded during the tests, with and without isolation systems,demonstrates that the wire ropes reduce approximately of 75%the maximum stress level in the ceramic, which highly increasesthe safety level of this apparatus against earthquakes.
Acknowledgments
The work presented herein was performed with a financialgrant from the Italian Transmission System Operator (TERNA).Any opinions, findings and conclusions or recommendationsexpressed in this paper are those of the authors and do notnecessarily reflect those of the funding agency. The authors wantto thank Mr. Baldassarri for his valid help during the test execution.
References
[1] Bonacina, G, Bonetti, P. et al. Seismic base isolation of gas insulated electricalsubstations: design, experimental and numerical activities, evaluation of theapplicability. In: Duma, editor. 10th European conference on earthquakeengineering; 1995.
[2] CEI EN 62271-207. High-voltage switchgear and controlgear. Part 207: Seismicqualification for gas-insulated switchgear assemblies for rated voltages above52 kV; 2008.
[3] Colombo E, Salvetti M, Vallino M. Report on in progress experimental/analytical activities intend for seismic qualification of ENEL HV electrical
Please cite this article in press as: Alessandri S et al. Seismic retrofitting of an HVtest validation. Eng Struct (2015), http://dx.doi.org/10.1016/j.engstruct.2015.0
substations. In: International workshop on risk and reliability analysis ofelectrical transmission systems subjected to seismic events and other extremeloads, ISMES conference centre – Seriate (BG), Italy, 22–23 June 1995; 1995.
[4] Di Donna M, Serino G, Giannini R. Advance earthquake protection systems forhigh voltage electric equipment. In: 12th European conference on earthquakeengineering, London, September 2002; 2002.
[5] Ersoy S, Saadeghvaziri MA, Liu GY, Mau ST. Analytical and experimentalseismic studies of transformers isolated with friction pendulum system anddesign aspects. Earthquake Spectra 2001;17(4):569–95.
[6] Gasparini D, Vanmarcke EH. SIMQKE: a program for artificial motiongeneration. Cambridge, MA: Department of Civil Engineering, MassachusettsInstitute of Technology; 1976.
[7] Alessandri S, Giannini R, Paolacci F, Malena M. Seismic retrofitting of an HVcircuit breaker using base isolation with wire ropes. Part 1: Preliminary testsand analyses. Eng Struct 2015. http://dx.doi.org/10.1016/j.engstruct.2015.03.032.
[8] Gilani AS, Chavez JW, Fenves GL, Whittaker AS. Seismic evaluation, and retrofitof 230-kV porcelain transformer bushings, PEER 1999/14 Dec. 1999; 1999.
[9] Gilani ASJ, Whittaker AS, Fenves GL, Chen C-H, Ho H, Fujisaki E. Seismicevaluation and analysis of 230-kV disconnect switches. Pacific EarthquakeEngineering Research Center, Report 2000/06. PEER, University of California atBerkeley; 2000.
[10] Günay S, Mosalam KM. Seismic performance evaluation of high-voltagedisconnect switches using real-time hybrid simulation: II. Parametric study.(2014). Earthquake Eng Struct Dyn 2014;43(8):1223–37.
[11] Gundy WE, Associates. Design and analysis of a disconnect switch supportstructure. Report 1195-17 for Southern States, Inc. W.E. Gundy and AssociatesInc: Hailey, ID; 2002.
[12] IEEE Standard 693-2005. Recommended practice for seismic design ofsubstations. New York, NY; 2006.
[13] Kircher et al. Performance of a 230 kV ATB 7 power circuit breaker mounted ongapec isolators. Report by The John A. Blume Earthquake Engineering ResearchCenter, Dept. of Civil Engrg., Stanford University, Stanford, CA; 1979.
[14] Kong D. Evaluation and protection of high voltage electrical equipment againstsevere shock and vibrations, Phd dissertation, Department of Civil, Structuraland Environmental Engineering, The State University of New York at Buffalo,September; 2010.
[15] Kong D, Reinhorn A. Seismic evaluation and protection of high voltagedisconnect switches. In: Proceedings of the 2009 technical council on lifelineearthquake engineering conference. TCLEE. Oakland, California. June 28-July 1,2009, pp 221–231.
[16] McKenna F, Fenves GL, Scott MH. OpenSees: open system for earthquakeengineering simulation. Berkeley, CA: PEER, University of California; 2007.
[17] Mosalam KM, Günay S. Seismic performance evaluation of high voltagedisconnect switches using real-time hybrid simulation: I. System developmentand validation. Earthquake Eng Struct Dyn 2014;43(8):1205–22.
[18] Murota M, Feng MQ, Gee Y-L. Experimental and analytical studies of baseisolation systems for seismic protection of power transformers, MCEER-05-0008; 9/30/2005; 2005.
[19] Oikonomou K, Constantinou MC, Reinhorn AM, Yenidogan C. Seismic isolationof electrical equipment ‘‘Seismic Table Simulation’’. In: 15th World conferenceof earthquake engineering, September 24–28, Lisbon, Portugal; 2012.
[20] Paolacci F, Giannini R. Seismic reliability assessment of a disconnect switchusing an effective fragility analysis. J Earthquake Eng 2009;13:217–35. http://dx.doi.org/10.1080/13632460802347448.
[21] Paolacci F, Giannini R, De Angelis M. Seismic response mitigation of chemicalplant components by passive control systems. J Loss Prev Process Ind2013;26(5):879–948. http://dx.doi.org/10.1016/j.jlp.2013.03.003.
[22] Paolacci F, Giannini R, Alessandri S, De Felice G. Seismic vulnerabilityassessment of a high voltage disconnect switch. Soil Dyn Earthquake Eng2014;67:198–207. http://dx.doi.org/10.1016/j.soildyn.2014.09.014.
[23] Serino G, Bonacina G, Bettinali F. Passive protection devices for high-voltageequipment: design procedures and performance evaluation. In: Proceedings ofthe fourth U.S. conference sponsored by the technical council on lifelineearthquake engineering/ASCE; 1995.
circuit breaker using base isolation with wire ropes. Part 2: Shaking-table3.031
Related Documents