© The Authors, published by EDP Sciences. This is an open access article distributed under the terms of the Creative Commons Attribution License 4.0 (http://creativecommons.org/licenses/by/4.0/). MATEC Web of Conferences 195, 02017 (2018) https://doi.org/10.1051/matecconf/201819502017 ICRMCE 2018 Seismic performance of four-storey masonry infilled reinforced concrete frame building 1 Master Program, Civil Engineering Department, Faculty of Engineering, Universitas Sebelas Maret, Surakarta, Indonesia 2 SMARTQuake and SMARTCrete Research Group, Civil Engineering Department, Faculty of Engineering, Universitas Sebelas Maret, Surakarta, Indonesia Abstract. Masonry infilled reinforced concrete frames are a structural system commonly used for low-to-mid-rise buildings. Generally, this type of structure is modelled as an open frame neglecting the strength and stiffness contribution of the masonry infilled panel. In order to describe realistic behaviour under lateral loading, this paper evaluates the seismic performance of the building by modelling the contribution of masonry as a compression strut acting diagonally in the panel. The non-linear static procedure is employed by subjecting the building to pushover loads. The performance of the building is then analysed based on the obtained capacity curve. Seismic performance is assessed in terms of building fragility which is the conditional probability of exceeding certain damage state for a given ground shaking intensity. Fragility functions eventually are expressed as series of log-normal curves of both the open and masonry infilled reinforced concrete frame. Based on this study, the infilled frame can resist a maximum load of 20.3x10 3 kN, while the open frame is only able to withstand a maximum load of 15.2x10 3 kN. From the fragility curve, it can be concluded that the probability of the infilled frame to reach a certain damage state is lower than that of the open frame. 1 Introduction A masonry infilled wall is regarded as a non-structural component that only gives a gravitational load effect to the structure. Hence, the masonry infilled frame building is generally modelled as an open frame structure omitting the strength and stiffness contribution of the infilled wall. In reality, the infilled wall consists of bricks and mortar components which, as a composite material, provides certain strength and stiffness to the structural frame. The magnitude of the strength and stiffness of the built masonry are diverse and they are greatly influenced by the quality of the materials and workmanship [1]. Based on the previous research, it is shown that the probability of collapse of the masonry infilled structure is smaller compared to the open frame model [2]. The finding highlights the important contribution of masonry infilled to the behaviour of the structural frame. * Corresponding author: [email protected] Isyana Ratna Hapsari 1,* , Senot Sangadji 2 , and Stefanus Adi Kristiawan 2

Welcome message from author
This document is posted to help you gain knowledge. Please leave a comment to let me know what you think about it! Share it to your friends and learn new things together.
Transcript
© The Authors, published by EDP Sciences. This is an open access article distributed under the terms of the Creative Commons Attribution License 4.0 (http://creativecommons.org/licenses/by/4.0/).
MATEC Web of Conferences 195, 02017 (2018) https://doi.org/10.1051/matecconf/201819502017ICRMCE 2018
Seismic performance of four-storey masonry infilled reinforced concrete frame building
1 Master Program, Civil Engineering Department, Faculty of Engineering, Universitas Sebelas Maret, Surakarta, Indonesia 2 SMARTQuake and SMARTCrete Research Group, Civil Engineering Department, Faculty of Engineering, Universitas Sebelas Maret, Surakarta, Indonesia
Abstract. Masonry infilled reinforced concrete frames are a structural system commonly used for low-to-mid-rise buildings. Generally, this type of structure is modelled as an open frame neglecting the strength and stiffness contribution of the masonry infilled panel. In order to describe realistic behaviour under lateral loading, this paper evaluates the seismic performance of the building by modelling the contribution of masonry as a compression strut acting diagonally in the panel. The non-linear static procedure is employed by subjecting the building to pushover loads. The performance of the building is then analysed based on the obtained capacity curve. Seismic performance is assessed in terms of building fragility which is the conditional probability of exceeding certain damage state for a given ground shaking intensity. Fragility functions eventually are expressed as series of log-normal curves of both the open and masonry infilled reinforced concrete frame. Based on this study, the infilled frame can resist a maximum load of 20.3x10³ kN, while the open frame is only able to withstand a maximum load of 15.2x10³ kN. From the fragility curve, it can be concluded that the probability of the infilled frame to reach a certain damage state is lower than that of the open frame.
1 Introduction A masonry infilled wall is regarded as a non-structural component that only gives a gravitational load effect to the structure. Hence, the masonry infilled frame building is generally modelled as an open frame structure omitting the strength and stiffness contribution of the infilled wall. In reality, the infilled wall consists of bricks and mortar components which, as a composite material, provides certain strength and stiffness to the structural frame. The magnitude of the strength and stiffness of the built masonry are diverse and they are greatly influenced by the quality of the materials and workmanship [1]. Based on the previous research, it is shown that the probability of collapse of the masonry infilled structure is smaller compared to the open frame model [2]. The finding highlights the important contribution of masonry infilled to the behaviour of the structural frame.
* Corresponding author: [email protected]
Isyana Ratna Hapsari1,*, Senot Sangadji2, and Stefanus Adi Kristiawan2
2
MATEC Web of Conferences 195, 02017 (2018) https://doi.org/10.1051/matecconf/201819502017ICRMCE 2018
Indonesia is a country with numerous incidences of earthquakes at a variety of intensities. The incidences can bring catastrophic consequences to the people and properties. For this reason, a reliable seismic performance of building has to be endorsed to guarantee the damage induced by the seismic load is within an acceptable limit. This can be achieved by a realistic analysis of structure and an appropriate quantification of damage state limit when the building is subjected to various seismic intensities. In this regard, this study employs a macro model of masonry infilled wall in the form of an equivalent diagonal compression strut [3,4] to take into account its contribution to the seismic performance of the building.
In addition to the material and structural modelling, the accuracy of building seismic performance also depends on the correct approach in determining the criteria for damage on which the seismic performance is evaluated. For the current study, seismic performance is assessed on the basis of the fragility curve. The fragility curve provides complete information on the probabilities of various levels of building damage due to various seismic intensities [5,6]. The limit of damage states adopted in this study refers to the criteria set by HAZUS-MH MR5 [7], ATC 40 [8] and Silva et al [9]. Based on the above approaches, the improved seismic performance associated with the masonry infilled wall contribution is then quantified by comparing the performance of four-storey masonry infilled reinforced concrete frame structure with that of the open frame structure.
2 Modelling of the building
2.1 Open frame structure
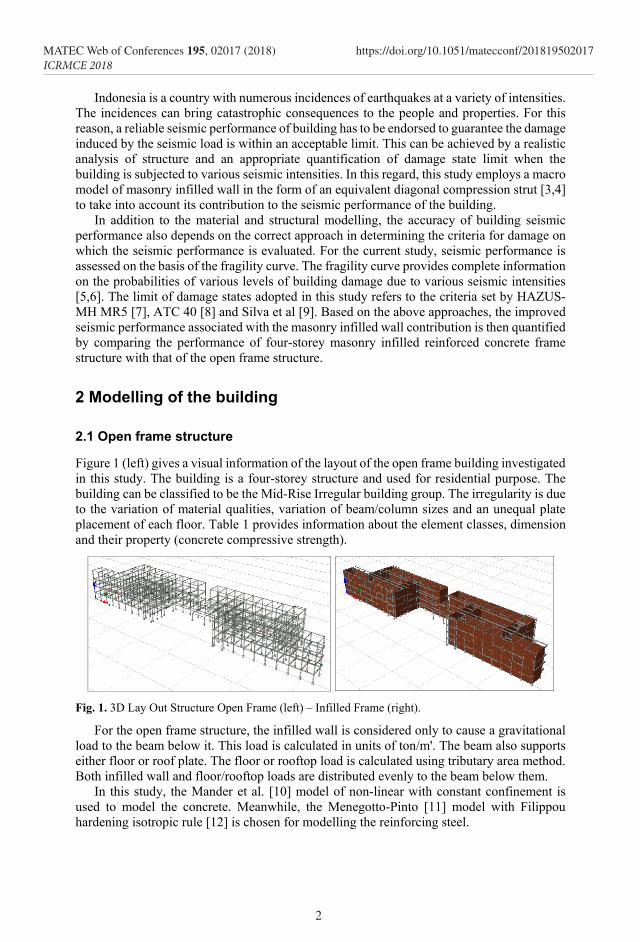
Figure 1 (left) gives a visual information of the layout of the open frame building investigated in this study. The building is a four-storey structure and used for residential purpose. The building can be classified to be the Mid-Rise Irregular building group. The irregularity is due to the variation of material qualities, variation of beam/column sizes and an unequal plate placement of each floor. Table 1 provides information about the element classes, dimension and their property (concrete compressive strength).
Fig. 1. 3D Lay Out Structure Open Frame (left) – Infilled Frame (right).
For the open frame structure, the infilled wall is considered only to cause a gravitational load to the beam below it. This load is calculated in units of ton/m'. The beam also supports either floor or roof plate. The floor or rooftop load is calculated using tributary area method. Both infilled wall and floor/rooftop loads are distributed evenly to the beam below them.
In this study, the Mander et al. [10] model of non-linear with constant confinement is used to model the concrete. Meanwhile, the Menegotto-Pinto [11] model with Filippou hardening isotropic rule [12] is chosen for modelling the reinforcing steel.

3
MATEC Web of Conferences 195, 02017 (2018) https://doi.org/10.1051/matecconf/201819502017ICRMCE 2018
Indonesia is a country with numerous incidences of earthquakes at a variety of intensities. The incidences can bring catastrophic consequences to the people and properties. For this reason, a reliable seismic performance of building has to be endorsed to guarantee the damage induced by the seismic load is within an acceptable limit. This can be achieved by a realistic analysis of structure and an appropriate quantification of damage state limit when the building is subjected to various seismic intensities. In this regard, this study employs a macro model of masonry infilled wall in the form of an equivalent diagonal compression strut [3,4] to take into account its contribution to the seismic performance of the building.
In addition to the material and structural modelling, the accuracy of building seismic performance also depends on the correct approach in determining the criteria for damage on which the seismic performance is evaluated. For the current study, seismic performance is assessed on the basis of the fragility curve. The fragility curve provides complete information on the probabilities of various levels of building damage due to various seismic intensities [5,6]. The limit of damage states adopted in this study refers to the criteria set by HAZUS-MH MR5 [7], ATC 40 [8] and Silva et al [9]. Based on the above approaches, the improved seismic performance associated with the masonry infilled wall contribution is then quantified by comparing the performance of four-storey masonry infilled reinforced concrete frame structure with that of the open frame structure.
2 Modelling of the building
2.1 Open frame structure
Figure 1 (left) gives a visual information of the layout of the open frame building investigated in this study. The building is a four-storey structure and used for residential purpose. The building can be classified to be the Mid-Rise Irregular building group. The irregularity is due to the variation of material qualities, variation of beam/column sizes and an unequal plate placement of each floor. Table 1 provides information about the element classes, dimension and their property (concrete compressive strength).
Fig. 1. 3D Lay Out Structure Open Frame (left) – Infilled Frame (right).
For the open frame structure, the infilled wall is considered only to cause a gravitational load to the beam below it. This load is calculated in units of ton/m'. The beam also supports either floor or roof plate. The floor or rooftop load is calculated using tributary area method. Both infilled wall and floor/rooftop loads are distributed evenly to the beam below them.
In this study, the Mander et al. [10] model of non-linear with constant confinement is used to model the concrete. Meanwhile, the Menegotto-Pinto [11] model with Filippou hardening isotropic rule [12] is chosen for modelling the reinforcing steel.
Table 1. Element classes and dimension.
2.2 Masonry infilled frame structure
It is expected that the infilled wall contributes to the strength and stiffness of the frame structure. A macro modelling of masonry infilled as an equivalent diagonal compression strut is adopted in this study [3,4]. A single strut modelling (see Figure 2) is used to represent masonry behavior. Despite the simplicity of its mathematical formulas, this model can still provide an adequate estimation of the infilled frame stiffness value against lateral load [13]. Table 2 indicates parameters associated with the masonry properties for the structural modelling. A typical value of Indonesian masonry compressive strength of 0.919 MPa as given in [14] is used for the current study.
Fig. 2. Macro modelling of masonry infilled.
Element Classes Beam size (mm2)
Concrete compressive strength of
beam (MPa)
Column size
(mm2)
Concrete compressive strength of
column (MPa)
Slab thickness
(mm)
a. 1,2,3 FLOOR 1. Primary type 1 300 x 400 28 300 x 400 30 140 2. Primary type 2 300 x 500 28 3. Primary type 3 300 x 300 25 4. Primary type 4 300 x 600 24 5. Primary type 5 250 x 400 28 6. Secondary type 1 200 x 300 26 150 x 150 30 7. Secondary type 2 300 x 400 24 150 x 300 8. Secondary type 3 150 x 300 26 9. Secondary type 4 150 x 250 28 10. Secondary type 5
(only 1st floor) 150 x 200 30
b. ROOF 11. Primary type 1 200 x 300 26 300 x 400 30 120 12. Primary type 2 300 x 400 28 13. Secondary type 1 200 x 300 26 150 x 150 30 14. Secondary type 2 150 x 250 28 150 x 300 15. Secondary type 3 150 x 300 26

4
MATEC Web of Conferences 195, 02017 (2018) https://doi.org/10.1051/matecconf/201819502017ICRMCE 2018
Table 2. Infilled parameters, equations and references.
Infilled Panel Model Parameters Unit Used Value
Equation Ref
1.Mechanical Properties a. Elastic Young’s Modulus, Em MPa varies Em = fmθ /εm (1) b. Mean diagonal compressive
strength, fmθ MPa varies fmθ = f1. sin2θ (2) [3]
c. Tensile Strength, ft MPa 0 [15] d. Bond shear strength, τ0 MPa 0.3 [15] e. Coefficient of friction, μ 0.62 [16] f. Maximum shear stress, τmax MPa 1 [15] g. Strain at max stress, (εm) MPa 0.0012 [15] h. Ultimate strain, (εu) MPa 0.024 εu = 20.εm (3) [15] i. Closing strain, (εcl) MPa 0.003 [15] j. Specific Weight, W N/mm3 1.7E-
005
2.Empirical Properties a. Starting Unloading Stiffness Factor,
(γun) 1.7 [15]
b. Strain Reloading Factor, (αre) 0.2 [15] c. Strain Inflection Factor, (αrh) 0.7 [15] d. Complete Unloading Strain Factor,
(βa) 2 [15]
e. Stress Inflection Factor, (βch) 0.9 [15] f. Zero Stress Stiffness Factor, (γplu) 1 [15] g. Reloading Stiffness Factor, (γplr) 1.1 [15] h. Plastic Unloading Stiffness Factor,
ex1 3 [15]
i. Repeated Cycle Strain Factor, ex2 1 [15] j. Reduction Shear Factor, (αs) MPa 1.43 [3] k. Out-of-plane Failure Drift % 1 [17] l. Proportion of stiffness assigned to
shear, γs % 70 [15]
3.Geometrical Properties a. Panel Thickness, tw mm 150 b. Dimensionless relative stiffness, �
� = ℎ�Em tw sin (2)4 Ec Ic hw
4 (4) [3]
c. Width of strut, bw1 mm varies bw = 0.175 (λ. h)-0.4 dw (5) [18,19]
d. Strut Area 1, Am1 mm2 varies Am1 = bw1. tinf (6) e. Strut Area 2, Am2 % 70 Am2 = bwcracked/bwuncracked (7) [3] f. Strut Area Reduction Strain, (ε1) 0.0006 [20] g. Residual Strut Area Strain, (ε2) 0.001 [20] h. Equivalent Contact Length, hz mm 0 Diagonal Single strut i. Horizontal Offsets, xoi % varies 𝑥𝑥𝑥𝑥𝑥𝑥 = 0.5 column width
width of infill panel (8) [15]
j. Vertical Offsets, yoi % varies 𝑦𝑦𝑥𝑥𝑥𝑥 = 0.5 beam depthheight of infill panel
(9) [15]

5
MATEC Web of Conferences 195, 02017 (2018) https://doi.org/10.1051/matecconf/201819502017ICRMCE 2018
Table 2. Infilled parameters, equations and references.
Infilled Panel Model Parameters Unit Used Value
Equation Ref
1.Mechanical Properties a. Elastic Young’s Modulus, Em MPa varies Em = fmθ /εm (1) b. Mean diagonal compressive
strength, fmθ MPa varies fmθ = f1. sin2θ (2) [3]
c. Tensile Strength, ft MPa 0 [15] d. Bond shear strength, τ0 MPa 0.3 [15] e. Coefficient of friction, μ 0.62 [16] f. Maximum shear stress, τmax MPa 1 [15] g. Strain at max stress, (εm) MPa 0.0012 [15] h. Ultimate strain, (εu) MPa 0.024 εu = 20.εm (3) [15] i. Closing strain, (εcl) MPa 0.003 [15] j. Specific Weight, W N/mm3 1.7E-
005
2.Empirical Properties a. Starting Unloading Stiffness Factor,
(γun) 1.7 [15]
b. Strain Reloading Factor, (αre) 0.2 [15] c. Strain Inflection Factor, (αrh) 0.7 [15] d. Complete Unloading Strain Factor,
(βa) 2 [15]
e. Stress Inflection Factor, (βch) 0.9 [15] f. Zero Stress Stiffness Factor, (γplu) 1 [15] g. Reloading Stiffness Factor, (γplr) 1.1 [15] h. Plastic Unloading Stiffness Factor,
ex1 3 [15]
i. Repeated Cycle Strain Factor, ex2 1 [15] j. Reduction Shear Factor, (αs) MPa 1.43 [3] k. Out-of-plane Failure Drift % 1 [17] l. Proportion of stiffness assigned to
shear, γs % 70 [15]
3.Geometrical Properties a. Panel Thickness, tw mm 150 b. Dimensionless relative stiffness, �
� = ℎ�Em tw sin (2)4 Ec Ic hw
4 (4) [3]
c. Width of strut, bw1 mm varies bw = 0.175 (λ. h)-0.4 dw (5) [18,19]
d. Strut Area 1, Am1 mm2 varies Am1 = bw1. tinf (6) e. Strut Area 2, Am2 % 70 Am2 = bwcracked/bwuncracked (7) [3] f. Strut Area Reduction Strain, (ε1) 0.0006 [20] g. Residual Strut Area Strain, (ε2) 0.001 [20] h. Equivalent Contact Length, hz mm 0 Diagonal Single strut i. Horizontal Offsets, xoi % varies 𝑥𝑥𝑥𝑥𝑥𝑥 = 0.5 column width
width of infill panel (8) [15]
j. Vertical Offsets, yoi % varies 𝑦𝑦𝑥𝑥𝑥𝑥 = 0.5 beam depthheight of infill panel
(9) [15]
3 Seismic performance analysis
3.1 Structural analysis
The structural response of both the open frame and the masonry infilled frame structure are evaluated by performing a non-linear static pushover analysis first. The analysis is carried out using a finite element software (Seismostruct) [21]. The main output of this analysis is a capacity curve.
3.2 Developing fragility curve
3.2.1 Converting the capacity curve into a spectrum capacity curve
The first step in the development of a fragility curve is by converting the capacity curve obtained from the non-linear pushover analysis to a spectrum capacity curve. The formulae used to convert the capacity curve (base shear-displacement) into spectral capacity (spectral acceleration versus spectral displacement) based on ATC-40 [8] are as follows:
Sa = V/Wα1
(10)
Sd = ΔroofPF1 x Øroof1
(11)
and PF1 can be calculated as follows [7]:
��1 𝛼 �∑ (wi.∅i1)N
i=1 g�∑ (wi.∅i1²)N
i=1 g�� (12)
𝛼𝛼1 𝛼�∑ (wi.∅i1)
g�Ni=1 � ²
�∑ (wi)g�N
i=1 � �∑ (wi.∅i1²)g�N
i=1 � (13)
The notations of Sa, Sd, PF1, α1, ∅𝑖𝑖1𝑖 𝑖𝑖𝑖 𝑖𝑖𝑖 𝑖𝑖𝑖𝑖𝑖𝑖𝑖𝑖𝑖𝑖,and (𝑤𝑤𝑖𝑖)𝑤𝑤𝑤 refer to spectral acceleration, spectral displacement, modal participation of 1st mode, modal mass coefficient of 1st mode, 1st amplitude pushover for level i, base shear, weight of structure, roof displacement, and mass on level i, respectively.
3.2.2 Determining the damage states
There are several ways to determine the damage states of the structure. They may be calculated on the basis of the inter-story drift ratio, the maximum base shear capacity, the yield displacement (dy) and ultimate displacement (du), the material strain level, etc. [7-9,22]. This study determines the damage states of the structure using the inter-story drift ratio criteria as set in the HAZUS-MH MR5 [7] and ATC 40 [8]. In addition, criteria of damage states based on the maximum base shear capacity as suggested by Silva et al [9] are also adopted.
6
MATEC Web of Conferences 195, 02017 (2018) https://doi.org/10.1051/matecconf/201819502017ICRMCE 2018
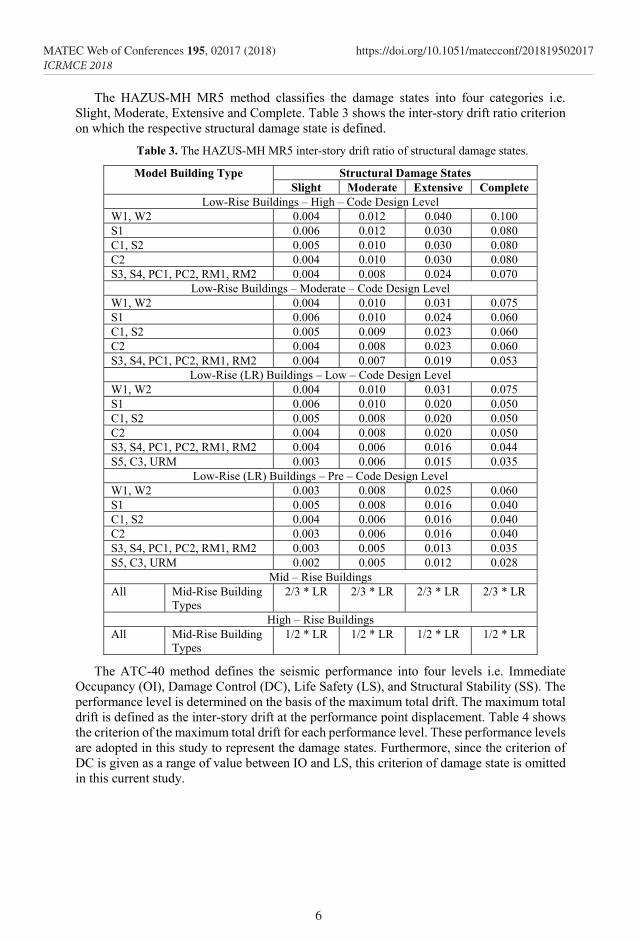
The HAZUS-MH MR5 method classifies the damage states into four categories i.e. Slight, Moderate, Extensive and Complete. Table 3 shows the inter-story drift ratio criterion on which the respective structural damage state is defined.
Table 3. The HAZUS-MH MR5 inter-story drift ratio of structural damage states.
Model Building Type Structural Damage States Slight Moderate Extensive Complete
Low-Rise Buildings – High – Code Design Level W1, W2 0.004 0.012 0.040 0.100 S1 0.006 0.012 0.030 0.080 C1, S2 0.005 0.010 0.030 0.080 C2 0.004 0.010 0.030 0.080 S3, S4, PC1, PC2, RM1, RM2 0.004 0.008 0.024 0.070
Low-Rise Buildings – Moderate – Code Design Level W1, W2 0.004 0.010 0.031 0.075 S1 0.006 0.010 0.024 0.060 C1, S2 0.005 0.009 0.023 0.060 C2 0.004 0.008 0.023 0.060 S3, S4, PC1, PC2, RM1, RM2 0.004 0.007 0.019 0.053
Low-Rise (LR) Buildings – Low – Code Design Level W1, W2 0.004 0.010 0.031 0.075 S1 0.006 0.010 0.020 0.050 C1, S2 0.005 0.008 0.020 0.050 C2 0.004 0.008 0.020 0.050 S3, S4, PC1, PC2, RM1, RM2 0.004 0.006 0.016 0.044 S5, C3, URM 0.003 0.006 0.015 0.035
Low-Rise (LR) Buildings – Pre – Code Design Level W1, W2 0.003 0.008 0.025 0.060 S1 0.005 0.008 0.016 0.040 C1, S2 0.004 0.006 0.016 0.040 C2 0.003 0.006 0.016 0.040 S3, S4, PC1, PC2, RM1, RM2 0.003 0.005 0.013 0.035 S5, C3, URM 0.002 0.005 0.012 0.028
Mid – Rise Buildings All Mid-Rise Building
Types 2/3 * LR 2/3 * LR 2/3 * LR 2/3 * LR
High – Rise Buildings All Mid-Rise Building
Types 1/2 * LR 1/2 * LR 1/2 * LR 1/2 * LR
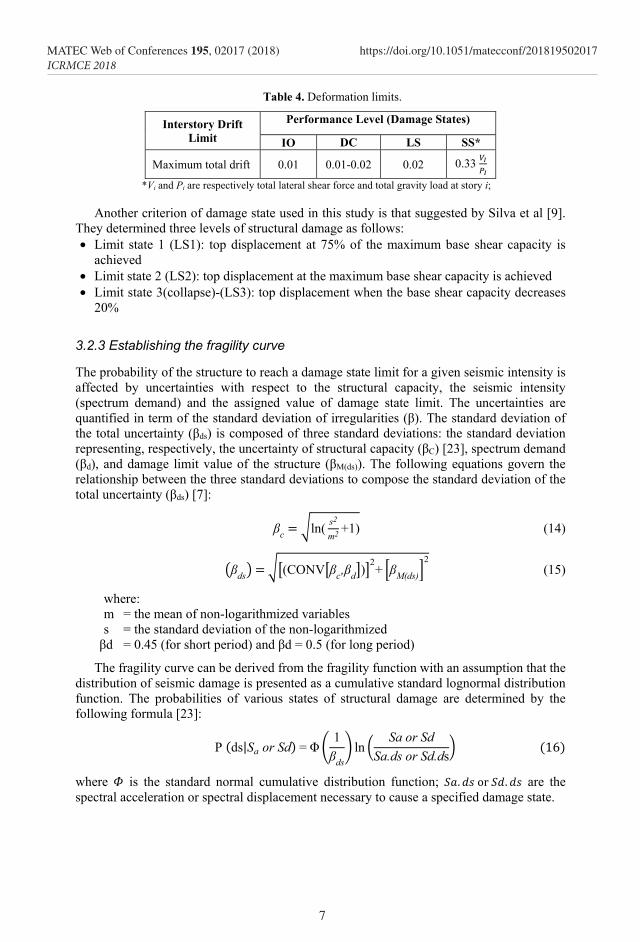
The ATC-40 method defines the seismic performance into four levels i.e. Immediate Occupancy (OI), Damage Control (DC), Life Safety (LS), and Structural Stability (SS). The performance level is determined on the basis of the maximum total drift. The maximum total drift is defined as the inter-story drift at the performance point displacement. Table 4 shows the criterion of the maximum total drift for each performance level. These performance levels are adopted in this study to represent the damage states. Furthermore, since the criterion of DC is given as a range of value between IO and LS, this criterion of damage state is omitted in this current study.
7
MATEC Web of Conferences 195, 02017 (2018) https://doi.org/10.1051/matecconf/201819502017ICRMCE 2018
The HAZUS-MH MR5 method classifies the damage states into four categories i.e. Slight, Moderate, Extensive and Complete. Table 3 shows the inter-story drift ratio criterion on which the respective structural damage state is defined.
Table 3. The HAZUS-MH MR5 inter-story drift ratio of structural damage states.
Model Building Type Structural Damage States Slight Moderate Extensive Complete
Low-Rise Buildings – High – Code Design Level W1, W2 0.004 0.012 0.040 0.100 S1 0.006 0.012 0.030 0.080 C1, S2 0.005 0.010 0.030 0.080 C2 0.004 0.010 0.030 0.080 S3, S4, PC1, PC2, RM1, RM2 0.004 0.008 0.024 0.070
Low-Rise Buildings – Moderate – Code Design Level W1, W2 0.004 0.010 0.031 0.075 S1 0.006 0.010 0.024 0.060 C1, S2 0.005 0.009 0.023 0.060 C2 0.004 0.008 0.023 0.060 S3, S4, PC1, PC2, RM1, RM2 0.004 0.007 0.019 0.053
Low-Rise (LR) Buildings – Low – Code Design Level W1, W2 0.004 0.010 0.031 0.075 S1 0.006 0.010 0.020 0.050 C1, S2 0.005 0.008 0.020 0.050 C2 0.004 0.008 0.020 0.050 S3, S4, PC1, PC2, RM1, RM2 0.004 0.006 0.016 0.044 S5, C3, URM 0.003 0.006 0.015 0.035
Low-Rise (LR) Buildings – Pre – Code Design Level W1, W2 0.003 0.008 0.025 0.060 S1 0.005 0.008 0.016 0.040 C1, S2 0.004 0.006 0.016 0.040 C2 0.003 0.006 0.016 0.040 S3, S4, PC1, PC2, RM1, RM2 0.003 0.005 0.013 0.035 S5, C3, URM 0.002 0.005 0.012 0.028
Mid – Rise Buildings All Mid-Rise Building
Types 2/3 * LR 2/3 * LR 2/3 * LR 2/3 * LR
High – Rise Buildings All Mid-Rise Building
Types 1/2 * LR 1/2 * LR 1/2 * LR 1/2 * LR
The ATC-40 method defines the seismic performance into four levels i.e. Immediate Occupancy (OI), Damage Control (DC), Life Safety (LS), and Structural Stability (SS). The performance level is determined on the basis of the maximum total drift. The maximum total drift is defined as the inter-story drift at the performance point displacement. Table 4 shows the criterion of the maximum total drift for each performance level. These performance levels are adopted in this study to represent the damage states. Furthermore, since the criterion of DC is given as a range of value between IO and LS, this criterion of damage state is omitted in this current study.
Table 4. Deformation limits.
Interstory Drift Limit
Performance Level (Damage States)
IO DC LS SS*
Maximum total drift 0.01 0.01-0.02 0.02 0.33 ����
*Vi and Pi are respectively total lateral shear force and total gravity load at story i;
Another criterion of damage state used in this study is that suggested by Silva et al [9]. They determined three levels of structural damage as follows: • Limit state 1 (LS1): top displacement at 75% of the maximum base shear capacity is
achieved • Limit state 2 (LS2): top displacement at the maximum base shear capacity is achieved • Limit state 3(collapse)-(LS3): top displacement when the base shear capacity decreases
20%
3.2.3 Establishing the fragility curve
The probability of the structure to reach a damage state limit for a given seismic intensity is affected by uncertainties with respect to the structural capacity, the seismic intensity (spectrum demand) and the assigned value of damage state limit. The uncertainties are quantified in term of the standard deviation of irregularities (β). The standard deviation of the total uncertainty (βds) is composed of three standard deviations: the standard deviation representing, respectively, the uncertainty of structural capacity (βC) [23], spectrum demand (βd), and damage limit value of the structure (βM(ds)). The following equations govern the relationship between the three standard deviations to compose the standard deviation of the total uncertainty (βds) [7]:
βc = �ln( s2
m2 +1) (14)
�βds� = ��(CONV�βc,βd�)�2+ �βM(ds)�2 (15)
where: m = the mean of non-logarithmized variables s = the standard deviation of the non-logarithmized
βd = 0.45 (for short period) and βd = 0.5 (for long period)
The fragility curve can be derived from the fragility function with an assumption that the distribution of seismic damage is presented as a cumulative standard lognormal distribution function. The probabilities of various states of structural damage are determined by the following formula [23]:
P (ds|Sa or Sd) = Φ � 1βds
� ln � Sa or SdSa.ds or Sd.ds� (��)
where 𝛷𝛷 is the standard normal cumulative distribution function; 𝑆𝑆𝑆𝑆𝑆 𝑆𝑆𝑆𝑆 𝑆𝑆 𝑆𝑆𝑆𝑆𝑆 𝑆𝑆𝑆𝑆 are the spectral acceleration or spectral displacement necessary to cause a specified damage state.
8
MATEC Web of Conferences 195, 02017 (2018) https://doi.org/10.1051/matecconf/201819502017ICRMCE 2018
4 Results and discussion
4.1 Comparison of capacity curve
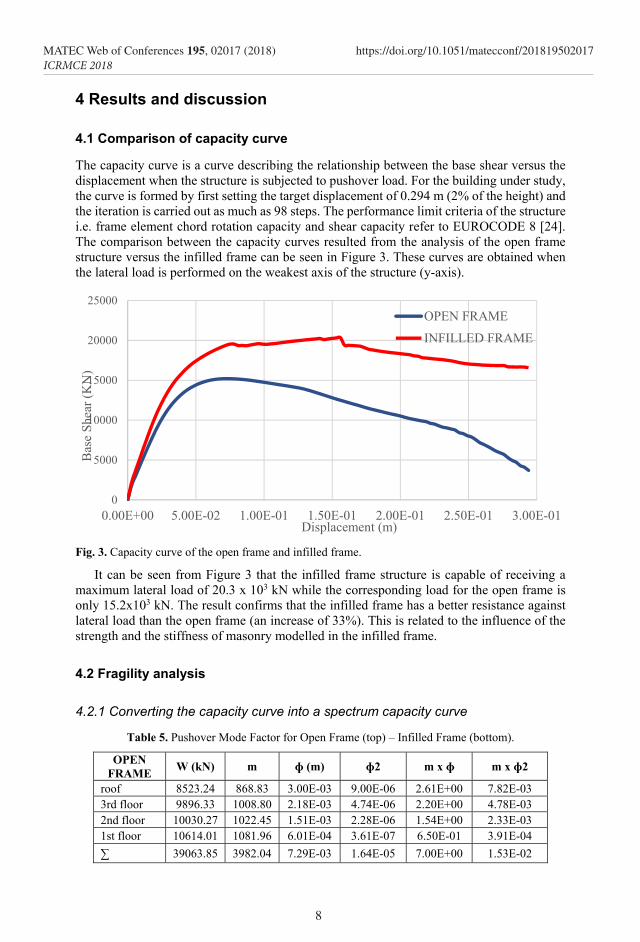
The capacity curve is a curve describing the relationship between the base shear versus the displacement when the structure is subjected to pushover load. For the building under study, the curve is formed by first setting the target displacement of 0.294 m (2% of the height) and the iteration is carried out as much as 98 steps. The performance limit criteria of the structure i.e. frame element chord rotation capacity and shear capacity refer to EUROCODE 8 [24]. The comparison between the capacity curves resulted from the analysis of the open frame structure versus the infilled frame can be seen in Figure 3. These curves are obtained when the lateral load is performed on the weakest axis of the structure (y-axis).
Fig. 3. Capacity curve of the open frame and infilled frame.
It can be seen from Figure 3 that the infilled frame structure is capable of receiving a maximum lateral load of 20.3 x 10³ kN while the corresponding load for the open frame is only 15.2x10³ kN. The result confirms that the infilled frame has a better resistance against lateral load than the open frame (an increase of 33%). This is related to the influence of the strength and the stiffness of masonry modelled in the infilled frame.
4.2 Fragility analysis
4.2.1 Converting the capacity curve into a spectrum capacity curve
Table 5. Pushover Mode Factor for Open Frame (top) – Infilled Frame (bottom).
OPEN FRAME W (kN) m ɸ (m) ɸ2 m x ɸ m x ɸ2
roof 8523.24 868.83 3.00E-03 9.00E-06 2.61E+00 7.82E-03 3rd floor 9896.33 1008.80 2.18E-03 4.74E-06 2.20E+00 4.78E-03 2nd floor 10030.27 1022.45 1.51E-03 2.28E-06 1.54E+00 2.33E-03 1st floor 10614.01 1081.96 6.01E-04 3.61E-07 6.50E-01 3.91E-04 ∑ 39063.85 3982.04 7.29E-03 1.64E-05 7.00E+00 1.53E-02
0
5000
10000
15000
20000
25000
0.00E+00 5.00E-02 1.00E-01 1.50E-01 2.00E-01 2.50E-01 3.00E-01
Base
She
ar (K
N)
Displacement (m)
OPEN FRAMEINFILLED FRAME

9
MATEC Web of Conferences 195, 02017 (2018) https://doi.org/10.1051/matecconf/201819502017ICRMCE 2018
4 Results and discussion
4.1 Comparison of capacity curve
The capacity curve is a curve describing the relationship between the base shear versus the displacement when the structure is subjected to pushover load. For the building under study, the curve is formed by first setting the target displacement of 0.294 m (2% of the height) and the iteration is carried out as much as 98 steps. The performance limit criteria of the structure i.e. frame element chord rotation capacity and shear capacity refer to EUROCODE 8 [24]. The comparison between the capacity curves resulted from the analysis of the open frame structure versus the infilled frame can be seen in Figure 3. These curves are obtained when the lateral load is performed on the weakest axis of the structure (y-axis).
Fig. 3. Capacity curve of the open frame and infilled frame.
It can be seen from Figure 3 that the infilled frame structure is capable of receiving a maximum lateral load of 20.3 x 10³ kN while the corresponding load for the open frame is only 15.2x10³ kN. The result confirms that the infilled frame has a better resistance against lateral load than the open frame (an increase of 33%). This is related to the influence of the strength and the stiffness of masonry modelled in the infilled frame.
4.2 Fragility analysis
4.2.1 Converting the capacity curve into a spectrum capacity curve
Table 5. Pushover Mode Factor for Open Frame (top) – Infilled Frame (bottom).
OPEN FRAME W (kN) m ɸ (m) ɸ2 m x ɸ m x ɸ2
roof 8523.24 868.83 3.00E-03 9.00E-06 2.61E+00 7.82E-03 3rd floor 9896.33 1008.80 2.18E-03 4.74E-06 2.20E+00 4.78E-03 2nd floor 10030.27 1022.45 1.51E-03 2.28E-06 1.54E+00 2.33E-03 1st floor 10614.01 1081.96 6.01E-04 3.61E-07 6.50E-01 3.91E-04 ∑ 39063.85 3982.04 7.29E-03 1.64E-05 7.00E+00 1.53E-02
0
5000
10000
15000
20000
25000
0.00E+00 5.00E-02 1.00E-01 1.50E-01 2.00E-01 2.50E-01 3.00E-01
Base
She
ar (K
N)
Displacement (m)
OPEN FRAMEINFILLED FRAME
INFILLED FRAME W (kN) m ɸ (m) ɸ2 m x ɸ m x ɸ2
roof 8523.24 868.83 3.00E-03 9.00E-06 2.61E+00 7.82E-03 3rd floor 9896.33 1008.80 2.28E-03 5.19E-06 2.30E+00 5.24E-03 2nd floor 10030.27 1022.45 1.61E-03 2.58E-06 1.64E+00 2.64E-03 1st floor 10614.01 1081.96 6.54E-04 4.28E-07 7.08E-01 4.63E-04 ∑ 39063.85 3982.04 7.54E-03 1.72E-05 7.26E+00 1.62E-02
Table 5 gives the pushover mode factor for both the open frame and the infilled frame structure. The parameters of the pushover mode factor are obtained from the eigenvalue and log report of the pushover analysis. These parameters (node masses = m, ∅i1 = amplitude of pushover mode at ith) are then used as inputs to calculate α1 and PF1 using Equation 12 and 13. The value of α1 and PF1 for the open frame structure is 0.80 and 1.37, respectively. The corresponding value for the infilled frame is 0.82 and 1.35, respectively. Based on the obtained values of α1 and PF1 as given above, the capacity curve can be presented into Acceleration Displacement Response Spectrum (ADRS) format using Equations 10 and 11. The obtained spectrum capacity curve is presented in Figure 4.
Fig. 4. Spectrum capacity of the open frame and infilled frame.
4.2.2 Determining the damage states
The damage states (see sub-section 3.2.2) as defined by the HAZUS-MH MR5 [7], ATC 40 [8] and Silva et al [9] are calculated and then used to identify the spectral displacement of Figure 4 at which the respective damage state occurs. Recapitulation of spectral displacements (Sd) representing various damage states can be seen in Table 6 and 7.
4.2.3 Establishing the fragility curve
The first step in forming the fragility curve is to calculate the standard deviation (β) representing various uncertainties. Based on the eigen analysis, the structures have a period of 0.36 seconds (open frame) and 0.31 seconds (infilled frame) for the first mode. Hence, both structures belong to the short period structure (i.e a period of less than 3.5 seconds). For this type of structure, the dispersion demand (βd) is 0.45. Meanwhile, the value of βM (ds) is taken to be 0.4 according to the HAZUS-MH MR5 [6]. This value is used for all types of damage states. The last value of standard deviation is βC which represents the uncertainty of
0.00
0.10
0.20
0.30
0.40
0.50
0.60
0.70
0.00 0.05 0.10 0.15 0.20 0.25
Spec
tral A
ccel
erat
ion
-Sa
Spectral Displacement - Sd
OPEN FRAMEINFILLED FRAME
10
MATEC Web of Conferences 195, 02017 (2018) https://doi.org/10.1051/matecconf/201819502017ICRMCE 2018
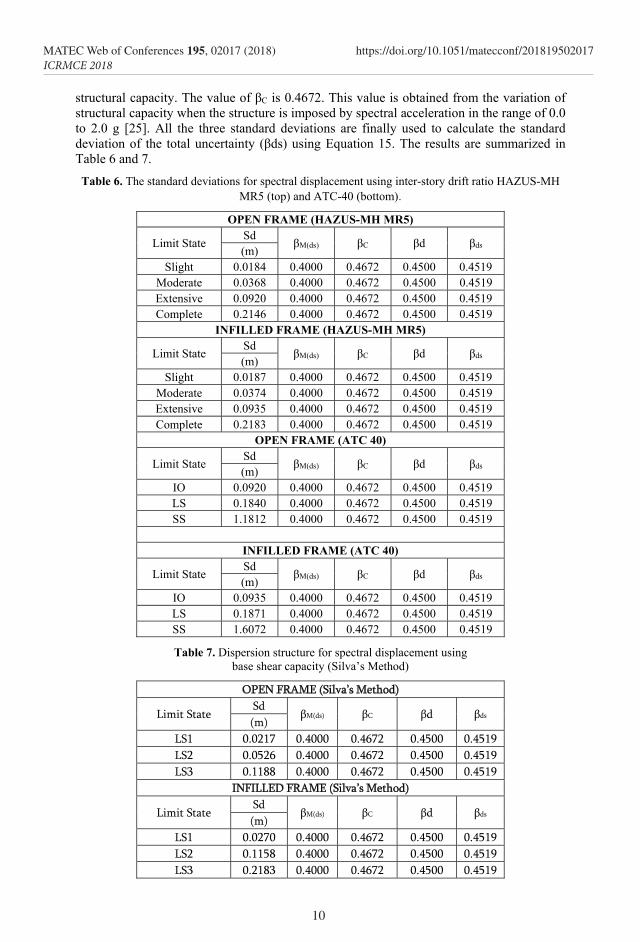
structural capacity. The value of βC is 0.4672. This value is obtained from the variation of structural capacity when the structure is imposed by spectral acceleration in the range of 0.0 to 2.0 g [25]. All the three standard deviations are finally used to calculate the standard deviation of the total uncertainty (βds) using Equation 15. The results are summarized in Table 6 and 7. Table 6. The standard deviations for spectral displacement using inter-story drift ratio HAZUS-MH
MR5 (top) and ATC-40 (bottom).
OPEN FRAME (HAZUS-MH MR5)
Limit State Sd βM(ds) βC βd βds (m) Slight 0.0184 0.4000 0.4672 0.4500 0.4519
Moderate 0.0368 0.4000 0.4672 0.4500 0.4519 Extensive 0.0920 0.4000 0.4672 0.4500 0.4519 Complete 0.2146 0.4000 0.4672 0.4500 0.4519
INFILLED FRAME (HAZUS-MH MR5)
Limit State Sd βM(ds) βC βd βds (m) Slight 0.0187 0.4000 0.4672 0.4500 0.4519
Moderate 0.0374 0.4000 0.4672 0.4500 0.4519 Extensive 0.0935 0.4000 0.4672 0.4500 0.4519 Complete 0.2183 0.4000 0.4672 0.4500 0.4519
OPEN FRAME (ATC 40)
Limit State Sd βM(ds) βC βd βds (m) IO 0.0920 0.4000 0.4672 0.4500 0.4519 LS 0.1840 0.4000 0.4672 0.4500 0.4519 SS 1.1812 0.4000 0.4672 0.4500 0.4519
INFILLED FRAME (ATC 40)
Limit State Sd βM(ds) βC βd βds (m) IO 0.0935 0.4000 0.4672 0.4500 0.4519 LS 0.1871 0.4000 0.4672 0.4500 0.4519 SS 1.6072 0.4000 0.4672 0.4500 0.4519
Table 7. Dispersion structure for spectral displacement using base shear capacity (Silva’s Method)
OPEN FRAME (Silva’s Method)
Limit State Sd
βM(ds) βC βd βds (m)
LS1 0.0217 0.4000 0.4672 0.4500 0.4519 LS2 0.0526 0.4000 0.4672 0.4500 0.4519 LS3 0.1188 0.4000 0.4672 0.4500 0.4519
INFILLED FRAME (Silva’s Method)
Limit State Sd
βM(ds) βC βd βds (m)
LS1 0.0270 0.4000 0.4672 0.4500 0.4519 LS2 0.1158 0.4000 0.4672 0.4500 0.4519 LS3 0.2183 0.4000 0.4672 0.4500 0.4519
11
MATEC Web of Conferences 195, 02017 (2018) https://doi.org/10.1051/matecconf/201819502017ICRMCE 2018
structural capacity. The value of βC is 0.4672. This value is obtained from the variation of structural capacity when the structure is imposed by spectral acceleration in the range of 0.0 to 2.0 g [25]. All the three standard deviations are finally used to calculate the standard deviation of the total uncertainty (βds) using Equation 15. The results are summarized in Table 6 and 7. Table 6. The standard deviations for spectral displacement using inter-story drift ratio HAZUS-MH
MR5 (top) and ATC-40 (bottom).
OPEN FRAME (HAZUS-MH MR5)
Limit State Sd βM(ds) βC βd βds (m) Slight 0.0184 0.4000 0.4672 0.4500 0.4519
Moderate 0.0368 0.4000 0.4672 0.4500 0.4519 Extensive 0.0920 0.4000 0.4672 0.4500 0.4519 Complete 0.2146 0.4000 0.4672 0.4500 0.4519
INFILLED FRAME (HAZUS-MH MR5)
Limit State Sd βM(ds) βC βd βds (m) Slight 0.0187 0.4000 0.4672 0.4500 0.4519
Moderate 0.0374 0.4000 0.4672 0.4500 0.4519 Extensive 0.0935 0.4000 0.4672 0.4500 0.4519 Complete 0.2183 0.4000 0.4672 0.4500 0.4519
OPEN FRAME (ATC 40)
Limit State Sd βM(ds) βC βd βds (m) IO 0.0920 0.4000 0.4672 0.4500 0.4519 LS 0.1840 0.4000 0.4672 0.4500 0.4519 SS 1.1812 0.4000 0.4672 0.4500 0.4519
INFILLED FRAME (ATC 40)
Limit State Sd βM(ds) βC βd βds (m) IO 0.0935 0.4000 0.4672 0.4500 0.4519 LS 0.1871 0.4000 0.4672 0.4500 0.4519 SS 1.6072 0.4000 0.4672 0.4500 0.4519
Table 7. Dispersion structure for spectral displacement using base shear capacity (Silva’s Method)
OPEN FRAME (Silva’s Method)
Limit State Sd
βM(ds) βC βd βds (m)
LS1 0.0217 0.4000 0.4672 0.4500 0.4519 LS2 0.0526 0.4000 0.4672 0.4500 0.4519 LS3 0.1188 0.4000 0.4672 0.4500 0.4519
INFILLED FRAME (Silva’s Method)
Limit State Sd
βM(ds) βC βd βds (m)
LS1 0.0270 0.4000 0.4672 0.4500 0.4519 LS2 0.1158 0.4000 0.4672 0.4500 0.4519 LS3 0.2183 0.4000 0.4672 0.4500 0.4519
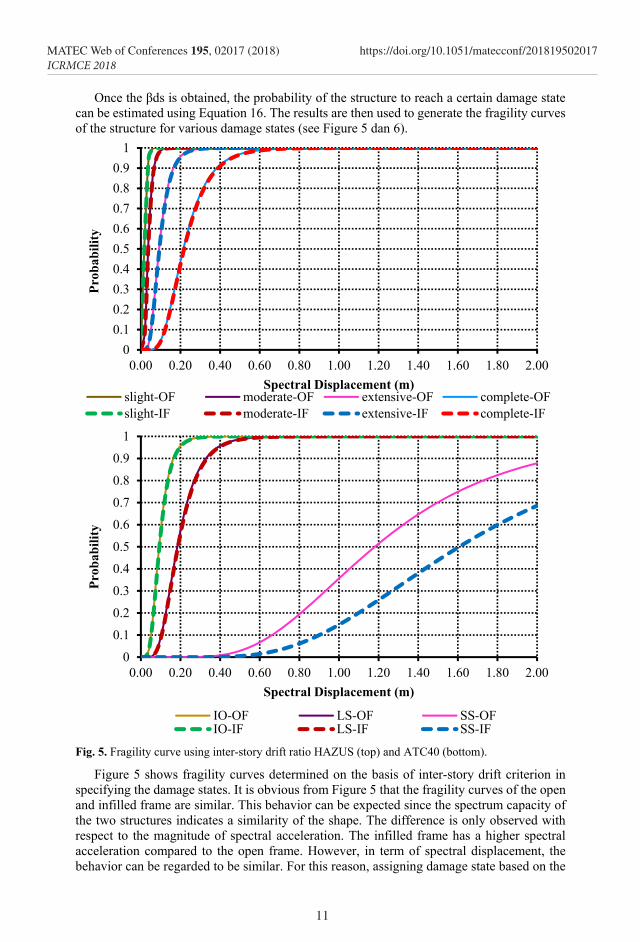
Once the βds is obtained, the probability of the structure to reach a certain damage state can be estimated using Equation 16. The results are then used to generate the fragility curves of the structure for various damage states (see Figure 5 dan 6).
Fig. 5. Fragility curve using inter-story drift ratio HAZUS (top) and ATC40 (bottom).
Figure 5 shows fragility curves determined on the basis of inter-story drift criterion in specifying the damage states. It is obvious from Figure 5 that the fragility curves of the open and infilled frame are similar. This behavior can be expected since the spectrum capacity of the two structures indicates a similarity of the shape. The difference is only observed with respect to the magnitude of spectral acceleration. The infilled frame has a higher spectral acceleration compared to the open frame. However, in term of spectral displacement, the behavior can be regarded to be similar. For this reason, assigning damage state based on the
00.10.20.30.40.50.60.70.80.9
1
0.00 0.20 0.40 0.60 0.80 1.00 1.20 1.40 1.60 1.80 2.00
Prob
abili
ty
Spectral Displacement (m)slight-OF moderate-OF extensive-OF complete-OFslight-IF moderate-IF extensive-IF complete-IF
00.10.20.30.40.50.60.70.80.9
1
0.00 0.20 0.40 0.60 0.80 1.00 1.20 1.40 1.60 1.80 2.00
Prob
abili
ty
Spectral Displacement (m)
IO-OF LS-OF SS-OFIO-IF LS-IF SS-IF
12
MATEC Web of Conferences 195, 02017 (2018) https://doi.org/10.1051/matecconf/201819502017ICRMCE 2018
inter-story drift criterion tends to give a similar spectral displacement at which the damage state occurs. Consequently, the fragility curve of the open and infilled frame will be alike. The exception is found on the fragility curve for the structural stability (SS) criterion of ATC 40. The method of ATC 40 determines the inter-story drift criterion for the SS is based on the ratio of lateral force to gravity load. Thus, the criterion is basically related to the magnitude of base shear (spectral acceleration). As a result, the fragility curve of the open frame and the infilled frame show a distinctive shape.
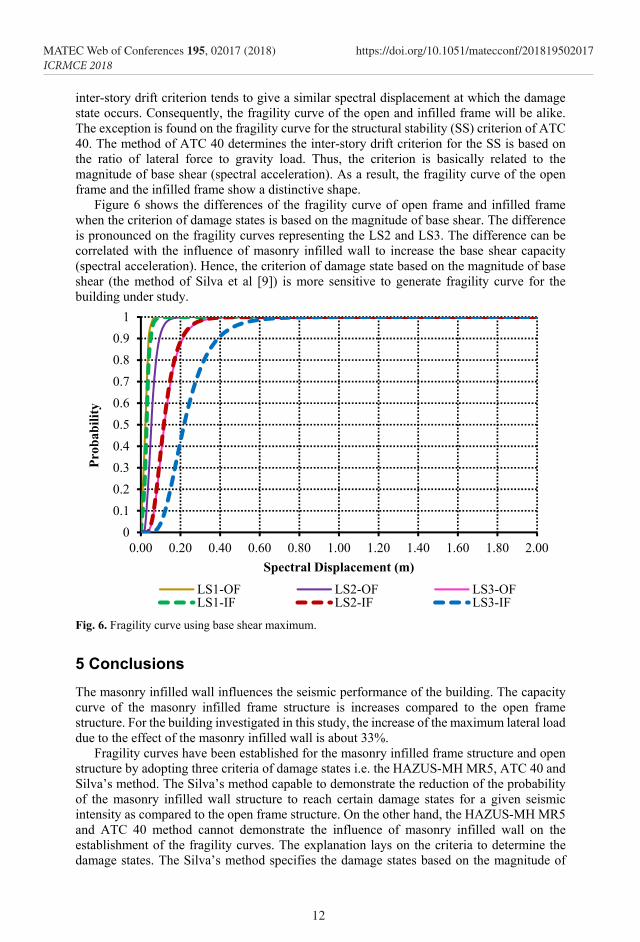
Figure 6 shows the differences of the fragility curve of open frame and infilled frame when the criterion of damage states is based on the magnitude of base shear. The difference is pronounced on the fragility curves representing the LS2 and LS3. The difference can be correlated with the influence of masonry infilled wall to increase the base shear capacity (spectral acceleration). Hence, the criterion of damage state based on the magnitude of base shear (the method of Silva et al [9]) is more sensitive to generate fragility curve for the building under study.
Fig. 6. Fragility curve using base shear maximum.
5 Conclusions The masonry infilled wall influences the seismic performance of the building. The capacity curve of the masonry infilled frame structure is increases compared to the open frame structure. For the building investigated in this study, the increase of the maximum lateral load due to the effect of the masonry infilled wall is about 33%.
Fragility curves have been established for the masonry infilled frame structure and open structure by adopting three criteria of damage states i.e. the HAZUS-MH MR5, ATC 40 and Silva’s method. The Silva’s method capable to demonstrate the reduction of the probability of the masonry infilled wall structure to reach certain damage states for a given seismic intensity as compared to the open frame structure. On the other hand, the HAZUS-MH MR5 and ATC 40 method cannot demonstrate the influence of masonry infilled wall on the establishment of the fragility curves. The explanation lays on the criteria to determine the damage states. The Silva’s method specifies the damage states based on the magnitude of
00.10.20.30.40.50.60.70.80.9
1
0.00 0.20 0.40 0.60 0.80 1.00 1.20 1.40 1.60 1.80 2.00
Prob
abili
ty
Spectral Displacement (m)LS1-OF LS2-OF LS3-OFLS1-IF LS2-IF LS3-IF
13
MATEC Web of Conferences 195, 02017 (2018) https://doi.org/10.1051/matecconf/201819502017ICRMCE 2018
inter-story drift criterion tends to give a similar spectral displacement at which the damage state occurs. Consequently, the fragility curve of the open and infilled frame will be alike. The exception is found on the fragility curve for the structural stability (SS) criterion of ATC 40. The method of ATC 40 determines the inter-story drift criterion for the SS is based on the ratio of lateral force to gravity load. Thus, the criterion is basically related to the magnitude of base shear (spectral acceleration). As a result, the fragility curve of the open frame and the infilled frame show a distinctive shape.
Figure 6 shows the differences of the fragility curve of open frame and infilled frame when the criterion of damage states is based on the magnitude of base shear. The difference is pronounced on the fragility curves representing the LS2 and LS3. The difference can be correlated with the influence of masonry infilled wall to increase the base shear capacity (spectral acceleration). Hence, the criterion of damage state based on the magnitude of base shear (the method of Silva et al [9]) is more sensitive to generate fragility curve for the building under study.
Fig. 6. Fragility curve using base shear maximum.
5 Conclusions The masonry infilled wall influences the seismic performance of the building. The capacity curve of the masonry infilled frame structure is increases compared to the open frame structure. For the building investigated in this study, the increase of the maximum lateral load due to the effect of the masonry infilled wall is about 33%.
Fragility curves have been established for the masonry infilled frame structure and open structure by adopting three criteria of damage states i.e. the HAZUS-MH MR5, ATC 40 and Silva’s method. The Silva’s method capable to demonstrate the reduction of the probability of the masonry infilled wall structure to reach certain damage states for a given seismic intensity as compared to the open frame structure. On the other hand, the HAZUS-MH MR5 and ATC 40 method cannot demonstrate the influence of masonry infilled wall on the establishment of the fragility curves. The explanation lays on the criteria to determine the damage states. The Silva’s method specifies the damage states based on the magnitude of
00.10.20.30.40.50.60.70.80.9
1
0.00 0.20 0.40 0.60 0.80 1.00 1.20 1.40 1.60 1.80 2.00
Prob
abili
ty
Spectral Displacement (m)LS1-OF LS2-OF LS3-OFLS1-IF LS2-IF LS3-IF
base shear (spectral acceleration) while the other methods are based on the inter-story drift. Hence, an increase of base shear capacity due to the masonry infilled wall can only be shown by the fragility curve determined using Silva’s method.
References 1. M. Sukrawa, Penyertaan Dinding Pengisi Dalam Pemodelan Kerangka Beton Bertulang
Dan Pengaruhnya Terhadap Hasil Perencanaan Struktur, Prosiding Konferensi Nasional Teknik Sipil, 4, S401-S408 (2010)
2. A. Gautham, K. G. Krishna, Mater. Tod.: Proc., 4, 10565-10569 (2017) 3. F. J. Crisafulli, Seismic Behaviour of Reinforced Concrete Structures with Masonry
Infills (Thesis, University of Canterbury, New Zealand, 1997) 4. H. Crowley, R. Pinho, Simplified Equations for Estimating the Period of Vibration of
Existing Buildings, First European Conference on Earthquake Engineering and Seismology, 1122 (2006)
5. S. N. A. Saruddin, F. M. Nazri, Proc. Eng., 125, 873-878 (2015) 6. D. Cardone, M. Rossino, G. Gesualdi, Soil. Dyn. Earthq. Eng. (article in press) (2017) 7. FEMA. HAZUS-MH MR5, Advanced Engineering Building Module (AEBM) (Federal
Emergency Management Agency, Washington, DC, 2010) 8. ATC-40, Seismic Evaluation and Retrofit of Concrete Buildings (Applied Technology
Council Redwood City, CA, volume 1, 1996) 9. V. Silva, H. Varum, H. Crowley, R. Sousa, R. Pinho, Evaluation of Analytical
Methodologies to Derive Vulnerability Functions, 15th World Conference Earthquake Engingeering, (2012)
10. J. B. Mander, M. J. N. Priestley and R. Park, ASCE J. Struct. Eng., 114, 1804-1826 (1988)
11. M. Menegotto and P. E. Pinto, Method of Analysis for Cyclically Loaded R.C. Plane Frames Including Changes in Geometry and Non-elastic Behaviour of Elements under Combined Normal Force and Bending, Symposium on the Resistance and Ultimate Deformability of Structures Acted on by Well Defined Repeated Loads, Zurich, Switzerland (1973)
12. F. C. Filippou, E. P. Popov and V. V. Bertero, ASCE J. Struct. Eng., 109, 2666-2684 (1983)
13. F. J. Crisafulli, A. J. Carr, Bull. N.Z. Soc. Earth. Eng., 40, 69-77 (2007) 14. B. E. Wahyudianto, Tinjauan Kuat Tekan dan Kuat Lentur Dinding Pasangan Batu Bata
dengan Perkuatan Diagonal Tulangan Baja (Skripsi, Universitas Muhamadiyah Surakarta, 2016)
15. E. Smyrou, Implementation and Verification of a Masonry Panel Model for Nonlinear Dynamic Analysis of Infilled RC Frames (Dissertation, University of Pavia, Italy, 2006)
16. G. J. W. King and P. C. Pandey, Proc. Inst. Civ. Eng., Part 2, 65, 749-760 (1978) 17. F. da Porto, G. Guidi, M. D. Benetta, N. Verlato, combined in-plane/out-of-plane
experimental behaviour of reinforced and strengthened infill masonry walls, 12th
Canadian Masonry Symposium, (2013) 18. R. E. Klingner and V. V. Bertero, ASCE J. Struct. Div., 104, 973-989 (1978) 19. FEMA 356, Pre-standard and Commentary for the Seismic Rehabilitation of Buildings,
(Federal Emergency Management Agency, Washington, DC, 2000)
14
MATEC Web of Conferences 195, 02017 (2018) https://doi.org/10.1051/matecconf/201819502017ICRMCE 2018
20. A. Meslem, D. D’Ayala, Toward Worldwide Guidelines for the Development of Analytical Vulnerability Functions and Fragility Curves at Regional Level, 15th World Conference Earthquake Engineering. (2012)
21. SeismoSoft, Seismostruct-a computer program for static and dynamic nonlinear analysis of framed structures, Available from URL:http//www.seismosoft.com (2006)
22. T. Choudhury, H.B. Kaushik, Eng. Struct., 155, 1-13 (2017) 23. A. Papailia, Seismic fragility curves for reinforced concrete buildings (Dissertation
Submitted in Partial Fulfilment of the Requirements for the Master Degree, University of Patras, 2011)
24. Eurocode 8, Design of Structure for Earthquake Resistance-Part 3: Assessment and Retrofitting of Buildings (British Standard, 389 Chiswick High Road, London W4 4AL, 2006)
25. N. Astuti, Rapid and in-depth Analysis for Seismic Risk Evaluation (Thesis, Sebelas Maret University, Surakarta, 2017)
Related Documents


