For Peer Review Seismic moment tensors of the April 2009, L'Aquila (Central Italy), earthquake sequence Journal: Geophysical Journal International Manuscript ID: Draft Manuscript Type: Express Letter Keywords: Earthquake source observations < SEISMOLOGY, Seismicity and tectonics < SEISMOLOGY, Continental tectonics: extensional < TECTONOPHYSICS Geophysical Journal International

Welcome message from author
This document is posted to help you gain knowledge. Please leave a comment to let me know what you think about it! Share it to your friends and learn new things together.
Transcript

For Peer Review
Seismic moment tensors of the April 2009, L'Aquila (Central
Italy), earthquake sequence
Journal: Geophysical Journal International
Manuscript ID: Draft
Manuscript Type: Express Letter
Keywords:
Earthquake source observations
<
SEISMOLOGY, Seismicity and tectonics
<
SEISMOLOGY, Continental tectonics: extensional
<
TECTONOPHYSICS
Geophysical Journal International

For Peer Review
Seismic moment tensors of the April 2009, L'Aquila (Central Italy),
earthquake sequence
Pondrelli S.1, Salimbeni S. 1, Morelli A. 1, Ekström G. 2, Olivieri M. 3, Boschi E. 4
1 Istituto Nazionale di Geofisica e Vulcanologia, Sezione di Bologna, Via D. Creti 12,
40128 Bologna, Italy
2 Lamont-Doherty Earth Observatory, Columbia University, NY, USA
3 Istituto Nazionale di Geofisica e Vulcanologia, CNT, Via di Vigna Murata 605, 00143
Rome, Italy
4 Istituto Nazionale di Geofisica e Vulcanologia, Via di Vigna Murata 605, 00143 Rome,
Italy
Accepted date: Received date ; in original form date
Short Title: RCMTs for April 2009, L'Aquila (Central Italy), earthquakes
Corresponding author: Pondrelli S., Istituto Nazionale di Geofisica e Vulcanologia,
Sez. di Bologna, Via D. Creti 12, 40128 Bologna, Italy; [email protected]; Fax: +39
0514151499
Page 1 of 21 Geophysical Journal International
123456789101112131415161718192021222324252627282930313233343536373839404142434445464748495051525354555657585960

For Peer Review
Summary
On April 6, 2009, the Central Apennines were hit by a Mw=6.3 earthquake. The region
had been shaken since October 2008 by seismic activity that culminated in two
foreshocks with Mw>4, one week and a few hours before the main shock. We computed
seismic moment tensors for 26 events with Mw between 3.9 and 5.5, using the Regional
Centroid Moment Tensor (RCMT) scheme. Most of these source parameters have been
computed within one hour after the earthquake and rapidly revised successively. The
focal mechanisms are all extensional, with a variable and sometimes significant strike-
slip component. This geometry agrees with the NE-SW extensional deformation of the
Apennines, known from previous seismic and geodetic observations. Events group into
three clusters. Those located in the southern area have larger centroid depths and a wider
distribution of T-axis directions. These differences suggest that towards south a different
fault system was activated with respect to the SW-dipping normal faults beneath L'Aquila
and more to the north. These considerations and other analyses have been possible for the
rapid availability of these robust moment tensors.
Key-words: seismic moment tensor, seismotectonics, Apennines, Central Italy
Page 2 of 21Geophysical Journal International
123456789101112131415161718192021222324252627282930313233343536373839404142434445464748495051525354555657585960

For Peer Review
Introduction
The Italian Apennines are seat of extensional deformation, concentrated along the inner
part of the mountain belt. This phenomenon is a relict of the process, driven by the rolling
back subduction of Adriatic plate, that lead to the opening of the Tyrrhenian back-arc
basin (Facenna et al., 2004). This NE-SW trending deformation reaches velocities up to 3
mm/yr (D’Agostino et al., 2008). Seismic activity is well known, both historically and
instrumentally, and it is spread along the whole length of the mountain chain. Seismic
hazard is high all along the Apennines (MPS Working Group, 2004). Typically,
earthquakes along Central-Southern Apennines show normal faulting mechanisms and
focal depths in the upper 15 km of crust (Vannucci et al., 2004). The most recent
examples are the 1915, M=6.9 Avezzano event (Amoruso et al., 1998); 1930, M=6.7 and
1980, M=6.9, Irpinia events (Pino et al., 2008); the 1979, Mw=5.9 Valnerina quake
(Boschi et al., 2000); the 1997-1998 Umbria-Marche sequence, that included two events
with Mw=5.7 and Mw=6.0 (Ekström et al., 1998). Another recent sequence — 2002,
Mw=5.7, S. Giuliano di Puglia twin events — showed instead strike-slip character. It was
located off mountain chain, and it has been attributed to deformation within the Adriatic
Plate descending beneath the Apennines (Di Luccio et al., 2005)
On April 6, 2009, a Mw=6.3 earthquake occurred in Central Italy, with shallow
hypocenter located at the outskirts of the city of L'Aquila, in the Abruzzo region, causing
extensive damage and casualties (Figure 1). It followed a seismic activity that initiated in
October 2008 and culminated with the Mw=4.4 event of March 30, and the Mw=4.2
earthquake, a few hours before the main shock (Figure 1 and Tables in supplementary
material). Thousands of aftershocks have been recorded. Seismic activity in this region
Page 3 of 21 Geophysical Journal International
123456789101112131415161718192021222324252627282930313233343536373839404142434445464748495051525354555657585960

For Peer Review
had been scarce during past few decades, with only three seismic swarms in 1985 (Ml
4.2), 1994 (Ml 3.9) and 1996 (Ml 4.1) as reported in Catalogo della Sismicità Italiana
(CSI, Castello et al., 2007). Historical records show instead the occurrence of destructive
events, with at least two of them — in 1461 and 1703 — reaching intensities up to X
(Gruppo di Lavoro CPTI, 2004). The epicentral area had been identified before the
earthquake as a region of higher-than-average earthquake probability, in particular along
the Apennines axis (Akinci et al., 2009; Faenza et al., 2003).
Here, we report on source geometries of the L'Aquila seismic sequence. We computed 26
moment-tensor solutions using the same technique we apply to maintain the European-
Mediterranean Regional Centroid Moment Tensor (RCMT) Catalog
(www.bo.ingv.it/RCMT; Pondrelli et al., 2006 and references therein). They are greatly
in agreement with seismotectonics of the region. Comparing definitive to Quick RCMTs
computed immediately after the earthquakes, we found really smaller adjustments to
quick determinations. This highlights the robustness of RCMT solutions, considering that
timely publication of moment tensors for main events of a sequence is a functional tool to
support ongoing studies as complex source description and hazard update.
Regional CMT solutions: data analysis
We compute seismic moment tensors using an extension of the global CMT scheme,
based on fitting fundamental-mode Rayleigh and Love waves recorded at regional
distance (Arvidsson and Ekström, 1998). This process is particularly appropriate to study
intermediate-magnitude events, and produces robust seismic moment tensors and Mw,
fully compatible with other source parameters (e.g., Global CMTs, Ekström et al., 2005).
Page 4 of 21Geophysical Journal International
123456789101112131415161718192021222324252627282930313233343536373839404142434445464748495051525354555657585960

For Peer Review
We use three-component seismograms, low-pass filtered with cut-off frequencies ranging
from 1/30 to 1/50 Hz, depending on magnitude, to select the broadest spectrum with good
signal-to-noise ratio. When signal-to-noise ratio allows it, long-period body waves are
added in the inversion, as for 9 of the 26 RCMTs computed for this sequence (Figure and
Table 2 in Supplementary Material). Data retrieval and pre-processing are done
automatically, but each inversion is always controlled and reviewed by an operator. We
commonly use 5 to 15 stations with a distance range between 3 to 15 degrees, belonging
to MedNet and GEOFON networks. Located closer to the source region, these stations
are the most useful to study European-Mediterranean smaller magnitude events, and
provide good azimuthal coverage. When new seismograms from other networks become
available through ORFEUS (www.orfeus.org), we revise and update the solutions. Here
we present the definitive RCMTs for 26 events with a Mw between 3.9 and 6.3, including
the two greater foreshocks of March, 30 and April, 5 (Tables in supplementary material).
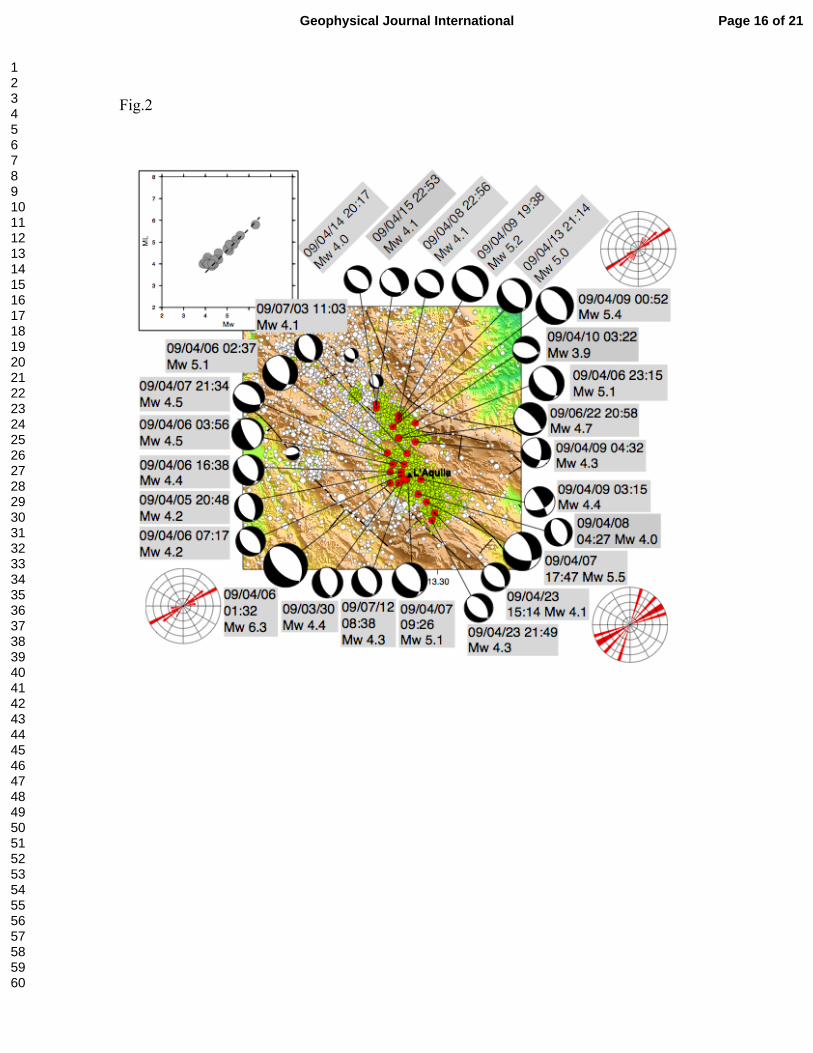
NW-SE striking extensional moment tensors dominate, with tensional axes oriented
between 40° and 60° (Figure 2). Only in a few cases, a pronounced strike-slip component
characterizes the source geometry as for the April 7, 17:47 aftershock. Most of these
solutions have “A“ quality flag, that means greatest stability (see Pondrelli et al., 2006 for
quality evaluation); only four smaller magnitude events have a “C” flag because their
inversion required to fix the location (Table 2 in Supplementary Material). Centroid depth
of all solutions is in general agreement with preliminary locations; only two cases have a
final location 5 km deeper with respect to initial one. Most events have the typical depth,
within the top 15 km, of seismic sequences occurred previously in the Apennines. Only a
few of them are deeper, down to 26 km, mainly those located southward and with a more
Page 5 of 21 Geophysical Journal International
123456789101112131415161718192021222324252627282930313233343536373839404142434445464748495051525354555657585960

For Peer Review
prominent strike-slip component (Tables in Supplementary Material). A comparison with
solutions produced by other groups with other techniques (www.csem-eu.org; http;
TDMT on earthquakes.rm.ingv.it) shows an unquestionable similarity of focal
geometries. Our Mw values are in good agreement with those from other agencies,
mainly for greater events and have a regular behaviour respect to ML (Figure 2).
Comparing definitive RCMTs to Quick RCMTs computed (when M>4.0) within one
hour after the earthquake occurred, we found really small changes to quick
determinations. This promotes the robust reliability of QRCMTs, at least for the Central
Mediterranean, where on-line seismograms ensure a fast and good azimuthal coverage.
RCMT solutions in a seismotectonic framework
The extensional geometry of mechanisms of L’Aquila earthquakes is the same of other
important seismic sequences along the Apennines, such as the 1980, M=6.9, Irpinia
earthquake and the Umbria-Marche seismic sequence in 1997-1998. The seismic
sequence started beneath the city of L’Aquila and spread along a 40 km area into three
main clusters (Figures 1 and 2). This migration of hypocenters was also seen in the 1997-
1998 Umbria-Marche sequence. The foreshocks, the main shock and most of the activity
of the first three days are part of the central cloud of seismicity, located beneath the town.
The seismic activity that preceeded the sequence and the two main foreshocks also
occurred in this area (Figures 1 and 2). All RCMTs of this central cluster have a shallow
centroid depth (within 14 km). The northern seismicity cluster activated just after the
main shock (Mw=5.1 on April 6, at 23:15, Table 1 in supplementary material) and
continued with its northernmost expression with the two Mw 4.0 and 4.1 events on April
Page 6 of 21Geophysical Journal International
123456789101112131415161718192021222324252627282930313233343536373839404142434445464748495051525354555657585960

For Peer Review
14 and 15. Depths for two of these events exceed 15 km. The southern seismicity cluster
started later, with the Mw 5.6 aftershock, on April 7. Here are located the deepest events
of the sequence, with hypocentral centroid locations deeper than 20 km and characterized
also by a consistent strike-slip component. The T axes distribution is NE-SW, roughly
perpendicular to the Apennines, in the central and northern seismicity clusters, whereas
the southern one is more heterogeneous (Figure 2).
The location and focal mechanism for the main shock suggest that this event occurred on
the Paganica fault, a 10-15 km length, NW-SE striking, SW-dipping structure previously
identified in the field (Vezzani e Ghisetti, 1998). The geometry of this fault is in
agreement with our source parameters. This hypothesis was supported also by aftershock
distribution (Chiarabba et al., 2009), DinSAR analysis (Atzori et al., 2009), geodetic and
geological surveys (Anzidei et al., 2009; Emergeo Working Group, 2009). The northern
cluster of the sequence shows a distribution that may be in agreement with an activation
of the Campotosto fault, another normal fault, NNW-SSE striking and SW dipping (Galli
et al., 2008; Boncio et al., 2004). Also our focal mechanisms are in agreement with the
geometry of this fault. The southernmost cluster, where events with deeper location and
with a greater strike-slip component are located, has a less-clear geometry and appears to
be connected to a different system of faults. In this area previous studies identified the
NNW-SSE Mt. Ocre fault system (Salvi et al., 2003). Because of its strike direction, it
could be related to the present-day seismicity that at south privileges a NNW-SSE trend,
rotated with respect to the NW-SE distribution of the two other clusters. However, at
south the poor definition of any structure from hypocentral location makes any relation
more doubtful.
Page 7 of 21 Geophysical Journal International
123456789101112131415161718192021222324252627282930313233343536373839404142434445464748495051525354555657585960

For Peer Review
Deeper events also showed relevant strike-slip components in previous Apenninic
seismic sequences, such as in the 1997-1998 Umbria-Marche sequence (Ekström et al.,
1998) or in the 2002 S. Giuliano di Puglia sequence (Di Luccio et al., 2005). This vertical
distribution of deformation styles is interpreted as an extension working on the thrust and
fold belt while deeper deformation occurs within the Adria plate located beneath the belt.
Conclusions
We computed seismic moment tensors for 26 events with Mw between 3.9 and 6.3
belonging to the 2009 L’Aquila (Central Italy) seismic sequence. RCMTs gave
immediately the indication that this seismicity, from the seismotectonic point of view, is
similar to previous extensional activity occurred along this mountain belt, also in the
vertical distribution of hypocenters and deformation styles. NW-SE striking focal planes
agree with mapped faults of the region, allowing to infer which tectonic structures have
been activated. For some events a relevant strike-slip component is observed, mainly
when the hypocenters are deeper. This occurs mainly at south with respect to the entire
activated region.
Seismotectonic analysis of the ongoing seismic sequence has been supported by the
prompt availability of RCMTs, quick solutions first and definitive solutions successively.
Our results provide crucial information for a number of ongoing studies about different
aspects of the seismic sources. We conclude on the feasibility and importance of
application of our inversion scheme for the early and reliable analysis of seismic
sequences.
Acknowledgments
Page 8 of 21Geophysical Journal International
123456789101112131415161718192021222324252627282930313233343536373839404142434445464748495051525354555657585960

For Peer Review
We thank all operators involved in station maintenance and data management at MedNet,
GEOFON and ORFEUS. Figures are drawn using GMT (Wessel and Smith, 1998).
Page 9 of 21 Geophysical Journal International
123456789101112131415161718192021222324252627282930313233343536373839404142434445464748495051525354555657585960

For Peer Review
References
Akinci, A., Galadini, F., Pantosti, D., Petersen, M., Malagnini, L. & Perkins, D., 2009.
Effect of time dependence on probabilistic seismic-hazard maps and
deaggregation for the Central Apennines, Italy, Bull. Seismol. Soc. Am., 99(2A),
585-610.
Amoruso, A., Crescentini, L. & Scarpa, R. 1998. Inversion of source parameters from
near and far field observations: An application to the 1915 Fucino earthquake,
Central Apennines, J. Geophys. Res., 103, 29.989-29.999.
Anzidei, M., Boschi, E., Cannelli, V., Devoti, R., Esposito, A., Galvani, A., Melini, D.,
Pietrantonio, G., Riguzzi, F., Sepe, V. & Serpelloni, E., 2009. Coseismic
deformation of the destructive April 6, 2009 L’Aquila earthquake (central Italy)
from GPS data, Geophys. Res. Lett., 36, doi:10.1029/2009GL039145.
Arvidsson, R. & Ekström, G., 1998. Global CMT Analysis of Moderate Earthquakes
Mw≥4.5 using Intermediate Period Surface Waves, Bull. Seismol. Soc. Am., 88,
1003-1013.
Atzori, S., Hunstad, I., Chini, M., Salvi, S., Tolomei, C., Bignami, C., Stramondo, S.,
Trasatti, E., Antonioli, A. & Boschi, E., 2009. Finite fault inversion of DinSAR
coseismic displacement of the 2009 L’Aquila earthquake (Central Italy), Geophy.
Res. Lett., in press.
Boncio, P., Lavecchia, G., Milana, G. & Rozzi, B., 2004. Seismogenesis in Central
Apennines, Italy: an integrated analysis of minor earthquake sequences and
structural data in the Amatrice-Campotosto area, Annals of Geophysics, 47, 6,
1723-1742.
Page 10 of 21Geophysical Journal International
123456789101112131415161718192021222324252627282930313233343536373839404142434445464748495051525354555657585960

For Peer Review
Boschi, E., Guidoboni, E., Ferrari, G., Mariotti, D., Valensise, G. & Gasperini, P. (eds.),
2000), Catalogue of Strong Italian Earthquakes from 461 B.C. to 1997, Ann.
Geofis., 43, 609-868.
Castello, B., Olivieri, M. & Selvaggi, G., 2007. Local and duration magnitude
determination for the Italian earthquake catalogue (1981-2002), Bull. Seism. Soc.
Am., 97, 1B, 128-139.
D’Agostino, N., Avallone, A., Cheloni, D., D’Anastasio, E., Mantenuto, S. & Selvaggi,
G., 2008. Active tectonics of the Adriatic region from GPS and earthquake slip
vectors, J. Geophys.. Res., 113, B12413.
Di Luccio, F., Fukuyama, E. & Pino, N. A., 2005. The 2002 Molise earthquake sequence:
What can we learn about the tectonics of southern Italy? Tectonophysics, 405, 1-4,
141-154.
Ekström, G., Morelli, A., Boschi, E. & Dziewonski, A. M., 1998. Moment tensor analysis
of the central Italy earthquake sequence of September-October 1997, Geophys.
Res. Lett., 25, 1971-1974.
Ekström, G., Dziewonski, A. M., Maternovskaya, N. N. & Nettles, M., 2005. Global
seismicity of 2003: Centroid-moment tensor solutions for 1087 earthquakes, Phys.
Earth Planet. Int., 148, 327-351.
Emergeo Working Group, 2009. Rilievi geologici di terreno effettuati nell’area
epicentrale della sequenza sismica dell’Aquilano del 6 aprile 2009, in italian,
available at http://portali.ingv.it/primo-piano/archivio-primo-piano/notizie-
2009/terremoto-6-aprile/copy_of_la-sequenza-dell-aquilano-aprile-2009/
Faccenna, C., Piromallo, C., Crespo-Blanc, A., Jolivet, L. & Rossetti, F., 2004. Lateral
Page 11 of 21 Geophysical Journal International
123456789101112131415161718192021222324252627282930313233343536373839404142434445464748495051525354555657585960

For Peer Review
slab deformation and the origin of the western Mediterranean arcs, Tectonics, 23,
TC1012.
Faenza, L., Marzocchi, W. & Boschi, E., 2003. A non-parametric hazard model to
characterize the spatio-temporal occurrence of large earthquakes; an application to
the Italian catalogue. Geophy. J. Int., 155, 521-531
Galli, P., Galadini, F. & Pantosti, D., 2008. Twenty years of paleoseismology in Italy,
Earth-Science Reviews, 88, 89-117.
Gruppo di lavoro CPTI, 2004. Catalogo Parametrico dei Terremoti Italiani, INGV,
Bologna, http://emidius.mi.ingv.it/CPTI04/.
MPS Working Group, 2004. Redazione della mappa di pericolosità sismica prevista
dall’Ord. PCM 3274 del 20/03/2003. Rapporto Conclusivo per il Dip. Prot. Civ.,
INGV, Milano-Roma, pp 65, http://zonesismiche.mi.ingv.it.
Pino, N. A., Palombo, B., Ventura, G., Perniola, B. & Ferrari, G., 2008. Waveform
modeling of historical seismograms of the 1930 Irpinia earthquake provides
insight on “blind” faulting in Southern Apennines (Italy), J. Geophys. Res., 113,
B05303.
Pondrelli, S., Salimbeni, S., Ekström, G., Morelli, A., Gasperini, P. & Vannucci, G.,
2006. The Italian CMT dataset from 1977 to the present, Phys. Earth Planet. Int.,
159, 286-303.
Salvi, S., Cinti, F. R., Colini, L., D'addezio, G., Doumaz, F. & Pettinelli, E., 2003.
Investigation of the active Celano-L'Aquila Fault System, Abruzzi (Central
Apennines, Italy) with combined ground-penetrating radar and palaeoseismic
trenching, Geophys. J. Int., 155, 805-818.
Page 12 of 21Geophysical Journal International
123456789101112131415161718192021222324252627282930313233343536373839404142434445464748495051525354555657585960

For Peer Review
Vannucci, G., Pondrelli, S., Argnani, A., Morelli, A., Gasperini, P. & Boschi, E., 2004.
An Atlas of Mediterranean seismicity, Annals of Geophysics, 47, 1, 334 pp.
Vezzani, L. & Ghisetti, F., 1998. Carta Geologica dell’Abruzzo, scale 1:100,000.
S.EL.CA., Firenze.
Wessel, P. & Smith, W. H. F., 1998. New improved version of the Generic Mapping
Tools Released, Eos Trans. AGU, 79, 579.
Page 13 of 21 Geophysical Journal International
123456789101112131415161718192021222324252627282930313233343536373839404142434445464748495051525354555657585960

For Peer Review
Figure captions
Figure 1 - Map of seismicity. Blue stars – events of the sequence with Ml >5.0; red
square – historical seismicity with Imax > 7.5 (Gruppo di Lavoro CPTI, 2004); white
circles – previous seismicity (Castello et al., 2007); grey circles –events from January to
April 2009; red circles– seismicity from April 6 to 9; orange – from 9 to 11; yellow –
from 11 to 30; light yellow – from May 1 to July 27 (iside.rm.ingv.it). Upper right: Italy
map with L’Aquila as a red square. Below: cumulative seismic energy release (joule)
from January to July 2009.
Figure 2 - RCMTs with their epicenters (in red) and the smaller magnitude seismicity of
the sequence (in yellow). In the background (white dots) previous seismicity (CSI,
Castello et al., 2007) and previous available RCMTs (small focal mechanisms, Pondrelli
et al., 2006; http://www.bo.ingv.it/RCMT/Italydataset.html). Upper left: Ml vs Mw in
comparison to the regression line for these kind of magnitudes (Gruppo di Lavoro CPTI,
2004). Upper right, lower left and right: rose diagrams representing respectively the
different T axes distribution in the three areas where seismicity occurred.
Page 14 of 21Geophysical Journal International
123456789101112131415161718192021222324252627282930313233343536373839404142434445464748495051525354555657585960

For Peer Review
Fig.1
Page 15 of 21 Geophysical Journal International
123456789101112131415161718192021222324252627282930313233343536373839404142434445464748495051525354555657585960
For Peer Review
Fig.2
Page 16 of 21Geophysical Journal International
123456789101112131415161718192021222324252627282930313233343536373839404142434445464748495051525354555657585960
For Peer Review
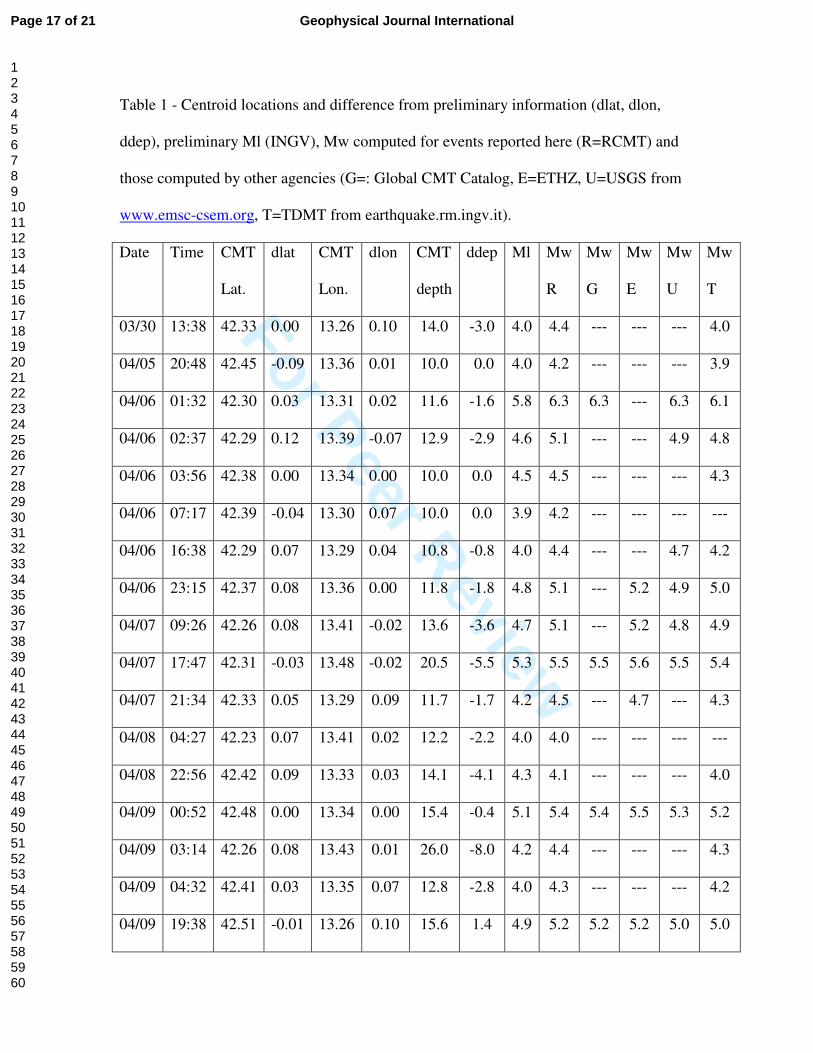
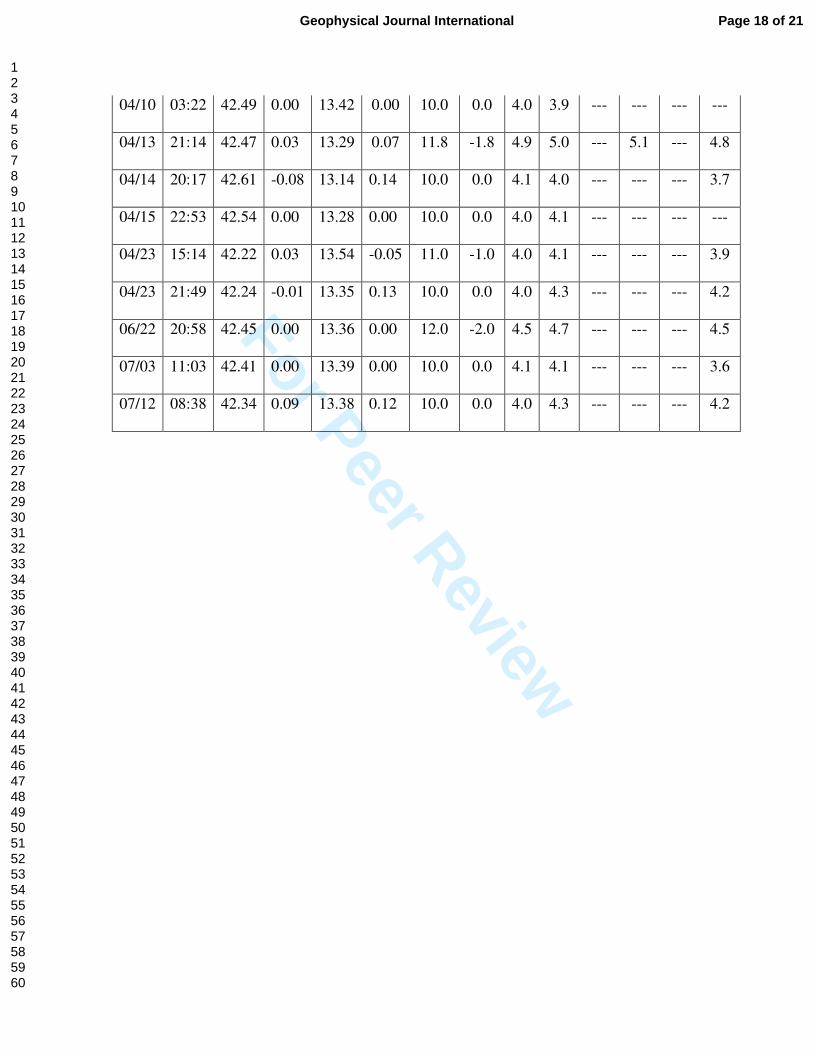
Table 1 - Centroid locations and difference from preliminary information (dlat, dlon,
ddep), preliminary Ml (INGV), Mw computed for events reported here (R=RCMT) and
those computed by other agencies (G=: Global CMT Catalog, E=ETHZ, U=USGS from
www.emsc-csem.org, T=TDMT from earthquake.rm.ingv.it).
Date Time CMT
Lat.
dlat CMT
Lon.
dlon CMT
depth
ddep Ml Mw
R
Mw
G
Mw
E
Mw
U
Mw
T
03/30 13:38 42.33 0.00 13.26 0.10 14.0 -3.0 4.0 4.4 --- --- --- 4.0
04/05 20:48 42.45 -0.09 13.36 0.01 10.0 0.0 4.0 4.2 --- --- --- 3.9
04/06 01:32 42.30 0.03 13.31 0.02 11.6 -1.6 5.8 6.3 6.3 --- 6.3 6.1
04/06 02:37 42.29 0.12 13.39 -0.07 12.9 -2.9 4.6 5.1 --- --- 4.9 4.8
04/06 03:56 42.38 0.00 13.34 0.00 10.0 0.0 4.5 4.5 --- --- --- 4.3
04/06 07:17 42.39 -0.04 13.30 0.07 10.0 0.0 3.9 4.2 --- --- --- ---
04/06 16:38 42.29 0.07 13.29 0.04 10.8 -0.8 4.0 4.4 --- --- 4.7 4.2
04/06 23:15 42.37 0.08 13.36 0.00 11.8 -1.8 4.8 5.1 --- 5.2 4.9 5.0
04/07 09:26 42.26 0.08 13.41 -0.02 13.6 -3.6 4.7 5.1 --- 5.2 4.8 4.9
04/07 17:47 42.31 -0.03 13.48 -0.02 20.5 -5.5 5.3 5.5 5.5 5.6 5.5 5.4
04/07 21:34 42.33 0.05 13.29 0.09 11.7 -1.7 4.2 4.5 --- 4.7 --- 4.3
04/08 04:27 42.23 0.07 13.41 0.02 12.2 -2.2 4.0 4.0 --- --- --- ---
04/08 22:56 42.42 0.09 13.33 0.03 14.1 -4.1 4.3 4.1 --- --- --- 4.0
04/09 00:52 42.48 0.00 13.34 0.00 15.4 -0.4 5.1 5.4 5.4 5.5 5.3 5.2
04/09 03:14 42.26 0.08 13.43 0.01 26.0 -8.0 4.2 4.4 --- --- --- 4.3
04/09 04:32 42.41 0.03 13.35 0.07 12.8 -2.8 4.0 4.3 --- --- --- 4.2
04/09 19:38 42.51 -0.01 13.26 0.10 15.6 1.4 4.9 5.2 5.2 5.2 5.0 5.0
Page 17 of 21 Geophysical Journal International
123456789101112131415161718192021222324252627282930313233343536373839404142434445464748495051525354555657585960
For Peer Review
04/10 03:22 42.49 0.00 13.42 0.00 10.0 0.0 4.0 3.9 --- --- --- ---
04/13 21:14 42.47 0.03 13.29 0.07 11.8 -1.8 4.9 5.0 --- 5.1 --- 4.8
04/14 20:17 42.61 -0.08 13.14 0.14 10.0 0.0 4.1 4.0 --- --- --- 3.7
04/15 22:53 42.54 0.00 13.28 0.00 10.0 0.0 4.0 4.1 --- --- --- ---
04/23 15:14 42.22 0.03 13.54 -0.05 11.0 -1.0 4.0 4.1 --- --- --- 3.9
04/23 21:49 42.24 -0.01 13.35 0.13 10.0 0.0 4.0 4.3 --- --- --- 4.2
06/22 20:58 42.45 0.00 13.36 0.00 12.0 -2.0 4.5 4.7 --- --- --- 4.5
07/03 11:03 42.41 0.00 13.39 0.00 10.0 0.0 4.1 4.1 --- --- --- 3.6
07/12 08:38 42.34 0.09 13.38 0.12 10.0 0.0 4.0 4.3 --- --- --- 4.2
Page 18 of 21Geophysical Journal International
123456789101112131415161718192021222324252627282930313233343536373839404142434445464748495051525354555657585960

For Peer Review
Table 2 - Qf is the Quality flag (Pondrelli et al., 2006), data used (S: only surface waves,
C: body and surface waves; * for RCMT recovered later), focal plane parameters and T
and P axes directions.
Date Time Qf Data str1 dip1 sl1. str2 dip2 sl2 T az T dip P az P dip
03/30 13:38 A S 2 35 -70 158 57 -104 258 11 31 74
04/05 20:49 A S* 147 37 -108 349 55 -77 70 9 300 76
04/06 01:32 A C 326 35 -80 134 56 -97 229 10 20 78
04/06 02:37 A S 355 46 -53 128 55 -122 240 5 341 64
04/06 03:56 C S* 340 25 -103 175 66 -84 260 21 96 68
04/06 07:17 A S* 138 41 -93 323 49 -87 51 4 261 86
04/06 16:38 A C 348 40 -64 135 55 -111 239 8 353 72
04/06 23:15 A C 341 44 -68 132 50 -109 236 3 339 75
04/07 09:26 A S 341 41 -64 128 54 -111 233 7 344 72
04/07 17:47 A C 105 53 -134 342 55 -48 44 1 312 57
04/07 21:34 A C 321 41 -64 108 54 -110 213 7 325 72
04/08 04:27 A S* 344 38 -84 156 52 -95 250 7 39 82
04/08 22:56 A S 319 40 -76 121 51 -101 219 5 340 80
04/09 00:52 C C 329 45 -81 136 46 -99 233 0 326 84
04/09 03:14 A S 67 50 -170 331 83 -40 25 21 281 33
04/09 04:32 A C 113 57 -144 2 61 -39 58 2 326 47
04/09 19:38 A C 321 44 -83 132 46 -97 227 1 331 85
04/10 03:22 C S* 91 41 -108 294 51 -75 14 5 260 77
04/13 21:14 A C 337 38 -71 133 54 -104 233 8 359 76
Page 19 of 21 Geophysical Journal International
123456789101112131415161718192021222324252627282930313233343536373839404142434445464748495051525354555657585960

For Peer Review
04/14 20:17 A S 309 42 -92 132 48 -88 221 3 65 87
04/15 22:53 C S* 113 33 -126 333 64 -69 48 17 279 65
04/23 15:14 A S 126 43 -105 326 49 -76 46 3 301 79
04/23 21:49 A S 323 27 -95 149 63 -87 237 18 65 72
06/22 20:58 C S 113 19 -112 315 72 -83 29 27 236 62
07/03 11:03 C S 144 42 -108 348 50 -74 67 4 318 77
07/12 08:38 A S 342 35 -76 146 56 -99 243 11 26 77
Page 20 of 21Geophysical Journal International
123456789101112131415161718192021222324252627282930313233343536373839404142434445464748495051525354555657585960

For Peer Review
Data (blue) and syntethics (red) for some of seismograms used for the inversion of April
6, 2009 Mw 6.3 event. In the upper group of stations body and surface waves are used, in
the lower only surface waves.
Page 21 of 21 Geophysical Journal International
123456789101112131415161718192021222324252627282930313233343536373839404142434445464748495051525354555657585960
Related Documents
![M. Billaud-Friess ,A.Nouyand O. Zahm€¦ · canonical tensors, Tucker tensors, Tensor Train tensors [27,40], Hierarchical Tucker tensors [25] or more general tree-based Hierarchical](https://static.cupdf.com/doc/110x72/606a2ea8ed4bc80bc83876de/m-billaud-friess-anouyand-o-zahm-canonical-tensors-tucker-tensors-tensor-train.jpg)


