SEISMIC INTERPRETATION AND CLASSIFICATION OF MUD VOLCANOES OF THE SOUTH CASPIAN BASIN, OFFSHORE AZERBAIJAN A Thesis by MEHDI YUSIFOV Submitted to the Office of Graduate Studies of Texas A&M University in partial fulfillment of the requirements for the degree of MASTER OF SCIENCE August 2004 Major Subject: Geology

Welcome message from author
This document is posted to help you gain knowledge. Please leave a comment to let me know what you think about it! Share it to your friends and learn new things together.
Transcript

SEISMIC INTERPRETATION AND CLASSIFICATION OF
MUD VOLCANOES OF THE SOUTH CASPIAN BASIN,
OFFSHORE AZERBAIJAN
A Thesis
by
MEHDI YUSIFOV
Submitted to the Office of Graduate Studies of Texas A&M University
in partial fulfillment of the requirements for the degree of
MASTER OF SCIENCE
August 2004
Major Subject: Geology

SEISMIC INTERPRETATION AND CLASSIFICATION OF
MUD VOLCANOES OF THE SOUTH CASPIAN BASIN,
OFFSHORE AZERBAIJAN
A Thesis
by
MEHDI YUSIFOV
Submitted to Texas A&M University
in partial fulfillment of the requirements for the degree of
MASTER OF SCIENCE
Approved as to style and content by: Philip D. Rabinowitz Tom Blasingame (Chair of Committee) (Member) William R. Bryant Richard Carlson (Member) (Head of Department)
August 2004
Major Subject: Geology
iii
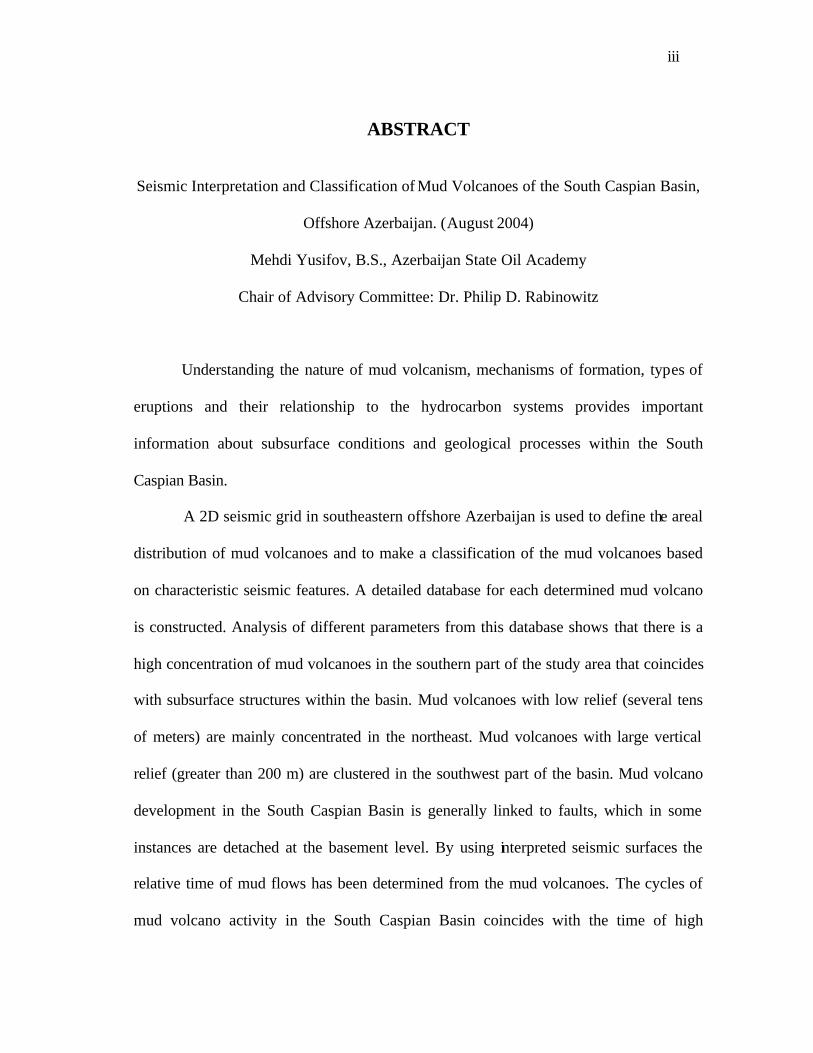
ABSTRACT
Seismic Interpretation and Classification of Mud Volcanoes of the South Caspian Basin,
Offshore Azerbaijan. (August 2004)
Mehdi Yusifov, B.S., Azerbaijan State Oil Academy
Chair of Advisory Committee: Dr. Philip D. Rabinowitz
Understanding the nature of mud volcanism, mechanisms of formation, types of
eruptions and their relationship to the hydrocarbon systems provides important
information about subsurface conditions and geological processes within the South
Caspian Basin.
A 2D seismic grid in southeastern offshore Azerbaijan is used to define the areal
distribution of mud volcanoes and to make a classification of the mud volcanoes based
on characteristic seismic features. A detailed database for each determined mud volcano
is constructed. Analysis of different parameters from this database shows that there is a
high concentration of mud volcanoes in the southern part of the study area that coincides
with subsurface structures within the basin. Mud volcanoes with low relief (several tens
of meters) are mainly concentrated in the northeast. Mud volcanoes with large vertical
relief (greater than 200 m) are clustered in the southwest part of the basin. Mud volcano
development in the South Caspian Basin is generally linked to faults, which in some
instances are detached at the basement level. By using interpreted seismic surfaces the
relative time of mud flows has been determined from the mud volcanoes. The cycles of
mud volcano activity in the South Caspian Basin coincides with the time of high

iv
sedimentation rate, a regional contraction episode, and major stage for hydrocarbon
generation. Mud volcano activity initiated in the Sabunchi-Syrakhany (lower Pliocene)
and has increased in activity in upper Apsheron-Quaternary time.
Previous studies of the onshore mud volcanoes in Azerbaijan and the results from
current work conclude that mud volcano formation within the South Caspian Basin is
mainly controlled by tectonic forces and overpressured sediments. Mud volcano activity
is not always related to the Maykop organic rich shale succession. It can occur at
shallow depths by pressure breakthrough from any stratigraphic zone.

v
DEDICATION
I would like to dedicate this manuscript to those whose support and care inspired
me throughout all these years at Texas A&M – my parents and Magdalena Vintrova.
Without their love and understanding this contribution would not be possible.
vi
ACKNOWLEDGEMENTS
I want to express my special gratitude to Dr. Philip D. Rabinowitz for the
support, dedication and honest belief in my success.
I acknowledge my committee members – Dr. Tom Blasingame and Dr. William
Bryant for their encouragement during this study.
Special thanks to ExxonMobil Exploration Company for the help and data
support for this project during my summer internship.
Also, my acknowledgments to the Caspian Geophysical and State Oil Company
of Azerbaijan Republic for the release of required seismic lines.

vii
TABLE OF CONTENTS
Page
ABSTRACT………………………………………………………………………. iii
DEDICATION……………………………………………………………………. v
ACKNOWLEDGEMENTS………………………………………………………. vi
TABLE OF CONTENTS…………………………………………………………. vii
LIST OF FIGURES………………………………………………………………. ix
CHAPTER
I INTRODUCTION………………………………………………………... 1
Methods and Procedures………………………………………….. 3 Significance of the Study…………………………………………. 4
II GEOLOGICAL BACKGROUND……………………………………….. 6
Tectonics………………………………………………………….. 8
Stratigraphy……………………………………………………….. 14 Previous Studies of Mud Volcanoes……………………………… 20
III OBSERVATIONS AND RESULTS……………………………………... 26
Database Description……………………………………………… 26 The Size…………………………………………………… 26 Shape of the Mud Volcanoes……………………………... 29 Seismic Artifacts………………………………………….. 33 Faulting and Relation to the Underlying Structure……….. 35 Collapse Structure………………………………………… 35 Mud Flows and Timing of Activity………………………. 38
Observations and Database Analysis……………………………... 40 IV DISCUSSION AND CONCLUSIONS…………………………………... 59
REFERENCES CITED…………………………………………………………… 74
APPENDIX A…………………………………………………………………….. 81

viii
Page
APPENDIX B…………………………………………………………………….. 92
VITA……………………………………………………………………………… 94

ix
LIST OF FIGURES FIGURE Page
1 Area of study with the 2D seismic data coverage ……………….. 2
2 Summary structural map of the South Caspian Basin …………… 7
3 Crust and uppermost mantle cross-section between the Kura Basin to the west of the South Caspian Basin and the Turkmenian lowlands and the Kopeh Dag mountains to the east ……………………………………………... 9
4 A schematic geological cross-section of the NE Talesh in Azerbaijan ……………………………………………………... 11
5 Sketches to illustrate active tectonics of the South Caspian Basin ……………………………………………... 13
6 Generalized stratigraphic column for the Azeri sector of the South Caspian Basin ………………………………………. 15
7 Diagram for the procedure of identifying the size of mud volcano….………………………………………………... 27
8 Diagram showing height extraction from the seismic data……….. 29
9 Types of mud volcanoes based on the shape and appearance on the seismic line ……………………………..……. 31
10 Change in shape of a seismic response based on the
place where the line intersects the mud volcano…………………. 32
11 Examples of seismic artifacts associated with the mud volcanoes……………………………………………............. 34
12 Example of the mud volcano with faults in the vicinity …............. 36
13 Example of the collapse structure before (a) and after (b) interpretation…………………………………………….. 37
14 Scheme for identifying time of mud flows……………………….. 39
x
FIGURE Page
15 Areal distribution of the mud volcanoes within the area of study………………………………………………………………. 41
16 a) Plot of the area versus height of the mud volcanoes;
b) height and c) area distribution from the obtained data population.…………………………………………………… 43
17 Relative height of the mud volcanoes…………………………….. 45
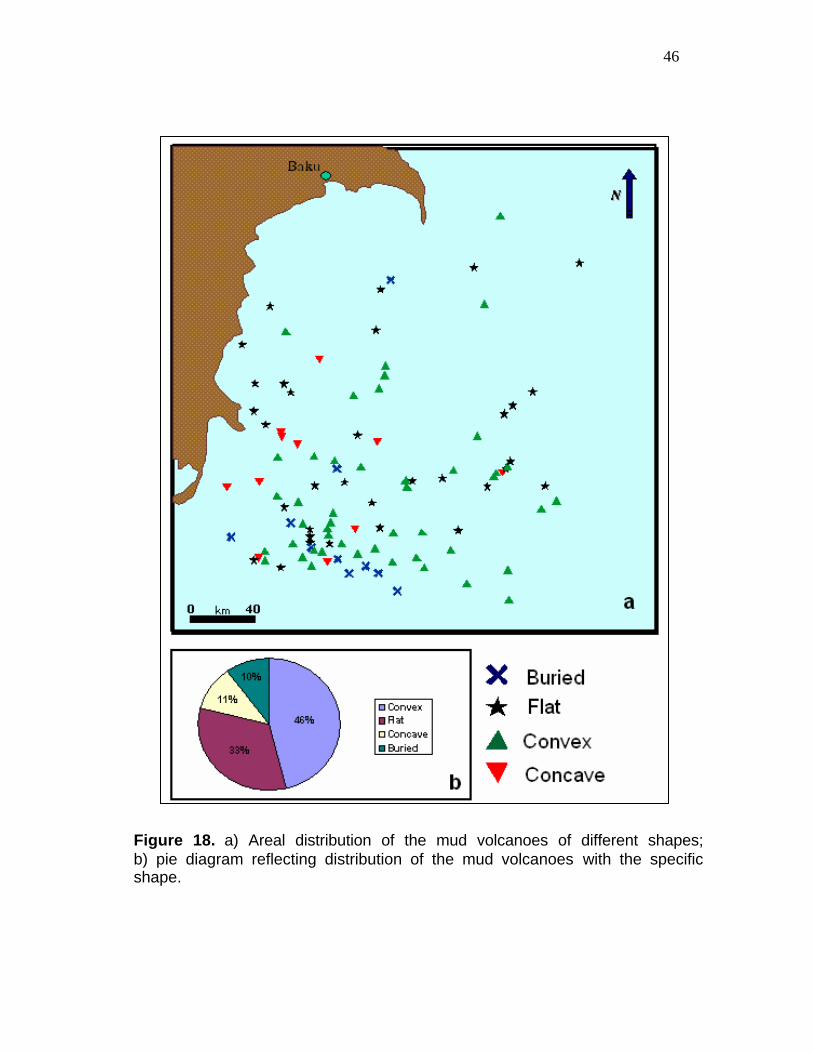
18 a) Areal distribution of the mud volcanoes of different shapes;
b) pie diagram reflecting distribution of the mud volcanoes with the specific shape……………………………………………. 46
19 a) Position of the mud volcanoes relative to subsurface
structure; b) pie diagram reflecting distribution of the mud volcanoes relative to the subsurface structure………………….. 47
20 Mud volcano activity through time……………………………….. 49
21a Maps of mud volcano development in different periods of time:
Activity in Subunchi–Upper Surakhany time (4.33 MY)………… 51
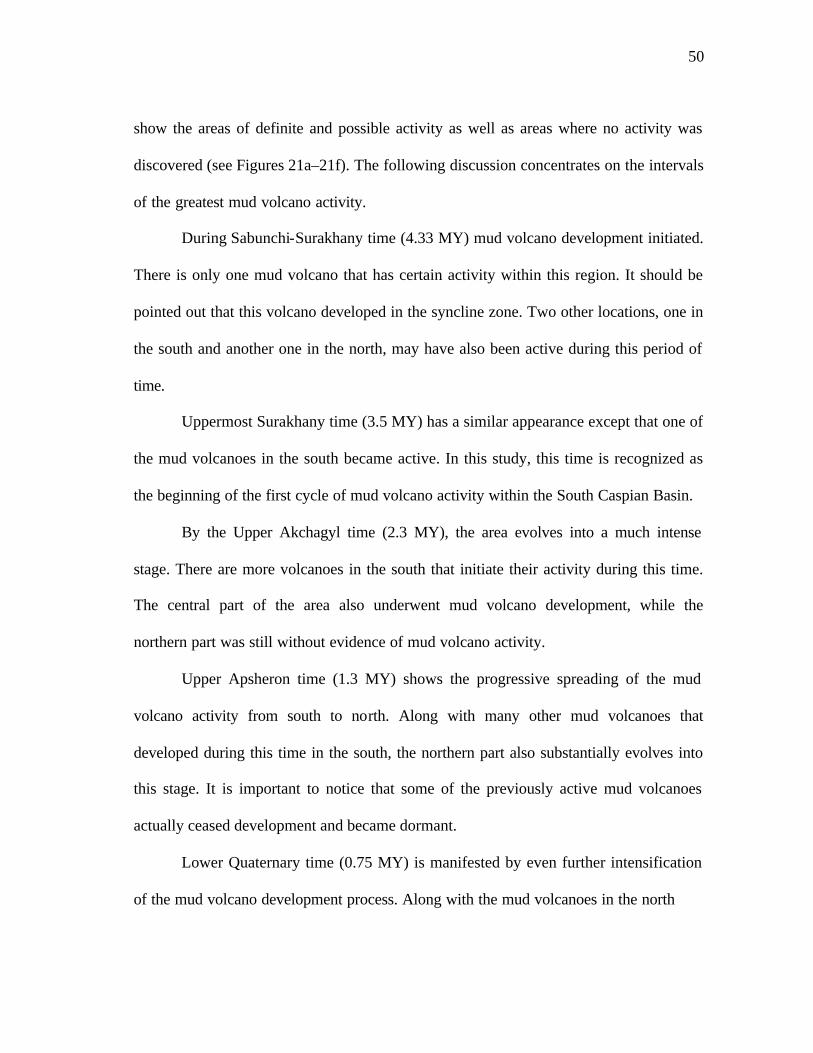
21b Maps of mud volcano development in different periods of time: Activity in Uppermost Surakhany time (3.5 MY)………………... 52
21c Maps of mud volcano development in different periods of time: Activity in Upper Akchagyl time (2.3 MY)………………………. 53
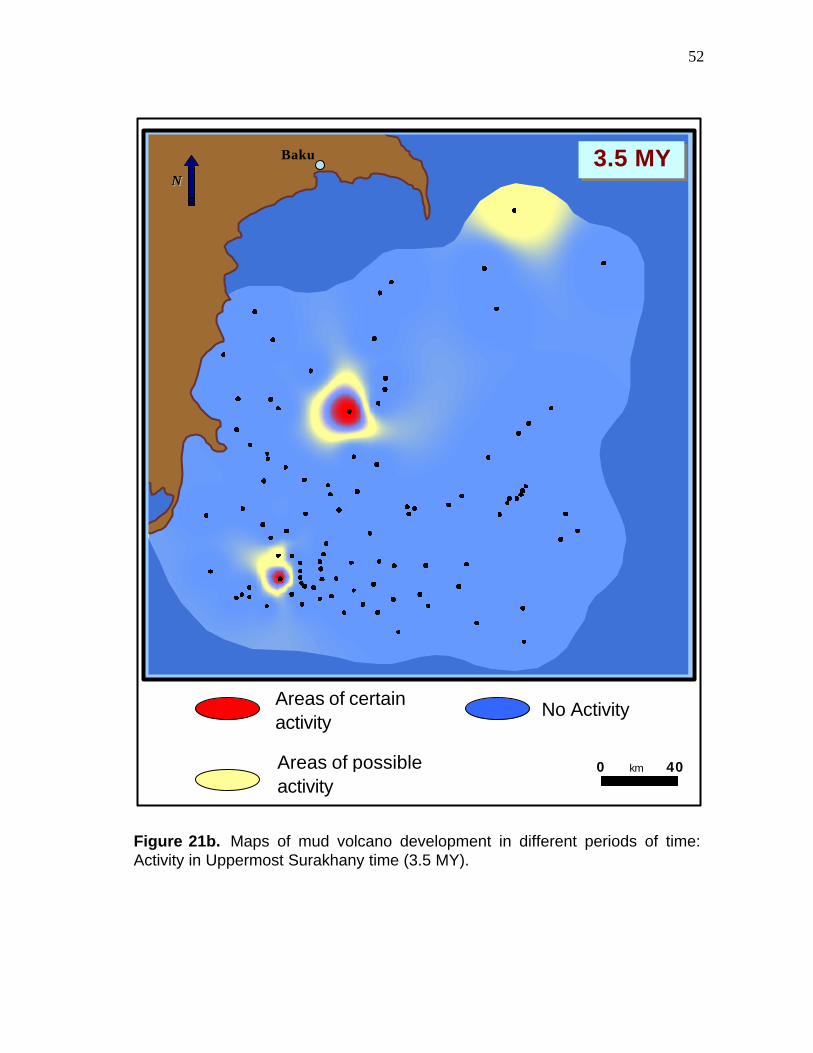
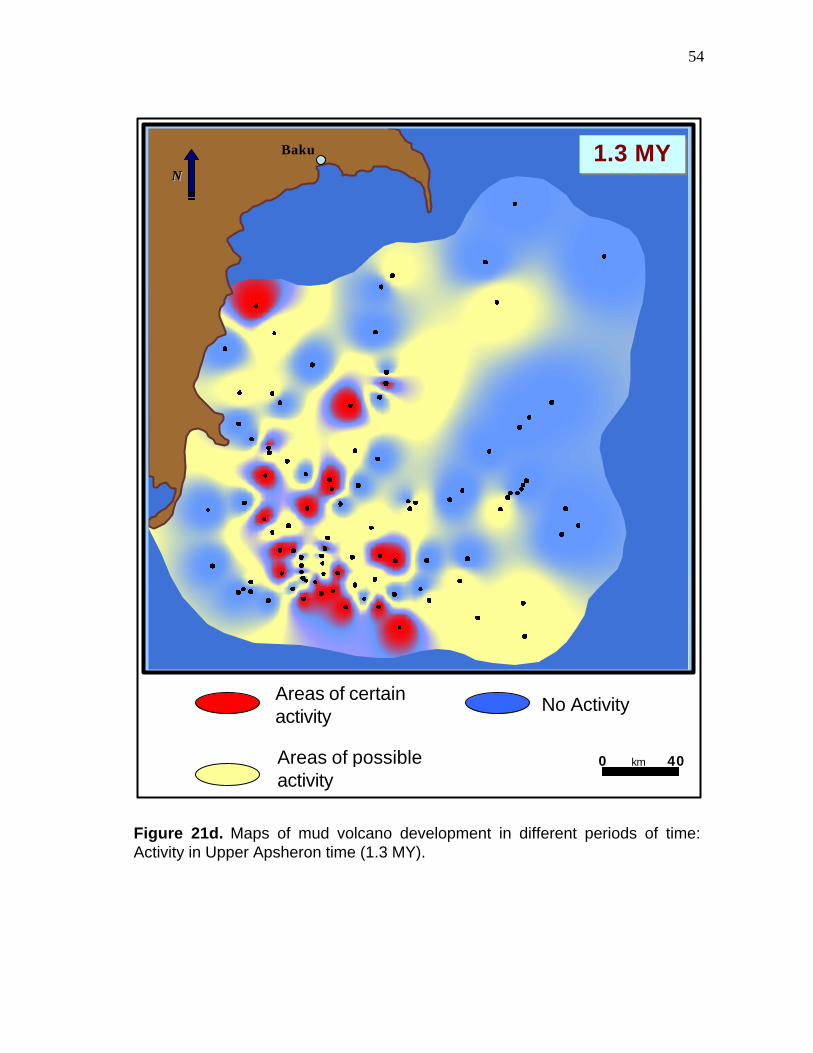
21d Maps of mud volcano development in different periods of time: Activity in Upper Apsheron time (1.3 MY)………………………. 54
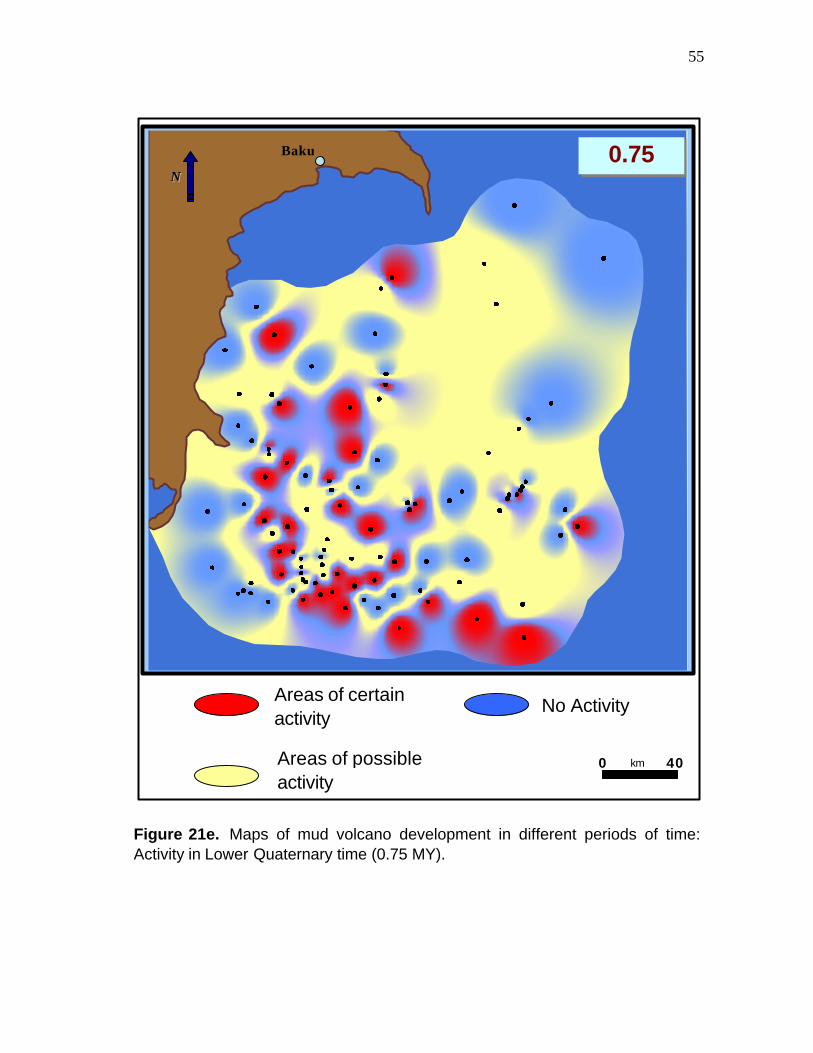
21e Maps of mud volcano development in different periods of time: Activity in Lower Quaternary time (0.75 MY)……………………. 55
21f Maps of mud volcano development in different periods of time: Activity in Upper Quaternary time (0.3 MY)…………………….. 56
22 Distribution of mud volcanoes on Earth………………………….. 60
1
CHAPTER I
INTRODUCTION
Mud volcanoes are a natural phenomena that has attracted attention for a long
time. They have some similarities in appearance to magmatic volcanoes, but have
greatly different origins. Mud volcanoes are key features that reflect regional geological
processes in the Caspian Sea.
The Caspian Sea and surrounding regions, in particular Azerbaijan, have a long
history relating to petroleum (Maksimova, 1987; Narimanov and Palaz, 1995; Abrams
and Narimanov, 1997; Cullen, 1999; Daniloff, 1998; Sagers and Matzko, 1993). Stories
abound with respect to the use of petroleum seeps in the 4th century BC by soldiers of
Alexander the Great. Marco Polo, when travelling on the Silk Route in the 13th century,
noted its great abundance (Rabinowitz et al., 2004). The very first oil exploration well
ever drilled was in Baku, Azerbaijan in 1848, long before the first gushers in Texas and
Arabia. The commercial production in the Baku area dates from the 1870’s when the
Russian government first allowed private development of the oil fields. By 1900, there
were about 3000 oil wells and Azerbaijan accounted for ~50% of the worlds oil
production and in 1924 the first offshore well was drilled (Rabinowitz et al., 2004).
There are many global studies of mud volcanoes that reveal aspects of their
origin, mechanism of formation and paleo-activity (Brown, 1990; Guliyev and
This thesis follows the style and format of the AAPG Bulletin.
2
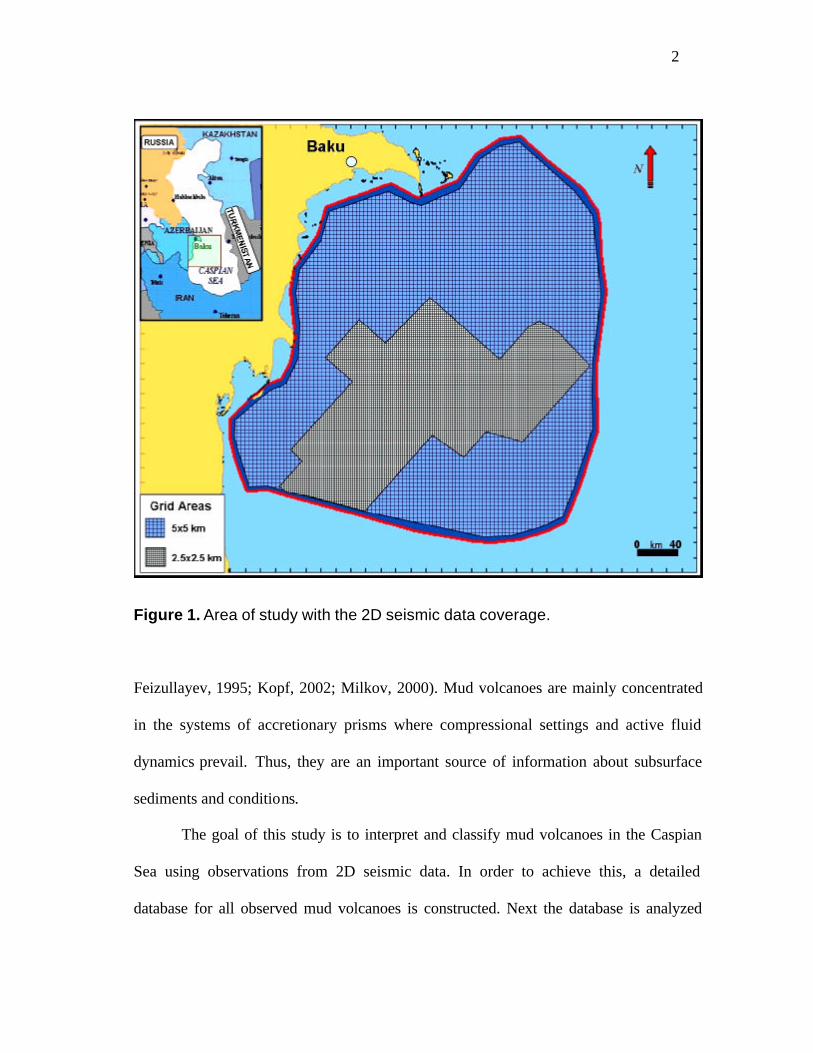
Figure 1. Area of study with the 2D seismic data coverage.
Feizullayev, 1995; Kopf, 2002; Milkov, 2000). Mud volcanoes are mainly concentrated
in the systems of accretionary prisms where compressional settings and active fluid
dynamics prevail. Thus, they are an important source of information about subsurface
sediments and conditions.
The goal of this study is to interpret and classify mud volcanoes in the Caspian
Sea using observations from 2D seismic data. In order to achieve this, a detailed
database for all observed mud volcanoes is constructed. Next the database is analyzed
3
and the relationship between the mud volcano occurrence and the regional geological
settings is determined. Finally, these results and other major observations are combined
with previous studies of mud volcanoes in the Caspian as well with studies of mud
volcanoes in other regions of the globe.
This study provides a description of offshore mud volcanoes in an area of about
60,000 km2 southeast offshore Azerbaijan (Figure 1). The source of data is 2D seismic
coverage that has been shot in 1995 and 1998. This seismic survey has extensively
covered most of the Azeri sector of the Caspian Sea. The coarse grid between seismic
lines is 5x5 km. In the central and southwestern portion of the study area the seismic line
spacing is finer - 2.5x2.5 km (Figure1). Since there is a paucity of geologic samples
from the offshore areas where mud volcanoes are observed, the seismic data is vital for
our understanding the processes and mechanisms of their formation.
Methods and Procedures
The mud volcanoes are characterized using seismic data by different assigned
parameters (shape, height, relationship with the structure, existence of the faults, wipeout
zones, etc.). Each parameter obtained from the seismic data were carefully documented
and put into a database constructed in a Microsoft Excel spreadsheet. The database given
in the appendix aid in obtaining a quantitative description of the assigned parameters.
The analysis of the database allows for the position of the mud volcanoes and
their areal distribution to be mapped. Furthermore, the relative time of paleoflows
(paleoactivity) from the mud volcanoes is identified. Wedge like features observed

4
beneath the sea floor on the seismic reflection profiles are also mapped. These features
are manifestation of mud volcano activity in the past.
Significance of the Study
More than 30% of the world’s known mud volcanoes are concentrated in the
South Caspian Basin (Guliyev and Feizullayev, 1995). Favorable tectonic conditions,
depositional settings and thermobaric conditions caused generation of significantly huge
mud volcanoes in this region (Guliyev and Feizullayev, 1995). In places, they are several
kilometers across and reach several hundred meters in height (Appendix A). As a source
of hydrocarbon gases they may provide sufficient supply of gases to the hydrosphere and
atmosphere to possibly affect climate change (Kopf, 2002; Milkov, 2000). According to
Guliyev (1995) the mud volcanoes may have a spatial and genetic relationship with oil
and gas fields and thus may provide evidence of petroleum potential. This study shows
that mud volcanoes are indeed located in regions where active hydrocarbon system are
present, but are not necessary connected with fossil fuel accumulation. Mud volcanoes
also impact drilling operations, rig installations and pipeline routings by their violent
eruptions and instability of the surrounding gas saturated sediments (Milkov, 2000).
Moreover, of particular interest to scholars as well as the petroleum industry is the
answer to the question of what are mud volcanoes – are they conduits for charge of
hydrocarbons to the reservoir rock or pathways to its leakage?
Observations from this study when integrated with the previous studies on mud
volcanoes in the Caspian Sea show that there are no evidence of mud diapirs observed in

5
the seismic data. Most mud volcanoes are situated above anticlines that are complicated
by faults and there is a cyclicity in mud volcano development within an area of study.
These conclusions also similar in part with conclusions of mud volcano studies in other
geographical regions.

6
CHAPTER II
GEOLOGICAL BACKGROUND
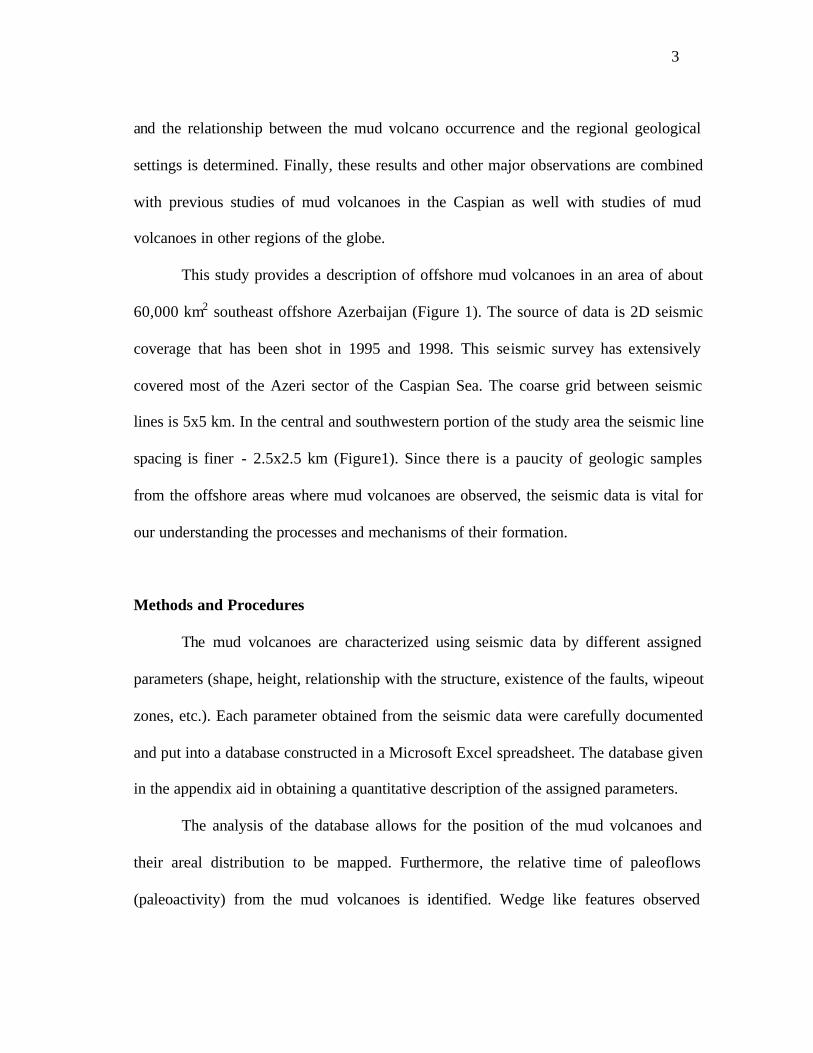
The South Caspian Basin is a Tertiary basin lying between the Greater and
Lesser Caucasus and Talysh Mountains in Azerbaijan, and the Elburz and Koped Dag
Mountains in Iran and Turkmenistan, respectively (Figure 2). It contains significant
accumulations of oil and gas with discovered reserves estimated to be more than 20
GOEB (billion oil equivalent barrels) with an additional 20 plus GOEB undiscovered
reserves. The South Caspian Basin a thus a world class petroleum system (Rabinowitz et
al., 2004).
The South Caspian depression is characterized by a system of positive
morphological elements reflecting subsurface Pliocene-Quaternary structures. These
elements relate to the anticlinal folds extending from several tens of kilometers up to the
180-200 km (Croissant, 1998; Lebedev et al., 1987).
Extremely low values of geothermal gradient at the central part of the basin (1.0
to 1.8 deg.C/100m), compared to the values from the other basins (2.5-3.5 deg.C/100m)
puts the present day limit for the “oil window” to about 9 km and the “gas window” to
about 14 km (Guliyev and Feizullayev, 1995; Lerche et al., 1997; Nadirov et al., 1997).
High sedimentation rates up to 1000m/MA since middle Pliocene, as compared
with other similar basins (100-200m/MA), causes excessive fluid pressure within the
sediments throughout whole basin. Existence of overpressured sediments appears to be
7
Figure 2. Summary structural map of the South Caspian Basin.
the key factor for the mud volcano formation and the mud volcanism in the basin
(Lerche et al., 1997; Nadirov et al., 1997).
Hydrocarbon accumulations are mainly associated with structural traps. Variety
of the anticlinal folds, monoclines with various degrees of reverse faulting and fracturing
creates favorite conditions for the trapping hydrocarbons. However, mud volcanoes
penetrate most of these structures. These are relatively large surface features, with an
average height of ~400 meters and several kilometers in width. This large areal extent
Lesser Caucasus
Lesser Caucasus

8
and unpredictable behavior is of obvious importance to the petroleum industry. The
geological overview of this unique basin is described below.
Tectonics
The northern boundary of the South Caspian Basin is the Apsheron Sill that links
the Apsheron and Cheleken peninsulas with a line of shallow anticlines (Allen et al.,
2003). Its southern boundary lies parallel and just to the north of the Iranian coastline of
the Caspian Sea. The eastern and western boundaries roughly correspond with the
present day Caspian shorelines (Mangino and Priestley, 1998). Seismicity at the margins
of the South Caspian Basin shows that it is in the early stages of subducting under the
Apsheron Sill to its north, where earthquakes occur at depth of up to ~ 80 km, and
probably also under the Talysh to its west, where gently west-dipping thrust have depth
of 15-27 km (Jackson et al., 2002).
Early works of Russian scientists, along with deep seismic sounding (DSS)
experiments show that the crust of the South Caspian Basin is very different from that of
the surrounding region (Jackson et al., 2002). Russian seismologists generally divide the
continental crust into three main sections: a sedimentary layer, an upper or “granitic”
crust bellow the sediments and a lower or “basaltic” crust. The DSS studies of the South
Caspian Basin do not show “granitic” layer that is observed in the surrounding regions
(Figure 3). Instead, the crust of the South Caspian Basin consists of a 15-25 km thick
sedimentary layer with a Vp of 3.5-4.8 km s-1 overlying a 12-18 km thick “basaltic”
layer with a Vp of 6.8-7.0 km s-1 (Galperin et al., 1962; Neprochnov, 1968; Ryaboy,

9
Figure 3. Crust and uppermost mantle cross-section between the Kura Basin to the west of the South Caspian Basin and the Turkmenian lowlands and the Kopeh Dag mountains to the east. The structure is summarized in terms of four generalized rock types: low-velocity sediments; the upper ‘granitic’ crust consisting of rocks with Vp 5.8–6.5 km/sec; the lower ‘basaltic’ crust consisting of rocks with Vp 6.5–7.8 km/sec; and the upper mantle. The vertical arrows at the top of the cross-section denote points where receiver function analysis (large solid arrows) or Russian refraction analysis (small open arrows), both from Mangino & Priestley (1998), provide a constraint on the crustal structure. The surface wave study of Priestley & Patton (2001) is for the path denoted by the double-headed arrow above the cross-section. The dashed line at 35 km depth beneath the basin denotes the approximate position of the Moho from the surface wave analysis. Adapted from Jackson et al., 2002. 1969; Yegorkin and Matushkin, 1970; Bulin, 1978; Khalilov et al., 1987). However, the
thickness of this “basaltic” crust is not well constrained in the central part of the basin.
The tectonic evolution of the South Caspian Basin is quite complex with little
agreement as to the origin of the anomalous south Caspian crust. Rezanov and Chamo
10
(1969) and Shikalibeily and Grigoryants (1980) indicate that the region was uplifted
during the Mesozoic by a mantle diapir and the upper continental crust was eroded. After
this event was the period of subsidence and sedimentation. Berberian and King (1981)
and Berberian (1983) suggest that the South Caspian Basin is either an unsubducted
crustal remnant of an ocean that closed in the Triassic or Cretaceous, or a remnant of a
marginal sea that developed behind an island arc in the late Mesozoic or Paleogene.
Zonenshain and Le Pichon (1986) and Philip et al. (1989) argue that both the Black and
Caspian seas are fragments of a larger, late Mesozoic back-arc basin which lies to the
north of the late Mesozoic-Paleogene subduction zone of the Tethys Ocean. After the
Tethys Ocean closed, the Red Sea Rift opened and as the Arabian plate moved
northwards relative to the Eurasian plate, subduction shifted to the northern boundary of
the marginal sea. Closure of this marginal sea ~3.5 Ma resulted in uplift and crustal
thickening of the Caucasus and left relic oceanic crust underlying part of the Black Sea
and South Caspian Basin. Sengor (1990) suggests that the South Caspian Basin opened
as a large pull-apart structure along a major late Cretaceous strike-slip fault zone
collinear with the Koped Dag - Alborz - Greater Caucasus montain belts.
The present day tectonics of the South Caspian Basin was also described in many
sources. The recent analysis of the present active tectonics of the South Caspian Basin is
presented by Jackson (2002) and Allen (2003). They suggest that lack of shallow
earthquakes within the South Caspian Basin indicates that it behaves as a rigid block
within the Eurasia-Iran-Arabia collision zone. Both this basement and sedimentary cover
are markedly different from surrounding ranges, leading to major variations in the nature
11
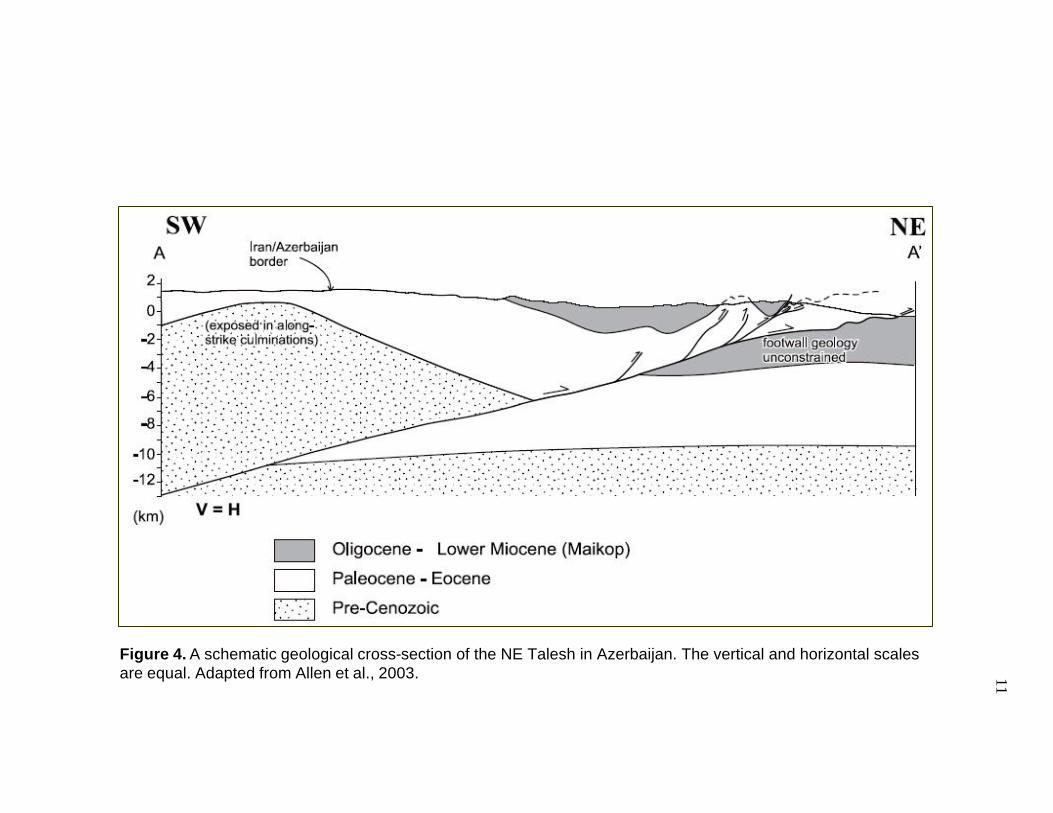
Figure 4. A schematic geological cross-section of the NE Talesh in Azerbaijan. The vertical and horizontal scales are equal. Adapted from Allen et al., 2003.

12
and orientations of structures across the region. The South Caspian Basin is presently
overthrust from all sides. At its margins, range-parallel strike–slip faults in the Alborz
and Kopet Dagh indicate a westward motion of the South Caspian relative to both Iran
and Eurasia. Earthquakes at up to ~80 km beneath and north of the Apsheron Sill are
consistent with the South Caspian basement subducting northwards (Allen, 2003). The
surface folding is likely to be completely decoupled, and can be spatially separated from
any basement shortening by the overpressured muds. The N-S folds in offshore
Azerbaijan are probably a response to deeper basement shortening that occurs ~100km
further west beneath the Talesh (Figure 4). Thus the Talesh takes up part of the regional
Arabia–Eurasia convergence and also the westward motion of the South Caspian
basement. The north–south shortening in the Talesh also means that the range moves
northwards with respect to the adjacent South Caspian Basin. In contrast WNW-ESE
trending surface folds near the Apsheron-Balkhan sill are probably a response to deeper
thrusting of the Southern Caspian beneath the northern Caspian.
Figure 5 summarizes the active tectonics of the South Caspian Basin. The present
day configuration (a) shows S to SW underthrusting in the Kopeh Dag, Alborz, Talesh
and eastern Greater Caucasus and north dipping underthrusting in the central Caspian. A
velocity triangle (b) illustrates the relative motion between Iran (I), Eurasia (E) and the
South Caspian Basin (C). Sketch (c) illustrates how the current collinear geometry of the
seismic belt across the Apsheron-Balkhan sill with the Caucasus and Kopeh Dag is
unstable because the underthrusting is to the north in the middle (white triangles) but to

13
Figure 5. Sketches to illustrate active tectonics of the South Caspian Basin. (a) The present-day configuration, showing S to SW underthrusting in the Kopeh Dag, Alborz, Talesh and eastern Greater Caucasus and north-dipping underthrusting in the central Caspian. Note the left-lateral strike-slip component in the eastern Alborz, and right-lateral component in the Kopeh Dag. The white arrow shows the approximate direction of the South Caspian Basin relative to Iran, and the black arrow shows its motion relative to Eurasia. (b) A velocity triangle constructed to illustrate the relative motion between Iran (I), Eurasia (E) and the South Caspian Basin (C). Velocities are in mm yrx1. (c) A sketch to illustrate how the current collinear geometry of the seismic belt across the Apsheron–Balkhan sill with the Caucasus and Kopeh Dag is unstable because the underthrusting is to the north in the middle (white triangles) but to the south on either side (black triangles). It will eventually evolve to the offset configuration shown by the white semi-circles.
14
the south on either side (black triangles). It will eventually evolve to the offset
configuration shown by the white semi circles.
The ability of the South Caspian basement to subduct under adjacent regions may
lead to its eventual elimination. The South Caspian region especially demonstrates that a
rigid block of crust within a collision zone may move with respect to adjacent areas
millions of years after initial collision. As it moves, it produces deformation zones with
kinematics that are not predictable from the overall plate convergence. The exact style in
which deformation occurs depends strongly on the nature of the crust in each area, its
overall strength, pre-existing structures available for reactivation, and the stratigraphic
horizons available to slip during thrusting (Allen, 2003).
Stratigraphy
The huge sedimentary cover in some instances up to 20km thick contains
sediments from Jurassic to Quaternary in age (Abrams and Narimanov, 1997). Typical
source rock for the basin is the organic rich Maikop shales (Figure 6). These are mud-
prone sediments that lie at depths of 10–12 km within the basin interior. Their thickness,
in some instances, reaches 8 km. Outcrop studies showed the very high values for the
total organic carbon (TOC) in these shales which together with other different
geochemical parameters reveals its high generation potential (Abrams and Narimanov,
1997; Belopolsky et al., 1998; Buryakovky et al., 1995; Katz et al., 2000; Lerche et al.,
1997).

15
Figure 6. Generalized stratigraphic column for the Azeri sector of the South Caspian Basin.

16
Younger strata record a broadly shallowing upward trend in the basin, which led
to the late Miocene deposition of evaporites. The main oil reserves have been discovered
in the Middle Pliocene Productive Series. Fluvial–deltaic deposition of the Productive
Series and its lateral equivalents took place between the latest Miocene and the early
Pliocene (Reynolds and Simmons, 1998). During this time highly incised paleo-Volga
river system supplied sediment from the Russian Plain to the north, and the paleo-Amu
Darya supplied sediment from the Pamirs to the east. Relatively minor sediment input
came from other river systems, such as paleo-Kura and paleo-Sumgaiet. These rivers fed
a series of lowstand lacustrine deltas. There are two distinctive groups of reservoir rocks
within the Productive Series. One is the Early Productive series - mainly quartz and
rocks typical for Paleo Volga deposits. The second is the Late Productive series - less
quartz, more feldspar, and fragments of both sedimentary and volcanic rocks typical for
Paleo-Kura sediments.
The following is a detailed description of the Productive Series based on the field
work studies of several outcrops around Apsheron peninsula (Reynolds and Simmons,
1998). The Productive Series of the Absheron Peninsula is divided into several
distinctive intervals or suites: Kalin Suite (KAS), Pre-Kirmaky Sand Suite (PK),
Kirmaky Suite (KS), Post-Kirmaky Sand Suite (NKP), Post-Kirmaky Clay Suite (NKG),
Pereriva Suite, Balakhany Suite, Sabunchy Suite, Surakhany Suite.
The area around Kirmaky Valley is the best place to examine exposures of the
Productive series. This area lies in the center of the Apsheron Peninsula, 12 km north of
Baku. Many of the sandstones are bitumen stained or oil bearing, and at the northern
17
edge of the valley, there is a well-known and spectacular burning gas seep (Reynolds
and Simmons, 1998). Outcrops of the older suites within the Productive series occur
along the margins of a mud volcano in Kirmaky Valley. The strata comprise the PK, the
KS, the NKP, the NKG, and the Pereriva Suite. The overlying Balakhany Suite and
Sabunchi Suite are only poorly exposed in Kirmaky Valley. However, good exposures of
these suites occur west of the main valley in a quarry identified as Balakhany Quarry,
where 220 m of the Balakhany Suite is exposed, and good exposures occur along the
side of an adjacent lake, where a wave-cut platform, exposes over 190 m of the Sabunchi
Suite.
Kalin Suite is not exposed in any outcrops within the Absheron Peninsula. It is
known from the numerous wells that breach this suite in different areas. Kalin Suite is
presented by the coarse-grained succession more than 300 m thick.
The Pre-Kirmaky Sand Suite is poorly exposed at Kirmaky Valley (commonly
covered by mud volcano flows). The sands are weak-sorted, medium and coarse grained,
rarely fine-grained, and often cemented into the sandstones.
The Kirmaky Suite can be divided into a lower sand-prone unit and an upper
argillaceous unit. Lower sand-prone unit that exposed at Kirmaky Valley consists of
three stacked parasequences (9-15 m thick) bounded by abrupt flooding surfaces. The
coarser grained and most laterally extens ive sandstones occur at the top of each
parasequence and interpreted as fluvially dominated, shoal-water distributary mouth bars
at the front of the paleo-Volga delta (Reynolds and Simmons, 1998).
18
In Kirmaky Valley the Post-Kirmaky Sand Suite is around 150 m thick at
outcrop. The basal sandstone passes upward into a succession of mudstones, siltstones,
and sandstones arranged into coarsening-upward parasequences that range in thickness
from 7 to 14 m. As in the Kirmaky Suite, the coarsening-upward signatures are thought
to record deposition on fluvially dominated mouth bars. The fining-upward successions,
by contrast, are interpreted as the product of distributary channels that fed the prograding
mouth bars.
The Post-Kirmaky Clay Suite is dominated by mudstone and siltstone with thin
sandstone beds. These rock types are arranged into stacked coarsening-upward
successions (9-15 m thick). The characteristics of the post-Kirmaky Clay Suite indicate
low-energy conditions dominated by deposition of suspended fine-grained material.
Micropaleontological studies of the samples from this suite show that deposition occurs
in a low salinity, shallow-marine environment.
The Pereriva Suite is one of the most important producing intervals in the
subsurface, particularly in the offshore where it is up to 110 m thick. In Kirmaky Valley,
where only the basal 35 m of the Pereriva are well exposed, the suite is 100% sandstone
and characterized in its lower portions by conglomeratic sandstones with clasts up to 10
cm in diameter. The grain-size decreases upward to very fine or fine-grained sandstone.
These characteristics are interpreted to record a major fluvial or distributary channel
system. The erosion surface and jump to coarser grade material that occur at the base of
the Pereriva Suite are thought to reflect a drop in base level and are considered to record
a major sequence boundary.

19
The Balakhany Suit is the major producing interval in the offshore Apsheron
Peninsula. The suite consists of fine-grained sandstone intervals and intervals of
interbedded siltstone and sandstone. The sandstone intervals are predominantly fine
grained, laterally extensive, and interpreted as stacked channels and proximal mouth
bars. The interbedded siltstone and sandstone reflects delta- front and delta-plain
deposition.
The Sabunchi Suite is an argillaceous succession. It is exposed west of
Balakhany Quarry, and characterized by decimeter thick beds of mudstone, siltstone, and
sandstone. Sandstone beds are either of constant grain size or fine upward. The overall
succession is thought to be deposited in a distal delta- front setting (in case of thin sands
interbeded with the siltstone) or in mouth bars and distributary channels environment (in
case of thick sands).
The Surakhany Suite is the uppermost lithostratigraphic subdivision of the
Productive series. It typically consists of mudstones, siltstones, and very thin, fine-
grained sandstones. This suite is not exposed in the Kirmaky Valley area. Good
exposures of this suite exist at Yasamal Valley on the Apsheron Peninsula.
To summarize, the deposition of the Productive series was initiated by a major
fall in base level during the latest Miocene (Reynolds and Simmons, 1998; Allen et al.,
2003). The Paleo-Volga river brought the majority of sediments into the small, isolated
South Caspian Basin. Over the Apsheron Peninsula the paleo-Volga river formed a
major sandy braid delta. Fluctuations in sediment supply and in base level caused the
delta to prograde, retrograde, and step abruptly basinward at a variety of scales. Four

20
major facies associations show different reservoir quality and outline general
characteristics of target horizons: (1) Alluvial Braided River, (2) Delta Plain, (3)
Proximal Delta Front, and (4) Distal Delta Front facies associations (Reynolds and
Simmons, 1998; Abdullayev, 2000). Each of these facies reflects different depositional
environment and leads to different reservoir performance in the subsurface. Fluvial
reservoirs are likely to have an excellent reservoir performance. In delta-plain deposits
reservoir performance are likely to be poorer than that in fluvial system. Fine grained
sands and interbedded siltstones along with the faulting affect dramatically on reservoir
performance within the proximal delta-front deposits. Poorest reservoir quality has
deposits of distal delta-front facies association. Very fine sands compartmentalized by
faults and shale injections affect greatly on reservoir performance.
Previous Studies of Mud Volcanoes
Mud volcanism is an interesting and unusual natural phenomenon. It occurs in
areas of tectonic compression and is usually associated with hydrocarbon accumulations
in deep-seated strata. Three important aspects are (Milkov, 2000): (1) mud volcanoes
may be an indication of high petroleum potential, (2) mud volcanoes are an important
tool for obtaining information about subsurface sediments and conditions, (3) submarine
mud volcanoes are may be hazardous for the drilling operations, rig installations and
pipeline routings.
From a scientific point of view mud volcanoes offer an important source of
information about subsurface conditions and environment. Proper use of this "natural

21
well" allows us to evaluate types of hydrocarbons, build trap models, charge scenarios
and define reservoir distribut ion.
More than 30% of the world’s mud volcanoes are concentrated in the Azerbaijan
region. Based on comprehensive studies by Azeri and Russian geologists, more than 300
mud volcanoes have been recognized both onshore and offshore Azerbaijan. Most are
relatively large with an average height of 400 m with widths of several kilometers.
However, as will be discussed, recent surveys indicate that the concentration of mud
volcanoes offshore is higher than previously assumed.
There are several important conditions that are necessary for mud volcano
formation (Milkov, 2000):
• thick sedimentary cover;
• the presence of plastic stratum in the subsurface;
• enough gas supply and high hydrocarbon potential;
• the rapid sedimentation rate and as a consequence of that abnormally high
formation pressure;
• the occurrence of faults;
• compressional settings;
• seismicity.
Within the South Caspian Basin the sedimentary cover is about 20 km. The
source rock for hydrocarbon generation is the thick Mykop shale succession. It is highly
overpressured. Overpressure of the sediments is caused by high sedimentation rate and
subsidence in the Plio-Pleistocene (>2.0 km/MA). Such high sedimentation causes the
22
low heat flow within the basin. The region is tectonically very active. The basin is
highly folded and faulted and the overall seismicity of the region is considerably high
(Lerche et al., 1997). Therefore, the South Caspian Basin has the sufficient conditions
that lead to mud volcano formation.
Many hypotheses were proposed in order to explain mechanism of mud volcano
formation. One theory explains the formation of mud volcanoes due to rising of mud
diapirs where gas supply and formation fluids is the driving forces for the mud
volcanism (Brown, 1990; Guliyev and Feyzullayev, 1995; Kopf, 2002; Milkov, 2000).
Another hypothesis, proposed by Lorenz (1975), explains the formation of the mud
volcanoes due to rapid flow of pore fluids to the plastic shales and later escape of this
highly fluidized mass through the faults or other structural conduits (Fowler et al., 2000).
This theory does not associate the formation of the mud volcanoes with the mud
diapirism. However, both concepts show the critical role of the gas and formation fluids
in the mechanism of formation of the mud volcanoes.
From the studies of onshore mud volcanoes in Azerbaijan it is possible to
conclude that:
• Mud volcano formation begins in the Middle Miocene and becomes more
intensive in the Pliocene.
• Roots of many mud volcanoes onshore are Lower Cretaceous and Jurassic.
The samples of these rocks have bitumen content from 0.469% up to 2.5%.
• Gases of mud volcanoes consist primarily of methane with a little content of
CO2 and heavy hydrocarbons.
23
• Mineralization of the waters of mud volcanoes is the same as the waters of oil
fields.
• The height and the form of mud volcanoes depend on their activity
(frequency of eruption) and on the nature of material erupted.
• Mud volcanoes have little affect on the oil and gas distribution in the
structures. They primarily affect as a seal, not as a conductor.
An interesting relationship has been found between the shape of the mud volcano
and the material erupted. Volcanoes, which are not known for their powerful eruptions
but are characterized by constant activity of gryphons and salses do not usually form
distinct topographic highs, and sometimes simply merge into the surrounding plain.
Their highest points are usually raised by only 10-20 m, but they often cover an area of
several square kilometers. The craters are up to 400 m in diameter, and the base of the
volcano is usually hundreds of meters, and sometimes several kilometers across. On the
other hand, material erupted has a very strong influence on the shape and height of the
body of the mud volcano. More dense material has steeper slopes and greater heights.
Offshore areas of Azerbaijan have little in terms of geological samples.
Therefore, the offshore seismic records are of special importance in correlating what is
observed onshore to offshore (Fowler et al., 2000).
Potential hazards from the mud volcano eruption might be expulsion of mud,
emission of toxic gases and spontaneous combustion of the gases (Guliyev and
Feyzullayev, 1995). These hazardous phenomena can occur suddenly and without
warning. They only affect the area directly near the mud volcanoes and therefore only

24
pose a localized threat. However not all mud volcano eruptions are violent and
dangerous. There are four basic groups of mud volcanoes as defined by State Oil
Company of Azerbaijan Republic:
1. Explosive - powerful flow of mud and gas that spontaneously ignites.
2. Effusive - ejection of large amount of mud breccia with non-ignited gas
emission.
3. Effusive - flow of low viscosity of mud without intense gas emissions.
4. Extrusive - slow extrusion of viscous mud with very insufficient amount of
gas (Fowler, 2000).
Among these types of mud volcano eruptions, the first two can be very
hazardous. Others have less destructive power and might be considerably predictable.
The South Caspian Basin is an important element in the Arabia-Eurasia collision.
Being overthrust by continental material from all sides it behaves as a rigid block. The
origin of this block is still controversial. It is either a remnant of oceanic lithosphere with
unusual thick crust (Zonenshain et al., 1986; Philip et al., 1989) or stretched continental
crust with unusually high velocity (Sengor, 1990). High sedimentation rate initiated
during Upper Miocene – Early Pliocene time caused deposition of a very thick highly
overpressured sedimentary succession. Silty sediments interbedded with the thick sand
beds contain great amount of fluids as well as hydrocarbon gases. These extreme
conditions such as overpressure, existence of plastic shale succession saturated with the
fluids and high tectonic activity favors the mud volcano development in the region. Mud

25
volcanism apparently plays very important role in the regional geology of the area as
well as in many aspects of petroleum exploration.

26
CHAPTER III
OBSERVATIONS AND RESULTS
Database Description
Using 2D seismic lines that cover most of the territory of Azeri sector of the
Caspian Sea it is possible to determine the size, shape and seismic characteristic of the
features that are interpreted as mud volcanoes. These observations are placed into a
database cons tructed in Excel Spreadsheet format and presented in Appendix A. The
database was created in order to capture any possible observations that might be relevant
to the mud volcano and to reveal characteristics of mud volcanism in general. The
description of the mud volcanoes was based on size, shape and seismic artifacts, such as
wipeout zone, multiples and pulldown effect, and on relation to the faults and structures
underneath the observed seismic features. In addition to this study, the data of the paleo
flows from mud volcanoes is gathered and the time of their occurrence is determined.
Detailed description of the database is provided below.
The Size
The procedure for estimating the size of the interpreted mud volcano is
described. First the seismic line is examined for the existence of any indicators
suggesting the existence of a mud volcano. This feature is marked by the arbitrary
horizon that captures the entire extent of the mud volcano within this particular seismic
27
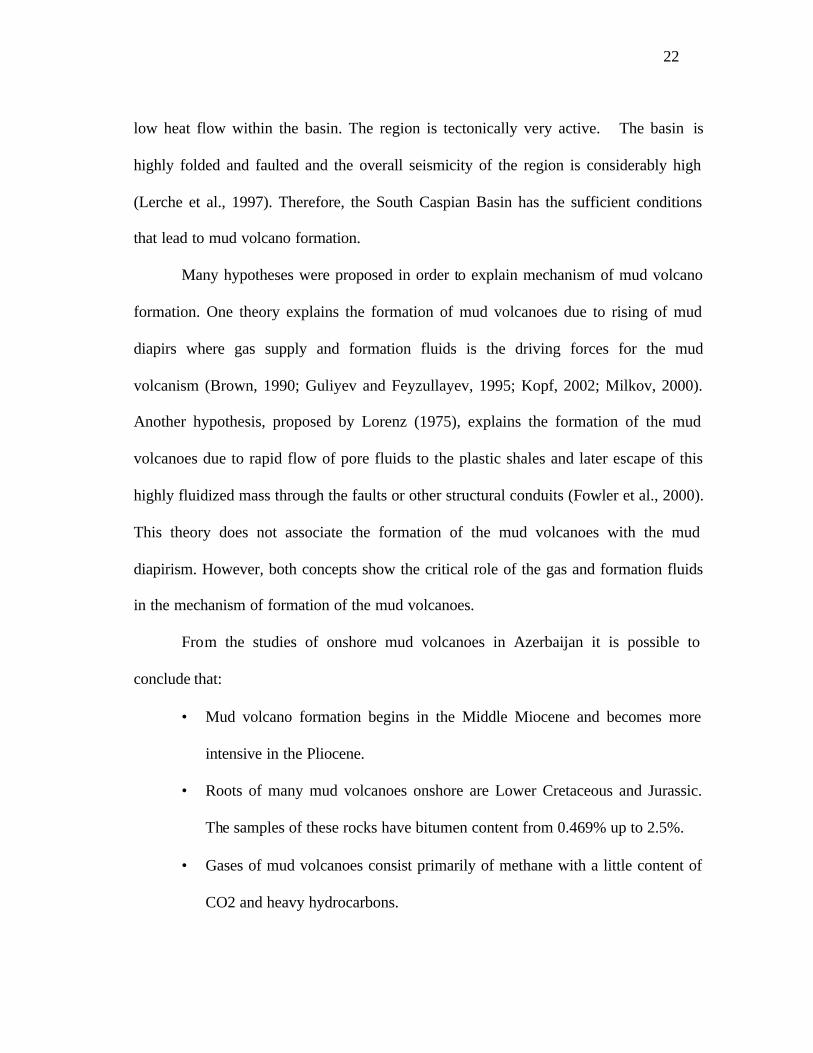
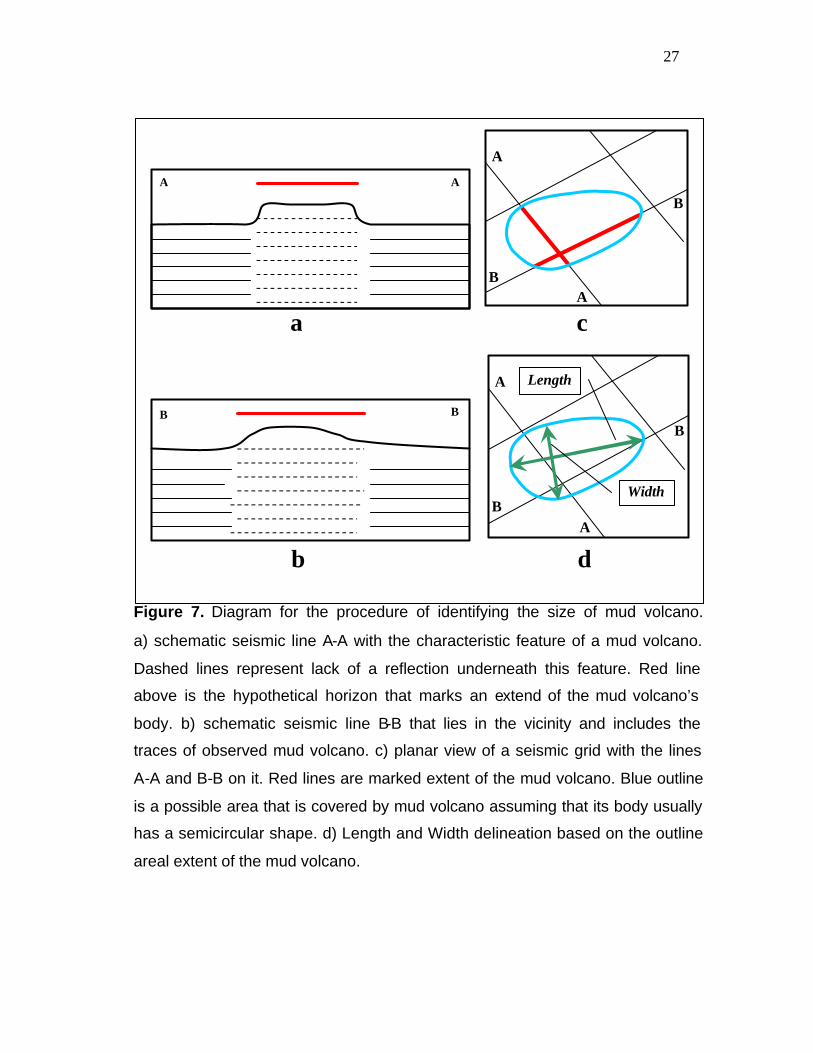
Figure 7. Diagram for the procedure of identifying the size of mud volcano.
a) schematic seismic line A-A with the characteristic feature of a mud volcano.
Dashed lines represent lack of a reflection underneath this feature. Red line
above is the hypothetical horizon that marks an extend of the mud volcano’s
body. b) schematic seismic line B-B that lies in the vicinity and includes the
traces of observed mud volcano. c) planar view of a seismic grid with the lines
A-A and B-B on it. Red lines are marked extent of the mud volcano. Blue outline
is a possible area that is covered by mud volcano assuming that its body usually
has a semicircular shape. d) Length and Width delineation based on the outline
areal extent of the mud volcano.
A A
B B
A
A B
B
A
A B
B
Length
Width
a)
c)
b)
d)
28
line (Figure 7a). The same procedure is applied to all other lines that intersect, or are in
the vicinity of the first seismic line, until there are no other visible traces of the analyzed
mud volcano (Figure 7b).
In the next stage of the analyses, the planar view of the seismic grid is employed
in order to determine the size and areal extent of the mud volcano. When the horizon that
is assigned to the mud volcano is retrieved, the outline of the interpreted feature is given
on the base map. By connecting the contours of the marked horizons, the areal extent of
the mud volcano could be defined, assuming that this feature has semicircular shape
(Figure 7c). A probable area occupied by the mud volcano is then found using the
planimeter option. The length of the mud volcano is assumed to be the longest distance
within the outlined region. The width is the line perpendicular to the length and it
captures the widest part of the outline (Figure 7d).
The height of mud volcanoes above the sea floor was determined from the
following equation:
2000)(
sec/1485 21 msmsmHχχ −
=
where: 1485 m/sec is the speed of sound wave through water; ms1χ is the two way
travel time of the sea floor by the vicinity of mud volcano in milli seconds; ms2χ stands
for the two way travel time of the highest point of the mud volcano in milli seconds and
2000 represents the conversion factor obtained by converting units in milli seconds to
the seconds and two way travel time into one way travel time (Figure 8). In cases where

29
several lines cross the body of one mud volcano, the line that shows the highest relief is
chosen for height extraction.
Shape of the Mud Volcanoes
Mud volcanoes on the seismic lines have different shapes and forms. Some form
a distinguished feature on the sea floor, whereas others merge into the surrounding relief
and form pools of unconsolidated gassy mud. Four types of mud volcanoes that are
distinguished based on their shape and appearance on the sea floor are described here:
Concave, Convex, Flat and Buried.
Figure 8. Diagram showing height extraction from the seismic data. 1485 m/sec – speed of sound wave through water; X1ms - two way travel time of the sea floor by the vicinity of mud volcano; X2ms - two way travel time of the highest point of the mud volcano; 2000 – conversion factor obtained by converting units in milli seconds to the seconds and two way travel time into one way travel time.
t t
ms2χ 2000)(sec/1485 21 msmsmH χχ −=
m s1χ
30
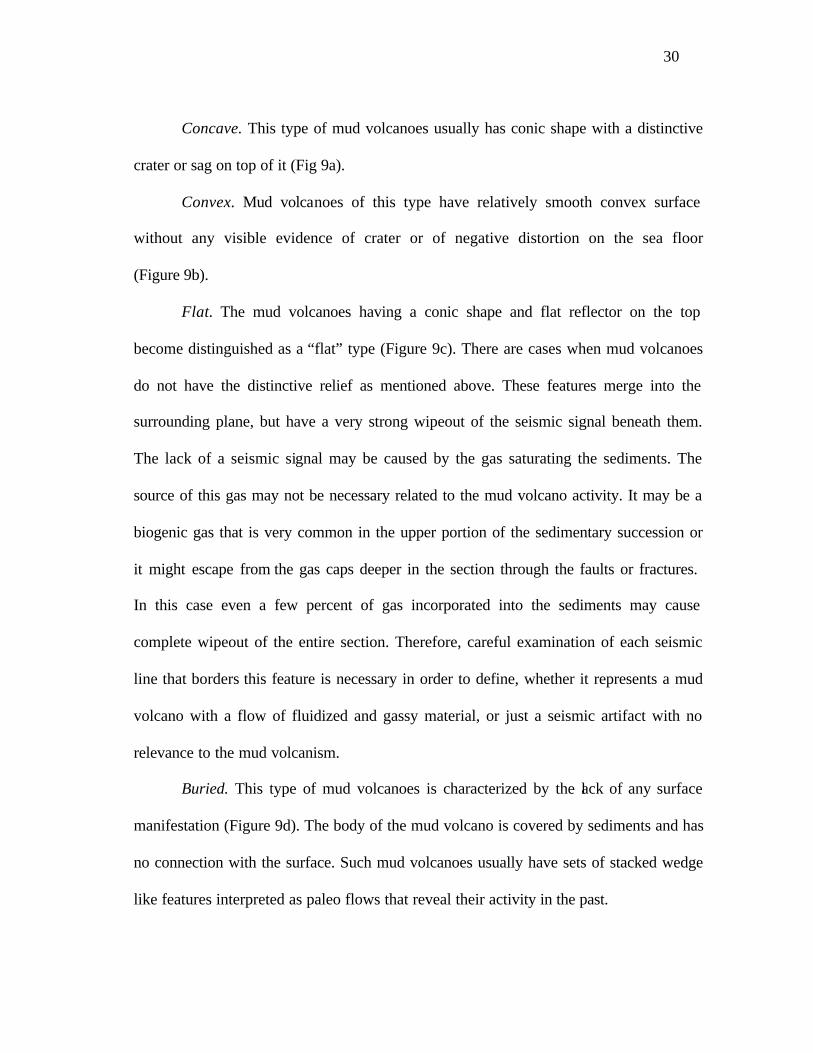
Concave. This type of mud volcanoes usually has conic shape with a distinctive
crater or sag on top of it (Fig 9a).
Convex. Mud volcanoes of this type have relatively smooth convex surface
without any visible evidence of crater or of negative distortion on the sea floor
(Figure 9b).
Flat. The mud volcanoes having a conic shape and flat reflector on the top
become distinguished as a “flat” type (Figure 9c). There are cases when mud volcanoes
do not have the distinctive relief as mentioned above. These features merge into the
surrounding plane, but have a very strong wipeout of the seismic signal beneath them.
The lack of a seismic signal may be caused by the gas saturating the sediments. The
source of this gas may not be necessary related to the mud volcano activity. It may be a
biogenic gas that is very common in the upper portion of the sedimentary succession or
it might escape from the gas caps deeper in the section through the faults or fractures.
In this case even a few percent of gas incorporated into the sediments may cause
complete wipeout of the entire section. Therefore, careful examination of each seismic
line that borders this feature is necessary in order to define, whether it represents a mud
volcano with a flow of fluidized and gassy material, or just a seismic artifact with no
relevance to the mud volcanism.
Buried. This type of mud volcanoes is characterized by the lack of any surface
manifestation (Figure 9d). The body of the mud volcano is covered by sediments and has
no connection with the surface. Such mud volcanoes usually have sets of stacked wedge
like features interpreted as paleo flows that reveal their activity in the past.

31
Figure 9. Types of mud volcanoes based on the shape and appearance on the seismic line. a) Concave; b) Convex; c) Flat; d) Buried.

32
Even after meticulous analysis of each seismic line there is still a limitation that
affects the precision of shape determination. 2D seismic coverage can not necessary
provide fully accurate picture of the mud volcano. The seismic line could cross the mud
volcano through the center as well as through the distant portion of its body. Depending
where the seismic line crosses the mud volcano, different seismic response will become
available. The same mud volcano can be interpreted as having concave shape, if the
seismic line intersects its center, or convex, if the line was shot trough its side (Figure
10). Therefore certain caution should be involved when analyzing these data.
Figure 10. Change in shape of a seismic response based on the place where the line intersects the mud volcano. a) When the seismic line is shot through the center of a mud volcano; b) When the seismic line is shot through the edge of mud volcano. Note change in shape of the same mud volcano to the right.
A
A
A A
B
B
B B
a
b
33
Seismic Artifacts
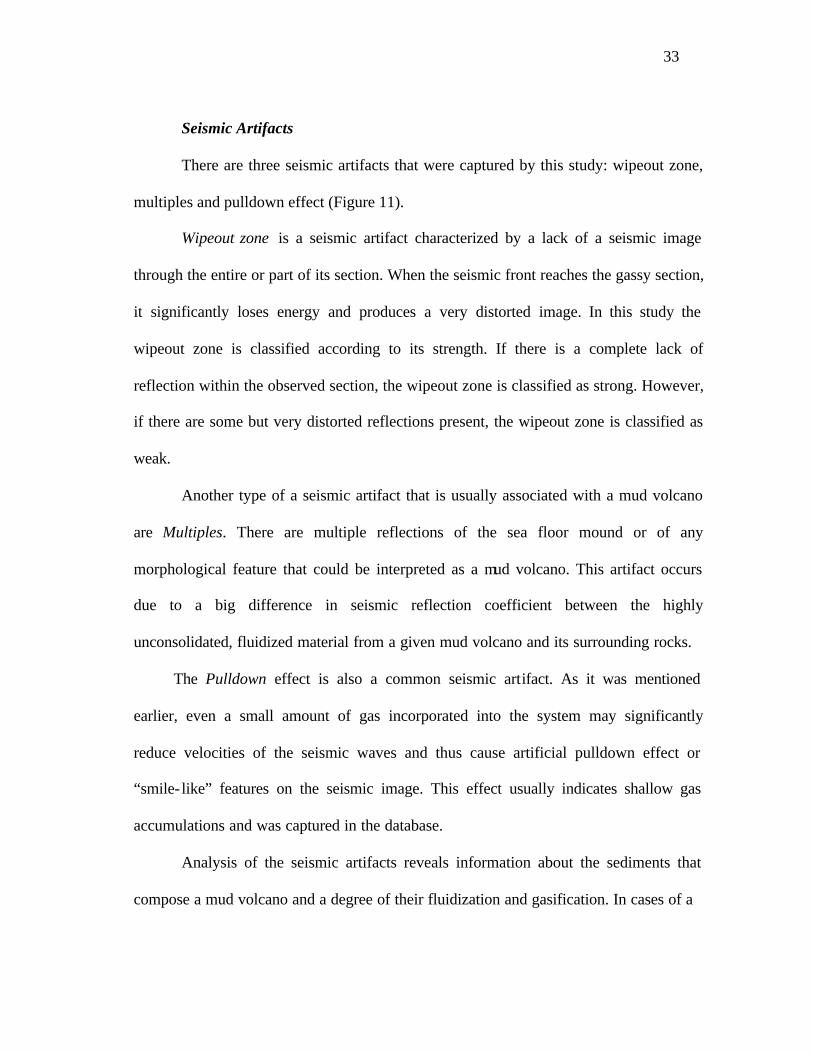
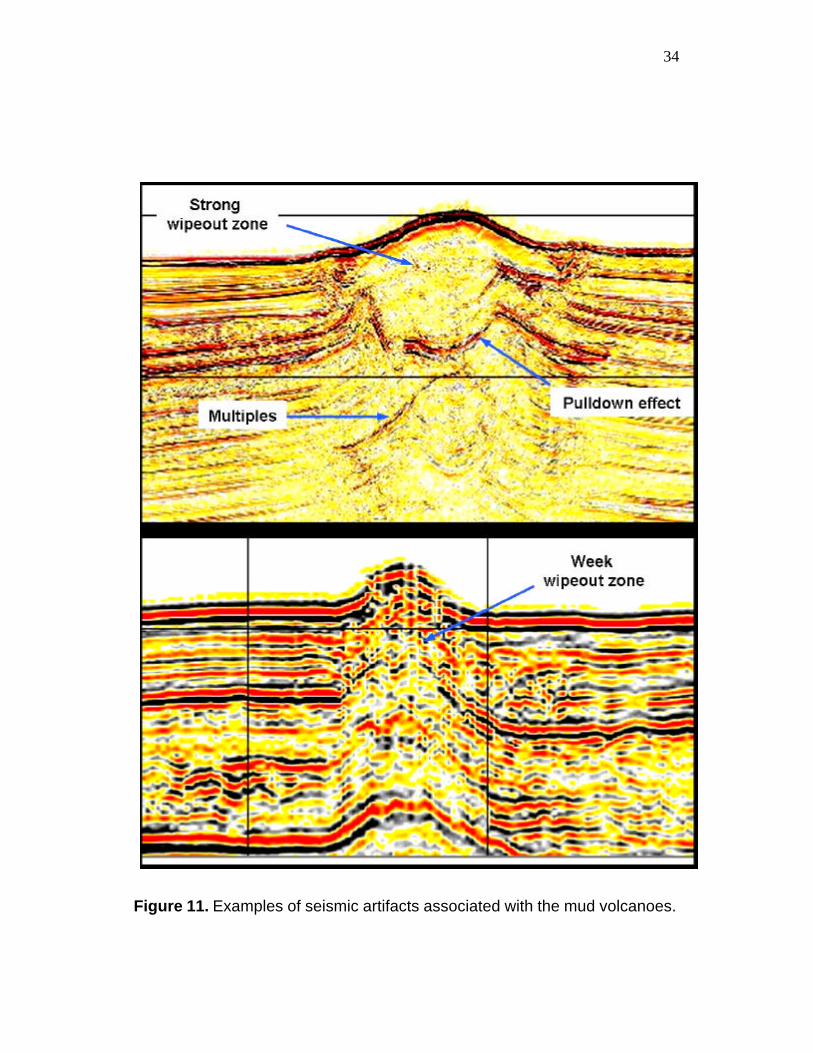
There are three seismic artifacts that were captured by this study: wipeout zone,
multiples and pulldown effect (Figure 11).
Wipeout zone is a seismic artifact characterized by a lack of a seismic image
through the entire or part of its section. When the seismic front reaches the gassy section,
it significantly loses energy and produces a very distorted image. In this study the
wipeout zone is classified according to its strength. If there is a complete lack of
reflection within the observed section, the wipeout zone is classified as strong. However,
if there are some but very distorted reflections present, the wipeout zone is classified as
weak.
Another type of a seismic artifact that is usually associated with a mud volcano
are Multiples. There are multiple reflections of the sea floor mound or of any
morphological feature that could be interpreted as a mud volcano. This artifact occurs
due to a big difference in seismic reflection coefficient between the highly
unconsolidated, fluidized material from a given mud volcano and its surrounding rocks.
The Pulldown effect is also a common seismic artifact. As it was mentioned
earlier, even a small amount of gas incorporated into the system may significantly
reduce velocities of the seismic waves and thus cause artificial pulldown effect or
“smile- like” features on the seismic image. This effect usually indicates shallow gas
accumulations and was captured in the database.
Analysis of the seismic artifacts reveals information about the sediments that
compose a mud volcano and a degree of their fluidization and gasification. In cases of a
34
Figure 11. Examples of seismic artifacts associated with the mud volcanoes.
35
strong occurrence of these artifacts the sediments may be assumed to be more fluidized
by gas. This implies that the system is active and that there is a constant gas supply.
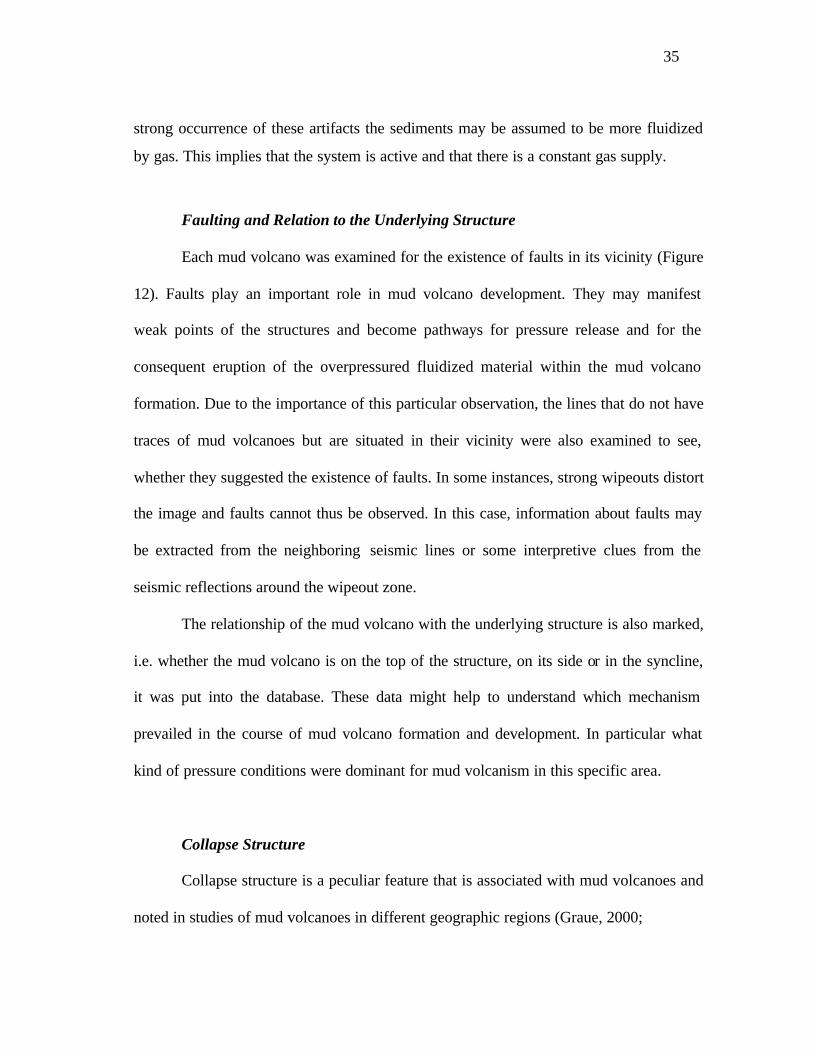
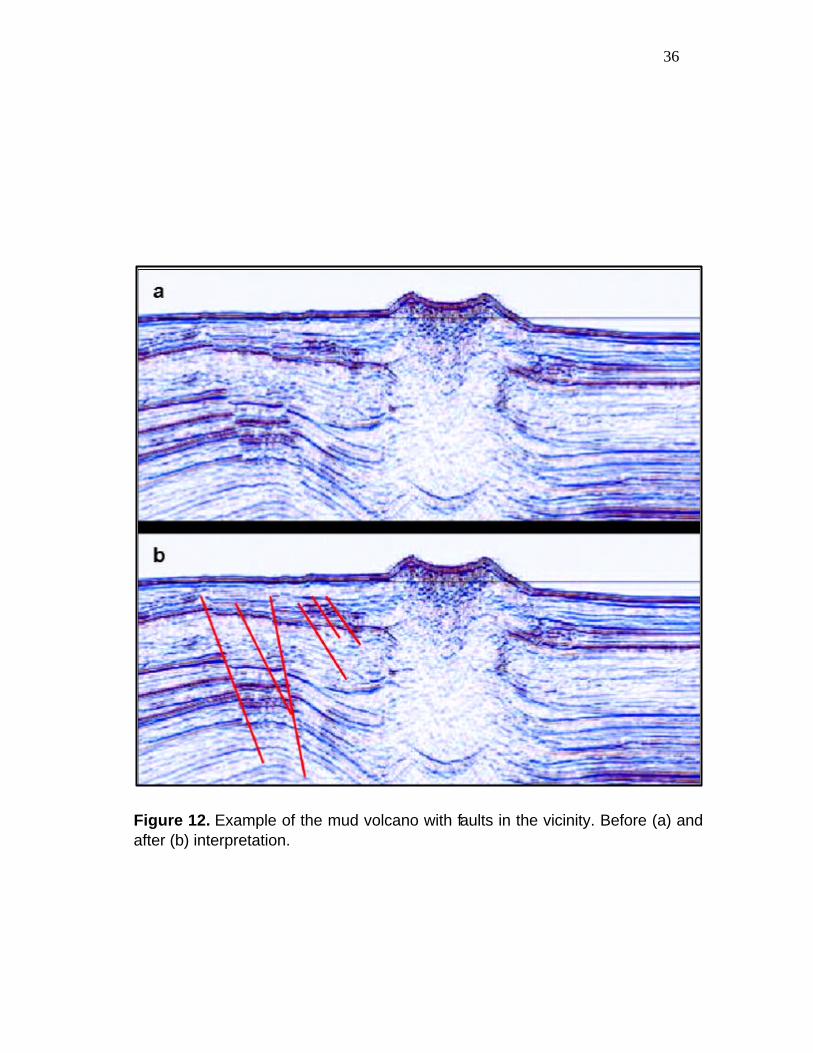
Faulting and Relation to the Underlying Structure
Each mud volcano was examined for the existence of faults in its vicinity (Figure
12). Faults play an important role in mud volcano development. They may manifest
weak points of the structures and become pathways for pressure release and for the
consequent eruption of the overpressured fluidized material within the mud volcano
formation. Due to the importance of this particular observation, the lines that do not have
traces of mud volcanoes but are situated in their vicinity were also examined to see,
whether they suggested the existence of faults. In some instances, strong wipeouts distort
the image and faults cannot thus be observed. In this case, information about faults may
be extracted from the neighboring seismic lines or some interpretive clues from the
seismic reflections around the wipeout zone.
The relationship of the mud volcano with the underlying structure is also marked,
i.e. whether the mud volcano is on the top of the structure, on its side or in the syncline,
it was put into the database. These data might help to understand which mechanism
prevailed in the course of mud volcano formation and development. In particular what
kind of pressure conditions were dominant for mud volcanism in this specific area.
Collapse Structure
Collapse structure is a peculiar feature that is associated with mud volcanoes and
noted in studies of mud volcanoes in different geographic regions (Graue, 2000;
36
Figure 12. Example of the mud volcano with faults in the vicinity. Before (a) and after (b) interpretation.

37
Kopf, 2002). This feature is the package of reflectors parallel to the overlying sediments
that collapse into a zone of mass deficiency (Figure 13). Usually these structures are
associated with listric faults. The base of the collapse structure may provide information
about the source of mud volcano.
Figure 13. Example of the collapse structure before (a) and after (b) interpretation. Note faults that are product of the collapse and next generation of the mud volcano activity (yellow line), separated from the major event by the time of quiescence.
a
b
38
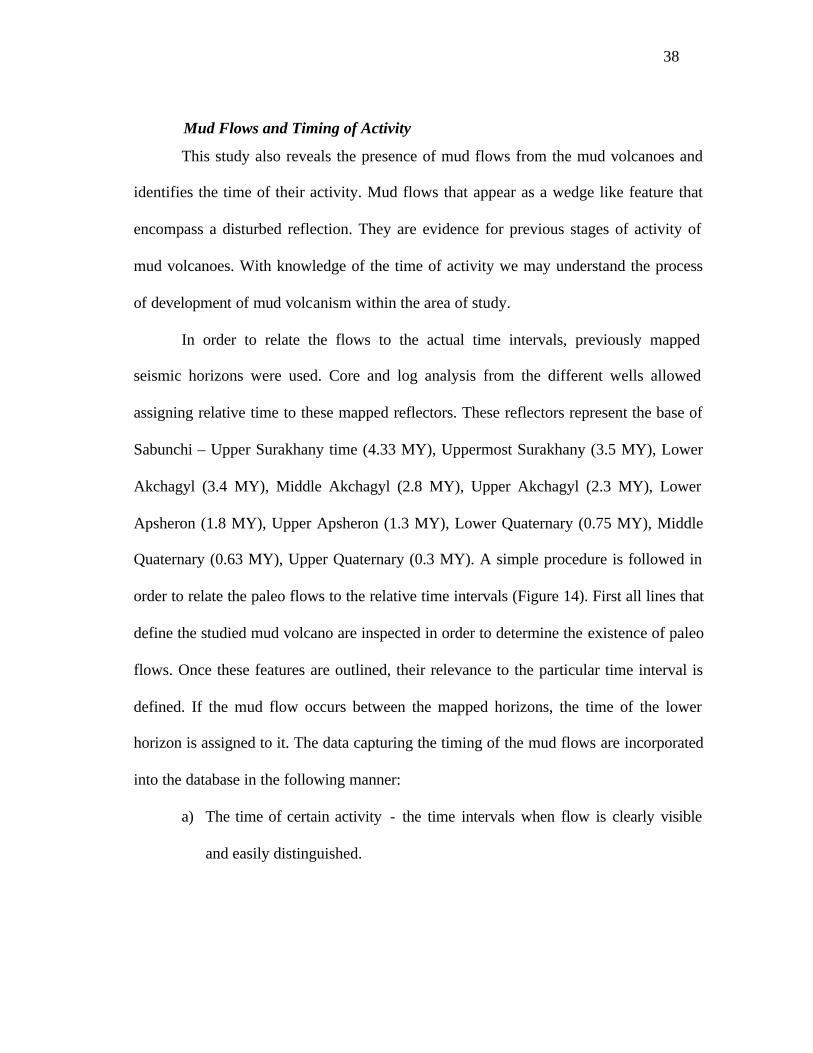
Mud Flows and Timing of Activity
This study also reveals the presence of mud flows from the mud volcanoes and
identifies the time of their activity. Mud flows that appear as a wedge like feature that
encompass a disturbed reflection. They are evidence for previous stages of activity of
mud volcanoes. With knowledge of the time of activity we may understand the process
of development of mud volcanism within the area of study.
In order to relate the flows to the actual time intervals, previously mapped
seismic horizons were used. Core and log analysis from the different wells allowed
assigning relative time to these mapped reflectors. These reflectors represent the base of
Sabunchi – Upper Surakhany time (4.33 MY), Uppermost Surakhany (3.5 MY), Lower
Akchagyl (3.4 MY), Middle Akchagyl (2.8 MY), Upper Akchagyl (2.3 MY), Lower
Apsheron (1.8 MY), Upper Apsheron (1.3 MY), Lower Quaternary (0.75 MY), Middle
Quaternary (0.63 MY), Upper Quaternary (0.3 MY). A simple procedure is followed in
order to relate the paleo flows to the relative time intervals (Figure 14). First all lines that
define the studied mud volcano are inspected in order to determine the existence of paleo
flows. Once these features are outlined, their relevance to the particular time interval is
defined. If the mud flow occurs between the mapped horizons, the time of the lower
horizon is assigned to it. The data capturing the timing of the mud flows are incorporated
into the database in the following manner:
a) The time of certain activity - the time intervals when flow is clearly visible
and easily distinguished.
39
Figure 14. Scheme for identifying time of mud flows. a) Seismic line without interpretation; b) Same seismic line with identified mud flow features and c) mapped reflectors. The time of the first from the top flow is H1 time, second is H2 time and etc.
40
b) The time of probable activity - the time intervals when flow is difficult to
recognize because of low resolution of the seismic data, decreasing quality of
the seismic data with depth or due to other seismic artifacts that distort the
image. In this case, there are assumptions made when revealing the evidence
of paleo activity.
c) The time of no activity – the time intervals when there is no visible evidence
of mud flows. However, there are instances when the seismic lines are
disturbed by the wipeout zones and there is no opportunity to determine paleo
activity. If none of the bordering seismic lines reveal the evidence of flow
then this particular mud volcano is assumed to have no past activity. In
addition, the presence of large and shallow “mud chambers”, their tendency
to enlarge themselves, the ability of mud to be injected to the subsurface
zones of weakness and consequently form highly irregular shapes
substantially complicate precise dating of the mud volcano activity (Cooper,
2001).
Observations and Database Analysis
Here the analysis of data described above is presented in order to show the major
trends in their distribution. The interpretation of the observations will be discussed in the
next chapter.
The analysis of the seismic lines reveals 99 mud volcanoes within the area of
study. The map presented in Figure 15 shows the position and areal extent of each mud
41
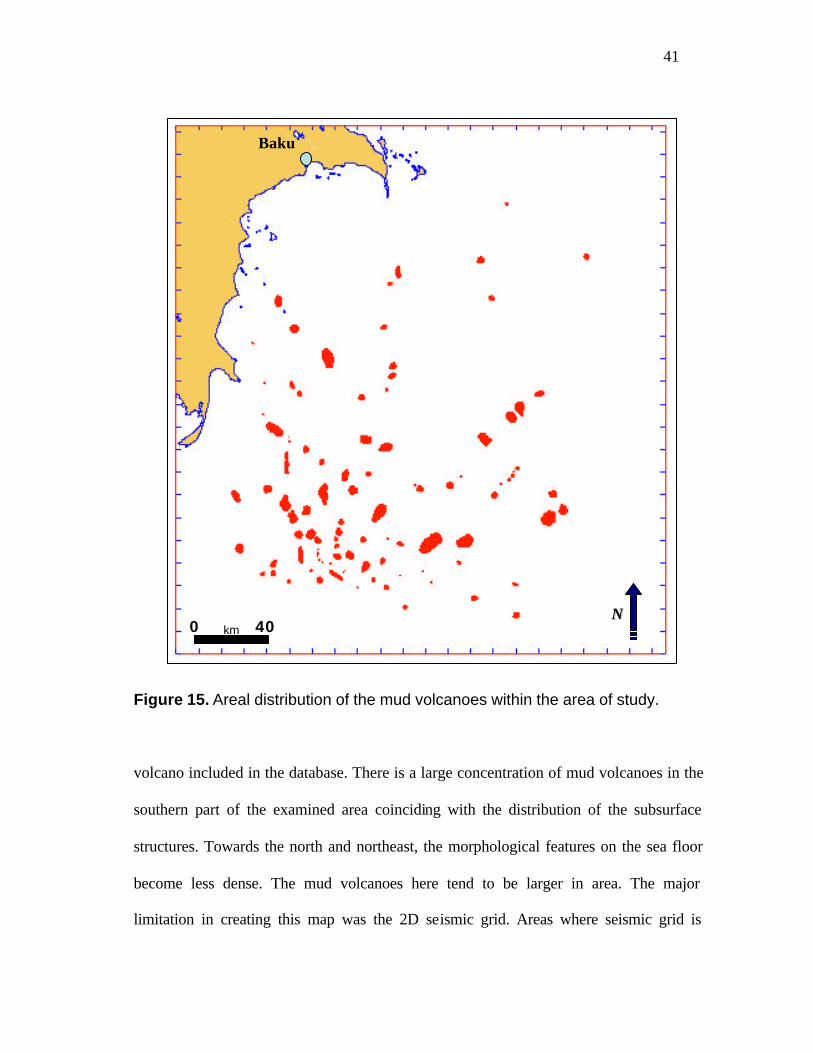
Figure 15. Areal distribution of the mud volcanoes within the area of study. volcano included in the database. There is a large concentration of mud volcanoes in the
southern part of the examined area coinciding with the distribution of the subsurface
structures. Towards the north and northeast, the morphological features on the sea floor
become less dense. The mud volcanoes here tend to be larger in area. The major
limitation in creating this map was the 2D seismic grid. Areas where seismic grid is
Baku
NN 0 40 km

42
coarse (Figure 1) should be considered less reliable in comparison with the ones of a
finer grid. However, even though the spacing between the lines range between 5 to 5 km
and 2.5 to 2.5 km, it is necessary to analyze the data with a certain degree of caution.
Studies on mud volcanoes onshore as well as numerous 3D surface extractions of the sea
floor around mud volcanoes (Guliyev and Feyzullayev, 1995; Graue, 2000; Dimitrov,
2002; Fowler et al., 2000) show that the body of a mud volcano may consist of many
morphological features (gryphones, salsas, domes). These elements can occur on the
volcanic plateau itself or can be attached to it within some proximity. Therefore, the
feature that is interpreted as a separate mud volcano might be a part of one volcanic
system. The 2D seismic coverage is too coarse to distinguish between these relatively
small features.
The height and areal extent of the mud volcano are the most important values
among those that describe an actua l size of the feature. Studies of onshore mud
volcanoes in Azerbaijan revealed a relationship between these two parameters (Guliyev
and Feyzullayev, 1995). According to Azeri scientists, the height and areal extent of a
mud volcano depends on the physical properties of the material that had been erupted.
Lerche and Bagirov (1999) describes different variables of mud volcanoes
(length, width, area, and diameter) observed onshore Azerbaijan. He derives equations
showing the relationships between these variables for the onshore data. Offshore data
from this study when applied to his equations give significant different results. Lerche
and Bagirov (1999) notes that mud volcano flow is different on land surfaces than on the
sea floor. In offshore conditions, turbidity flows associated with the mud volume release
43
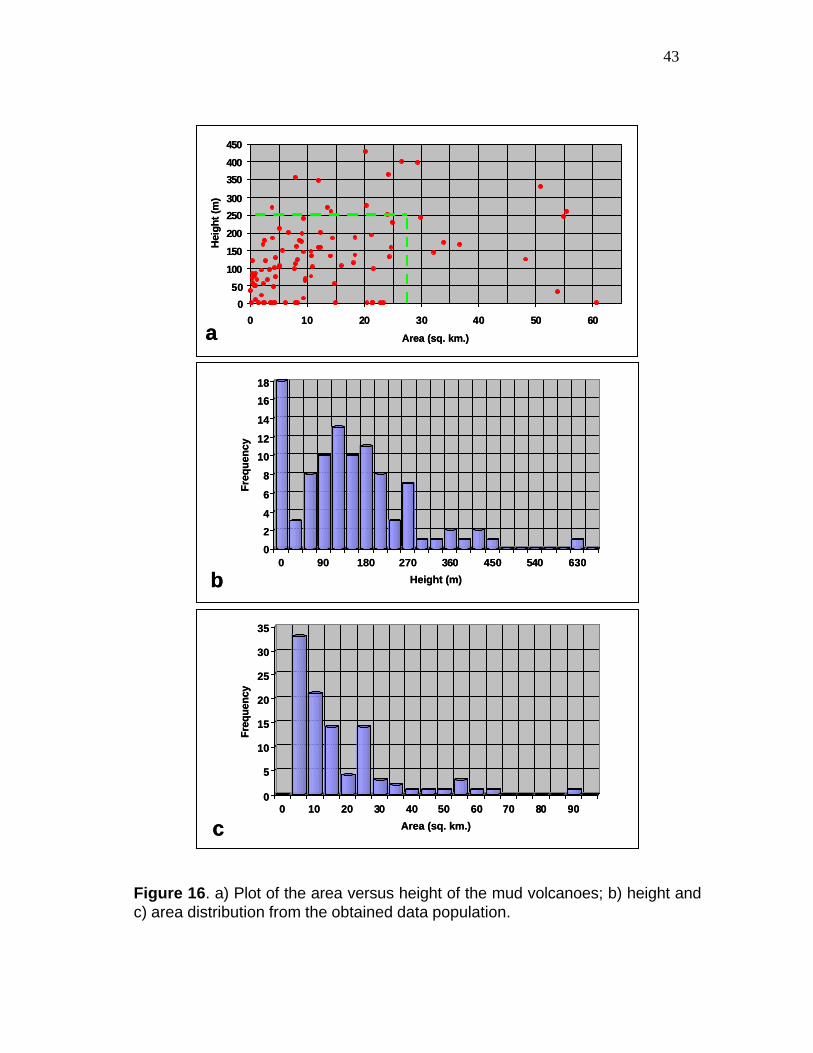
Figure 16. a) Plot of the area versus height of the mud volcanoes; b) height and c) area distribution from the obtained data population.
0
2
4
6
8
10
12
14
16
18
Fre
qu
ency
0 90 180 270 360 450 540 630
Height (m)
0
5
10
15
20
25
30
35
Freq
uenc
y
0 10 20 30 40 50 60 70 80 90
Area (sq. km.)
b
c
a0
50
100
150
200
250
300
350
400
450
0 10 20 30 40 50 60
Area (sq. km.)
Hei
ght
(m)
0
2
4
6
8
10
12
14
16
18
Fre
qu
ency
0 90 180 270 360 450 540 630
Height (m)
0
5
10
15
20
25
30
35
Freq
uenc
y
0 10 20 30 40 50 60 70 80 90
Area (sq. km.)
b
c
a0
50
100
150
200
250
300
350
400
450
0 10 20 30 40 50 60
Area (sq. km.)
Hei
ght
(m)
44
may decrease the length of the mud flow. The low viscosity of mud flows in marine
conditions compared with those on land would make the distance covered by a marine
mud flow greater. However, the areal extension of the mud volcanoes both onshore and
offshore depends on the local morphology and on the angle of the slope.
Simple statistical analysis of the height and areal extent of mud volcanoes
(Figure 16 b, c) shows exponential distribution of these data sets. Probability plots
constructed to confirm this observation also show a non- linear pattern within these
values. About 80% of all mud volcanoes do not exceed 240-270 meters in height and 25
square kilometers in areal extent (Figure 16a). There are instances of mud volcanoes
with great areal extent and very low relief as well as of small mud volcanoes with
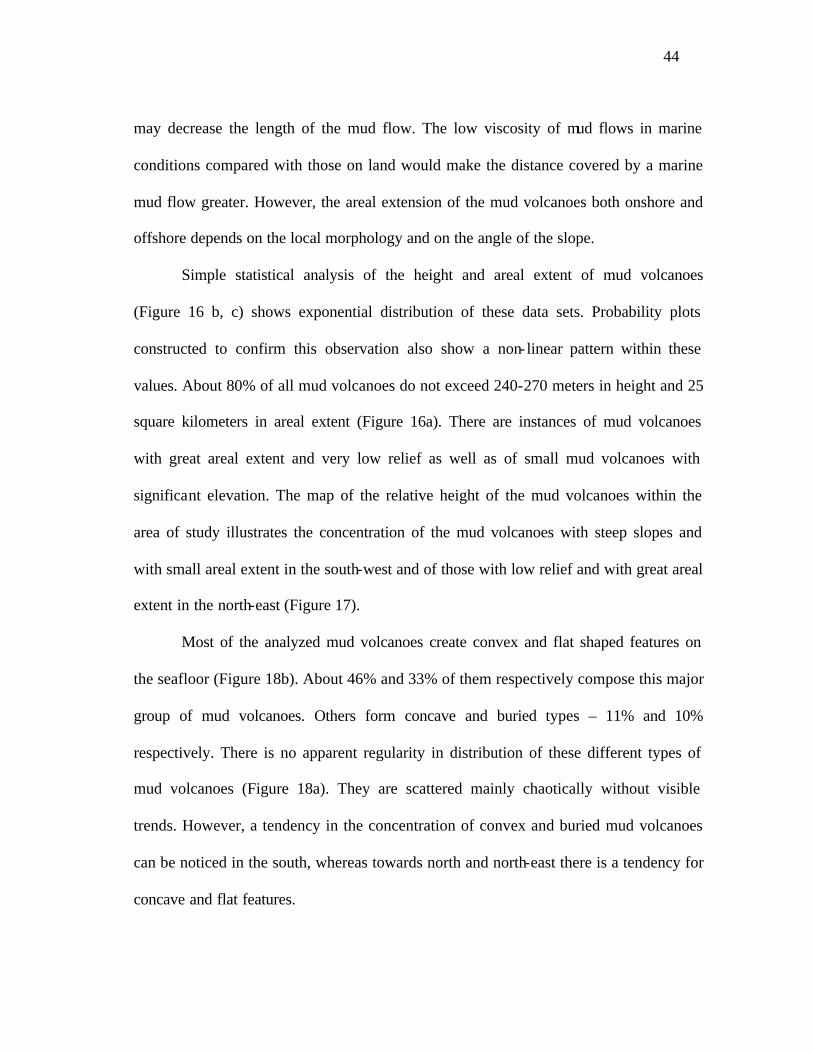
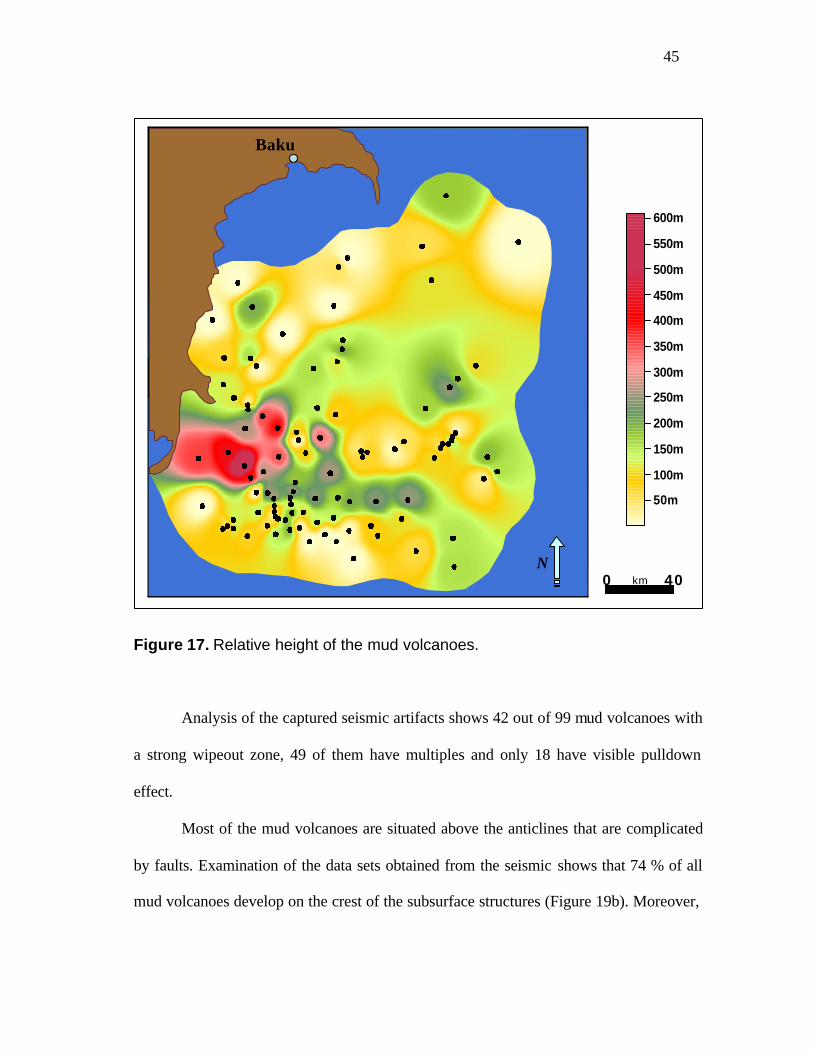
significant elevation. The map of the relative height of the mud volcanoes within the
area of study illustrates the concentration of the mud volcanoes with steep slopes and
with small areal extent in the south-west and of those with low relief and with great areal
extent in the north-east (Figure 17).
Most of the analyzed mud volcanoes create convex and flat shaped features on
the seafloor (Figure 18b). About 46% and 33% of them respectively compose this major
group of mud volcanoes. Others form concave and buried types – 11% and 10%
respectively. There is no apparent regularity in distribution of these different types of
mud volcanoes (Figure 18a). They are scattered mainly chaotically without visible
trends. However, a tendency in the concentration of convex and buried mud volcanoes
can be noticed in the south, whereas towards north and north-east there is a tendency for
concave and flat features.
45
Figure 17. Relative height of the mud volcanoes.
Analysis of the captured seismic artifacts shows 42 out of 99 mud volcanoes with
a strong wipeout zone, 49 of them have multiples and only 18 have visible pulldown
effect.
Most of the mud volcanoes are situated above the anticlines that are complicated
by faults. Examination of the data sets obtained from the seismic shows that 74 % of all
mud volcanoes develop on the crest of the subsurface structures (Figure 19b). Moreover,
50m
100m
150m
200m
250m
300m
350m
400m
450m
500m
550m
600m
Baku
0 40km N
46
Figure 18. a) Areal distribution of the mud volcanoes of different shapes; b) pie diagram reflecting distribution of the mud volcanoes with the specific shape.

47
Figure 19. a) Position of the mud volcanoes relative to subsurface structure; b) pie diagram reflecting distribution of the mud volcanoes relative to the subsurface structure.

48
there are 21 mud volcanoes that form on the flanks. Analysis of the database for an
existence of distinctive collapse structures reveal 35 mud volcanoes associated with
them. Syncline mud volcanoes are of a great interest to scholars. Their mechanism of
formation is still not very well understood. It is possible that these features represent
evidence of a large pressure breakthrough that developed under very active tectonic
conditions. There are 5 mud volcanoes that formed in the synclines within the area of
study. Most of the mud volcanoes that are situa ted above the flanks of the subsurface
structures are concentrated in the south (Figure 19a). Similar pattern follows distribution
of syncline mud volcanoes. However there is one case when a syncline mud volcano
occurs on the north between two big structures and will be discussed further in the next
chapter.
Analysis of paleo flows reveal cyclicity in mud volcano development. Figure 20
represents mud volcano activity through time captured in a cumulative curve of activity
of the analyzed mud volcanoes from lower Pliocene time through upper Pleistocene.
The oldest time of activity within the area of study corresponds to the Surakhany-
Sabunchi time (4.33 MY). In this study, this period is considered as the beginning of the
mud volcano activity in the offshore South Caspian Basin. As shown in the activity
chart, there are several cycles of mud volcano development. Each cycle consists of the
period of increasing activity, of the period of stable activity and of the period of general
quiescence followed by the beginning of the next cycle. In order to observe the evolution
of mud volcano development in offshore Azerbaijan, a series of maps that reveal the
activity in different time periods are created. These are intensity maps that

49 49
Figure 20. Mud volcano activity through time. See text for details.
50
show the areas of definite and possible activity as well as areas where no activity was
discovered (see Figures 21a–21f). The following discussion concentrates on the intervals
of the greatest mud volcano activity.
During Sabunchi-Surakhany time (4.33 MY) mud volcano development initiated.
There is only one mud volcano that has certain activity within this region. It should be
pointed out that this volcano developed in the syncline zone. Two other locations, one in
the south and another one in the north, may have also been active during this period of
time.
Uppermost Surakhany time (3.5 MY) has a similar appearance except that one of
the mud volcanoes in the south became active. In this study, this time is recognized as
the beginning of the first cycle of mud volcano activity within the South Caspian Basin.
By the Upper Akchagyl time (2.3 MY), the area evolves into a much intense
stage. There are more volcanoes in the south that initiate their activity during this time.
The central part of the area also underwent mud volcano development, while the
northern part was still without evidence of mud volcano activity.
Upper Apsheron time (1.3 MY) shows the progressive spreading of the mud
volcano activity from south to north. Along with many other mud volcanoes that
developed during this time in the south, the northern part also substantially evolves into
this stage. It is important to notice that some of the previously active mud volcanoes
actually ceased development and became dormant.
Lower Quaternary time (0.75 MY) is manifested by even further intensification
of the mud volcano development process. Along with the mud volcanoes in the north

51
Figure 21a. Maps of mud volcano development in different periods of time: Activity in Subunchi–Upper Surakhany time (4.33 MY).
4.33 MY
Baku
No Activity
Areas of possible activity
Areas of certain activity
NN
0 40 km
52
Figure 21b. Maps of mud volcano development in different periods of time: Activity in Uppermost Surakhany time (3.5 MY).
Baku 3.5 MY
No Activity
Areas of possible activity
Areas of certain activity
NN
0 40 km

53
Figure 21c. Maps of mud volcano development in different periods of time: Activity in Upper Akchagyl time (2.3 MY).
Baku 2.3 MY
No Activity
Areas of possible activity
Areas of certain activity
NN
0 40 km
54
Figure 21d. Maps of mud volcano development in different periods of time: Activity in Upper Apsheron time (1.3 MY).
Baku 1.3 MY
No Activity
Areas of possible activity
Areas of certain activity
NN
0 40 km
55
Figure 21e. Maps of mud volcano development in different periods of time: Activity in Lower Quaternary time (0.75 MY).
Baku 0.75 MY
No Activity
Areas of possible activity
Areas of certain activity
NN
0 40 km

56
Figure 21f. Maps of mud volcano development in different periods of time: Activity in Upper Quaternary time (0.3 MY).
0.3 MY Baku
No Activity
Areas of possible activity
Areas of certain activity
NN
0 40 km

57
and in the central part of the region, there are more volcanoes in the south that became
active during this time.
Finally, by the Upper Quaternary time (0.3 MY), most of the region is involved
in mud volcanic activity. However, some mud volcanoes in the south-west region, after
being active since lower Akchagyl have become inactive.
In conclusion, the following summarizes the major observations that were made
after extensive analysis of the database:
• 99 Mud Volcanoes have been recognized.
• Most mud volcanoes are situated above anticlines that are complicated by
faults.
• Mud volcanoes that develop on the flanks of the structures are clustered in
the south.
• Syncline mud volcanoes are concentrated also in the south.
• 35% of mud volcanoes have a distinctive collapse feature associated with
them.
• Mud volcanoes with steep slopes and with small areal extent are mainly
concentrated in the south-west.
• Mud volcanoes with low relief and with great areal extent are clustered in the
north-east.
• Four types of mud volcanoes were recognized based on the shape of the
morphological features on the sea floor: Concave, Convex, Flat and Buried.

58
• Cyclicity in mud volcano development was revealed, with their beginning in
Lower Pliocene (Sabunchi-Surakhany time) and with the greatest activity
during Upper Pleistocene (Upper Apsheron – Quaternary time).
• In general, there is a chaotic pattern in distribution of all mud volcano
parameters (shape, size, etc.).

59
CHAPTER IV
DISCUSSION AND CONCLUSIONS
Mud volcanism is a widespread phenomenon. It occurs in many regions that
have in general similar geological settings. Figure 22 shows the geographical occurrence
of mud volcanoes on Earth. They predominantly develop at convergent plate margins,
where high volume of the sediments is subjected to great lateral and vertical stresses.
The actual number of features, as well as the amount of material involved in mud
volcanism, is much greater in offshore areas than onshore.
Mud volcanoes in collisional settings show many similarities in geometry, age,
material extruded, and volatile emission. The region where most of the mud extrusions
have been found is in the Mediterranean Sea and Tethyan Belt, stretching from south of
Greece over the Black and Caspian Seas into Azerbaijan, the Crimea and Taman
Peninsulas, Iran, and Turkmenistan into the Makran coast. Azerbaijan is the region of
the world’s densest onshore and offshore population of mud volcanoes and is an
excellent area to study this phenomenon. First, they have been described in the works of
many scholars (Kulschin, 1845; Abich, 1863; Jakubov et al., 1971; Guliyev and
Feyzullayev, 1995; Lerche and Bagirov, 1999) and second, the mud volcanoes in this
region represent a collection of features with different forms and sizes from onshore to
marine settings.
Extensive studies of onshore mud volcanoes in Azerbaijan concluded that mud
volcanism in this area is a manifestation of mud diapiric processes. The theory proposed

60
Figure 22. Distribution of mud volcanoes on Earth. Adopted from A.J. Kopf,
2002.
61
by Goubkin (1934) explained the mechanism of mud volcano formation in Azerbaijan
and was widely accepted among other scholars. He believed that since Akchagyl time
overpressure builds conditions for plastic shale movement up to the dome of the
structures. Water, gas and later oil began to migrate in the same direction concentrating
on the top of the growing structure, where fracturing and faulting of the overburden
rocks provide a passage for the gas and water to escape. Some amount of the fluid
reaches the surface and forms a natural seepage. When the rate of gas supply becomes so
high that its discharge is no longer sufficient the greatest pressure builds up on top of the
structure. This stress is released as an eruption of the fluidized shale, with enormous
amount of gas destroying the dome and taking surrounding rocks to the surface. Usually
eruption occurs through the fault or faults system. However, even little cracks or
fractures within the overburden rocks could be enough for the triggering the mud
volcano mechanism.
By definition diapirism is the process of movement of a plastic body from areas
of greater pressure to areas of less pressure. Therefore, diapirs are bodies of fine-grained
sediments produced by the plastic deformation that are capable to deform and rupture
overlying rocks. They usually have rather intrusive nature, whereas mud volcanoes are
characterized by the extrusive mechanism of a moving mass. In addition, mud diapirism
is described mainly as a slow process of a movement of a plastic rock over an
instantaneous event in a mud volcano case.
Many mud volcanoes develop in the crest of the diapirs (Dimitrov, 2002). It is
also true that most of the studies of mud volcanoes in Azerbaijan were made from

62
onshore observations where mud diapirism was confirmed not only by seismic methods
but also by numerous wells available for analysis. However, there are many examples
when mud volcanoes are not connected with diapirs (Dimitrov, 2002). In this case, the
term diatreme is used. It is type of mud extrusive feature that evolve from the violent
eruption of overpressured mud, cross-cutting the overlying strata like a dyke (Kopf,
2002). Mud diapirs and diatremes are neatly distinguished on the grounds of the
mechanical stress and the mud intrusions that they originate.
In offshore realms of Azerbaijan, the only data is extensive 2D and 3D seismic
acquisition. Seismic data acquired across the mud volcanoes showed enormous
parabolic, diapir like zones of signal distortion. From a conventional point of view on
mud volcanism in Azerbaijan, a seemingly obvious conclusion was that the diapirs
compose the core of mud volcanoes (Guliyev and Feyzullayev, 1995; Jakubov et al.,
1971). Regional compression was invoked to attribute to a weak material of almost
incomprehensible strength to pierce huge columns of rock. It could be very difficult to
initiate such a system, where mechanical objections were not considered. The recent
models suggest that mud diapirs were initiated during the deposition of the Lower
Productive Series in Late Miocene time and underwent repeated intermittent inflation
(Cooper, 2001). Such a model would require thinning of the syndepositional sedimentary
series across the rising high. In this particular study, after careful examination of the
strata attached to the discontinuous zone of weak reflections syndepositional thinning
was not detected. The majority of mud volcanoes are related to the regional deep fault
systems along with shallower listric and normal faults. Such a setting suggests that mud

63
volcanoes in this area form due to instantaneous event of pressure release through
diatremes.
Mud volcano formation is controlled by several factors including, recent tectonic
activity, particularly compressional settings, sedimentary or tectonic loading due to rapid
sedimentation, continuous hydrocarbon generation, and existence of fine-grained plastic
sediments. All of these factors prevail in the South Caspian Basin. However, it is crucial
to understand the origin of these forces in order to reveal the mechanism of mud
volcanism in the region.
The South Caspian Basin is known for its abnormally high formation pressures.
The formation of overpressure is controlled by two major factors. The first factor is the
relative isolation of rocks from the effects if fluid flow. The second factor is the change
of either fluid volume and / or pore volume that may occur during the burial history of a
given sequence of rocks. There are three major mechanisms that result in the
development of abnormal high formation pressure: 1) sedimentation, 2) hydrocarbon
generation, 3) the vertical migration of fluids. In a broader sense there are numerous
ways to create anomalous subsurface pressure. They include:
Nonequilibrium compaction is believed to be the dominant mechanism in
formation of overpressured sediments. During burial and compaction, water is physically
expelled from sediments. In thick, rapidly deposited fine-grained sections reductions in
porosity and permeability related to compaction inhibit the flow of water out of the
shale. As burial continues, fluid pressure increases in response to bearing the increasing
weight of the overburden.
64
Tectonic compression creates abnormal pressure similar to the nonequilibrium
compaction mechanism. Horizontal compressive forces, directed at zones of low
porosity and permeability act on the pore fluids and cause pore pressure to increase.
Aquathermal pressuring occurs when increasing temperature with depth of burial
causes pore waters to expand at a greater rate than the rock. If pore waters are prevented
from escaping by the flow barrier, pore pressure will increase.
Transformation of smectite to illite refers to the fact that at a temperature of
about 221 F, smectite, which is a mineral composing shale, begins altering to illite and
expels a large volume of water. This way, if the rock is sealed, expelled water combined
with the thermal expansion of the pore fluids will increase the formation pressure.
Hydrocarbon generation is thought to be the next major contributor after
compaction forces to the pressure increase in the formation rocks. The generation of
hydrocarbons involves the transformation of kerogen in organic matter into liquid and
gaseous phases. This transformation results in an increase in fluid volume of the organic
matter that will lead to the growth of formation pressure.
Other types of mechanisms that evolve in increase formation pressure are
Osmosis, Reverse Osmosis, Gypsum/anhydrite transformation, Buoyancy, Irregularities
in the potentiometric surface and Isolation and uplift of deep, gas-filled compartments.
These mechanisms may contribute to the overall increase of the pressure within the
sediments but their influence is rather minimal (if any) to the magnitude of overpressure.
Field data show the presence of unaltered montmorillonite in deposits around
Baku Archipelago at depth down to 6 km (Buryakovsky et al., 1995). That indicates a

65
subordinate role of montmorillonite dehydration in the total process of abnormal
formation pressure development. Luo et al. (1994) conclude that most of the pore-fluid
generating mechanisms (illite to smectite transforma tion, aquathermal expansion,
kerogen maturation) contribute little to overpressure increase. Kerogen to gas or oil to
gas transition produce significant volume changes (Rensbergen et al., 1999). In
addition, Forbes et al. (1992) and Sandal (1996) report that even thin units of a rock can
form effective permeability barriers. Faults of limited throw and relatively thin shale
beds can maintain high pressure differences for a relatively long time.
The stratigraphic section of the South Caspian Basin consists of a high
percentage of the fine-grained matrix (Figure 6). Sand succession highly interbedded by
shales and silts. Moreover, sediments that are brought by the Kura river have poor
reservoir quality due to high content of a silt material. Azeri scientists are inclined to
believe that mud volcanism in Azerbaijan is related only to the Maykop plastic shale
succession (Guliyev and Feyzullayev, 1995; Jakubov et al., 1971), a theory confirmed by
the analyses of rocks sampled around onshore mud volcanoes. However, in offshore
where Maykop lies at depth of about 12 km, it would require extreme high pressures to
overcome the overburden and instantaneously break through to the surface. More likely,
due to shaly nature of the stratigraphic section, the mud volcano activity is not always
related to the Maykop shale succession. Mud volcanism can occur from a shallower
depth from any stratigraphic zone that can accommodate and store the great pressure and
have sufficient plasticity to be transported to the surface.
66
Compressional settings are also important in mud volcano formation and
development. The map of distribution of the mud volcanoes (Figure 15) illustrates the
position of these features along the regional structural trends (compare Figure 15 with
the Figure 2). The general occurrence of the mud volcanoes above the structural crest
also suggests that their origin is due to structural growth. The appearance of mud
volcanoes on the flanks of the structures is usually associated with faults that detach
subsurface structure. Such observations may reveal violent escape of the fluidized and
highly overpressured material through the faults and cause of the seal failure. The
existence of growth faults with a curved shaped at the seabed (ring faults) are connected
to the mud volcanoes. Consequently the question arises whether the mud volcanoes are
triggered by the activity of these faults, or conversely is there any connection at all.
Graue (2000) in his work on mud volcanoes in Nigeria suggests that sudden pressure
release associated with eruption will cause trembling of undercompacted shale at the
root and the liquefied and gasified mud subsequently flows up the vent. This explains the
distorted seismic image in the root zone. The rapid kinetics of such an eruption causes
rapid depletion of pressure to a level bellow the fracture pressure of the seal. It is the
point when the roof collapses into the vent and plugs the conduit to the surface. This
collapse is believed to account for the concentric faults and the dipping section seen on
the seismic data (Figure 13). This model proposes that eruption triggers spontaneous
activity along the listric faults. Contraction occurs at the base, with corresponding fault
displacement up section (Graue, 2000). In addition, use of seismic coherency attributes
and mapping the fault pattern illustrate that mud volcanoes in the South Caspian Basin

67
occur strictly in areas of local tension and within regional compressive fields (Cooper,
2001).
Syncline mud volcanoes observed in this study may be good indicators of a
relationship of a mud volcanism with the regional compressional fields. First of all, these
features occur mainly in the south, where the high density of subsurface structures
suggests intense structural growth, therefore highly active compressional settings. It is
plausible to expect that due to the great magnitude of lateral compression the fluidized
mud overcomes fracture pressure and breaks the seal immediately in place of its origin,
rather than to transmit the pressure to the top of the structure. Furthermore, the analysis
of the location of a northern syncline mud volcano is important. This mud volcano is
situated between two structural trends directed south-east and south-west respectively
(compare Figures 2 and 19), implying tha t this area has undergone compression from
both sides with an opposite direction. From a stratigraphic point of view this location is
influenced by deposition of two different river systems. From the north it is the Volga
River that in this particular location is represented by fine-grained sediments of distal
delta deposits. From the west it is the silty and muddy deposits of the Kura River.
Therefore, the highly overpressured succession of predominantly fine-grained plastic
sediments being compressed by the lateral tectonic load overcame the seal capacity of
the overburden and formed this remarkable volcano. In addition, this mud volcano is the
oldest extrusive feature that was detected by this study (refer to the series of maps on
Figure 21). Its activity most probably began in Sabunchi time and continued through
present.

68
Example of mud volcanoes over the Shah Deniz structure, offshore Azerbaijan
(Fowler, 2000) shows that the time of their activity offsets the beginning of structural
growth in the beginning of Akchagyl time. Therefore, one can expect a relationship of
the mud volcano formation with the major elements of petroleum system. The lack of
regional pressure data confines the possibility to compare the pulses of structural growth
and mud volcano activity in this region. However, knowledge of the other elements of
petroleum system may reveal some clues to the prevailing factors of the mud volcanism
in South Caspian Basin.
Since the middle Pliocene time at about 4-5 MY ago sedimentation rate in South
Caspian Basin substantially increased and reached turbidite values (Lerche et al., 1997).
Approximately 2 MY ago the Azerbaijan part of the South Caspian Basin had undergone
the next pulse of rapid sediment load. When these sedimentation rates are compared with
the timing of activity of mud volcanoes it becomes apparent that the first pulse of mud
volcano activity in the Uppermost Surakhany offsets the major pulse of sediment load.
The later event of an increase in sediment supply also coincides with the peak of mud
volcano activity in Upper Akhagyl time.
Lerche et al. (1997) after analyzing the data from 18 wells, together with
numerical modeling of different elements of petroleum systems, concluded that the
major episode of hydrocarbon generation, migration and accumulation of excessive
pressure within the South Caspian Basin occurred between 3-1 MY with the emphasis to
the interval of 1.8 MY. This coincides with the major increase in activity of mud
volcanoes with a large increase around Upper Akchagyl (1.8 MY).

69
The direction of the lateral pressure gradients after massive deposition of the
Pliocene sediments is primarily to the northeast from the central portion of the basin,
with secondary drives to the northwest and southwest. Accounting for the lack of data
(only 18 wells) and huge approximation and extrapolation of the pressure contours it is
quite difficult to expect a nice match between these trends and evolution of the mud
volcanoes obtained in this study. However, there is certain trend can be seen regarding
the evolution of the mud volcanoes that is consistent with conclusions of Lerche (1999).
The cyclicity of mud volcano evolution in the South Caspian Basin by itself is
very important aspect of mud volcano development. Based on several studies on mud
volcanoes in Trinidad and Nigeria, in addition to the studies of mud flows at Shah Deniz
structure, it is possible to differentiate three stages of mud volcano development (Graue,
2000; Barboza and Boettcher, 2000; Boettcher et al., 2000; Fowler, 2000).
Stage 1 – Eruption. Hydraulic failure of strata within the overpressured
stratigraphic section.
Stage 2 – Depletion. Migration of gas, oil and water to the surface from cracks,
mudflow and adjacent porous strata.
Stage 3 – Quiescence and build-up. Accumulation of primary and/or secondary
overpressure.
These stages may reflect the development of the mud volcanoes in the South
Caspian. Each cycle shown in Figure 20 clearly distinguished the periods of maximum
activity, depletion and quiescence. Therefore, the general pattern of development of the

70
mud volcanoes observed globally is influenced by similar factors of the seal failure, gas
supply and pressure build-up.
The different morphology of mud volcanoes could be explained by differences in
physical properties of material supplied, by the frequency of eruptions or it could
represent different stages of mud volcano development. In the literature there are many
terms that describe the shape and seize of mud volcanoes (Cooper, 2001; Graue, 2000;
Guliyev and Feyzullayev, 1995; Kopf, 2002; Dimitrov, 2002). Some terms are referred
to as mud cones, mud pies, domes and craters. The distinctive type of mud volcano with
a negative surface expression is called a mud pool, when extruded material is so
fluidized and gassy that it collapses into the crater and fills the depression. Simple rules
appear to apply to the formation of different shapes of the mud volcanoes. The higher
the pore-fluid pressure, the more violent the eruption; the more frequent the activity, the
larger the structure; the lower the viscosity, the larger and flatter the body. Mud with low
porosities form mud domes or ridges, more consistent mud with intermediate fluid
content can give rise to mud volcanoes with large diameters and elevation above the sea
floor, and high porosity mud creates mud pies with the great areal extent. Summarizing
the general knowledge of mud volcano geometry it is possible to conclude that the size
of mud volcano is mainly a function of the size of the conduit and the driving force of
the mud volcanism in the area. Large features are generally thought to have a wide
conduit and efficient trigger at depth (Kopf, 2002). In addition, the consistency of the
mud is suggested to be the controlling parameter for the height of the mud volcano.
Analog modeling of mud volcanism in the laboratory has yielded flat mud pies for wide
71
feeders and cones for narrowing feeders when using the same material (Lance et al.,
1998).
There are instances when mud volcanoes are spaced very close to each other
and form a common body. The mud flows from such system can cover areas of 100
square kilometers. It is especially true for the mud volcanoes in the South Caspian Basin,
where extensive morphological features have several mud volcanoes associated with
them.
The attempt to classify mud volcanoes based on the character of eruption with
regard to the surface expression was made by Kalinko (1964). He distinguishes three
classes of mud volcanoes:
First class – Lokbatan type. Well formed steep conical shape of mud volcanoes
of this type.
Second class – Chikishlyar type. The mud volcanoes of this type form very low,
bulged or flat domes, which merge with the surrounding plane, or they form plate-
shaped depressions that are filled by water.
Third class – Schugin type. Characterized by a great variety of forms, but most
common the mud volcanoes of this type create composite craters.
In this study the convex shape of the mud volcanoes within the Caspian Sea may
be classified as the Lokbatan type, flat mud volcanoes as Chikishyar type and convex
shaped mud volcanoes as Schugin type. Buried mud volcanoes can be distinguished as a
separate type, since they do not have a surface manifestation. The areal distribution of
the mud volcanoes of different shapes does not reveal any noticeable trend. Most
72
commonly, all types of mud volcanoes can be observed in a volcano belt of mud
volcanoes.
The different morphology of the mud volcanoes may also be related to the
different stages in its development. At the first stage of the mud volcano evolution one
can expect a product of violent eruption manifesting itself by creating a large crater and
a huge amount of mud and parts of rocks deposited on the sides. Then during the time of
fluid migration the crater can be filled by the mud, or in the case of more dense material,
it could form a dome-like feature. Later stages of quiescence may result in subsidence of
the feature and formation of a very low dome that would eventually merge with the
surrounding plane. However, this does not mean that this process is controlling the
geometry of the mud volcanoes. It may have a relationship with the general and widely
accepted point of view, described above, such as a relationship with the density of
material and frequency of eruptions (Guliyev and Feyzullayev, 1995; Kopf, 2002;
Cooper, 2001; Graue, 2000; Dimitrov, 2002).
Summarizing everything above the following are the major conclusions drown
from the analysis and interpretation of the data as well as the extensive literature
research:
• Mud volcanism in South Caspian offshore is associated with the fluid
pressure gradient (diatremes) in the subsurface.
• Differences in morphology may be due to the relationship between driving
force (pressure) and material supply, width of conduit or could represent
different stages in mud volcano evolution.

73
• Mud volcanoes occur strictly in areas of local tension, within regional
compressional fields.
• Mud Volcano formation in the offshore South Caspian is mainly controlled
by tectonic forces and overpressured sediments.
• Mud volcano activity is not always related to the Maykop shale succession. It
can occur at shallow depths by pressure breakthrough from any stratigraphic
zone.
• The cycles of mud volcano activity in the South Caspian Basin coincides
with the time of high sedimentation rate, a regional contraction episode, and
major stage for hydrocarbon generation.
• There is no relationship between the mud volcano parameters such as size,
shape areal extent etc., and their distribution.

74
REFERENCES CITED
Abdullayev, N. R., 2000, Seismic stratigraphy of the Upper Pliocene and Quaternary
deposits in the South Caspian Basin: Journal of Petroleum Science and
Engineering, no 28, p. 207-226.
Abich, O. W. H., 1863, Uber eine im Caspischen Meere erschienene Insel, nebst
Beitragen zur Kenntniss der Schlammvulkane der Caspischen Region: Memoir of
Academy Imperial Science, St. Petersburg, ser. 7, T6(5), 183 p.
Abrams, M. A., and A. A. Narimanov, 1997, Geochemical evaluation of hydrocarbons
and their potential sources in the western South Caspian depression, Republic of
Azerbaijan: Marine and Petroleum Geology, v. 14, no. 4, p. 451-468.
Allen, M. B., S. J. Vincent, G. I. Alsop, A. Ismail-zadeh, and R. Flecker, 2003, Late
Cenozoic deformation in the South Caspian region: effects of a rigid basement
block within a collision zone: Tectonophysics, v. 366, p. 223-239.
Barboza, S. A., and S. S. Boettcher, 2000, Major and trace element constraints on fluid
origin, offshore Eastern Trinidad: Proceedings of SPE 2000 Conference, Port-of-
Spain, Trinidad, 11 p.
Belopolsky, A., M. Talwani, and D. L. Berry, 1998, Geology and petroleum potential of
the Caspian region: The Center for Political Economy and the James A. Baker III
Institute for Public Policy, Rice University, Houston, TX, 34 p.

75
Berberian, M., 1983, The Southern Caspian: a compressional depression floored by a
trapped, modified oceanic crust: Canadian Journal of Earth Science, v. 20,
p. 163-183.
Berberian, M., and G. P. King, 1981, Towards a paleogeography and tectonic evolution
of Iran: Canadian Journal of Earth Science, v. 18, p. 210-265.
Boettcher, S. S., J. L. Jackson, J. E. Neal, and M. J. Quinn, 2000, Lithosphere-scale cross
section and tectonic synthesis, offshore Eastern Trinidad: Proceedings of SPE
2000 Conference, Port-of-Spain, Trinidad, 14 p.
Brown, K. M., 1990, Nature and hydrogeologic significance of mud diapirs and
diatrimes for accretionary systems: Journal of Geophysical Research, v.95, p.
8969-8982.
Bulin, N. K., 1978, New ideas on crust structure (from seismic data): International
Geology Reviews, v. 20, p. 887-889.
Buryakovsky, L. A., R. D. Djevanshir, and G. V. Chilingar, 1995, Abnormally-high
formation pressures in Azerbaijan and the South Caspian Basin (as related to
smectite – illite transformations during diagenesis and catagenesis): Journal of
Petroleum Science and Engineering, v. 13, p. 203-218.
Cooper, C., 2001, Mud volcanoes of the South Caspian Basin – seismic data and
implications for hydrocarbon systems: AAPG Bulletin, v. 85, no. 13, p. 231-245.
Croissant, C., 1998, Azerbaijan oil and geopolitics: Nova Science Publishers, Commack,
New York, 117 p.
Cullen, R., 1999, The Caspian Sea: National Geographic, v. 195, no. 5, p. 2-35.

76
Daniloff, R., 1998, Waiting for the oil boom: Smithsonian, v. 28, no. 10, p. 24-35.
Dimitrov, L. I., 2002, Mud volcanoes – the most important pathway for degassing
deeply buried sediments: Earth-Science Reviews, v. 59, p. 49-76.
Forbes, P. L., P. Ungerer, and B. S. Mudford, 1992, A two-dimensional model of
overpressure development and gas accumulation in Venture field, Eastern
Canada: AAPG Bulletin, v. 76, p. 318-338.
Fowler, S. R., J. Mildenhall, and S. Zalova, 2000, Mud volcanoes and structural
development on Shah Deniz: Journal of Petroleum Science and Engineering,
no. 28, p.189-206.
Galperin, Y., I. Kosminskaya, and P. Krakshina, 1962, Main characteristics of deep
waves recorded during deep seismic sounding in the central part of the Caspian
Sea, Deep Seismic Sounding of the earth’s crust in the U.S.S.R.: Academy of
Science of U.S.S.R., Moscow, p. 167-186.
Goubkin, I., 1934, Tectonics of South-East Caucasus and its relation to the productive
oilfields: AAPG Bulletin, v. 18, p. 603-671.
Graue, K., 2000, Mud volcanoes in deep water Nigeria: Marine and Petroleum Geology,
v.17, p. 959-974.
Guliyev, I. S., and A. A. Feizullayev, 1995, All about mud volcanoes: Institute of
Geology of the Azerbaijan Academy of Sciences, Baku, 52 p.
Jackson, J., K. Priestley, M. Allen, and M. Berberian, 2002, Active tectonics of the
South Caspian Basin: Geophysical Journal International, v. 148, p. 214-245.

77
Jakubov, A. A., A. A. Ali-Zade, and M. M. Zeynalov, 1971, Mud volcanoes of the
Azerbaijan SSR: Academy of Science of the Azerbaijan SSR, Baku, 257 p.
Kalinko, M., 1964, Mud volcanoes, reasons of their origin, development and fading:
VNIGRI, v. 40, p. 30-54 (in Russian).
Katz, B., D. Richards, D. Long, and W. Lawrence, 2000, A new look at the components
of the petroleum system of the South Caspian Basin: Journal of the Petroleum
Science and Engineering, v. 28, p.161-182.
Khalilov, E. N., S. F. Mekhtiyev, and V. Y. Khain, 1987, Some geophysical data
confirming the collisional origin of the Greater Caucasus: Geotectonics, v. 21,
p. 132-136.
Kopf, A. J., 2002, Significance of mud volcanism: Reviews of Geophysics, v. 40, no. 2,
p. 2.1-2.52.
Kulshin, V., 1845, Die Schlammvulcane der Krym: Arch. Wiss. Russ., v. 4, p. 130-134.
Lance, S., P. Henry, X. Le Pichon, S. Lallemant, H. Chamley, F. Rostek, J. Faugeres, E.
Conthier, and K. Olu, 1998, Submersible study of mud volcanoes seaward of the
Barbados accretionary wedge: sedimentology, structure and rheology: Marine
Geology, v. 145, p. 255-292.
Lebedev, L. I., I. A. Aleksina, and L.S. Kulakova, 1987, Caspian Sea geology and oil
and gas potential: Nauka, Russian Academy of Science, Moscow, 295 p. (in
Russian).
Lerche, I., and E. Bagirov, 1999, Impact of natural hazards on oil and gas extraction, the
South Caspian Basin: Kluwer Academic / Plenium Publishers, New York, 353 p.

78
Lerche, I., E. Bagirov, F. Nadirov, M. Tagiyev, and I. Guliyev, 1997, Evolution of the
South Caspian Basin: geologic risks and probable hazards: Institute of Geology
of Azerbaijan Academy of Sciences, Baku, 580 p.
Lorenz, V., 1975, Formation of phreatomagmatic maar-diatreme volcanoes and its
relevances to kimberlite diatremes: Physical Chemistry of Earth, v. 9, p. 17-27.
Luo, M., M. R. Baker, and D. V. LeMone, 1994, Distribution and generation of the
overpressure system, eastern Delaware Basin, western Texas and southern New
Mexico: AAPG Bulletin, v. 78, p. 1386-1405.
Maksimova, S. P., 1987, Oil and gas deposits of the USSR. Asiatic part of USSR:
Moscow, Nedra Press (in Russian), v. 2, p. 69-110.
Mangino, S., and K. Priestley, 1998, The crustal structure of the southern Caspian
region: Geophysical Journal International, v. 133, p. 630-648.
Milkov, A. V., 2000, Worldwide distribution of submarine mud volcanoes and
associated gas hydrates: Marine Geology, v. 167, p. 29-42.
Nadirov, R. S., E. Bagirov, and M. Tagiyev, 1997, Flexural plate subsidence,
sedimentation rates, and structural development of the super-deep South Caspian
Basin: Marine and Petroleum Geology, v. 14, p. 383-400.
Narimanov, A. A., and I. Palaz, 1995, Oil history, potential converge in Azerbaijan: Oil
and Gas Journal, May 22, p. 32-39.
Neprochnov, Y. U., 1968, Structure of the earth’s crust of epicontinental seas: Caspian,
Black and Mediterranean: Canadian Journal of Earth Science, v. 5, p. 1037-1043.

79
Philip, H., A. Cisternas, A. Gvishian, and A. Gorshkov, 1989, The Caucasus: an actual
example of the initial stages of continental collision: Tectonophysics, v. 161,
p. 1-21.
Rabinowitz, P. D., M. Z. Yusifov, J. Arnoldi, and E. Hakim, 2004, Geology, oil and gas
potential, pipelines, and the geopolitics of the Caspian Sea Region: Ocean
Development and International Law, v. 35, p. 19-40.
Rensbergen, P. V., C. K. Morley, D. W. Ang, T. Q. Hoan, and N. T. Lam, 1999,
Structural evolution of shale diapirs from reactive rise to mud volcanism: 3D
seismic data from the Baram delta, offshore Brunei Darussalam: Journal of the
Geological Society, London, v. 156, p. 633-650.
Reynolds, A. D., and M. D. Simmons, 1998, Implications of outcrop geology for
reservoirs in the Neogene Productive Series: Apsheron Peninsula, Azerbaijan:
AAPG Bulletin, v. 82, no. 1, p. 25-49.
Rezanov, I. A., and S. S. Chamo, 1969, Reasons for absence of a granitic layer in basins
of the South Caspian and Black Sea type: Canadian Journal of Earth Science, v.
6, p. 671-678.
Ryaboy, V., 1969, Structure of the Earth’s crust in the central regions of Turkmenia
according to deep seismic sounding data: Proceedings of 8th Assembly European
Seismic Commission, p. 216-221.
Sagers M. J., and J. R. Matzko, 1993, The oil resources of Azerbaijan, survey and
current developments: International Geology Review, v. 35, p. 1093-1103.

80
Sandal, S. T., 1996, The geology and hydrocarbon resources of Negara Brunei
Darussalem (1996 revision): Brunei Shell Petroleum Company/Brunei Museum,
Syabas Bandar Seri Begawan, Brunei Darussalem.
Sengor, A. M. C., 1990, A new model for the late Paleozoic-Mesozoic tectonic evolution
of Iran and implications for Oman, the geology and tectonics of the Oman
region: Geological Society of London Special Publication, no. 49, p. 797-831.
Shikalibeily, E. Sh., and B. V. Grigoriants, 1980, Principal features of the crustal
structure of the South Caspian Basin and the conditions of its formation:
Tectonophysics, v. 69, p. 113-121.
Yegorkin, A. V., and B. A. Matushkin, 1970, Crustal structure of the Caucasus and
Western Central Asia based on geophysical sounding data: International Geology
Reviews, v. 12, p. 281-290.
Zonenshain, L.P., and X. Le Pichon, 1986, Deep basins of the Black Sea and Caspian
Sea as remnants of Mesozoic back-arc basins: Tectonophysics, v.123,
p. 181-211.

81
APPENDIX A
DATABASE FOR ANALYZED MUD VOLCANOES WITHIN THE
AREA OF STUDY
Legend:
× Clear presence of determined parameter ? Probable presence of determined parameter

82
Size Seismic Artifacts Mud Volcanoes
(MV) Length
(m) Width (m)
area (sq.km)
height (m)
Shape of the MV Wipeout
zone Multiples Pulldown
effect
Relation to the structure
Collapse structure
Faulting
1 4361 3180 10.79 132 Convex Strong × Side × × 2 737 683 1.96 23 Concave Weak Syncline × × 3 1587 1587 4.5 74 Flat Strong × Side 4 4608 3038 14.97 0 Buried Weak Crest × 5 5110 4030 21.42 0 Buried Weak Crest 6 3256 2594 8.26 122 Convex Strong × Side × × 7 2719 2081 4.28 99 Flat Strong × Side 8 9560 2810 24.33 130 Convex Weak × × Crest × × 9 1568 1570 2.4 55 Convex Weak Crest × 10 3921 3408 10.76 148 Convex Weak × Side × 11 3210 1110 3.11 65 Flat Strong × Crest × × 12 1568 1568 2.47 0 Buried Weak Side × 13 1389 1389 2.13 92 Convex Weak × Syncline 14 2807 2159 5.12 101 Convex Weak Crest × × 15 5222 4272 18.12 113 Convex Weak Side × 16 5214 3926 14.41 184 Flat Strong × Side × 17 1618 1492 2.5 178 Convex Weak Side × × 18 8830 2222 21.18 194 Concave Strong × Crest 19 2526 1662 4.28 0 Buried Weak Side 20 1213 1213 1.61 0 Buried Strong Syncline × 21 2583 1543 4.42 0 Buried Strong × Side × 22 6071 3817 18.4 136 Convex Strong × Side × 23 4369 2663 9.47 145 Convex Strong × Side ×

83
Size Seismic Artifacts Mud Volcanoes
(MV) Length
(m) Width (m)
area (sq.km)
height (m)
Shape of the MV Wipeout
zone Multiples Pulldown effect
Relation to the structure
Collapse structure Faulting
24 2952 2306 6.15 0 Buried Weak Side × × 25 3290 2982 7.93 0 Buried Weak × Syncline × 26 953 953 0.9 10 Convex Weak × Side 27 2265 2080 3.42 94 Convex Weak Crest × 28 1185 1084 1.02 84 Convex Weak Crest × 29 3817 3437 12 157 Convex Weak Side × × 30 2792 2275 5.75 151 Convex Strong Crest × 31 4072 3390 9.7 62 Convex Weak Crest × × 32 2208 2208 5.18 105 Convex Weak × Side × × 33 13791 5820 90 237 Convex Strong × Crest × × 34 10151 6921 54.87 246 Flat Strong × Crest × 35 8626 7434 54 32 Convex Weak × Crest × × 36 5611 5293 24.72 157 Convex Strong × Crest × × 37 4835 4061 18.41 187 Flat Strong × Crest × ×
38a 3917 3200 10.68 76 Flat Strong × Crest × × 38b 774 774 0.43 71 Convex Weak Crest × × 39 333 333 0.1 34 Convex Weak Crest × 40 4179 4125 9.32 13.8 Flat Strong × Crest × 41 1053 1053 0.8 50 Convex Strong Crest × 42 7748 4779 36.73 166 Convex Weak Crest × × 43 7046 5109 30 243 Flat Strong × Crest × × 44 8145 5646 34 172 Flat Strong × Crest × 45 5624 3543 16 106 Flat Strong × Crest × ×
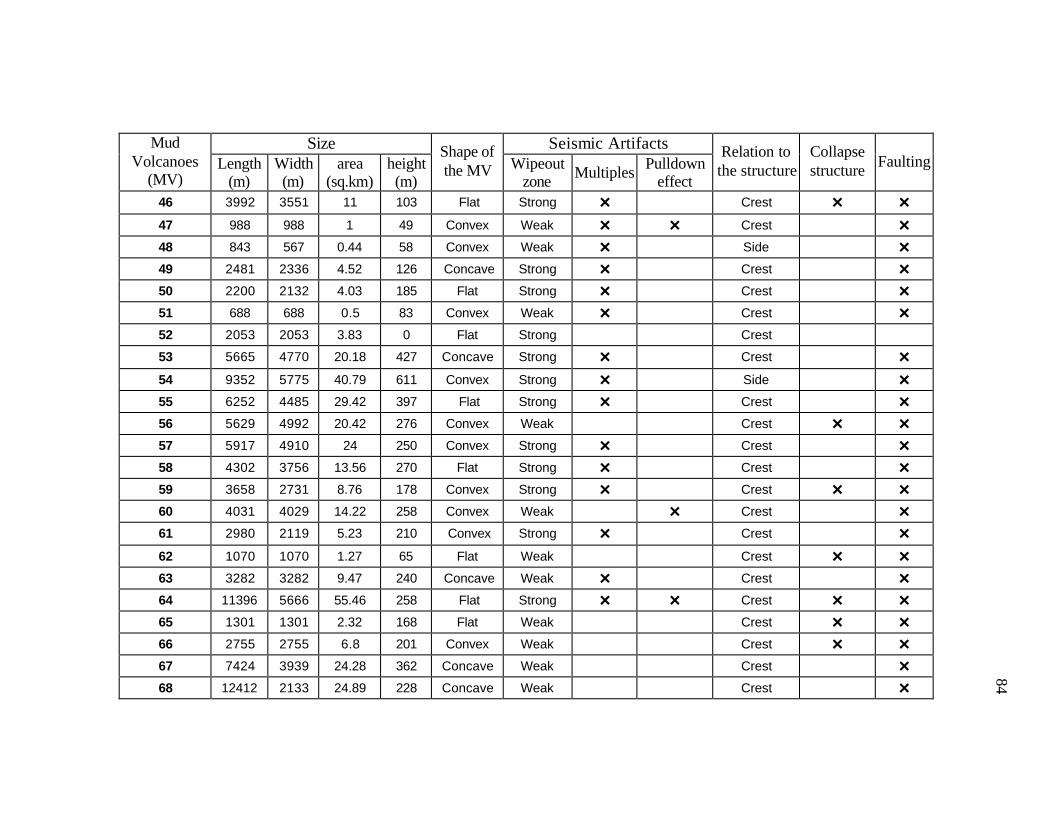
84
Size Seismic Artifacts Mud Volcanoes
(MV) Length
(m) Width (m)
area (sq.km)
height (m)
Shape of the MV Wipeout
zone Multiples Pulldown effect
Relation to the structure
Collapse structure Faulting
46 3992 3551 11 103 Flat Strong × Crest × × 47 988 988 1 49 Convex Weak × × Crest × 48 843 567 0.44 58 Convex Weak × Side × 49 2481 2336 4.52 126 Concave Strong × Crest × 50 2200 2132 4.03 185 Flat Strong × Crest × 51 688 688 0.5 83 Convex Weak × Crest × 52 2053 2053 3.83 0 Flat Strong Crest 53 5665 4770 20.18 427 Concave Strong × Crest × 54 9352 5775 40.79 611 Convex Strong × Side × 55 6252 4485 29.42 397 Flat Strong × Crest × 56 5629 4992 20.42 276 Convex Weak Crest × × 57 5917 4910 24 250 Convex Strong × Crest × 58 4302 3756 13.56 270 Flat Strong × Crest × 59 3658 2731 8.76 178 Convex Strong × Crest × × 60 4031 4029 14.22 258 Convex Weak × Crest × 61 2980 2119 5.23 210 Convex Strong × Crest × 62 1070 1070 1.27 65 Flat Weak Crest × × 63 3282 3282 9.47 240 Concave Weak × Crest × 64 11396 5666 55.46 258 Flat Strong × × Crest × × 65 1301 1301 2.32 168 Flat Weak Crest × × 66 2755 2755 6.8 201 Convex Weak Crest × × 67 7424 3939 24.28 362 Concave Weak Crest × 68 12412 2133 24.89 228 Concave Weak Crest ×

85
Size Seismic Artifacts Mud Volcanoes
(MV) Length
(m) Width (m)
area (sq.km)
height (m)
Shape of the MV Wipeout
zone Multiples Pulldown effect
Relation to the structure
Collapse structure Faulting
69 2109 1898 3.84 270 Convex Weak × Crest × 70 7118 3589 21.59 98 Convex Weak Side × × 71 4992 4992 22.93 0 Buried Strong × Side × 72 3328 3328 7.74 96 Flat Strong × × Crest × × 73 12205 6507 50.91 329 Convex Weak × Crest × × 74 4207 3295 12.08 347 Flat Weak Crest × 75 3304 3304 8.02 356 Concave Weak Crest × 76 6286 5252 26.7 398 Convex Weak Crest × × 77 7889 5031 32.28 143 Flat Strong × Crest × 78 1064 1064 0.8 77 Concave Weak Crest × 79 10997 5046 48.35 124 Flat Weak Crest × 80 838 838 0.5 118 Flat Weak × Crest × 81 1788 1788 2.42 0 Concave Weak × Crest × 82 1878 1878 3.66 0 Flat Weak × Crest × 83 4296 2306 9.76 68 Flat Weak Crest × 84 2768 2768 8.15 160 Flat Weak × Crest × 85 560 560 0.3 0 Flat Weak Crest × 86 11653 6361 60.73 0 Concave Strong × Crest × 87 3928 3694 12.43 157 Convex Strong × × Syncline × × 88 4174 2474 9.12 199 Convex Weak × × Crest × × 89 6185 4799 23.37 0 Flat Weak Crest × 90 5219 5219 21.47 0 Flat Weak × Crest 91 1692 1692 2.7 118 Convex Weak × Crest ×

86
Size Seismic Artifacts Mud Volcanoes
(MV) Length
(m) Width (m)
area (sq.km)
height (m)
Shape of the MV Wipeout
zone Multiples Pulldown effect
Relation to the structure
Collapse structure Faulting
92 4714 3032 12.24 200 Convex Strong × Crest × × 93 4417 3994 14.11 133 Convex Weak × Crest × 94 2354 1939 4.24 46 Flat Strong × Side × 95 7155 3023 20.48 0 Buried Weak Crest × × 96 4433 4091 14.85 55 Flat Strong × Crest × 97 3148 3148 8 111 Convex Weak Crest × 98 1078 1078 9 175 Convex Weak Crest 99 3367 3045 8.33 0 Flat Weak × Crest ×

87
Time of Mud Flows
Sabu
nchi
-U
pper
Su
rakh
any
Upp
erm
ost
Sura
khan
y
Low
er
Akc
hagy
l
Mid
A
kcha
gyl
Upp
er
Akc
hagy
l A
Upp
er
Akc
hagy
l B
Low
er
Aps
hero
n
Upp
er
Aps
hero
n
Low
er
Qua
tern
ary
Mid
Q
uate
rnar
y A
Mid
Q
uate
rnar
y B
Upp
er
Qua
tern
ary
A
Upp
er
Qua
tern
ary
B
Mud
Vol
cano
es
(MV
)
4.33 MY 3.5 MY 3.4 MY 2.8 MY 2.3 MY 2 MY 1.8 MY 1.3 MY 0.75 MY 0.63 MY 0.5 MY 0.3 MY 0.15 MY
1 × × × ? ? × × × ×
2 ? ? ? ×
3 ×
4 ? × × × × × × × ×
5 ×
6 NA
7 NA
8 ? × × × × × × × × 20 × ×
9 NA
10 × × × × × × × × ?
11 ? × × × × × × × × × ×
12 ? ? × ×
13 NA
14 ? ? ? ? ? ? ×
15 × × × × × × ×
16 ? ? ? ? × × ×
17 × × × × × × ×
18 ? × × × × × × ? ?
19 ? ? × × × × × ?
20 ? ? ? ? × × × × ×

88
Time of Mud Flows
Sabu
nchi
-U
pper
Su
rakh
any
Upp
erm
ost
Sura
khan
y
Low
er
Akc
hagy
l
Mid
A
kcha
gyl
Upp
er
Akc
hagy
l A
Upp
er
Akc
hagy
l B
Low
er
Aps
hero
n
Upp
er
Aps
hero
n
Low
er
Qua
tern
ary
Mid
Q
uate
rnar
y A
Mid
Q
uate
rnar
y B
Upp
er
Qua
tern
ary
A
Upp
er
Qua
tern
ary
B
Mud
Vol
cano
es
(MV
)
4.33 MY 3.5 MY 3.4 MY 2.8 MY 2.3 MY 2 MY 1.8 MY 1.3 MY 0.75 MY 0.63 MY 0.5 MY 0.3 MY 0.15 MY
21 NA
22 ? ? ? ? ? ? × ? × ×
23 ? ? ? ? ? ? × × × ×
24 ? × × × × × ×
25 × × × ×
26 × ? ? ×
27 ? ? × × × ×
28 × × × ×
29 ? ? ? ? ? ? × × × ×
30 0 0 ? ? ? ? ? ? ? ? ×
31 ? ? ? ? ? ? × × × ×
32 ? ? ? ? ? ? ? ? × ×
33 × × ×
34 × ×
35 × × ×
36 × × ? × ×
37 ? ×
38a ? ? ? ? ? ? × × × × ×
38b ? ? ? ? ? ? × × × × ×
39 NA

89
Time of Mud Flows
Sabu
nchi
-U
pper
Su
rakh
any
Upp
erm
ost
Sura
khan
y
Low
er
Akc
hagy
l
Mid
A
kcha
gyl
Upp
er
Akc
hagy
l A
Upp
er
Akc
hagy
l B
Low
er
Aps
hero
n
Upp
er
Aps
hero
n
Low
er
Qua
tern
ary
Mid
Q
uate
rnar
y A
Mid
Q
uate
rnar
y B
Upp
er
Qua
tern
ary
A
Upp
er
Qua
tern
ary
B
Mud
Vol
cano
es
(MV
)
4.33 MY 3.5 MY 3.4 MY 2.8 MY 2.3 MY 2 MY 1.8 MY 1.3 MY 0.75 MY 0.63 MY 0.5 MY 0.3 MY 0.15 MY
40 × ×
41 NA
42 ? ? ? ? ×
43 ? ? ? ? ×
44 ? × × ×
45 ? × × ×
46 ? ? ? ? ? ? ? ? ? ? ×
47 ? ? × ? ? × ×
48 ? ? ? ? ×
49 × × × ? ×
50 × × ×
51 NA
52 NA
53 NA
54 ? × × × × ? ? ×
55 ? ? ? ? ? × ×
56 ? ? × ? ? ? × ? × ×
57 ? ? × × × × × × ×
58 NA
59 ? ? ? ? ? ? ×

90
Time of Mud Flows
Sabu
nchi
-U
pper
Su
rakh
any
Upp
erm
ost
Sura
khan
y
Low
er
Akc
hagy
l
Mid
A
kcha
gyl
Upp
er
Akc
hagy
l A
Upp
er
Akc
hagy
l B
Low
er
Aps
hero
n
Upp
er
Aps
hero
n
Low
er
Qua
tern
ary
Mid
Q
uate
rnar
y A
Mid
Q
uate
rnar
y B
Upp
er
Qua
tern
ary
A
Upp
er
Qua
tern
ary
B
Mud
Vol
cano
es
(MV
)
4.33 MY 3.5 MY 3.4 MY 2.8 MY 2.3 MY 2 MY 1.8 MY 1.3 MY 0.75 MY 0.63 MY 0.5 MY 0.3 MY 0.15 MY
60 ? × ? × × × ×
61 ? ? ? ×
62 ? ? ? ? ? ? ×
63 ? ? ? ? ? ? × × ×
64 ? ? × × × ? ×
65 × × ? ? ? ×
66 ? ? × × × × ? ×
67 × ×
69 ? ? ? × × × ×
70 × × × × ×
71 × × × × × × ×
72 × × × ×
73 × × × × ×
74 ? × ? ? ×
75 ? ? ? × × ×
76 ? ? ? ×
77 × ? ? × × × × ×
78 ? ? ? ×
79 ×
80 NA

91
Time of Mud Flows
Sabu
nchi
-U
pper
Su
rakh
any
Upp
erm
ost
Sura
khan
y
Low
er
Akc
hagy
l
Mid
A
kcha
gyl
Upp
er
Akc
hagy
l A
Upp
er
Akc
hagy
l B
Low
er
Aps
hero
n
Upp
er
Aps
hero
n
Low
er
Qua
tern
ary
Mid
Q
uate
rnar
y A
Mid
Q
uate
rnar
y B
Upp
er
Qua
tern
ary
A
Upp
er
Qua
tern
ary
B
Mud
Vol
cano
es
(MV
)
4.33 MY 3.5 MY 3.4 MY 2.8 MY 2.3 MY 2 MY 1.8 MY 1.3 MY 0.75 MY 0.63 MY 0.5 MY 0.3 MY 0.15 MY
81 ? × × × × × ×
68 ? ? ? ? ×
83 ? ? ? ×
84 ? ? ? ? ×
85 × × × × ? ? ?
82 NA
86 × × ×
87 × × × × × × × × × × × × ×
89 NA
90 × × ×
88 ? ? ? ? × × × × ×
91 ? ? ? ? ? ? ×
92 ? ? × × × × × × ×
93 ×
94 ? ? ? × ×
95 ? ? ? ? × × × × ×
96 ? ? × ×
97 ? ? ? × × ×
98 ? ? ? × ×
99 NA
92
APPENDIX B
LOCATION MAP FOR MUD VOLCANOES PRESENTED IN THE
DATABASE
Legend:
Mud volcano
15 Number of the mud volcano according to the database

93
1 2
7 6 3
5 8
9
10
67 53
54
55
4 57 58
62 11 12
13 17
18 19
20 21
22 23
24
25
26
27
28
29
30
31
32
33 34
35 36
37 38a
38
39 40
41
42
43
44
45
46 47
48 49
50 51 52
56
59
60 61 14
16 15
63
64
65 66
69
74
79
80 81
68 75
76 70
71
72
73
77
78
83 84
85
82
90
88
86
87 91
92 93
89
94
95
96
98
99
Baku
0 km
NN
40
94
VITA Name Mehdi Yusifov Mailing Address 18 Gulbala Aliyev, apt. # 1, Baku,
Azerbaijan 370003 Educational Background B.S. in Exploration Geology,
Azerbaijan State Oil Academy, June 2000.
M.S. in Geology, Texas A&M University, August 2004. Professional Organization American Association of Petroleum Geologist
(AAPG), Society of Exploration Geophysicist (SEG), Geological Society of America (GSA).
Experience Laboratory Assistant
Institute of Geology, Azerbaijan Academy of Science, October 1998 – July 2000 Research Assistant Ocean Drilling Program, Texas A&M University, College Station, TX, January 2003 – December 2003
Related Documents