13 th World Conference on Earthquake Engineering Vancouver, B.C., Canada August 1-6, 2004 Paper No. 1659 SEISMIC HAZARD ASSESSMENT IN A MODERATE SEISMICITY REGION, HONG KONG Matthew FREE 1 , Jack PAPPIN 2 , Raymond KOO 3 SUMMARY This paper describes a probabilistic seismic hazard assessment undertaken to estimate the potential seismic ground motion levels on bedrock in Hong Kong. A detailed catalogue of historical and recent seismicity within the South China region has been compiled. A suite of published empirical and stochastic attenuation relationships have been used with alternative source models and source parameters in a logic tree hazard analysis. Uniform hazard bedrock ground-motion spectra having a 50%, 10% and 2% probability of being exceeded in 50 years have been calculated. The results have been de-aggregated to investigate what earthquake magnitude and distance combinations have contributed most to the hazard levels for the different probabilities and structural periods. INTRODUCTION The Hong Kong Special Administrative Region is located in an area of low to moderate seismicity. The current codes of practice for building design do not require any seismic considerations. This paper describes the assessment of the potential seismic ground motion levels on rock in Hong Kong. The evaluation of the potential site response effects in Hong Kong are described in a companion paper, Pappin et al. [1] that should be read in conjunction with this paper. GEOLOGY AND TECTONICS OF THE HONG KONG REGION Regional Geology and Tectonic Setting Hong Kong is situated in southeast China near the south-eastern margin of the Eurasian Continental Plate in a stable continental intraplate region about 700 km from the nearest plate boundary, which underlies Taiwan and trends south to the Philippines and northeast to Japan, see Sewell et al. [2] and Fyfe et al. [3]. The regional tectonic setting is shown in Figure 1. Two major, regional northeast trending fault zones are interpreted to lie along the Southeast China coast. The Changle-Nanao Fault Zone, runs along the coast 1 Associate, Arup Hong Kong, Email: [email protected] 2 Director, Arup Hong Kong, Email: [email protected] 3 Geotechnical Engineer, Arup Hong Kong, Email: [email protected]

Welcome message from author
This document is posted to help you gain knowledge. Please leave a comment to let me know what you think about it! Share it to your friends and learn new things together.
Transcript
13th World Conference on Earthquake Engineering Vancouver, B.C., Canada
August 1-6, 2004 Paper No. 1659
SEISMIC HAZARD ASSESSMENT IN A MODERATE SEISMICITY REGION, HONG KONG
Matthew FREE1, Jack PAPPIN2, Raymond KOO3
SUMMARY
This paper describes a probabilistic seismic hazard assessment undertaken to estimate the potential seismic ground motion levels on bedrock in Hong Kong. A detailed catalogue of historical and recent seismicity within the South China region has been compiled. A suite of published empirical and stochastic attenuation relationships have been used with alternative source models and source parameters in a logic tree hazard analysis. Uniform hazard bedrock ground-motion spectra having a 50%, 10% and 2% probability of being exceeded in 50 years have been calculated. The results have been de-aggregated to investigate what earthquake magnitude and distance combinations have contributed most to the hazard levels for the different probabilities and structural periods.
INTRODUCTION The Hong Kong Special Administrative Region is located in an area of low to moderate seismicity. The current codes of practice for building design do not require any seismic considerations. This paper describes the assessment of the potential seismic ground motion levels on rock in Hong Kong. The evaluation of the potential site response effects in Hong Kong are described in a companion paper, Pappin et al. [1] that should be read in conjunction with this paper.
GEOLOGY AND TECTONICS OF THE HONG KONG REGION Regional Geology and Tectonic Setting Hong Kong is situated in southeast China near the south-eastern margin of the Eurasian Continental Plate in a stable continental intraplate region about 700 km from the nearest plate boundary, which underlies Taiwan and trends south to the Philippines and northeast to Japan, see Sewell et al. [2] and Fyfe et al. [3]. The regional tectonic setting is shown in Figure 1. Two major, regional northeast trending fault zones are interpreted to lie along the Southeast China coast. The Changle-Nanao Fault Zone, runs along the coast
1 Associate, Arup Hong Kong, Email: [email protected] 2 Director, Arup Hong Kong, Email: [email protected] 3 Geotechnical Engineer, Arup Hong Kong, Email: [email protected]
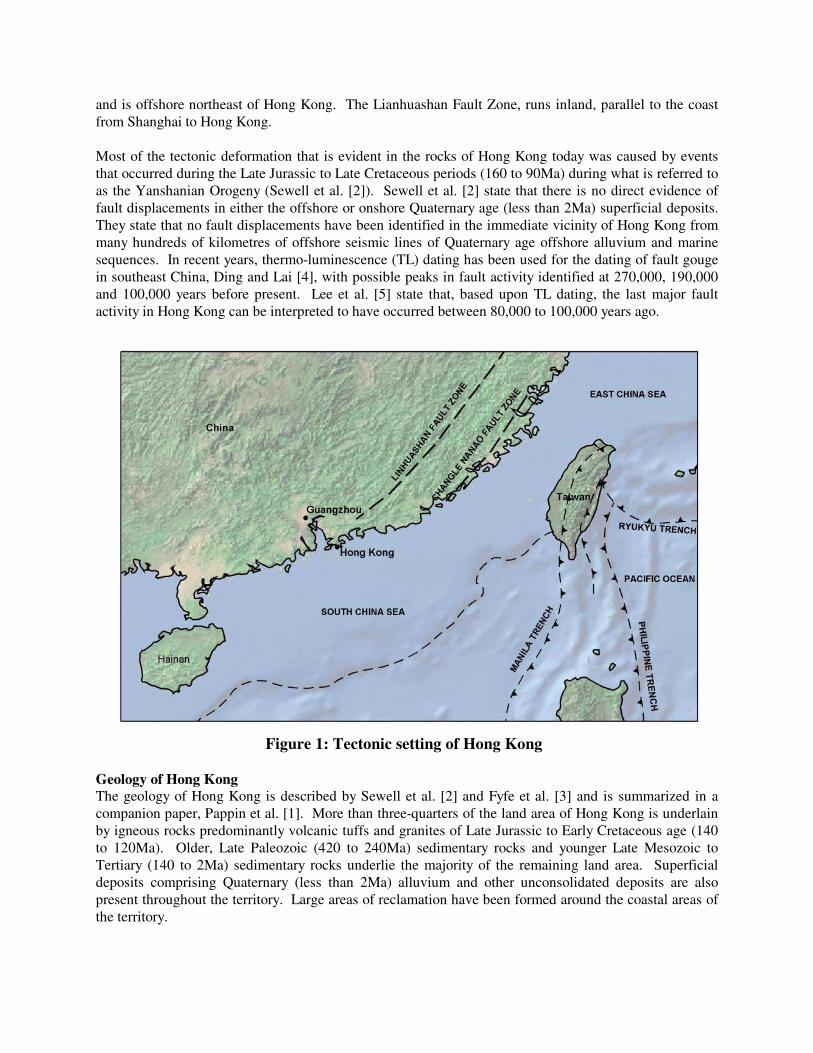
and is offshore northeast of Hong Kong. The Lianhuashan Fault Zone, runs inland, parallel to the coast from Shanghai to Hong Kong. Most of the tectonic deformation that is evident in the rocks of Hong Kong today was caused by events that occurred during the Late Jurassic to Late Cretaceous periods (160 to 90Ma) during what is referred to as the Yanshanian Orogeny (Sewell et al. [2]). Sewell et al. [2] state that there is no direct evidence of fault displacements in either the offshore or onshore Quaternary age (less than 2Ma) superficial deposits. They state that no fault displacements have been identified in the immediate vicinity of Hong Kong from many hundreds of kilometres of offshore seismic lines of Quaternary age offshore alluvium and marine sequences. In recent years, thermo-luminescence (TL) dating has been used for the dating of fault gouge in southeast China, Ding and Lai [4], with possible peaks in fault activity identified at 270,000, 190,000 and 100,000 years before present. Lee et al. [5] state that, based upon TL dating, the last major fault activity in Hong Kong can be interpreted to have occurred between 80,000 to 100,000 years ago.
Figure 1: Tectonic setting of Hong Kong Geology of Hong Kong The geology of Hong Kong is described by Sewell et al. [2] and Fyfe et al. [3] and is summarized in a companion paper, Pappin et al. [1]. More than three-quarters of the land area of Hong Kong is underlain by igneous rocks predominantly volcanic tuffs and granites of Late Jurassic to Early Cretaceous age (140 to 120Ma). Older, Late Paleozoic (420 to 240Ma) sedimentary rocks and younger Late Mesozoic to Tertiary (140 to 2Ma) sedimentary rocks underlie the majority of the remaining land area. Superficial deposits comprising Quaternary (less than 2Ma) alluvium and other unconsolidated deposits are also present throughout the territory. Large areas of reclamation have been formed around the coastal areas of the territory.
SEISMIC HAZARD ASSESSMENT Seismic Hazard Assessment Methodology The probabilistic seismic hazard assessment (PSHA) methodology, e.g. Cornell [6], McGuire [7], has been applied using Oasys SISMIC, the in-house PSHA program of Arup. The PSHA methodology used the following steps:
• Potential seismic sources have been defined on the basis of regional geology and seismicity, • Seismicity parameters defining the rate of earthquake activity has been derived for each of the
potential seismic sources, • Ground motion attenuation relationships, considered to be appropriate for the region, have been
defined, and • The frequency of specified ground motion levels being exceeded has been derived by first
determining the likelihood that the ground motion will be exceeded if an earthquake of a certain magnitude at a certain distance occurs and multiplying this likelihood by the annual frequency of such an event occurring in any of the source zones. By summing the annual frequencies of the ground motion level being exceeded from all specified earthquake distances and magnitudes the overall frequency is established.
The epistemic uncertainty arising from differences in expert opinion on a range of modelling assumptions has been addressed through the use of a logic tree, Kulkarni et al. [8], Coppersmith and Youngs [9] and NRC [10]. Aleatory uncertainty, arising from natural physical variability, has been addressed by allowing for the normal variation, represented by its standard deviation “sigma”, of the ground motion attenuation relationships in the hazard computation. Seismological Data for the Hong Kong Region Historical earthquake data for the Southeast China region (Guangdong Province of China) has been obtained from a range of sources. The Directory of Earthquakes in China (BC 1831 to AD 1969) as listed in Gu et al. [11] and the Guangdong Seismological Bureau [12] database provide the most extensive catalogues of historical earthquake data for the region. These have been supplemented by the data from the GCO [13]. For historical earthquakes, where there is no instrumental records, the event magnitude has been determined by Gu et al. [11] using an empirical formula, M = 0.58 IO +1.5, where IO is the intensity at the epicentre of the event. The historical dataset comprises 199 events between 1067 and 1970. For a number of the larger historical events, the magnitudes defined by Johnston [14, 15] have been used. A set of 3-component, long period seismographs, were established at the Hong Kong Observatory in 1921. The first felt earthquake recorded by these instruments occurred on the 10th January 1924. During World War II, the original seismographs were lost and no local observations were made between 1941 and 1950. Recording resumed in 1951. The GSB has maintained a database of earthquakes within the Guangdong Province with magnitude, ML ≥ 2.0 since 1970. A subset of this data, for the region within 500 km of Hong Kong, was obtained for this study. For the PSHA, all events are required to be statistically independent and therefore foreshocks and aftershocks have been removed from the catalogue using the methodology of Gardener and Knopoff [16]. Man-induced events have also been identified and removed from the catalogue. A reservoir induced earthquake swarm commenced in 1962 during the filling of the Xinfengjiang Reservoir. The mainshock of the swarm had a local magnitude ML = 6.1. The earthquake events in the catalogue have been compiled from a range of sources and a range of magnitude scales have been used in the original sources (ML, mb and MS). The moment magnitude scale
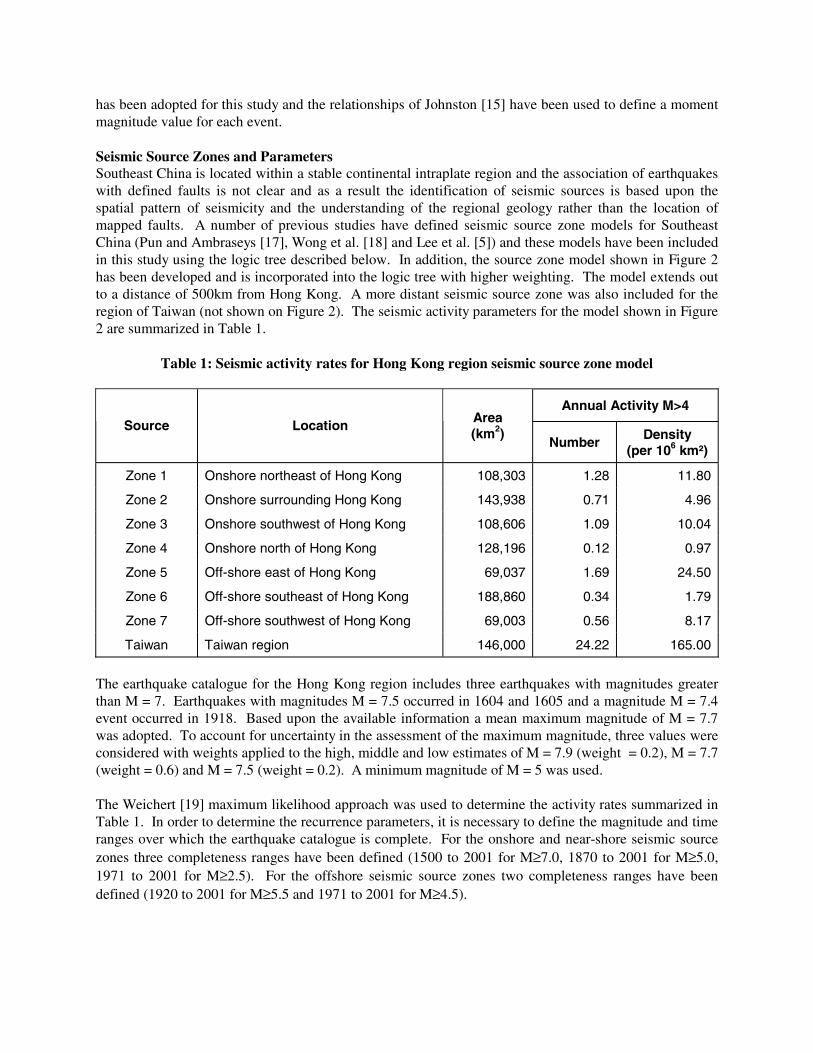
has been adopted for this study and the relationships of Johnston [15] have been used to define a moment magnitude value for each event. Seismic Source Zones and Parameters Southeast China is located within a stable continental intraplate region and the association of earthquakes with defined faults is not clear and as a result the identification of seismic sources is based upon the spatial pattern of seismicity and the understanding of the regional geology rather than the location of mapped faults. A number of previous studies have defined seismic source zone models for Southeast China (Pun and Ambraseys [17], Wong et al. [18] and Lee et al. [5]) and these models have been included in this study using the logic tree described below. In addition, the source zone model shown in Figure 2 has been developed and is incorporated into the logic tree with higher weighting. The model extends out to a distance of 500km from Hong Kong. A more distant seismic source zone was also included for the region of Taiwan (not shown on Figure 2). The seismic activity parameters for the model shown in Figure 2 are summarized in Table 1.
Table 1: Seismic activity rates for Hong Kong region seismic source zone model
Annual Activity M>4
Source Location Area (km2)
Number Density (per 106 km²)
Zone 1 Onshore northeast of Hong Kong 108,303 1.28 11.80
Zone 2 Onshore surrounding Hong Kong 143,938 0.71 4.96
Zone 3 Onshore southwest of Hong Kong 108,606 1.09 10.04
Zone 4 Onshore north of Hong Kong 128,196 0.12 0.97
Zone 5 Off-shore east of Hong Kong 69,037 1.69 24.50
Zone 6 Off-shore southeast of Hong Kong 188,860 0.34 1.79
Zone 7 Off-shore southwest of Hong Kong 69,003 0.56 8.17
Taiwan Taiwan region 146,000 24.22 165.00
The earthquake catalogue for the Hong Kong region includes three earthquakes with magnitudes greater than M = 7. Earthquakes with magnitudes M = 7.5 occurred in 1604 and 1605 and a magnitude M = 7.4 event occurred in 1918. Based upon the available information a mean maximum magnitude of M = 7.7 was adopted. To account for uncertainty in the assessment of the maximum magnitude, three values were considered with weights applied to the high, middle and low estimates of M = 7.9 (weight = 0.2), M = 7.7 (weight = 0.6) and M = 7.5 (weight = 0.2). A minimum magnitude of M = 5 was used. The Weichert [19] maximum likelihood approach was used to determine the activity rates summarized in Table 1. In order to determine the recurrence parameters, it is necessary to define the magnitude and time ranges over which the earthquake catalogue is complete. For the onshore and near-shore seismic source zones three completeness ranges have been defined (1500 to 2001 for M≥7.0, 1870 to 2001 for M≥5.0, 1971 to 2001 for M≥2.5). For the offshore seismic source zones two completeness ranges have been defined (1920 to 2001 for M≥5.5 and 1971 to 2001 for M≥4.5).
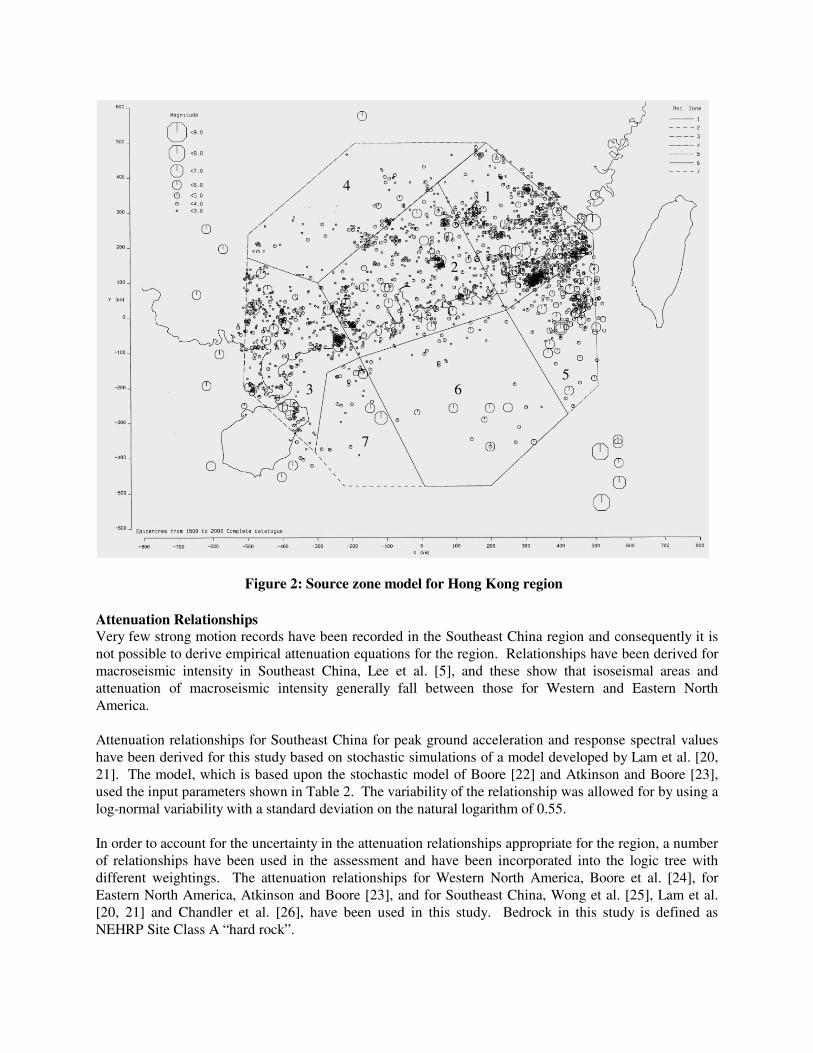
Figure 2: Source zone model for Hong Kong region Attenuation Relationships Very few strong motion records have been recorded in the Southeast China region and consequently it is not possible to derive empirical attenuation equations for the region. Relationships have been derived for macroseismic intensity in Southeast China, Lee et al. [5], and these show that isoseismal areas and attenuation of macroseismic intensity generally fall between those for Western and Eastern North America. Attenuation relationships for Southeast China for peak ground acceleration and response spectral values have been derived for this study based on stochastic simulations of a model developed by Lam et al. [20, 21]. The model, which is based upon the stochastic model of Boore [22] and Atkinson and Boore [23], used the input parameters shown in Table 2. The variability of the relationship was allowed for by using a log-normal variability with a standard deviation on the natural logarithm of 0.55. In order to account for the uncertainty in the attenuation relationships appropriate for the region, a number of relationships have been used in the assessment and have been incorporated into the logic tree with different weightings. The attenuation relationships for Western North America, Boore et al. [24], for Eastern North America, Atkinson and Boore [23], and for Southeast China, Wong et al. [25], Lam et al. [20, 21] and Chandler et al. [26], have been used in this study. Bedrock in this study is defined as NEHRP Site Class A “hard rock”.
1
2
3
4
56
7
1
2
3
4
56
7

Table 2: Input parameters for Southeast China stochastic model
Seismological Parameters Input Value
Source Model CENA model, Atkinson [27]
Geometrical Spreading 30 / R (R ≤ 45km)
0.667 (45km < R ≤ 75km)
5.77 / R0.5 (R > 75km)
where R is hypocentral distance in km, Lam et al. [21].
Anelastic Attenuation Q = 592 f0.36
where Q is the wave transmission quality factor and f is frequency, Chandler et al. [26]
Crustal Effect Mid-Crust
β = 3.5km/s
where β is the average shear wave velocity at mid-crust (~10km depth), Lam et al. [21]
Upper-crust
κ = 0.01 and v30 = 2,000m/s
where κ is kappa value and v30 is the average shear wave velocity within the upper 30m, Lam et al. [21]
Logic Tree The logic tree that was developed for the study is shown in Figure 3.
Figure 3: Logic tree
NOTE: (0.5) = Weight : For the 5 second period only the GENQKE attenuation relationships have been used.
SOURCE ZONES
Arup (0.4)
Wong & Chau (0.2)
Lee et al (0.2)
Pun & Ambraseys (0.2)
ATTENUATION
RELATIONSHIPS
GENQKE Lam et al (2000) (0.3)
Atkinson and Boore(1997) (0.2)
Boore, Joyner and Fumal (1993) (0.2)
GENQKE Wong et al (2002) (0.3)
ACTIVITY &
b VALUE
Median + 0.01 & b at 0.92 (0.2)
Median & b at 0.95 (0.6)
Median - 0.01 & b at 0.98 (0.2)
6.0 (0.2)
6.5 (0.6)
7.0 (0.2)
7.5 (0.2)
7.7 (0.6)
7.9 (0.2)
MMAX
For general areas
For areas in vicinity of Hong Kong
Taiwan (1.0) GENQKE for Taiwan (1.0) Median & b at 0.73 (1.0) 8.5 (1.0)Taiwan (1.0) GENQKE for Taiwan (1.0) Median & b at 0.73 (1.0) 8.5 (1.0)
SEISMIC HAZARD ASSESSMENT RESULTS
Peak Horizontal Acceleration on Rock The calculated hazard levels, in terms of peak horizontal acceleration on rock, at the three probabilities of being exceeded, are summarized in Table 3.
Table 3: Seismic Hazard Assessment Results
Spectral Acceleration (m/s²)
Period (s) Probability of
Being Exceeded
Peak Acceleration
(m/s²) 0.1 0.2 0.5 1.0 2.0 5.0
50 % in 50 years 0.48 1.00 0.82 0.40 0.16 0.07 0.02
10 % in 50 years 1.50 3.09 2.24 1.01 0.41 0.15 0.05
2 % in 50 years 3.41 6.82 4.66 2.01 0.81 0.30 0.08
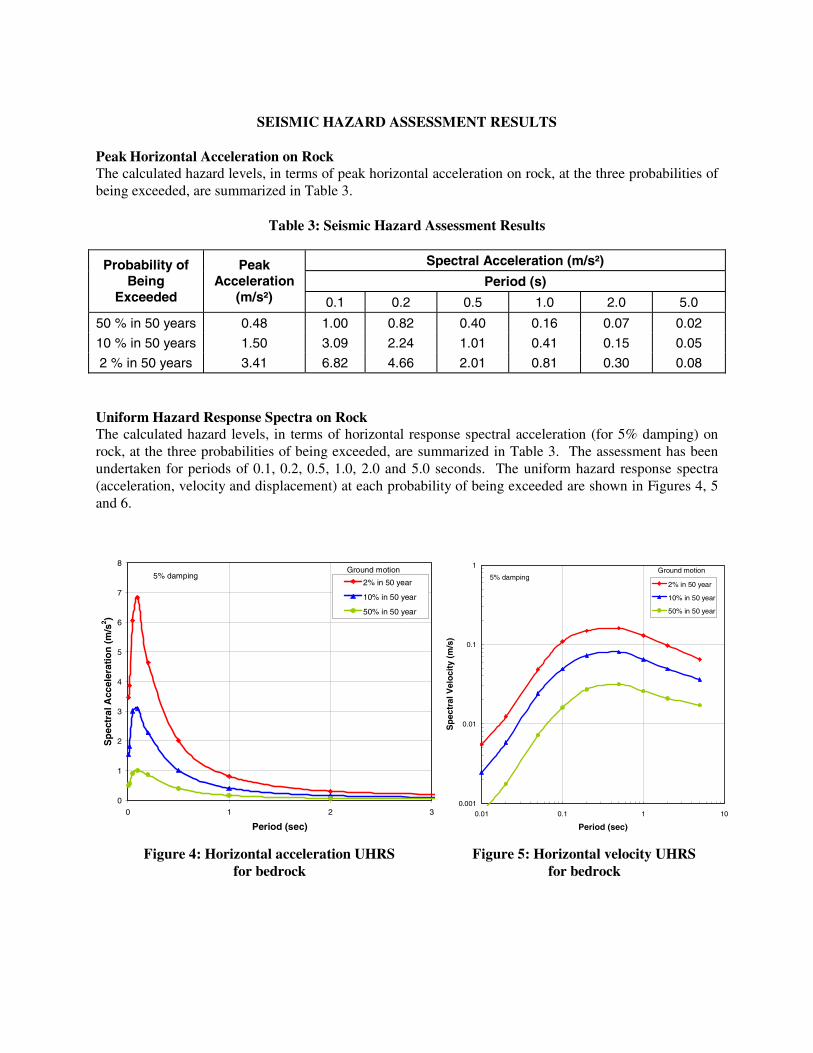
Uniform Hazard Response Spectra on Rock The calculated hazard levels, in terms of horizontal response spectral acceleration (for 5% damping) on rock, at the three probabilities of being exceeded, are summarized in Table 3. The assessment has been undertaken for periods of 0.1, 0.2, 0.5, 1.0, 2.0 and 5.0 seconds. The uniform hazard response spectra (acceleration, velocity and displacement) at each probability of being exceeded are shown in Figures 4, 5 and 6.
Figure 4: Horizontal acceleration UHRS for bedrock
Figure 5: Horizontal velocity UHRS for bedrock
0
1
2
3
4
5
6
7
8
0 1 2 3
Period (sec)
Sp
ectr
al A
ccel
erat
ion
(m/s
2 )
2% in 50 year
10% in 50 year
50% in 50 year
5% dampingGround motion
0.001
0.01
0.1
1
0.01 0.1 1 10
Period (sec)
Sp
ectr
al V
elo
city
(m
/s)
2% in 50 year
10% in 50 year
50% in 50 year
5% dampingGround motion
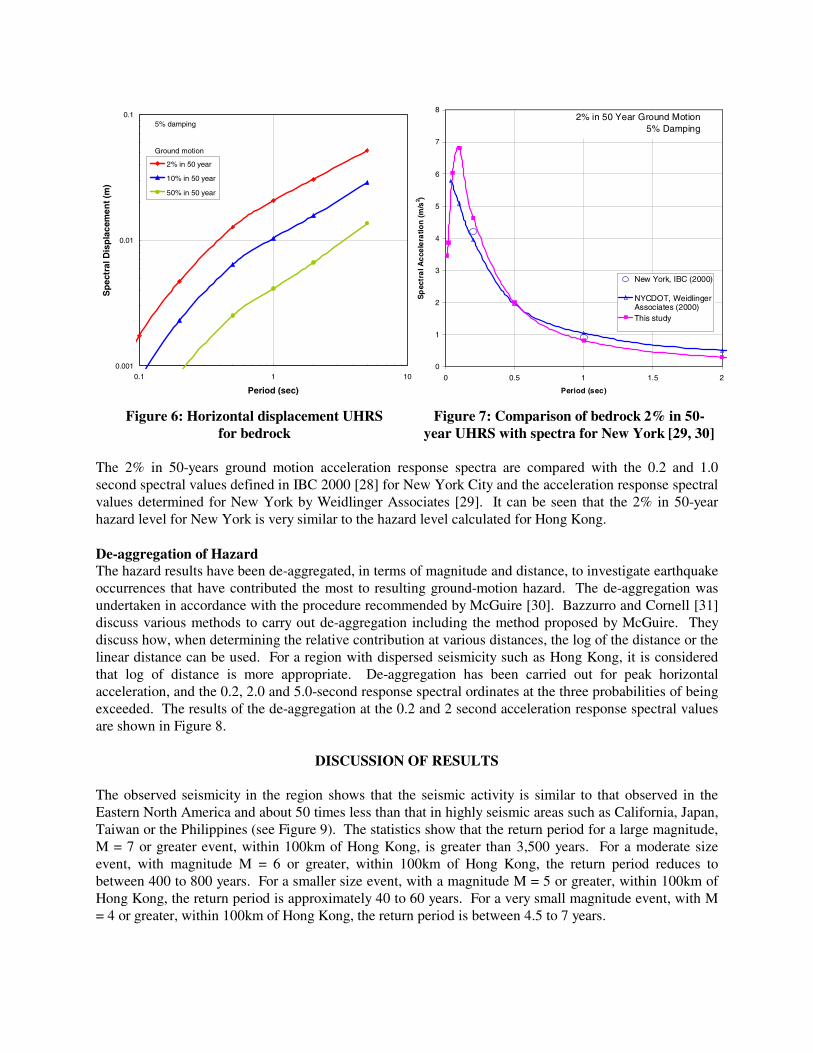
Figure 6: Horizontal displacement UHRS for bedrock
Figure 7: Comparison of bedrock 2% in 50-year UHRS with spectra for New York [29, 30]
The 2% in 50-years ground motion acceleration response spectra are compared with the 0.2 and 1.0 second spectral values defined in IBC 2000 [28] for New York City and the acceleration response spectral values determined for New York by Weidlinger Associates [29]. It can be seen that the 2% in 50-year hazard level for New York is very similar to the hazard level calculated for Hong Kong. De-aggregation of Hazard The hazard results have been de-aggregated, in terms of magnitude and distance, to investigate earthquake occurrences that have contributed the most to resulting ground-motion hazard. The de-aggregation was undertaken in accordance with the procedure recommended by McGuire [30]. Bazzurro and Cornell [31] discuss various methods to carry out de-aggregation including the method proposed by McGuire. They discuss how, when determining the relative contribution at various distances, the log of the distance or the linear distance can be used. For a region with dispersed seismicity such as Hong Kong, it is considered that log of distance is more appropriate. De-aggregation has been carried out for peak horizontal acceleration, and the 0.2, 2.0 and 5.0-second response spectral ordinates at the three probabilities of being exceeded. The results of the de-aggregation at the 0.2 and 2 second acceleration response spectral values are shown in Figure 8.
DISCUSSION OF RESULTS The observed seismicity in the region shows that the seismic activity is similar to that observed in the Eastern North America and about 50 times less than that in highly seismic areas such as California, Japan, Taiwan or the Philippines (see Figure 9). The statistics show that the return period for a large magnitude, M = 7 or greater event, within 100km of Hong Kong, is greater than 3,500 years. For a moderate size event, with magnitude M = 6 or greater, within 100km of Hong Kong, the return period reduces to between 400 to 800 years. For a smaller size event, with a magnitude M = 5 or greater, within 100km of Hong Kong, the return period is approximately 40 to 60 years. For a very small magnitude event, with M = 4 or greater, within 100km of Hong Kong, the return period is between 4.5 to 7 years.
0
1
2
3
4
5
6
7
8
0 0.5 1 1.5 2
Period (sec)
Sp
ectr
al A
cce
lera
tio
n (
m/s
2 )
New York, IBC (2000)
NYCDOT, WeidlingerAssociates (2000)This study
2% in 50 Year Ground Motion 5% Damping
0.001
0.01
0.1
0.1 1 10
Period (sec)
Sp
ectr
al D
isp
lace
men
t (m
)
2% in 50 year
10% in 50 year
50% in 50 year
5% damping
Ground motion
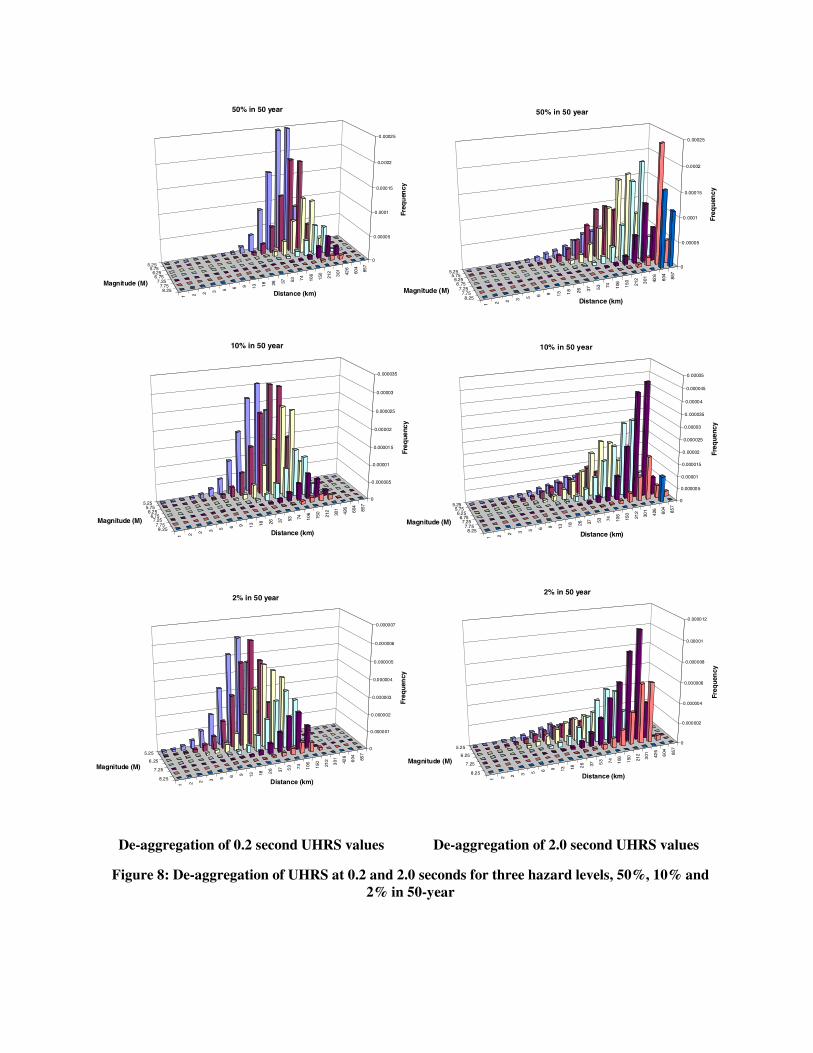
De-aggregation of 0.2 second UHRS values De-aggregation of 2.0 second UHRS values
Figure 8: De-aggregation of UHRS at 0.2 and 2.0 seconds for three hazard levels, 50%, 10% and 2% in 50-year
1 2 2 3 5 6 9 13 18 26 37 53 74 106
150
212
301
426
604
857
8 .257.75
7.256.75
6.255.75
5.250
0.000005
0.00001
0.000015
0.00002
0.000025
0.00003
0.000035
Freq
uenc
y
Distance (km)
Magnitude (M)
10% in 50 year
1 2 2 3 5 6 9 13 18 26 37 5
3 74
106 150 21
2
301 42
6
604 85
7
8.25
7.25
6.25
5.250
0.000001
0.000002
0.000003
0.000004
0.000005
0.000006
0.000007
Freq
uen
cy
Distance (km)
Magnitude (M)
2% in 50 year
1 2 2 3 5 6 9 13 18 26 37 53 74 106
150
212
301
426
604
857
8.257.75
7.256.75
6.255.75
5.250
0.000005
0.00001
0.000015
0.00002
0.000025
0.00003
0.000035
0.00004
0.000045
0.00005
Freq
uenc
y
Distance (km)
Magnitude (M)
10% in 50 year
1 2 2 3 5 6 9 13 18 26 37 5
3 74
106 150 21
2
301 42
6
604 85
7
8.25
7.25
6.25
5.250
0.000002
0.000004
0.000006
0.000008
0.00001
0.000012
Freq
uen
cy
Distance (km)
Magnitude (M)
2% in 50 year
1 2 2 3 5 6 9 13 18 26 37 53 7
4
106
150 21
2
301 42
6
604
857
8.257.75
7.256.75
6.255.75
5.250
0.00005
0.0001
0.00015
0.0002
0.00025
Freq
uen
cy
Distance (km)
Magnitude (M)
50% in 50 year
1 2 2 3 5 6 9 13 18 26 37 53 74 10
6
150
212
301 42
6
604
857
8.257.75
7.256.75
6.255.75
5.250
0.00005
0.0001
0.00015
0.0002
0.00025
Freq
uen
cy
Distance (km)
Magnitude (M)
50% in 50 year
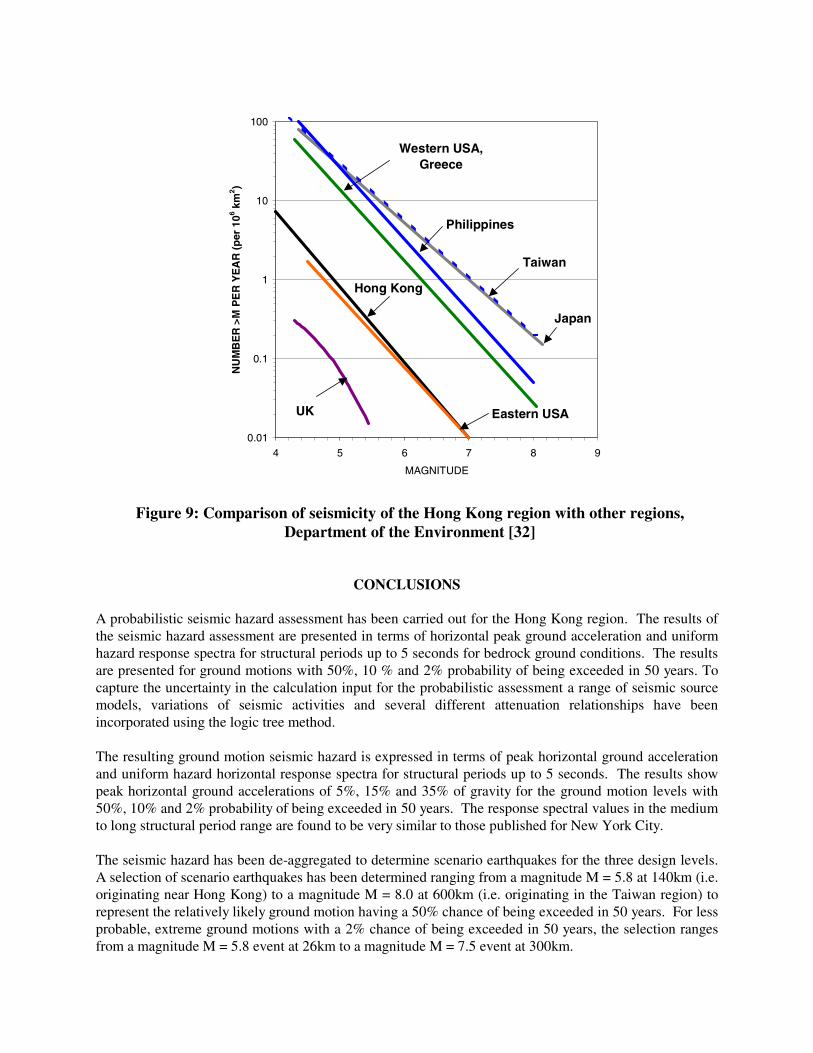
Figure 9: Comparison of seismicity of the Hong Kong region with other regions, Department of the Environment [32]
CONCLUSIONS A probabilistic seismic hazard assessment has been carried out for the Hong Kong region. The results of the seismic hazard assessment are presented in terms of horizontal peak ground acceleration and uniform hazard response spectra for structural periods up to 5 seconds for bedrock ground conditions. The results are presented for ground motions with 50%, 10 % and 2% probability of being exceeded in 50 years. To capture the uncertainty in the calculation input for the probabilistic assessment a range of seismic source models, variations of seismic activities and several different attenuation relationships have been incorporated using the logic tree method. The resulting ground motion seismic hazard is expressed in terms of peak horizontal ground acceleration and uniform hazard horizontal response spectra for structural periods up to 5 seconds. The results show peak horizontal ground accelerations of 5%, 15% and 35% of gravity for the ground motion levels with 50%, 10% and 2% probability of being exceeded in 50 years. The response spectral values in the medium to long structural period range are found to be very similar to those published for New York City. The seismic hazard has been de-aggregated to determine scenario earthquakes for the three design levels. A selection of scenario earthquakes has been determined ranging from a magnitude M = 5.8 at 140km (i.e. originating near Hong Kong) to a magnitude M = 8.0 at 600km (i.e. originating in the Taiwan region) to represent the relatively likely ground motion having a 50% chance of being exceeded in 50 years. For less probable, extreme ground motions with a 2% chance of being exceeded in 50 years, the selection ranges from a magnitude M = 5.8 event at 26km to a magnitude M = 7.5 event at 300km.
0.01
0.1
1
10
100
4 5 6 7 8 9
MAGNITUDE
NU
MB
ER
>M
PE
R Y
EA
R (
per
106 k
m2 )
Western USA,Greece
Philippines
Japan
Hong Kong
Eastern USAUK
Taiwan

REFERENCES
1. Pappin JW, Free MW, Bird J, Koo R. “Evaluation of site effects in a moderate seismicity region,
Hong Kong”, 13th World Conference on Earthquake Engineering, Vancouver, B.C., Canada, August, 2004.
2. Sewell RJ, Campbell SDG, Fletcher CJN, Lai KW, Kirk PA. “The Pre-Quaternary geology of Hong Kong”, Hong Kong Geological Survey, Geotechnical Engineering Office, Civil Engineering Department, The Government of the Hong Kong SAR, 2000.
3. Fyfe JA, Shaw R, Campbell SDG, Lai KW, Kirk PA. “The Quaternary geology of Hong Kong”, Hong Kong Geological Survey, Geotechnical Engineering Office, Civil Engineering Department, The Government of the Hong Kong SAR, 2000.
4. Ding YZ, Lai KW “Neotectonic fault activity in Hong Kong: evidence from seismic events and thermo-luminescence dating of fault gouge”, Jn. Geological Society, 1997; 154, 1001-1007.
5. Lee CF, Ding YZ, Huang RH, Yu YB, Guo GA, Chen PL, Huang XH. “Seismic hazard analysis of the Hong Kong region”, GEO Report No. 65, Geotechnical Engineering Office, Civil Engineering Department, The Government of the Hong Kong SAR, 1998.
6. Cornell CA. “Engineering seismic risk analysis”, Bull. Seism. Soc Am., 1968; 58, 1583-1606. 7. McGuire RK. “Computations of Seismic Hazard”, in Giardini, D., and Basham, P.W. (eds), Global
Seismic Hazard Assessment Program, Annali di Geofisica, 1993; 34, 181-200. 8. Kulkarni RB, Youngs RR, Coppersmith KJ. “Assessment of confidence intervals for results of
seismic hazard analysis”, in Proceedings of the Eight World Conf. on Earthquake Engineering, San Francisco, Calif., 1984; 1, 263-270.
9. Coppersmith KJ, Youngs RR. “Capturing uncertainty in probabilistic seismic hazard assessments within intraplate tectonic environments”, Proc. 3rd. U.S. Nat. Conf. Earthq. Engg., 1986; 1, 301-312.
10. National Research Council “Probabilistic Seismic Hazard Analysis”, National Academy Press, Washington, D.C., 1988.
11. Gu GX, Liu TH, Shi ZL, Li Q, Wu HY, Lu SD, Yang YL, Chen HT, Wang SY. “The directory of earthquakes in China (BC 1831 to AD 1969)”, Science Publisher, China, 1983.
12. Guangdong Seismological Bureau. Listing of historical earthquakes 1067 to 1969 and listing of recent earthquakes 1970 to 2002.
13. Geotechnical Control Office “Review of earthquake Data for the Hong Kong region”, GCO Publication No. 1/91, 1991.
14. Johnston AC. “Moment magnitude assessment of stable continental earthquakes, Part 1: instrumental seismicity”, Geophysical Jn. Int., 1995a.
15. Johnston AC. “Moment magnitude assessment of stable continental earthquakes, Part 2: historical seismicity”, Geophysical Jn. Int., 1995b.
16. Gardener JK, Knopoff L. “Is the sequence of earthquakes in Southern California, with aftershocks removed, Poissonian?”, Bull. Seis. Soc. Am., 1974; 64 (5), 1363-1367.
17. Pun WK, Ambraseys NN. “Earthquake data review and seismic hazard analysis for the Hong Kong region”, Earthquake Engineering and Structural Dynamics, 1992; 21, 433-443.
18. Wong YL, Zhao JX, Chau KT, Lee CM. “Assessment of seismicity model for Hong Kong region”, Hong Kong Institution of Engineers, Transactions, 1998; 5 (1), 50-62.
19. Weichert DH. “Estimation of the earthquake recurrence parameters for unequal observation periods for different magnitudes”, Bull. Seis. Soc. Am., 1980; 70 (4), 1337-1346.
20. Lam, NTK, Wilson JL, Hutchinson GL. “Generation of synthetic earthquake accelerograms using seismological modelling: a review”, Journal of Earthquake Engineering, 2000: 4(3), 321-354.
21. Lam NTK, Wilson JL, Chandler AM, Hutchinson GL. “Response spectral relationships for rock sites derived from the component attenuation model”, Earthquake Engineering & Structural Dynamics, 2000: 29, 1457-1489.
22. Boore DM. “Stochastic simulation of high frequency ground motions based on seismological models of the radiated spectra”, Bull. Seis. Soc. Am., 1983; 73 (1), 865-894.
23. Atkinson GM, Boore DM. “Some comparisons between recent ground motion relations”, Seismological Research Letters, 1995; 68 (1), 24-40.
24. Boore DM, Joyner W, Fumal T. “Estimation of response spectra and peak accelerations from western North American earthquakes: an interim report”, Open File Report 93-509, United States Geological Survey, 1993.
25. Wong YL, Zheng S, Liu J, Kand Y, Tam CM, Leung YK, Zhao X. “Attenuation function of ground motions for Guangdong region of Southern China”, International Conference on Advances and New Challenges in Earthquake Engineering Research, August 15-20, Harbin and Hong Kong, China, 2002, 123-130.
26. Chandler AM, Lam NTK, Sheikh MN. “Response spectral predictions for potential near field and far field earthquakes affect Hong Kong: soil sites”, Soil Dynamics and Earthquake Engineering, 2002, 22, 419-440.
27. Atkinson GM. “Source spectra for earthquakes in Eastern North America”, Bull. Seis. Soc. Am., 1993; 83, 1778-1798.
28. International Code Council “International Building Code 2000”, International Code Council, California, USA, 2000.
29. Weidlinger Associates Inc. “New York City seismic hazard study”, www.wai.com, 2000. 30. McGuire RK “Probabilistic seismic hazard analysis and design earthquakes: Closing the loop”, Bull.
Seis. Soc. Am., 1995; 85 (5), 1275-1284. 31. Bazzurro P, Cornell CA. “Disaggregation of seismic hazard”, Bull. Seis. Soc. Am., 1999; 89 (2), 501-
520. 32. The Department of the Environment. “Earthquake hazard and risk in the UK”, Prepared by Ove Arup
and Partners, London, HMSO, 1993.
Related Documents