© Ricardo-AEA Ltd www.ricardo-aea.com Assessing variations in roadside air quality with sampling height 21 st October 2014

SEIG seminar 2014 - A Smarter Way to Lower Emissions - Stephen Stratton
Jul 30, 2015
Welcome message from author
This document is posted to help you gain knowledge. Please leave a comment to let me know what you think about it! Share it to your friends and learn new things together.
Transcript

© Ricardo-AEA Ltd
www.ricardo-aea.com
Assessing variations in roadside air quality with sampling height21st October 2014
© Ricardo-AEA LtdRicardo-AEA in Confidence2
Introduction
2
• Study commissioned by the Scottish Government to investigate roadside air quality versus height.
• Progress so far.
• Some results (still provisional).

© Ricardo-AEA LtdRicardo-AEA in Confidence3
The Study
3
“The study will investigate how Air Quality varies with height and aims to:
•Determine the relationship between height from pavement and Air Quality.
•Investigate the relationship between mobile and fixed sampling methods.
•Examine diurnal and seasonal variations in Air Quality.
The outputs will help inform Air Quality policy in Scotland.”

© Ricardo-AEA LtdRicardo-AEA in Confidence4
The Team
Ellis Marshall-Padkin
Stephen Stratton
Susannah Telfer Stephen Gray
David Hector
Sam Copsey Brian Stacey
Stuart Sneddon

© Ricardo-AEA LtdRicardo-AEA in Confidence5
The Equipment
Species Sampling Method/Analyser
PM2.5 (Automatic) Lighthouse IAQ 3016 PM2.5analyser
PM2.5 (Gravimetric) Harvard-PEMS + BGI pump (Personal Exposure Monitor)
Black Carbon Magee MicroAeth AE51Ultrafine Particles Philips NanotracerNO2, SO2, CO and O3 AQMeshCO2 COZIR Optical SensorBenzene Pumped tube sampling
Meteorology Lufft WS600 (WS+WD+T+H+P+RF)
Video and GPS RoadhawkData Acquisition Weblogger with 3G telemetry
© Ricardo-AEA LtdRicardo-AEA in Confidence6
The Location – Why Glasgow?
• Glasgow is Scotland’s largest city.
• Glasgow City Centre combines a variety of urban environments within walking distance.
• Glasgow City Centre is busy, both in terms of road traffic and people.
• Ricardo-AEA Scotland office, Blythswood Square.

© Ricardo-AEA LtdRicardo-AEA in Confidence7
So Far…
• Literature Review
• Testing
• Co-locations
• Sampling Runs

© Ricardo-AEA LtdRicardo-AEA in Confidence8
Findings - Literature Review
• No study was found that incorporated mobile sampling with sampling at more than one height.
• The review focussed on but was not restricted to the following types of study:
Ø Air quality versus height.
Ø Mobile monitoring.
Ø Personal exposure.
• Research indicates that a pollutant gradient does exist at heights below 3 m above ground level, but that the following factors will affect the vertical profile:
Ø Meteorology.
Ø Topography.
Ø Distance from emissions source.
• Methodology outlined for the study was validated.
• Sampling heights defined as 168 cm above ground level for the average height of an adult above the age of 16 years in Scotland; and 80 cm for a child in a buggy.
• Highlighted problems that we might encounter.

© Ricardo-AEA LtdRicardo-AEA in Confidence9
Sampling Regime
• Predetermined route.
• 8 mobile sampling exercise (2 weekend days).
• 6 co-location exercises, sampling at an automatic monitoring site.
• Carried out between February and August 2014.

© Ricardo-AEA LtdRicardo-AEA in Confidence10
Sampling Route
Map data ©2013 Google
Street name Description of street on route
Approximate Length of street
within study route (miles)
Hope Street Busy urban canyon orientation south to north (partially restricted to buses and taxes)
0.42
Sauchiehall Street Urban pedestrian precinct orientation west to east 0.16
Buchanan Street Urban pedestrian precinct orientation north to south 0.22
St Vincent Street Busy urban canyon orientation west to east 0.10George Square Busy urban street orientation west to east 0.14George Street Busy urban canyon orientation west to east 0.14
Montrose street Busy urban canyon orientation north to south 0.11
Ingram Street Busy urban street orientation west to east 0.18High street Busy urban street orientation north to south 0.21Saltmarket Busy urban street orientation north to south 0.34
Clyde Street/Broomielaw Busy Urban street orientation east to west 0.44
Oswald Street Busy urban street orientation north to south 0.16
Ricardo-AEA Office

© Ricardo-AEA LtdRicardo-AEA in Confidence11
• 185 miles covered and 9,840 ft “climbed”……over a total of 82 hours.• 2 x 18,575 Calories used.
Vital Stats
11
Mobile Sampling Exercises
Fri 14/03/2014
Thur 10/04/2014Wed 21/05/2014Mon 23/06/2014Tue 08/07/2014Sun 13/07/2014Sat 09/08/2014Fri 15/08/2014
Colocation Exercises
Townhead AURN (including BC) 14/02/2014
Hope Street AURN 25/04/2014
Hope Street AURN 19/06/2014
Hope Street AURN 17/07/2014
Hope Street 13/08/2014
London Marylebone Road (UFP only) 21/08/2014
Townhead AURN (including BC) 27/08/2014

© Ricardo-AEA LtdRicardo-AEA in Confidence12
PM2.5 (µg m-3)
Contains Ordinance Survey data © Crown copyright and database right 2014.

© Ricardo-AEA LtdRicardo-AEA in Confidence13
Black Carbon (ng m-3)
Contains Ordinance Survey data © Crown copyright and database right 2014.

© Ricardo-AEA LtdRicardo-AEA in Confidence14
Ultrafine Particles (N Particles cm-3)
Contains Ordinance Survey data © Crown copyright and database right 2014.
© Ricardo-AEA LtdRicardo-AEA in Confidence15
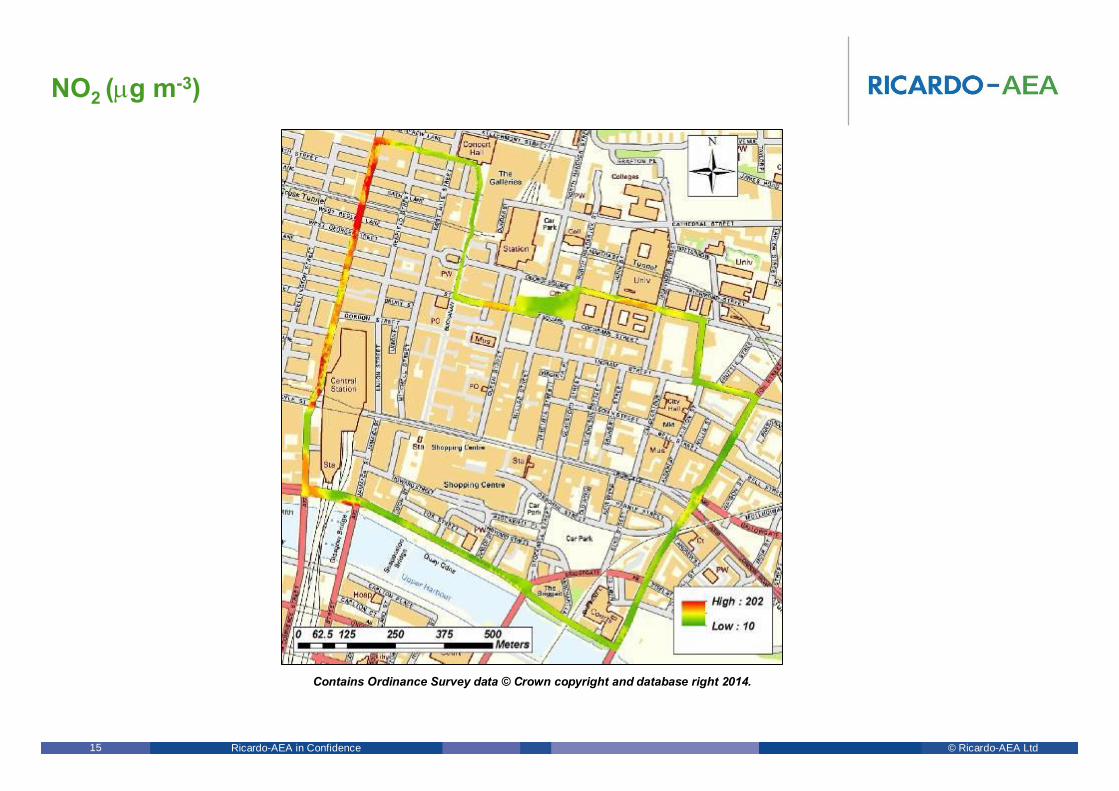
NO2 (µg m-3)
Contains Ordinance Survey data © Crown copyright and database right 2014.
© Ricardo-AEA LtdRicardo-AEA in Confidence16
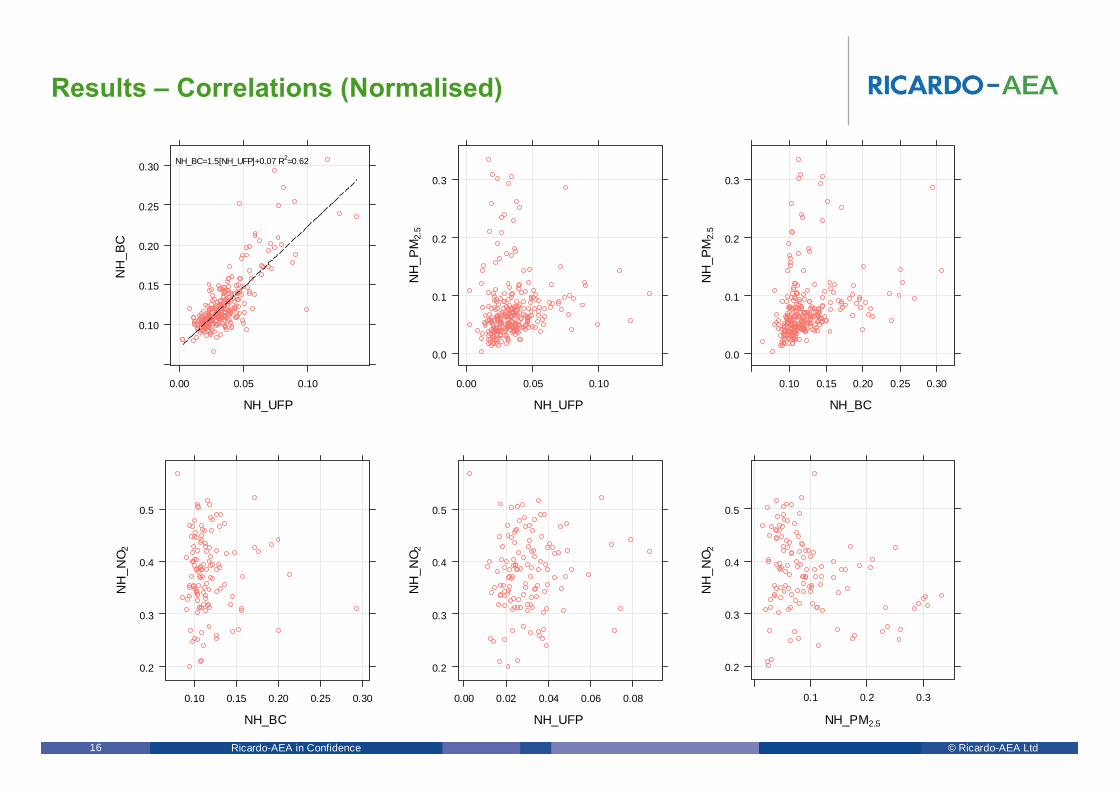
Results – Correlations (Normalised)
NH_UFP
NH
_BC
0.10
0.15
0.20
0.25
0.30
0.00 0.05 0.10
NH_BC=1.5[NH_UFP]+0.07 R2=0.62
NH_UFP N
H_P
M2.
5
0.0
0.1
0.2
0.3
0.00 0.05 0.10
NH_BC
NH
_PM
2.5
0.0
0.1
0.2
0.3
0.10 0.15 0.20 0.25 0.30
NH_BC
NH
_NO 2
0.2
0.3
0.4
0.5
0.10 0.15 0.20 0.25 0.30
NH_UFP
NH
_NO 2
0.2
0.3
0.4
0.5
0.00 0.02 0.04 0.06 0.08
NH_PM2.5
NH
_NO 2
0.2
0.3
0.4
0.5
0.1 0.2 0.3

© Ricardo-AEA LtdRicardo-AEA in Confidence17
Results – PM vs Height
Pollutant LOW/HIGH DifferencePM0.5 ~0%PM1 ~0%PM2.5 ~0%PM5 ~7%PM10 ~12%Black Carbon ~5%UFP ~0%NO2 ~0%
• Latest analyses indicate that a concentration gradient does exist:

© Ricardo-AEA LtdRicardo-AEA in Confidence18
Results – Diurnal/Seasonal Variations
Wednesday, 21/05/2014
H_U
FP, H
_BC
, H_P
M 2.5
, H_N
O 2
20000
25000
30000
H_U
FP
20002500300035004000
H_B
C
56789
10
H_P
M 2.5
40506070
08:00 09:00 10:00 11:00 12:00 13:00 14:00 15:00 16:00 17:00 18:00
H_N
O 2
H_UFP H_BC H_PM2.5 H_NO2
Thursday, 10/04/2014
H_U
FP, H
_BC
, H_P
M 2.5
, H_N
O 2 20000
25000
30000
H_U
FP
20002500300035004000
H_B
C
810121416
H_P
M 2.5
4045505560
08:00 09:00 10:00 11:00 12:00 13:00 14:00 15:00 16:00 17:00 18:00
H_N
O 2
H_UFP H_BC H_PM2.5 H_NO2
Friday, 14/03/2014
H_U
FP, H
_BC
, H_P
M 2.5
, H_N
O 2
150002000025000
H_U
FP
200030004000500060007000
H_B
C
10203040
H_P
M 2.5
303540455055
08:00 09:00 10:00 11:00 12:00 13:00 14:00 15:00 16:00 17:00
H_N
O2
H_UFP H_BC H_PM2.5 H_NO2
Sunday, 13/07/2014
H_U
FP, H
_BC
, H_P
M 2.5
, H_N
O 2
1500020000
25000
H_U
FP
150020002500300035004000
H_B
C
468
H_P
M 2.5
20
3040
09:00 10:00 11:00 12:00 13:00 14:00 15:00 16:00
H_N
O2
H_UFP H_BC H_PM2.5 H_NO2

© Ricardo-AEA LtdRicardo-AEA in Confidence19
Results – Diurnal/Seasonal Variations
Thursday, 10/04/2014
NO2 (ppb)
Freq
uenc
y
0 20 40 60 80 100 120 140
050
100
150
Friday, 14/03/2014
NO2 (ppb)
Freq
uenc
y
0 50 100
050
100
150
200
Wednesday, 21/05/2014
NO2 (ppb)
Freq
uenc
y
0 50 100 150 200
050
100
150
200
Sunday, 13/07/2014
NO2 (ppb)
Freq
uenc
y
0 50 100
020
4060
8010
0

© Ricardo-AEA LtdRicardo-AEA in Confidence20
Finally…
• This type study, combining mobile monitoring with monitoring at more than one height, has not been carried out before.
• Collected a lot of data!
• Ongoing analyses indicate that a concentration gradient does exist, but that it is pollutant dependent and changes with microenvironment.
• ‘Typical’ diurnal variations in pollutant concentrations are seen.
• Method has proved very useful for characterising the spatial distribution of pollutants, identifying pollution ‘hotspots’.
• Final results due to be published by the end of 2014…

© Ricardo-AEA Ltd
www.ricardo-aea.com
T:E: W:
Stephen Stratton
+44 (0)1235 75 [email protected]
Comments/ Questions?
Related Documents


