Segmentation of the central-chest lymph nodes in 3D MDCT images Kongkuo Lu a,b , William E. Higgins a, a Department of Electrical Engineering, Penn State University, University Park, PA 16802, USA b Philips Research North America, Briarcliff, NY, USA article info Article history: Received 6 July 2010 Accepted 17 June 2011 Keywords: Lymph node 3D imaging Thoracic imaging Lung cancer MDCT Image segmentation Live wire abstract Central-chest lymph nodes play a vital role in lung-cancer staging. The definition of lymph nodes from three-dimensional (3D) multidetector computed-tomography (MDCT) images, however, remains an open problem. We propose two methods for computer-based segmentation of the central-chest lymph nodes from a 3D MDCT scan: the single-section live wire and the single-click live wire. For the single-section live wire, the user first applies the standard live wire to a single two-dimensional (2D) section after which automated analysis completes the segmentation process. The single-click live wire is similar but is almost completely automatic. Ground-truth studies involving human 3D MDCT scans demonstrate the robustness, efficiency, and intra-observer and inter-observer reproducibility of the methods. & 2011 Elsevier Ltd. All rights reserved. 1. Introduction The central-chest lymph nodes play a vital role in lung-cancer staging [1–3]. The standard lymph-node staging procedure involves identification of suspect lymph nodes in a chest CT scan followed by bronchoscopic nodal sampling. Modern MDCT scanners provide detailed high-resolution 3D images of the anatomy [4,5]. Even though MDCT has become a standard tool for lung- cancer staging, partial-volume effects and limited dynamic range in discriminating different soft tissues make it difficult to define soft- tissue structures in a 3D MDCT image. In particular, the definition of lymph nodes proves especially difficult, because lymph nodes vary greatly in size, shape, and gray-scale consistency. They also often have undiscernible boundaries with surrounding soft-tissue struc- tures such as airways and vessels (Fig. 1). We propose two methods for computer-based segmentation of the central-chest lymph nodes in a 3D MDCT scan. Regarding past efforts at devising computer-based methods for defining lymph nodes in CT chest images, Vining et al. relied on manual image ‘‘painting’’ of individual 2D MDCT sections to define 3D lymph nodes, as did McAdams et al. [6,7]. Honea et al. [8,9] proposed 2D and 3D methods for lymph-node segmentation based on active contour models, but they only evaluated their methods on synthetic images and did not consider realistic situations. Yan et al. [10] presented an edge-based matching method, but gave no evaluation results. Kiraly et al. [11] presented a method for labeling preidentified and presegmented central-chest lymph nodes, but did not offer a segmentation method. Feuerstein et al. [12] proposed an automatic method for detecting candidate lymph nodes, but did not put forth a follow-on method for segmenting the detected candi- dates. Finally, researchers have considered lymph-node segmenta- tion in other domains, such as the abdomen, pelvis, and neck, but it is unclear if these methods could be applicable to the chest and 3D MDCT and they again sometimes require human interaction [13,14]. Thus, central-chest lymph-node segmentation from 3D MDCT images remains an open problem. Our two methods are motivated by the general paradigm of active contour analysis and draw upon the recently proposed notion referred to as the live wire [15–19]. For the first method, referred to as the single-section live wire, the user first applies the standard 2D live wire to a single 2D section of a given 3D MDCT image, after which automated analysis completes the segmentation process. The second method, referred to as the single-click live wire, is very similar to the single-section method but is almost completely automatic. The methods constitute part of a general lymph-node station mapper system (LNSM) we have been devising for nodal station analysis and procedure planning [20–22]. The methods have also been used extensively in our efforts for the planning and follow-on guidance of lung-cancer assessment procedures [23–25]. Section 2 describes the methods in detail, Section 3 presents experimental results, and Section 4 offers concluding remarks. 2. Methods Given an input 3D MDCT image I, the goal is to arrive at a 3D segmentation B of a lymph node of interest. For both the single- section and single-click live-wire methods, the user provides Contents lists available at ScienceDirect journal homepage: www.elsevier.com/locate/cbm Computers in Biology and Medicine 0010-4825/$ - see front matter & 2011 Elsevier Ltd. All rights reserved. doi:10.1016/j.compbiomed.2011.06.014 Corresponding author. Fax: þ1 814 863 5341. E-mail address: [email protected] (W.E. Higgins). Computers in Biology and Medicine 41 (2011) 780–789

Welcome message from author
This document is posted to help you gain knowledge. Please leave a comment to let me know what you think about it! Share it to your friends and learn new things together.
Transcript
Computers in Biology and Medicine 41 (2011) 780–789
Contents lists available at ScienceDirect
Computers in Biology and Medicine
0010-48
doi:10.1
� Corr
E-m
journal homepage: www.elsevier.com/locate/cbm
Segmentation of the central-chest lymph nodes in 3D MDCT images
Kongkuo Lu a,b, William E. Higgins a,�
a Department of Electrical Engineering, Penn State University, University Park, PA 16802, USAb Philips Research North America, Briarcliff, NY, USA
a r t i c l e i n f o
Article history:
Received 6 July 2010
Accepted 17 June 2011
Keywords:
Lymph node
3D imaging
Thoracic imaging
Lung cancer
MDCT
Image segmentation
Live wire
25/$ - see front matter & 2011 Elsevier Ltd. A
016/j.compbiomed.2011.06.014
esponding author. Fax: þ1 814 863 5341.
ail address: [email protected] (W.E. Higgins).
a b s t r a c t
Central-chest lymph nodes play a vital role in lung-cancer staging. The definition of lymph nodes from
three-dimensional (3D) multidetector computed-tomography (MDCT) images, however, remains an open
problem. We propose two methods for computer-based segmentation of the central-chest lymph nodes
from a 3D MDCT scan: the single-section live wire and the single-click live wire. For the single-section live
wire, the user first applies the standard live wire to a single two-dimensional (2D) section after which
automated analysis completes the segmentation process. The single-click live wire is similar but is almost
completely automatic. Ground-truth studies involving human 3D MDCT scans demonstrate the robustness,
efficiency, and intra-observer and inter-observer reproducibility of the methods.
& 2011 Elsevier Ltd. All rights reserved.
1. Introduction
The central-chest lymph nodes play a vital role in lung-cancerstaging [1–3]. The standard lymph-node staging procedureinvolves identification of suspect lymph nodes in a chest CTscan followed by bronchoscopic nodal sampling. Modern MDCTscanners provide detailed high-resolution 3D images of the anatomy[4,5]. Even though MDCT has become a standard tool for lung-cancer staging, partial-volume effects and limited dynamic range indiscriminating different soft tissues make it difficult to define soft-tissue structures in a 3D MDCT image. In particular, the definition oflymph nodes proves especially difficult, because lymph nodes varygreatly in size, shape, and gray-scale consistency. They also oftenhave undiscernible boundaries with surrounding soft-tissue struc-tures such as airways and vessels (Fig. 1). We propose two methodsfor computer-based segmentation of the central-chest lymph nodesin a 3D MDCT scan.
Regarding past efforts at devising computer-based methods fordefining lymph nodes in CT chest images, Vining et al. relied onmanual image ‘‘painting’’ of individual 2D MDCT sections to define3D lymph nodes, as did McAdams et al. [6,7]. Honea et al. [8,9]proposed 2D and 3D methods for lymph-node segmentation basedon active contour models, but they only evaluated their methods onsynthetic images and did not consider realistic situations. Yan et al.[10] presented an edge-based matching method, but gave noevaluation results. Kiraly et al. [11] presented a method for labelingpreidentified and presegmented central-chest lymph nodes, but did
ll rights reserved.
not offer a segmentation method. Feuerstein et al. [12] proposed anautomatic method for detecting candidate lymph nodes, but did notput forth a follow-on method for segmenting the detected candi-dates. Finally, researchers have considered lymph-node segmenta-tion in other domains, such as the abdomen, pelvis, and neck, but itis unclear if these methods could be applicable to the chest and 3DMDCT and they again sometimes require human interaction [13,14].Thus, central-chest lymph-node segmentation from 3D MDCTimages remains an open problem.
Our two methods are motivated by the general paradigm ofactive contour analysis and draw upon the recently proposed notionreferred to as the live wire [15–19]. For the first method, referred toas the single-section live wire, the user first applies the standard 2Dlive wire to a single 2D section of a given 3D MDCT image, afterwhich automated analysis completes the segmentation process. Thesecond method, referred to as the single-click live wire, is verysimilar to the single-section method but is almost completelyautomatic. The methods constitute part of a general lymph-nodestation mapper system (LNSM) we have been devising for nodalstation analysis and procedure planning [20–22]. The methods havealso been used extensively in our efforts for the planning andfollow-on guidance of lung-cancer assessment procedures [23–25].Section 2 describes the methods in detail, Section 3 presentsexperimental results, and Section 4 offers concluding remarks.
2. Methods
Given an input 3D MDCT image I, the goal is to arrive at a 3Dsegmentation B of a lymph node of interest. For both the single-section and single-click live-wire methods, the user provides
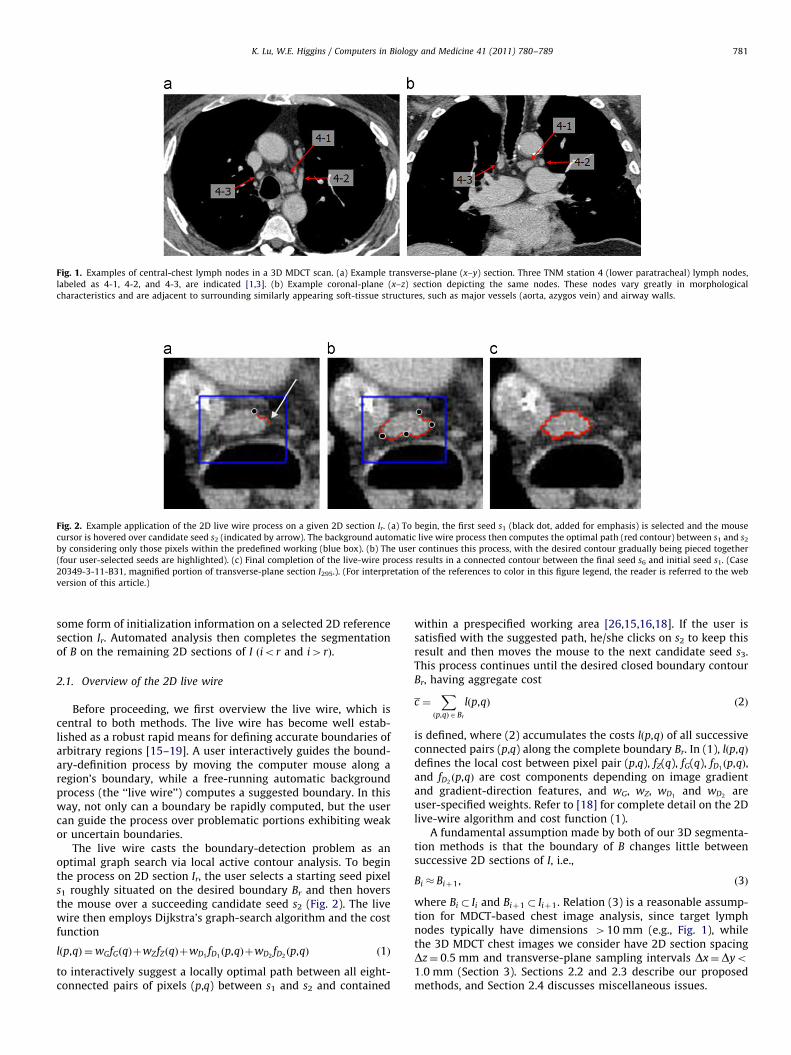
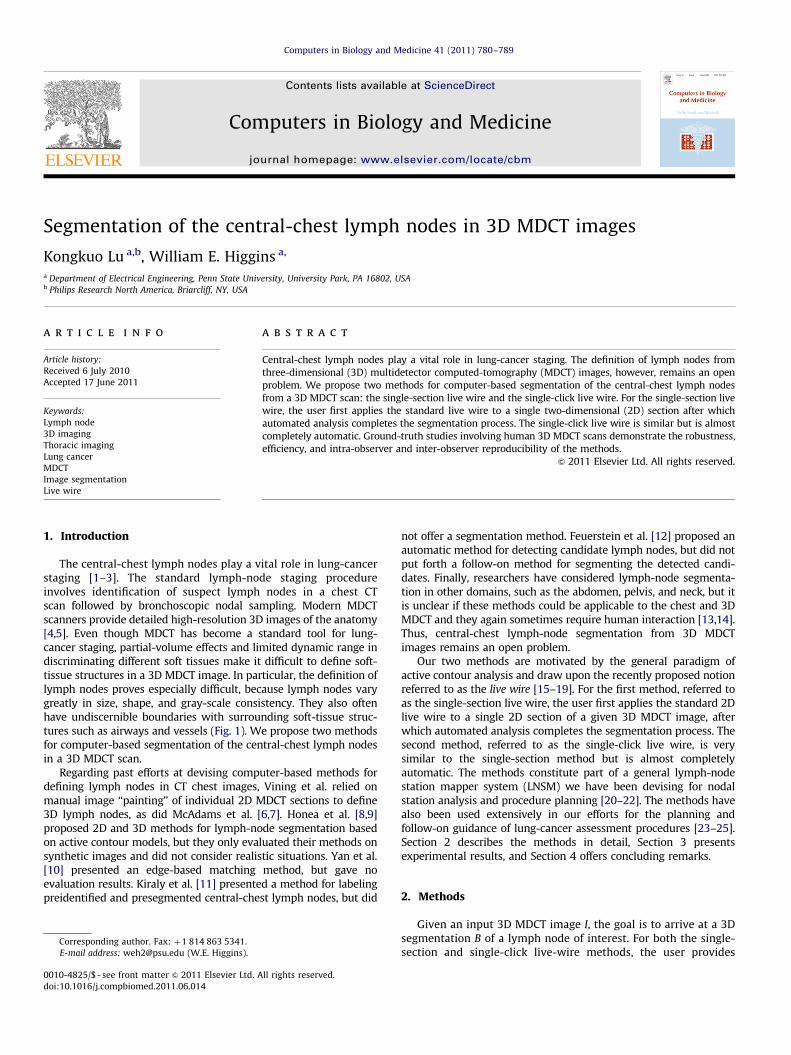
Fig. 1. Examples of central-chest lymph nodes in a 3D MDCT scan. (a) Example transverse-plane (x–y) section. Three TNM station 4 (lower paratracheal) lymph nodes,
labeled as 4-1, 4-2, and 4-3, are indicated [1,3]. (b) Example coronal-plane (x–z) section depicting the same nodes. These nodes vary greatly in morphological
characteristics and are adjacent to surrounding similarly appearing soft-tissue structures, such as major vessels (aorta, azygos vein) and airway walls.
Fig. 2. Example application of the 2D live wire process on a given 2D section Ir. (a) To begin, the first seed s1 (black dot, added for emphasis) is selected and the mouse
cursor is hovered over candidate seed s2 (indicated by arrow). The background automatic live wire process then computes the optimal path (red contour) between s1 and s2
by considering only those pixels within the predefined working (blue box). (b) The user continues this process, with the desired contour gradually being pieced together
(four user-selected seeds are highlighted). (c) Final completion of the live-wire process results in a connected contour between the final seed s6 and initial seed s1. (Case
20349-3-11-B31, magnified portion of transverse-plane section I295.). (For interpretation of the references to color in this figure legend, the reader is referred to the web
version of this article.)
K. Lu, W.E. Higgins / Computers in Biology and Medicine 41 (2011) 780–789 781
some form of initialization information on a selected 2D referencesection Ir. Automated analysis then completes the segmentationof B on the remaining 2D sections of I ðior and i4rÞ.
2.1. Overview of the 2D live wire
Before proceeding, we first overview the live wire, which iscentral to both methods. The live wire has become well estab-lished as a robust rapid means for defining accurate boundaries ofarbitrary regions [15–19]. A user interactively guides the bound-ary-definition process by moving the computer mouse along aregion’s boundary, while a free-running automatic backgroundprocess (the ‘‘live wire’’) computes a suggested boundary. In thisway, not only can a boundary be rapidly computed, but the usercan guide the process over problematic portions exhibiting weakor uncertain boundaries.
The live wire casts the boundary-detection problem as anoptimal graph search via local active contour analysis. To beginthe process on 2D section Ir, the user selects a starting seed pixels1 roughly situated on the desired boundary Br and then hoversthe mouse over a succeeding candidate seed s2 (Fig. 2). The livewire then employs Dijkstra’s graph-search algorithm and the costfunction
lðp,qÞ ¼wGfGðqÞþwZfZðqÞþwD1fD1ðp,qÞþwD2
fD2ðp,qÞ ð1Þ
to interactively suggest a locally optimal path between all eight-connected pairs of pixels (p,q) between s1 and s2 and contained
within a prespecified working area [26,15,16,18]. If the user issatisfied with the suggested path, he/she clicks on s2 to keep thisresult and then moves the mouse to the next candidate seed s3.This process continues until the desired closed boundary contourBr, having aggregate cost
c ¼Xðp,qÞABr
lðp,qÞ ð2Þ
is defined, where (2) accumulates the costs lðp,qÞ of all successiveconnected pairs (p,q) along the complete boundary Br. In (1), lðp,qÞdefines the local cost between pixel pair (p,q), fZ(q), fG(q), fD1
ðp,qÞ,and fD2
ðp,qÞ are cost components depending on image gradientand gradient-direction features, and wG, wZ, wD1
and wD2are
user-specified weights. Refer to [18] for complete detail on the 2Dlive-wire algorithm and cost function (1).
A fundamental assumption made by both of our 3D segmenta-tion methods is that the boundary of B changes little betweensuccessive 2D sections of I, i.e.,
Bi � Biþ1, ð3Þ
where Bi � Ii and Biþ1 � Iiþ1. Relation (3) is a reasonable assump-tion for MDCT-based chest image analysis, since target lymphnodes typically have dimensions 410 mm (e.g., Fig. 1), whilethe 3D MDCT chest images we consider have 2D section spacingDz¼ 0:5 mm and transverse-plane sampling intervals Dx¼Dyo1:0 mm (Section 3). Sections 2.2 and 2.3 describe our proposedmethods, and Section 2.4 discusses miscellaneous issues.
K. Lu, W.E. Higgins / Computers in Biology and Medicine 41 (2011) 780–789782
2.2. Single-section live wire
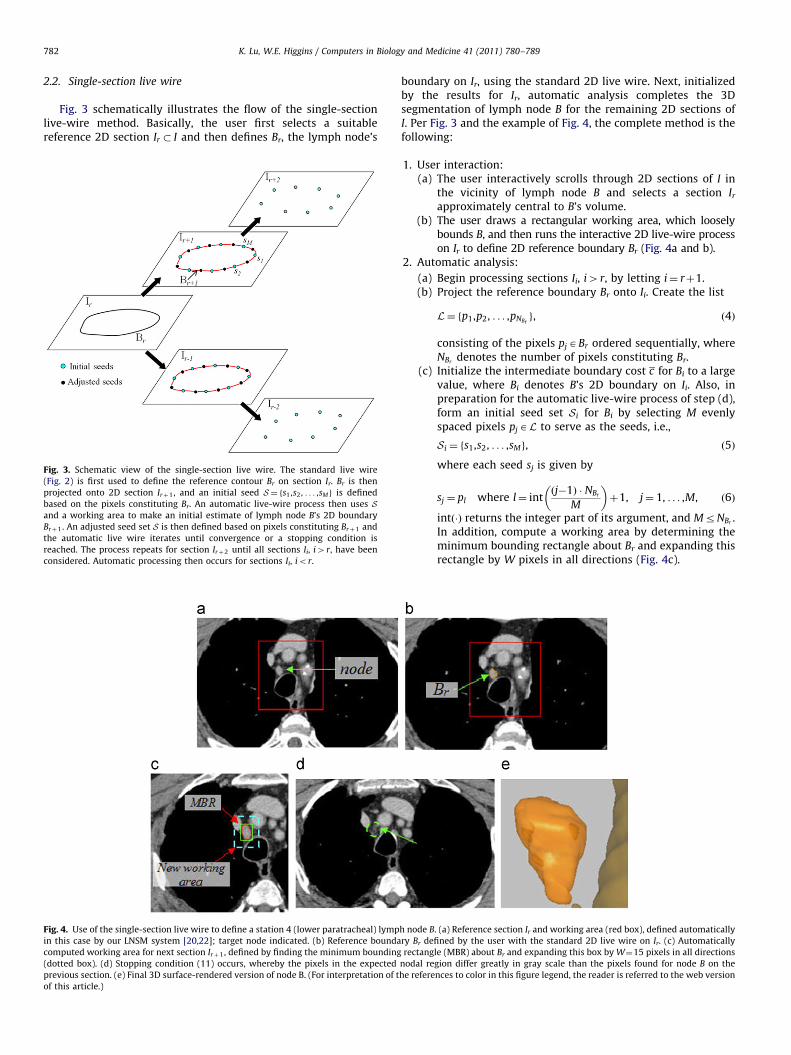
Fig. 3 schematically illustrates the flow of the single-sectionlive-wire method. Basically, the user first selects a suitablereference 2D section Ir � I and then defines Br, the lymph node’s
Fig. 3. Schematic view of the single-section live wire. The standard live wire
(Fig. 2) is first used to define the reference contour Br on section Ir. Br is then
projected onto 2D section Irþ1, and an initial seed S¼ fs1 ,s2 , . . . ,sMg is defined
based on the pixels constituting Br. An automatic live-wire process then uses Sand a working area to make an initial estimate of lymph node B’s 2D boundary
Brþ1. An adjusted seed set S is then defined based on pixels constituting Brþ1 and
the automatic live wire iterates until convergence or a stopping condition is
reached. The process repeats for section Irþ2 until all sections Ii, i4r, have been
considered. Automatic processing then occurs for sections Ii, ior.
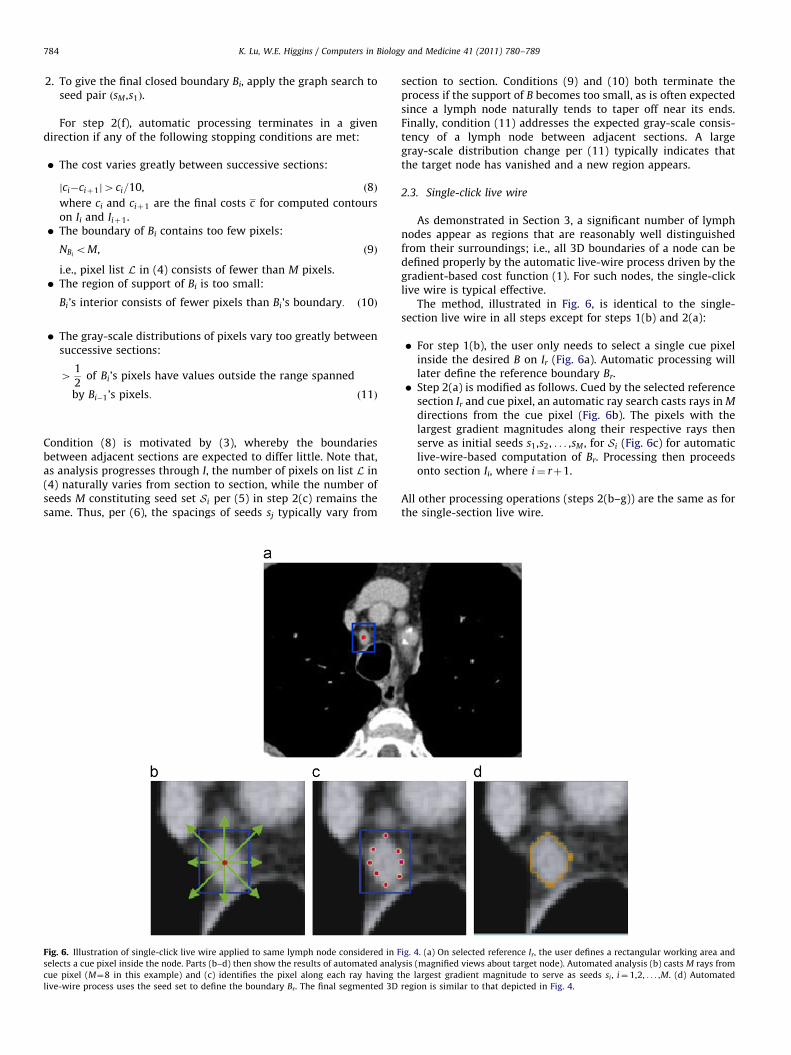
Fig. 4. Use of the single-section live wire to define a station 4 (lower paratracheal) lymp
in this case by our LNSM system [20,22]; target node indicated. (b) Reference bounda
computed working area for next section Irþ1, defined by finding the minimum bounding
(dotted box). (d) Stopping condition (11) occurs, whereby the pixels in the expected
previous section. (e) Final 3D surface-rendered version of node B. (For interpretation of t
of this article.)
boundary on Ir, using the standard 2D live wire. Next, initializedby the results for Ir, automatic analysis completes the 3Dsegmentation of lymph node B for the remaining 2D sections ofI. Per Fig. 3 and the example of Fig. 4, the complete method is thefollowing:
1.
h no
ry B
rec
nod
he r
User interaction:(a) The user interactively scrolls through 2D sections of I in
the vicinity of lymph node B and selects a section Ir
approximately central to B’s volume.(b) The user draws a rectangular working area, which loosely
bounds B, and then runs the interactive 2D live-wire processon Ir to define 2D reference boundary Br (Fig. 4a and b).
de B
r de
tang
al re
efere
2.
Automatic analysis:(a) Begin processing sections Ii, i4r, by letting i¼ rþ1.(b) Project the reference boundary Br onto Ii. Create the list
L¼ fp1,p2, . . . ,pNBrg, ð4Þ
consisting of the pixels pjABr ordered sequentially, whereNBr
denotes the number of pixels constituting Br.(c) Initialize the intermediate boundary cost c for Bi to a large
value, where Bi denotes B’s 2D boundary on Ii. Also, inpreparation for the automatic live-wire process of step (d),form an initial seed set Si for Bi by selecting M evenlyspaced pixels pjAL to serve as the seeds, i.e.,
Si ¼ fs1,s2, . . . ,sMg, ð5Þ
where each seed sj is given by
sj ¼ pl where l¼ intðj�1Þ � NBr
M
� �þ1, j¼ 1, . . . ,M, ð6Þ
intð�Þ returns the integer part of its argument, and MrNBr.
In addition, compute a working area by determining theminimum bounding rectangle about Br and expanding thisrectangle by W pixels in all directions (Fig. 4c).
. (a) Reference section Ir and working area (red box), defined automatically
fined by the user with the standard 2D live wire on Ir. (c) Automatically
le (MBR) about Br and expanding this box by W¼15 pixels in all directions
gion differ greatly in gray scale than the pixels found for node B on the
nces to color in this figure legend, the reader is referred to the web version
Figind
sur
live
the
the
K. Lu, W.E. Higgins / Computers in Biology and Medicine 41 (2011) 780–789 783
(d) Using Si and the working area (e.g., Fig. 4b), apply the 2D livewire automatically to sequentially connect seeds in Si usingthe same order (clockwise or counter-clockwise) as for Br.This gives candidate boundary Bi with cost ci per (1) and (2).
(e) If
jc�cijrc=100 ð7Þ
(i.e., the cost has converged), stop the process. Otherwise,replace seeds in Si with pixels ABi that are midwaybetween each successive pair of seeds ðsj,sjþ1Þ in Si, letc ¼ ci, and repeat steps (d) and (e).
(f) Unless a stopping condition is met (e.g., Fig. 4d), proceedto the next section by letting i¼ iþ1, Br ¼ Bi, and returningto step (b).
(g) Perform automatic analysis similar to steps (a)–(f) for 2Dsections Ii, ior, but proceed in the opposite direction;i.e., let i¼ r�1, etc.
. 5. E
icate
face r
-wire
3D s
refer
The final output B consists of all computed 2D contours Bi.
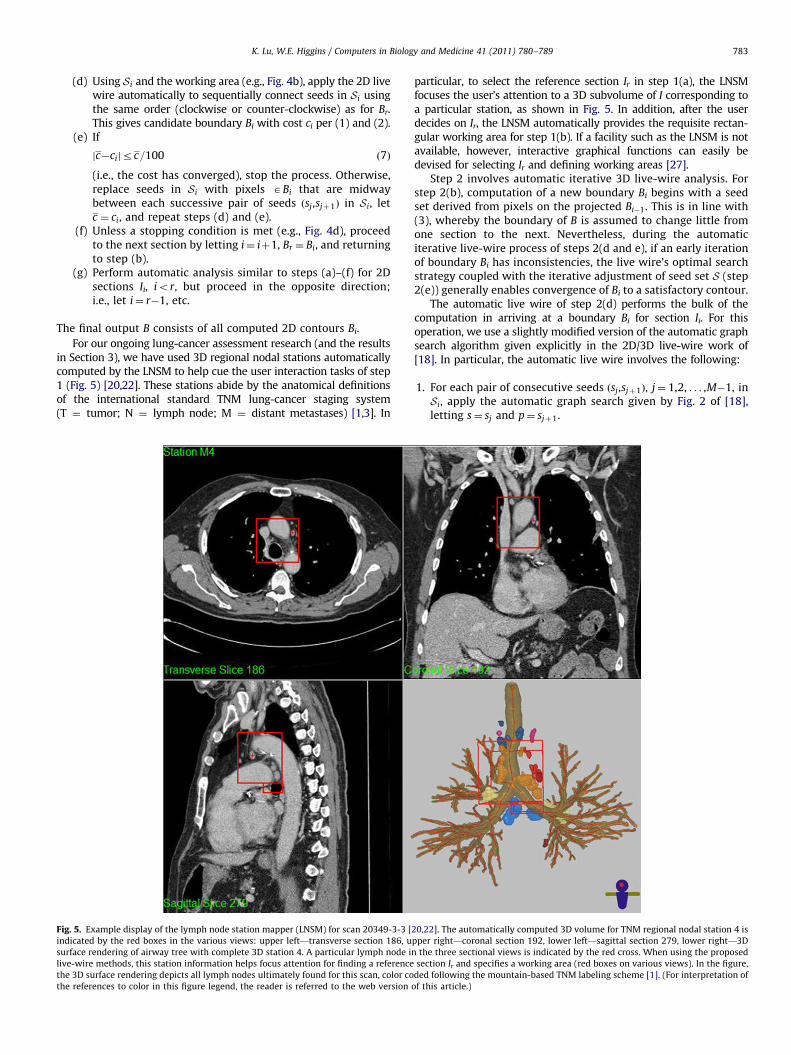
For our ongoing lung-cancer assessment research (and the resultsin Section 3), we have used 3D regional nodal stations automaticallycomputed by the LNSM to help cue the user interaction tasks of step1 (Fig. 5) [20,22]. These stations abide by the anatomical definitionsof the international standard TNM lung-cancer staging system(T ¼ tumor; N ¼ lymph node; M ¼ distant metastases) [1,3]. In
xample display of the lymph node station mapper (LNSM) for scan 20349-3-3 [
d by the red boxes in the various views: upper left—transverse section 186, u
endering of airway tree with complete 3D station 4. A particular lymph node i
methods, this station information helps focus attention for finding a reference
urface rendering depicts all lymph nodes ultimately found for this scan, color co
ences to color in this figure legend, the reader is referred to the web version
particular, to select the reference section Ir in step 1(a), the LNSMfocuses the user’s attention to a 3D subvolume of I corresponding toa particular station, as shown in Fig. 5. In addition, after the userdecides on Ir, the LNSM automatically provides the requisite rectan-gular working area for step 1(b). If a facility such as the LNSM is notavailable, however, interactive graphical functions can easily bedevised for selecting Ir and defining working areas [27].
Step 2 involves automatic iterative 3D live-wire analysis. Forstep 2(b), computation of a new boundary Bi begins with a seedset derived from pixels on the projected Bi�1. This is in line with(3), whereby the boundary of B is assumed to change little fromone section to the next. Nevertheless, during the automaticiterative live-wire process of steps 2(d and e), if an early iterationof boundary Bi has inconsistencies, the live wire’s optimal searchstrategy coupled with the iterative adjustment of seed set S (step2(e)) generally enables convergence of Bi to a satisfactory contour.
The automatic live wire of step 2(d) performs the bulk of thecomputation in arriving at a boundary Bi for section Ii. For thisoperation, we use a slightly modified version of the automatic graphsearch algorithm given explicitly in the 2D/3D live-wire work of[18]. In particular, the automatic live wire involves the following:
1.
20,2
ppe
n th
sec
ded
of th
For each pair of consecutive seeds ðsj,sjþ1Þ, j¼ 1,2, . . . ,M�1, inSi, apply the automatic graph search given by Fig. 2 of [18],letting s¼ sj and p¼ sjþ1.
2]. The automatically computed 3D volume for TNM regional nodal station 4 is
r right—coronal section 192, lower left—sagittal section 279, lower right—3D
e three sectional views is indicated by the red cross. When using the proposed
tion Ir and specifies a working area (red boxes on various views). In the figure,
following the mountain-based TNM labeling scheme [1]. (For interpretation of
is article.)
K. Lu, W.E. Higgins / Computers in Biology and Medicine 41 (2011) 780–789784
2.
To give the final closed boundary Bi, apply the graph search toseed pair ðsM ,s1Þ.For step 2(f), automatic processing terminates in a givendirection if any of the following stopping conditions are met:
�
Figsele
cue
live
The cost varies greatly between successive sections:
jci�ciþ1j4ci=10, ð8Þ
where ci and ciþ1 are the final costs c for computed contourson Ii and Iiþ1.
� The boundary of Bi contains too few pixels:NBioM, ð9Þ
i.e., pixel list L in (4) consists of fewer than M pixels.
� The region of support of Bi is too small:Bi’s interior consists of fewer pixels than Bi’s boundary: ð10Þ
�
The gray-scale distributions of pixels vary too greatly betweensuccessive sections:41
2of Bi’s pixels have values outside the range spanned
by Bi�1’s pixels: ð11Þ
Condition (8) is motivated by (3), whereby the boundariesbetween adjacent sections are expected to differ little. Note that,as analysis progresses through I, the number of pixels on list L in(4) naturally varies from section to section, while the number ofseeds M constituting seed set Si per (5) in step 2(c) remains thesame. Thus, per (6), the spacings of seeds sj typically vary from
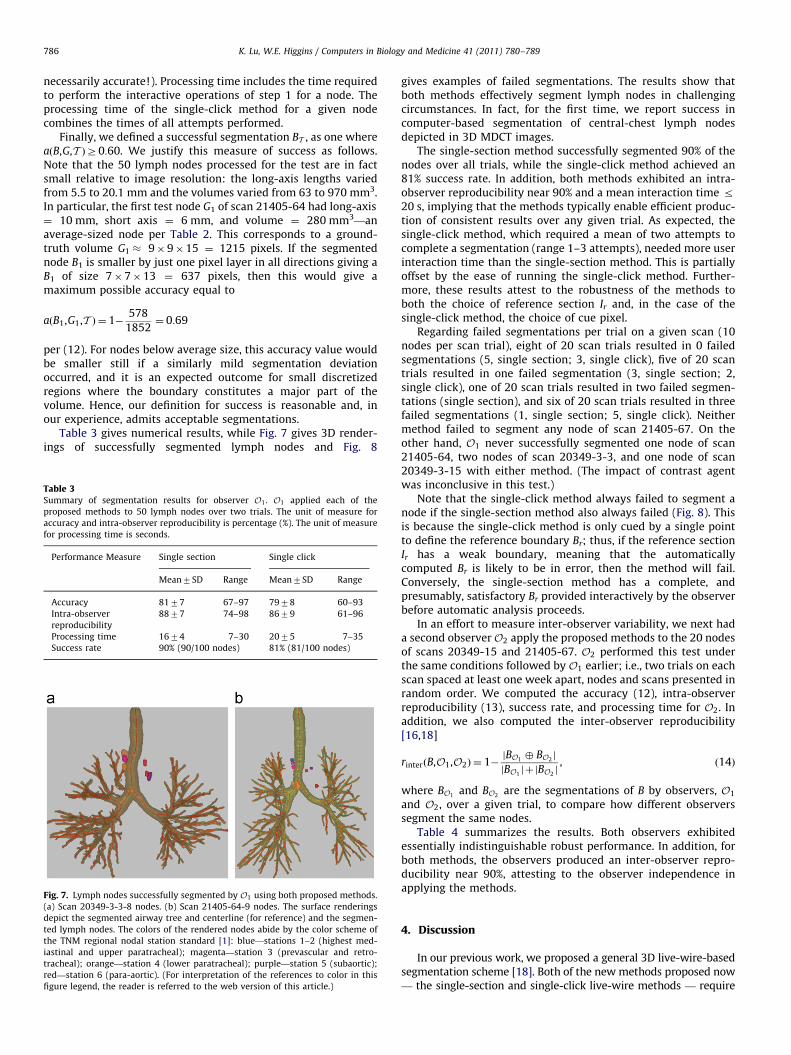
. 6. Illustration of single-click live wire applied to same lymph node considered in F
cts a cue pixel inside the node. Parts (b–d) then show the results of automated analy
pixel (M¼8 in this example) and (c) identifies the pixel along each ray having t
-wire process uses the seed set to define the boundary Br. The final segmented 3D
section to section. Conditions (9) and (10) both terminate theprocess if the support of B becomes too small, as is often expectedsince a lymph node naturally tends to taper off near its ends.Finally, condition (11) addresses the expected gray-scale consis-tency of a lymph node between adjacent sections. A largegray-scale distribution change per (11) typically indicates thatthe target node has vanished and a new region appears.
2.3. Single-click live wire
As demonstrated in Section 3, a significant number of lymphnodes appear as regions that are reasonably well distinguishedfrom their surroundings; i.e., all 3D boundaries of a node can bedefined properly by the automatic live-wire process driven by thegradient-based cost function (1). For such nodes, the single-clicklive wire is typical effective.
The method, illustrated in Fig. 6, is identical to the single-section live wire in all steps except for steps 1(b) and 2(a):
�
ig.
sis
he
reg
For step 1(b), the user only needs to select a single cue pixelinside the desired B on Ir (Fig. 6a). Automatic processing willlater define the reference boundary Br.
� Step 2(a) is modified as follows. Cued by the selected referencesection Ir and cue pixel, an automatic ray search casts rays in M
directions from the cue pixel (Fig. 6b). The pixels with thelargest gradient magnitudes along their respective rays thenserve as initial seeds s1,s2, . . . ,sM , for Si (Fig. 6c) for automaticlive-wire-based computation of Br. Processing then proceedsonto section Ii, where i¼ rþ1.
All other processing operations (steps 2(b–g)) are the same as forthe single-section live wire.
4. (a) On selected reference Ir, the user defines a rectangular working area and
(magnified views about target node). Automated analysis (b) casts M rays from
largest gradient magnitude to serve as seeds si , i¼ 1,2, . . . ,M. (d) Automated
ion is similar to that depicted in Fig. 4.
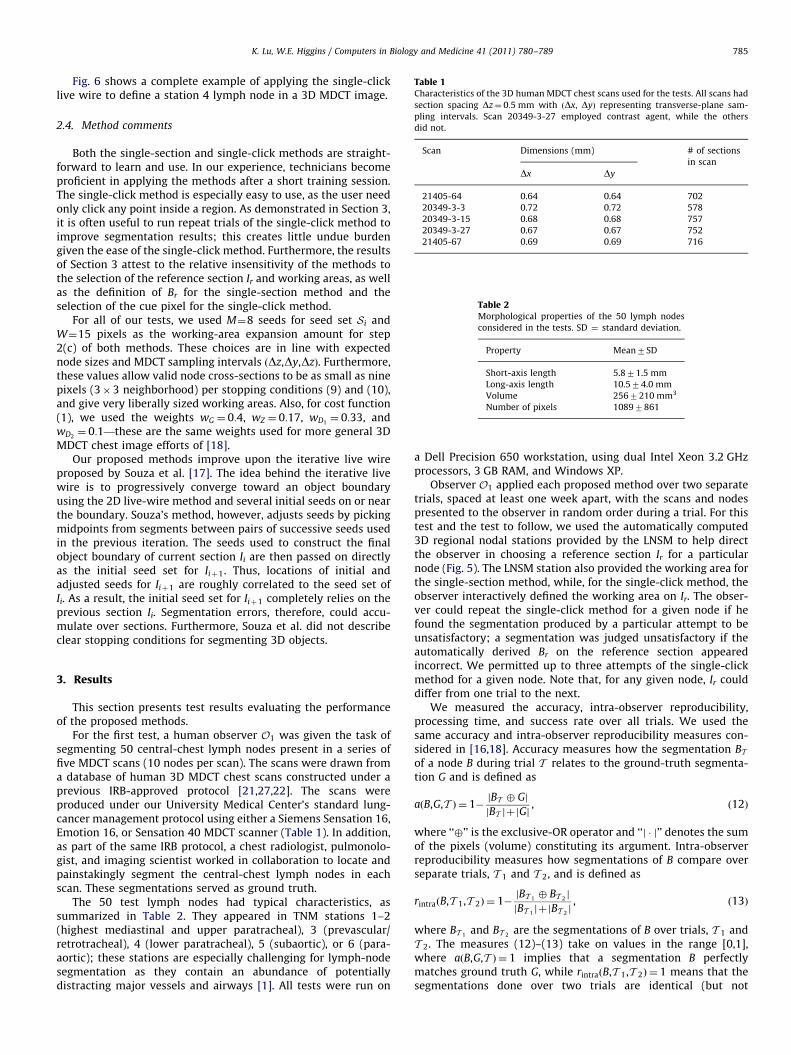
Table 1Characteristics of the 3D human MDCT chest scans used for the tests. All scans had
section spacing Dz¼ 0:5 mm with ðDx, DyÞ representing transverse-plane sam-
pling intervals. Scan 20349-3-27 employed contrast agent, while the others
did not.
Scan Dimensions (mm) # of sections
in scan
Dx Dy
21405-64 0.64 0.64 702
20349-3-3 0.72 0.72 578
20349-3-15 0.68 0.68 757
20349-3-27 0.67 0.67 752
21405-67 0.69 0.69 716
Table 2Morphological properties of the 50 lymph nodes
considered in the tests. SD ¼ standard deviation.
Property Mean7SD
Short-axis length 5.871.5 mm
Long-axis length 10.574.0 mm
Volume 2567210 mm3
Number of pixels 10897861
K. Lu, W.E. Higgins / Computers in Biology and Medicine 41 (2011) 780–789 785
Fig. 6 shows a complete example of applying the single-clicklive wire to define a station 4 lymph node in a 3D MDCT image.
2.4. Method comments
Both the single-section and single-click methods are straight-forward to learn and use. In our experience, technicians becomeproficient in applying the methods after a short training session.The single-click method is especially easy to use, as the user needonly click any point inside a region. As demonstrated in Section 3,it is often useful to run repeat trials of the single-click method toimprove segmentation results; this creates little undue burdengiven the ease of the single-click method. Furthermore, the resultsof Section 3 attest to the relative insensitivity of the methods tothe selection of the reference section Ir and working areas, as wellas the definition of Br for the single-section method and theselection of the cue pixel for the single-click method.
For all of our tests, we used M¼8 seeds for seed set Si andW¼15 pixels as the working-area expansion amount for step2(c) of both methods. These choices are in line with expectednode sizes and MDCT sampling intervals ðDz,Dy,DzÞ. Furthermore,these values allow valid node cross-sections to be as small as ninepixels (3�3 neighborhood) per stopping conditions (9) and (10),and give very liberally sized working areas. Also, for cost function(1), we used the weights wG ¼ 0:4, wZ ¼ 0:17, wD1
¼ 0:33, andwD2¼ 0:1—these are the same weights used for more general 3D
MDCT chest image efforts of [18].Our proposed methods improve upon the iterative live wire
proposed by Souza et al. [17]. The idea behind the iterative livewire is to progressively converge toward an object boundaryusing the 2D live-wire method and several initial seeds on or nearthe boundary. Souza’s method, however, adjusts seeds by pickingmidpoints from segments between pairs of successive seeds usedin the previous iteration. The seeds used to construct the finalobject boundary of current section Ii are then passed on directlyas the initial seed set for Iiþ1. Thus, locations of initial andadjusted seeds for Iiþ1 are roughly correlated to the seed set ofIi. As a result, the initial seed set for Iiþ1 completely relies on theprevious section Ii. Segmentation errors, therefore, could accu-mulate over sections. Furthermore, Souza et al. did not describeclear stopping conditions for segmenting 3D objects.
3. Results
This section presents test results evaluating the performanceof the proposed methods.
For the first test, a human observer O1 was given the task ofsegmenting 50 central-chest lymph nodes present in a series offive MDCT scans (10 nodes per scan). The scans were drawn froma database of human 3D MDCT chest scans constructed under aprevious IRB-approved protocol [21,27,22]. The scans wereproduced under our University Medical Center’s standard lung-cancer management protocol using either a Siemens Sensation 16,Emotion 16, or Sensation 40 MDCT scanner (Table 1). In addition,as part of the same IRB protocol, a chest radiologist, pulmonolo-gist, and imaging scientist worked in collaboration to locate andpainstakingly segment the central-chest lymph nodes in eachscan. These segmentations served as ground truth.
The 50 test lymph nodes had typical characteristics, assummarized in Table 2. They appeared in TNM stations 1–2(highest mediastinal and upper paratracheal), 3 (prevascular/retrotracheal), 4 (lower paratracheal), 5 (subaortic), or 6 (para-aortic); these stations are especially challenging for lymph-nodesegmentation as they contain an abundance of potentiallydistracting major vessels and airways [1]. All tests were run on
a Dell Precision 650 workstation, using dual Intel Xeon 3.2 GHzprocessors, 3 GB RAM, and Windows XP.
Observer O1 applied each proposed method over two separatetrials, spaced at least one week apart, with the scans and nodespresented to the observer in random order during a trial. For thistest and the test to follow, we used the automatically computed3D regional nodal stations provided by the LNSM to help directthe observer in choosing a reference section Ir for a particularnode (Fig. 5). The LNSM station also provided the working area forthe single-section method, while, for the single-click method, theobserver interactively defined the working area on Ir. The obser-ver could repeat the single-click method for a given node if hefound the segmentation produced by a particular attempt to beunsatisfactory; a segmentation was judged unsatisfactory if theautomatically derived Br on the reference section appearedincorrect. We permitted up to three attempts of the single-clickmethod for a given node. Note that, for any given node, Ir coulddiffer from one trial to the next.
We measured the accuracy, intra-observer reproducibility,processing time, and success rate over all trials. We used thesame accuracy and intra-observer reproducibility measures con-sidered in [16,18]. Accuracy measures how the segmentation BTof a node B during trial T relates to the ground-truth segmenta-tion G and is defined as
aðB,G,T Þ ¼ 1�jBT � Gj
jBT jþjGj, ð12Þ
where ‘‘�’’ is the exclusive-OR operator and ‘‘j � j’’ denotes the sumof the pixels (volume) constituting its argument. Intra-observerreproducibility measures how segmentations of B compare overseparate trials, T 1 and T 2, and is defined as
rintraðB,T 1,T 2Þ ¼ 1�jBT 1� BT 2
j
jBT 1jþjBT 2
j, ð13Þ
where BT 1and BT 2
are the segmentations of B over trials, T 1 andT 2. The measures (12)–(13) take on values in the range [0,1],where aðB,G,T Þ ¼ 1 implies that a segmentation B perfectlymatches ground truth G, while rintraðB,T 1,T 2Þ ¼ 1 means that thesegmentations done over two trials are identical (but not
K. Lu, W.E. Higgins / Computers in Biology and Medicine 41 (2011) 780–789786
necessarily accurate!). Processing time includes the time requiredto perform the interactive operations of step 1 for a node. Theprocessing time of the single-click method for a given nodecombines the times of all attempts performed.
Finally, we defined a successful segmentation BT , as one whereaðB,G,T ÞZ0:60. We justify this measure of success as follows.Note that the 50 lymph nodes processed for the test are in factsmall relative to image resolution: the long-axis lengths variedfrom 5.5 to 20.1 mm and the volumes varied from 63 to 970 mm3.In particular, the first test node G1 of scan 21405-64 had long-axis¼ 10 mm, short axis ¼ 6 mm, and volume ¼ 280 mm3—anaverage-sized node per Table 2. This corresponds to a ground-truth volume G1 � 9�9�15 ¼ 1215 pixels. If the segmentednode B1 is smaller by just one pixel layer in all directions giving aB1 of size 7�7�13 ¼ 637 pixels, then this would give amaximum possible accuracy equal to
aðB1,G1,T Þ ¼ 1�578
1852¼ 0:69
per (12). For nodes below average size, this accuracy value wouldbe smaller still if a similarly mild segmentation deviationoccurred, and it is an expected outcome for small discretizedregions where the boundary constitutes a major part of thevolume. Hence, our definition for success is reasonable and, inour experience, admits acceptable segmentations.
Table 3 gives numerical results, while Fig. 7 gives 3D render-ings of successfully segmented lymph nodes and Fig. 8
Table 3Summary of segmentation results for observer O1. O1 applied each of the
proposed methods to 50 lymph nodes over two trials. The unit of measure for
accuracy and intra-observer reproducibility is percentage (%). The unit of measure
for processing time is seconds.
Performance Measure Single section Single click
Mean7SD Range Mean7SD Range
Accuracy 8177 67–97 7978 60–93
Intra-observer
reproducibility
8877 74–98 8679 61–96
Processing time 1674 7–30 2075 7–35
Success rate 90% (90/100 nodes) 81% (81/100 nodes)
Fig. 7. Lymph nodes successfully segmented by O1 using both proposed methods.
(a) Scan 20349-3-3-8 nodes. (b) Scan 21405-64-9 nodes. The surface renderings
depict the segmented airway tree and centerline (for reference) and the segmen-
ted lymph nodes. The colors of the rendered nodes abide by the color scheme of
the TNM regional nodal station standard [1]: blue—stations 1–2 (highest med-
iastinal and upper paratracheal); magenta—station 3 (prevascular and retro-
tracheal); orange—station 4 (lower paratracheal); purple—station 5 (subaortic);
red—station 6 (para-aortic). (For interpretation of the references to color in this
figure legend, the reader is referred to the web version of this article.)
gives examples of failed segmentations. The results show thatboth methods effectively segment lymph nodes in challengingcircumstances. In fact, for the first time, we report success incomputer-based segmentation of central-chest lymph nodesdepicted in 3D MDCT images.
The single-section method successfully segmented 90% of thenodes over all trials, while the single-click method achieved an81% success rate. In addition, both methods exhibited an intra-observer reproducibility near 90% and a mean interaction time r20 s, implying that the methods typically enable efficient produc-tion of consistent results over any given trial. As expected, thesingle-click method, which required a mean of two attempts tocomplete a segmentation (range 1–3 attempts), needed more userinteraction time than the single-section method. This is partiallyoffset by the ease of running the single-click method. Further-more, these results attest to the robustness of the methods toboth the choice of reference section Ir and, in the case of thesingle-click method, the choice of cue pixel.
Regarding failed segmentations per trial on a given scan (10nodes per scan trial), eight of 20 scan trials resulted in 0 failedsegmentations (5, single section; 3, single click), five of 20 scantrials resulted in one failed segmentation (3, single section; 2,single click), one of 20 scan trials resulted in two failed segmen-tations (single section), and six of 20 scan trials resulted in threefailed segmentations (1, single section; 5, single click). Neithermethod failed to segment any node of scan 21405-67. On theother hand, O1 never successfully segmented one node of scan21405-64, two nodes of scan 20349-3-3, and one node of scan20349-3-15 with either method. (The impact of contrast agentwas inconclusive in this test.)
Note that the single-click method always failed to segment anode if the single-section method also always failed (Fig. 8). Thisis because the single-click method is only cued by a single pointto define the reference boundary Br; thus, if the reference sectionIr has a weak boundary, meaning that the automaticallycomputed Br is likely to be in error, then the method will fail.Conversely, the single-section method has a complete, andpresumably, satisfactory Br provided interactively by the observerbefore automatic analysis proceeds.
In an effort to measure inter-observer variability, we next hada second observerO2 apply the proposed methods to the 20 nodesof scans 20349-15 and 21405-67. O2 performed this test underthe same conditions followed by O1 earlier; i.e., two trials on eachscan spaced at least one week apart, nodes and scans presented inrandom order. We computed the accuracy (12), intra-observerreproducibility (13), success rate, and processing time for O2. Inaddition, we also computed the inter-observer reproducibility[16,18]
rinterðB,O1,O2Þ ¼ 1�jBO1� BO2
j
jBO1jþjBO2
j, ð14Þ
where BO1and BO2
are the segmentations of B by observers, O1
and O2, over a given trial, to compare how different observerssegment the same nodes.
Table 4 summarizes the results. Both observers exhibitedessentially indistinguishable robust performance. In addition, forboth methods, the observers produced an inter-observer repro-ducibility near 90%, attesting to the observer independence inapplying the methods.
4. Discussion
In our previous work, we proposed a general 3D live-wire-basedsegmentation scheme [18]. Both of the new methods proposed now— the single-section and single-click live-wire methods — require
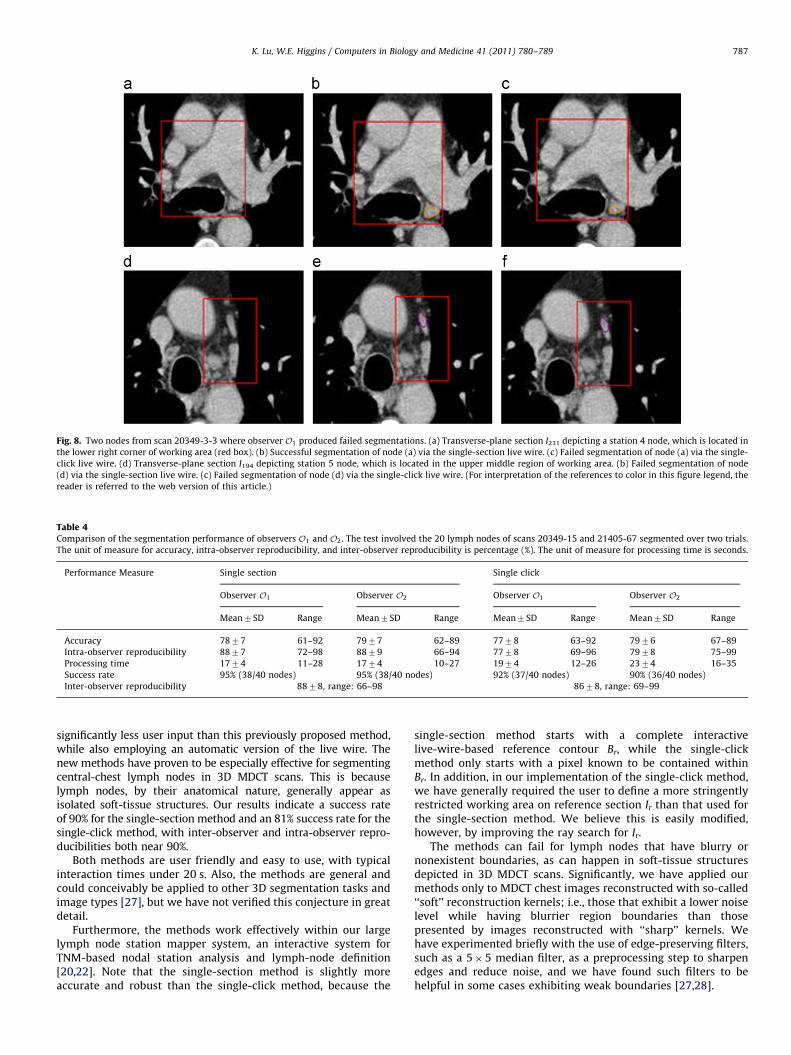
Table 4Comparison of the segmentation performance of observers O1 and O2. The test involved the 20 lymph nodes of scans 20349-15 and 21405-67 segmented over two trials.
The unit of measure for accuracy, intra-observer reproducibility, and inter-observer reproducibility is percentage (%). The unit of measure for processing time is seconds.
Performance Measure Single section Single click
Observer O1 Observer O2 Observer O1 Observer O2
Mean7SD Range Mean7SD Range Mean7SD Range Mean7SD Range
Accuracy 7877 61–92 7977 62–89 7778 63–92 7976 67–89
Intra-observer reproducibility 8877 72–98 8879 66–94 7778 69–96 7978 75–99
Processing time 1774 11–28 1774 10–27 1974 12–26 2374 16–35
Success rate 95% (38/40 nodes) 95% (38/40 nodes) 92% (37/40 nodes) 90% (36/40 nodes)
Inter-observer reproducibility 8878, range: 66–98 8678, range: 69–99
Fig. 8. Two nodes from scan 20349-3-3 where observer O1 produced failed segmentations. (a) Transverse-plane section I231 depicting a station 4 node, which is located in
the lower right corner of working area (red box). (b) Successful segmentation of node (a) via the single-section live wire. (c) Failed segmentation of node (a) via the single-
click live wire. (d) Transverse-plane section I194 depicting station 5 node, which is located in the upper middle region of working area. (b) Failed segmentation of node
(d) via the single-section live wire. (c) Failed segmentation of node (d) via the single-click live wire. (For interpretation of the references to color in this figure legend, the
reader is referred to the web version of this article.)
K. Lu, W.E. Higgins / Computers in Biology and Medicine 41 (2011) 780–789 787
significantly less user input than this previously proposed method,while also employing an automatic version of the live wire. Thenew methods have proven to be especially effective for segmentingcentral-chest lymph nodes in 3D MDCT scans. This is becauselymph nodes, by their anatomical nature, generally appear asisolated soft-tissue structures. Our results indicate a success rateof 90% for the single-section method and an 81% success rate for thesingle-click method, with inter-observer and intra-observer repro-ducibilities both near 90%.
Both methods are user friendly and easy to use, with typicalinteraction times under 20 s. Also, the methods are general andcould conceivably be applied to other 3D segmentation tasks andimage types [27], but we have not verified this conjecture in greatdetail.
Furthermore, the methods work effectively within our largelymph node station mapper system, an interactive system forTNM-based nodal station analysis and lymph-node definition[20,22]. Note that the single-section method is slightly moreaccurate and robust than the single-click method, because the
single-section method starts with a complete interactivelive-wire-based reference contour Br, while the single-clickmethod only starts with a pixel known to be contained withinBr. In addition, in our implementation of the single-click method,we have generally required the user to define a more stringentlyrestricted working area on reference section Ir than that used forthe single-section method. We believe this is easily modified,however, by improving the ray search for Ir.
The methods can fail for lymph nodes that have blurry ornonexistent boundaries, as can happen in soft-tissue structuresdepicted in 3D MDCT scans. Significantly, we have applied ourmethods only to MDCT chest images reconstructed with so-called‘‘soft’’ reconstruction kernels; i.e., those that exhibit a lower noiselevel while having blurrier region boundaries than thosepresented by images reconstructed with ‘‘sharp’’ kernels. Wehave experimented briefly with the use of edge-preserving filters,such as a 5�5 median filter, as a preprocessing step to sharpenedges and reduce noise, and we have found such filters to behelpful in some cases exhibiting weak boundaries [27,28].
K. Lu, W.E. Higgins / Computers in Biology and Medicine 41 (2011) 780–789788
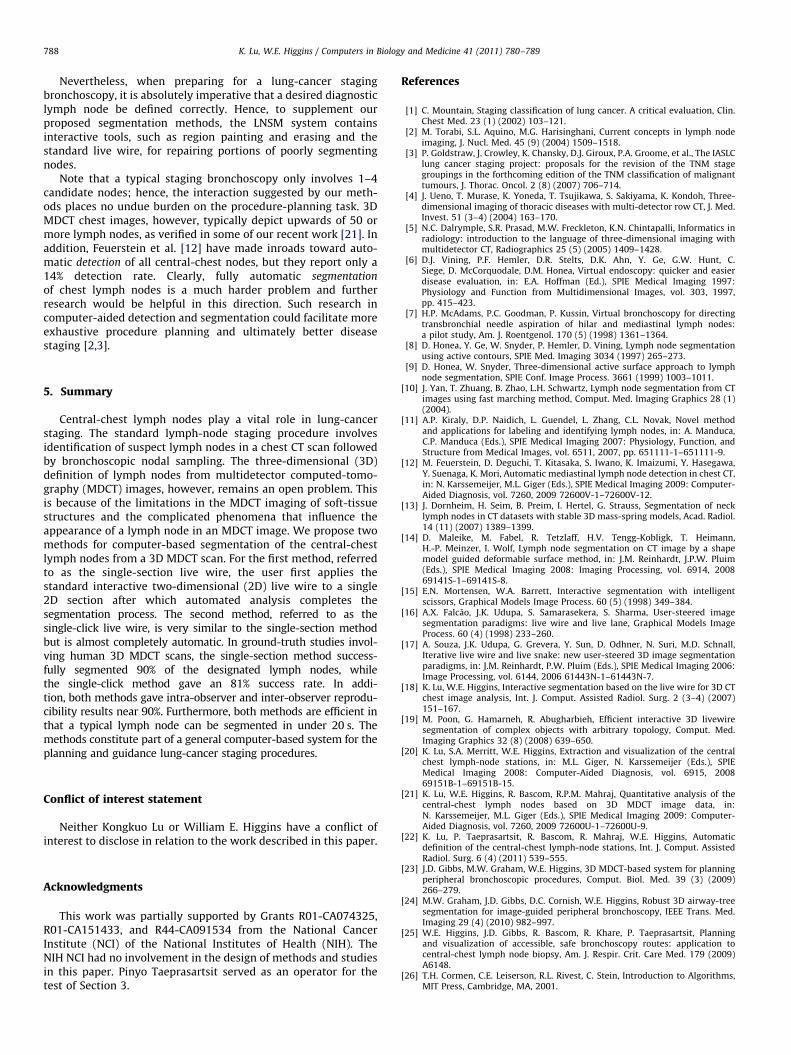
Nevertheless, when preparing for a lung-cancer stagingbronchoscopy, it is absolutely imperative that a desired diagnosticlymph node be defined correctly. Hence, to supplement ourproposed segmentation methods, the LNSM system containsinteractive tools, such as region painting and erasing and thestandard live wire, for repairing portions of poorly segmentingnodes.
Note that a typical staging bronchoscopy only involves 1–4candidate nodes; hence, the interaction suggested by our meth-ods places no undue burden on the procedure-planning task. 3DMDCT chest images, however, typically depict upwards of 50 ormore lymph nodes, as verified in some of our recent work [21]. Inaddition, Feuerstein et al. [12] have made inroads toward auto-matic detection of all central-chest nodes, but they report only a14% detection rate. Clearly, fully automatic segmentation
of chest lymph nodes is a much harder problem and furtherresearch would be helpful in this direction. Such research incomputer-aided detection and segmentation could facilitate moreexhaustive procedure planning and ultimately better diseasestaging [2,3].
5. Summary
Central-chest lymph nodes play a vital role in lung-cancerstaging. The standard lymph-node staging procedure involvesidentification of suspect lymph nodes in a chest CT scan followedby bronchoscopic nodal sampling. The three-dimensional (3D)definition of lymph nodes from multidetector computed-tomo-graphy (MDCT) images, however, remains an open problem. Thisis because of the limitations in the MDCT imaging of soft-tissuestructures and the complicated phenomena that influence theappearance of a lymph node in an MDCT image. We propose twomethods for computer-based segmentation of the central-chestlymph nodes from a 3D MDCT scan. For the first method, referredto as the single-section live wire, the user first applies thestandard interactive two-dimensional (2D) live wire to a single2D section after which automated analysis completes thesegmentation process. The second method, referred to as thesingle-click live wire, is very similar to the single-section methodbut is almost completely automatic. In ground-truth studies invol-ving human 3D MDCT scans, the single-section method success-fully segmented 90% of the designated lymph nodes, whilethe single-click method gave an 81% success rate. In addi-tion, both methods gave intra-observer and inter-observer reprodu-cibility results near 90%. Furthermore, both methods are efficient inthat a typical lymph node can be segmented in under 20 s. Themethods constitute part of a general computer-based system for theplanning and guidance lung-cancer staging procedures.
Conflict of interest statement
Neither Kongkuo Lu or William E. Higgins have a conflict ofinterest to disclose in relation to the work described in this paper.
Acknowledgments
This work was partially supported by Grants R01-CA074325,R01-CA151433, and R44-CA091534 from the National CancerInstitute (NCI) of the National Institutes of Health (NIH). TheNIH NCI had no involvement in the design of methods and studiesin this paper. Pinyo Taeprasartsit served as an operator for thetest of Section 3.
References
[1] C. Mountain, Staging classification of lung cancer. A critical evaluation, Clin.Chest Med. 23 (1) (2002) 103–121.
[2] M. Torabi, S.L. Aquino, M.G. Harisinghani, Current concepts in lymph nodeimaging, J. Nucl. Med. 45 (9) (2004) 1509–1518.
[3] P. Goldstraw, J. Crowley, K. Chansky, D.J. Giroux, P.A. Groome, et al., The IASLClung cancer staging project: proposals for the revision of the TNM stagegroupings in the forthcoming edition of the TNM classification of malignanttumours, J. Thorac. Oncol. 2 (8) (2007) 706–714.
[4] J. Ueno, T. Murase, K. Yoneda, T. Tsujikawa, S. Sakiyama, K. Kondoh, Three-dimensional imaging of thoracic diseases with multi-detector row CT, J. Med.Invest. 51 (3–4) (2004) 163–170.
[5] N.C. Dalrymple, S.R. Prasad, M.W. Freckleton, K.N. Chintapalli, Informatics inradiology: introduction to the language of three-dimensional imaging withmultidetector CT, Radiographics 25 (5) (2005) 1409–1428.
[6] D.J. Vining, P.F. Hemler, D.R. Stelts, D.K. Ahn, Y. Ge, G.W. Hunt, C.Siege, D. McCorquodale, D.M. Honea, Virtual endoscopy: quicker and easierdisease evaluation, in: E.A. Hoffman (Ed.), SPIE Medical Imaging 1997:Physiology and Function from Multidimensional Images, vol. 303, 1997,pp. 415–423.
[7] H.P. McAdams, P.C. Goodman, P. Kussin, Virtual bronchoscopy for directingtransbronchial needle aspiration of hilar and mediastinal lymph nodes:a pilot study, Am. J. Roentgenol. 170 (5) (1998) 1361–1364.
[8] D. Honea, Y. Ge, W. Snyder, P. Hemler, D. Vining, Lymph node segmentationusing active contours, SPIE Med. Imaging 3034 (1997) 265–273.
[9] D. Honea, W. Snyder, Three-dimensional active surface approach to lymphnode segmentation, SPIE Conf. Image Process. 3661 (1999) 1003–1011.
[10] J. Yan, T. Zhuang, B. Zhao, L.H. Schwartz, Lymph node segmentation from CTimages using fast marching method, Comput. Med. Imaging Graphics 28 (1)(2004).
[11] A.P. Kiraly, D.P. Naidich, L. Guendel, L. Zhang, C.L. Novak, Novel methodand applications for labeling and identifying lymph nodes, in: A. Manduca,C.P. Manduca (Eds.), SPIE Medical Imaging 2007: Physiology, Function, andStructure from Medical Images, vol. 6511, 2007, pp. 651111-1–651111-9.
[12] M. Feuerstein, D. Deguchi, T. Kitasaka, S. Iwano, K. Imaizumi, Y. Hasegawa,Y. Suenaga, K. Mori, Automatic mediastinal lymph node detection in chest CT,in: N. Karssemeijer, M.L. Giger (Eds.), SPIE Medical Imaging 2009: Computer-Aided Diagnosis, vol. 7260, 2009 72600V-1–72600V-12.
[13] J. Dornheim, H. Seim, B. Preim, I. Hertel, G. Strauss, Segmentation of necklymph nodes in CT datasets with stable 3D mass-spring models, Acad. Radiol.14 (11) (2007) 1389–1399.
[14] D. Maleike, M. Fabel, R. Tetzlaff, H.V. Tengg-Kobligk, T. Heimann,H.-P. Meinzer, I. Wolf, Lymph node segmentation on CT image by a shapemodel guided deformable surface method, in: J.M. Reinhardt, J.P.W. Pluim(Eds.), SPIE Medical Imaging 2008: Imaging Processing, vol. 6914, 200869141S-1–69141S-8.
[15] E.N. Mortensen, W.A. Barrett, Interactive segmentation with intelligentscissors, Graphical Models Image Process. 60 (5) (1998) 349–384.
[16] A.X. Falc~ao, J.K. Udupa, S. Samarasekera, S. Sharma, User-steered imagesegmentation paradigms: live wire and live lane, Graphical Models ImageProcess. 60 (4) (1998) 233–260.
[17] A. Souza, J.K. Udupa, G. Grevera, Y. Sun, D. Odhner, N. Suri, M.D. Schnall,Iterative live wire and live snake: new user-steered 3D image segmentationparadigms, in: J.M. Reinhardt, P.W. Pluim (Eds.), SPIE Medical Imaging 2006:Image Processing, vol. 6144, 2006 61443N-1–61443N-7.
[18] K. Lu, W.E. Higgins, Interactive segmentation based on the live wire for 3D CTchest image analysis, Int. J. Comput. Assisted Radiol. Surg. 2 (3–4) (2007)151–167.
[19] M. Poon, G. Hamarneh, R. Abugharbieh, Efficient interactive 3D livewiresegmentation of complex objects with arbitrary topology, Comput. Med.Imaging Graphics 32 (8) (2008) 639–650.
[20] K. Lu, S.A. Merritt, W.E. Higgins, Extraction and visualization of the centralchest lymph-node stations, in: M.L. Giger, N. Karssemeijer (Eds.), SPIEMedical Imaging 2008: Computer-Aided Diagnosis, vol. 6915, 200869151B-1–69151B-15.
[21] K. Lu, W.E. Higgins, R. Bascom, R.P.M. Mahraj, Quantitative analysis of thecentral-chest lymph nodes based on 3D MDCT image data, in:N. Karssemeijer, M.L. Giger (Eds.), SPIE Medical Imaging 2009: Computer-Aided Diagnosis, vol. 7260, 2009 72600U-1–72600U-9.
[22] K. Lu, P. Taeprasartsit, R. Bascom, R. Mahraj, W.E. Higgins, Automaticdefinition of the central-chest lymph-node stations, Int. J. Comput. AssistedRadiol. Surg. 6 (4) (2011) 539–555.
[23] J.D. Gibbs, M.W. Graham, W.E. Higgins, 3D MDCT-based system for planningperipheral bronchoscopic procedures, Comput. Biol. Med. 39 (3) (2009)266–279.
[24] M.W. Graham, J.D. Gibbs, D.C. Cornish, W.E. Higgins, Robust 3D airway-treesegmentation for image-guided peripheral bronchoscopy, IEEE Trans. Med.Imaging 29 (4) (2010) 982–997.
[25] W.E. Higgins, J.D. Gibbs, R. Bascom, R. Khare, P. Taeprasartsit, Planningand visualization of accessible, safe bronchoscopy routes: application tocentral-chest lymph node biopsy, Am. J. Respir. Crit. Care Med. 179 (2009)A6148.
[26] T.H. Cormen, C.E. Leiserson, R.L. Rivest, C. Stein, Introduction to Algorithms,MIT Press, Cambridge, MA, 2001.

K. Lu, W.E. Higgins / Computers in Biology and Medicine 41 (2011) 780–789 789
[27] K. Lu, Multidimensional Image Segmentation and Pulmonary Lymph-NodeAnalysis, Ph.D. Thesis, The Pennsylvania State University, Department ofElectrical Engineering, 2010.
[28] K. Lu, W.E. Higgins, Central-chest lymph nodes definition from 3D MDCTimage data, in: N. Karssemeijer, R. Summers (Eds.), SPIE Medical Imaging2010: Computer-Aided Diagnosis, vol. 7624, 2010 76240T-1–76240T-10.
Kongkuo Lu received the B.E. in automatic control and the M.E. in automationfrom Nankai University, Tianjin, China, and the Ph.D. in electrical engineering fromthe Pennsylvania State University. He is currently employed by Philips MedicalSystems, Houston, Texas. His research interests are in computer vision, medicalimaging, computer-aided diagnosis, and visualization.
William E. Higgins received the B.S. degree in electrical engineering from theMassachusetts Institute of Technology, Cambridge, MA, and the M.S. and Ph.D.degrees in electrical engineering from the University of Illinois, Urbana-Cham-paign. He has held positions previously at the Honeywell Systems and ResearchCenter, Minneapolis, MN, and the Mayo Clinic, Rochester, MN. He is currently adistinguished professor of electrical engineering, computer science and engineer-ing, and bioengineering at the Pennsylvania State University. His researchinterests are in multidimensional medical image processing and visualizationand in virtual endoscopy.
Related Documents