1874 IEEE JOURNAL OF BIOMEDICAL AND HEALTH INFORMATICS, VOL. 18, NO. 6, NOVEMBER 2014 Segmentation of the Blood Vessels and Optic Disk in Retinal Images Ana Salazar-Gonzalez, Djibril Kaba, Yongmin Li, and Xiaohui Liu Abstract—Retinal image analysis is increasingly prominent as a nonintrusive diagnosis method in modern ophthalmology. In this paper, we present a novel method to segment blood vessels and optic disk in the fundus retinal images. The method could be used to support nonintrusive diagnosis in modern ophthalmology since the morphology of the blood vessel and the optic disk is an impor- tant indicator for diseases like diabetic retinopathy, glaucoma, and hypertension. Our method takes as first step the extraction of the retina vascular tree using the graph cut technique. The blood vessel information is then used to estimate the location of the optic disk. The optic disk segmentation is performed using two alternative methods. The Markov random field (MRF) image reconstruction method segments the optic disk by removing vessels from the optic disk region, and the compensation factor method segments the op- tic disk using the prior local intensity knowledge of the vessels. The proposed method is tested on three public datasets, DIARETDB1, DRIVE, and STARE. The results and comparison with alternative methods show that our method achieved exceptional performance in segmenting the blood vessel and optic disk. Index Terms—Graph cut segmentation, optic disk segmentation, retinal images, vessel segmentation. I. INTRODUCTION T HE segmentation of retinal image structures has been of great interest because it could be used as a nonintrusive diagnosis in modern ophthalmology. The morphology of the retinal blood vessel and the optic disk is an important struc- tural indicator for assessing the presence and severity of retinal diseases such as diabetic retinopathy, hypertension, glaucoma, hemorrhages, vein occlusion, and neovascularization. However, to assess the diameter and tortuosity of the retinal blood vessel or the shape of the optic disk, manual planimetry has commonly been used by ophthalmologists, which is generally time con- suming and prone to human error, especially when the vessel structures are complicated or a large number of images are ac- quired to be labeled by hand. Therefore, a reliable automated method for retinal blood vessel and optic disk segmentation, Manuscript received August 21, 2013; revised January 16, 2014 and Novem- ber 28, 2013; accepted January 17, 2014. Date of publication January 27, 2014; date of current version November 3, 2014. A. Salazar-Gonzalez was with the Department of Computer Science, Brunel University, Middlesex, UB8 3PH, London, U.K. She is now with Access IS, Reading, RG6 1AZ, U.K. D. Kaba, Y. Li, and X. Liu are with the Department of Computer Science, Brunel University, Middlesex, UB8 3PH, London, U.K. (e-mail: kabadjibril@ gmail.com). Color versions of one or more of the figures in this paper are available online at http://ieeexplore.ieee.org. Digital Object Identifier 10.1109/JBHI.2014.2302749 which preserves various vessel and optic disk characteristics, is attractive in computer-aided diagnosis. An automated segmentation and inspection of retinal blood vessel features such as diameter, color, and tortuosity as well as the optic disk morphology allows ophthalmologists and eye care specialists to perform mass vision screening exams for early detection of retinal diseases and treatment evaluation. This could prevent and reduce vision impairments, age-related diseases, and many cardiovascular diseases, as well as reduce the cost of the screening. Over the past few years, several segmentation techniques have been employed for the segmentation of retinal structures such as blood vessels and optic disks and diseases like lesions in fundus retinal images. However, the acquisition of fundus retinal images under different conditions of illumination, resolution and field of view (FOV), and the overlapping tissue in the retina cause a significant degradation of the performance of automated blood vessels and optic disk segmentations. Thus, there is a need for a reliable technique for retinal vascular tree extraction and optic disk detection, which preserves various vessel and optic disk shapes. In the following segment, we briefly review the previous studies on the blood vessel segmentation and optic disk segmentation separately. II. RELATED WORKS Two different approaches have been deployed to segment the vessels of the retina: the pixel-processing-based methods and tracking-based methods [1]. The pixel-processing-based approach performs the vessel segmentation in a two-pass operation. First, the appearance of the vessel is enhanced using detection processes such as mor- phological preprocessing techniques and adaptive filtering. The second operation is the recognition of the vessel structure using thinning or branch-point operations to classify a pixel as a vessel or background (Bg). These approaches process every pixel in the image and apply multiple operations on each pixel. Some pixel processing methods use neutral networks and frequency analysis to define pixels in the image as vessel pixels and Bg pixels. Typical pixel processing operations are shown by Hoover et al. [2], Mendoca et al. [3], Soares et al. [4], Staal et al. [5], Chaudhuri et al. [6], and Zana et al. [7]. The second set of approaches for vessel segmentation are re- ferred to as vessel tracking, vectorial tracking, or tracing [1]. In contrast to the pixel-processing-based approaches, the tracking methods detect first initial vessel seed points, and then track the rest of the vessel pixels through the image by measuring the continuity proprieties of the blood vessels. This technique is used as a single-pass operation, where the detection of the vessel 1949-3029 © 2014 IEEE. Translations and content mining are permitted for academic research only. Personal use is also permitted, but republication/redistribution requires IEEE permission. See http://www.ieee.org/publications standards/publications/rights/index.html for more information.

Segmentation of the blood vessels and optic disk in retinal images
Aug 15, 2015
Welcome message from author
This document is posted to help you gain knowledge. Please leave a comment to let me know what you think about it! Share it to your friends and learn new things together.
Transcript
1874 IEEE JOURNAL OF BIOMEDICAL AND HEALTH INFORMATICS, VOL. 18, NO. 6, NOVEMBER 2014
Segmentation of the Blood Vessels and Optic Diskin Retinal Images
Ana Salazar-Gonzalez, Djibril Kaba, Yongmin Li, and Xiaohui Liu
Abstract—Retinal image analysis is increasingly prominent as anonintrusive diagnosis method in modern ophthalmology. In thispaper, we present a novel method to segment blood vessels andoptic disk in the fundus retinal images. The method could be usedto support nonintrusive diagnosis in modern ophthalmology sincethe morphology of the blood vessel and the optic disk is an impor-tant indicator for diseases like diabetic retinopathy, glaucoma, andhypertension. Our method takes as first step the extraction of theretina vascular tree using the graph cut technique. The blood vesselinformation is then used to estimate the location of the optic disk.The optic disk segmentation is performed using two alternativemethods. The Markov random field (MRF) image reconstructionmethod segments the optic disk by removing vessels from the opticdisk region, and the compensation factor method segments the op-tic disk using the prior local intensity knowledge of the vessels. Theproposed method is tested on three public datasets, DIARETDB1,DRIVE, and STARE. The results and comparison with alternativemethods show that our method achieved exceptional performancein segmenting the blood vessel and optic disk.
Index Terms—Graph cut segmentation, optic disk segmentation,retinal images, vessel segmentation.
I. INTRODUCTION
THE segmentation of retinal image structures has been ofgreat interest because it could be used as a nonintrusive
diagnosis in modern ophthalmology. The morphology of theretinal blood vessel and the optic disk is an important struc-tural indicator for assessing the presence and severity of retinaldiseases such as diabetic retinopathy, hypertension, glaucoma,hemorrhages, vein occlusion, and neovascularization. However,to assess the diameter and tortuosity of the retinal blood vesselor the shape of the optic disk, manual planimetry has commonlybeen used by ophthalmologists, which is generally time con-suming and prone to human error, especially when the vesselstructures are complicated or a large number of images are ac-quired to be labeled by hand. Therefore, a reliable automatedmethod for retinal blood vessel and optic disk segmentation,
Manuscript received August 21, 2013; revised January 16, 2014 and Novem-ber 28, 2013; accepted January 17, 2014. Date of publication January 27, 2014;date of current version November 3, 2014.
A. Salazar-Gonzalez was with the Department of Computer Science, BrunelUniversity, Middlesex, UB8 3PH, London, U.K. She is now with Access IS,Reading, RG6 1AZ, U.K.
D. Kaba, Y. Li, and X. Liu are with the Department of Computer Science,Brunel University, Middlesex, UB8 3PH, London, U.K. (e-mail: [email protected]).
Color versions of one or more of the figures in this paper are available onlineat http://ieeexplore.ieee.org.
Digital Object Identifier 10.1109/JBHI.2014.2302749
which preserves various vessel and optic disk characteristics, isattractive in computer-aided diagnosis.
An automated segmentation and inspection of retinal bloodvessel features such as diameter, color, and tortuosity as wellas the optic disk morphology allows ophthalmologists and eyecare specialists to perform mass vision screening exams for earlydetection of retinal diseases and treatment evaluation. This couldprevent and reduce vision impairments, age-related diseases,and many cardiovascular diseases, as well as reduce the cost ofthe screening.
Over the past few years, several segmentation techniques havebeen employed for the segmentation of retinal structures suchas blood vessels and optic disks and diseases like lesions infundus retinal images. However, the acquisition of fundus retinalimages under different conditions of illumination, resolutionand field of view (FOV), and the overlapping tissue in the retinacause a significant degradation of the performance of automatedblood vessels and optic disk segmentations. Thus, there is a needfor a reliable technique for retinal vascular tree extraction andoptic disk detection, which preserves various vessel and opticdisk shapes. In the following segment, we briefly review theprevious studies on the blood vessel segmentation and opticdisk segmentation separately.
II. RELATED WORKS
Two different approaches have been deployed to segment thevessels of the retina: the pixel-processing-based methods andtracking-based methods [1].
The pixel-processing-based approach performs the vesselsegmentation in a two-pass operation. First, the appearance ofthe vessel is enhanced using detection processes such as mor-phological preprocessing techniques and adaptive filtering. Thesecond operation is the recognition of the vessel structure usingthinning or branch-point operations to classify a pixel as a vesselor background (Bg). These approaches process every pixel inthe image and apply multiple operations on each pixel. Somepixel processing methods use neutral networks and frequencyanalysis to define pixels in the image as vessel pixels and Bgpixels. Typical pixel processing operations are shown by Hooveret al. [2], Mendoca et al. [3], Soares et al. [4], Staal et al. [5],Chaudhuri et al. [6], and Zana et al. [7].
The second set of approaches for vessel segmentation are re-ferred to as vessel tracking, vectorial tracking, or tracing [1]. Incontrast to the pixel-processing-based approaches, the trackingmethods detect first initial vessel seed points, and then trackthe rest of the vessel pixels through the image by measuringthe continuity proprieties of the blood vessels. This technique isused as a single-pass operation, where the detection of the vessel
1949-3029 © 2014 IEEE. Translations and content mining are permitted for academic research only. Personal use is also permitted, but republication/redistributionrequires IEEE permission. See http://www.ieee.org/publications standards/publications/rights/index.html for more information.

SALAZAR-GONZALEZ et al.: SEGMENTATION OF THE BLOOD VESSELS AND OPTIC DISK IN RETINAL IMAGES 1875
structures and the recognition of the structures are simultane-ously performed.
The tracking-based approaches included semiautomated trac-ing and automated tracing. In the semiautomated tracing meth-ods, the user manually selects the initial vessel seed point. Thesemethods are generally used in quantitative coronary angiogra-phy analysis and they generally provide accurate segmentationof the vessels. In fully automated tracing, the algorithms auto-matically select the initial vessel points and most methods useGaussian functions to characterize a vessel profile model, whichlocates a vessel point for the vessel tracing. They are computa-tionally efficient and more suitable for retinal image processing.Examples of the tracking-based approaches are presented by Xuet al. [8], Maritiner-perez et al. [9], Staal et al. [5], and Zhouet al. [10].
Both pixel processing and tracking approaches have their ownadvantages and limitations over each other. The pixel process-ing approaches can provide a complete extraction of the vasculartree in the retinal image since they search all the possible ves-sel pixels across the whole image. However, these techniquesare computationally expensive and require special hardware tobe suitable for large image dataset. The presence of noise andlesions in some retinal images causes a significant degrada-tion in the performance of the pixel processing approaches asthe enhancement operation may pick up some noise and le-sions as vessel pixels. This could lead to false vessel detectionin the recognition operation. On the other hand, the trackingapproaches are computationally efficient and much faster thanthe pixel processing methods because they perform the vesselsegmentation using only the pixels in the neighborhood of thevessels structure and avoid the processing of every pixel in theimage. Nevertheless, these methods lack in extracting a com-plete vascular tree in the case where there are discontinuities inthe vessel branches. Furthermore, the semiautomated trackingsegmentation methods need manual input, which requires time.
The optic nerve head is described as the brightest round areain the retina where the blood vessels converge with a shapethat is approximately elliptical and has a width of 1.8 ± 0.2 mmand height 1.9 ± 0.2 mm [11]. The convergence feature of bloodvessels into the optic disk region is generally used to estimate thelocation of the optic disk and segment it from the retinal image.But the intrusion of vessels in the optic disk region constitutescomputational complexity for the optic disk segmentation as it isbreaking the continuity of its boundary. To address this problem,several methods have been employed such as those presentedby Chrastek et al. [12], Lowell et al. [13], Welfer et al. [14], andAquino et al. [15].
Chrastek et al. [12] presented an automated segmentation ofthe optic nerve head for diagnosis of glaucoma. The methodremoves the blood vessel by using a distance map algorithm;then, the optic disk is segmented by combining a morphologi-cal operation, Hough transform, and an anchored active contourmodel. Lowell et al. [13] proposed a deformable contour modelto segment the optic nerve head boundary in low-resolutionretinal images. The approach localizes the optic disk using aspecialized template matching and a directionally sensitive gra-dient to eliminate the obstruction of the vessel in the optic disk
Fig. 1. Vessel segmentation algorithm.
region before performing the segmentation. Welfer et al. [14]proposed an automated segmentation of the optic disk in coloreye fundus image using an adaptive morphological operation.The method uses a watershed transform marker to define theoptic disk boundary, and the vessel obstruction is minimized bymorphological erosion.
These techniques are performed using morphological opera-tions to eliminate the blood vessels from the retinal image. How-ever, the application of morphological operations can modify theimage by corrupting some useful information.
In our optic disk segmentation process, the convergence fea-ture of vessels into the optic disk region is used to estimate itslocation. We then use two automated methods [Markov randomfield (MRF) image reconstruction and compensation factor] tosegment the optic disk.
The rest of the paper is organized as follows. The blood vesselsegmentation is discussed in Section III. Section IV provides thedetailed description of the optic disk segmentation. Section Vpresents the experimental results of our method with compar-isons to other methods. Conclusions are drawn in Section VI.The preliminary results of the three components of the approach,namely the blood vessel segmentation, optic disk segmentationusing the graph cut and MRF, respectively, were presented sep-arately in [16]–[18]. More details of the approach can be foundin the Ph.D. thesis [19].
III. BLOOD VESSEL SEGMENTATION
Blood vessels can be seen as thin elongated structures in theretina, with variation in width and length. In order to segmentthe blood vessel from the fundus retinal image, we have imple-mented a preprocessing technique, which consists of an effectiveadaptive histogram equalization and robust distance transform.This operation improves the robustness and the accuracy of thegraph cut algorithm. Fig. 1 shows the illustration of the vesselsegmentation algorithm.
A. Preprocessing
We apply a contrast enhancement process to the green channelimage similar to the work presented in [20]. The intensity of theimage is inverted, and the illumination is equalized. The result-ing image is enhanced using an adaptive histogram equalizer,

1876 IEEE JOURNAL OF BIOMEDICAL AND HEALTH INFORMATICS, VOL. 18, NO. 6, NOVEMBER 2014
Fig. 2. Preprocessing. (a) h = 45, r = 3, (b) h = 45, r = 6, (c) h = 81, r =3, (d) h = 81, r = 6, (e) distance map, and (f) sample of a vessel with arrowsindicating the vessel gradients.
given by
IEnhanced =
⎛⎝ ∑
p ′∈R(p)
s (I (p) − I (p′))h2
⎞⎠
r
· M (1)
where I is the green channel of the fundus retinal color image, pdenotes a pixel, and p
′is the neighborhood pixel around p. p
′ ∈R(p) is the square window neighborhood with length h. s(d) =1 if d > 0, and s(d) = 0 otherwise with d = s (I (p) − I (p′)).M = 255 value of the maximum intensity in the image. r isa parameter to control the level of enhancement. Increasingthe value of r would also increase the contrast between vesselpixels and the Bg as seen in Fig. 2. The experimental values ofthe window length was set to h = 81 and r = 6.
A binary morphological open process is applied to prune theenhanced image, which discards all the misclassified pixels inFig. 2(d). This approach significantly reduces the false positive,since the enhanced image will be used to construct the graph forsegmentation.
A distance map image is created using the distance transformalgorithm. This is used to calculate the direction and the magni-tude of the vessel gradient. Fig. 2(e) and (f) shows the distancemap of the whole image and a sample vessel with arrows in-dicating the direction of the gradients, respectively. From thesample vessel image, we can see the center line with the bright-est pixels, which are progressively reduced in intensity in thedirection of the edges (image gradients). The arrows in Fig. 2(f)are referred to as vector field, which are used to construct thegraph in the next sections.
B. Graph Construction for Vessel Segmentation
The graph cut is an energy-based object segmentation ap-proach. The technique is characterized by an optimization op-eration designed to minimize the energy generated from a givenimage data. This energy defines the relationship between neigh-borhood pixel elements in an image.
TABLE IWEIGHT ASSIGNMENT OF THE EDGES IN THE GRAPH
A graph G (ν, ε) is defined as a set of nodes (pixels) ν and a setof undirected edges ε that connect these neighboring nodes. Thegraph included two special nodes, a foreground (Fg) terminal(source S) and a Bg terminal (sink T ). ε includes two typesof undirected edges: neighborhood links (n-links) and terminallinks (t-links). Each pixel p ∈ P (a set of pixels) in the graphpresents two t-links {p, S} and {p, T} connecting it to eachterminal, while a pair of neighboring pixels {p, q} ∈ N (numberof pixel neighbors) is connected by an n-link [21]. Thus,
ε = N⋃p∈P
{{p, S}, {p, T}, ν = P ∪ {S, T}}. (2)
An edge e ∈ ε is assigned a weight (cost) We > 0. A cut isdefined by a subset of edges C ∈ ε, where G (c) = 〈ν, ε\C〉separating the graph into Fg and Bg with C defined as |C| =∑
e∈C We
The max-flow algorithm is used to cut the graph and find theoptimal segmentation. Table I assigns weight to the edges ε inthe graph [21], where
K = 1 + maxp∈P
∑{p,q}
Bp,q , (3)
and F and B represent the subsets of pixels selected as theFg and Bg, respectively. Thus, F ⊂ P and B ⊂ P such thatF ∩ B = . Bp,q defines the discontinuity between neighbor-ing pixels, and its value is large when the pixel intensities. λ > 0is a constant coefficient, which we will define in the energy for-mulation of the graph.
The graph cut technique is used in our segmentation becauseit allows the incorporation of prior knowledge into the graphformulation in order to guide the model and find the optimalsegmentation. Let us assume A = (A1 , Ap , . . . , AP ) is a binaryvector set of labels assigned to each pixel p in the image, whereAp indicate assignments to pixels p in P . Therefore, each as-signment Ap is either in the Fg or Bg. Thus, the segmentation isobtained by the binary vector A and the constraints imposed onthe regional and boundary proprieties of vector A are derivedby the energy formulation of the graph defined as
E (A) = λ · R (A) + B (A) (4)
where the positive coefficient λ indicates the relative importanceof the regional term (likelihoods of Fg and Bg) RA against theboundary term (relationship between neighborhood pixels) BA .The regional or the likelihood of the Fg and Bg is given by
R (A) =∑p∈P
Rp (Ap) (5)
SALAZAR-GONZALEZ et al.: SEGMENTATION OF THE BLOOD VESSELS AND OPTIC DISK IN RETINAL IMAGES 1877
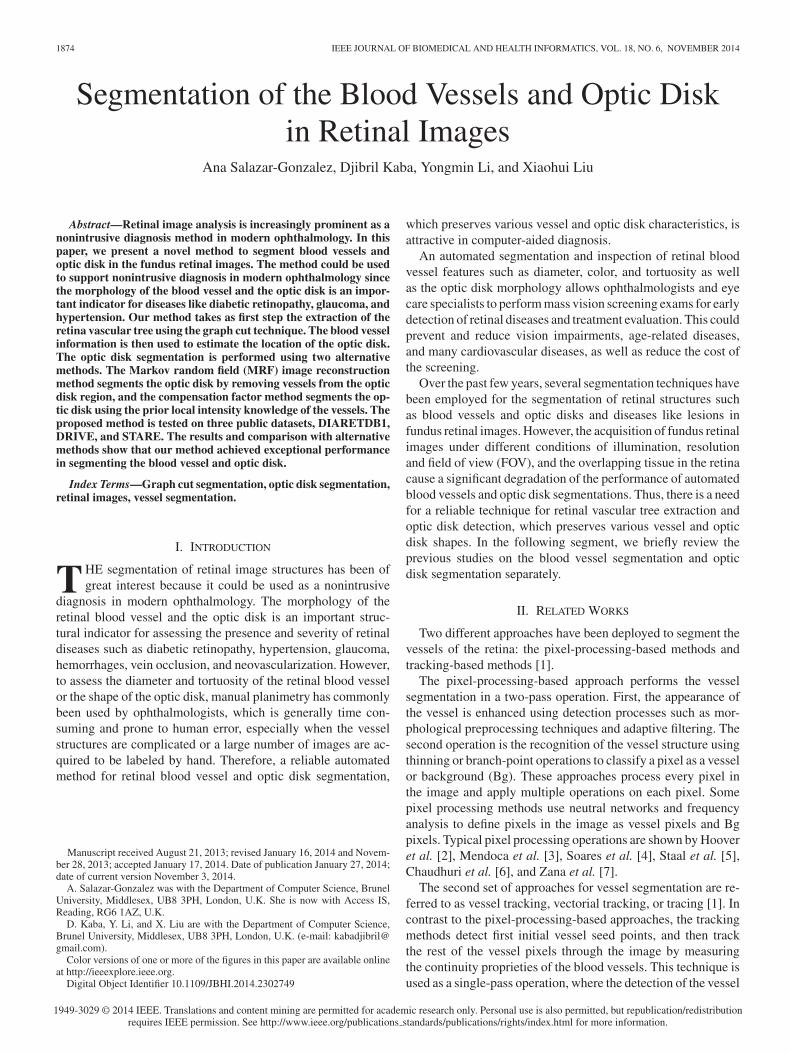
Fig. 3. Retinal blood vessel segmentation using the traditional graph. (a) Seedsinitialization of the input image, (b) λ = 20, (c) λ = 50, and (d) λ = 100.
and the boundary constraints are defined as
B (A) =∑
p,q∈N
Bp,q · φ (Ap,Aq ) (6)
where φ (Ap,Aq ) = 1 for Ap = Aq and 0 otherwise,
Bp,q = exp(− (Ip − Iq)2
2σ2 ) · 1dist(p, q)
. (7)
Rp (Ap) specifies the assignment of pixel p to either the Fgor the Bg. Bp,q defines the discontinuity between neighboringpixels, and its value is large when the pixel intensities Ip and Iq
are similar and close to zero when they are different. The valueof Bp,q is also affected by the Euclidean distance dist(p, q)between pixels p and q.
During the minimization of the graph energy formulationin (4) to segment thin objects like blood vessels, the secondterm (boundary term) in (4) has a tendency to follow shortedges known as “the shrinking bias” [22]. This problem causesa significant degradation of the performance of the graph cutalgorithm on thin elongated structures like the blood vessels.Fig. 3 shows an example of the blood vessel segmentation usingthe traditional graph formulation [23]. From Fig. 3, it can beseen that the blood vessel segmentation follows short edges,and tends to shrink in the search for the cheapest cost. It canalso be noticed that λ in (4) controls the relation between theboundary and regional terms. Increasing the value of λ, thelikelihood of the pixels belonging to the Fg and Bg (t-links)gains strength over the regional term (n-links), which slightlyimproves the segmentation result as shown in Fig. 3(d).
To address the aforementioned problem, the segmentation ofblood vessels using the graph cut requires a special graph for-mulation. One of the methods used to address the shrinking biasproblem is to impose an additional connectivity prior, where theuser marks the constraint connectivity [22]. In order to achievefull automated segmentation, we used the method presentedin [23], which overcomes the “shrinking bias” by adding themechanism of vectors flux into the construction of the graph.
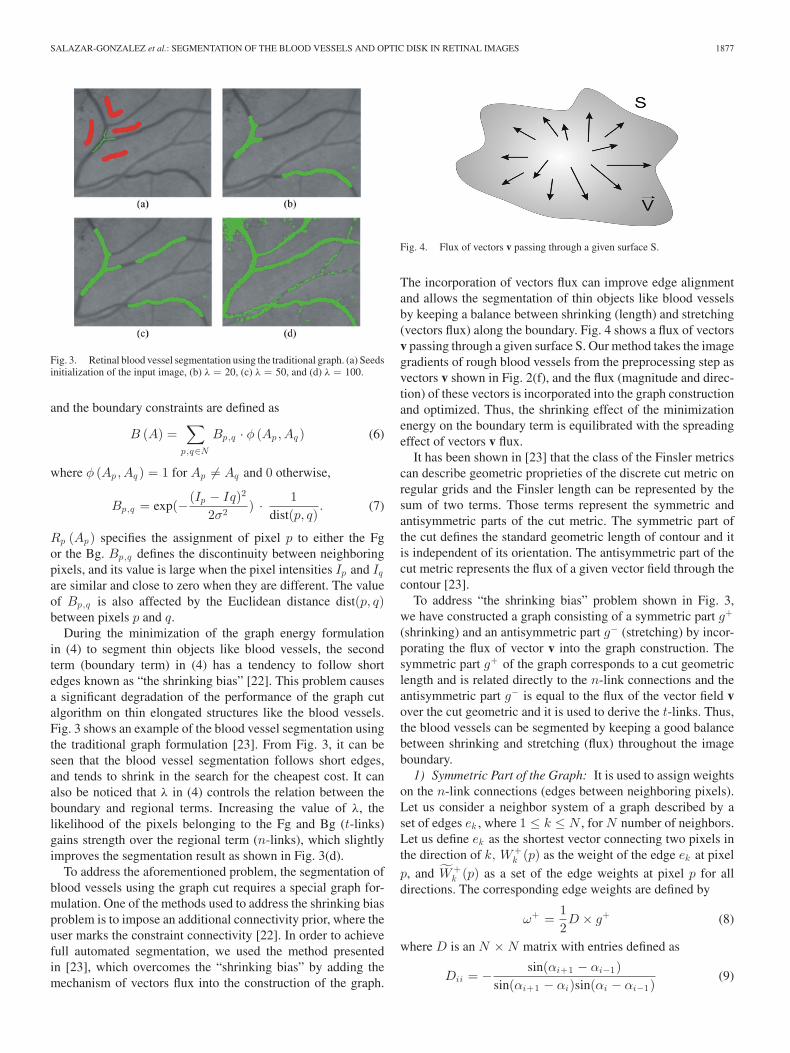
Fig. 4. Flux of vectors v passing through a given surface S.
The incorporation of vectors flux can improve edge alignmentand allows the segmentation of thin objects like blood vesselsby keeping a balance between shrinking (length) and stretching(vectors flux) along the boundary. Fig. 4 shows a flux of vectorsv passing through a given surface S. Our method takes the imagegradients of rough blood vessels from the preprocessing step asvectors v shown in Fig. 2(f), and the flux (magnitude and direc-tion) of these vectors is incorporated into the graph constructionand optimized. Thus, the shrinking effect of the minimizationenergy on the boundary term is equilibrated with the spreadingeffect of vectors v flux.
It has been shown in [23] that the class of the Finsler metricscan describe geometric proprieties of the discrete cut metric onregular grids and the Finsler length can be represented by thesum of two terms. Those terms represent the symmetric andantisymmetric parts of the cut metric. The symmetric part ofthe cut defines the standard geometric length of contour and itis independent of its orientation. The antisymmetric part of thecut metric represents the flux of a given vector field through thecontour [23].
To address “the shrinking bias” problem shown in Fig. 3,we have constructed a graph consisting of a symmetric part g+
(shrinking) and an antisymmetric part g− (stretching) by incor-porating the flux of vector v into the graph construction. Thesymmetric part g+ of the graph corresponds to a cut geometriclength and is related directly to the n-link connections and theantisymmetric part g− is equal to the flux of the vector field vover the cut geometric and it is used to derive the t-links. Thus,the blood vessels can be segmented by keeping a good balancebetween shrinking and stretching (flux) throughout the imageboundary.
1) Symmetric Part of the Graph: It is used to assign weightson the n-link connections (edges between neighboring pixels).Let us consider a neighbor system of a graph described by aset of edges ek , where 1 ≤ k ≤ N , for N number of neighbors.Let us define ek as the shortest vector connecting two pixels inthe direction of k, W+
k (p) as the weight of the edge ek at pixel
p, and W+k (p) as a set of the edge weights at pixel p for all
directions. The corresponding edge weights are defined by
ω+ =12D × g+ (8)
where D is an N × N matrix with entries defined as
Dii = − sin(αi+1 − αi−1)sin(αi+1 − αi)sin(αi − αi−1)
(9)

1878 IEEE JOURNAL OF BIOMEDICAL AND HEALTH INFORMATICS, VOL. 18, NO. 6, NOVEMBER 2014
Fig. 5. Neighborhood system for a grid in the graph.
Dij =
⎧⎨⎩
1sin (αj − αi)
if j + 1 ± 1 mod N
0 for other entries
where αk is the angle of the edge ek with respect to the positiveaxis X as shown in Fig. 5.
In our implementation, we consider a grid map of 16 neigh-bors with edges ek , k = 1, 2, . . . , 16 as shown in Fig. 5. For eachpixel p in the green channel image, the edge weight W+
k (p) iscomputed according to (8). g+ is calculated using the pixelintensity difference between two given nodes by
g+ = K · exp
(−(Ip − Iq )2
σ2
). (10)
g+ has a high value for pixels of similar intensities, whenIp − Iq < σ. However, if the pixels are very different Ip − Iq >σ, the value of g+ is small, which represents a poor relationbetween the pixels; hence, they belong to different terminals[24].
2) Antisymmetric Part of the Graph: We used the term an-tisymmetry because the flux (stretching) of the vector field vover the cut geometric balanced the shrinking of blood vesselsduring the segmentation. This antisymmetric part of the graphis defined by the flux of the vector field v over the cut geomet-ric. It is used to assign weights on the t-links (edges betweena given pixel and the terminals) to balance the shrinking effectseen in Fig. 3. Specific weights for t-links are obtained based onthe deposition of vector v. Different decompositions of vectorv may result in different t-links whose weights can be inter-preted as an estimation of divergence. In our implementation,we decomposed the vector v along grid edges with the n-linksoriented along the main axes, i.e., in the X- and Y -directions.Thus, vector v can be decomposed as v = vxux + vyuy , whereux and uy are unit vectors in the X- and Y -directions, respec-tively. This decomposition leads to the t-link weights definedas
tp =δ2
2[(vright
x − vleftx
)+
(vup
y − vdownx
)] (11)
where vrightx and vleft
x are the components of vector v in theX-direction taken at the right and left neighbors of pixel P ,
Fig. 6. Vessel segmentation using the decomposition of vector v: (a) inputretinal image, (b) blood vessel segmentation using horizontal (X -axis) de-composition of vector v, (c) blood vessel segmentation using vertical (Y -axis)decomposition of vector v, and (d) blood vessel segmentation result using thedecomposition of vector v along the X- and Y-axes.
respectively. vupy and vdown
y are in the Y -direction of vector vtaken at the top and down neighbors of pixel P . δ is the size ofthe cell in the grid map (see Fig. 5). We add edge (s → p) withweight C ∗ (−tp) if tp < 0, or edge (p → t) with weight C ∗ tpotherwise. The parameter C is related to the magnitude of thevector v; thus, the pixels in the center of the blood vessel have ahigher connection to the source (Fg) than the pixels in the edgeof the blood vessels. Because the distance map is calculated onthe pruned image and vector v is only defined for the pixelsdetected as blood vessels in the rough segmentation, for the restof the pixels in the image, the initialization of t-link weightsis set as (p → s) with weight t = 0 and (p → t) with weightt = K, where K is the maximum weight sum for a pixel in thesymmetric construction. Fig. 6 shows the segmentation resultsof the blood vessels using different decomposition of the vectorv generating different t-link weights.
IV. OPTIC DISK SEGMENTATION
The optic disk segmentation starts by defining the locationof the optic disk. This process used the convergence feature ofvessels into the optic disk to estimate its location. The disk areais then segmented using two different automated methods (MRFimage reconstruction and compensation factor). Both methodsuse the convergence feature of the vessels to identify the positionof the disk. The MRF method is applied to eliminate the vesselfrom the optic disk region. This process is known as imagereconstruction and it is performed only on the vessel pixels toavoid the modification of other structures of the image. Thereconstructed image is free of vessels and it is used to segmentthe optic disk via graph cut. In contrast to MRF method, thecompensation factor approach segments the optic disk usingprior local intensity knowledge of the vessels. Fig. 7 showsthe overview of both the MRF and the compensation factormethods.
SALAZAR-GONZALEZ et al.: SEGMENTATION OF THE BLOOD VESSELS AND OPTIC DISK IN RETINAL IMAGES 1879
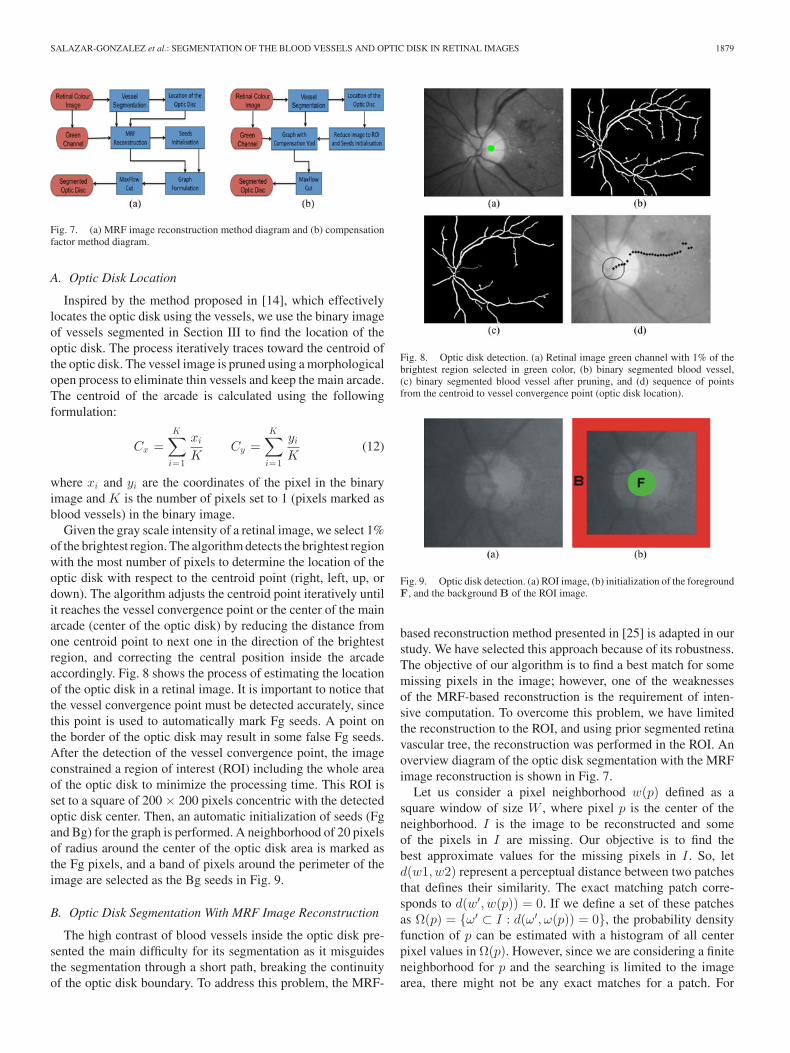
Fig. 7. (a) MRF image reconstruction method diagram and (b) compensationfactor method diagram.
A. Optic Disk Location
Inspired by the method proposed in [14], which effectivelylocates the optic disk using the vessels, we use the binary imageof vessels segmented in Section III to find the location of theoptic disk. The process iteratively traces toward the centroid ofthe optic disk. The vessel image is pruned using a morphologicalopen process to eliminate thin vessels and keep the main arcade.The centroid of the arcade is calculated using the followingformulation:
Cx =K∑
i=1
xi
KCy =
K∑i=1
yi
K(12)
where xi and yi are the coordinates of the pixel in the binaryimage and K is the number of pixels set to 1 (pixels marked asblood vessels) in the binary image.
Given the gray scale intensity of a retinal image, we select 1%of the brightest region. The algorithm detects the brightest regionwith the most number of pixels to determine the location of theoptic disk with respect to the centroid point (right, left, up, ordown). The algorithm adjusts the centroid point iteratively untilit reaches the vessel convergence point or the center of the mainarcade (center of the optic disk) by reducing the distance fromone centroid point to next one in the direction of the brightestregion, and correcting the central position inside the arcadeaccordingly. Fig. 8 shows the process of estimating the locationof the optic disk in a retinal image. It is important to notice thatthe vessel convergence point must be detected accurately, sincethis point is used to automatically mark Fg seeds. A point onthe border of the optic disk may result in some false Fg seeds.After the detection of the vessel convergence point, the imageconstrained a region of interest (ROI) including the whole areaof the optic disk to minimize the processing time. This ROI isset to a square of 200 × 200 pixels concentric with the detectedoptic disk center. Then, an automatic initialization of seeds (Fgand Bg) for the graph is performed. A neighborhood of 20 pixelsof radius around the center of the optic disk area is marked asthe Fg pixels, and a band of pixels around the perimeter of theimage are selected as the Bg seeds in Fig. 9.
B. Optic Disk Segmentation With MRF Image Reconstruction
The high contrast of blood vessels inside the optic disk pre-sented the main difficulty for its segmentation as it misguidesthe segmentation through a short path, breaking the continuityof the optic disk boundary. To address this problem, the MRF-
Fig. 8. Optic disk detection. (a) Retinal image green channel with 1% of thebrightest region selected in green color, (b) binary segmented blood vessel,(c) binary segmented blood vessel after pruning, and (d) sequence of pointsfrom the centroid to vessel convergence point (optic disk location).
Fig. 9. Optic disk detection. (a) ROI image, (b) initialization of the foregroundF, and the background B of the ROI image.
based reconstruction method presented in [25] is adapted in ourstudy. We have selected this approach because of its robustness.The objective of our algorithm is to find a best match for somemissing pixels in the image; however, one of the weaknessesof the MRF-based reconstruction is the requirement of inten-sive computation. To overcome this problem, we have limitedthe reconstruction to the ROI, and using prior segmented retinavascular tree, the reconstruction was performed in the ROI. Anoverview diagram of the optic disk segmentation with the MRFimage reconstruction is shown in Fig. 7.
Let us consider a pixel neighborhood w(p) defined as asquare window of size W , where pixel p is the center of theneighborhood. I is the image to be reconstructed and someof the pixels in I are missing. Our objective is to find thebest approximate values for the missing pixels in I . So, letd(w1, w2) represent a perceptual distance between two patchesthat defines their similarity. The exact matching patch corre-sponds to d(w′, w(p)) = 0. If we define a set of these patchesas Ω(p) = {ω′ ⊂ I : d(ω′, ω(p)) = 0}, the probability densityfunction of p can be estimated with a histogram of all centerpixel values in Ω(p). However, since we are considering a finiteneighborhood for p and the searching is limited to the imagearea, there might not be any exact matches for a patch. For
1880 IEEE JOURNAL OF BIOMEDICAL AND HEALTH INFORMATICS, VOL. 18, NO. 6, NOVEMBER 2014
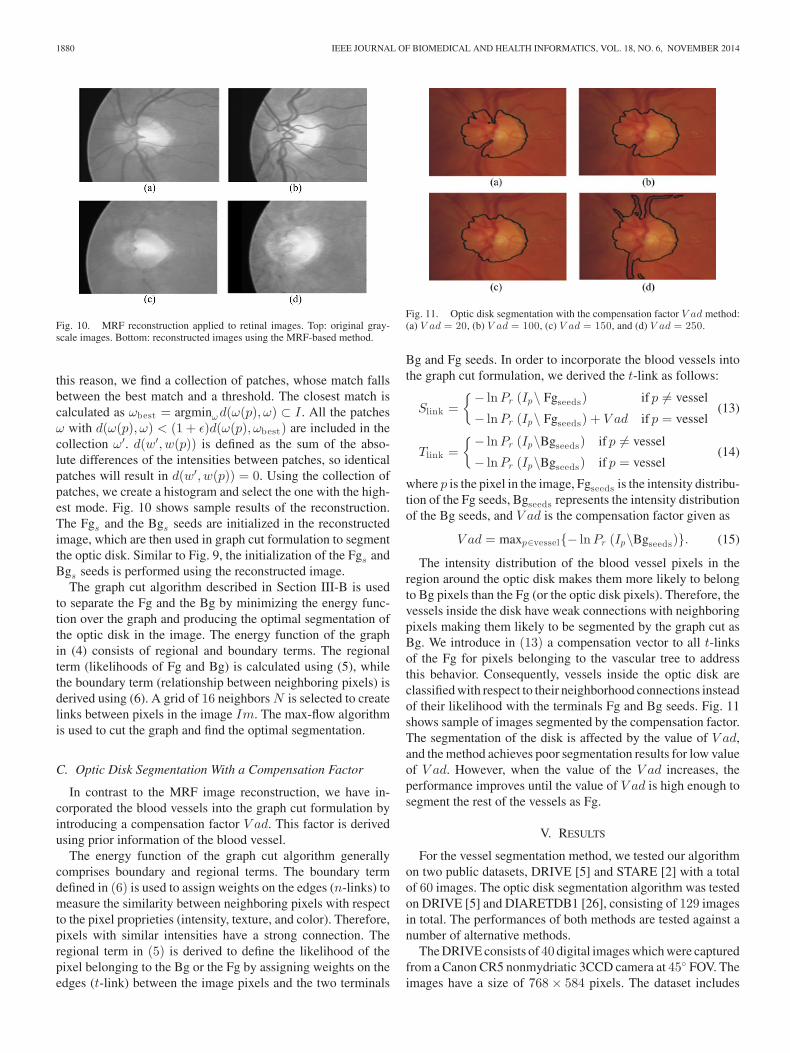
Fig. 10. MRF reconstruction applied to retinal images. Top: original gray-scale images. Bottom: reconstructed images using the MRF-based method.
this reason, we find a collection of patches, whose match fallsbetween the best match and a threshold. The closest match iscalculated as ωbest = argminω d(ω(p), ω) ⊂ I . All the patchesω with d(ω(p), ω) < (1 + ε)d(ω(p), ωbest) are included in thecollection ω′. d(w′, w(p)) is defined as the sum of the abso-lute differences of the intensities between patches, so identicalpatches will result in d(w′, w(p)) = 0. Using the collection ofpatches, we create a histogram and select the one with the high-est mode. Fig. 10 shows sample results of the reconstruction.The Fgs and the Bgs seeds are initialized in the reconstructedimage, which are then used in graph cut formulation to segmentthe optic disk. Similar to Fig. 9, the initialization of the Fgs andBgs seeds is performed using the reconstructed image.
The graph cut algorithm described in Section III-B is usedto separate the Fg and the Bg by minimizing the energy func-tion over the graph and producing the optimal segmentation ofthe optic disk in the image. The energy function of the graphin (4) consists of regional and boundary terms. The regionalterm (likelihoods of Fg and Bg) is calculated using (5), whilethe boundary term (relationship between neighboring pixels) isderived using (6). A grid of 16 neighbors N is selected to createlinks between pixels in the image Im. The max-flow algorithmis used to cut the graph and find the optimal segmentation.
C. Optic Disk Segmentation With a Compensation Factor
In contrast to the MRF image reconstruction, we have in-corporated the blood vessels into the graph cut formulation byintroducing a compensation factor V ad. This factor is derivedusing prior information of the blood vessel.
The energy function of the graph cut algorithm generallycomprises boundary and regional terms. The boundary termdefined in (6) is used to assign weights on the edges (n-links) tomeasure the similarity between neighboring pixels with respectto the pixel proprieties (intensity, texture, and color). Therefore,pixels with similar intensities have a strong connection. Theregional term in (5) is derived to define the likelihood of thepixel belonging to the Bg or the Fg by assigning weights on theedges (t-link) between the image pixels and the two terminals
Fig. 11. Optic disk segmentation with the compensation factor V ad method:(a) V ad = 20, (b) V ad = 100, (c) V ad = 150, and (d) V ad = 250.
Bg and Fg seeds. In order to incorporate the blood vessels intothe graph cut formulation, we derived the t-link as follows:
Slink ={− ln Pr (Ip\ Fgseeds) if p = vessel
− ln Pr (Ip\ Fgseeds) + V ad if p = vessel(13)
Tlink ={− ln Pr (Ip\Bgseeds) if p = vessel
− ln Pr (Ip\Bgseeds) if p = vessel(14)
where p is the pixel in the image, Fgseeds is the intensity distribu-tion of the Fg seeds, Bgseeds represents the intensity distributionof the Bg seeds, and V ad is the compensation factor given as
V ad = maxp∈vessel{− ln Pr (Ip\Bgseeds)}. (15)
The intensity distribution of the blood vessel pixels in theregion around the optic disk makes them more likely to belongto Bg pixels than the Fg (or the optic disk pixels). Therefore, thevessels inside the disk have weak connections with neighboringpixels making them likely to be segmented by the graph cut asBg. We introduce in (13) a compensation vector to all t-linksof the Fg for pixels belonging to the vascular tree to addressthis behavior. Consequently, vessels inside the optic disk areclassified with respect to their neighborhood connections insteadof their likelihood with the terminals Fg and Bg seeds. Fig. 11shows sample of images segmented by the compensation factor.The segmentation of the disk is affected by the value of V ad,and the method achieves poor segmentation results for low valueof V ad. However, when the value of the V ad increases, theperformance improves until the value of V ad is high enough tosegment the rest of the vessels as Fg.
V. RESULTS
For the vessel segmentation method, we tested our algorithmon two public datasets, DRIVE [5] and STARE [2] with a totalof 60 images. The optic disk segmentation algorithm was testedon DRIVE [5] and DIARETDB1 [26], consisting of 129 imagesin total. The performances of both methods are tested against anumber of alternative methods.
The DRIVE consists of 40 digital images which were capturedfrom a Canon CR5 nonmydriatic 3CCD camera at 45◦ FOV. Theimages have a size of 768 × 584 pixels. The dataset includes

SALAZAR-GONZALEZ et al.: SEGMENTATION OF THE BLOOD VESSELS AND OPTIC DISK IN RETINAL IMAGES 1881
masks to separate the FOV from the rest of the image. It includedtwo sets of hand-labeled images (set A and set B) for the bloodvessel. Set A offers the manually labeled images for all theimages in the dataset, whereas set B provides the manuallylabeled images for half of the dataset. To test our method, weadopt the set A hand labeling as the benchmark. We manuallydelimited the optic disk to test the performance of the optic disksegmentation algorithm.
The STARE dataset consists of 20 images captured by a Top-Con TRV-50 fundus camera at 35◦ FOV. The size of the images is700 × 605 pixels. We calculated the mask image for this datasetusing a simple threshold technique for each color channel. TheSTARE dataset included images with retinal diseases selectedby Hoover et al. [2]. It also provides two sets of hand-labeled im-ages performed by two human experts. The first expert labeledfewer vessel pixels than the second one. To test our method, weadopt the first expert hand labeling as the ground truth.
The DIARETDB1 dataset consists of 89 color images with 84of them containing at last one indication of lesion. The imageswere captured with a digital fundus camera at 50◦ FOV and hada size of 1500 × 1152 pixels. Hand-labeled lesion regions areprovided in this dataset by four human experts. However, theDIARETDB1 dataset only includes the hand-labeled groundtruth of lesions but not the blood vessels and the optic disk.For this reason, we were unable to compare the performanceof the blood vessel segmentation on the DIARETDB1 dataset.Nevertheless, we were able to create the hand-labeled groundtruth of an optic disk to test the performance of the optic disksegmentation.
To facilitate the performance comparison between our methodand alternative retinal blood vessels segmentation approaches,parameters such as the true positive rate (TPR), the false positiverate (FPR), and the accuracy rate (ACC) are derived to measurethe performance of the segmentation [5]. The ACC is definedas the sum of the true positives (pixels correctly classified asvessel points) and the true negatives (nonvessel pixels correctlyidentified as nonvessel points), divided by the total number ofpixels in the images. The TPR is defined as the total numberof true positives, divided by the number of blood vessel pixelsmarked in the ground true image. The FPR is calculated asthe total number of false positives divided by the number ofpixels marked as nonvessel in the ground true image. It is worthmentioning that a perfect segmentation would have an FPR of 0and a TPR of 1. Our method and all the alternative methods usedthe first expert hand-labeled images as a performance reference.
Most of the alternative methods use the whole image to mea-sure the performance. In [5], all the experiments are carried outon the FOV without considering the performance in the darkarea outside the FOV. The method in [3] measures the perfor-mance on both the whole image and the FOV. The dark Bgoutside the FOV in the retinal image is easy to segment. It isan advantage in measuring the true negatives pixels when thewhole image is considered. We have calculated the percentageof pixels outside the FOV in the images for the two datasets,which represents approximately 25% of the pixels in the wholeimage. However, it does not affect all the measurement metrics,except when the true negative value is involved (e.g., ACC). On
TABLE IIPERFORMANCE COMPARISON IN THE STARE DATASET
TABLE IIIPERFORMANCE COMPARISON OF HEALTHY VERSUS DISEASE IMAGES
IN THE STARE DATASET
the other hand, most of the methods use the whole image tomeasure their performance, making the comparison fair.
A. Results of the Blood Vessel Segmentation Algorithmon the STARE Dataset
Tables II and III show performance comparison results ofour approach with recent alternative methods in terms of TPR,FPR, and ACC on the STARE dataset. The performance resultsof the second expert hand labeled and the method proposed byMartinez-Perez et al. [9] and Staal et al. [5] are taken from [9].The results of the methods proposed by Mendonca et al. [3]and Hoover et al. [2] are taken from [3], and the approachesof Chaudhuri et al. [6], Kaba et al. [27] Marin et al. [28], andZhang et al. [29] were generated from their original manuscripts.The performance results of segmentation for Zhang et al. [29],Chaudhuri et al. [6], and Soares et al. [30] on both healthy and

1882 IEEE JOURNAL OF BIOMEDICAL AND HEALTH INFORMATICS, VOL. 18, NO. 6, NOVEMBER 2014
Fig. 12. DRIVE dataset: (a) and (d) retinal images, (b) and (e) our segmenta-tion results, and (c) (and e) manually labeled results.
unhealthy images were taken from [29]. The testing includesall the 20 fundus images except the method proposed by Staalet al. [5] which used 19 out of the 20 (ten healthy and nineunhealthy) images.
In Table II, the second human expert hand-labeled imageis considered as the target performance level with averageTPR = 0.7887, given the first human expert hand-labeled im-age as benchmark. Thus, our method needs an improvement of10.64% in average true positive, whereas Mendon et al., Staalet al., Chaudhuri et al., Hoover et al., Kaba et al., Martinez-Perez et al., and Zhang et al. have a room of improvementof 19.55%, 19.81%, 28.17%, 22.00%, 23.06%, 14.45%, and17.74%, respectively.
Considering the value of average TPR as a performance mea-sure, our proposed approach reaches better performance thanall the other methods. However, with the average ACC, ourmethod is only marginally inferior to the methods presented byStaal et al. [5], Kaba et al. [27], Marin et al. [28], and Zhanget al. [29], but as mentioned previously, Staal et al. [5] used 19of the 20 images. Compared to the methods proposed by Hooveret al. [2], Martinez-Perez et al. [9], and Chaudhuri et al. [6], ourapproach outperforms the ACC of these techniques and it hasapproximately the same value of ACC as Mendonca et al. [3].
Table III compares the performance of the healthy subject im-ages against the unhealthy subject images on the STARE dataset.The results of the experiments show that the unhealthy ocularimages cause a significant degradation of the performance ofautomated blood vessel segmentation techniques. An overviewof the results shows that in both healthy and unhealthy images,our proposed method achieves a better overall average TPR per-formance than all the other methods. However, the average ACCvalue is comparable to the performance of Soares et al. [30] andZhang et al. [29]. It outperforms the ACC of Mendonca et al. [3],Hoover et al. [2], and Chaudhuri et al. [6] in both healthy andunhealthy images.
Figs. 12 and 13 show the segmented images and the man-ually labeled images for the DRIVE and the STARE datasets,respectively.
Fig. 13. STARE dataset: (a) and (d) retinal images, (b) and (e) our segmenta-tion results, and (c) and (e) manually labeled results.
B. Results of the Blood Vessel Segmentation Algorithmon the DRIVE Dataset
The performance of the segmentation of our method on theDRIVE dataset is compared with alternative methods: Zhanget al. [29], Soares et al. [30], Zana et al. [7], Garg et al. [31],Perfetti et al. [32], and Al-Rawi et al. [33] taken from [29]. Theresults of the second human expert B and the method proposedby Niemeijer et al. [34], Mendonca et al. [3], and Staal et al. [5]were acquired from [3]. The results of the methods proposed byCinsdikici et al. [35] and Jiang et al. [36] were generated fromMarin et al. [28], and finally, the results of the methods by Ricciet al. [37], Soares et al. [30], and Martinez-Perez et al. [9] wereacquired from their original manuscripts.
The second human expert B hand-labeled image [3] is con-sidered as the target performance level with average (TPR =0.7761 and ACC = 0.9473) given the first human expert Ahand-labeled image as reference (benchmark). Table IV showsthe performance of our method against the aforementionedmethods on the DRIVE dataset. Our method needs an overallimprovement of 2.49% and 0.61% in average TPR and averageACC, respectively.
On the other hand, with an average TPR of 0.7512, our methodachieves better performance than all the other methods withrespect to the average TPR value. The average accuracy achievedwith our approach on DRIVE outperforms Jiang et al. [36],Cinsdikici et al. [35], Zana et al. [7], Garg et al. [31], Zhanget al. [29], and Martinez et al. [9]. But it is marginally inferior tothe methods proposed by Al-Rawi et al. [33], Ricci et al. [37],and Mendonca et al. [3], and it is comparable to Soares et al.[30], Marin et al. [28], Niemeijer et al. [34], and Staal et al. [5].
It is important to note that the methods presented by Ricciet al. [37], Soares et al. [30], Marin et al. [28], Niemeijeret al. [34], and Staal et al. [5] used supervised techniques thatgenerally depend on the training datasets; thus to achieve goodresults, classifier retraining is required before performing anyexperimentation on new datasets.
An overview of the testing results on DRIVE shows that ourmethod offers a reliable and robust segmentation solution for

SALAZAR-GONZALEZ et al.: SEGMENTATION OF THE BLOOD VESSELS AND OPTIC DISK IN RETINAL IMAGES 1883
TABLE IVPERFORMANCE COMPARISON IN THE DRIVE DATASET
blood vessels. It is clearly observed that our approach reachesbetter performance in terms of the average TPR.
C. Results of Optic Disk Segmentation on the DIARETDB1and DRIVE Datasets
The performance results of our approach are compared tothe alternative methods: the adaptive morphological approachby Welfer et al. [14], the traditional graph cut technique byBoykov et al. [24], and the topology cut technique proposedby Zeng et al. [38]. Unfortunately, it was not possible to testour method against a large number of alternative methods, sincemost of the methods do use a unique benchmark to measurethe results of the optic disk segmentation; therefore, this makesthe comparison of the results difficult. Further comparison ismade between our two optic disk segmentation methods (thecompensation factor and the MRF image reconstruction). Allthe methods are tested on the same datasets (DIARETDB1 andDRIVE) of 109 fundus retinal images in total, including thosewith a discernable optic disk.
The optic disk segmentation performance is evaluated by theoverlapping ratio Oratio and the mean absolute distance (MAD).The overlapping ratio is defined to measure the common areabetween the optic disk region in the ground truth and the op-tic disk region segmented by our method. It is defined by thefollowing formulation:
Oratio =G
⋂S
G⋃
S(16)
where G represents the true optic disk boundary (manually la-beled region) and S is the optic disk boundary segmented by
Fig. 14. (a) Optic disk segmentation results of DIARETDB1 images: first rowtopology cut, second row graph cut, third row compensation factor algorithm,fourth row MRF image reconstruction algorithm, and fifth row hand labeled.(b) Optic disk segmentation results of DRIVE images: first row topology cut,second row graph cut, third row compensation factor algorithm, fourth row MRFimage reconstruction algorithm, and fifth row hand labeled.
our method. MAD is defined as
MAD (Gc, Sc) =12
{1n
n∑i=1
d(gci , S) +1m
m∑i=1
d(sci , G)
}
(17)where Gc and Sc are the contours of the segmented regionsof the ground truth and our algorithm, respectively. d(ai, B) isthe minimum distance from the position of the pixel ai on thecontour A to the contour B. A good segmentation implies a highoverlapping ratio and a low MAD value.
The sensitivity of our method on DIARETDB1 and DRIVEis defined as
Sensitivity =Tp
Tp + Fn(18)
where Tp and Fn are the number of true positives and thenumber of false negatives, respectively. The sensitivity indicatesthe detection of the Fg pixels by the segmentation method.
Fig. 14(a) and (b) show the optic disk segmentation resultsof topology cut technique [38], traditional graph cut technique[24], and both our methods: the optic disk segmentation withthe compensation factor and the optic disk segmentation withthe MRF image reconstruction on DIARETDB1 and DRIVE,respectively. Considering the ground truth images, it is clearthat both our methods perform better than alternative methods:topology cut technique [38] and traditional graph cut technique[24]. The topology cut technique achieved acceptable resultsin the brighter images, characterized by vessels that are morelikely to belong to the Fg (similar intensity as the optic disk).However, the traditional graph cut technique tends to segmentonly the brightest region of the disk; this is due to the intrusionof the blood vessels in the optic disk region, which misguide thesegmentation algorithm to follow a short path.
Table V shows the performance of our proposed methodswith alternative methods on the DIARETDB1 images. The
1884 IEEE JOURNAL OF BIOMEDICAL AND HEALTH INFORMATICS, VOL. 18, NO. 6, NOVEMBER 2014
TABLE VPERFORMANCE COMPARISON ON THE DIARETDB1 DATASET
TABLE VIPERFORMANCE COMPARISON ON THE DRIVE DATASET
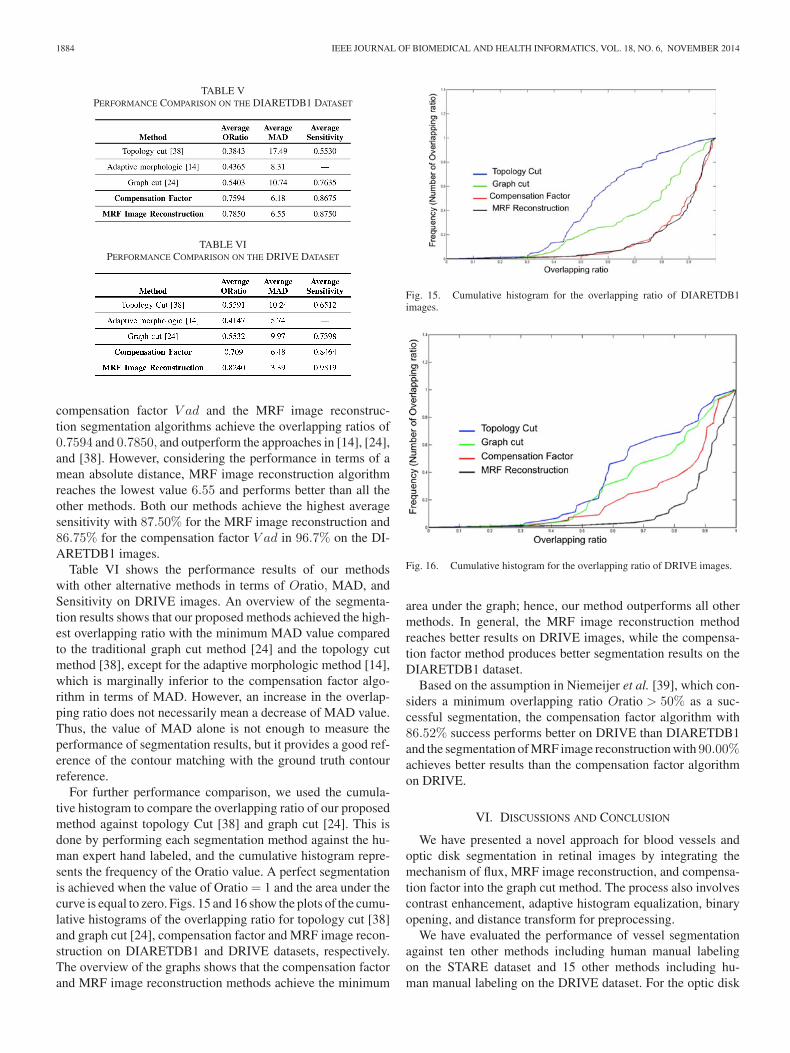
compensation factor V ad and the MRF image reconstruc-tion segmentation algorithms achieve the overlapping ratios of0.7594 and 0.7850, and outperform the approaches in [14], [24],and [38]. However, considering the performance in terms of amean absolute distance, MRF image reconstruction algorithmreaches the lowest value 6.55 and performs better than all theother methods. Both our methods achieve the highest averagesensitivity with 87.50% for the MRF image reconstruction and86.75% for the compensation factor V ad in 96.7% on the DI-ARETDB1 images.
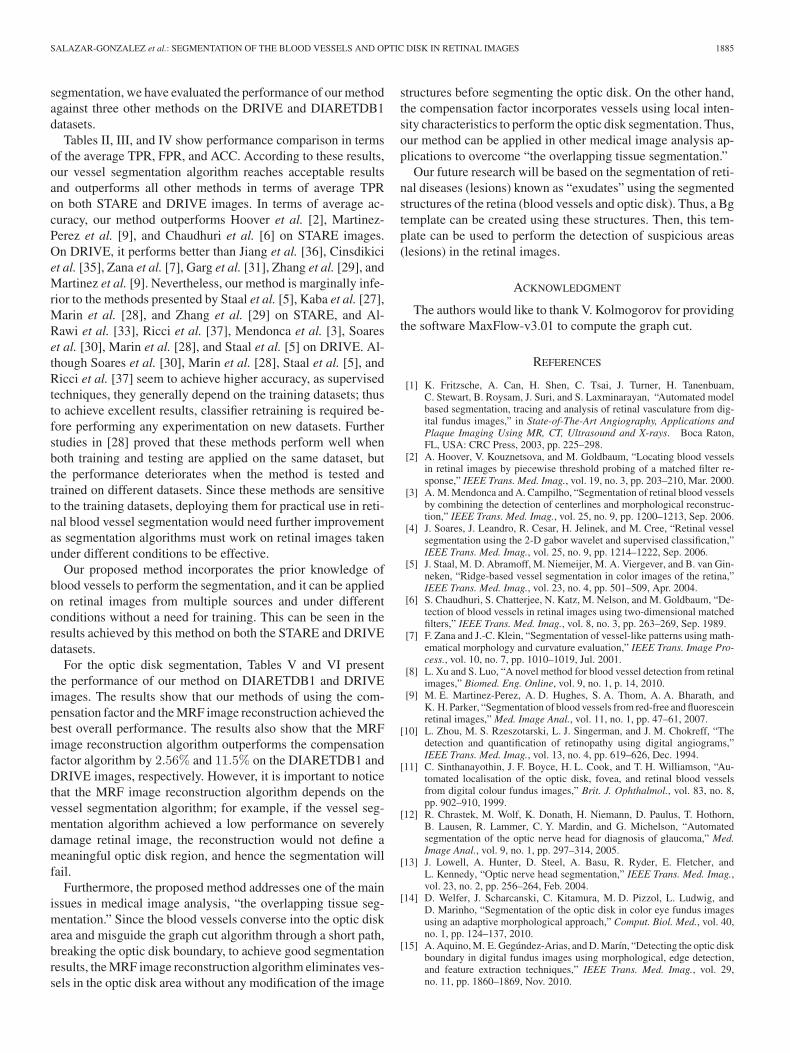
Table VI shows the performance results of our methodswith other alternative methods in terms of Oratio, MAD, andSensitivity on DRIVE images. An overview of the segmenta-tion results shows that our proposed methods achieved the high-est overlapping ratio with the minimum MAD value comparedto the traditional graph cut method [24] and the topology cutmethod [38], except for the adaptive morphologic method [14],which is marginally inferior to the compensation factor algo-rithm in terms of MAD. However, an increase in the overlap-ping ratio does not necessarily mean a decrease of MAD value.Thus, the value of MAD alone is not enough to measure theperformance of segmentation results, but it provides a good ref-erence of the contour matching with the ground truth contourreference.
For further performance comparison, we used the cumula-tive histogram to compare the overlapping ratio of our proposedmethod against topology Cut [38] and graph cut [24]. This isdone by performing each segmentation method against the hu-man expert hand labeled, and the cumulative histogram repre-sents the frequency of the Oratio value. A perfect segmentationis achieved when the value of Oratio = 1 and the area under thecurve is equal to zero. Figs. 15 and 16 show the plots of the cumu-lative histograms of the overlapping ratio for topology cut [38]and graph cut [24], compensation factor and MRF image recon-struction on DIARETDB1 and DRIVE datasets, respectively.The overview of the graphs shows that the compensation factorand MRF image reconstruction methods achieve the minimum
Fig. 15. Cumulative histogram for the overlapping ratio of DIARETDB1images.
Fig. 16. Cumulative histogram for the overlapping ratio of DRIVE images.
area under the graph; hence, our method outperforms all othermethods. In general, the MRF image reconstruction methodreaches better results on DRIVE images, while the compensa-tion factor method produces better segmentation results on theDIARETDB1 dataset.
Based on the assumption in Niemeijer et al. [39], which con-siders a minimum overlapping ratio Oratio > 50% as a suc-cessful segmentation, the compensation factor algorithm with86.52% success performs better on DRIVE than DIARETDB1and the segmentation of MRF image reconstruction with 90.00%achieves better results than the compensation factor algorithmon DRIVE.
VI. DISCUSSIONS AND CONCLUSION
We have presented a novel approach for blood vessels andoptic disk segmentation in retinal images by integrating themechanism of flux, MRF image reconstruction, and compensa-tion factor into the graph cut method. The process also involvescontrast enhancement, adaptive histogram equalization, binaryopening, and distance transform for preprocessing.
We have evaluated the performance of vessel segmentationagainst ten other methods including human manual labelingon the STARE dataset and 15 other methods including hu-man manual labeling on the DRIVE dataset. For the optic disk
SALAZAR-GONZALEZ et al.: SEGMENTATION OF THE BLOOD VESSELS AND OPTIC DISK IN RETINAL IMAGES 1885
segmentation, we have evaluated the performance of our methodagainst three other methods on the DRIVE and DIARETDB1datasets.
Tables II, III, and IV show performance comparison in termsof the average TPR, FPR, and ACC. According to these results,our vessel segmentation algorithm reaches acceptable resultsand outperforms all other methods in terms of average TPRon both STARE and DRIVE images. In terms of average ac-curacy, our method outperforms Hoover et al. [2], Martinez-Perez et al. [9], and Chaudhuri et al. [6] on STARE images.On DRIVE, it performs better than Jiang et al. [36], Cinsdikiciet al. [35], Zana et al. [7], Garg et al. [31], Zhang et al. [29], andMartinez et al. [9]. Nevertheless, our method is marginally infe-rior to the methods presented by Staal et al. [5], Kaba et al. [27],Marin et al. [28], and Zhang et al. [29] on STARE, and Al-Rawi et al. [33], Ricci et al. [37], Mendonca et al. [3], Soareset al. [30], Marin et al. [28], and Staal et al. [5] on DRIVE. Al-though Soares et al. [30], Marin et al. [28], Staal et al. [5], andRicci et al. [37] seem to achieve higher accuracy, as supervisedtechniques, they generally depend on the training datasets; thusto achieve excellent results, classifier retraining is required be-fore performing any experimentation on new datasets. Furtherstudies in [28] proved that these methods perform well whenboth training and testing are applied on the same dataset, butthe performance deteriorates when the method is tested andtrained on different datasets. Since these methods are sensitiveto the training datasets, deploying them for practical use in reti-nal blood vessel segmentation would need further improvementas segmentation algorithms must work on retinal images takenunder different conditions to be effective.
Our proposed method incorporates the prior knowledge ofblood vessels to perform the segmentation, and it can be appliedon retinal images from multiple sources and under differentconditions without a need for training. This can be seen in theresults achieved by this method on both the STARE and DRIVEdatasets.
For the optic disk segmentation, Tables V and VI presentthe performance of our method on DIARETDB1 and DRIVEimages. The results show that our methods of using the com-pensation factor and the MRF image reconstruction achieved thebest overall performance. The results also show that the MRFimage reconstruction algorithm outperforms the compensationfactor algorithm by 2.56% and 11.5% on the DIARETDB1 andDRIVE images, respectively. However, it is important to noticethat the MRF image reconstruction algorithm depends on thevessel segmentation algorithm; for example, if the vessel seg-mentation algorithm achieved a low performance on severelydamage retinal image, the reconstruction would not define ameaningful optic disk region, and hence the segmentation willfail.
Furthermore, the proposed method addresses one of the mainissues in medical image analysis, “the overlapping tissue seg-mentation.” Since the blood vessels converse into the optic diskarea and misguide the graph cut algorithm through a short path,breaking the optic disk boundary, to achieve good segmentationresults, the MRF image reconstruction algorithm eliminates ves-sels in the optic disk area without any modification of the image
structures before segmenting the optic disk. On the other hand,the compensation factor incorporates vessels using local inten-sity characteristics to perform the optic disk segmentation. Thus,our method can be applied in other medical image analysis ap-plications to overcome “the overlapping tissue segmentation.”
Our future research will be based on the segmentation of reti-nal diseases (lesions) known as “exudates” using the segmentedstructures of the retina (blood vessels and optic disk). Thus, a Bgtemplate can be created using these structures. Then, this tem-plate can be used to perform the detection of suspicious areas(lesions) in the retinal images.
ACKNOWLEDGMENT
The authors would like to thank V. Kolmogorov for providingthe software MaxFlow-v3.01 to compute the graph cut.
REFERENCES
[1] K. Fritzsche, A. Can, H. Shen, C. Tsai, J. Turner, H. Tanenbuam,C. Stewart, B. Roysam, J. Suri, and S. Laxminarayan, “Automated modelbased segmentation, tracing and analysis of retinal vasculature from dig-ital fundus images,” in State-of-The-Art Angiography, Applications andPlaque Imaging Using MR, CT, Ultrasound and X-rays. Boca Raton,FL, USA: CRC Press, 2003, pp. 225–298.
[2] A. Hoover, V. Kouznetsova, and M. Goldbaum, “Locating blood vesselsin retinal images by piecewise threshold probing of a matched filter re-sponse,” IEEE Trans. Med. Imag., vol. 19, no. 3, pp. 203–210, Mar. 2000.
[3] A. M. Mendonca and A. Campilho, “Segmentation of retinal blood vesselsby combining the detection of centerlines and morphological reconstruc-tion,” IEEE Trans. Med. Imag., vol. 25, no. 9, pp. 1200–1213, Sep. 2006.
[4] J. Soares, J. Leandro, R. Cesar, H. Jelinek, and M. Cree, “Retinal vesselsegmentation using the 2-D gabor wavelet and supervised classification,”IEEE Trans. Med. Imag., vol. 25, no. 9, pp. 1214–1222, Sep. 2006.
[5] J. Staal, M. D. Abramoff, M. Niemeijer, M. A. Viergever, and B. van Gin-neken, “Ridge-based vessel segmentation in color images of the retina,”IEEE Trans. Med. Imag., vol. 23, no. 4, pp. 501–509, Apr. 2004.
[6] S. Chaudhuri, S. Chatterjee, N. Katz, M. Nelson, and M. Goldbaum, “De-tection of blood vessels in retinal images using two-dimensional matchedfilters,” IEEE Trans. Med. Imag., vol. 8, no. 3, pp. 263–269, Sep. 1989.
[7] F. Zana and J.-C. Klein, “Segmentation of vessel-like patterns using math-ematical morphology and curvature evaluation,” IEEE Trans. Image Pro-cess., vol. 10, no. 7, pp. 1010–1019, Jul. 2001.
[8] L. Xu and S. Luo, “A novel method for blood vessel detection from retinalimages,” Biomed. Eng. Online, vol. 9, no. 1, p. 14, 2010.
[9] M. E. Martinez-Perez, A. D. Hughes, S. A. Thom, A. A. Bharath, andK. H. Parker, “Segmentation of blood vessels from red-free and fluoresceinretinal images,” Med. Image Anal., vol. 11, no. 1, pp. 47–61, 2007.
[10] L. Zhou, M. S. Rzeszotarski, L. J. Singerman, and J. M. Chokreff, “Thedetection and quantification of retinopathy using digital angiograms,”IEEE Trans. Med. Imag., vol. 13, no. 4, pp. 619–626, Dec. 1994.
[11] C. Sinthanayothin, J. F. Boyce, H. L. Cook, and T. H. Williamson, “Au-tomated localisation of the optic disk, fovea, and retinal blood vesselsfrom digital colour fundus images,” Brit. J. Ophthalmol., vol. 83, no. 8,pp. 902–910, 1999.
[12] R. Chrastek, M. Wolf, K. Donath, H. Niemann, D. Paulus, T. Hothorn,B. Lausen, R. Lammer, C. Y. Mardin, and G. Michelson, “Automatedsegmentation of the optic nerve head for diagnosis of glaucoma,” Med.Image Anal., vol. 9, no. 1, pp. 297–314, 2005.
[13] J. Lowell, A. Hunter, D. Steel, A. Basu, R. Ryder, E. Fletcher, andL. Kennedy, “Optic nerve head segmentation,” IEEE Trans. Med. Imag.,vol. 23, no. 2, pp. 256–264, Feb. 2004.
[14] D. Welfer, J. Scharcanski, C. Kitamura, M. D. Pizzol, L. Ludwig, andD. Marinho, “Segmentation of the optic disk in color eye fundus imagesusing an adaptive morphological approach,” Comput. Biol. Med., vol. 40,no. 1, pp. 124–137, 2010.
[15] A. Aquino, M. E. Gegundez-Arias, and D. Marın, “Detecting the optic diskboundary in digital fundus images using morphological, edge detection,and feature extraction techniques,” IEEE Trans. Med. Imag., vol. 29,no. 11, pp. 1860–1869, Nov. 2010.

1886 IEEE JOURNAL OF BIOMEDICAL AND HEALTH INFORMATICS, VOL. 18, NO. 6, NOVEMBER 2014
[16] A. Salazar-Gonzalez, Y. Li, and X. Liu, “Optic disk segmentation by incor-porating blood vessel compensation,” in Proc. IEEE SSCI, Int. WorkshopComput. Intell. Med. Imag., 2011, pp. 1–8.
[17] A. G. Salazar-Gonzalez, Y. Li, and X. Liu, “Retinal blood vessel segmen-tation via graph cut,” in Proc. IEEE 11th Int. Conf. Contr. Autom. Robot.Vis., 2010, pp. 225–230.
[18] A. Salazar-Gonzalez, Y. Li, and D. Kaba, “Mrf reconstruction of retinalimages for the optic disk segmentation,” in Health Information Science.New York, NY, USA: Springer-Verlag, 2012, pp. 88–99.
[19] A. G. S. Gonzalez, “Structure analysis and lesion detection from retinalfundus images,” Ph.D. dissertation, Dept. Comput. Sci., Brunel Univ.,West London, U.K., 2011
[20] D. Wu, M. Zhang, and J. Liu, “On the adaptive detection of blood vesselsin retinal images,” IEEE Trans. Biomed. Eng., vol. 53, no. 2, pp. 341–343,Feb. 2006.
[21] Y. Y. Boykov and M.-P. Jolly, “Interactive graph cuts for optimal boundary& region segmentation of objects in N-D images,” in Proc. IEEE 8thInt. Conf. Comput. Vis., 2001, vol. 1, pp. 105–112.
[22] S. Vicente, V. Kolmogorov, and C. Rother, “Graph cut based image seg-mentation with connectivity priors,” in Proc. IEEE Conf. Comput. Vis.Pattern Recogn., 2008, vol. 1, pp. 1–8.
[23] V. Kolmogorov and Y. Boykov, “What metrics can be approximated bygeo-cuts, or global optimization of length/area and flux,” in Proc. 10thIEEE Int. Conf. Comput. Vis., 2005, vol. 1, pp. 564–571.
[24] Y. Boykov and G. Funka-Lea, “Graph cuts and efficient N-D image seg-mentation,” Int. J. Comput. Vis., vol. 70, no. 2, pp. 109–131, 2006.
[25] A. Efros and T. Leung, “Texture synthesis by non-parametric sampling,”in Proc. IEEE Int. Conf. Comput. Vis, 1999, pp. 1033–1038.
[26] T. Kauppi, V. Kalesnykiene, J. Kamarainen, L. Lensu, I. Sorri, A. Raninen,R. Voitilainen, H. Uusitalo, H. Kalviainen, and J. Pietila, “Diaretdb1 dia-betic retinopathy database and evaluation protocol,” in Proc. Brit. Mach.Vis. Conf., 2007, pp. 1–10.
[27] D. Kaba, A. G. Salazar-Gonzalez, Y. Li, X. Liu, and A. Serag, “Seg-mentation of retinal blood vessels using gaussian mixture models andexpectation maximisation,” in Health Information Science. New York,NY, USA: Springer-Verlag, 2013, pp. 105–112.
[28] D. Marın, A. Aquino, M. E. Gegundez-Arias, and J. M. Bravo, “A newsupervised method for blood vessel segmentation in retinal images byusing gray-level and moment invariants-based features,” IEEE Trans. Med.Imag., vol. 30, no. 1, pp. 146–158, Jan. 2011.
[29] B. Zhang, L. Zhang, L. Zhang, and F. Karray, “Retinal vessel extractionby matched filter with first-order derivative of gaussian,” Comput. Biol.Med., vol. 40, no. 4, pp. 438–445, 2010.
[30] J. V. Soares, J. J. Leandro, R. M. Cesar, H. F. Jelinek, and M. J. Cree,“Retinal vessel segmentation using the 2-D gabor wavelet and supervisedclassification,” IEEE Trans. Med. Imag., vol. 25, no. 9, pp. 1214–1222,Sep. 2006.
[31] S. Garg, J. Sivaswamy, and S. Chandra, “Unsupervised curvature-basedretinal vessel segmentation,” in Proc. IEEE 4th IEEE Int. Symp. Biomed.Imag.: Nano Macro, 2007, pp. 344–347.
[32] R. Perfetti, E. Ricci, D. Casali, and G. Costantini, “Cellular neural net-works with virtual template expansion for retinal vessel segmentation,”IEEE Trans. Circuits Syst. II, Exp. Briefs,, vol. 54, no. 2, pp. 141–145,Feb. 2007.
[33] M. Al-Rawi, M. Qutaishat, and M. Arrar, “An improved matched filterfor blood vessel detection of digital retinal images,” Comput. Biol. Med.,vol. 37, no. 2, pp. 262–267, 2007.
[34] M. Niemeijer, J. Staal, B. van Ginneken, M. Loog, and M. D. Abramoff,“Comparative study of retinal vessel segmentation methods on a newpublicly available database,” in Proc. SPIE Med. Imag. Int. Soc. Opt.Photon., 2004, pp. 648–656.
[35] M. G. Cinsdikici and D. Aydın, “Detection of blood vessels in ophthalmo-scope images using mf/ant (matched filter/ant colony) algorithm,” Com-put. Methods Prog. Biomed., vol. 96, no. 2, pp. 85–95, 2009.
[36] X. Jiang and D. Mojon, “Adaptive local thresholding by verification-based multithreshold probing with application to vessel detection in retinalimages,” IEEE Trans. Pattern Anal. Mach. Intell., vol. 25, no. 1, pp. 131–137, Jan. 2003.
[37] E. Ricci and R. Perfetti, “Retinal blood vessel segmentation using lineoperators and support vector classification,” IEEE Trans. Med. Imag.,vol. 26, no. 10, pp. 1357–1365, Oct. 2007.
[38] Y. Zeng, D. Samaras, W. Chen, and Q. Peng, “Topology cuts: A novelmin-cut/max-flow algorithm for topology preserving segmentation in n-dimages,” J. Comput. Vis. Image Understand., vol. 112, no. 1, pp. 81–90,2008.
[39] M. Niemeijer, M. D. Abramoff, and B. Van Ginneken, “Segmentation ofthe optic disk, macula and vascular arch in fundus photographs,” IEEETrans. Med. Imag., vol. 26, no. 1, pp. 116–127, Jan. 2007.
Ana Salazar-Gonzalez was born in Irapuato, Guana-juato, Mexico, in 1979. She received the B.S. degreein electronics engineering in 2003, and the M.S. de-gree in signal processing from the Universidad deGuanajuato, Guanajuato, Mexico, in 2006. She re-ceived the Ph.D. degree in computer science fromBrunel University, London, U.K, in 2012.
Since 2003, she has been dedicated to the de-sign and development of image processing systems.Her research interests include medical image analy-sis, OCR systems, and image processing for security
documents under different wavelength lights. Currently, she is an Engineer atAccess IS, Reading, U.K., designing and developing OCR systems and proto-cols of validation for security documents (passports, visas, ID cards, drivinglicences, etc.).
Djibril Kaba received the M.Eng. and B.Eng. de-grees in electronics engineering from Kings’ Col-lege University, London, U.K., in 2010. He is cur-rently working toward the Ph.D. degree in the Depart-ment of Computer Science, Brunel University, WestLondon, U.K.
From 2010 to 2011, he worked as a BusinessAnalyst for ITSeven, London, U.K. Since 2011, hehas been a Teaching Assistant in the Department ofComputer Science, Brunel University, London, U.K.His research interests include computer vision, image
processing, pattern recognition, medical image analysis, and machine learning.
Yongmin Li received the M.Eng. and B.Eng. degreesin control engineering from Tsinghua University, Bei-jing, China, in 1990 and 1992, respectively, and thePh.D. degree in computer vision from Queen MaryUniversity of London, London, U.K., in 2001.
Between 2001 and 2003, he worked as a ResearchScientist at the British Telecom Laboratories, Suffolk,U.K. He is currently a Senior Lecturer in the Depart-ment of Computer Science, Brunel University, WestLondon, U.K. His current research interests includeautomatic control, nonlinear filtering, computer vi-
sion, image processing, video analysis, medical imaging, machine learning, andpattern recognition.
Xiaohui Liu received the B.Eng. degree in computingfrom Hohai University, Nanjing, China, in 1982 andthe Ph.D. degree in computer science from Heriot-Watt University, Edinburgh, U.K., in 1988.
He is currently a Professor of computing at BrunelUniversity, West London, U.K., where he directs theCentre for Intelligent Data Analysis, conducting in-terdisciplinary research concerned with the effectiveanalysis of data. He also a Professor of computingat King Abdulaziz Unviersity, Jeddah 21589, SaudiArabia. He is a Charted Engineer, Life Member of
the Association for the Advancement of Artificial Intelligence, Fellow of theRoyal Statistical Society, and Fellow of the British Computer Society. He hasover 100 high quality journal publications in biomedical informatics, complexsystems, computational intelligence, and data mining. His H-index is over 40.
Related Documents


![Automatic Optic Disc Localization in Color Retinal … › acst18 › acstv11n1_01.pdfAutomatic Optic Disc Localization in Color Retinal Fundus Images 3 Abdel-Ghafar et al. [3] developed](https://static.cupdf.com/doc/110x72/5f0bf2757e708231d433013c/automatic-optic-disc-localization-in-color-retinal-a-acst18-a-acstv11n101pdf.jpg)


