KU LEUVEN FACULTEIT BIOMEDISCHE WETENSCHAPPEN BEELDVORMING EN CARDIOVASCULAIRE DYNAMICA Herestraat 49, 3000 Leuven (Belgi¨ e) SEGMENTATIE VAN DE LINKER HARTKAMER IN REAL-TIME 3D ECHOCARDIOGRAFIE Promotors: Prof. dr. Jan D’HOOGE Prof. dr. ir. Olivier BERNARD Examencommissie: Prof. dr. Werner Budts (voorzitter) Prof. dr. ir. Dirk Vandermeulen Prof. dr. ir. Sofie Pollin Prof. dr. ir. Johan G. Bosch Proefschrift voorgedragen tot het behalen van het doctoraat in de Biomedische Wetenschappen door Jo˜ ao PEDROSA Oktober 2018

Welcome message from author
This document is posted to help you gain knowledge. Please leave a comment to let me know what you think about it! Share it to your friends and learn new things together.
Transcript

KU LEUVENFACULTEIT BIOMEDISCHE WETENSCHAPPENBEELDVORMING EN CARDIOVASCULAIRE DYNAMICAHerestraat 49, 3000 Leuven (Belgie)
SEGMENTATIE VAN DE LINKERHARTKAMER IN REAL-TIME 3D
ECHOCARDIOGRAFIE
Promotors:
Prof. dr. Jan D’HOOGEProf. dr. ir. Olivier BERNARD
Examencommissie:
Prof. dr. Werner Budts (voorzitter)Prof. dr. ir. Dirk VandermeulenProf. dr. ir. Sofie PollinProf. dr. ir. Johan G. Bosch
Proefschrift voorgedragen tot hetbehalen van het doctoraat in de
Biomedische Wetenschappen
door
Joao PEDROSA
Oktober 2018

KU LEUVENFACULTY OF BIOMEDICAL SCIENCESCARDIOVASCULAR IMAGING AND DYNAMICSHerestraat 49, 3000 Leuven (Belgium)
LEFT VENTRICULAR SEGMENTATION OFTHE HEART IN REAL-TIME 3D
ECHOCARDIOGRAPHY
Promotors:
Prof. Jan D’HOOGE, PhDProf. Olivier BERNARD, PhD
Examination committee:
Prof. Werner Budts, MD, PhD (chair)Prof. Dirk Vandermeulen, PhDProf. Sofie Pollin, PhDProf. Johan G. Bosch, PhD
Dissertation presented in partialfulfilment of the requirements for
the degree of Doctor inBiomedical Sciences
by
Joao PEDROSA
October 2018

© Katholieke Universiteit Leuven − Faculteit Biomedische WetenschappenHerestraat 49, 3000 Leuven (Belgie)
Alle rechten voorbehouden. Niets uit deze uitgave mag worden vermenigvuldigd en/ofopenbaar gemaakt worden door middel van druk, fotokopie, microfilm, elektronisch of opwelke andere wijze ook, zonder voorafgaande schriftelijke toestemming van de uitgever.
All rights reserved. No part of this publication may be reproduced in any form by print,photoprint, microfilm or any other means without written permission from the publisher.

Acknowledgements
Firstly, I would like to express my gratitude to the institutions that madethis work possible, namely the European Research Council through the EuropeanUnion’s Seventh Framework Program for funding this project and giving me thisopportunity to grow and then also the KU Leuven for receiving me into this greatinstitution which I have grown to love.
Secondly, to all the jury members, thank you for your willingness to devote timeto this work by reading this manuscript and wishing to make it better through yourcomments and questions. I must especially thank Dirk Vandermeulen and SofiePollin for your continuous efforts during this PhD to assess the progress that wasbeing made and discuss what should be the next steps.
Third, to my advisors throughout this project, Jan D’hooge and Olivier Bernard,I cannot thank you enough for your help throughout these four years. Jan, you havestood beside me since day one and it’s been a pleasure to work by your side. Thankyou for giving me the support I needed to believe in myself at the many times Idoubted what I was doing. On the academic world and outside of it you have beenan example through your calm but firm approach to every problem that appeared.To see that what drives you forward (and all of us with you) is the simple almostchildlike desire to know more and show it to others made every challenge that mucheasier. To Olivier Bernard, thank you for the insight you gave throughout this PhDand the many meetings we had. It was always useful to get a look from outside thelab to know what we missed and where to go next. To Daniel Barbosa, thank youfor the BEAS legacy you left me and for the guidance in the first few months of thePhD. In a way, this PhD would have never been possible without you.
Looking back at this PhD it is inevitable to see others in myself and in how I’vefound my way through the challenges that appeared and my family has, more thananyone, made me who I am. The willingness to jump up to every challenge as ameans to grow and help others in the process is perhaps one of the biggest lessonsI have been taught. Thank you for all the love you have given me always and forteaching me how to love others. To my mother, thank you for teaching me so much,about the world and the wonders that fill it from deep down under to the skiesand beyond, for teaching me to love to learn and giving me this burning desire tofind out what lies after the next turn. To my father, thank you for teaching me tofind simple solutions to complex problems and to make things from nothing withmy bare hands and to feel proud on what I had achieved every time. To my sister,
i
ACKNOWLEDGEMENTS
thank you showing me how to find myself and fight for what I believe in. You havebeen there from the very start and I will follow you, always.
To Helena, my partner through every struggle and every conquest, thank youso much for everything. You have carried me every step of the way with a patienceand faith in me I cannot find in myself. I am blessed to receive your love and yourexample of love and care for all those around you is something I can only hope toachieve. You are the most perfect of companions, sending me flying to heights Inever dreamed of and putting my feet on the ground at the same time. Thank youfor launching yourself into this great adventure with me. I can only hope that wewill share many many more, preferably with less than 1485km between us.
To all my colleagues and friends at the Louvre, thank you for all the long daysand nights spent together but also for the fun, the coffee breaks, conferences, winterand summer schools and everything else. To Bidisha, my doctorate sister, I am soproud and lucky to have shared this time in the Louvre with you going through thesame struggles together, laughing, travelling and learning together. To Adriyana,thank you for teaching so much about the world to the innocent privileged boythat I am next to you. To Pedro and Nuno, my home away from home, it wasalways a laugh with both of you from the first day (or night) and I hope we willbump into each other many times back in tiny little Portugal. To Anna, you arethe sunshine! Thank you for all the laughter we shared together. To Brecht, thankyou for teaching me everything about how to be a true Flemish and for giving methe passion for cycling I have found in me. To all of you, to Alejandra, Carolina,Martino, Margot, Raja, Natalia, Mahdi, Hang, Natasa, Antonio, Vangjush, Nadya,Miaomiao, Mahvish, Sandro, Morais, Aravind, Wentao, Alessandro, Olivia, Sofie,Arun, Marta and Helena and also to Jurgen, Monica, Marta, Aniela, Ahmed, Blazejand Razvan and also to Dzemila, I will miss you and remember you always.
To all the friends and wonderful people I was fortunate to meet in Leuven, thankyou for the happiness and experience you brought into my life. To Hanna, Jonasand Robby, thank you for all the moments and dinners we shared, especially duringthe first year. It was difficult but good to see that we all grew beyond ourselves tobecome more than what we were four years ago. To Clarissa, my dearest friend, Iadmire you deeply and you know that I will miss your company the most. Yourpassion for life and all things beautiful really makes you shine and most days it wasjust enough to bask under that warm glow. On the difficult days, remember thathope for something better lies just a warm cozy plate of food away. To Carla, thankyou for all those evenings spent together sharing the pieces of our lives. Thank youfor giving me the strength to push on and believe in myself; you have done muchmore than you might ever imagine. To Oli and Jade, thank you for all the happinessthat comes barging through everytime you are near, thank you for giving me thegift of making the benches together. To all of you and also to Marie, Anaıs, Chiara,Lucıa, Katja and Michiel thank you for enriching my Leuven these four years.
To all of those above and the ones I have forgotten to mention my greatest ofthank you’s!
Joao Pedrosa
ii
Abstract
Left Ventricular Segmentation of the Heart in Real-Time 3D Echocardiography
Cardiovascular diseases account for more deaths than any other cause [1] andare projected to remain the single leading cause of death [2]. Echocardiographyplays a crucial role in clinical cardiology with diagnostic, prognostic and interven-tional value. This is potentiated by its excellent temporal resolution, safety, goodspatial resolution and low cost, making it the cardiac imaging exam of reference indaily practice. Though 2D echocardiography remains the predominant modality forcardiac assessment, 3D echocardiography has the advantage of allowing for a 3Drendering of the anatomical structures thus discarding the need for the geometri-cal assumptions inherent to 2D echocardiography. Nevertheless, the analysis of 3Dimages is challenging and time consuming, fueling the need for software tools thatenable a fast, accurate analysis that reduces the burden on the clinician while atthe same time reducing the inter- and intra observer variability of the clinical in-dices extracted. This thesis aims to address these issues with a number of technicalcontributions from which a fast and robust framework for automatic full cycle 3Dleft ventricular myocardial segmentation emerges. This was possible based on theB-spline Explicit Active Surfaces framework [3], a formulation of Active GeometricFunctions [4] exploring the link between explicit and implicit formulations for imagesegmentation. The starting point for this thesis was a previous implementation ofthis framework for left ventricular segmentation and tracking which proved verypromising, outperforming other state-of-the-art methods. In this thesis, a hybridenergy for segmentation and tracking is introduced, allowing for more accurate fullcycle segmentation; robust left ventricular myocardial segmentation is made possi-ble by an efficient coupling between the endo- and epicardial surfaces; automaticshort axis orientation of the left ventricle is proposed, allowing for additional in-formation to be extracted; a Statistical Shape Model built from cardiac magneticresonance imaging is used to improve the robustness of the segmentation by provid-ing information on the expected shapes of the left ventricle when image informationis low or unreliable. At each step of the development thorough validation of themethods was performed, leading to the final framework for fast, automatic androbust full heart cycle 3D left ventricular myocardial segmentation. This frame-work was then implemented in a user-friendly distributable software application topotentiate its application in future studies. The added value of 3D echocardiogra-phy is further highlighted through a method for myocardial performance mapping
iii

ABSTRACT
through the study of the stress-strain relationships validated against nuclear imag-ing. Finally, the application of the developed framework in real-time is consideredby implementing it in an experimental system for 2D left ventricular segmentationfor anatomical imaging, as to obtain high frame rate imaging and study short livedmyocardial dynamics.
Segmentatie van de Linker Hartkamer in Real-Time3D Echocardiografie
Hart- en vaatziekten zijn verantwoordelijk voor meer sterfgevallen dan enigeandere oorzaak [1] en zullen naar verwachting ook de belangrijkste doodsoorzaakblijven [2]. Echocardiografie speelt een cruciale rol in klinische cardiologie met dia-gnostische, prognostische en interventionele waarde. Dit wordt versterkt door zijnuitstekende temporele resolutie, veiligheid, goede ruimtelijke resolutie en lage kost,waardoor het het cardiale beeldvormingsonderzoek bij uitstek is in de dagelijksepraktijk. Hoewel 2D echocardiografie de meest gebruikte modaliteit blijft voor car-diale beoordeling, heeft 3D echocardiografie het voordeel dat een 3D weergave vande anatomische structuren mogelijk is, waardoor de noodzaak voor de geometrischeaannames inherent aan 2D-echocardiografie wordt weggenomen. Desalniettemin isde analyse van 3D beelden moeilijk en tijdrovend, wat de behoefte aan softwaretools aanwakkert die een snelle, nauwkeurige analyse mogelijk maken. Dit zou dewerk belasting voor de clinicus verminderen, terwijl tegelijkertijd de inter- en intra-waarnemervariabiliteit van de klinische indices verminderen. Dit proefschrift beoogtdeze problemen aan te pakken met een aantal technische bijdragen waaruit een snelen robuust raamwerk voor automatische 3D linkerventrikelmyocardiale segmentatienaar voren komt voor de volledige hartcyclus. Dit was mogelijk op basis van hetB-spline Explicit Active Surfaces raamwerk [3], een formulering van Active Geo-metric Functions [4] met behulp van de koppeling tussen expliciete en implicieteformuleringen voor beeldsegmentatie. Het uitgangspunt voor dit proefschrift waseen eerdere implementatie van dit raamwerk voor linkerventrikel segmentatie entracking, dat veelbelovend bleek te zijn en beter presteerde dan andere state-of-the-art methoden. In dit proefschrift wordt er een hybride energie voor segmentatie entracking geıntroduceerd, waardoor een meer nauwkeurige volledige hartcyclus seg-mentatie mogelijk wordt; robuuste linkerventrikel myocardiale segmentatie wordtmogelijk gemaakt door een efficiente koppeling tussen de endo- en epicardiale op-pervlakken; er wordt een automatische korte as orientatie van de linkerventrikelvoorgesteld, waardoor aanvullende informatie kan worden geextraheerd; een Statis-tical Shape Model gebouwd met behulp van cardiale magnetische resonantie beeld-vorming wordt gebruikt om de robuustheid van de segmentatie te verbeteren doorinformatie te verschaffen over de verwachte vormen van het linkerventrikel wan-neer de beeldinformatie onbetrouwbaar is. Bij elke stap van de ontwikkeling werder een grondige validatie van de methoden uitgevoerd, leidend tot het definitieveraamwerk voor snelle, automatische en robuuste volledige hartcyclus 3D linkerven-trikelmyocardiale segmentatie. Dit raamwerk werd vervolgens geımplementeerd ineen gebruiksvriendelijke, distribueerbare softwareapplicatie om de toepassing er-van in toekomstige studies te vergemakkelijken. De toegevoegde waarde van 3D
iv

ABSTRACT
echocardiografie wordt verder benadrukt door de ontwikkeling van een methode ommyocardiale performantie te verkrijgen door de studie van de stress-strain relatiesdie gevalideerd is tegen nucleaire beeldvorming. Ten slotte wordt het ontwikkelderaamwerk geımplementeerd in een experimenteel systeem voor 2D linkerventrikelsegmentatie in real-time voor anatomische beeldvorming, om beeldvorming met eenhoge beeldsnelheid te verkrijgen en kortstondige myocarddynamiek te bestuderen.
v

ABSTRACT
vi

List of acronyms
1D One dimensional
2D Two dimensional
2DE Two dimensional echocardiography
2S Two-step
3D Three dimensional
4D Four dimensional
AAM Active appearance model
AL-PM Anterolateral-posteromedial
AV Aortic valve
A-P Anterior-posterior
BEAS B-spline explicit active surfaces
cMRI Cardiac magnetic resonance imaging
CRT Cardiac resynchronization therapy
CT Computed tomography
DW Diverging waves
EB Endocardial based
ECG Electrocardiogram
ED End diastole
EDV End diastolic volume
EF Ejection fraction
ES End systole
ESV End systolic volume
FDG-PET 18F-fluorodeoxyglucose positron emission tomography
FOV Field of view
FPGA Field-programmable gate array
FR Frame rate
vii

LIST OF ACRONYMS
HD Hausdorff distance
HTc Hough transform for circles
ICP Iterative closest point
LA Left atrium
lAAOF Localized anatomical affine optical flow
LAx Long-axis
LV Left ventricle
LVOT Left ventricle outflow tract
MA Mitral annulus
MAD Mean absolute distance
MLA Multi-line acquisition
MLT Multi-line transmit
MM Mid-myocardial
MV Mitral valve
NRIR Non-rigid image registration
PET Positron emission tomography
PVA Polyvinyl alcohol
RA Right atrium
ROI Region of interest
RT3DE Real-time three dimensional echocardiography
RV Right ventricle
SAx Short-axis
SNR Signal-to-noise ratio
SPECT Single photon emission computed tomography
SSM Statistical shape model
SV Stroke volume
TEE Transesophageal echocardiography
TTE Transthoracic echocardiography
UN Uncoupled
viii

Contents
Abstract iii
1 Motivation, Objectives and Outline 1
2 Introduction 5
2.1 The Heart . . . . . . . . . . . . . . . . . . . . . . . . . . . . . . . . . 6
2.1.1 Cardiovascular Anatomy and Function . . . . . . . . . . . . . 6
2.1.2 The Left Ventricle . . . . . . . . . . . . . . . . . . . . . . . . 8
2.2 Left Ventricular Assessment . . . . . . . . . . . . . . . . . . . . . . . 9
2.2.1 Prognostic Value in Clinical Practice . . . . . . . . . . . . . . 10
2.2.2 Available Imaging Modalities . . . . . . . . . . . . . . . . . . 10
2.3 Ultrasonic Imaging . . . . . . . . . . . . . . . . . . . . . . . . . . . . 11
2.3.1 Fundamental Physical Concepts . . . . . . . . . . . . . . . . 12
2.3.2 Acquisition System and Image Formation . . . . . . . . . . . 12
2.3.3 High Frame Rate Imaging . . . . . . . . . . . . . . . . . . . . 13
2.3.4 Three-Dimensional Echocardiography . . . . . . . . . . . . . 15
2.4 Echocardiographic Image Analysis . . . . . . . . . . . . . . . . . . . 16
2.4.1 Left Ventricular Segmentation/Tracking Methods . . . . . . . 17
2.4.2 Available Commercial Technology . . . . . . . . . . . . . . . 18
2.4.3 3D Left Ventricular Volume Assessment Validation . . . . . . 20
2.5 Towards Robust Left Ventricular Segmentation . . . . . . . . . . . . 24
2.6 B-spline Explicit Active Surfaces . . . . . . . . . . . . . . . . . . . . 25
2.6.1 Framework Fundamentals . . . . . . . . . . . . . . . . . . . . 25
2.6.2 Energy Formulation . . . . . . . . . . . . . . . . . . . . . . . 25
2.6.3 Algorithm Implementation . . . . . . . . . . . . . . . . . . . 26
2.6.4 Application to 3D Left Ventricular Segmentation . . . . . . . 27
2.7 Concluding Remarks . . . . . . . . . . . . . . . . . . . . . . . . . . . 29
ix

x CONTENTS
I Segmentation Methodologies 33
3 heartBEATS: A Hybrid Energy Approach for Real-Time B-splineExplicit Active Tracking of Surfaces 35
3.1 Introduction . . . . . . . . . . . . . . . . . . . . . . . . . . . . . . . . 36
3.2 Methodology . . . . . . . . . . . . . . . . . . . . . . . . . . . . . . . 38
3.2.1 B-spline Explicit Active Surfaces . . . . . . . . . . . . . . . . 38
3.2.2 Fast left ventricular affine motion estimation . . . . . . . . . 38
3.2.3 Hybrid framework for fast left ventricle tracking . . . . . . . 40
3.2.4 Implementation Details . . . . . . . . . . . . . . . . . . . . . 43
3.3 Experiments and Results . . . . . . . . . . . . . . . . . . . . . . . . . 43
3.4 Discussion . . . . . . . . . . . . . . . . . . . . . . . . . . . . . . . . . 45
3.4.1 Performance comparison . . . . . . . . . . . . . . . . . . . . . 46
3.5 Conclusions . . . . . . . . . . . . . . . . . . . . . . . . . . . . . . . . 48
4 Automatic Short Axis Orientation of the Left Ventricle in 3D Ul-trasound Recordings 49
4.1 Introduction . . . . . . . . . . . . . . . . . . . . . . . . . . . . . . . . 50
4.2 Methodology . . . . . . . . . . . . . . . . . . . . . . . . . . . . . . . 51
4.2.1 Short Axis Orientation . . . . . . . . . . . . . . . . . . . . . . 51
4.3 Experiments . . . . . . . . . . . . . . . . . . . . . . . . . . . . . . . . 52
4.4 Results . . . . . . . . . . . . . . . . . . . . . . . . . . . . . . . . . . . 53
4.5 Discussion . . . . . . . . . . . . . . . . . . . . . . . . . . . . . . . . . 53
4.6 Conclusions . . . . . . . . . . . . . . . . . . . . . . . . . . . . . . . . 56
5 Fast and Fully Automatic Left Ventricular Segmentation and Track-ing in Echocardiography Using Shape-Based B-Spline Explicit Ac-tive Surfaces 57
5.1 Introduction . . . . . . . . . . . . . . . . . . . . . . . . . . . . . . . . 58
5.2 Methodology . . . . . . . . . . . . . . . . . . . . . . . . . . . . . . . 59
5.2.1 B-spline Explicit Active Surfaces . . . . . . . . . . . . . . . . 59
5.2.2 Statistical Shape Model . . . . . . . . . . . . . . . . . . . . . 60
5.2.3 SSM-Based Regularization . . . . . . . . . . . . . . . . . . . . 62
5.2.4 Framework Description . . . . . . . . . . . . . . . . . . . . . 64
5.3 Experiments . . . . . . . . . . . . . . . . . . . . . . . . . . . . . . . . 66
5.3.1 Data Description . . . . . . . . . . . . . . . . . . . . . . . . . 66
5.3.2 Segmentation Performance . . . . . . . . . . . . . . . . . . . 66
x
CONTENTS xi
5.3.3 Position/Orientation Performance and Sensitivity . . . . . . . 67
5.3.4 Parameter Sensitivity Assessment . . . . . . . . . . . . . . . . 67
5.3.5 Statistical Analysis . . . . . . . . . . . . . . . . . . . . . . . . 67
5.4 Results . . . . . . . . . . . . . . . . . . . . . . . . . . . . . . . . . . . 68
5.4.1 Segmentation Performance . . . . . . . . . . . . . . . . . . . 68
5.4.2 Position/Orientation Performance and Sensitivity . . . . . . . 69
5.4.3 Parameter Sensitivity Assessment . . . . . . . . . . . . . . . . 69
5.5 Discussion . . . . . . . . . . . . . . . . . . . . . . . . . . . . . . . . . 69
5.5.1 Segmentation Performance . . . . . . . . . . . . . . . . . . . 70
5.5.2 Position/Orientation Performance and Sensitivity . . . . . . . 71
5.5.3 Parameter Sensitivity Assessment . . . . . . . . . . . . . . . . 71
5.5.4 Limitations and Future Work . . . . . . . . . . . . . . . . . . 72
5.6 Conclusion . . . . . . . . . . . . . . . . . . . . . . . . . . . . . . . . 73
6 Left Ventricular Myocardial Segmentation in 3D Ultrasound Record-ings: Effect of Different Endocardial and Epicardial Coupling Strate-gies 79
6.1 Introduction . . . . . . . . . . . . . . . . . . . . . . . . . . . . . . . . 80
6.2 Methodology . . . . . . . . . . . . . . . . . . . . . . . . . . . . . . . 82
6.2.1 Automatic Initialization . . . . . . . . . . . . . . . . . . . . . 83
6.2.2 B-Spline Explicit Active Surfaces . . . . . . . . . . . . . . . . 83
6.2.3 Coupling Strategies . . . . . . . . . . . . . . . . . . . . . . . 87
6.2.4 Implementation Details . . . . . . . . . . . . . . . . . . . . . 89
6.3 Experiments . . . . . . . . . . . . . . . . . . . . . . . . . . . . . . . . 89
6.3.1 Data acquisition . . . . . . . . . . . . . . . . . . . . . . . . . 89
6.3.2 Data analysis . . . . . . . . . . . . . . . . . . . . . . . . . . . 89
6.3.3 Similarity Metrics . . . . . . . . . . . . . . . . . . . . . . . . 90
6.3.4 Cross-Validation . . . . . . . . . . . . . . . . . . . . . . . . . 91
6.3.5 Parameter Sensitivity Analysis . . . . . . . . . . . . . . . . . 91
6.4 Results . . . . . . . . . . . . . . . . . . . . . . . . . . . . . . . . . . . 92
6.4.1 Comparison of Coupling Strategies . . . . . . . . . . . . . . . 92
6.4.2 Performance of Proposed Coupling Strategy . . . . . . . . . . 94
6.4.3 Parameter Sensitivity Analysis . . . . . . . . . . . . . . . . . 95
6.5 Discussion . . . . . . . . . . . . . . . . . . . . . . . . . . . . . . . . . 97
6.5.1 Comparison of Coupling Strategies . . . . . . . . . . . . . . . 97
xi
xii CONTENTS
6.5.2 Performance of Proposed Coupling Strategy . . . . . . . . . . 97
6.5.3 Parameter Sensitivity Analysis . . . . . . . . . . . . . . . . . 98
6.5.4 Limitations and Future Work . . . . . . . . . . . . . . . . . . 99
6.6 Conclusions . . . . . . . . . . . . . . . . . . . . . . . . . . . . . . . . 100
7 Validation of Automatic 3D Myocardial Segmentation Using Cou-pled Shape-Based B-Spline Explicit Active Surfaces 101
7.1 Introduction . . . . . . . . . . . . . . . . . . . . . . . . . . . . . . . . 102
7.2 Methodology . . . . . . . . . . . . . . . . . . . . . . . . . . . . . . . 103
7.2.1 B-spline Explicit Active Surfaces . . . . . . . . . . . . . . . . 103
7.2.2 Statistical Shape Model . . . . . . . . . . . . . . . . . . . . . 103
7.2.3 Framework Description . . . . . . . . . . . . . . . . . . . . . 105
7.3 Experiments . . . . . . . . . . . . . . . . . . . . . . . . . . . . . . . . 107
7.4 Results . . . . . . . . . . . . . . . . . . . . . . . . . . . . . . . . . . . 108
7.5 Discussion . . . . . . . . . . . . . . . . . . . . . . . . . . . . . . . . . 110
7.6 Conclusion . . . . . . . . . . . . . . . . . . . . . . . . . . . . . . . . 111
II Applications 113
8 Integration of Segmentation Methodologies in a Distributable User-Friendly Software Tool 115
8.1 Introduction . . . . . . . . . . . . . . . . . . . . . . . . . . . . . . . . 116
8.2 Speqle3D . . . . . . . . . . . . . . . . . . . . . . . . . . . . . . . . . 116
8.2.1 3D Myocardial Segmentation . . . . . . . . . . . . . . . . . . 117
8.2.2 2D Myocardial Segmentation . . . . . . . . . . . . . . . . . . 118
8.2.3 3D Mitral Valve Segmentation . . . . . . . . . . . . . . . . . 121
8.3 Conclusion . . . . . . . . . . . . . . . . . . . . . . . . . . . . . . . . 122
9 Non-invasive Myocardial Performance Mapping Using 3D Echocar-diographic Stress-Strain Loops 125
9.1 Introduction . . . . . . . . . . . . . . . . . . . . . . . . . . . . . . . . 126
9.2 Methodology . . . . . . . . . . . . . . . . . . . . . . . . . . . . . . . 127
9.2.1 3D Left Ventricular Myocardial Segmentation . . . . . . . . . 127
9.2.2 Left Ventricular Stress Estimation . . . . . . . . . . . . . . . 128
9.2.3 Myocardial Performance Mapping . . . . . . . . . . . . . . . 128
9.3 Experiments . . . . . . . . . . . . . . . . . . . . . . . . . . . . . . . . 129
xii

CONTENTS xiii
9.4 Results . . . . . . . . . . . . . . . . . . . . . . . . . . . . . . . . . . . 129
9.5 Discussion . . . . . . . . . . . . . . . . . . . . . . . . . . . . . . . . . 129
9.6 Conclusion . . . . . . . . . . . . . . . . . . . . . . . . . . . . . . . . 132
10 Real-Time Anatomical Imaging of the Heart on an ExperimentalUltrasound System 133
10.1 Introduction . . . . . . . . . . . . . . . . . . . . . . . . . . . . . . . . 134
10.2 Methodology . . . . . . . . . . . . . . . . . . . . . . . . . . . . . . . 135
10.2.1 Echocardiographic Acquisition . . . . . . . . . . . . . . . . . 135
10.2.2 Real-time Automatic Segmentation . . . . . . . . . . . . . . . 136
10.2.3 Anatomical Imaging . . . . . . . . . . . . . . . . . . . . . . . 136
10.2.4 Non-rigid Image Registration . . . . . . . . . . . . . . . . . . 137
10.3 Experiments . . . . . . . . . . . . . . . . . . . . . . . . . . . . . . . . 137
10.4 Results . . . . . . . . . . . . . . . . . . . . . . . . . . . . . . . . . . . 138
10.5 Discussion . . . . . . . . . . . . . . . . . . . . . . . . . . . . . . . . . 140
10.6 Conclusion . . . . . . . . . . . . . . . . . . . . . . . . . . . . . . . . 141
11 Final Remarks 143
11.1 Main Contributions . . . . . . . . . . . . . . . . . . . . . . . . . . . . 144
11.1.1 Technical Contributions . . . . . . . . . . . . . . . . . . . . . 144
11.1.2 Applicational/Clinical Contributions . . . . . . . . . . . . . . 146
11.2 Discussion . . . . . . . . . . . . . . . . . . . . . . . . . . . . . . . . . 146
11.3 Conclusion and Future Perspectives . . . . . . . . . . . . . . . . . . 149
A Fully Automatic Assessment of Mitral Valve Morphology from 3DTransthoracic Echocardiography 151
A.1 Introduction . . . . . . . . . . . . . . . . . . . . . . . . . . . . . . . . 152
A.2 Methodology . . . . . . . . . . . . . . . . . . . . . . . . . . . . . . . 153
A.2.1 B-spline Explicit Active Surfaces . . . . . . . . . . . . . . . . 153
A.2.2 Framework Description . . . . . . . . . . . . . . . . . . . . . 154
A.3 Experiments . . . . . . . . . . . . . . . . . . . . . . . . . . . . . . . . 158
A.4 Results . . . . . . . . . . . . . . . . . . . . . . . . . . . . . . . . . . . 159
A.5 Discussion . . . . . . . . . . . . . . . . . . . . . . . . . . . . . . . . . 160
A.6 Conclusion . . . . . . . . . . . . . . . . . . . . . . . . . . . . . . . . 162
Bibliography 162
xiii

xiv CONTENTS
List of publications 189
Acknowledgement, Personal Contribution and Conflicts of Interest 191
xiv

Chapter 1
Motivation, Objectives andOutline
Motivation
Analysis of cardiac function, and specifically of left ventricle (LV) function, isan important part of clinical cardiology for patient management, diagnosis, riskstratification and therapy selection [5–7]. Among the different cardiac imagingmodalities, ultrasound stands out due to its safety, portability, low cost, compet-itive spatiotemporal resolution and real-time capability. While 2D echocardiog-raphy (2DE) remains the predominant modality for cardiac assessment, real-time3D echocardiography (RT3DE) has inherent advantages, namely the imaging ofthe 3D geometry and motion of the heart, which cannot be directly assessed in2DE. Numerous validation studies support the claim that valuable clinical informa-tion can be extracted through RT3DE, based on comparison with the current goldstandard for volumetric assessment, cardiac magnetic resonance imaging (cMRI).Nevertheless, manual 3D image analysis is challenging and time consuming and, toanswer this problem, extensive research towards more automated solutions for LVsegmentation and tracking in RT3DE have been conducted with a similar trend incommercial solutions. In spite of this, at the beginning of this project, there was nosatisfactory software package available that provided fast and fully automatic LVvolume/function assessment in a robust way.
Thesis objectives
The overall goal of this thesis was to investigate and develop novel techniques forLV segmentation in 3D echocardiographic images. The optimal LV segmentationframework should fulfill the following requirements:
1
2 CHAPTER 1. MOTIVATION, OBJECTIVES AND OUTLINE
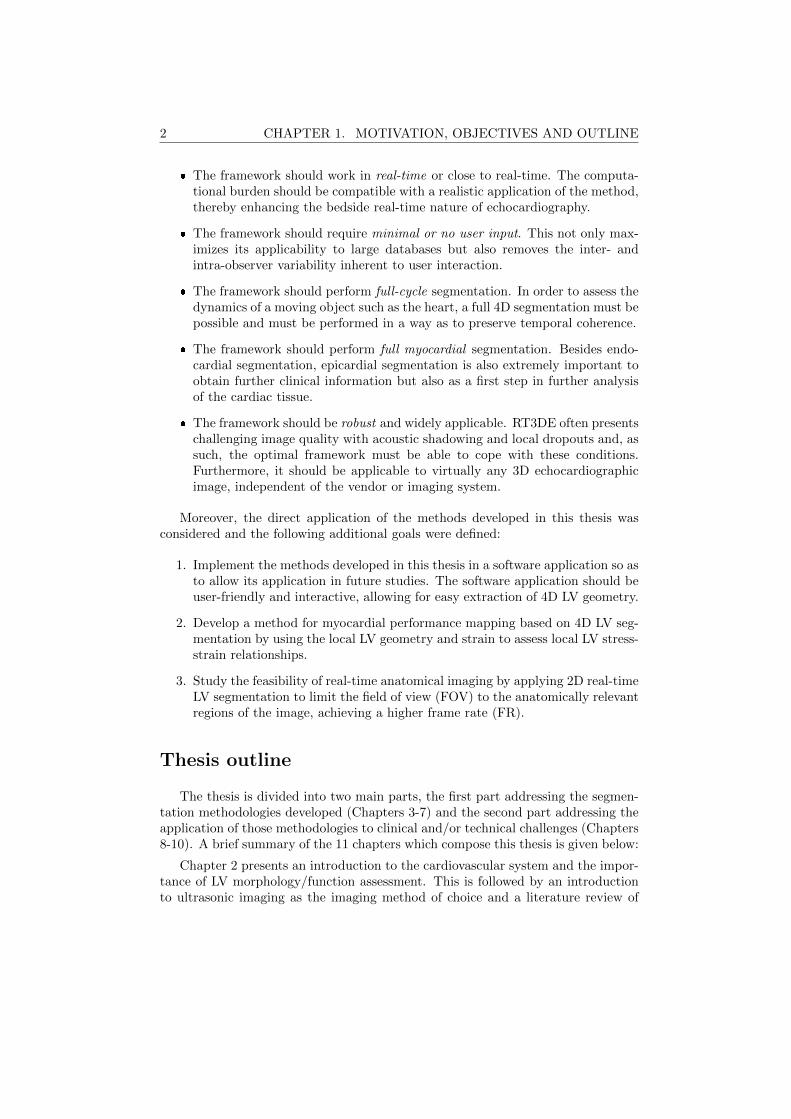
The framework should work in real-time or close to real-time. The computa-tional burden should be compatible with a realistic application of the method,thereby enhancing the bedside real-time nature of echocardiography.
The framework should require minimal or no user input. This not only max-imizes its applicability to large databases but also removes the inter- andintra-observer variability inherent to user interaction.
The framework should perform full-cycle segmentation. In order to assess thedynamics of a moving object such as the heart, a full 4D segmentation must bepossible and must be performed in a way as to preserve temporal coherence.
The framework should perform full myocardial segmentation. Besides endo-cardial segmentation, epicardial segmentation is also extremely important toobtain further clinical information but also as a first step in further analysisof the cardiac tissue.
The framework should be robust and widely applicable. RT3DE often presentschallenging image quality with acoustic shadowing and local dropouts and, assuch, the optimal framework must be able to cope with these conditions.Furthermore, it should be applicable to virtually any 3D echocardiographicimage, independent of the vendor or imaging system.
Moreover, the direct application of the methods developed in this thesis wasconsidered and the following additional goals were defined:
1. Implement the methods developed in this thesis in a software application so asto allow its application in future studies. The software application should beuser-friendly and interactive, allowing for easy extraction of 4D LV geometry.
2. Develop a method for myocardial performance mapping based on 4D LV seg-mentation by using the local LV geometry and strain to assess local LV stress-strain relationships.
3. Study the feasibility of real-time anatomical imaging by applying 2D real-timeLV segmentation to limit the field of view (FOV) to the anatomically relevantregions of the image, achieving a higher frame rate (FR).
Thesis outline
The thesis is divided into two main parts, the first part addressing the segmen-tation methodologies developed (Chapters 3-7) and the second part addressing theapplication of those methodologies to clinical and/or technical challenges (Chapters8-10). A brief summary of the 11 chapters which compose this thesis is given below:
Chapter 2 presents an introduction to the cardiovascular system and the impor-tance of LV morphology/function assessment. This is followed by an introductionto ultrasonic imaging as the imaging method of choice and a literature review of
3
state-of-the-art methods for LV segmentation and tracking, both in research andin commercial software. Finally, the key rationale of the thesis is presented anda detailed description of B-spline Explicit Active Surfaces (BEAS), the segmen-tation framework used throughout this thesis, is given. Chapter 2 is based on apeer-reviewed publication (item 1 of the journal publications on the List of Publi-cations).
Chapter 3 presents a method for hybrid LV segmentation and tracking usingBEAS and anatomical affine optical flow. This method allows for robust full-cyclesegmentation by combining both segmentation and tracking clues in an efficientmanner. Though this framework was initially proposed in the PhD work of DanielBarbosa, the author of this thesis played a determinant role in the finalization andpublication of the validation results obtained. Chapter 3 is based on a peer-reviewedpublication (item 3 of the journal publications on the List of Publications).
Chapter 4 presents a method for short-axis (SAx) orientation of the LV based onthe detection of the right ventricular (RV) insertion point. This orientation allowsfor a point-to-point correspondence between the mesh and the cardiac anatomy,thereby providing information on the orientation of the LV. Chapter 4 is basedon conference proceedings (item 3 of the proceedings publications on the List ofPublications).
Chapter 5 presents a method for LV segmentation and tracking with increasedrobustness by combining BEAS with a statistical shape model (SSM) and the hybridsegmentation/tracking approach used in Chapter 3. The SSM provides LV shapeclues, thus acting as a regularization of BEAS. It is shown that this method outper-forms all currently available state-of-the-art methods on LV endocardial segmenta-tion. Chapter 5 is based on a peer-reviewed publication (item 5 of the internationaljournals listed on the List of Publications).
Chapter 6 addresses one of the fundamental issues in myocardial segmentation- the definition of the two surfaces, i.e. endo- and epicardium, as well as to whichdegree they are connected. For this purpose, different coupling models are testedand an ideal coupling model for myocardial segmentation is proposed. Chapter 6is based on a peer-reviewed publication (item 4 of the journal publications on theList of Publications).
Chapter 7 extends the framework from Chapter 5 to perform LV myocardialsegmentation by taking advantage of the coupling models studied in Chapter 6and applying them with a myocardial SSM. Chapter 7 is based on a peer-reviewedpublication (item 7 of the journal publications on the List of Publications).
Chapter 8 brings the tools developed in the aforementioned chapters together ina user-friendly distributable software application. This allows users to easily applythe developed methods in future studies.
Chapter 9 focusses on the application of the method developed in Chapter 7 toobtain myocardial performance maps. By performing 3D myocardial segmentationand tracking, local geometry and strain are obtained which are used to assess localLV stress-strain relationships, a measure of myocardial work. This method is vali-dated against 18F-fluorodeoxyglucose positron emission tomography (FDG-PET),
4 CHAPTER 1. MOTIVATION, OBJECTIVES AND OUTLINE
the reference method to assess local metabolism clinically. Chapter 7 is based on apeer-reviewed publication (item 7 of the journal publications on the List of Publi-cations).
Chapter 10 investigates the feasibility of in-vivo anatomical scanning in 2DE. A2D version of the framework developed in Chapter 7 is implemented on an exper-imental scanner to perform real-time segmentation. By obtaining information onthe position of the myocardium in the image, the scanning sequence is modified tofocus on the myocardial region only, thus increasing FR. It is shown that a mini-mum FR gain of 1.5 can be obtained without degrading image quality, which couldbe further increased through the use of advanced beamforming techniques. Chapter10 is based on conference proceedings (item 4 of the proceedings publications onthe List of Publications).
Finally, Chapter 11 discusses the contributions of this thesis, including futuredevelopments for the methodologies proposed in this thesis and its future applica-tions.
Appendix A proposes a method for mitral valve (MV) segmentation in transtho-racic echocardiography (TTE). It takes advantage of the LV segmentation frame-work proposed in Chapter 5 to localize the MV in the image and uses BEAS toperform MV segmentation, further refined by the use of an atlas of segmented MVshapes. Appendix A is based on conference proceedings (item 8 of the proceedingspublications on the List of Publications).

Chapter 2
Introduction
Sections of this chapter are based on a paper published in Current Pharmaceutical Design:Pedrosa J., Barbosa D., Almeida N., Bernard O., Bosch J., D’hooge J.. Cardiac ChamberVolumetric Assessment Using 3D Ultrasound - A Review. Curr Pham Des, 2016;22(1):105-21.
5
6 CHAPTER 2. INTRODUCTION
Abstract
This chapter provides a global overview of the main topics covered in this thesis.First, the basic concepts of the cardiovascular system are reviewed, with special em-phasis on the left ventricle (LV). The value of cardiac morphology and function arethen explained, as well as the available imaging modalities. Given the topic of thisthesis, a chapter is dedicated to ultrasonic imaging, starting from its fundamentalconcepts and going into further detail in emerging techniques, namely high framerate (FR) imaging and real-time 3D echocardiography (RT3DE) and their potentialapplications. Finally, the analysis of echocardiographic images is considered in astate-of-the-art review of LV segmentation/tracking methods, both in the researchsetting and the commercial tools available. The validation of these tools and of 3DLV assessment in general is also considered at this point. The final section of thischapter draws on the contextualization from the previous sections to give a finaloverview on the remaining challenges that this thesis addresses.
2.1 The Heart
2.1.1 Cardiovascular Anatomy and Function
The cardiovascular system is an organ system that enables the circulation ofblood and transports nutrients, hormones and cells within the body, providingnourishment but also playing a role in other tasks such as fighting disease andmaintaining homeostasis. It is composed of the heart, blood vessels, blood and thelymphatic system, which circulates lymph [8].
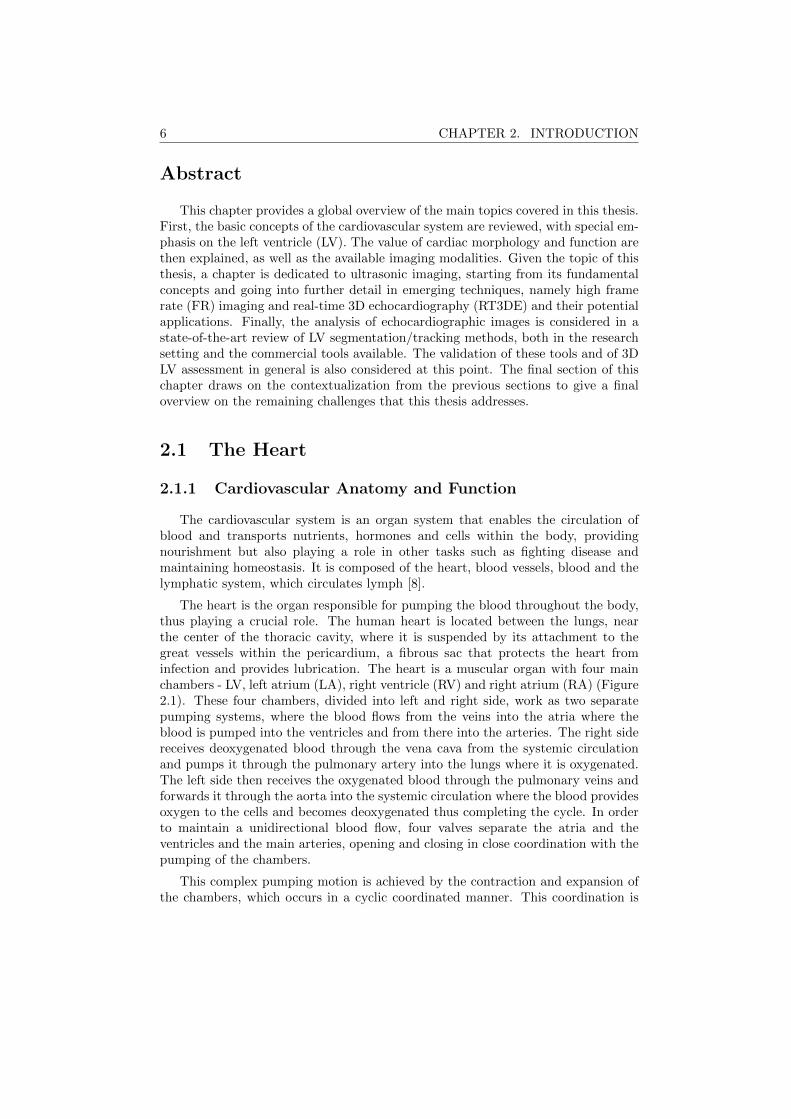
The heart is the organ responsible for pumping the blood throughout the body,thus playing a crucial role. The human heart is located between the lungs, nearthe center of the thoracic cavity, where it is suspended by its attachment to thegreat vessels within the pericardium, a fibrous sac that protects the heart frominfection and provides lubrication. The heart is a muscular organ with four mainchambers - LV, left atrium (LA), right ventricle (RV) and right atrium (RA) (Figure2.1). These four chambers, divided into left and right side, work as two separatepumping systems, where the blood flows from the veins into the atria where theblood is pumped into the ventricles and from there into the arteries. The right sidereceives deoxygenated blood through the vena cava from the systemic circulationand pumps it through the pulmonary artery into the lungs where it is oxygenated.The left side then receives the oxygenated blood through the pulmonary veins andforwards it through the aorta into the systemic circulation where the blood providesoxygen to the cells and becomes deoxygenated thus completing the cycle. In orderto maintain a unidirectional blood flow, four valves separate the atria and theventricles and the main arteries, opening and closing in close coordination with thepumping of the chambers.
This complex pumping motion is achieved by the contraction and expansion ofthe chambers, which occurs in a cyclic coordinated manner. This coordination is
2.1. THE HEART 7
Figure 2.1: The heart and its main anatomical constituents.
assured by the conduction system, making the heart an efficient pump. The sinoa-trial node creates and sustains the cardiac rhythm, generating an action potentialthat is carried radially via Bachmann’s bundle causing the contraction of the LAand RA. From the atrioventricular node the signal is then propagated throughoutthe His-Purkinje network to the ventricles, causing them to contract. The contrac-tion itself is performed by the cardiac muscular tissue, the myocardium, composedof cardiac myocytes arranged into fibers with a complex orientation distributionacross the wall.
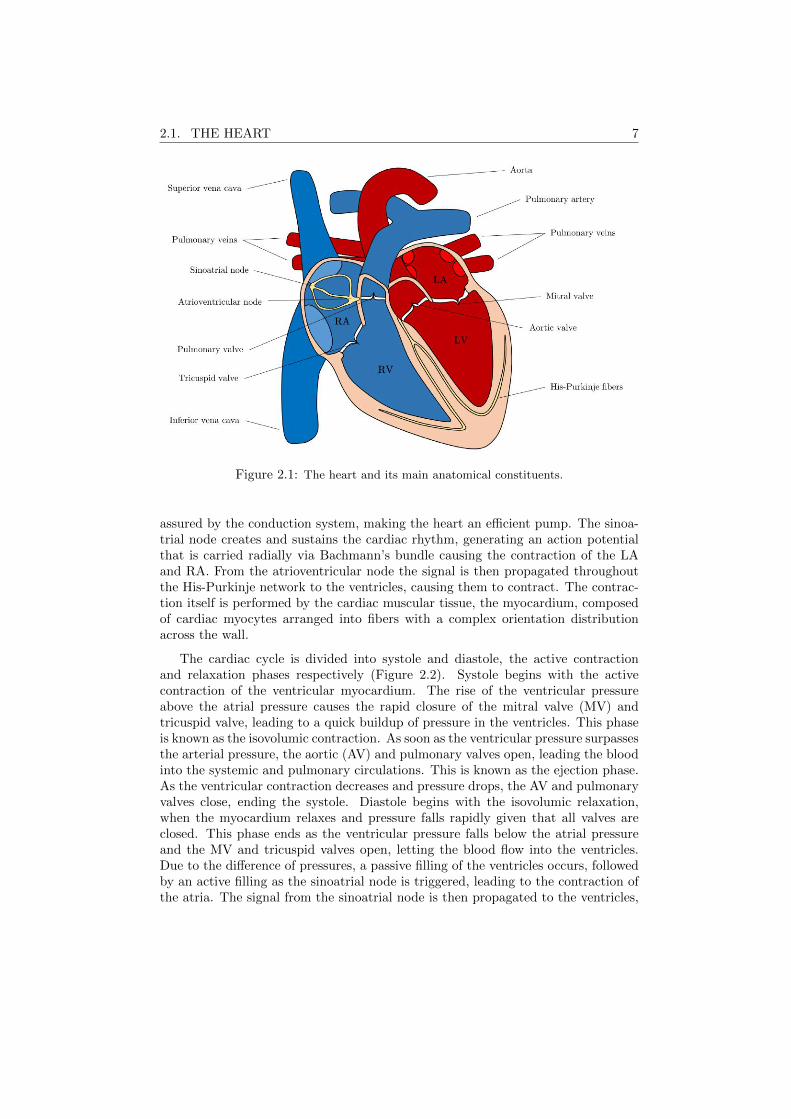
The cardiac cycle is divided into systole and diastole, the active contractionand relaxation phases respectively (Figure 2.2). Systole begins with the activecontraction of the ventricular myocardium. The rise of the ventricular pressureabove the atrial pressure causes the rapid closure of the mitral valve (MV) andtricuspid valve, leading to a quick buildup of pressure in the ventricles. This phaseis known as the isovolumic contraction. As soon as the ventricular pressure surpassesthe arterial pressure, the aortic (AV) and pulmonary valves open, leading the bloodinto the systemic and pulmonary circulations. This is known as the ejection phase.As the ventricular contraction decreases and pressure drops, the AV and pulmonaryvalves close, ending the systole. Diastole begins with the isovolumic relaxation,when the myocardium relaxes and pressure falls rapidly given that all valves areclosed. This phase ends as the ventricular pressure falls below the atrial pressureand the MV and tricuspid valves open, letting the blood flow into the ventricles.Due to the difference of pressures, a passive filling of the ventricles occurs, followedby an active filling as the sinoatrial node is triggered, leading to the contraction ofthe atria. The signal from the sinoatrial node is then propagated to the ventricles,
8 CHAPTER 2. INTRODUCTION
Figure 2.2: Wiggers diagram showing the key events of the cardiac cycle. IVC - Isovolumiccontraction; IVR - Isovolumic relaxation. Adapted under CC BY-SA 4.0. [9]
leading to their contraction and thus restarting the systolic phase.
2.1.2 The Left Ventricle
The LV is one of the chambers of the heart and, perhaps for symbolic reasons asthe driver of the systemic circulation, is by far the most studied both in anatomy,function and pathology. It sits below the LA, separated by the MV at the mitralannulus (MA), and shares the septal wall with the RV (Figure 2.1). Together withthe RV, they form the apex of the heart. The LV connects with the systemic circu-lation through the aorta, separated by the AV. Inside the LV itself, one can identifythe main chamber, as well as the LV outflow tract (LVOT) on the anteroseptal side,which leads to the AV. Due to its role driving the systemic circulation, the LV hasthicker myocardial walls than the remaining chambers to pump blood throughoutthe body. The inner and outer surfaces of the myocardial walls are designated as theendo- and epicardium respectively. Rather than a smooth surface, the endocardiumis covered in rounded irregular muscular columns, the trabeculae, which are thoughtto play a role in hemodynamics. One can also identify the papillary muscles, onthe anterior and posterior walls, which attach to each of the MV’s leaflets throughchordae tendineae and prevent the inversion or prolapse of the MV when pressurein the LV builds up during systole.
2.2. LEFT VENTRICULAR ASSESSMENT 9
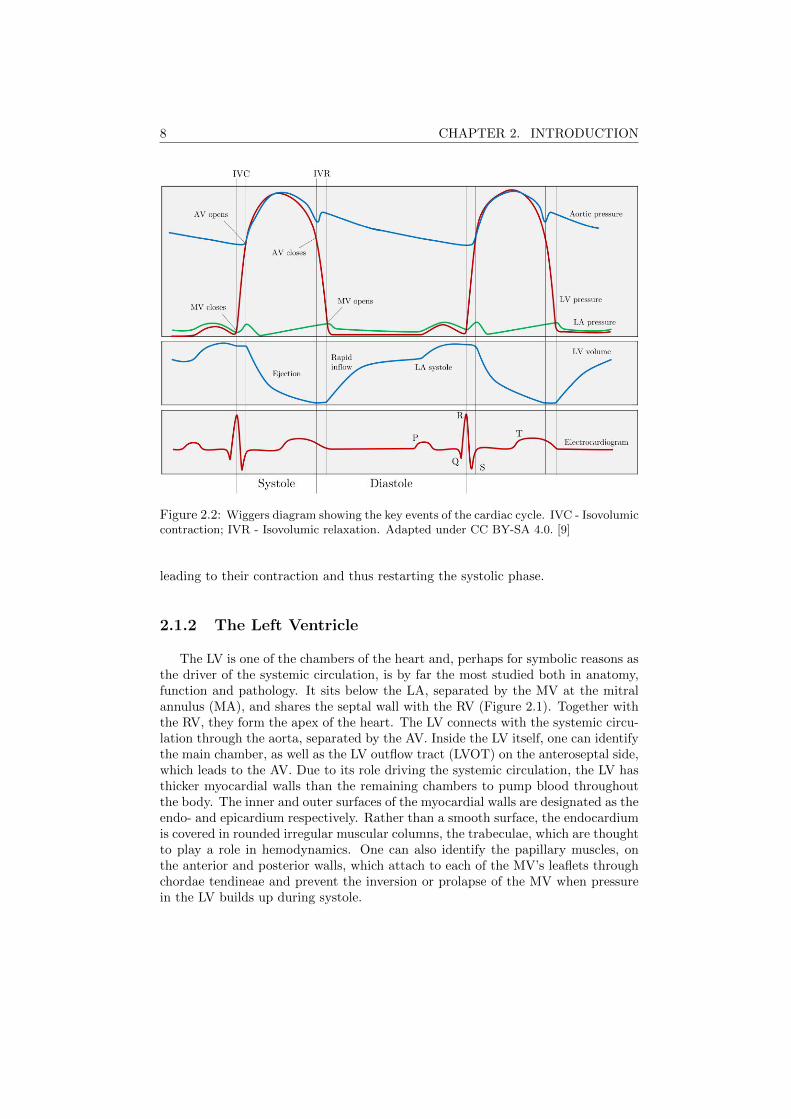
Figure 2.3: 17 segment division of the LV and long axis and short axis views of the LVshowing the location of the different segments.
The LV is commonly divided into 17 different segments (Figure 2.3): longitu-dinally these are divided into the basal, mid-cavity and apical segments and theapical cap and circumferentially into the anterior, anteroseptal, inferoseptal, infe-rior, inferolateral and anterolateral segments [10].
2.2 Left Ventricular Assessment
The current global status of cardiovascular diseases, accounting for more deathsthan any other cause [1] and projected to remain the leading global cause ofdeath [2], makes the assessment of cardiac volume and function a topic of extremeimportance not only in the clinical field for patient diagnosis and follow-up but alsoin research as new therapies are developed and tested.
Besides linear measurements of the LV dimensions such as the LV diameter, themost common indices extracted to characterize both cardiac morphology and globalfunction are those from the volume traces at end diastole (ED) and end systole(ES), namely the ED and ES volumes (EDV and ESV). Furthermore, other cardiacglobal functional indices can be extracted from the volume traces. Stroke volume(SV=EDV-ESV) is the effective amount of blood ejected by a cavity. The LV SV,when multiplied by the heart rate, gives the total cardiac output. As a measure ofpumping efficiency, one can estimate the ejection fraction (EF=(SV/EDV)x100%),as proposed originally by Pombo et al. [11], which is still probably the most widelyused parameter to assess the global status of cardiac function in LV [12].
10 CHAPTER 2. INTRODUCTION
2.2.1 Prognostic Value in Clinical Practice
Extensive research has been directed at determining the prognostic value ofvolumetric indices for different illnesses and conditions. A brief review of some ofthese studies is presented here to illustrate the importance of cardiac volume andfunction assessment. Patient survival after myocardial infarction and its relationto LV function has been thoroughly described in literature. It was first associatedwith LV ESV by White et al. [13] and Norris et al. [14]. In a study by Burns etal., it was shown that LV EF had even a superior prognostic value than LV ESVfor survival after myocardial infarction [15]. Numerous other studies have givenfurther evidence on the prognostic value of LV EF on both short- and long-termsurvival after myocardial infarction [16–20]. Furthermore, LV EF has been linkedto cardiac arrest events [19], heart failure [21], and arrhythmia suppression andcardiac events [22] in survivors of myocardial infarction. More generally, mortalityin patients with coronary artery disease has also been associated with LV EF byBuxton et al. [23].
The prognostic value of LV EF for the mortality in patients with heart failurehas also been a subject of much research as well as controversy with different studiesreaching different conclusions as to which population, preserved or reduced LV EF,represents a higher mortality risk [24,25]. More recently, two meta-analysis studies,one by Somaratne et al. and a second by a large-scale project (MAGGIC), analyzeddata from 17 and 31 studies respectively demonstrating that a higher risk of deathis present in patients with heart failure and reduced LV EF [26,27].
LV function has also been used as a predictor of survival in dilated cardiomy-opathy [28, 29]. Furthermore, LV EF has been associated to mortality in patientswith LV dysfunction [30] and to mortality in end-stage renal disease patients onstarting hemodialysis [31]. Some works have also been dedicated to the study ofstress and post-stress LV volumes. In Sharir et al. post-exercise LV EF and ESVwere associated to cardiac death [32] and in Coletta et al. dobutamine stress testingwas used to link stress LV EDV to cardiac events in patients with coronary heartdisease [33].
2.2.2 Available Imaging Modalities
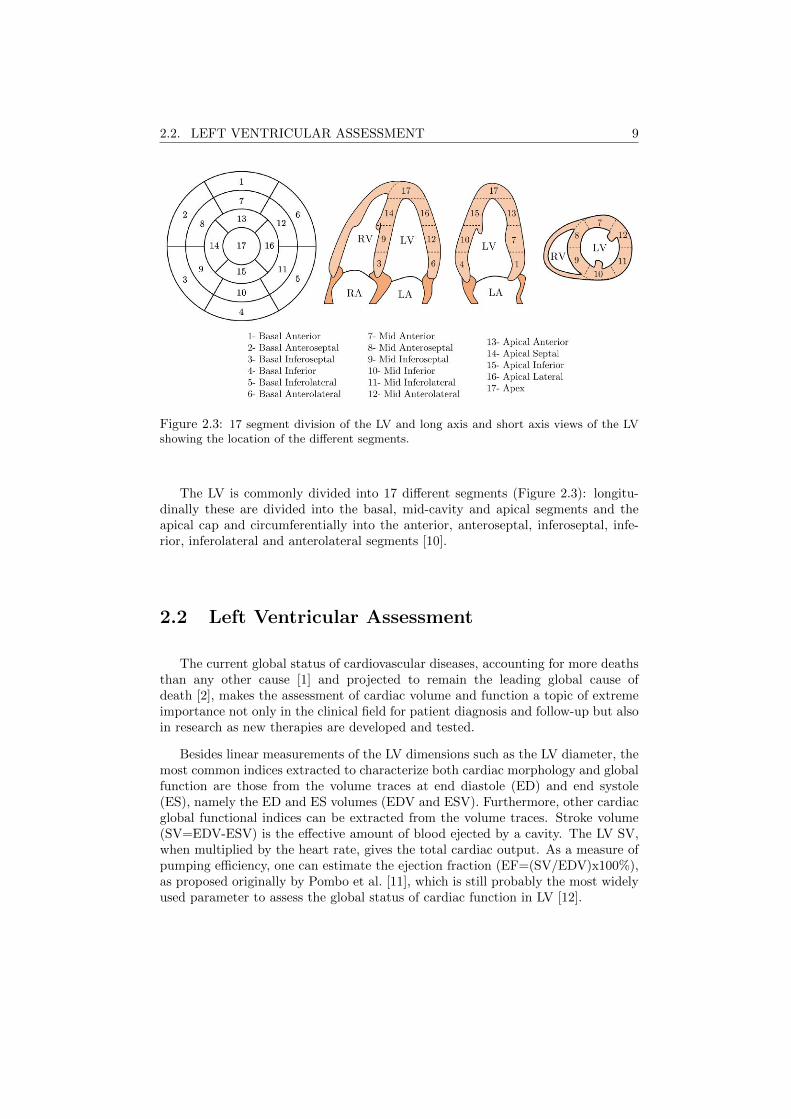
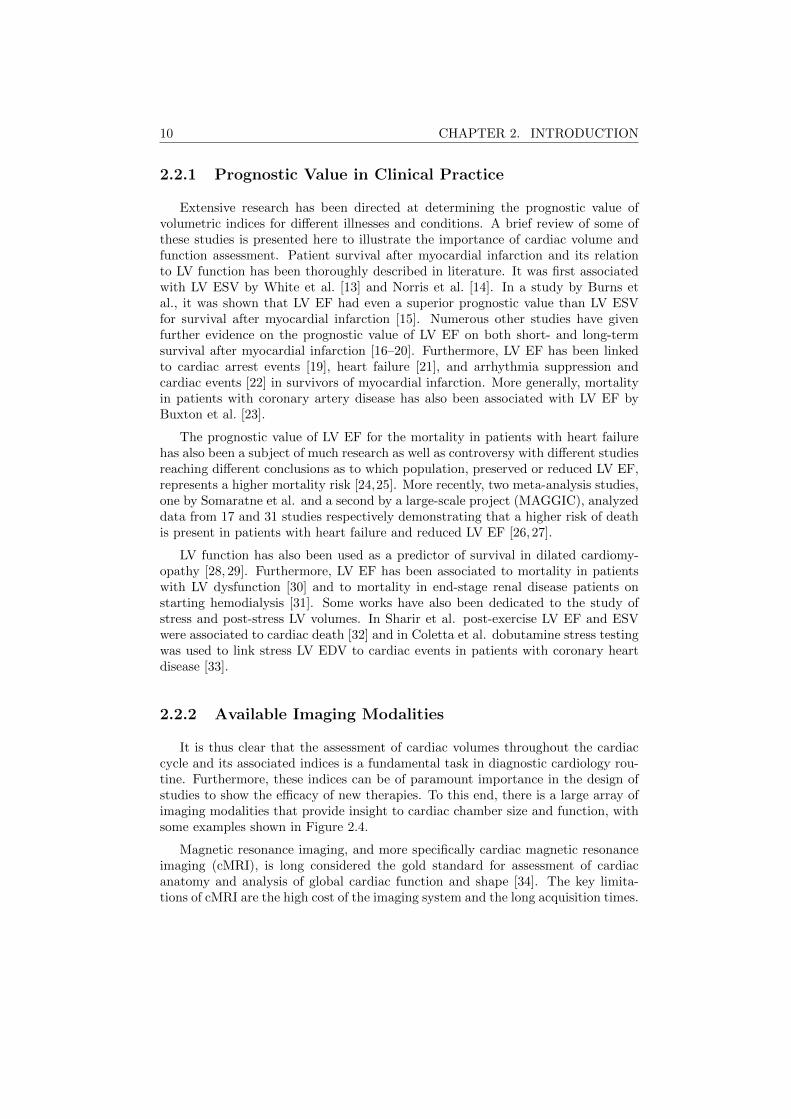
It is thus clear that the assessment of cardiac volumes throughout the cardiaccycle and its associated indices is a fundamental task in diagnostic cardiology rou-tine. Furthermore, these indices can be of paramount importance in the design ofstudies to show the efficacy of new therapies. To this end, there is a large array ofimaging modalities that provide insight to cardiac chamber size and function, withsome examples shown in Figure 2.4.
Magnetic resonance imaging, and more specifically cardiac magnetic resonanceimaging (cMRI), is long considered the gold standard for assessment of cardiacanatomy and analysis of global cardiac function and shape [34]. The key limita-tions of cMRI are the high cost of the imaging system and the long acquisition times.
2.3. ULTRASONIC IMAGING 11
Figure 2.4: Examples of different cardiac imaging modalities: cMRI (a), CT (b), 2DE (c)and RT3DE (d). CT image courtesy of Walter Coudyzer, Department of Radiology, UZLeuven, Belgium.
This last problem is particularly relevant for cardiac imaging, given the fast dynam-ics of a beating heart. Computed tomography (CT) is one of the fastest evolvingimaging modalities. Cardiac CT, which requires the use of contrast agents, offerssuperb definition of the boundary between the myocardium and the blood pool,excellent spatial resolution (<1mm) and good temporal resolution. However, itinvolves exposure to ionizing radiation and is expensive. Other imaging modali-ties used include cardiac single photon emission computed tomography (SPECT)and multiple gated imaging strategies, also known as radionuclide ventriculogra-phy [35, 36], positron emission tomography (PET) [37] and other nuclear imagingtechniques [38]. However, these techniques require the injection of radioactive trac-ers, thus involving exposure to ionizing radiation, and the imaging systems are veryexpensive.
With the exception of standard X-ray exams, ultrasound is the leading imagingmodality worldwide [39]. As key imaging advantages, the excellent temporal res-olution clearly sets echocardiography apart from the remaining modalities. Otherimportant advantages, such as its safety, good spatial resolution and low cost, alsocontribute to the widespread use of echocardiography as the cardiac imaging diag-nostic exam of reference in daily practice.
2.3 Ultrasonic Imaging
The history of medical ultrasound first started during World War I, when mil-itary investment fast-tracked the technology, first as a means for detection of sub-marines and later for nondestructive testing of metals [40]. In the medical field,ultrasound was first applied as a theurapeutic tool in physiotherapy and cancertreatment. It was only in 1942 that ultrasound was first used as a diagnostic tool forbrain tumour localization. Diagnostic ultrasound was then further developed lead-ing to the first 2D grayscale images in the 1950s and the first cardiac examination in1953 by Inge Edler and Carl H. Hertz [41]. Since then, diagnostic ultrasound keptevolving, with the introduction of real time imaging in 1965 and electronic beamsteering in 1968, as well as overall improvements in image quality and acquisitionand processing techniques in the following decades [40].
The use of echocardiography to assess cardiac chamber size and function dates
12 CHAPTER 2. INTRODUCTION
to the advent of this technology. Popp et al. investigated the variation of cardiacdimensions during the cardiac cycle using M-mode echocardiography [42]. Feigen-baum et al. used these changes to assess LV function and correlated it to angiogra-phy [43]. Wyatt et al. showed that volumetric indices extracted from 2D B-modeimages were superior to their M-mode counterparts, especially in asymmetricalhearts [44, 45]. Currently, biplane area assessment using 2DE is the standard toolfor assessment of LV volumetric indices but recent developments in RT3DE haveallowed to entirely visualize the morphology of the cardiac chambers.
2.3.1 Fundamental Physical Concepts
The term ultrasonic refers to sound waves with frequencies above those audibleby humans. This ranges from 20kHz onwards but, typically, medical (non-invasive)ultrasound operates within the 1-20MHz range depending on the application. Ul-trasonic waves are progressive compression waves, which means that the particlesare displaced in a direction parallel to the direction of wave motion. This formsregions of high and low particle density which in turn propagate the wave forwardas the elasticity and inertia of the medium counteract to return the medium’s parti-cles to their original positions [40]. Ultrasonic imaging depends on the interactionsbetween the tissue and the propagating ultrasonic wave.
As the ultrasonic wave travels through the tissue, it meets a multitude of differentstructures which lead to different phenomena. When a wave meets the boundarybetween two media of different density and/or sound velocity, part of the energy ofthe wave is reflected and the remaining is refracted through the boundary into thesecond media. The reflection/transmission ratio depend on the acoustic impedancesof the two media, where mismatched acoustic impedances lead to a high reflection ofthe ultrasonic wave. While a perfectly smooth boundary will cause a pure specularreflection, where the reflected wave has a single direction, this is usually not thecase and irregularities at the boundary will lead to a diffuse reflection in a widerange of directions. Furthermore, tissue inhomogeneities due to local variations ofdensity and/or compressibility cause similar diffuse reflections - scattering. It isthis property that gives ultrasound its particular grainy appearance, called speckle,which reflects the inhomogeneous nature of each of the tissues in the image.
However, as the ultrasonic wave travels through the tissue, there is a loss ofacoustic energy mainly due to the conversion of acoustic energy into heat. Thisattenuation causes the wave amplitude to decay exponentially as it travels, thuslimiting the depth to which imaging is possible. Finally, nonlinear distortion mayoccur for high amplitude ultrasonic waves due to the nonlinear mechanic charac-teristics of the medium, changing the original shape of the transmitted ultrasonicpulse as it travels through the tissue.
2.3.2 Acquisition System and Image Formation
Typically, ultrasonic waves are generated by means of a piezoelectric crystal,which, when excited with an oscillating electric field, expand and contract at the
2.3. ULTRASONIC IMAGING 13
same frequency as the electrical field creating a compression wave. This very samephenomenon is used to receive the signal, where compression waves that hit thepiezoelectric crystal are converted into an electrical field. The concept of pulse-echois thus typically used in medical ultrasound where the same transducer, composedof an array of piezoelectric crystals, is used to first transmit the ultrasonic pulseand then receive its reflections as it travels through the tissue.
The electrical field generated by the piezoelectric crystal can then be amplified,filtered and converted to a digital signal. Envelope detection is then performed tothe raw data obtained to remove the high frequency oscillations and the amplitudeis corrected for the attenuation effects, a process known as time gain compensation.Usually, the signal is then log-compressed to decrease the differences in amplitudebetween the specular and scatter reflections, which gives additional informationon the tissue texture. Such a pipeline provides the simplest ultrasound imagingmode, the A-mode (for amplitude), where the magnitude along a single direction isacquired and plotted as a function of depth, and subsequently overwritten. If thetransducer is static and multiple A-lines are acquired at subsequent time points,the signals obtained can then be plotted in 2D, with depth and time as dimensions,providing an insight into the motion of tissue in time. This is known as M-mode(for motion).
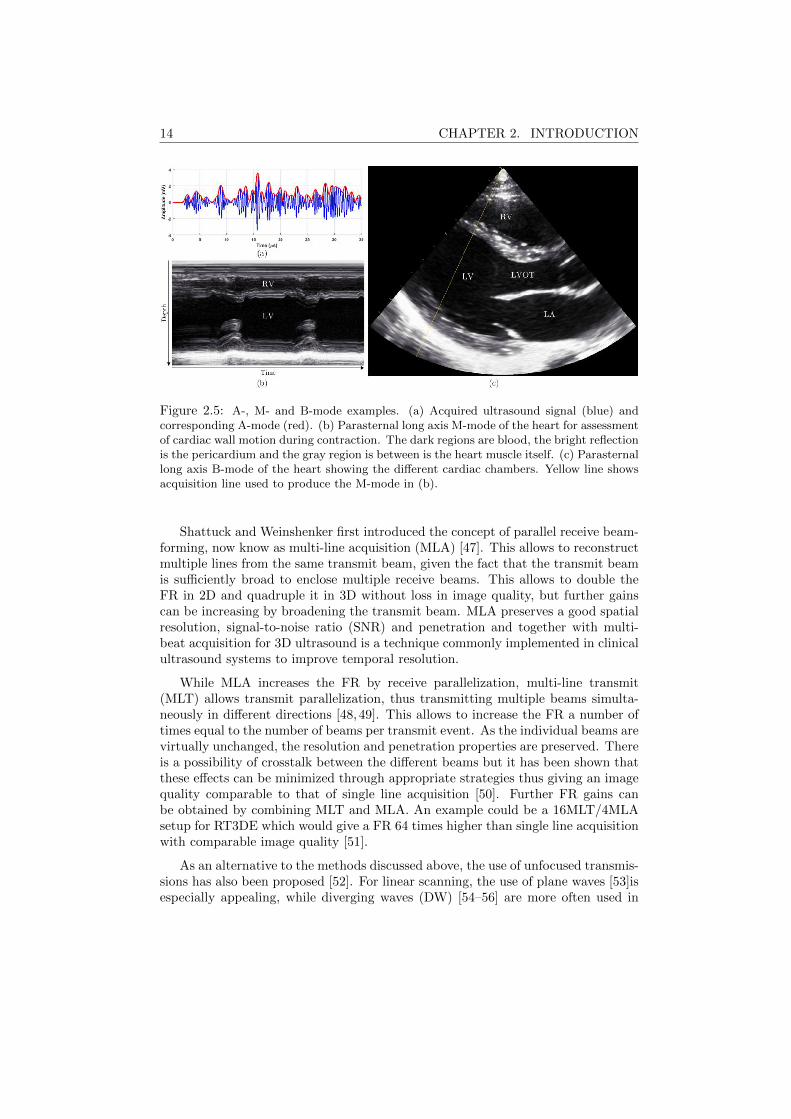
To obtain a 2D ultrasound image, multiple A-lines have to be acquired succes-sively from different directions, forming the B-mode. This can be done by trans-lating or tilting the transducer mechanically but is usually performed by changingthe transmit profile along the different piezoelectric crystals in the transducer. Inechocardiography applications, where the imaging window is relatively narrow dueto the position of the ribs, this is typically done by introducing delays to the trans-mits of each piezoelectric crystal such that the beams are steered from one side tothe other. Because this process provides A-lines in a polar grid, a final interpolationis needed to obtain the 2D cartesian image. An example of an A-, M- and B-modeare shown in Figure 2.5.
2.3.3 High Frame Rate Imaging
Given that conventional B-mode acquisition relies on single line acquisition,where each beam direction is acquired at a time, there is an intrinsic trade-offbetween temporal resolution and the number of lines acquired (and thus spatialresolution). As such, improving the temporal resolution through advanced beam-forming techniques has long been an active topic of research in the field. Multipletechniques have thus been proposed which enable an increase in temporal resolutionwith more or less impact on spatial resolution and image contrast.
A straightforward method to improve temporal resolution is to perform a multi-beat acquisition. This strategy consists in dividing the whole image into differentsections and acquiring each of those sections in a consecutive number of beats [46].This technique depends however on the patient having a stable heartbeat and keep-ing a breathhold during the whole acquisition which might not be straightforwardfor some patients.
14 CHAPTER 2. INTRODUCTION
Figure 2.5: A-, M- and B-mode examples. (a) Acquired ultrasound signal (blue) andcorresponding A-mode (red). (b) Parasternal long axis M-mode of the heart for assessmentof cardiac wall motion during contraction. The dark regions are blood, the bright reflectionis the pericardium and the gray region is between is the heart muscle itself. (c) Parasternallong axis B-mode of the heart showing the different cardiac chambers. Yellow line showsacquisition line used to produce the M-mode in (b).
Shattuck and Weinshenker first introduced the concept of parallel receive beam-forming, now know as multi-line acquisition (MLA) [47]. This allows to reconstructmultiple lines from the same transmit beam, given the fact that the transmit beamis sufficiently broad to enclose multiple receive beams. This allows to double theFR in 2D and quadruple it in 3D without loss in image quality, but further gainscan be increasing by broadening the transmit beam. MLA preserves a good spatialresolution, signal-to-noise ratio (SNR) and penetration and together with multi-beat acquisition for 3D ultrasound is a technique commonly implemented in clinicalultrasound systems to improve temporal resolution.
While MLA increases the FR by receive parallelization, multi-line transmit(MLT) allows transmit parallelization, thus transmitting multiple beams simulta-neously in different directions [48, 49]. This allows to increase the FR a number oftimes equal to the number of beams per transmit event. As the individual beams arevirtually unchanged, the resolution and penetration properties are preserved. Thereis a possibility of crosstalk between the different beams but it has been shown thatthese effects can be minimized through appropriate strategies thus giving an imagequality comparable to that of single line acquisition [50]. Further FR gains canbe obtained by combining MLT and MLA. An example could be a 16MLT/4MLAsetup for RT3DE which would give a FR 64 times higher than single line acquisitionwith comparable image quality [51].
As an alternative to the methods discussed above, the use of unfocused transmis-sions has also been proposed [52]. For linear scanning, the use of plane waves [53]isespecially appealing, while diverging waves (DW) [54–56] are more often used in
2.3. ULTRASONIC IMAGING 15
cardiac applications to match the sector scan geometry. DWs use the full trans-ducer array to create a wave that insonifies the whole volume at once, thus allowingto reconstruct a full volume in a single transmission. This comes, however, at theexpense of lateral resolution, SNR and penetration, as well as possible side lobeissues. For these reasons, coherent compounding of DWs is usually performed bycombining insonifications with different orientations [57]. Motion of the probe orthe tissue being imaged can however be problematic if a high number of transmis-sions are compounded and motion correction has been proposed to compensate thiseffect [58].
Besides offsetting the trade-off between spatial and temporal resolution, thusimproving the imaging of dynamic structures such as the heart, increasing the tem-poral resolution would undoubtedly find multiple applications in clinical cardiologyof both diagnostic and prognostic value and an extensive review on this topic canbe found in [59] and [60]. Motion and deformation imaging in 3D and with hightemporal resolution can be especially interesting to get a full 3D contextual infor-mation of cardiac events, especially short lived ones [61]. Electromechanical waveimaging is such an example where following local myocardial motion/deformationas the myocardium depolarizes and begins to contract, would provide informationabout the cardiac activation sequence and allow to build electroanatomical mapsnon-invasively [62,63].
2.3.4 Three-Dimensional Echocardiography
While 2D B-mode remains the predominant modality for cardiac assessment,the fact that it is a 2D slice of a 3D anatomical structure makes it an inherentlyflawed diagnostic tool [64]. First, because the fact that only a 2D slice is obtainedat a time means that to make any statement about the 3D anatomy, strong geomet-rical assumptions must be made which inevitably lead to innacuracies. Moreover,attempts at mentally transforming a series of 2D slices to get a 3D impression of astructure are extremely subjective and innefficient. Secondly, the fact that a par-ticular 2D slice for analysis must be chosen from a 3D structure is problematic initself. Finding the correct anatomical slice can be difficult and foreshortening - slic-ing the heart obliquely so that not the whole length of the LV is represented - leadsto wrong geometrical assumptions. Even with a definition of standard anatomicalviews, it is challenging, at best, to obtain the same image plane at different pointsin time, thus making it difficult to make exact statements on the evolution of agiven structure over time. In comparison, the acquisition of 3D ultrasonic imagingwould give access to the full geometry of the heart thus solving the aforementionedlimitations.
Dekker et al. [65] were the first to scan the human heart in 3D by using arobotic arm to move a transducer with five degrees of freedom. Later attemptsrelied on 1D transducer arrays moved mechanically to obtain multiple 2D imageplanes which could then be rendered into a single 3D volume [66–71]. However itwas with the development of 2D matrix transducers, enabling 3D electronic steeringin the seminal work of S. Smith, H. Pavy, and O. von Ramm [72, 73], that the
16 CHAPTER 2. INTRODUCTION
technology was able to mature. Further advances in design and engineering led tothe commercialization of RT3DE technology [74].
Nevertheless, due to the intrinsic trade-off between temporal and spatial reso-lution in ultrasound, RT3DE acquisition is often challenging. In fact, to acquire avolume encompassing the whole heart a volume of 75°x75°with a 15cm range is typ-ically required. For adequate lateral resolution, approximately 85x85 lines wouldbe required and for each line the sound must travel twice the 15cm range. Thisthen means that a single volume would take 1.4 seconds, giving a FR of 0.7Hz.While this value is clearly insufficient to assess a dynamic organ such as the heart,different strategies can be implemented to improve FR. First of all, the field of view(FOV) can be decreased to encompass only the structure of interest. However, thatmight not be possible, especially in the case of dilated hearts. Secondly, the linedensity can be decreased, which however degrades the overall image quality. Third,a multi-beat acquisition can be performed, a strategy implemented in most clini-cal scanners. Finally, any of the advanced beamforming techniques mentioned forhigh frame rate imaging might be used to offset the trade-off between spatial andtemporal resolution, thereby increasing the FR in RT3DE.
Furthermore, the fact that 2D probes present a larger footprint makes the ac-quisition more challenging as the intercostal space varies between patients and canobstruct the ultrasound path. The processing of RT3DE data is also a challenge asmanual contouring of 3D data is time consuming and automatization has only re-cently been made available in commercial solutions. The intrinsic more challengingacquisition and processing of the data has thus led to a delay of the introduction ofRT3DE to clinical practice.
In spite of the limitations of RT3DE, the fact that the 3D anatomy of the heartcan be assessed without assumptions directly translates into increased agreement ofRT3DE against the current gold-standard method (i.e. cMRI) when compared toconventional 2DE. Summing this to the intrinsic advantages of ultrasound imagingagainst other modalities and the continuous technical advances in both image ac-quisition and processing, RT3DE will likely become the standard echocardiographicexamination of the future.
2.4 Echocardiographic Image Analysis
Additionally to the imaging acquisition, the extraction of the relevant informa-tion from the data must be considered. The assessment of volumetric, functionaland morphologic indices poses two main problems. First, a clear identification ofthe myocardial anatomy is needed, through the delineation of the endo- and epicar-dial surfaces at a given time point. Furthermore, the position of these boundariesthroughout the cardiac cycle is needed to recover the underlying motion of thecardiac chamber and capture the volume changes. However, ultrasound image pro-cessing poses several challenges [75]. The image quality is strongly affected by theacquisition conditions which can lead to low SNR and different artifacts such asdropouts resulting in missing boundaries. Furthermore, the very contrast between
2.4. ECHOCARDIOGRAPHIC IMAGE ANALYSIS 17
structures of interest is often low. The inherent speckle pattern of ultrasound imagecan also be a confounder. Moreover, the manual delineation of boundaries in 3Ddata is a cumbersome and time-consuming task, making the introduction of semi-or fully automated cardiac image processing methods of great importance.
2.4.1 Left Ventricular Segmentation/Tracking Methods
Several methods have thus been proposed to address these problems and a cate-gorization of these methods is possible dividing into geometrical models, shape-freemethods, statistical models, classification approaches and tracking [76]. Each ofthese categories is briefly described in this section. For a more comprehensive de-scription of these methods, the interested reader can refer to the extensive reviewby Leung and Bosch [76].
Geometrical models are the most common border detection approaches and con-sist of the representation of a border in terms of a curved surface influenced bygeometrical constraints. This surface is initialized interactively or automaticallyand evolves iteratively according to image features such as the local intensity oredge information. Most geometrical models use energy-based optimization where amathematical energy function is defined according to the image features and otherregularization terms and optimized iteratively [3, 77–81]. Given the surface rep-resentation that is used, the main disadvantage of these models lies in finding abalance between a surface that is too smooth and one that becomes implausible.
Shape-free methods are, as the name implies, methods with little or no depen-dency on the shape of the final object. As such, they are heavily dependent onlow-level image information such as pixel intensity, gradients, edges and cornersand motion vectors. The two main families with this category are clustering andlevel sets. Clustering is, simply put, a categorization of each pixel of the image intogroups, for example myocardial tissue and blood pool [82–85]. Level sets are similarto geometrical models with the main difference that the shape of the object is notrestricted, which can often result in multiple disconnected surfaces [86–90]. Due tothe low level of shape restrictions imposed, these techniques are quite susceptibleto image artifacts such as shadowing or dropouts.
Statistical models are population based methods that model the statistical vari-ations of patient data according to borders manually contoured by experts. Thisis done by finding a relatively simple mathematical model with but a few param-eters that can express the patient variability from an average. By varying theseparameters one can then synthesize a large number of shapes. Different sourcesof information can be used to build such a model. Active shape models use themanually contoured borders [91–93], whereas active appearance models (AAM) usea combination of the manually contoured borders and the image intensity infor-mation [94–96]. Given their origin from real examples this method can only findplausible results. However, this is also its downfall as the accuracy of the modelwill always be dependent on the quality of the original database and its extensionthroughout both healthy and pathological populations.
18 CHAPTER 2. INTRODUCTION
Classification approaches are also dependent on large sets of data contoured byexperts, with however a different approach than statistical models [97–100]. Ac-cording to the database information, a classifier is trained to distinguish the objectsof interest into classes using appropriate features. In practice, parts of an imageare then classified by selecting regions of different sizes in the image in differentpositions and determining its class following a coarse-to-fine scheme. Though thetraining procedure is extremely time consuming, the detection can be very fast.Classification approaches suffer from the same disadvantage as statistical modelsdue to its dependency on the original database. However, even larger datasetsare typically needed than for statistical models. Recently, classification approacheshave received increasingly more attention following the advent of machine learn-ing and deep learning techniques. The continuous increase in computational powerand data storage have increased the feasibility of these methods and it should beexpected that, as in other computer vision problems, these methods should in thefuture prove very effective given their direct access to a wide range of data.
Finally, tracking approaches are the most different from the other approaches asthey do not aim at the border detection itself but at the estimation of the motionof an object throughout time. Thus, tracking approaches have a more dynamicnature. Since tracking approaches are mostly dependent on image information suchas pixel intensity, the results can be especially sensitive to the presence of artifacts.This makes the introduction of information such as cardiac motion patterns par-ticularly interesting. The existing tracking approaches are usually based on eitherregistration or speckle tracking. In registration approaches the spatial correspon-dence between sequential images is found by measuring and optimizing a measure ofsimilarity between them [79, 101–104]. Speckle tracking approaches aim at findinga correspondence between speckle patterns throughout time [105–113].
Given the many different approaches proposed in literature, it can be extremelyoverwhelming to draw conclusions over which segmentation tools seem to be thebest and most promising. As such, benchmarking efforts such as the one recentlypublished in Bernard et al. [114] are extremely important. By providing a thor-ough and equal validation to all segmentation methods, a just comparison can beperformed and conclusions drawn over the evaluated strategies. In the study byBernard et al., B-spline Explicite Active Surfaces (BEAS) [115] was the most accu-rate automatic segmentation tool both in distance metrics but also in the clinicalindices evaluated. In terms of computational time, it was also one of the fastestmethods, surpassed only by the Kalman filtering method by Smistad et al. [116]. Itis also worth noting that the shape information or modelling provided to the seg-mentation model seems to play a big role in determining the behaviour of a givensegmentation tool, probably due to the challenging aspects of ultrasound in termsof shadowing and dropout artifacts.
2.4.2 Available Commercial Technology
From the aforementioned methods, some of them have been adapted or devel-oped into commercial software packages designed to introduce at least some form
2.4. ECHOCARDIOGRAPHIC IMAGE ANALYSIS 19
of automation for 3D LV segmentation and, ultimately, aid the clinician.
Tomtec Imaging Systems (Unterschleissheim, Germany) was the first companypresenting commercial tools for 3D volume quantification, taking advantage of itsexpertise on image processing and visualization. Their current product, TomTec4D LV-Analysis©, performs an automatic orientation of the LV longitudinal axis todisplay three apical and three short axis (SAx) views. If necessary, these can be ad-justed by the user to avoid foreshortening and modify the AV landmark orientation.The entire 3D endocardial surface of the LV is then contoured by the software in ESand, using 3D speckle tracking, propagated throughout the heart cycle [117]. Thissame tool is also available under TomTec's software solution 4D LV-FunctionTM.
Contrarily to the purely offline approach offered by TomTec, Philips Healthcare(Best, Netherlands) introduced the possibility of both offline and online analysiswith their QLAB – 3DQ Advance (3DQA) software suit [118, 119]. First, the lon-gitudinal axes must be aligned in the 4-chamber and 2-chamber views at the EDphase. Five anatomical landmarks must then be marked, which are used to ini-tialize a deformable shell model [77]. This model is afterwards deformed towardsthe LV boundaries, with the option for manual correction. The same process mustbe completed for the ES phase [119]. Philips Healthcare has recently introduceda new commercial tool, the HeartModelAI, available on their EPIQ7 system. TheHeartModelAI is a fully automatic knowledge-based model which detects ED and ESinstances, performs localization and tracking of the four chambers and also align-ment of the apical 4-, 3- and 2-chamber views [120]. Refinement of the results isalso possible through manual correction of the contours. The tool returns then theLV and LA volumes at ED and ES.
More recently, also General Electric (GE Vingmed, Horten, Norway) introduceda software package, 4D AutoLVQ, which allows both fully or semi-automated seg-mentation and volume quantification of the LV [117]. In this product, an initialalignment of the axis is needed so as to avoid foreshortening. This can be per-formed either automatically or manually by pivoting and translating the planes. Inthe semi-automatic version, the user is required to mark the location of the apexand the MA at ED and ES. After this, the 3D endocardial surface is automati-cally detected at these instances. In the fully automatic version no initializationpoints are required. After the conclusion of the segmentation the user is allowed tomanually edit the contours.
Toshiba Medical Systems (Tokyo, Japan) has entered the RT3DE realm withits ArtidaTM system, which was complemented with a software tool for chamberquantification by RT3DE speckle tracking, 3D Wall Motion Tracking (3D-WMT)[119, 121, 122]. This computational platform performs an automatic selection ofapical 4-chamber and 2-chamber views, as well as 3 SAx views at different LV levels.The user is then required to place six markers: at the edge of the MV and at the apexin each of the apical planes. These points are then used to automatically segment theendocardium. The epicardial contour is defined either by a predetermined thicknessor through manual contouring. The final shape of the LV can then be correctedmanually by the user. A 3D block matching algorithm [123] is then used to trackthe wall motion throughout the cardiac cycle in a fully automatic manner.
20 CHAPTER 2. INTRODUCTION
The development of a fully automatic image analysis software package has beenone of the main strategic investments of Siemens Medical Solutions (Mountain View,California) while developing their Acuson SC2000TM RT3DE system, resulting inthe software tool eSie LVATM. This tool is based on a comprehensive database ofmanually annotated RT3DE exams (over 4000) covering both healthy and typicalpathological cases in clinical practice. The offline learning process was performedusing a Probabilistic Boosting Tree [124] to obtain the final classifier. Given aninput volume, this classifier sequentially estimates position, position-orientationand full similarity to locate the object and finally performs both an orientationaccording to standard planes [100] and also the contouring of the LV using boundarydetectors [125] and statistical shape models (SSM). The final endocardial contourscan be refined by the user through manual correction.
2.4.3 3D Left Ventricular Volume Assessment Validation
The enthusiasm generated in the medical community by 2D matrix transduc-ers and RT3DE is well demonstrated by the numerous validation studies for thisimaging modality over the past decade. Although validation on other experimentalsetups has been done (e.g. water balloons of known volume [126], intracavity bal-loon measurement in canine models [127], in vitro porcine heart models [128]), theprimary and more generalized validation route for the existing software suites forvolumetric measurement is to perform direct comparison of the volumetric indicesextracted from RT3DE exams against reference values extracted from cMRI, whichremains the generally accepted gold standard method for volumetric assessment ofcardiac chamber dimensions. Alternatively, some studies report a direct compar-ison between automated vs. manual contouring of RT3DE data, thus providinginsight on the ability of automating the contouring process. The most relevantstudies are summarized in this sub-section and Table 2.1 provides an overview ofthe corresponding main results.
The earlier studies focused on software tools that relied mostly on a computer-assisted 3D manual contouring paradigm, either requiring manual delineation ofthe endocardial boundary in several long axis (LAx) planes or requiring significantuser input in semi-automatic segmentation algorithms. The performance of the pi-oneer Volumetrics system was analyzed by both Schimdt et. al [129] and Lee etal. [130]. Both studies found excellent correlation between cMRI-derived volumet-ric indices and the ones extracted from RT3DE data by manually contouring indifferent azimuthally equidistant LAx images. Note that Kuhl et al. had alreadydemonstrated that the truly 3D nature of RT3DE data enabled LAx contouring incontrast to the SAx, sum-of-disk approaches initially inherited from cMRI [131].Mannaerts et al. performed a similar study with an ATL® HDI 5000 system andmanually contouring the endocardium using one of the first TomTec tools, Echo-View. Mannaerts et al. reported good correlation as well as the first evidence of anegative bias of 3D echocardiographic volumes with respect to cMRI [132]. Kuhlet al. performed the first clinical validation on the second generation of 2D (i.e.fully sampled) matrix transducers, showing excellent correlation against cMRI, in a

2.4. ECHOCARDIOGRAPHIC IMAGE ANALYSIS 21
cohort of 24 good image quality patients [133]. In this study, a manual contouringparadigm was compared against an early semi-automatic algorithm, showing thatthe tested semi-automated approach enabled full 4D delineation but required longeranalysis times and showed larger bias and wider limits of agreement. Jenkins et al.further validated the same system in a larger study (#=50) using a semi-automaticapproach provided in an earlier version of TomTec's 4D LV-Analysis© [134]. Thetool required the placement of landmarks in 12 azimuthally equidistant LAx viewswhich were used to fit an ellipse to the endocardial borders. This was then followedby manual refinement. In addition to low bias and acceptable limits of agreement,RT3DE showed lower test-retest and intra/inter-observer variability than its 2Dcounterpart. The same semi-automatic approach was validated by Sugeng et al.with excellent correlation against cMRI and low bias though with wider limits ofagreement [135]. Van den Bosch et al. carried out the first clinical validation ofRT3DE-derived LV volumes in congenital heart disease patients, whose challeng-ing cardiac shapes had been previously reported as a difficulty [136]. Their resultsshowed excellent correlation/agreement for LV volumetric analysis using a fullymanual contouring approach. However, when applying the same semi-automaticcontouring software tool as used in [134], the results highlighted that this tool re-lied too much on a purely elliptical shape prior, thus having a poor performance.Despite the strong resilience of the multi-planar contouring paradigm in the earlyclinical validation, a more 3D-oriented vision has been introduced with the algo-rithm proposed by Corsi et al. [87], which was further validated by Caiani et al. ina clinical setting [90].
Jacobs et al. were the first to validate the concept of rapid, online measurementof LV volumes from RT3DE data [118], using the tool provided by Philips, QLAB– 3DQA. Indeed, online volumetric analysis within the imaging system without theneed to export data to an external computer for tracing and 3D reconstructionfurther reduces time load. Very strong correlation and acceptable limits of agree-ment were found for all volumetric indices, despite the significant bias for EDV andESV. Additionally, the comparison between the volumetric indices extracted onlinecorrelated strongly and had good agreement against the offline semi-automatic con-touring approach proposed in [133]. Nonetheless, in a study by Jenkins et al., theoffline approach by TomTec was compared to Philips’ QLAB – 3DQA showing thatoffline approaches remain superior to the online quantification of LV volumetric in-dices, at the expense of longer analysis times [137]. A similar study was conductedby Soliman et al. using a newer version of TomTec’s 4D LV-Analysis© in whichonly the manual contouring of three orthogonal planes is needed and similar resultsas those by Jenkins et al were obtained [138]. In a different study by Soliman etal., two different versions of TomTec’s 4D LV-Analysis© are compared to volumesobtained through cMRI showing strong correlation for both methods and a clearsuperiority of the newer version dependent on full volume reconstruction [139].
Despite the convincing results of the previous validation studies, a clearer un-derstanding of possible sources of errors was required for optimal clinical usage. Tothis end, Mor-Avi et al. have studied the source of variation between volumetricindices measured with RT3DE and cMRI, showing that the fundamental difference
22 CHAPTER 2. INTRODUCTION
is the inability of RT3DE to resolve the separation between trabeculae and my-ocardium. Indeed, including the trabecular region outside of the blood pool duringcMRI contouring in the blood pool significantly reduced the RT3DE vs. cMRI bias,as well as the limits of agreement [126]. This fact sums up with the blurring effectcaused by the point spread function of the acquired ultrasound signal, which pushesthe apparent blood-tissue interface towards the blood pool, as shown by Mor-Aviet al. in balloon phantoms.
More recently, a shift towards more advanced software suites has enabled moreautomated analysis of RT3DE data, allowing a more efficient workflow for the ex-traction of clinically relevant information from RT3DE data. Indeed, the previouslycited studies have mostly focused on semi-automatic software tools that provide atmost computer-aided manual delineation of the LV cavity. Typical time of analysisranged from around 2 [118] to 10 minutes [90,134], although several studies reportanalysis times around 5 minutes per dataset [126,138]. Note that Jacobs et al. haveshown that online LV volumetric analysis can provide accurate results in less than 2minutes per volume [118] but they stress that manual adjustments were required in42% of the analyzed cases using an online quantification tool, increasing the analysistime from 2 minutes to up to 5 minutes per volume.
With this in mind, a strong research effort has been directed towards more ef-ficient software packages, incorporating advanced computer algorithms enabling afaster, more efficient and more accurate processing of RT3DE volumes. Hansegardet al. [140] and Muraru et al. [141] used GE’s AutoLVQ and TomTec’s 4D LV-Analysis© to show that a more advanced, automated software package can reducethe average time of analysis when compared with standard semi-automated strate-gies, while keeping comparable accuracy. Muraru et al. [141] have equally shownthat fully automated (i.e. only manual initialization on ED and ES frames, withsubsequent automatic delineation) is feasible. However, their results show that a no-ticeable increased agreement can be achieved by manually adjusting the results froman automated method, at the cost of doubling the total analysis time. Kleijn et al.have validated another highly automated software tool, Toshiba’s 3D-WMT [142].Despite only moderately good results for the LV volume assessment, the EF resultsshowed excellent correlation and remarkably low bias and limits of agreement, in-dicating that more advanced tracking methods can positively influence the qualityof the extracted surfaces when compared to pure contour-extraction approaches.Similar results have been reported by Kawamura et al. [122]. To test the poten-tial of RT3DE in a realistic clinical scenario, Miller et al. analyzed 60 consecutivepatients to determine the effect of image quality in RT3DE volume quantificationperformance [143]. Despite reporting lower agreement with cMRI measurementsthan previously found, the authors stress that the degree of error is intrinsicallylinked with image quality.
Using Siemens’ eSie LVATM tool, Thavendiranathan et al. demonstrated thatfully automatic analysis of RT3DE is possible and presents extremely encouragingresults [144]. Note that Thavendiranathan et al. point out that the patients un-dergoing RT3DE exams in the analyzed dataset were selected for good acousticalwindows, thus having good imaging quality. The authors have applied the same
2.4. ECHOCARDIOGRAPHIC IMAGE ANALYSIS 23
computational automatic analysis algorithm to the reconstructed cMRI datasetsand have found slightly higher bias and limits of agreement against the manualdelineation on cMRI data than when using the same software on RT3DE data(−0.8± 4.7% vs. −0.3± 2.5%). This seems to point towards the excellent imagequality of the analyzed RT3DE dataset. Similar results were also found by Zhanget al. [145]. Using the same tool, Chang et al. [146] reported slightly lower correla-tions and the Bland-Altman analysis on EF estimates revealed much larger bias andlimits of agreement than reported by Thavendiranathan et al. in [144]. Nonethe-less, it is important to stress that the dataset corresponded to consecutive patients,although previously selected based on 2DE image quality and the user was allowedto manually correct the automatically detected contours. It should also be noticedthat Chang et al. report that automatic results were considered excellent in 11%of the cases (i.e. not requiring any adjustment), good (i.e. five or fewer manualcorrections required) in 34% of the cases and it failed completely (i.e. required man-ual delineation) in 10% of the cases. Regarding the influence of manual correction,Shibayama et al. have evaluated the same system, performing first fully automaticanalysis and then allowing the user to proceed to manual corrections, in a cohort of44 consecutive patients [147]. Their results reinforce the findings of Muraru et al.for a different system, thus highlighting that even state-of-the-art software pack-ages are not yet able to consistently perform fully automated/automatic analysisof RT3DE data. Indeed, Shibayama et al. show that fully automatic results aresignificantly improved through manual interaction. Nonetheless, manual correctionincreased the total analysis time by a factor of 10. Using Philips’ HeartModelAI
tool, Tsang et al. analyzed 46 patients achieving similar results to those reportedwith other fully automatic approaches without performing manual correction of thecontours [148].
The key summary of the literature on the clinical validation of RT3DE volumet-ric assessment against cMRI can also be appreciated in the recent meta-analysisstudies of Shimada and Shiota [149] and Dorosz et al. [150]. Shimada and Shiota’smeta-analysis included 3055 subjects in 95 studies, focusing not only on 2D matrixtransducers but also earlier systems based on mechanical steering. A key evidence isthe significant underestimation bias of LV volumes (both EDV and ESV) by RT3DEcompared with cMRI. On the other hand, no statistically significant bias for estima-tion of EF was found. Sources of error included gender and presence of congenitalheart disease, which were associated with larger underestimation in the analysis.Semi-automatic border detection and the use of matrix-array transducers were as-sociated with a smaller degree of underestimation. As key conclusion, the studiedliterature supports the role of RT3DE as both accurate and reproducible in assess-ing LV volumes and EF, although it is not interchangeable with other radiologicmodalities. On the meta-analysis study by Dorosz et al., an additional perspectiveon how RT3DE compares with conventional 2DE is given in parallel to the centralcomparison of RT3DE-derived volumetric indices against cMRI. Their main con-clusion is that RT3DE underestimates volumes and has wide limits of agreement,but compared with traditional 2D methods, it is more accurate (i.e. smaller bias)for volumes (EDV and ESV) and more precise (i.e. tighter limits of agreement)for EDV, ESV and EF measurements. One of the key benefits of RT3DE is the
24 CHAPTER 2. INTRODUCTION
reduction in intra/interobserver variability, which is important for clinical practice,since disease progression in a patient will most likely be assessed serially by differ-ent readers. Dorosz et al. also highlight the natural influence of image quality onthe estimation of LV volumetric indices. Indeed, an analysis of those studies thataccepted all 3D datasets, instead of selecting patients for image quality, shows thatthe 95% limits of agreement against cMRI raise from ±34 to ±38ml for EDV, ±30to ±34ml for ESV and ±12 to ±15% for EF.
Finally, the first step towards effective clinical integration of RT3DE volumemeasurements is the population-based assessment of normal values, as acknowledgedrecently by Marwick in the editorial note of a leading cardiovascular imaging journal[151]. Several studies, including the work of Aune et al. [152], Kaku et al. [153],Fukuda et al. [154], Chahal et al. [155] and Muraru et al. [156], have been fillingthis gap, providing clinicians one of the last pieces of the path towards clinicalintegration of RT3DE examination in daily routine. An ongoing large-scale project(EchoNoRMAL) is aiming to define the echocardiographic normal ranges of the LV,through a collaborative effort meta-analysis approach [157,158].
2.5 Towards Robust Left Ventricular Segmenta-tion
In spite of the significant research efforts related to LV segmentation and track-ing in echocardiography, at the beginning of this project, no satisfactory softwarepackage was available that provided fast and fully automatic LV assessment in arobust way. While significant advances have been made in terms of increasing ro-bustness and automatization, commercial software packages at the beginning of thisproject relied heavily on user interaction and the findings of Bernard et al. [114]showed that there is still a gap in accuracy between state of the art methods and in-terobserver variability. Even today, commercial software packages, such as SiemenseSie LVATM or Philips HeartModelAI, are proprietary and subject to the inherentimage characteristics and meta-information of those systems. As such, the goal ofthe present work was to develop a tool for 3D echocardiographic LV assessment andto make it available to clinicians by incorporating it in a graphical user interface.This tool should perform LV assessment along the full heart cycle in a coherent way.To provide all the necessary clinical parameters the tool should perform myocar-dial segmentation - besides the endocardial volumes, epicardial segmentation canbe especially interesting to study myocardial mass and as an initial step for furtherpost-processing applications. Additionally, the ideal tool should be automatic, withminimal/no user input. Furthermore, the tool should do so in real-time or close toreal-time, as the immediate access to the information is one of the strongest assetsof echocardiography. Finally, the ideal tool should be extremely robust and be ableto cope with images from different imaging systems. In this context, experimentalsystems can be especially challenging as the image quality is likely to be worse thanin conventional systems. Yet, it is also in this setting that an automatic tool wouldbe especially important to streamline applicational research such as that briefly
2.6. B-SPLINE EXPLICIT ACTIVE SURFACES 25
described in section 2.3.3.
Given the requirements defined in the previous paragraph, it becomes clearthat the method chosen for segmentation must be flexible and robust, but alsofast. As such, and according to the findings of Bernard et al. [114] as discussed insection 2.4.1, the tool chosen was BEAS as it showed excellent performance and caneasily be modelled to perform epicardial segmentation as well [159]. Furthermore,to increase robustness in poor image quality cases, shape/landmark informationshould be further included in the framework as this was shown to play a significantrole in determining the behaviour of the segmentation.
2.6 B-spline Explicit Active Surfaces
2.6.1 Framework Fundamentals
The fundamental concept of BEAS is to represent the interface Γ as an explicitfunction of its coordinates, i.e. one of the coordinates of the points along Γ isexpressed as a function of the remaining coordinates [3]. As such, a point x ∈ Rnof coordinates x1, ..., xn belonging to surface Γ in an n-dimensional space can beexpressed explicitly as x1 = ψ(x2, ..., xn). In this framework, ψ is defined as a linearcombination of B-spline basis functions [160], i.e.:
x1 = ψ(x2, ..., xn) =∑
k∈Zn−1
c[k]βd(
x∗
h− k
), (2.1)
where x∗ ∈ Rn−1 is a point of coordinates x2, ..., xn and βd(·) is the uniform(n−1)-dimensional B-spline of degree d. The knots of the B-splines are located ona rectangular grid defined on the chosen coordinate system, with a regular spacinggiven by h. The coefficients of the B-spline representation are gathered in c[k]. Thisallows for a smooth representation of any surface with the limitation that it mustrespect the coordinate system in which ψ is expressed. In the case of a sphericalcoordinate system for example, the surface represented should be a closed surfacearound the origin in which every point must be ’seen’ from the origin, i.e. a straightline from the origin to any point in the surface does not intersect with the surfaceat any other point.
2.6.2 Energy Formulation
Given the formulation of BEAS as a geometrical model, the explicit function ψ isfirst initialized and then evolved by the minimization of an energy criterion E. Thisenergy term can be defined according to any desired criterion and is often a combi-nation of multiple terms that reflect the properties of the object to be segmented.The term corresponding to image features typically uses a localized region-basedformulation due to its low sensitivity to noise and suitability for segmentation ofheterogeneous objects [161]. These terms use the specific image characteristics on

26 CHAPTER 2. INTRODUCTION
either side of the boundary to drive the segmentation and are localized, meaningthat these carachteristics are only considered in a region around the boundary. Sucha formulation can be written as:
E =
∫Ω
δφ(x)
∫Ω
B(x,y) · F (y, Hφ(y)) dydx, (2.2)
where F (y, Hφ(y)) is the image criterion and B(x,y) is the mask function in whichthe local parameters that drive the evolution are estimated. δφ(x) is the Diracoperator applied to the level set function φ(x) = Γ(x∗)− x1, which is defined overthe image domain Ω and Hφj
(y) = H(φj(y)) with H being the Heaviside function.
To maintain low computational costs, the region B is restricted to the normaldirection at x, thus:
B(x,y) =
1, if y = x + kN(x), k ∈ [−ρ, ρ]
0, otherwise(2.3)
where N(x) is the normal to the interface at position x and ρ the radius of the localneighborhood considered.
Given the BEAS formulation, the minimization of 2.2 can then be done withrespect to each B-spline coefficient c[ki] and can be shown [3] to be:
∂E
∂c[ki]=
∫Γ
g(x∗)βd(
x∗
h− ki
)dx∗, (2.4)
where g(x∗) represents the feature functions that drive the minimization of energyE.
2.6.3 Algorithm Implementation
Because any object to be described by BEAS must be described through theexplicit function in terms of its coordinates, the choice of an appropriate coordinatesystem is extremely important as it determines the topology of the final segmentedobject. For a 3D closed object such as the LV, the spherical coordinate system wouldbe appropriate, giving the radius of the surface points in function of the azimuthand elevation angles (r = ψ(θ, φ)). This implies of course that an appropriatecoordinate system origin and orientation are set before the segmentation is startedso that every surface point can be “seen” from the origin. An example of thisrepresentation through an explicit function is shown on Figure 2.6.
A second consideration must be the discretization of the interface and the B-spline spacing h. Given that the explicit function φ is defined over an n− 1 dimen-sional grid, this grid must be discretized in a uniform way. Adjusting these twoparameters allows one to adjust to the complexity of the shape, as the number ofpoints must be sufficient to represent the level of surface details necessary, but alsoto control the smoothing of the surface through the B-spline spacing h.
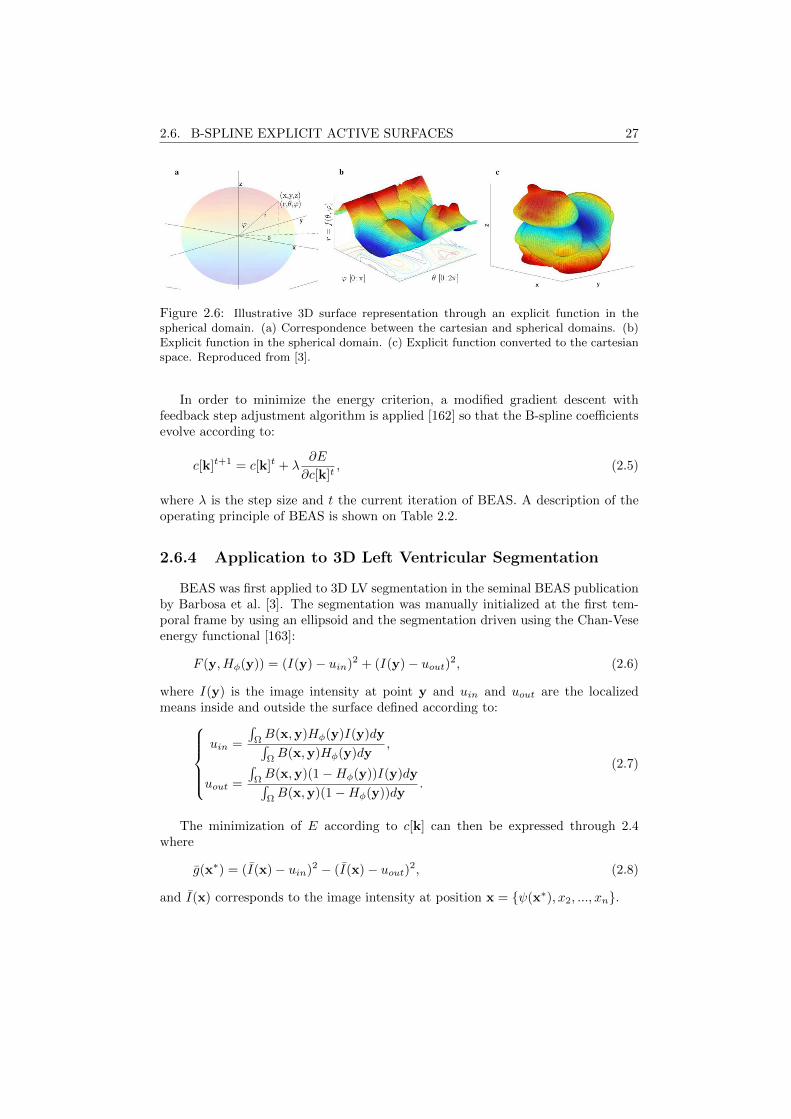
2.6. B-SPLINE EXPLICIT ACTIVE SURFACES 27
Figure 2.6: Illustrative 3D surface representation through an explicit function in thespherical domain. (a) Correspondence between the cartesian and spherical domains. (b)Explicit function in the spherical domain. (c) Explicit function converted to the cartesianspace. Reproduced from [3].
In order to minimize the energy criterion, a modified gradient descent withfeedback step adjustment algorithm is applied [162] so that the B-spline coefficientsevolve according to:
c[k]t+1 = c[k]t + λ∂E
∂c[k]t, (2.5)
where λ is the step size and t the current iteration of BEAS. A description of theoperating principle of BEAS is shown on Table 2.2.
2.6.4 Application to 3D Left Ventricular Segmentation
BEAS was first applied to 3D LV segmentation in the seminal BEAS publicationby Barbosa et al. [3]. The segmentation was manually initialized at the first tem-poral frame by using an ellipsoid and the segmentation driven using the Chan-Veseenergy functional [163]:
F (y, Hφ(y)) = (I(y)− uin)2 + (I(y)− uout)2, (2.6)
where I(y) is the image intensity at point y and uin and uout are the localizedmeans inside and outside the surface defined according to:
uin =
∫ΩB(x,y)Hφ(y)I(y)dy∫ΩB(x,y)Hφ(y)dy
,
uout =
∫ΩB(x,y)(1−Hφ(y))I(y)dy∫ΩB(x,y)(1−Hφ(y))dy
.
(2.7)
The minimization of E according to c[k] can then be expressed through 2.4where
g(x∗) = (I(x)− uin)2 − (I(x)− uout)2, (2.8)
and I(x) corresponds to the image intensity at position x = ψ(x∗), x2, ..., xn.
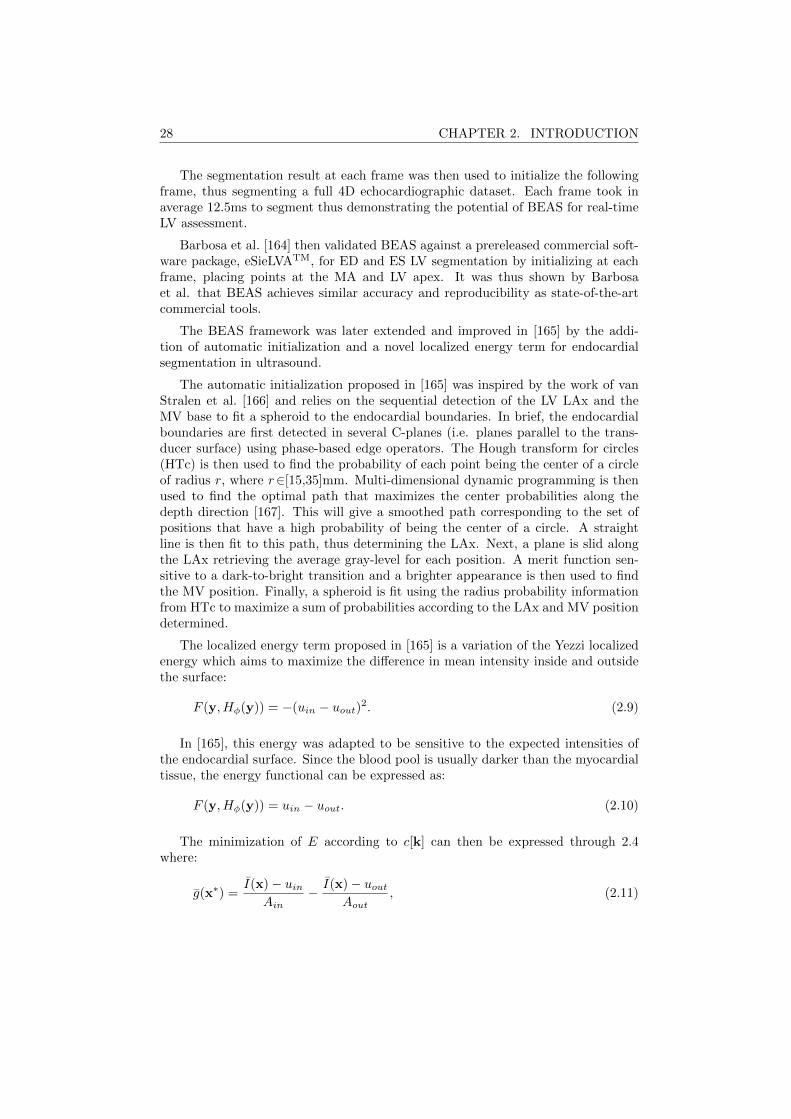
28 CHAPTER 2. INTRODUCTION
The segmentation result at each frame was then used to initialize the followingframe, thus segmenting a full 4D echocardiographic dataset. Each frame took inaverage 12.5ms to segment thus demonstrating the potential of BEAS for real-timeLV assessment.
Barbosa et al. [164] then validated BEAS against a prereleased commercial soft-ware package, eSieLVATM, for ED and ES LV segmentation by initializing at eachframe, placing points at the MA and LV apex. It was thus shown by Barbosaet al. that BEAS achieves similar accuracy and reproducibility as state-of-the-artcommercial tools.
The BEAS framework was later extended and improved in [165] by the addi-tion of automatic initialization and a novel localized energy term for endocardialsegmentation in ultrasound.
The automatic initialization proposed in [165] was inspired by the work of vanStralen et al. [166] and relies on the sequential detection of the LV LAx and theMV base to fit a spheroid to the endocardial boundaries. In brief, the endocardialboundaries are first detected in several C-planes (i.e. planes parallel to the trans-ducer surface) using phase-based edge operators. The Hough transform for circles(HTc) is then used to find the probability of each point being the center of a circleof radius r, where r∈[15,35]mm. Multi-dimensional dynamic programming is thenused to find the optimal path that maximizes the center probabilities along thedepth direction [167]. This will give a smoothed path corresponding to the set ofpositions that have a high probability of being the center of a circle. A straightline is then fit to this path, thus determining the LAx. Next, a plane is slid alongthe LAx retrieving the average gray-level for each position. A merit function sen-sitive to a dark-to-bright transition and a brighter appearance is then used to findthe MV position. Finally, a spheroid is fit using the radius probability informationfrom HTc to maximize a sum of probabilities according to the LAx and MV positiondetermined.
The localized energy term proposed in [165] is a variation of the Yezzi localizedenergy which aims to maximize the difference in mean intensity inside and outsidethe surface:
F (y, Hφ(y)) = −(uin − uout)2. (2.9)
In [165], this energy was adapted to be sensitive to the expected intensities ofthe endocardial surface. Since the blood pool is usually darker than the myocardialtissue, the energy functional can be expressed as:
F (y, Hφ(y)) = uin − uout. (2.10)
The minimization of E according to c[k] can then be expressed through 2.4where:
g(x∗) =I(x)− uin
Ain− I(x)− uout
Aout, (2.11)
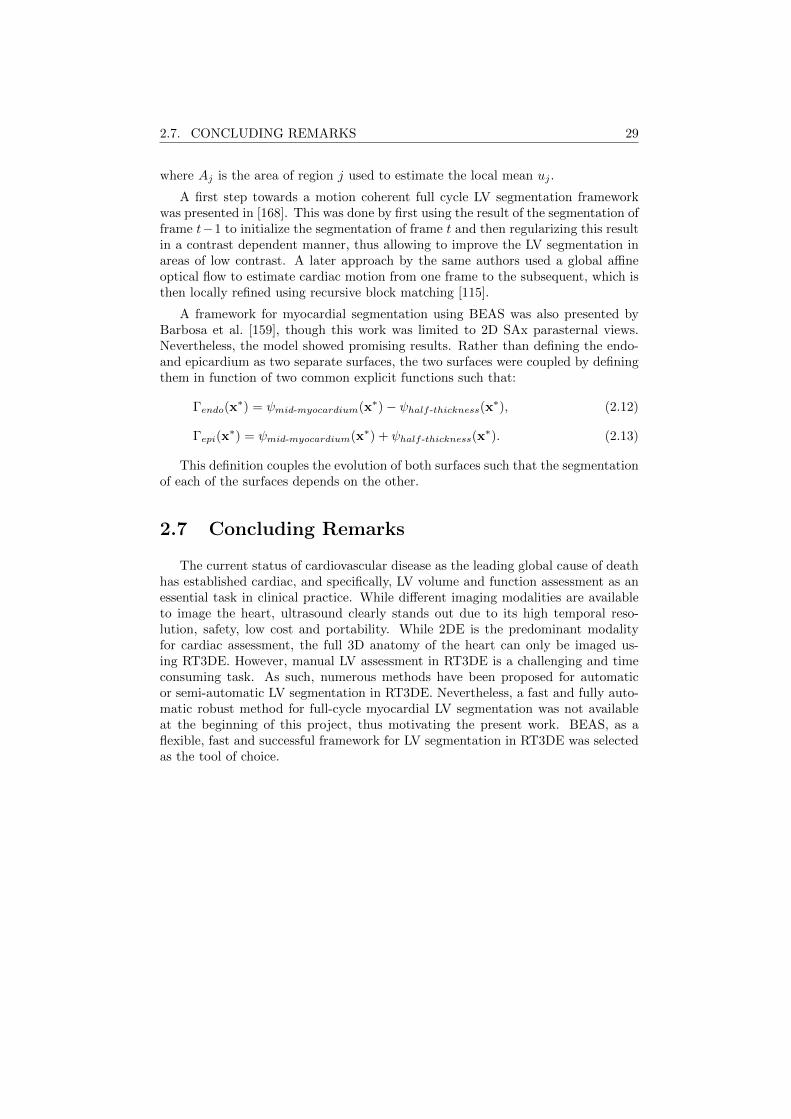
2.7. CONCLUDING REMARKS 29
where Aj is the area of region j used to estimate the local mean uj .
A first step towards a motion coherent full cycle LV segmentation frameworkwas presented in [168]. This was done by first using the result of the segmentation offrame t−1 to initialize the segmentation of frame t and then regularizing this resultin a contrast dependent manner, thus allowing to improve the LV segmentation inareas of low contrast. A later approach by the same authors used a global affineoptical flow to estimate cardiac motion from one frame to the subsequent, which isthen locally refined using recursive block matching [115].
A framework for myocardial segmentation using BEAS was also presented byBarbosa et al. [159], though this work was limited to 2D SAx parasternal views.Nevertheless, the model showed promising results. Rather than defining the endo-and epicardium as two separate surfaces, the two surfaces were coupled by definingthem in function of two common explicit functions such that:
Γendo(x∗) = ψmid-myocardium(x∗)− ψhalf-thickness(x
∗), (2.12)
Γepi(x∗) = ψmid-myocardium(x∗) + ψhalf-thickness(x
∗). (2.13)
This definition couples the evolution of both surfaces such that the segmentationof each of the surfaces depends on the other.
2.7 Concluding Remarks
The current status of cardiovascular disease as the leading global cause of deathhas established cardiac, and specifically, LV volume and function assessment as anessential task in clinical practice. While different imaging modalities are availableto image the heart, ultrasound clearly stands out due to its high temporal reso-lution, safety, low cost and portability. While 2DE is the predominant modalityfor cardiac assessment, the full 3D anatomy of the heart can only be imaged us-ing RT3DE. However, manual LV assessment in RT3DE is a challenging and timeconsuming task. As such, numerous methods have been proposed for automaticor semi-automatic LV segmentation in RT3DE. Nevertheless, a fast and fully auto-matic robust method for full-cycle myocardial LV segmentation was not availableat the beginning of this project, thus motivating the present work. BEAS, as aflexible, fast and successful framework for LV segmentation in RT3DE was selectedas the tool of choice.
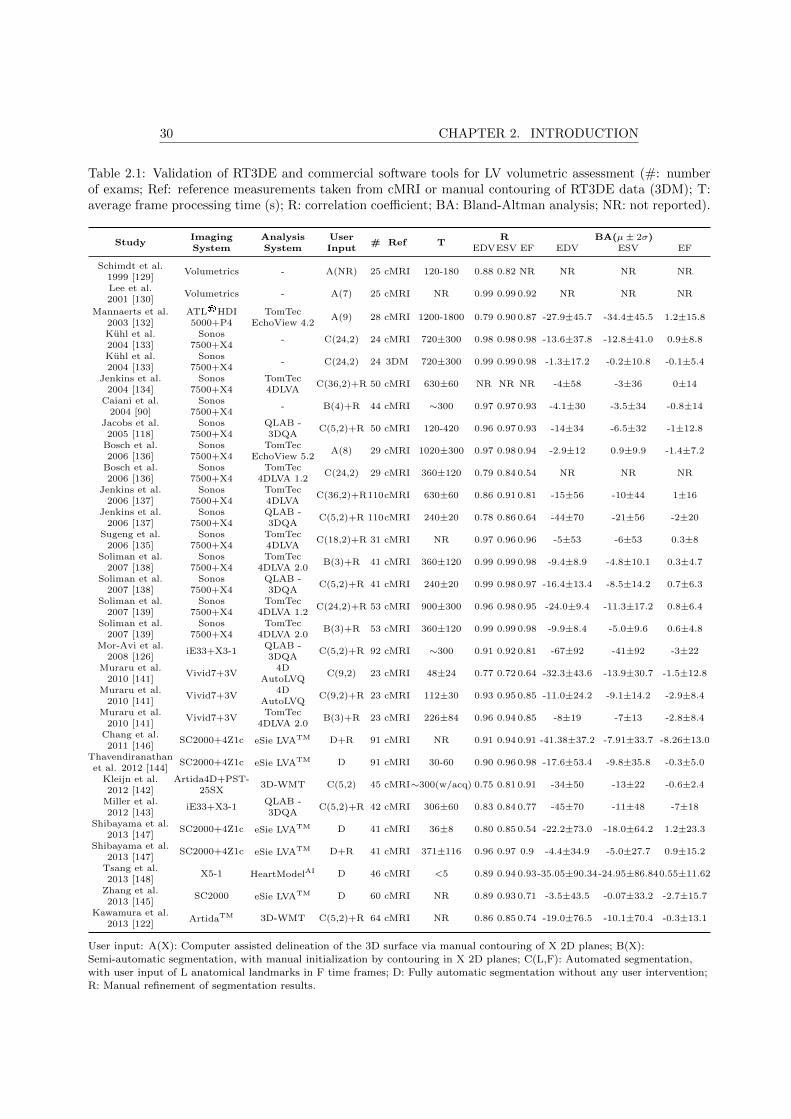
30 CHAPTER 2. INTRODUCTION
Table 2.1: Validation of RT3DE and commercial software tools for LV volumetric assessment (#: numberof exams; Ref: reference measurements taken from cMRI or manual contouring of RT3DE data (3DM); T:average frame processing time (s); R: correlation coefficient; BA: Bland-Altman analysis; NR: not reported).
StudyImaging Analysis User
# Ref TR BA(µ± 2σ)
System System Input EDVESV EF EDV ESV EF
Schimdt et al.Volumetrics - A(NR) 25 cMRI 120-180 0.88 0.82 NR NR NR NR
1999 [129]Lee et al.
Volumetrics - A(7) 25 cMRI NR 0.99 0.99 0.92 NR NR NR2001 [130]
Mannaerts et al. ATL®HDI TomTecA(9) 28 cMRI 1200-1800 0.79 0.90 0.87 -27.9±45.7 -34.4±45.5 1.2±15.8
2003 [132] 5000+P4 EchoView 4.2Kuhl et al. Sonos
- C(24,2) 24 cMRI 720±300 0.98 0.98 0.98 -13.6±37.8 -12.8±41.0 0.9±8.82004 [133] 7500+X4Kuhl et al. Sonos
- C(24,2) 24 3DM 720±300 0.99 0.99 0.98 -1.3±17.2 -0.2±10.8 -0.1±5.42004 [133] 7500+X4
Jenkins et al. Sonos TomTecC(36,2)+R 50 cMRI 630±60 NR NR NR -4±58 -3±36 0±14
2004 [134] 7500+X4 4DLVACaiani et al. Sonos
- B(4)+R 44 cMRI ∼300 0.97 0.97 0.93 -4.1±30 -3.5±34 -0.8±142004 [90] 7500+X4
Jacobs et al. Sonos QLAB -C(5,2)+R 50 cMRI 120-420 0.96 0.97 0.93 -14±34 -6.5±32 -1±12.8
2005 [118] 7500+X4 3DQABosch et al. Sonos TomTec
A(8) 29 cMRI 1020±300 0.97 0.98 0.94 -2.9±12 0.9±9.9 -1.4±7.22006 [136] 7500+X4 EchoView 5.2
Bosch et al. Sonos TomTecC(24,2) 29 cMRI 360±120 0.79 0.84 0.54 NR NR NR
2006 [136] 7500+X4 4DLVA 1.2Jenkins et al. Sonos TomTec
C(36,2)+R110cMRI 630±60 0.86 0.91 0.81 -15±56 -10±44 1±162006 [137] 7500+X4 4DLVA
Jenkins et al. Sonos QLAB -C(5,2)+R 110cMRI 240±20 0.78 0.86 0.64 -44±70 -21±56 -2±20
2006 [137] 7500+X4 3DQASugeng et al. Sonos TomTec
C(18,2)+R 31 cMRI NR 0.97 0.96 0.96 -5±53 -6±53 0.3±82006 [135] 7500+X4 4DLVA
Soliman et al. Sonos TomTecB(3)+R 41 cMRI 360±120 0.99 0.99 0.98 -9.4±8.9 -4.8±10.1 0.3±4.7
2007 [138] 7500+X4 4DLVA 2.0Soliman et al. Sonos QLAB -
C(5,2)+R 41 cMRI 240±20 0.99 0.98 0.97 -16.4±13.4 -8.5±14.2 0.7±6.32007 [138] 7500+X4 3DQA
Soliman et al. Sonos TomTecC(24,2)+R 53 cMRI 900±300 0.96 0.98 0.95 -24.0±9.4 -11.3±17.2 0.8±6.4
2007 [139] 7500+X4 4DLVA 1.2Soliman et al. Sonos TomTec
B(3)+R 53 cMRI 360±120 0.99 0.99 0.98 -9.9±8.4 -5.0±9.6 0.6±4.82007 [139] 7500+X4 4DLVA 2.0
Mor-Avi et al.iE33+X3-1
QLAB -C(5,2)+R 92 cMRI ∼300 0.91 0.92 0.81 -67±92 -41±92 -3±22
2008 [126] 3DQAMuraru et al.
Vivid7+3V4D
C(9,2) 23 cMRI 48±24 0.77 0.72 0.64 -32.3±43.6 -13.9±30.7 -1.5±12.82010 [141] AutoLVQ
Muraru et al.Vivid7+3V
4DC(9,2)+R 23 cMRI 112±30 0.93 0.95 0.85 -11.0±24.2 -9.1±14.2 -2.9±8.4
2010 [141] AutoLVQMuraru et al.
Vivid7+3VTomTec
B(3)+R 23 cMRI 226±84 0.96 0.94 0.85 -8±19 -7±13 -2.8±8.42010 [141] 4DLVA 2.0
Chang et al.SC2000+4Z1c eSie LVATM D+R 91 cMRI NR 0.91 0.94 0.91 -41.38±37.2 -7.91±33.7 -8.26±13.0
2011 [146]Thavendiranathan
SC2000+4Z1c eSie LVATM D 91 cMRI 30-60 0.90 0.96 0.98 -17.6±53.4 -9.8±35.8 -0.3±5.0et al. 2012 [144]
Kleijn et al. Artida4D+PST-3D-WMT C(5,2) 45 cMRI∼300(w/acq) 0.75 0.81 0.91 -34±50 -13±22 -0.6±2.4
2012 [142] 25SXMiller et al.
iE33+X3-1QLAB -
C(5,2)+R 42 cMRI 306±60 0.83 0.84 0.77 -45±70 -11±48 -7±182012 [143] 3DQA
Shibayama et al.SC2000+4Z1c eSie LVATM D 41 cMRI 36±8 0.80 0.85 0.54 -22.2±73.0 -18.0±64.2 1.2±23.3
2013 [147]Shibayama et al.
SC2000+4Z1c eSie LVATM D+R 41 cMRI 371±116 0.96 0.97 0.9 -4.4±34.9 -5.0±27.7 0.9±15.22013 [147]
Tsang et al.X5-1 HeartModelAI D 46 cMRI <5 0.89 0.94 0.93-35.05±90.34-24.95±86.840.55±11.62
2013 [148]Zhang et al.
SC2000 eSie LVATM D 60 cMRI NR 0.89 0.93 0.71 -3.5±43.5 -0.07±33.2 -2.7±15.72013 [145]
Kawamura et al.ArtidaTM 3D-WMT C(5,2)+R 64 cMRI NR 0.86 0.85 0.74 -19.0±76.5 -10.1±70.4 -0.3±13.1
2013 [122]
User input: A(X): Computer assisted delineation of the 3D surface via manual contouring of X 2D planes; B(X):Semi-automatic segmentation, with manual initialization by contouring in X 2D planes; C(L,F): Automated segmentation,with user input of L anatomical landmarks in F time frames; D: Fully automatic segmentation without any user intervention;R: Manual refinement of segmentation results.

2.7. CONCLUDING REMARKS 31
Table 2.2: BEAS algorithm operating principle description. Adapted from [3].
Initialization
Choose appropriate coordinate system
Define the origin and orientation of the coordinate system
Initialize ψ(x∗) and sample according to discretization grid
Set the gradient descent parameters λi, ηf and ItT
Segmentation
While It < Itmax and ctr < ItT Estimate image feature g(x∗) at the current surface position
Compute the energy gradient ∂E with respect to c[k]
Update the B-spline coefficients c[k]
Update ψ(x∗) to get the new interface points
If the update leads to a decrease in E
ctr = 0
λ = λi ψfinal(x∗) = ψ(x∗)
Else
ctr = ctr + 1
λ = λ/ηf It=It+1
λi is the initial step size, ηf is the step size update factor and ItT the maximum numberof iterations allowed without finding a new energy optimum.

32 CHAPTER 2. INTRODUCTION

Part I
Segmentation Methodologies
33


Chapter 3
heartBEATS: A HybridEnergy Approach forReal-Time B-spline ExplicitActive Tracking of Surfaces
This chapter is based on a paper published in Computerized Medical Imaging and Graph-ics: Barbosa D., Pedrosa J., Heyde B., Dietenbeck T., Friboulet D., Bernard O., D’hooge J..heartBEATS: A hybrid energy approach for real-time B-spline explicit active tracking of surfaces.Computerized Medical Imaging and Graphics. 2017 Dec 1;62:26-33.
35
36 CHAPTER 3. HEARTBEATS
Abstract
In this chapter a novel method is presented for left ventricular (LV) trackingin real-time 3D echocardiography (RT3DE) data using a hybrid approach combin-ing segmentation and tracking-based clues. This is accomplished by coupling anaffine motion model to an existing LV segmentation framework and introducing anenergy term that penalizes the deviation to the affine motion estimated using aglobal Lucas-Kanade algorithm. The hybrid nature of the proposed solution canbe seen as using the estimated affine motion to enhance the temporal coherence ofthe segmented surfaces, by enforcing the tracking of consistent patterns, while theunderlying segmentation algorithm allows to locally refine the estimated global mo-tion. The proposed method was tested on a dataset composed of 24 4D ultrasoundsequences from both healthy volunteers and diseased patients. The proposed hybridtracking platform offers a competitive solution for fast assessment of relevant LVvolumetric indices, by combining the robustness of affine motion tracking with thelow computational burden of the underlying segmentation algorithm.
3.1 Introduction
Despite the existence of several functional indices, ejection fraction (EF) re-mains the most widely used parameter to assess global cardiac function [12]. Whilecardiac magnetic resonance imaging (cMRI) remains the gold standard to assess car-diac morphology and function, it is still impractical for large patient throughput.Thanks to the technological maturation of 2D matrix array transducers, 3D ultra-sonic imaging systems have been gradually introduced into clinical practice overthe past decade. When compared with conventional 2D echocardiography (2DE),RT3DE offers some important advantages. Indeed, it overcomes several known lim-itations of conventional 2DE imaging, since it avoids foreshortening, out-of-planemotion and the need of geometric assumptions for volume estimation. As a result,it has already been shown that RT3DE offers superior performance in the assess-ment of global morphology and function than 2DE, when compared against cMRImeasurements [141]. Thus, the ability of combining accurate 3D volumetric assess-ment of cardiac morphology and function with the intrinsic benefits of ultrasoundimaging makes RT3DE a very useful and promising tool for clinical daily routine.
It should be noted that the added dimensionality of RT3DE data also poses somechallenges in the data analysis pipeline, when compared with conventional 2DE.The manual analysis of RT3DE data remains cumbersome and time consuming,which has triggered the development of several software suites in order to reducethe burden on the operating physician while extracting relevant cardiac diagnosticinformation. However, even state-of-the-art commercial solutions still require somedegree of user interaction both at the initialization step and for correction of thesegmentation/tracking results [141].
Nonetheless, several relevant methods have been proposed in order to increasethe automation degree and decrease the total analysis time of RT3DE data. For
3.1. INTRODUCTION 37
instance, Dikici and Orderud [169] have recently extended the Kalman-based, com-putationally efficient tracking framework initially introduced in [170], in order toaccount for advanced edge detectors to track the position of the LV endocardialborder throughout the cardiac cycle. Leung et al. [171] proposed a fully auto-matic method for RT3DE data segmentation based on 3D active appearance mod-els (AAM). The same authors have equally proposed a tracking framework able totake into account statistical cardiac motion models to improve the performance ofan optical flow based tracking algorithm [172]. Yang et al. [173] have proposed acomputational framework targeted to robust and fast 3D tracking of deformable ob-jects without any user interaction, by combining the input of multiple collaborativetrackers. Different commercial solutions also exist in the field, typically dependenton user interaction for single frame segmentation which is then propagated through-out the heart cycle using different tracking strategies as for example in Tomtec’sand Toshiba’s commercial tools described in Chapter 2 On the other hand, otherapproaches such as the newest available tools from Siemens and Philips, use largestatistical models to perform the segmentation in 4D.
Despite the promising results of B-spline Explicit Active Surfaces (BEAS) onthe segmentation of RT3DE data in both end diastolic (ED) and end systolic (ES)frames, as described in Section 2.6, the direct application of this algorithm to trackthe LV throughout the cardiac cycle has some intrinsic flaws. Indeed, segmentation-oriented energy functionals are designed to recover objects from a background instatic images. Although they can be used in multi-static scenarios to performtracking on subsequent images, there is no guarantee that the temporal coherenceof the patterns being tracked will be captured.
With this in mind, a novel hybrid framework which combines both segmenta-tion as well as motion-oriented clues is proposed. This is accomplished by couplingan affine motion model to the segmented LV surface and introducing an energyterm that penalizes the deviation to the affine motion estimated using a globalLucas-Kanade algorithm. The hybrid nature of the proposed solution can be seenas using the estimated affine motion to enhance the temporal coherence of the seg-mented surfaces, by enforcing the tracking of consistent patterns, while the under-lying segmentation algorithm allows to locally refine the estimated global motion.The proposed solution offers a competitive approach for fast assessment of relevantLV volumetric indices, by combining the robustness of affine motion tracking withthe low computational burden of BEAS.
The present chapter is structured as follows. First, the method for LV affinemotion estimation is presented, while also introducing the key novelty of this work, ahybrid tracking platform relying on both segmentation-based energies and tracking-oriented clues. It is shown that this coupling can be done via affine transformation ofthe coordinate system associated with the segmented LV surface. The key parametervalues chosen in the implementation of the proposed algorithm are then addressed.In the Results section, an evaluation of the performance of the method using adataset composed of 24 4D ultrasound exams is performed. In the Discussion, themain findings of the experiments are discussed and the performance of the proposedalgorithm is compared against the most relevant prior work in literature. Finally,
38 CHAPTER 3. HEARTBEATS
the Conclusions section gives the main conclusions and perspectives of this work.
3.2 Methodology
3.2.1 B-spline Explicit Active Surfaces
In this Chapter, the modified version of the localized means separation energyis used as introduced in 2.9, which takes advantage of the darker appearance ofblood with respect to the myocardial tissue. Given the volumetric nature of theobject of interest, ψ is defined in the spherical space, i.e. r = ψ(φ, θ). Furtherdetails regarding the fundamental formalism of BEAS and the derivation of thesegmentation energy minimization strategy are described in Section 2.6.
3.2.2 Fast left ventricular affine motion estimation
3D cardiac motion assessment is a very active research field and different algo-rithms have been proposed. While block-matching is a very popular approach incurrent commercial software suites [174], the recent trends in the research commu-nity show a tendency towards solutions based on elastic registration and opticalflow algorithms, as highlighted in the recent comparative study by De Craene etal. [175]. In the present manuscript, a global 3D extension of the method pro-posed by Suhling et al. [176] for the estimation of the local affine motion is used, asintroduced in [177].
As noted in the seminal work of Lucas and Kanade [178], the least squares solu-tion of the optical flow equation is equivalent to the first order Taylor expansion ofthe minimization of the sum of squared differences between two subsequent frames.Therefore, optical flow motion estimation algorithms build upon the assumptionthat the intensity of a particular point in a moving pattern does not change overtime and thus any difference in the local appearance of a region over a sequenceis uniquely defined by the underlying motion. Let I(x1, x2, x3, t) denote the pixelintensity at location ~x = [x1, x2, x3] and time t in a 4D image dataset. This as-sumption can then be formulated as [179]:
Ix1(~x, t)u(~x, t) + Ix2
(~x, t)v(~x, t) + Ix3(~x, t)w(~x, t) + IT (~x, t) = 0, (3.1)
where ∇I = [Ix1, Ix2
, Ix3] is the local image spatial gradient and IT corresponds
to the temporal derivative. u, v and w are the x1-, x2- and x3-components of theoptical flow that are to be estimated.
Taking the affine motion model as defined in [176], the 3D affine motion onframe t can be estimated by minimizing the following energy term:
EM (t)=
∫W(x1 − c1, x2 − c2, x3 − c3)(Ix1
u+ Ix2v + Ix3
w + IT )2d~x, (3.2)
3.2. METHODOLOGY 39
where W is a local window function centered in the position ~c = [c1, c2, c3] and
u(~x, t)=u0 + u1(x1 − c1) + u2(x2 − c2) + u3(x3 − c3), (3.3)
v(~x, t)=v0 + v1(x1 − c1) + v2(x2 − c2) + v3(x3 − c3), (3.4)
w(~x, t)=w0+w1(x1 − c1)+w2(x2 − c2)+w3(x3 − c3), (3.5)
encode the local motion field along respectively x1, x2 and x3. Parameters u0, v0
and w0 correspond to the motion at the window center and u1, u2, u3, v1, v2, v3,w1, w2 and w3 are respectively the first order spatial derivatives of u, v and w.These parameters then define the affine transform for frame t associated with thelocal motion field [u, v, w] as expressed by the augmented matrix
~Mt =
1 + u1 u2 u3 u0v1 1 + v2 v3 v0w1 w2 1 + w3 w00 0 0 1
. (3.6)
By differentiating equation 3.2 with respect to the affine motion field compo-nents, it can be shown that the minimization of the weighted least-squares criterion
can be expressed as the solution of ~ATWAd = ATWb, whose components are ex-panded at the bottom of the page. Note that < a, b > denotes the continuous
analogue of the dot product, expressed as∫a(~x)b(~x)d~x and that ~A, ~d and ~ATWb
are functions of (~x, t) though this was ommitted for simplicity.
A global formulation of the algorithm introduced by Suhling et al. could beemployed by considering W(~p) = 1, ∀~p. Such an assumption would yield the globalaffine transform between the two subsequent images. Nonetheless, increasing thespan of the window function W intrinsically hampers the underlying assumptionthat the affine motion model is constant within this region. This is particularlyproblematic in the case of echocardiographic data, since it is known that the mo-tion patterns of the blood and the surrounding tissues (e.g. pericardium and valves)are significantly different from the ones within the myocardium, thus violating thefundamental assumption of constant motion within the region of interest (ROI). Inorder to allow estimating the global affine transformation of the LV between subse-quent frames, the existing segmentation framework will be used and the formalismintroduced in [177] to define a ROI only around the segmented surface from theconvolution expanded so that:
W(~x) = δφ(~x) ∗ N(~x), (3.7)
where δφ(~x) implicitly defines the segmented surface and N(~x) is simply a neigh-borhood function defined as a 3D cube centered in ~x. An example of the resulting
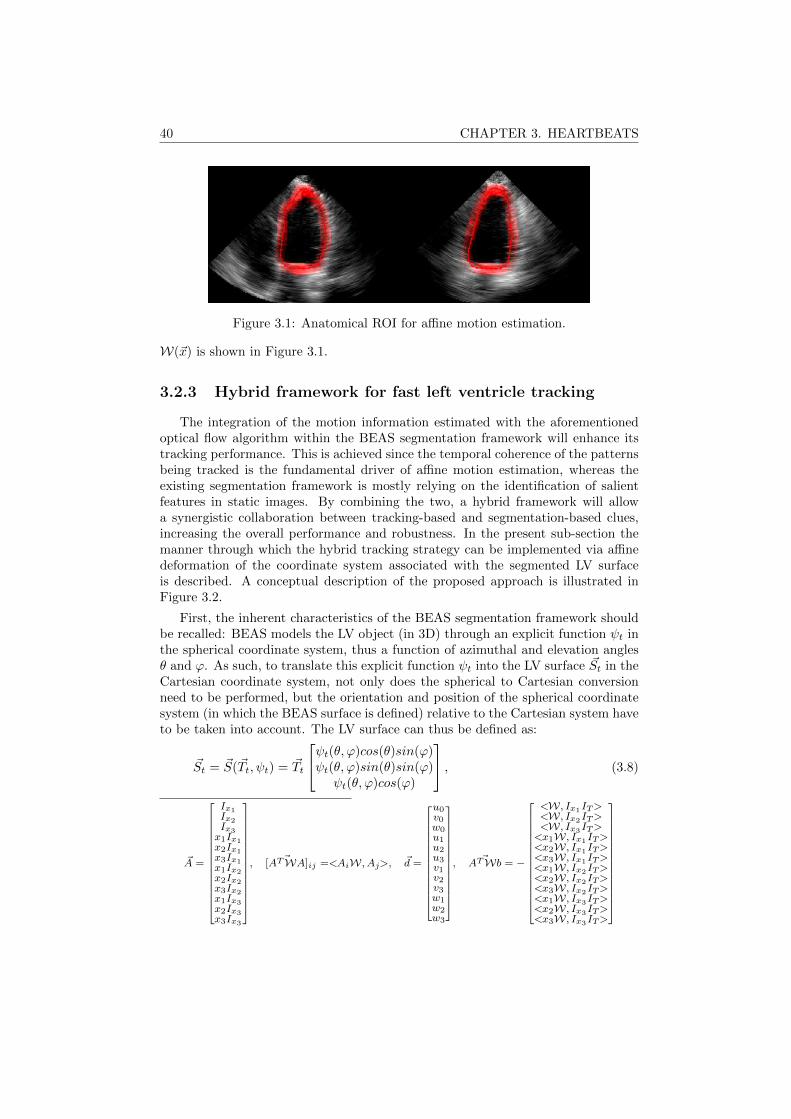
40 CHAPTER 3. HEARTBEATS
Figure 3.1: Anatomical ROI for affine motion estimation.
W(~x) is shown in Figure 3.1.
3.2.3 Hybrid framework for fast left ventricle tracking
The integration of the motion information estimated with the aforementionedoptical flow algorithm within the BEAS segmentation framework will enhance itstracking performance. This is achieved since the temporal coherence of the patternsbeing tracked is the fundamental driver of affine motion estimation, whereas theexisting segmentation framework is mostly relying on the identification of salientfeatures in static images. By combining the two, a hybrid framework will allowa synergistic collaboration between tracking-based and segmentation-based clues,increasing the overall performance and robustness. In the present sub-section themanner through which the hybrid tracking strategy can be implemented via affinedeformation of the coordinate system associated with the segmented LV surfaceis described. A conceptual description of the proposed approach is illustrated inFigure 3.2.
First, the inherent characteristics of the BEAS segmentation framework shouldbe recalled: BEAS models the LV object (in 3D) through an explicit function ψt inthe spherical coordinate system, thus a function of azimuthal and elevation anglesθ and ϕ. As such, to translate this explicit function ψt into the LV surface ~St in theCartesian coordinate system, not only does the spherical to Cartesian conversionneed to be performed, but the orientation and position of the spherical coordinatesystem (in which the BEAS surface is defined) relative to the Cartesian system haveto be taken into account. The LV surface can thus be defined as:
~St = ~S(~Tt, ψt) = ~Tt
ψt(θ, ϕ)cos(θ)sin(ϕ)ψt(θ, ϕ)sin(θ)sin(ϕ)
ψt(θ, ϕ)cos(ϕ)
, (3.8)
~A =
Ix1Ix2Ix3x1Ix1x2Ix1x3Ix1x1Ix2x2Ix2x3Ix2x1Ix3x2Ix3x3Ix3
, [ ~ATWA]ij =<AiW, Aj>, ~d =
u0v0w0u1u2u3v1v2v3w1w2w3
, ~ATWb = −
<W, Ix1IT><W, Ix2IT><W, Ix3IT><x1W, Ix1IT><x2W, Ix1IT><x3W, Ix1IT><x1W, Ix2IT><x2W, Ix2IT><x3W, Ix2IT><x1W, Ix3IT><x2W, Ix3IT><x3W, Ix3IT>
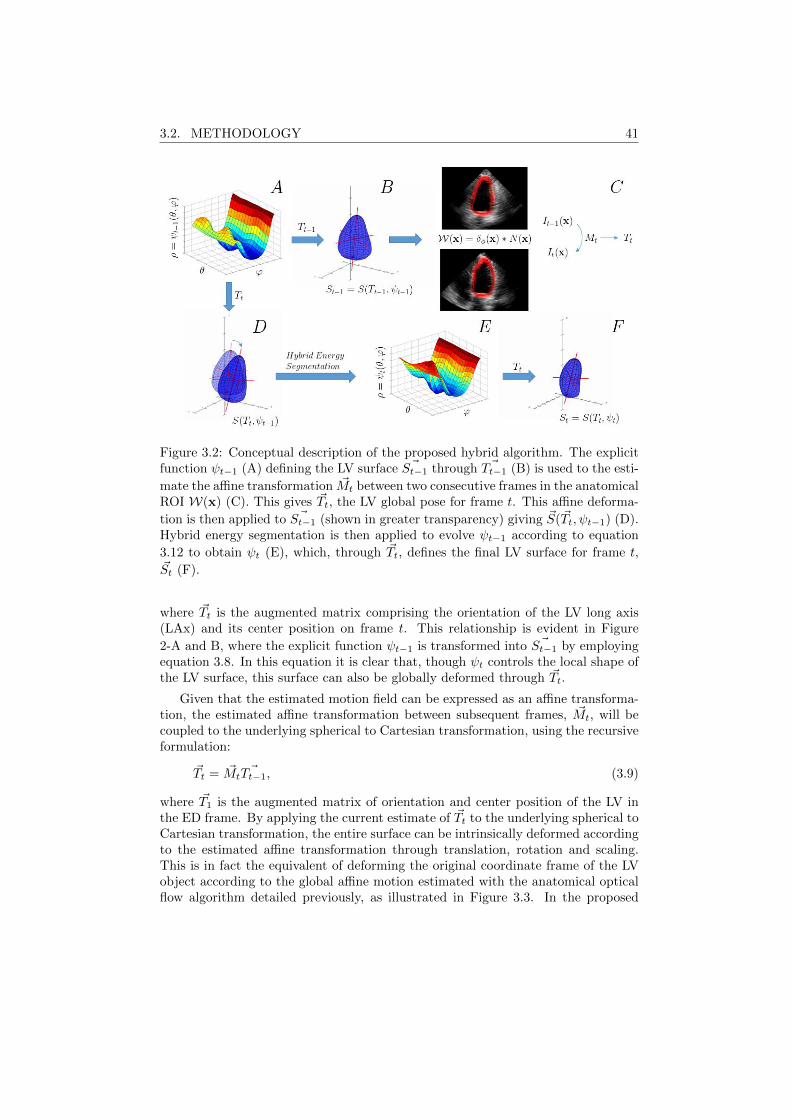
3.2. METHODOLOGY 41
Figure 3.2: Conceptual description of the proposed hybrid algorithm. The explicitfunction ψt−1 (A) defining the LV surface ~St−1 through ~Tt−1 (B) is used to the esti-
mate the affine transformation ~Mt between two consecutive frames in the anatomicalROI W(x) (C). This gives ~Tt, the LV global pose for frame t. This affine deforma-
tion is then applied to ~St−1 (shown in greater transparency) giving ~S(~Tt, ψt−1) (D).Hybrid energy segmentation is then applied to evolve ψt−1 according to equation
3.12 to obtain ψt (E), which, through ~Tt, defines the final LV surface for frame t,~St (F).
where ~Tt is the augmented matrix comprising the orientation of the LV long axis(LAx) and its center position on frame t. This relationship is evident in Figure
2-A and B, where the explicit function ψt−1 is transformed into ~St−1 by employingequation 3.8. In this equation it is clear that, though ψt controls the local shape ofthe LV surface, this surface can also be globally deformed through ~Tt.
Given that the estimated motion field can be expressed as an affine transforma-tion, the estimated affine transformation between subsequent frames, ~Mt, will becoupled to the underlying spherical to Cartesian transformation, using the recursiveformulation:
~Tt = ~Mt~Tt−1, (3.9)
where ~T1 is the augmented matrix of orientation and center position of the LV inthe ED frame. By applying the current estimate of ~Tt to the underlying spherical toCartesian transformation, the entire surface can be intrinsically deformed accordingto the estimated affine transformation through translation, rotation and scaling.This is in fact the equivalent of deforming the original coordinate frame of the LVobject according to the global affine motion estimated with the anatomical opticalflow algorithm detailed previously, as illustrated in Figure 3.3. In the proposed
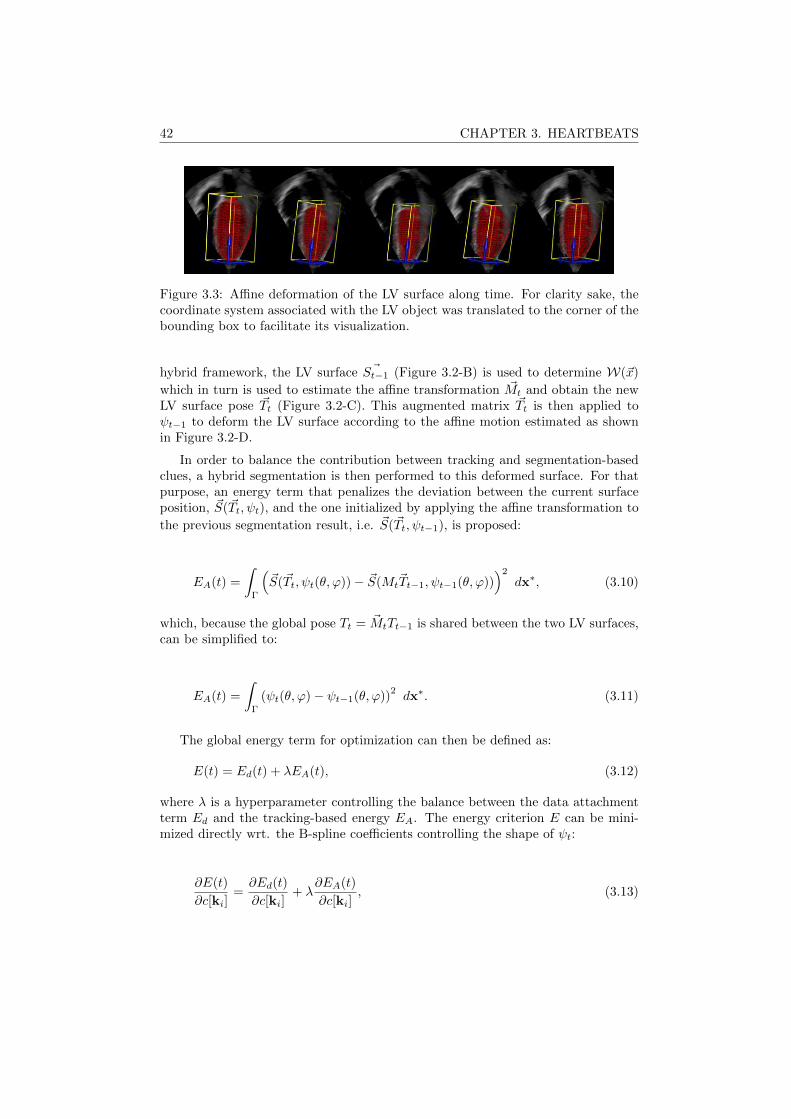
42 CHAPTER 3. HEARTBEATS
Figure 3.3: Affine deformation of the LV surface along time. For clarity sake, thecoordinate system associated with the LV object was translated to the corner of thebounding box to facilitate its visualization.
hybrid framework, the LV surface ~St−1 (Figure 3.2-B) is used to determine W(~x)
which in turn is used to estimate the affine transformation ~Mt and obtain the newLV surface pose ~Tt (Figure 3.2-C). This augmented matrix ~Tt is then applied toψt−1 to deform the LV surface according to the affine motion estimated as shownin Figure 3.2-D.
In order to balance the contribution between tracking and segmentation-basedclues, a hybrid segmentation is then performed to this deformed surface. For thatpurpose, an energy term that penalizes the deviation between the current surfaceposition, ~S(~Tt, ψt), and the one initialized by applying the affine transformation to
the previous segmentation result, i.e. ~S(~Tt, ψt−1), is proposed:
EA(t) =
∫Γ
(~S(~Tt, ψt(θ, ϕ))− ~S( ~MtTt−1, ψt−1(θ, ϕ))
)2
dx∗, (3.10)
which, because the global pose ~Tt = MtTt−1 is shared between the two LV surfaces,can be simplified to:
EA(t) =
∫Γ
(ψt(θ, ϕ)− ψt−1(θ, ϕ))2dx∗. (3.11)
The global energy term for optimization can then be defined as:
E(t) = Ed(t) + λEA(t), (3.12)
where λ is a hyperparameter controlling the balance between the data attachmentterm Ed and the tracking-based energy EA. The energy criterion E can be mini-mized directly wrt. the B-spline coefficients controlling the shape of ψt:
∂E(t)
∂c[ki]=∂Ed(t)
∂c[ki]+ λ
∂EA(t)
∂c[ki], (3.13)

3.3. EXPERIMENTS AND RESULTS 43
where ∂Ed(t)/∂c[ki] is defined according to equation 2.11 and ∂Ed(t)/∂c[ki] can beexpressed through equation 2.4 where
g(x∗) = ψt(θ, ϕ)−ψt−1(θ, ϕ). (3.14)
Note that even though the affine transform parameters are not explicitly statedthrough E(t), these are present in the term EA(t) as shown in equation 3.10. Thisterm penalizes the deviation from the LV surface position after the affine deforma-tion, guaranteeing that the data attachment term from the segmentation energyfunctional only modifies the segmented LV surface in regions where strong imagecontent is available. Thus, LV regions with reduced image content are preferablytracked with the global affine deformations via optical flow estimation, while re-gions with rich image content rely mostly on the image data. Therefore, there is anintrinsic trade-off between global, robust tracking and localized, accurate surfacepositioning.
By performing this hybrid segmentation, the explicit function ψt is then obtained(Figure 3.2-E), which, through ~Tt, defines the final LV surface for frame t, ~St (Figure3.2-F) and thus enabling to restart the process for the next frame.
3.2.4 Implementation Details
In order to speed-up the estimation ofW(~x), the convolution expressed in equa-tion 3.7 defining the anatomical ROI where EM is evaluated was simplified byassuming that δφ(~x) is different from zero only in the positions of the discretizedBEAS surface. N was defined as a 11x11x11 cube centered in the target point. Theimage gradient ∇I was estimated using a Gaussian derivative kernel with σ = 1,implemented as a separable convolution operation. Since differential optical flow ap-proaches are best suited to estimate small displacements, the optimization of EM (t)was performed using an iterative displacement refinement scheme to improve theaccuracy and robustness of the affine motion ~Mt estimation [180]. Five iterationswere used in all experiments.
The hyperparameter λ controlling the balance between the segmentation andtracking-based terms in equation 3.12 was empirically set to 0.25. As in previousBEAS implementations for the LV [165], the angular discretization of the boundaryφ was set to 24 × 16 and the B-spline scale h to 21. The mask function B(~x, ~y)was restricted to the points along the normal direction of the surface at a distancesmaller than 16mm as in [165]. The optimization of the global segmentation energyE(t) was implemented in a modified gradient descent with feedback step adjustmentas in previous BEAS implementations [165].
3.3 Experiments and Results
Twenty-four RT3DE exams were acquired using a Siemens Acuson SC2000 rev.1.5 (Siemens Ultrasound, Mountain View, CA) using a 4Z1c matrix transducer.
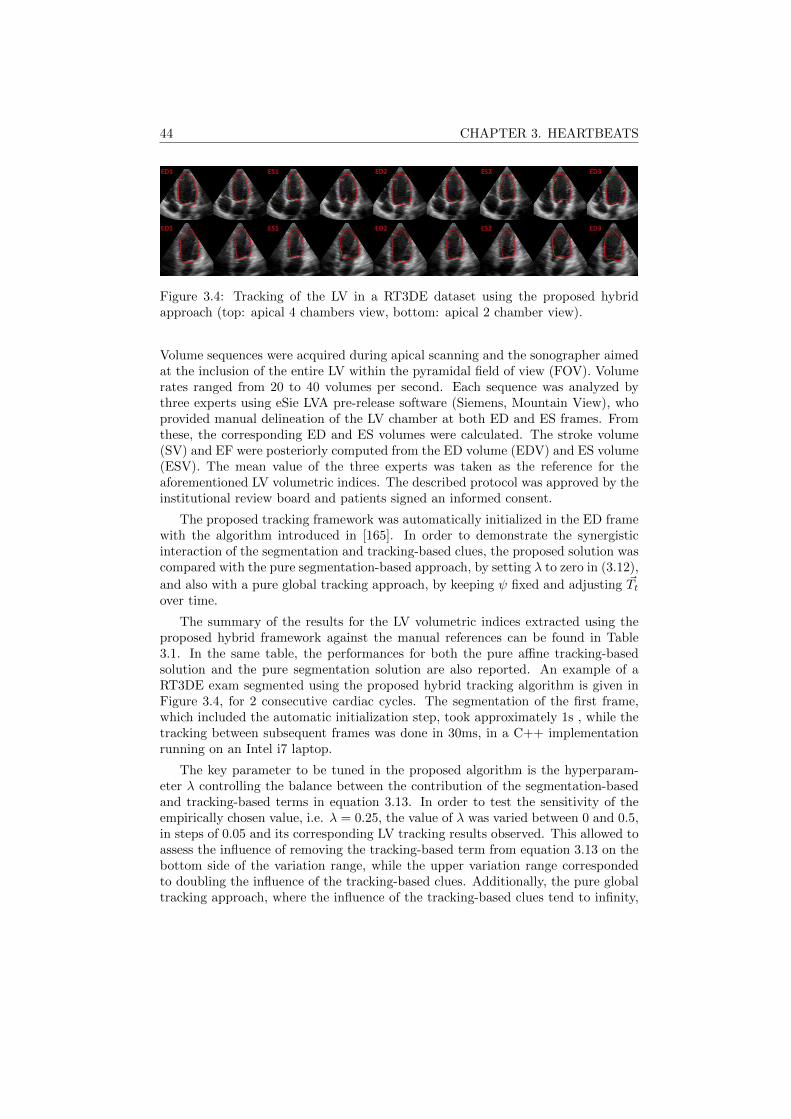
44 CHAPTER 3. HEARTBEATS
Figure 3.4: Tracking of the LV in a RT3DE dataset using the proposed hybridapproach (top: apical 4 chambers view, bottom: apical 2 chamber view).
Volume sequences were acquired during apical scanning and the sonographer aimedat the inclusion of the entire LV within the pyramidal field of view (FOV). Volumerates ranged from 20 to 40 volumes per second. Each sequence was analyzed bythree experts using eSie LVA pre-release software (Siemens, Mountain View), whoprovided manual delineation of the LV chamber at both ED and ES frames. Fromthese, the corresponding ED and ES volumes were calculated. The stroke volume(SV) and EF were posteriorly computed from the ED volume (EDV) and ES volume(ESV). The mean value of the three experts was taken as the reference for theaforementioned LV volumetric indices. The described protocol was approved by theinstitutional review board and patients signed an informed consent.
The proposed tracking framework was automatically initialized in the ED framewith the algorithm introduced in [165]. In order to demonstrate the synergisticinteraction of the segmentation and tracking-based clues, the proposed solution wascompared with the pure segmentation-based approach, by setting λ to zero in (3.12),
and also with a pure global tracking approach, by keeping ψ fixed and adjusting ~Ttover time.
The summary of the results for the LV volumetric indices extracted using theproposed hybrid framework against the manual references can be found in Table3.1. In the same table, the performances for both the pure affine tracking-basedsolution and the pure segmentation solution are also reported. An example of aRT3DE exam segmented using the proposed hybrid tracking algorithm is given inFigure 3.4, for 2 consecutive cardiac cycles. The segmentation of the first frame,which included the automatic initialization step, took approximately 1s , while thetracking between subsequent frames was done in 30ms, in a C++ implementationrunning on an Intel i7 laptop.
The key parameter to be tuned in the proposed algorithm is the hyperparam-eter λ controlling the balance between the contribution of the segmentation-basedand tracking-based terms in equation 3.13. In order to test the sensitivity of theempirically chosen value, i.e. λ = 0.25, the value of λ was varied between 0 and 0.5,in steps of 0.05 and its corresponding LV tracking results observed. This allowed toassess the influence of removing the tracking-based term from equation 3.13 on thebottom side of the variation range, while the upper variation range correspondedto doubling the influence of the tracking-based clues. Additionally, the pure globaltracking approach, where the influence of the tracking-based clues tend to infinity,
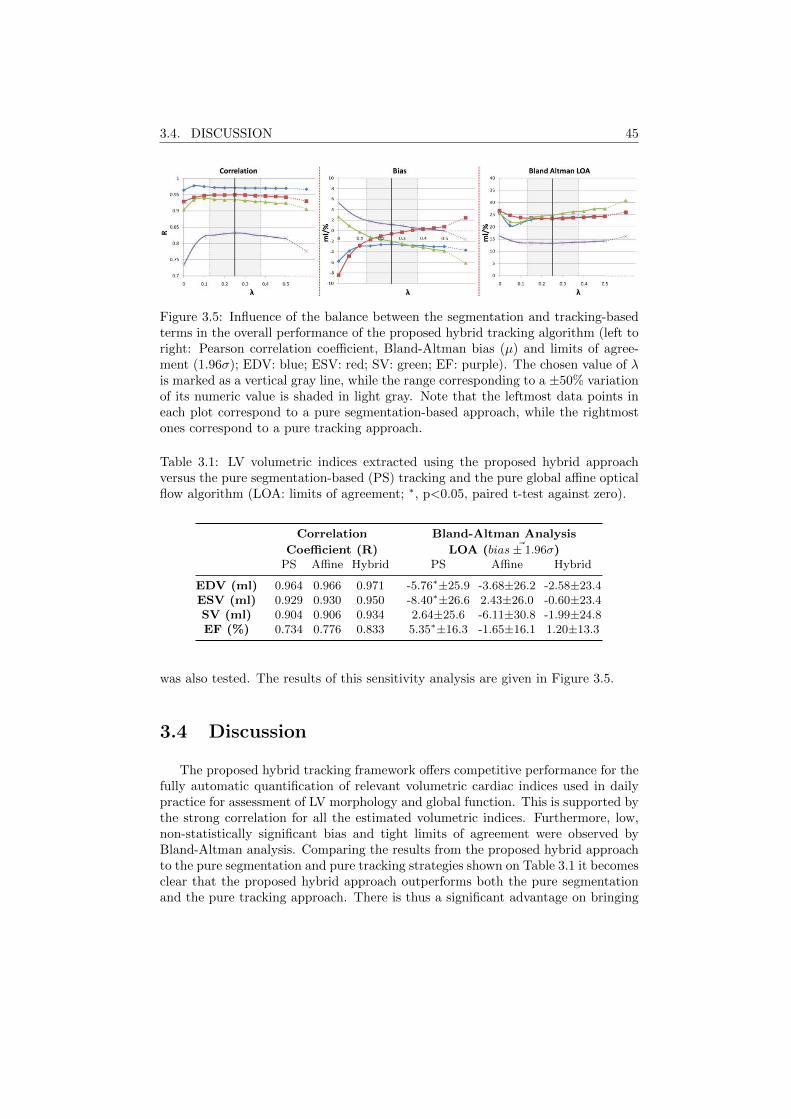
3.4. DISCUSSION 45
Figure 3.5: Influence of the balance between the segmentation and tracking-basedterms in the overall performance of the proposed hybrid tracking algorithm (left toright: Pearson correlation coefficient, Bland-Altman bias (µ) and limits of agree-ment (1.96σ); EDV: blue; ESV: red; SV: green; EF: purple). The chosen value of λis marked as a vertical gray line, while the range corresponding to a ±50% variationof its numeric value is shaded in light gray. Note that the leftmost data points ineach plot correspond to a pure segmentation-based approach, while the rightmostones correspond to a pure tracking approach.
Table 3.1: LV volumetric indices extracted using the proposed hybrid approachversus the pure segmentation-based (PS) tracking and the pure global affine opticalflow algorithm (LOA: limits of agreement; ∗, p<0.05, paired t-test against zero).
Correlation Bland-Altman Analysis
Coefficient (R) LOA ( ~bias± 1.96σ)PS Affine Hybrid PS Affine Hybrid
EDV (ml) 0.964 0.966 0.971 -5.76∗±25.9 -3.68±26.2 -2.58±23.4ESV (ml) 0.929 0.930 0.950 -8.40∗±26.6 2.43±26.0 -0.60±23.4SV (ml) 0.904 0.906 0.934 2.64±25.6 -6.11±30.8 -1.99±24.8EF (%) 0.734 0.776 0.833 5.35∗±16.3 -1.65±16.1 1.20±13.3
was also tested. The results of this sensitivity analysis are given in Figure 3.5.
3.4 Discussion
The proposed hybrid tracking framework offers competitive performance for thefully automatic quantification of relevant volumetric cardiac indices used in dailypractice for assessment of LV morphology and global function. This is supported bythe strong correlation for all the estimated volumetric indices. Furthermore, low,non-statistically significant bias and tight limits of agreement were observed byBland-Altman analysis. Comparing the results from the proposed hybrid approachto the pure segmentation and pure tracking strategies shown on Table 3.1 it becomesclear that the proposed hybrid approach outperforms both the pure segmentationand the pure tracking approach. There is thus a significant advantage on bringing
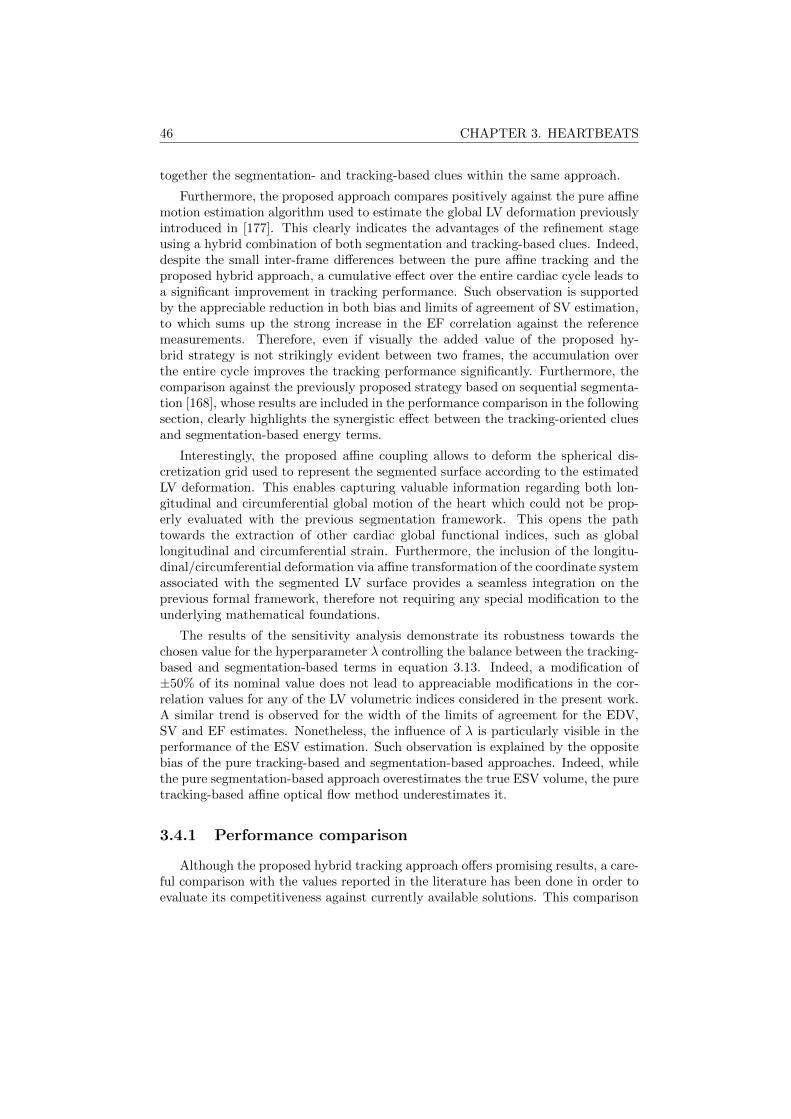
46 CHAPTER 3. HEARTBEATS
together the segmentation- and tracking-based clues within the same approach.
Furthermore, the proposed approach compares positively against the pure affinemotion estimation algorithm used to estimate the global LV deformation previouslyintroduced in [177]. This clearly indicates the advantages of the refinement stageusing a hybrid combination of both segmentation and tracking-based clues. Indeed,despite the small inter-frame differences between the pure affine tracking and theproposed hybrid approach, a cumulative effect over the entire cardiac cycle leads toa significant improvement in tracking performance. Such observation is supportedby the appreciable reduction in both bias and limits of agreement of SV estimation,to which sums up the strong increase in the EF correlation against the referencemeasurements. Therefore, even if visually the added value of the proposed hy-brid strategy is not strikingly evident between two frames, the accumulation overthe entire cycle improves the tracking performance significantly. Furthermore, thecomparison against the previously proposed strategy based on sequential segmenta-tion [168], whose results are included in the performance comparison in the followingsection, clearly highlights the synergistic effect between the tracking-oriented cluesand segmentation-based energy terms.
Interestingly, the proposed affine coupling allows to deform the spherical dis-cretization grid used to represent the segmented surface according to the estimatedLV deformation. This enables capturing valuable information regarding both lon-gitudinal and circumferential global motion of the heart which could not be prop-erly evaluated with the previous segmentation framework. This opens the pathtowards the extraction of other cardiac global functional indices, such as globallongitudinal and circumferential strain. Furthermore, the inclusion of the longitu-dinal/circumferential deformation via affine transformation of the coordinate systemassociated with the segmented LV surface provides a seamless integration on theprevious formal framework, therefore not requiring any special modification to theunderlying mathematical foundations.
The results of the sensitivity analysis demonstrate its robustness towards thechosen value for the hyperparameter λ controlling the balance between the tracking-based and segmentation-based terms in equation 3.13. Indeed, a modification of±50% of its nominal value does not lead to appreaciable modifications in the cor-relation values for any of the LV volumetric indices considered in the present work.A similar trend is observed for the width of the limits of agreement for the EDV,SV and EF estimates. Nonetheless, the influence of λ is particularly visible in theperformance of the ESV estimation. Such observation is explained by the oppositebias of the pure tracking-based and segmentation-based approaches. Indeed, whilethe pure segmentation-based approach overestimates the true ESV volume, the puretracking-based affine optical flow method underestimates it.
3.4.1 Performance comparison
Although the proposed hybrid tracking approach offers promising results, a care-ful comparison with the values reported in the literature has been done in order toevaluate its competitiveness against currently available solutions. This comparison
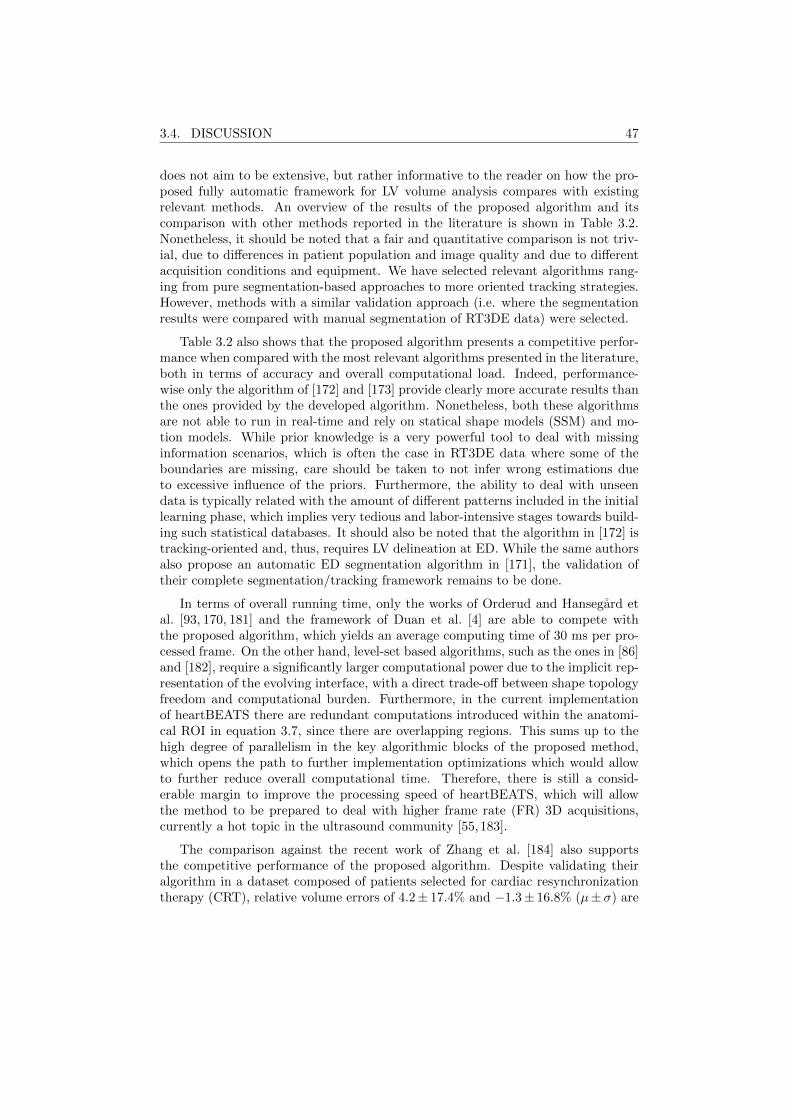
3.4. DISCUSSION 47
does not aim to be extensive, but rather informative to the reader on how the pro-posed fully automatic framework for LV volume analysis compares with existingrelevant methods. An overview of the results of the proposed algorithm and itscomparison with other methods reported in the literature is shown in Table 3.2.Nonetheless, it should be noted that a fair and quantitative comparison is not triv-ial, due to differences in patient population and image quality and due to differentacquisition conditions and equipment. We have selected relevant algorithms rang-ing from pure segmentation-based approaches to more oriented tracking strategies.However, methods with a similar validation approach (i.e. where the segmentationresults were compared with manual segmentation of RT3DE data) were selected.
Table 3.2 also shows that the proposed algorithm presents a competitive perfor-mance when compared with the most relevant algorithms presented in the literature,both in terms of accuracy and overall computational load. Indeed, performance-wise only the algorithm of [172] and [173] provide clearly more accurate results thanthe ones provided by the developed algorithm. Nonetheless, both these algorithmsare not able to run in real-time and rely on statical shape models (SSM) and mo-tion models. While prior knowledge is a very powerful tool to deal with missinginformation scenarios, which is often the case in RT3DE data where some of theboundaries are missing, care should be taken to not infer wrong estimations dueto excessive influence of the priors. Furthermore, the ability to deal with unseendata is typically related with the amount of different patterns included in the initiallearning phase, which implies very tedious and labor-intensive stages towards build-ing such statistical databases. It should also be noted that the algorithm in [172] istracking-oriented and, thus, requires LV delineation at ED. While the same authorsalso propose an automatic ED segmentation algorithm in [171], the validation oftheir complete segmentation/tracking framework remains to be done.
In terms of overall running time, only the works of Orderud and Hansegard etal. [93, 170, 181] and the framework of Duan et al. [4] are able to compete withthe proposed algorithm, which yields an average computing time of 30 ms per pro-cessed frame. On the other hand, level-set based algorithms, such as the ones in [86]and [182], require a significantly larger computational power due to the implicit rep-resentation of the evolving interface, with a direct trade-off between shape topologyfreedom and computational burden. Furthermore, in the current implementationof heartBEATS there are redundant computations introduced within the anatomi-cal ROI in equation 3.7, since there are overlapping regions. This sums up to thehigh degree of parallelism in the key algorithmic blocks of the proposed method,which opens the path to further implementation optimizations which would allowto further reduce overall computational time. Therefore, there is still a consid-erable margin to improve the processing speed of heartBEATS, which will allowthe method to be prepared to deal with higher frame rate (FR) 3D acquisitions,currently a hot topic in the ultrasound community [55,183].
The comparison against the recent work of Zhang et al. [184] also supportsthe competitive performance of the proposed algorithm. Despite validating theiralgorithm in a dataset composed of patients selected for cardiac resynchronizationtherapy (CRT), relative volume errors of 4.2± 17.4% and −1.3± 16.8% (µ± σ) are
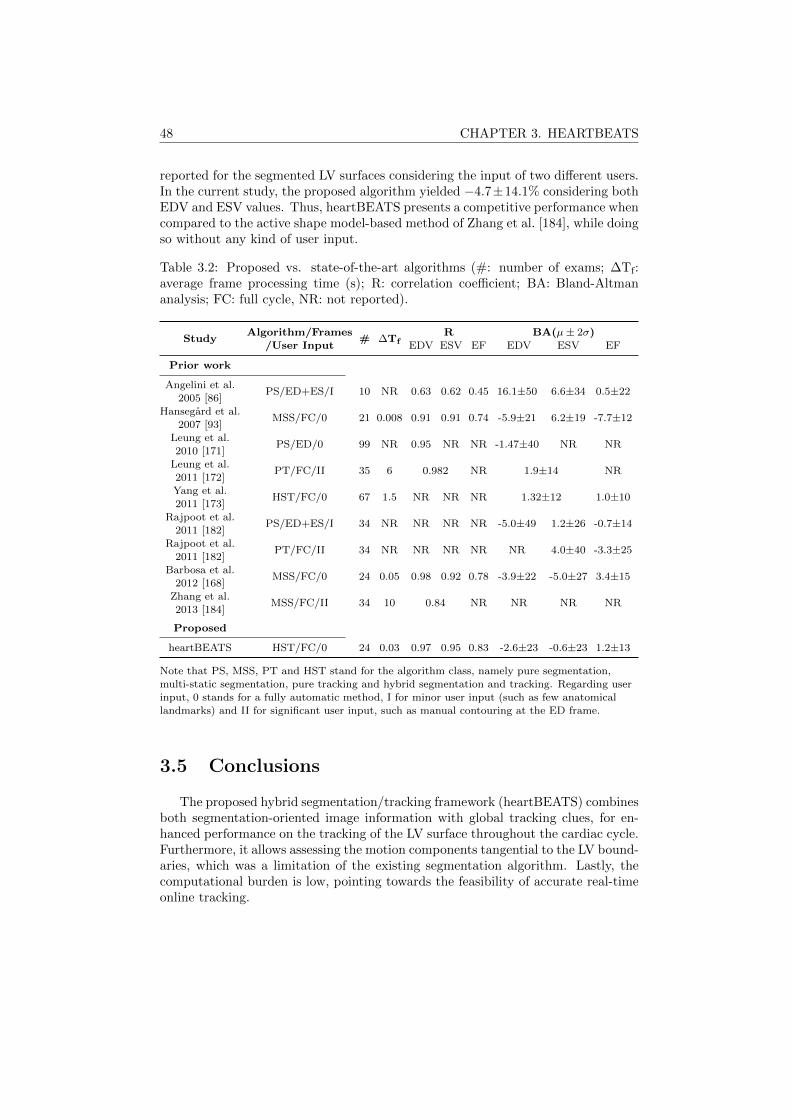
48 CHAPTER 3. HEARTBEATS
reported for the segmented LV surfaces considering the input of two different users.In the current study, the proposed algorithm yielded −4.7±14.1% considering bothEDV and ESV values. Thus, heartBEATS presents a competitive performance whencompared to the active shape model-based method of Zhang et al. [184], while doingso without any kind of user input.
Table 3.2: Proposed vs. state-of-the-art algorithms (#: number of exams; ∆Tf:average frame processing time (s); R: correlation coefficient; BA: Bland-Altmananalysis; FC: full cycle, NR: not reported).
StudyAlgorithm/Frames
# ∆TfR BA(µ± 2σ)
/User Input EDV ESV EF EDV ESV EF
Prior work
Angelini et al.PS/ED+ES/I 10 NR 0.63 0.62 0.45 16.1±50 6.6±34 0.5±22
2005 [86]Hansegard et al.
MSS/FC/0 21 0.008 0.91 0.91 0.74 -5.9±21 6.2±19 -7.7±122007 [93]
Leung et al.PS/ED/0 99 NR 0.95 NR NR -1.47±40 NR NR
2010 [171]Leung et al.
PT/FC/II 35 6 0.982 NR 1.9±14 NR2011 [172]Yang et al.
HST/FC/0 67 1.5 NR NR NR 1.32±12 1.0±102011 [173]
Rajpoot et al.PS/ED+ES/I 34 NR NR NR NR -5.0±49 1.2±26 -0.7±14
2011 [182]Rajpoot et al.
PT/FC/II 34 NR NR NR NR NR 4.0±40 -3.3±252011 [182]
Barbosa et al.MSS/FC/0 24 0.05 0.98 0.92 0.78 -3.9±22 -5.0±27 3.4±15
2012 [168]Zhang et al.
MSS/FC/II 34 10 0.84 NR NR NR NR2013 [184]
Proposed
heartBEATS HST/FC/0 24 0.03 0.97 0.95 0.83 -2.6±23 -0.6±23 1.2±13
Note that PS, MSS, PT and HST stand for the algorithm class, namely pure segmentation,multi-static segmentation, pure tracking and hybrid segmentation and tracking. Regarding userinput, 0 stands for a fully automatic method, I for minor user input (such as few anatomicallandmarks) and II for significant user input, such as manual contouring at the ED frame.
3.5 Conclusions
The proposed hybrid segmentation/tracking framework (heartBEATS) combinesboth segmentation-oriented image information with global tracking clues, for en-hanced performance on the tracking of the LV surface throughout the cardiac cycle.Furthermore, it allows assessing the motion components tangential to the LV bound-aries, which was a limitation of the existing segmentation algorithm. Lastly, thecomputational burden is low, pointing towards the feasibility of accurate real-timeonline tracking.

Chapter 4
Automatic Short AxisOrientation of the LeftVentricle in 3D UltrasoundRecordings
This chapter is based on a paper published in the proceedings of the 2016 SPIE MedicalImaging: Ultrasonic Imaging and Tomography: Pedrosa, J., Heyde, B., Heeren, L., Engvall,J., Zamorano, J., Papachristidis, A., Edvardsen, T., Claus, P. and D’hooge, J.; Automatic shortaxis orientation of the left ventricle in 3D ultrasound recordings. 2016 SPIE Medical Imagingproceedings, Vol.9790, 9790E.
49
50 CHAPTER 4. AUTOMATIC SHORT AXIS ORIENTATION
Abstract
The recent advent of real-time 3D echocardiography (RT3DE) has led to anincreased interest from the scientific community in left ventricle (LV) segmentationframeworks for cardiac volume and function assessment. An automatic orientationof the segmented LV mesh is an important step to obtain a point-to-point corre-spondence between the mesh and the cardiac anatomy. Furthermore, this wouldallow for an automatic division of the LV into the standard 17 segments and, thus,fully automatic per-segment analysis, e.g. regional strain assessment. In this work,a method for fully automatic short axis (SAx) orientation of the segmented LV ispresented. The proposed framework aims at detecting the inferior right ventricu-lar (RV) insertion point. 211 RT3DE images were used to validate this frameworkby comparison to manual annotation of the inferior RV insertion point. A meanunsigned error of 8.05± 18.50 was found, whereas the mean signed error was1.09. Large deviations between the manual and automatic annotations (> 30)only occurred in 3.79% of cases. The average computation time was 666ms in anon-optimized MATLAB environment, which allows for real-time application. Inconclusion, a successful automatic real-time method for orientation of the segmentedLV is proposed.
4.1 Introduction
LV segmentation has become an essential task in cardiovascular medicine forcardiac volume and function assessment. The recent advent of RT3DE has madethis modality especially promising for clinical practice and attracted the attentionof the scientific community for the development of segmentation frameworks [76].Nevertheless, to take full advantage of the information obtained from LV segmen-tation, an orientation of the segmented mesh is an essential step. This allows fora point-to-point correspondence between the mesh and the cardiac anatomy and,as such, makes an automatic division of the LV into its 17 segments possible. Thisis especially significant for the application of post-processing techniques such asregional strain assessment [185] or shape feature based statistical models [186].
While several approaches for LV long axis (LAx) orientation have been proposedin literature, little attention has been given to SAx orientation of the LV and ap-proaches looking beyond LAx orientation tend to focus only on the detection of thestandard view planes (i.e. 2-, 3- and 4-chamber views). [100, 187–189] Though thisis a similar problem, these methods do not give a precise SAx orientation as thestandard view planes are quite loosely defined within an interval.
As such, a method for fully automatic real-time SAx orientation of the LV isproposed in the present work. The proposed method relies on a prior LV seg-mentation, which is performed using the B-spline Explicit Active Surfaces (BEAS)framework [3]. The SAx orientation itself depends on the detection of the inferiorRV insertion using both image intensity and structural information.

4.2. METHODOLOGY 51
4.2 Methodology
The automatic LAx orientation and LV initialization and segmentation wereperformed according to the method of Barbosa et al. [165] as detailed in Section2.6.
4.2.1 Short Axis Orientation
Due to the near cylindrical symmetry of the LV, SAx orientation cannot relyon the LV shape but must rely on the detection of particular landmarks such as theRV and its insertion points, the aortic valve (AV) or the papillary muscles. Fromthese, the inferior RV insertion point is especially promising as it can be seen evenin lower quality images and can be found throughout the longitudinal extensionof the LV, making its detection less susceptible to artifacts. As such, the inferiorRV insertion point was selected as the preferred landmark for the SAx orientationframework proposed.
The proposed framework can be divided into two modules. The first consists ofthe extraction of the image intensity information around the LV to detect candidatesfor the insertion point. The second uses the Hough transform for circles (HTc) as inthe initialization to locate the RV and right atrium (RA) around the LV. The resultsfrom the two modules are then joined to choose a final candidate. A schematicdiagram of this SAx orientation framework is shown in Figure 4.1.
Figure 4.1: Schematic diagram of the SAx orientation framework. (a) Image intensityprofile extraction: The region of interest (ROI) from the segmented LV mesh is selected(shown in red) and the intensity outside the LV is extracted in several C-planes along theindividually colored curves shown. The intensities are then averaged to obtain a singlecircumferential intensity profile (red) and its associated Laplacian (black). (b) Structureinformation extraction using HTc: Equally spaced C-planes along the LAx are selectedand edge detection is performed in each plane, followed by HTc. Alignment according tothe LAx gives an averaged HTc from which the intensity is extracted (red points) to thenobtain a circumferential HTc profile.
The extraction of the image intensity takes advantage of the BEAS structure
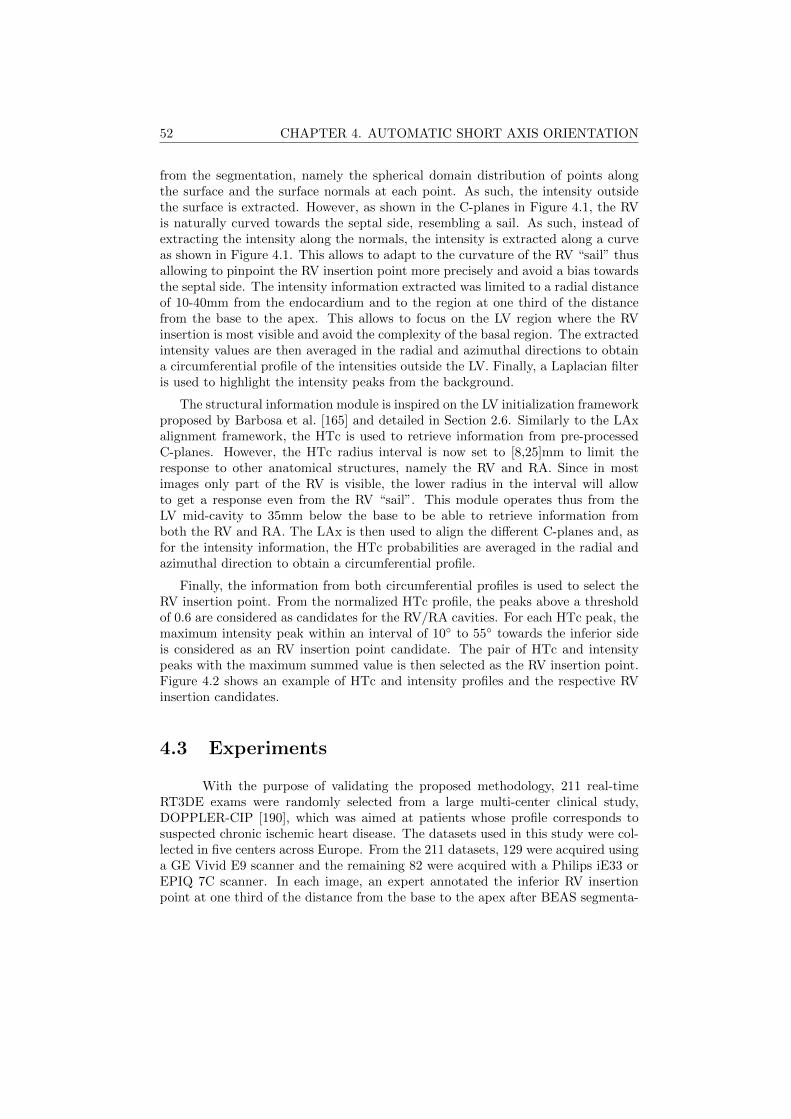
52 CHAPTER 4. AUTOMATIC SHORT AXIS ORIENTATION
from the segmentation, namely the spherical domain distribution of points alongthe surface and the surface normals at each point. As such, the intensity outsidethe surface is extracted. However, as shown in the C-planes in Figure 4.1, the RVis naturally curved towards the septal side, resembling a sail. As such, instead ofextracting the intensity along the normals, the intensity is extracted along a curveas shown in Figure 4.1. This allows to adapt to the curvature of the RV “sail” thusallowing to pinpoint the RV insertion point more precisely and avoid a bias towardsthe septal side. The intensity information extracted was limited to a radial distanceof 10-40mm from the endocardium and to the region at one third of the distancefrom the base to the apex. This allows to focus on the LV region where the RVinsertion is most visible and avoid the complexity of the basal region. The extractedintensity values are then averaged in the radial and azimuthal directions to obtaina circumferential profile of the intensities outside the LV. Finally, a Laplacian filteris used to highlight the intensity peaks from the background.
The structural information module is inspired on the LV initialization frameworkproposed by Barbosa et al. [165] and detailed in Section 2.6. Similarly to the LAxalignment framework, the HTc is used to retrieve information from pre-processedC-planes. However, the HTc radius interval is now set to [8,25]mm to limit theresponse to other anatomical structures, namely the RV and RA. Since in mostimages only part of the RV is visible, the lower radius in the interval will allowto get a response even from the RV “sail”. This module operates thus from theLV mid-cavity to 35mm below the base to be able to retrieve information fromboth the RV and RA. The LAx is then used to align the different C-planes and, asfor the intensity information, the HTc probabilities are averaged in the radial andazimuthal direction to obtain a circumferential profile.
Finally, the information from both circumferential profiles is used to select theRV insertion point. From the normalized HTc profile, the peaks above a thresholdof 0.6 are considered as candidates for the RV/RA cavities. For each HTc peak, themaximum intensity peak within an interval of 10 to 55 towards the inferior sideis considered as an RV insertion point candidate. The pair of HTc and intensitypeaks with the maximum summed value is then selected as the RV insertion point.Figure 4.2 shows an example of HTc and intensity profiles and the respective RVinsertion candidates.
4.3 Experiments
With the purpose of validating the proposed methodology, 211 real-timeRT3DE exams were randomly selected from a large multi-center clinical study,DOPPLER-CIP [190], which was aimed at patients whose profile corresponds tosuspected chronic ischemic heart disease. The datasets used in this study were col-lected in five centers across Europe. From the 211 datasets, 129 were acquired usinga GE Vivid E9 scanner and the remaining 82 were acquired with a Philips iE33 orEPIQ 7C scanner. In each image, an expert annotated the inferior RV insertionpoint at one third of the distance from the base to the apex after BEAS segmenta-
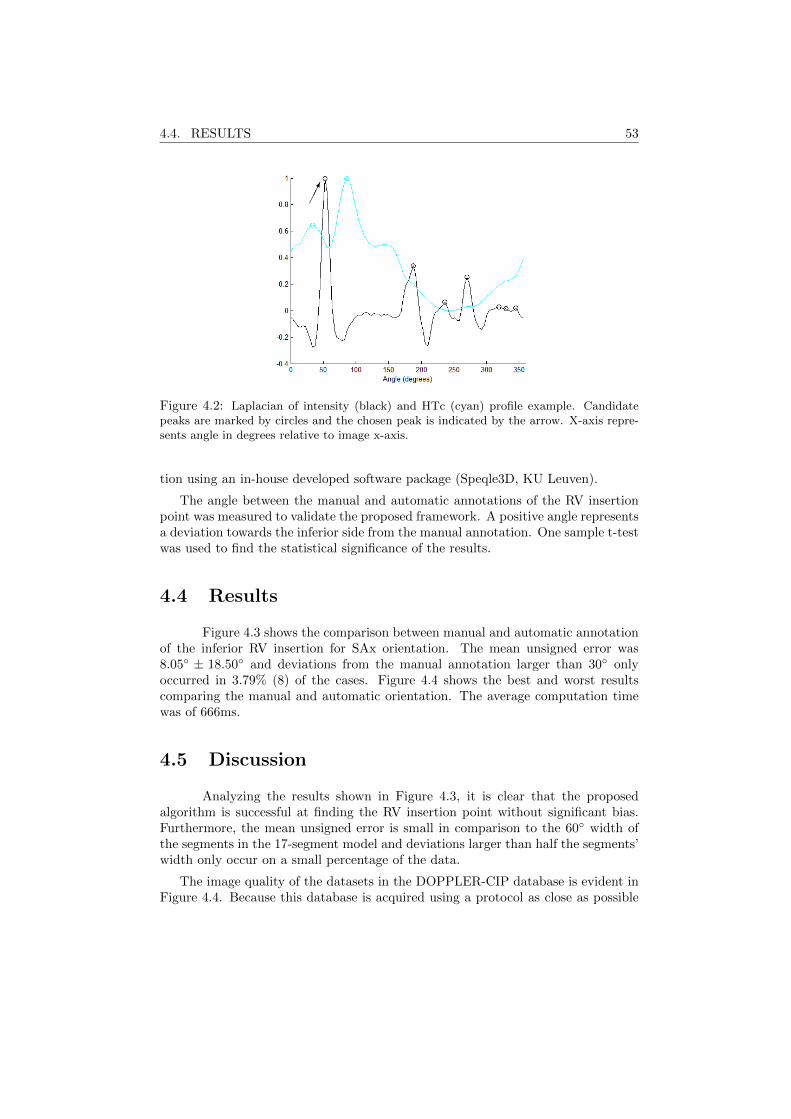
4.4. RESULTS 53
Figure 4.2: Laplacian of intensity (black) and HTc (cyan) profile example. Candidatepeaks are marked by circles and the chosen peak is indicated by the arrow. X-axis repre-sents angle in degrees relative to image x-axis.
tion using an in-house developed software package (Speqle3D, KU Leuven).
The angle between the manual and automatic annotations of the RV insertionpoint was measured to validate the proposed framework. A positive angle representsa deviation towards the inferior side from the manual annotation. One sample t-testwas used to find the statistical significance of the results.
4.4 Results
Figure 4.3 shows the comparison between manual and automatic annotationof the inferior RV insertion for SAx orientation. The mean unsigned error was8.05 ± 18.50 and deviations from the manual annotation larger than 30 onlyoccurred in 3.79% (8) of the cases. Figure 4.4 shows the best and worst resultscomparing the manual and automatic orientation. The average computation timewas of 666ms.
4.5 Discussion
Analyzing the results shown in Figure 4.3, it is clear that the proposedalgorithm is successful at finding the RV insertion point without significant bias.Furthermore, the mean unsigned error is small in comparison to the 60 width ofthe segments in the 17-segment model and deviations larger than half the segments’width only occur on a small percentage of the data.
The image quality of the datasets in the DOPPLER-CIP database is evident inFigure 4.4. Because this database is acquired using a protocol as close as possible
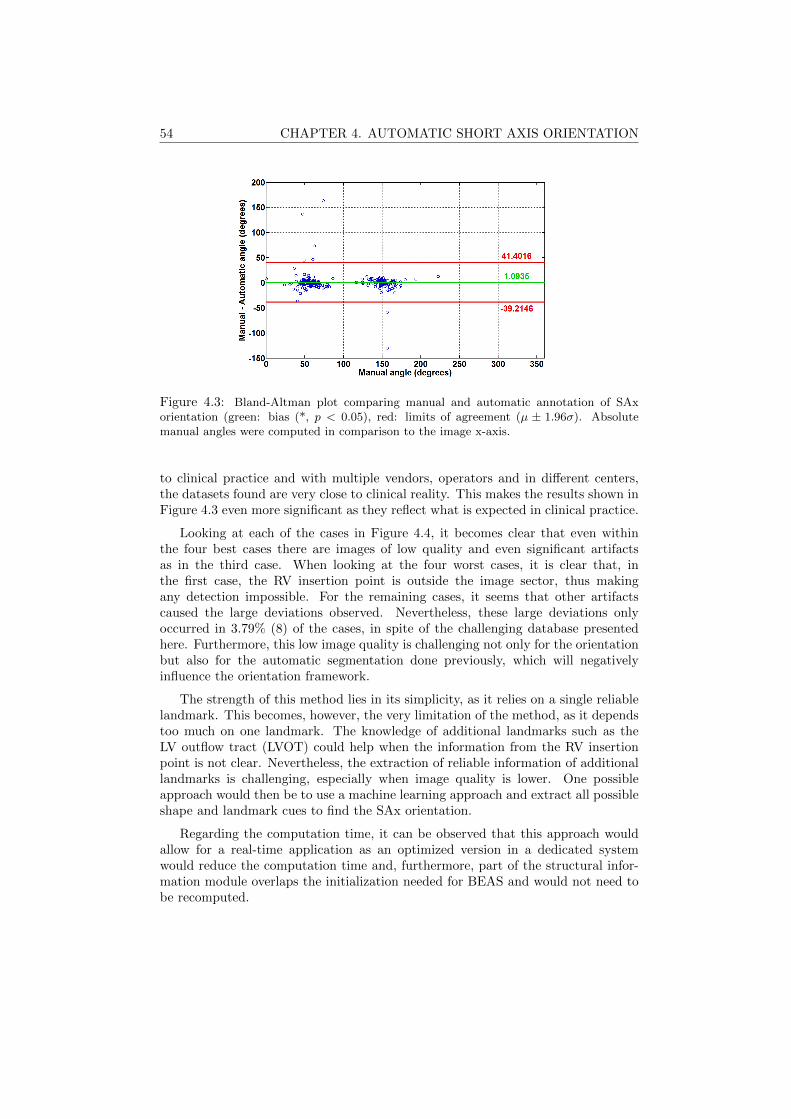
54 CHAPTER 4. AUTOMATIC SHORT AXIS ORIENTATION
Figure 4.3: Bland-Altman plot comparing manual and automatic annotation of SAxorientation (green: bias (*, p < 0.05), red: limits of agreement (µ ± 1.96σ). Absolutemanual angles were computed in comparison to the image x-axis.
to clinical practice and with multiple vendors, operators and in different centers,the datasets found are very close to clinical reality. This makes the results shown inFigure 4.3 even more significant as they reflect what is expected in clinical practice.
Looking at each of the cases in Figure 4.4, it becomes clear that even withinthe four best cases there are images of low quality and even significant artifactsas in the third case. When looking at the four worst cases, it is clear that, inthe first case, the RV insertion point is outside the image sector, thus makingany detection impossible. For the remaining cases, it seems that other artifactscaused the large deviations observed. Nevertheless, these large deviations onlyoccurred in 3.79% (8) of the cases, in spite of the challenging database presentedhere. Furthermore, this low image quality is challenging not only for the orientationbut also for the automatic segmentation done previously, which will negativelyinfluence the orientation framework.
The strength of this method lies in its simplicity, as it relies on a single reliablelandmark. This becomes, however, the very limitation of the method, as it dependstoo much on one landmark. The knowledge of additional landmarks such as theLV outflow tract (LVOT) could help when the information from the RV insertionpoint is not clear. Nevertheless, the extraction of reliable information of additionallandmarks is challenging, especially when image quality is lower. One possibleapproach would then be to use a machine learning approach and extract all possibleshape and landmark cues to find the SAx orientation.
Regarding the computation time, it can be observed that this approach wouldallow for a real-time application as an optimized version in a dedicated systemwould reduce the computation time and, furthermore, part of the structural infor-mation module overlaps the initialization needed for BEAS and would not need tobe recomputed.
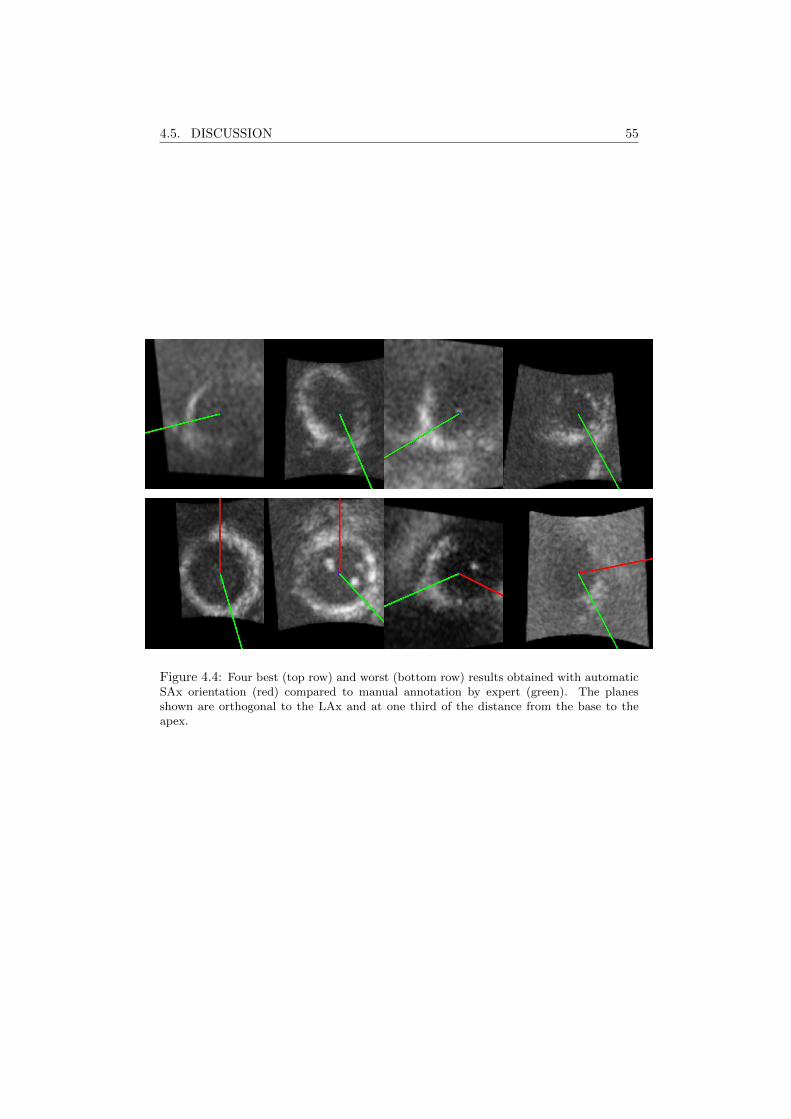
4.5. DISCUSSION 55
Figure 4.4: Four best (top row) and worst (bottom row) results obtained with automaticSAx orientation (red) compared to manual annotation by expert (green). The planesshown are orthogonal to the LAx and at one third of the distance from the base to theapex.

56 CHAPTER 4. AUTOMATIC SHORT AXIS ORIENTATION
4.6 Conclusions
In conclusion, the proposed approach is able to perform automatic real-timeorientation of a segmented LV mesh by accurately detecting the inferior RV insertionpoint. The proposed method is applicable to images even with low image qualityacquired in a clinical setting. This is due to the simple approach depending on areliable landmark, the inferior RV insertion point.
Chapter 5
Fast and Fully AutomaticLeft VentricularSegmentation and Trackingin Echocardiography UsingShape-Based B-SplineExplicit Active Surfaces
This chapter is based on a paper published in IEEE Transactions on Medical Imaging: Pe-drosa J., Queiros S., Bernard O., Engvall J., Edvardsen T., Nagel E., D’hooge J.. Fast and FullyAutomatic Left Ventricular Segmentation and Tracking in Echocardiography Using Shape-BasedB-Spline Explicit Active Surfaces. IEEE Transactions on Medical Imaging 2017 Nov;36(11):2287-96.
57
58 CHAPTER 5. SHAPE-BASED ENDOCARDIAL SEGMENTATION
Abstract
Cardiac volume/function assessment remains a critical step in daily cardiologyand 3D ultrasound plays an increasingly important role. Fully automatic left ven-tricle (LV) segmentation is, however, a challenging task due to the artifacts andlow contrast-to-noise ratio of ultrasound imaging. In this chapter, a fast and fullyautomatic framework for full cycle endocardial LV segmentation is proposed. Thisapproach couples the advantages of the B-spline Explicit Active Surface (BEAS)framework, a purely image information approach, to those of statistical shape mod-els (SSM) to give prior information about the expected shape for an accurate seg-mentation. The segmentation is propagated throughout the heart cycle using alocalized anatomical affine optical flow (lAAOF). It is shown that this approachnot only outperforms other state-of-the-art methods in terms of distance metricswith mean absolute distance (MAD) of 1.81± 0.59 mm and 1.98± 0.66 mm at enddiastole (ED) and end systole (ES) respectively but is computationally efficient (inaverage 11 seconds per 4D image) and fully automatic.
5.1 Introduction
Analysis of cardiac function, and specifically of LV function, is an important partof clinical cardiology for patient management, disease diagnosis, risk stratification ortherapy selection [5–7]. Among the different cardiac imaging modalities, real-time3D echocardiography (RT3DE) stands out as a low-cost, portable, risk-free and non-invasive technique with good space and time resolution. However, RT3DE posesseveral challenges due to its low contrast-to-noise ratio, the presence of artifactsand the dependence on the acquisition conditions [76].
In spite of the challenges presented, numerous approaches have been proposedfor automatic or semi-automatic chamber assessment in RT3DE, both in the re-search community and in the form of commercial solutions as can be appreciatedin Chapter 2. LV endocardial segmentation has been particularly well studied anda number of approaches have been proposed as can be appreciated in the review ofLeung and Bosch [76]. This is especially true when compared to other chamberssuch as the right ventricle (RV) and left atrium (LA) which have received signif-icantly less attention though some methods have been proposed [191, 192]. Giventhe different frameworks proposed for the same problem of LV segmentation, ini-tiatives such as the CETUS challenge [114] play an extremely important role inallowing the benchmarking of different frameworks [115, 116, 193–195] on the samedatasets using the same evaluation tools. Though the highest ranked solution of thechallenge was a purely image information approach by Barbosa et al. [115] usingthe BEAS framework, later approaches using shape and/or appearance clues provedto be more successful. Such approaches by Oktay et al. [196] and van Stralen etal. [197] came to prove the pre-existing idea that RT3DE is inherently challengingto segment due to its many artifacts and that prior information is key to an accu-rate segmentation. Nevertheless, the gap between state-of-the-art technologies and
5.2. METHODOLOGY 59
interobserver variability is still present and, as such, new approaches joining theadvantages of successful basic segmentation frameworks such as BEAS with toolsthat provide prior information about the LV are of much interest.
In the present work, a framework for fast and fully automatic segmentationand tracking of the LV in RT3DE is proposed. A shape-based deformable modelbased on the BEAS framework [3] using a SSM as in Queiros et al. [198] is usedfor segmentation at ED. This assures that both image information and shape-basedclues are used, thus increasing the robustness of this approach when compared toBEAS or other methods based solely on image information. This segmentation isthen propagated to the rest of the cardiac cycle using lAAOF [199]. To furtherrefine the results from the lAAOF, the shape-based BEAS framework is applied atES, again allowing for the combination of both image information and shape-basedclues for the final segmentation result.
The main novelty of the presented study lies in the algorithmic design and val-idation of the proposed method. Joining different and independent algorithmictools, the authors were able to build a single efficient framework capable of per-forming fast, fully automatic and robust full-cycle segmentation and validate it in arepresentative dataset that allows direct comparison to other state-of-the-art meth-ods. Furthermore, the shape-based regularization introduced in [198] was extendedin this study, from the original formulation based on a 1D SSM of Queiros et al.which would not be applicable to the LV to a full 2D oriented SSM.
5.2 Methodology
5.2.1 B-spline Explicit Active Surfaces
Given the volumetric nature of the object of interest, the B-spline representationwas created on a spherical coordinate system thus defining the active geometricfunctions as r = ψ(φ, θ). As in previous implementations of BEAS for LV seg-mentation [165], the angular discretization of the boundary representation was setempirically at 24 × 16 (elevation×azimuth) and the B-spline scale to 21 for bothangular coordinates.
The evolution of the model is defined by the minimization of an energy criterionE. This energy is expressed by the sum of the data attachment term Ed and aregularization term Er:
E = Ed + Er. (5.1)
The data attachment energy function Ed follows a variation of the localizedYezzi energy adapted for endocardial segmentation [165] detailed in Section 2.6.The neighborhood region limit ρ was set to 16 mm as in Barbosa et al. [115].
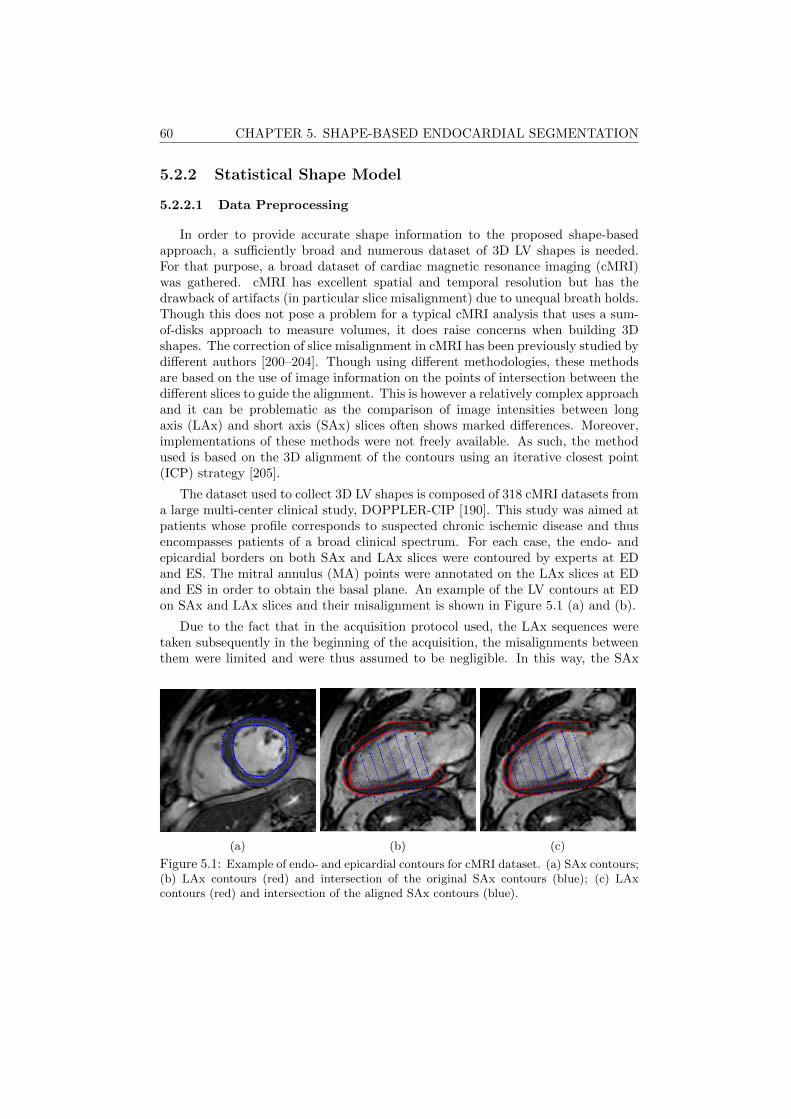
60 CHAPTER 5. SHAPE-BASED ENDOCARDIAL SEGMENTATION
5.2.2 Statistical Shape Model
5.2.2.1 Data Preprocessing
In order to provide accurate shape information to the proposed shape-basedapproach, a sufficiently broad and numerous dataset of 3D LV shapes is needed.For that purpose, a broad dataset of cardiac magnetic resonance imaging (cMRI)was gathered. cMRI has excellent spatial and temporal resolution but has thedrawback of artifacts (in particular slice misalignment) due to unequal breath holds.Though this does not pose a problem for a typical cMRI analysis that uses a sum-of-disks approach to measure volumes, it does raise concerns when building 3Dshapes. The correction of slice misalignment in cMRI has been previously studied bydifferent authors [200–204]. Though using different methodologies, these methodsare based on the use of image information on the points of intersection between thedifferent slices to guide the alignment. This is however a relatively complex approachand it can be problematic as the comparison of image intensities between longaxis (LAx) and short axis (SAx) slices often shows marked differences. Moreover,implementations of these methods were not freely available. As such, the methodused is based on the 3D alignment of the contours using an iterative closest point(ICP) strategy [205].
The dataset used to collect 3D LV shapes is composed of 318 cMRI datasets froma large multi-center clinical study, DOPPLER-CIP [190]. This study was aimed atpatients whose profile corresponds to suspected chronic ischemic disease and thusencompasses patients of a broad clinical spectrum. For each case, the endo- andepicardial borders on both SAx and LAx slices were contoured by experts at EDand ES. The mitral annulus (MA) points were annotated on the LAx slices at EDand ES in order to obtain the basal plane. An example of the LV contours at EDon SAx and LAx slices and their misalignment is shown in Figure 5.1 (a) and (b).
Due to the fact that in the acquisition protocol used, the LAx sequences weretaken subsequently in the beginning of the acquisition, the misalignments betweenthem were limited and were thus assumed to be negligible. In this way, the SAx
(a) (b) (c)
Figure 5.1: Example of endo- and epicardial contours for cMRI dataset. (a) SAx contours;(b) LAx contours (red) and intersection of the original SAx contours (blue); (c) LAxcontours (red) and intersection of the aligned SAx contours (blue).
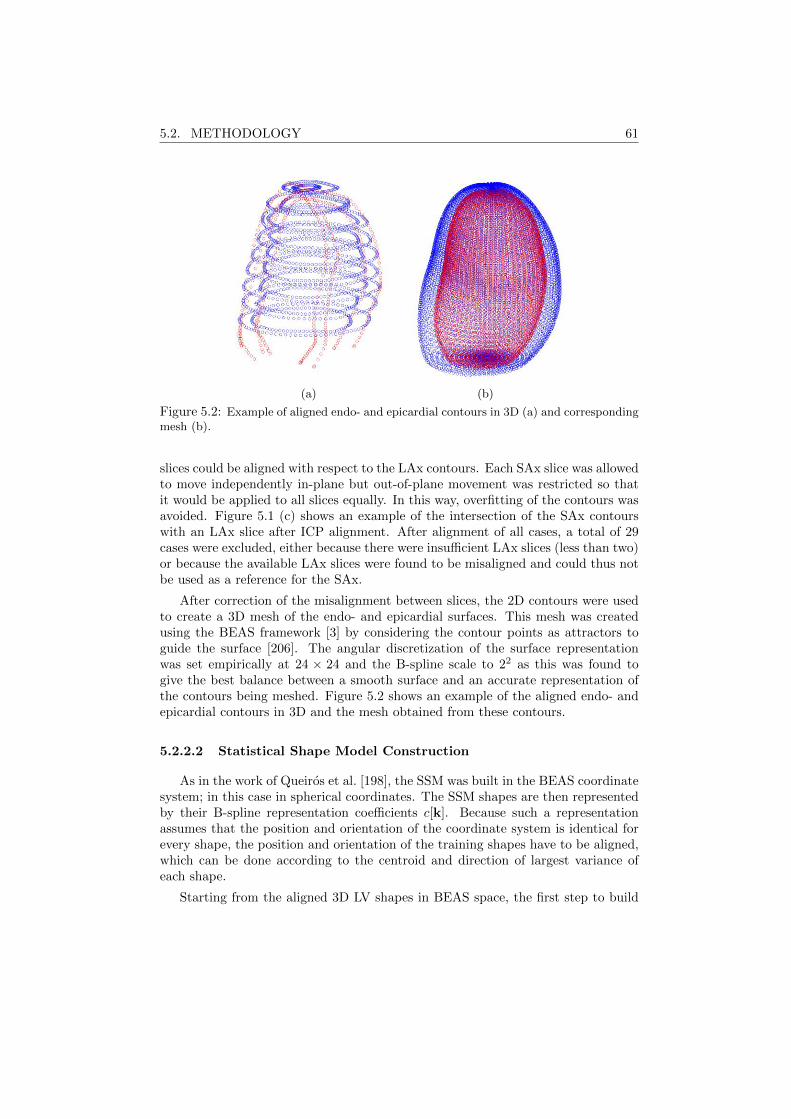
5.2. METHODOLOGY 61
(a) (b)
Figure 5.2: Example of aligned endo- and epicardial contours in 3D (a) and correspondingmesh (b).
slices could be aligned with respect to the LAx contours. Each SAx slice was allowedto move independently in-plane but out-of-plane movement was restricted so thatit would be applied to all slices equally. In this way, overfitting of the contours wasavoided. Figure 5.1 (c) shows an example of the intersection of the SAx contourswith an LAx slice after ICP alignment. After alignment of all cases, a total of 29cases were excluded, either because there were insufficient LAx slices (less than two)or because the available LAx slices were found to be misaligned and could thus notbe used as a reference for the SAx.
After correction of the misalignment between slices, the 2D contours were usedto create a 3D mesh of the endo- and epicardial surfaces. This mesh was createdusing the BEAS framework [3] by considering the contour points as attractors toguide the surface [206]. The angular discretization of the surface representationwas set empirically at 24 × 24 and the B-spline scale to 22 as this was found togive the best balance between a smooth surface and an accurate representation ofthe contours being meshed. Figure 5.2 shows an example of the aligned endo- andepicardial contours in 3D and the mesh obtained from these contours.
5.2.2.2 Statistical Shape Model Construction
As in the work of Queiros et al. [198], the SSM was built in the BEAS coordinatesystem; in this case in spherical coordinates. The SSM shapes are then representedby their B-spline representation coefficients c[k]. Because such a representationassumes that the position and orientation of the coordinate system is identical forevery shape, the position and orientation of the training shapes have to be aligned,which can be done according to the centroid and direction of largest variance ofeach shape.
Starting from the aligned 3D LV shapes in BEAS space, the first step to build

62 CHAPTER 5. SHAPE-BASED ENDOCARDIAL SEGMENTATION
the SSM is to scale all shapes so that equivalent points from different shapes can becompared without the influence of the LV size. Considering cs[k] the sth shape of all
N shapes, this is done by: calculating the mean of all shapes c[k] = 1N
∑Ns=1 cs[k],
scaling each shape to the current mean c[k] and then repeating these steps until theprocess converges [207]. The scaling step is done according to:
cscaled[k] = c[k]
∑i
w[ki]c[ki]c[ki]∑i
w[ki]c[ki]c[ki], (5.2)
where w[k] is a set of weights chosen to give more significance to the points thattend to be most stable:
w[ki] =
(N∑s=1
V ariance(cs[ki])
)−1
. (5.3)
Principal component analysis can then be applied to extract the shape variabilityof the LV B-spline coefficients [207]. Through singular value decomposition [208],it is then possible to obtain the eigenvectors pi and the corresponding eigenvaluesλi of the covariance matrix:
S =1
N
N∑s
(cs[ki]− c[ki]) (cs[ki]− c[ki])T . (5.4)
Since most of the variation can be explained by a small number of eigenvectors,only a portion of the original set is kept, corresponding to the number of eigenvectorst whose sum represents 90% of the total variance of all variables. In this way, anyshape from the dataset can be approximated by:
c[k] ≈ c[k] + Pb, (5.5)
where P is the matrix of the first t eigenvectors and b is a vector of t weights whichfor any given shape corresponds to b = PT (c[k]− c[k]).
To be able to model both ED and ES separately, two different SSMs were createdaccording to the methodology described above. The mean shapes for each of thesemodels are shown in Figure 5.3. Note that since these models are scaled accordingto equation 5.2 only shape variations can be observed in this figure. Additionaldescription of each of the SSMs, namely the shape variations described by eachcomponent, are provided in the link given in the footnote.
5.2.3 SSM-Based Regularization
To then use the SSM with BEAS for the segmentation of new images, two differ-ent regularization energies were defined so that the segmented shapes are regularizedaccording to those observed in the training set. These two regularizations, a hard
https://kuleuven.box.com/s/bii3yf4o5v4rz3295ua6ctyijjokzy1k
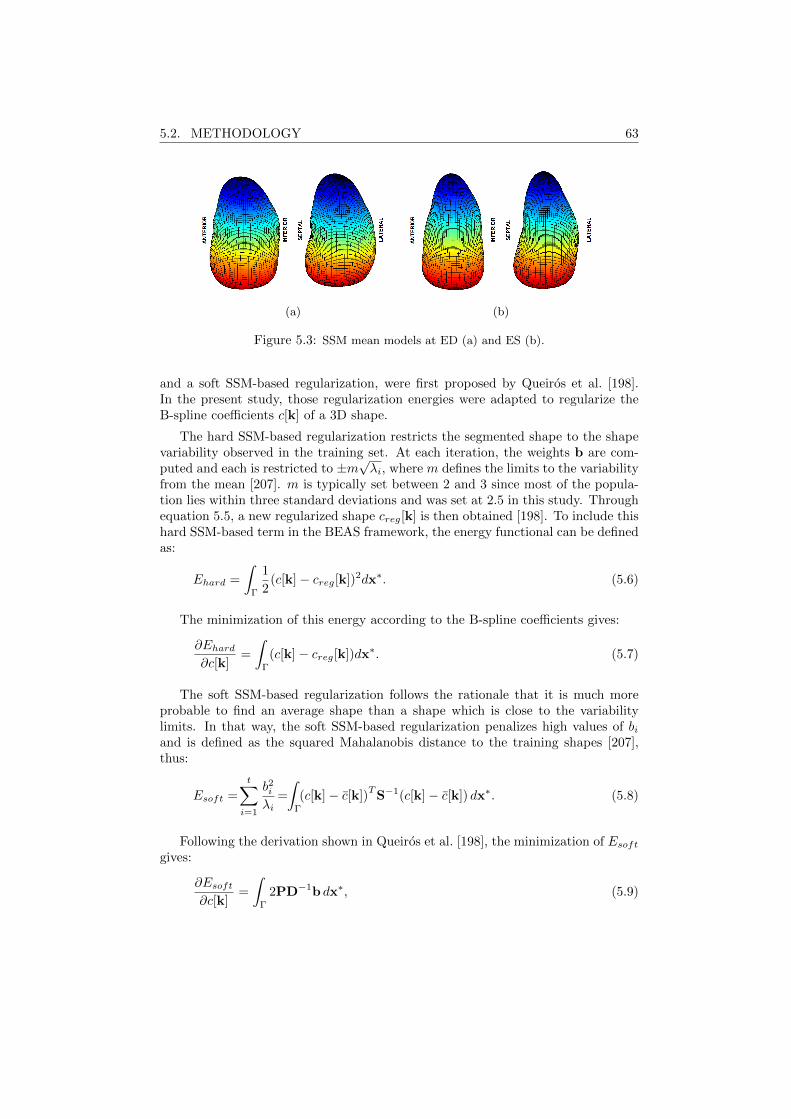
5.2. METHODOLOGY 63
(a) (b)
Figure 5.3: SSM mean models at ED (a) and ES (b).
and a soft SSM-based regularization, were first proposed by Queiros et al. [198].In the present study, those regularization energies were adapted to regularize theB-spline coefficients c[k] of a 3D shape.
The hard SSM-based regularization restricts the segmented shape to the shapevariability observed in the training set. At each iteration, the weights b are com-puted and each is restricted to ±m
√λi, where m defines the limits to the variability
from the mean [207]. m is typically set between 2 and 3 since most of the popula-tion lies within three standard deviations and was set at 2.5 in this study. Throughequation 5.5, a new regularized shape creg[k] is then obtained [198]. To include thishard SSM-based term in the BEAS framework, the energy functional can be definedas:
Ehard =
∫Γ
1
2(c[k]− creg[k])2dx∗. (5.6)
The minimization of this energy according to the B-spline coefficients gives:
∂Ehard∂c[k]
=
∫Γ
(c[k]− creg[k])dx∗. (5.7)
The soft SSM-based regularization follows the rationale that it is much moreprobable to find an average shape than a shape which is close to the variabilitylimits. In that way, the soft SSM-based regularization penalizes high values of biand is defined as the squared Mahalanobis distance to the training shapes [207],thus:
Esoft =
t∑i=1
b2iλi
=
∫Γ
(c[k]− c[k])TS−1(c[k]− c[k]) dx∗. (5.8)
Following the derivation shown in Queiros et al. [198], the minimization of Esoftgives:
∂Esoft∂c[k]
=
∫Γ
2PD−1b dx∗, (5.9)
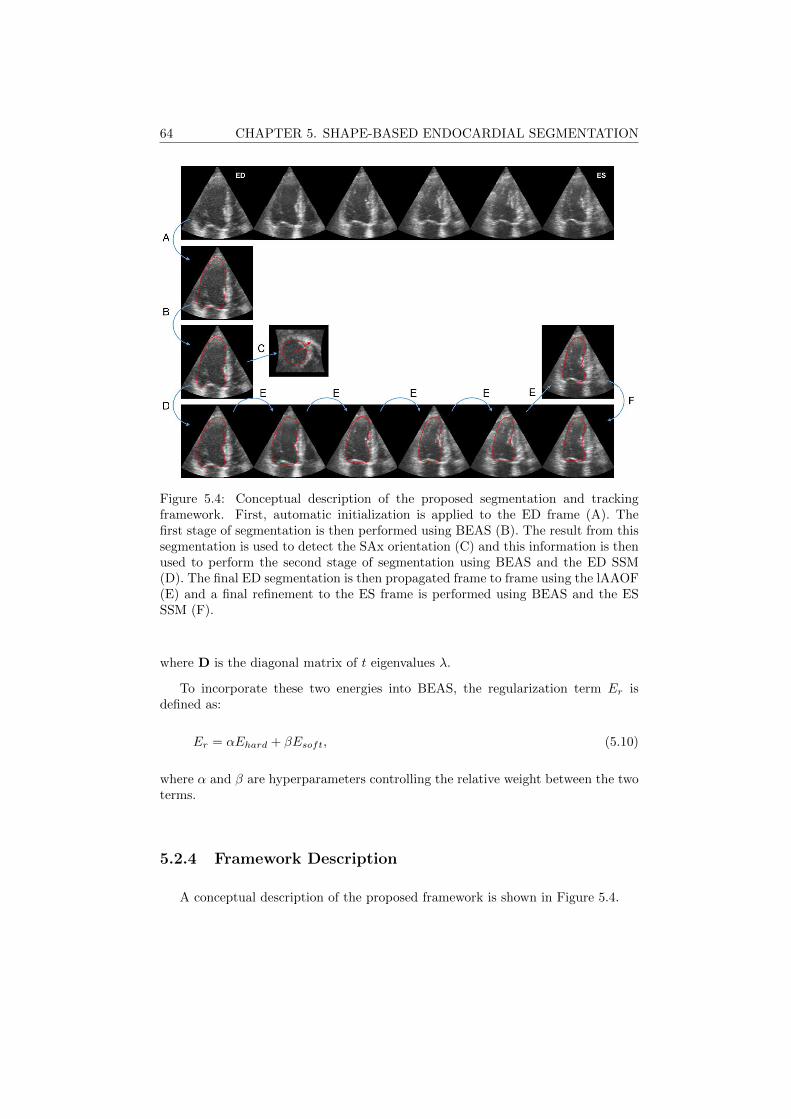
64 CHAPTER 5. SHAPE-BASED ENDOCARDIAL SEGMENTATION
Figure 5.4: Conceptual description of the proposed segmentation and trackingframework. First, automatic initialization is applied to the ED frame (A). Thefirst stage of segmentation is then performed using BEAS (B). The result from thissegmentation is used to detect the SAx orientation (C) and this information is thenused to perform the second stage of segmentation using BEAS and the ED SSM(D). The final ED segmentation is then propagated frame to frame using the lAAOF(E) and a final refinement to the ES frame is performed using BEAS and the ESSSM (F).
where D is the diagonal matrix of t eigenvalues λ.
To incorporate these two energies into BEAS, the regularization term Er isdefined as:
Er = αEhard + βEsoft, (5.10)
where α and β are hyperparameters controlling the relative weight between the twoterms.
5.2.4 Framework Description
A conceptual description of the proposed framework is shown in Figure 5.4.

5.2. METHODOLOGY 65
5.2.4.1 Automatic Initialization
The automatic initialization algorithm used was first introduced in Barbosa etal. [165] and is detailed in Chapter 2. This initialization will provide the initialestimation of the LAx and center for BEAS and the SSM.
5.2.4.2 Automatic SAx Orientation
The SAx orientation method is detailed on Chapter 4.
The SAx orientation is crucial to correctly position the SSM, given that differ-ent sides of the LV have different shape characteristics. However, this orientationalgorithm depends on a previous estimate of the LV surface and the result fromthe initialization is too rough as it relies on the fitting of an ellipsoid. As such,the automatic SAx orientation is only applied after an initial stage of segmentationwith BEAS.
5.2.4.3 Segmentation at ED
The segmentation at ED is composed of two stages. Initially, BEAS is usedwithout the SSM, so that the energy criterion E is equal to Ed, the data attachmentterm. This provides an initial segmentation of the LV, which is used for the SAxorientation estimation but also to refine the initial estimates of LAx orientation andcenter according to the centroid and direction of largest variance of the segmentedmesh. With the center position and both the LAx and SAx orientation well defined,it is then possible to use BEAS with the SSM regularization according to equation5.10 to further refine the segmentation.
5.2.4.4 Localized Anatomical Affine Optical Flow (lAAOF)
lAAOF is then used to propagate the result from ED to the remaining frames.The lAAOF method was proposed in [199] and relies on an affine optical flow ap-proach which independently estimates the motion at each point in the surface basedon an anatomically constrained neighborhood. A detailed description of this methodcan be found in the original paper by Queiros et al. [199]. The parameters used totune the lAAOF were replicated from [199].
5.2.4.5 Segmentation at ES
Segmentation at ES is used to further refine the result from the lAAOF, thusbringing together intensity and shape-based clues. In order to balance the con-tribution between tracking and segmentation clues, an energy term was added topenalize the deviation between the result of the lAAOF and the segmentation. Suchan approach is equivalent to that detailed in Chapter 3. The regularization energy
66 CHAPTER 5. SHAPE-BASED ENDOCARDIAL SEGMENTATION
criterion is then expressed as:
Er = αEhard + βEsoft + γEA, (5.11)
where EA is defined according to 3.11 and γ is a hyperparameter used to define thebalance between tracking and intensity/shape-based information.
5.3 Experiments
5.3.1 Data Description
The proposed framework was tested on the CETUS challenge data [114]. Thischallenge comprises 45 sequences of RT3DE volumes of one cardiac cycle from 45patients acquired in three different hospitals and ultrasound machines from threedifferent vendors. On each dataset, the LV endocardium was contoured by threeexperts at ED and ES until consensus was achieved between the three. Fifteendatasets are available as training with the corresponding reference meshes at EDand ES, while the remaining 30 datasets correspond to the testing set and only theRT3DE images are available.
5.3.2 Segmentation Performance
First, the 15 training datasets were used to tune the hyperparameters β andγ needed respectively for the SSM regularization and for the balance between thesegmentation and tracking information. This tuning was performed empiricallyby visual inspection of the results. The hyperparameters α, β and γ were setrespectively to 1, 0.0005 and 0.25. Note that the value of β is directly related tothe absolute value of eigenvalues λ as defined in (5.8), thus justifying its relativesmall value.
Using these settings, the framework was then tested on the 30 testing datasets.The evaluation of the results was conducted using the online MIDAS platform ofthe CETUS challenge, thus assuring that the proposed method can be directlycompared to other state-of-the-art methods. The accuracy of the segmentation wasevaluated at ED and ES through different distance metrics: MAD [209], whichmeasures the average distance at any point between the segmented and referencemeshes; Hausdorff distance (HD) [210], which measures the maximum distancebetween the segmented and reference meshes; and Dice [211], which is a measureof the overlap between the segmented and reference meshes. Because the meshesobtained from BEAS are sampled in the spherical coordinate system, causing thepoint density to be different along the surface, which could bias the error metrics tospecific regions, the segmented meshes were remeshed to assure greater smoothnessand more uniform mesh point density. Clinical indices were also studied, namelythe Pearson correlation coefficient and limits of agreement of ED volume (EDV),ES volume (ESV) and ejection fraction (EF).
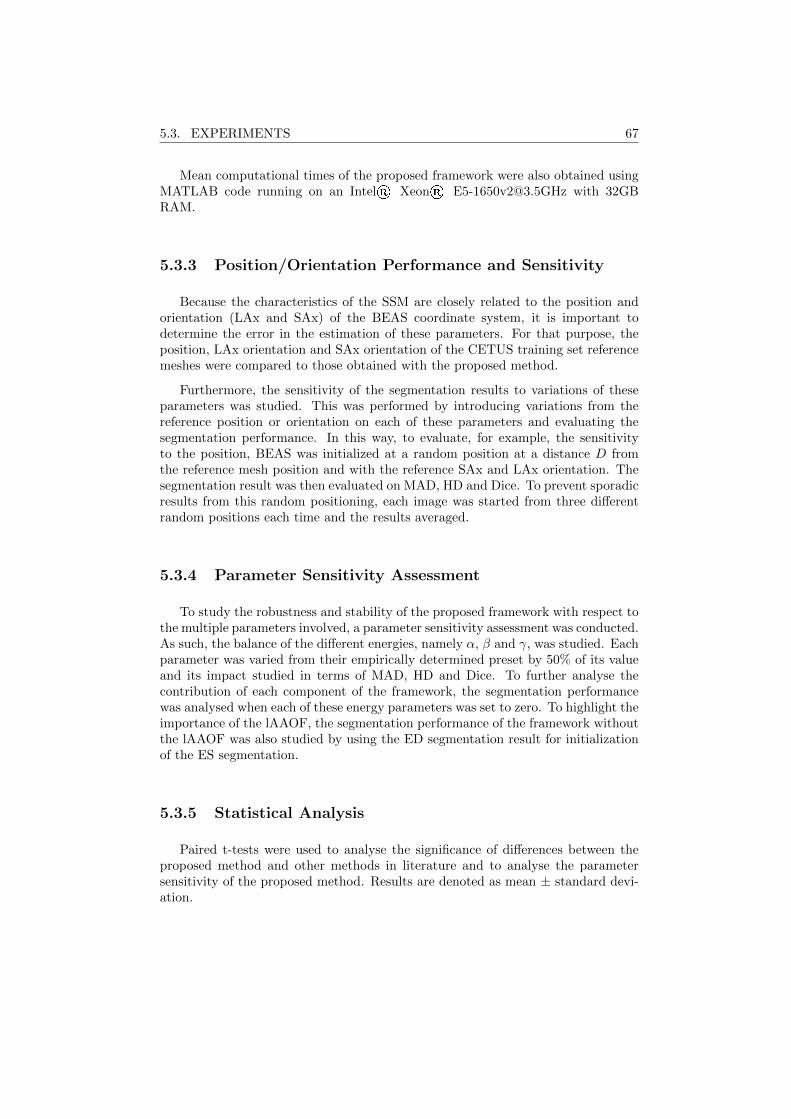
5.3. EXPERIMENTS 67
Mean computational times of the proposed framework were also obtained usingMATLAB code running on an Intel® Xeon® [email protected] with 32GBRAM.
5.3.3 Position/Orientation Performance and Sensitivity
Because the characteristics of the SSM are closely related to the position andorientation (LAx and SAx) of the BEAS coordinate system, it is important todetermine the error in the estimation of these parameters. For that purpose, theposition, LAx orientation and SAx orientation of the CETUS training set referencemeshes were compared to those obtained with the proposed method.
Furthermore, the sensitivity of the segmentation results to variations of theseparameters was studied. This was performed by introducing variations from thereference position or orientation on each of these parameters and evaluating thesegmentation performance. In this way, to evaluate, for example, the sensitivityto the position, BEAS was initialized at a random position at a distance D fromthe reference mesh position and with the reference SAx and LAx orientation. Thesegmentation result was then evaluated on MAD, HD and Dice. To prevent sporadicresults from this random positioning, each image was started from three differentrandom positions each time and the results averaged.
5.3.4 Parameter Sensitivity Assessment
To study the robustness and stability of the proposed framework with respect tothe multiple parameters involved, a parameter sensitivity assessment was conducted.As such, the balance of the different energies, namely α, β and γ, was studied. Eachparameter was varied from their empirically determined preset by 50% of its valueand its impact studied in terms of MAD, HD and Dice. To further analyse thecontribution of each component of the framework, the segmentation performancewas analysed when each of these energy parameters was set to zero. To highlight theimportance of the lAAOF, the segmentation performance of the framework withoutthe lAAOF was also studied by using the ED segmentation result for initializationof the ES segmentation.
5.3.5 Statistical Analysis
Paired t-tests were used to analyse the significance of differences between theproposed method and other methods in literature and to analyse the parametersensitivity of the proposed method. Results are denoted as mean ± standard devi-ation.
68 CHAPTER 5. SHAPE-BASED ENDOCARDIAL SEGMENTATION
Figure 5.5: Bullseye plots of average MAD and HD at every region for ED and ES forthe training datasets. Measures in mm.
5.4 Results
5.4.1 Segmentation Performance
Tables 5.1 and 5.2 show the segmentation and tracking results for the proposedapproach, as well as the performance obtained with other state-of-the-art methodsand inter-observer variability from manual contouring. Those obtained by Queiroset al. [199] and Barbosa et al. [115] also use BEAS as the segmentation tool butneither use shape-based information. Queiros et al. used the same lAAOF trackingwhereas Barbosa et al. used a global anatomically constrained optical flow approachfollowed by block matching refinement instead of the lAAOF. The other approachespresented were chosen as they are, to the author’s knowledge, the ones presentingthe best segmentation results on the CETUS dataset.
A regionwise analysis of error was also conducted by dividing the LV into the17-segment model [10], using the LAx as reference and dividing the LV into basal(35%), mid-cavity (35%) and apical (30%) regions. The average MAD and HD atED and ES for the training datasets is shown in Figure 5.5. It can be observed thatthe greatest errors occur on the apical region and on the anterior side of the LV.Figure 5.6 shows examples of the fully automatic segmentation results compared tothe consensus manual contours by experts.
Regarding computational time, the proposed framework took on average 0.9 sfor the initialization, 0.6 s for the SAx orientation and a combined time of 1.1 sfor the two stages of ED segmentation. The tracking took on average 0.8 s/frameand the final ES segmentation 0.4 s. The total time for a fully automatic ED/ES

5.5. DISCUSSION 69
segmentation was on average 11 s. All data was processed in a non-optimizedMATLAB implementation.
5.4.2 Position/Orientation Performance and Sensitivity
At initialization, the position and LAx orientation errors were respectively 3.7±2.1 mm and 5.0±2.8. After refinement at the first stage of ED BEAS segmentation,the position and LAx orientation errors were reduced to respectively 2.4± 1.0 mmand 4.4 ± 2.4. Automatic SAx orientation failed in one of the cases due to lowimage quality giving an error of 120.2 compared to manual annotation of the RVinsertion point. On the remaining datasets the SAx orientation error was 6.9±4.4.
Figure 5.7 shows the influence on the segmentation performance of the positionand orientation of the automatically defined BEAS coordinate system with respectto the position and orientation of the reference meshes. It can be observed that theposition and LAx orientation have the most influence on the segmentation results,where a distance above 2mm from the reference mesh centroid or an LAx angledeviation greater than 8 give an error larger than what was obtained with thefully automatic method used in this study.
5.4.3 Parameter Sensitivity Assessment
Figure 5.8 shows the influence of the parameters α, β and γ on the segmentationresults at ED and ES. For the interval considered from 50% to 150% of the presetvalue, none of the observed changes were statistically significant at a p < 0.01level and only the MAD at ES showed several statistically significant changes ata p < 0.05 level when changing β. When parameters β and γ are set to 0, thedifference is statistically significant at a p<0.001 level whereas for α the differenceis not statistically significant. When removing the lAAOF, the ES segmentationpresents an MAD, HD and Dice of 2.91±1.08mm, 9.81±2.92mm and 0.861±0.054respectively (all statistically significant at a p<0.001 level).
5.5 Discussion
A fully automatic LV segmentation and tracking framework is proposed, com-bining the strengths of image information from BEAS and shape-based clues froman SSM for segmentation and lAAOF to perform tracking. The way in which theSSM is represented on the BEAS space, through the corresponding B-spline rep-resentation coefficients c[k], brings BEAS and the SSM closer together, avoidingsteps such as conversion between the spherical and Cartesian coordinate systemsand scaling/translation operations. It also avoids one of the fundamental problemswith SSM, the point correspondence between different training shapes and withtesting shapes. This approach assumes however that the position and orientationof the coordinate system is identical for every shape. For the training shapes, it is
70 CHAPTER 5. SHAPE-BASED ENDOCARDIAL SEGMENTATION
trivial to match the position and orientation of every shape, making the previousassumption valid. When trying to fit the SSM to a new image, the center and boththe LAx and SAx orientations have to be guessed from image features.
5.5.1 Segmentation Performance
From Table 5.1 it is clear that the proposed automatic method shows excellentsegmentation and tracking performance and outperforms any other of the state-of-the-art approaches applied to the same database. Compared to other approachesusing BEAS [115,199], the impact of the SSM regularization on ED segmentation isstatistically significant. With a better starting point at ED for the lAAOF, togetherwith the SSM regularization at ES, the ES segmentation results are also improved,thereby outperforming other state-of-the-art methods. While a hybrid segmentationand tracking framework as that proposed in Chapter 3 would be possible, the factthat a local rather than global deformation is used in this Chapter means that thecomplex deformation of the LV can be captured by the tracking alone and it wasobserved that no significant improvement in terms of segmentation accuracy wasobtained from adding a hybrid segmentation and tracking method.
In comparison to other state-of-the-art approaches, it is difficult to say with cer-tainty what is the reason behind the differences in performance given the differentstrategies used in each framework but the following possible reasons can be con-sidered: regarding the semi-automatic method of Bernier et al. [193] using graphcuts, this method lacks a source of prior information needed to give an accuratesegmentation when image information is low or incongruous. For both van Stralenet al. [166] and Oktay et al. [196] that information is provided, respectively, by anactive appearance model (AAM) and a multi-atlas approach. However, both theseapproaches use ultrasound data as a prior which can be more variable than cMRI,especially for reduced datasets. Moreover, both these methods intend to model theappearance of the image, which can be particularly difficult due to the differencesbetween vendors, bad acquisition window or the presence of artifacts. Regardingthe clinical indices on Table 5.2, the proposed method has a performance similar tothe remaining state-of-the-art methods.
Regarding the regionwise analysis shown in Figure 5.5, there could be two pos-sible explanations for the regions with larger error: either there are inherent imagecharacteristics that make segmentation more difficult or there are framework specificcharacteristics that cause these errors, such as a systematic error on the LAx de-tection. However, regionwise error analysis in different frameworks and on manualcontouring by experts replicate this trend of larger errors at the apical and antero-lateral regions [114], which points to inherent image characteristics that make thesegmentation more difficult. Indeed, at the apex, image information is low due tonoise in the near field, whereas for the anterolateral region, dropout in this regionis common due to its position and proximity to lung tissue.
As for the computational speed, the proposed framework continues to be com-putationally efficient, especially if compared to other state-of-the-art approaches.Oktay et al. [196] reported an average time of 16min per image and Van Stralen et
5.5. DISCUSSION 71
al. [166] reported an average segmentation time of 15s in a C++ environment [213]to which the tracking time must be added (not reported). Furthermore, one canconsider ways of decreasing the computational burden of the proposed method bychanging to a more efficient implementation in C++, where it has been shown that3D endocardial segmentation can be done using BEAS in approximately 12.5 ms [3].
5.5.2 Position/Orientation Performance and Sensitivity
As predicted, moving the position and orientation away from the reference has astrong impact on the performance. The fact that SAx orientation has a smaller effectthan center position and LAx orientation can be explained by the fact that, thoughthe LV is far from being symmetric, the shape differences between the different sidesare much less pronounced than the shape difference between the apex and base ofthe LV or those resulting from representing the LV shape from a wrong position. Assuch, a compromise between the image information and the SSM can more easilybe found for an incorrect SAx orientation than from an incorrect center position orLAx orientation.
Figure 5.7 also shows that one of the bottlenecks of this method is the positioningand orientation of the LV. It can be seen that when the reference position andorientation is used, the error decreases considerably (MAD: 1.38 mm; HD: 4.86 mm;Dice: 0.959). As such, it would be important, in future work, to focus on betterautomatic initialization methods that, ideally, would provide the true center of theLV and the LAx and SAx orientation. This would imply however to move awayfrom the current initialization, which roughly delineates the LV using the Houghtransform for circles (HTc), to more complex methodologies, possibly involvingmachine learning or other more abstract approaches.
5.5.3 Parameter Sensitivity Assessment
Overall, the parameter sensitivity assessment showed that the performance of theproposed method is not significantly impaired within a wide range of the parametersettings. The parameters related to the SSM regularization seem to have a higherimpact as they control the balance between the image information and the SSM.The parameter related to the balance between segmentation and tracking has, asexpected, no impact on ED segmentation since γ is not used at ED, and little impacton ES segmentation performance. When each of the parameters is set to zero, thusturning off the corresponding energy contribution, the performance contribution ofeach energy becomes clear and both β and γ are crucial for the results obtained.The contribution of α is, however, less pronounced. This is due to the fact thatthe soft energy term already penalizes shapes away from the mean shape, makingit less likely for the segmented shape to deviate to the hard set limits at m=2.5.Nevertheless, it can be argued that the hard energy term is important to effectivelylimit the maximum deviation from the mean shape (if α=1) and in more challengingimages where image artifacts could make it easier for the segmented shape to deviatefrom the mean.
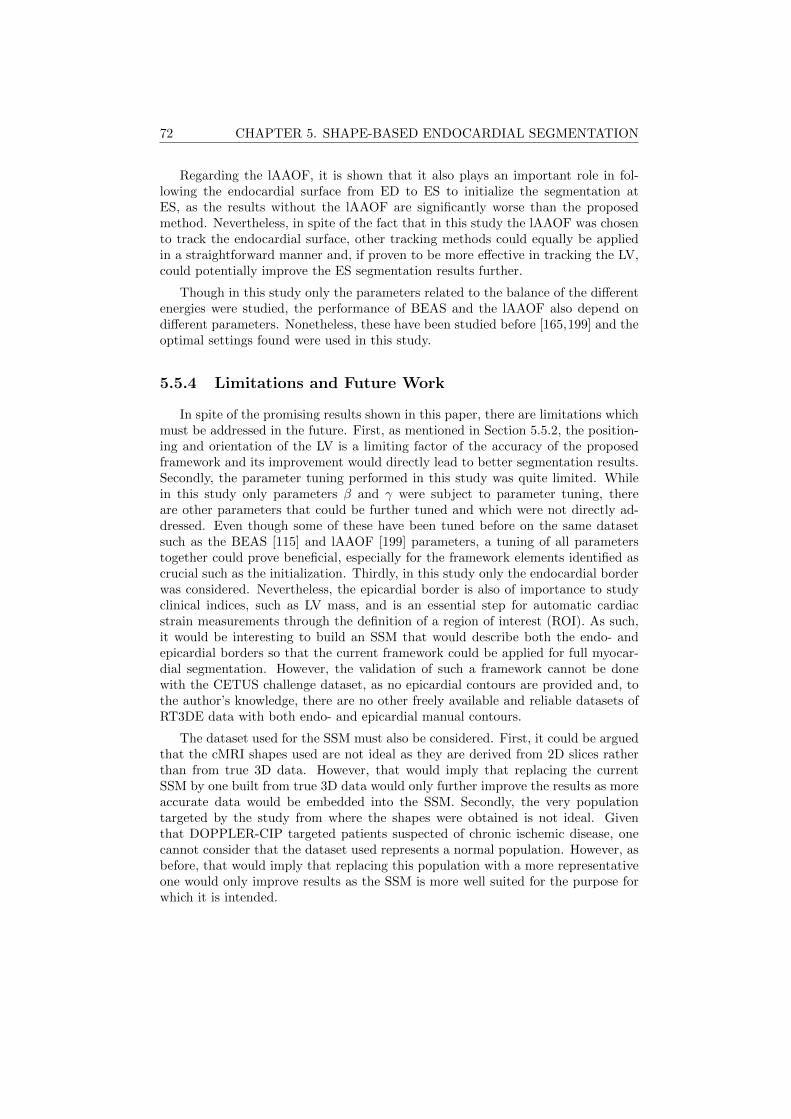
72 CHAPTER 5. SHAPE-BASED ENDOCARDIAL SEGMENTATION
Regarding the lAAOF, it is shown that it also plays an important role in fol-lowing the endocardial surface from ED to ES to initialize the segmentation atES, as the results without the lAAOF are significantly worse than the proposedmethod. Nevertheless, in spite of the fact that in this study the lAAOF was chosento track the endocardial surface, other tracking methods could equally be appliedin a straightforward manner and, if proven to be more effective in tracking the LV,could potentially improve the ES segmentation results further.
Though in this study only the parameters related to the balance of the differentenergies were studied, the performance of BEAS and the lAAOF also depend ondifferent parameters. Nonetheless, these have been studied before [165,199] and theoptimal settings found were used in this study.
5.5.4 Limitations and Future Work
In spite of the promising results shown in this paper, there are limitations whichmust be addressed in the future. First, as mentioned in Section 5.5.2, the position-ing and orientation of the LV is a limiting factor of the accuracy of the proposedframework and its improvement would directly lead to better segmentation results.Secondly, the parameter tuning performed in this study was quite limited. Whilein this study only parameters β and γ were subject to parameter tuning, thereare other parameters that could be further tuned and which were not directly ad-dressed. Even though some of these have been tuned before on the same datasetsuch as the BEAS [115] and lAAOF [199] parameters, a tuning of all parameterstogether could prove beneficial, especially for the framework elements identified ascrucial such as the initialization. Thirdly, in this study only the endocardial borderwas considered. Nevertheless, the epicardial border is also of importance to studyclinical indices, such as LV mass, and is an essential step for automatic cardiacstrain measurements through the definition of a region of interest (ROI). As such,it would be interesting to build an SSM that would describe both the endo- andepicardial borders so that the current framework could be applied for full myocar-dial segmentation. However, the validation of such a framework cannot be donewith the CETUS challenge dataset, as no epicardial contours are provided and, tothe author’s knowledge, there are no other freely available and reliable datasets ofRT3DE data with both endo- and epicardial manual contours.
The dataset used for the SSM must also be considered. First, it could be arguedthat the cMRI shapes used are not ideal as they are derived from 2D slices ratherthan from true 3D data. However, that would imply that replacing the currentSSM by one built from true 3D data would only further improve the results as moreaccurate data would be embedded into the SSM. Secondly, the very populationtargeted by the study from where the shapes were obtained is not ideal. Giventhat DOPPLER-CIP targeted patients suspected of chronic ischemic disease, onecannot consider that the dataset used represents a normal population. However, asbefore, that would imply that replacing this population with a more representativeone would only improve results as the SSM is more well suited for the purpose forwhich it is intended.

5.6. CONCLUSION 73
5.6 Conclusion
In this work, a novel fast and fully automatic LV segmentation and trackingframework based on shape-based BEAS and lAAOF is proposed. The proposedapproach outperforms all other state-of-the-art methods for LV segmentation eval-uated on the MICCAI CETUS challenge. Moreover, it outperforms other methodsin terms of computational speed, being able to perform ED/ES segmentation andtracking in a few seconds in a non-optimized implementation. The main strengthsof the proposed framework result from the combination of image and shape infor-mation through the balance of the image information from BEAS and the SSMregularization and the combination of tracking and segmentation clues for an effi-cient ES segmentation.

74 CHAPTER 5. SHAPE-BASED ENDOCARDIAL SEGMENTATION
Tab
le5.1:
Perfo
rman
ceon
the
CE
TU
Stestin
gd
atasets.
MA
D,
HD
an
dD
iceof
the
pro
posed
framew
ork,
other
state-of-the-art
ap
pro
aches
and
inter-ob
server
varia
bility.
All
values
inm
ean±
stan
dard
dev
iatio
n(NR
stand
sfor
not
reported
).?,†
and
‡in
dica
teresp
ectivelyth
atth
ed
ifferen
ceto
the
pro
posed
fram
ework
was
statistica
llysign
ifican
tat
ap<
0.05,
p<
0.01
and
p<
0.001
level.
Note
that
for
meth
od
s[1
93,196,1
97,2
12]
aco
mp
ariso
nis
not
possib
leas
the
data
isn
otp
ub
liclyavailab
le.
Meth
od
MA
D(m
m)
HD
(mm
)D
ice
ED
ES
ED
ES
ED
ES
Pro
posed
1.8
1±
0.5
91.9
8±
0.6
66.3
1±
1.6
96.9
5±
2.1
40.9
09±
0.0
34
0.8
75±
0.0
46
Queiro
set
al.
[199]
2.2
6±
0.7
2‡
2.4
5±
0.8
5‡
8.1
0±
2.6
2‡
8.1
9±
3.0
3?
0.8
94±
0.0
40‡
0.8
61±
0.0
54?
Barb
osa
etal.
[115]
2.2
6±
0.7
2‡
2.4
3±
0.8
9‡
8.1
0±
2.6
2‡
8.2
9±
3.0
1?
0.8
94±
0.0
40‡
0.8
56±
0.0
56‡
Bern
ieret
al.
[193]
2.3
7±NR
2.6
4±NR
9.4
1±NR
9.3
4±NR
0.8
82±NR
0.8
37±NR
van
Stra
lenet
al.
[197]
1.9
1±NR
2.4
8±NR
6.6
6±NR
7.3
8±NR
0.9
10±NR
0.8
62±NR
Oktay
etal.
[196]
1.9
4±
0.5
52.2
3±
0.6
07.0
0±
1.9
97.5
3±
2.2
30.9
04±
0.0
20.8
74±
0.0
4
Inter-o
bserv
er[2
12]
1.0
1±
0.3
01.0
1±
0.3
83.3
7±
0.8
73.3
0±
0.9
40.9
49±
0.1
50.9
38±
0.2
1
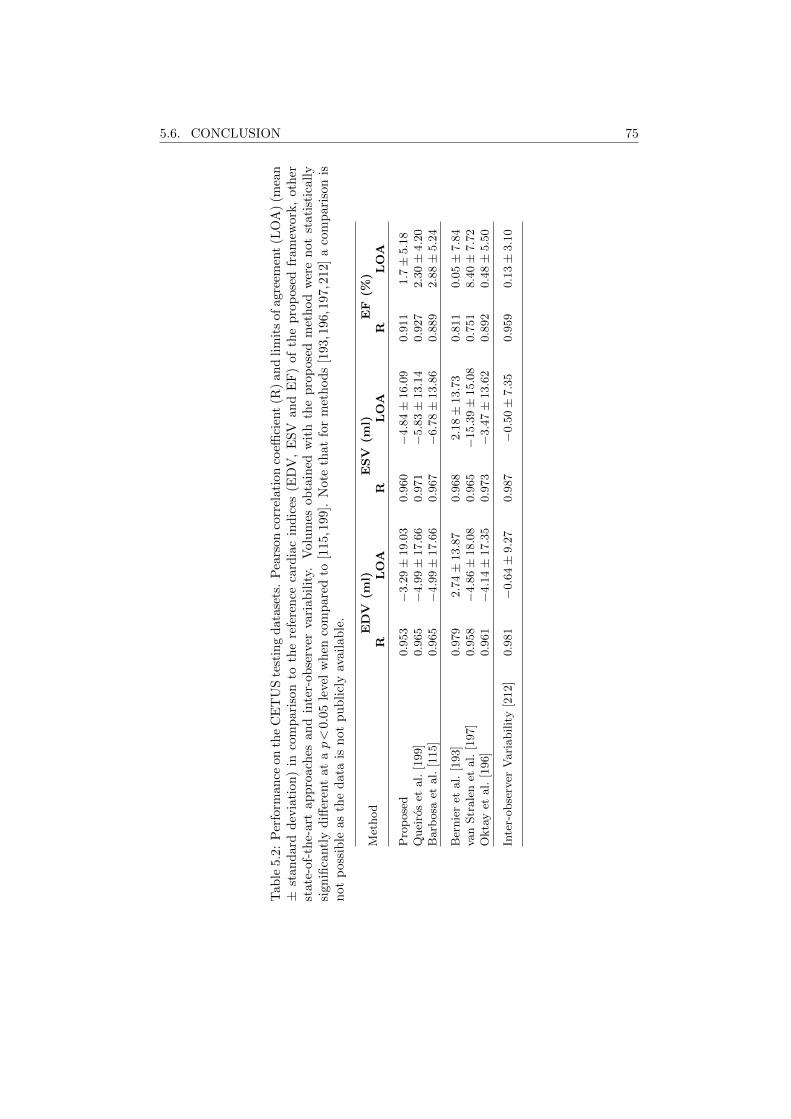
5.6. CONCLUSION 75
Tab
le5.
2:P
erfo
rman
ceon
the
CE
TU
Ste
stin
gd
atase
ts.
Pea
rson
corr
elati
on
coeffi
cien
t(R
)an
dli
mit
sofagre
emen
t(L
OA
)(m
ean
±st
and
ard
dev
iati
on)
inco
mp
aris
onto
the
refe
ren
ceca
rdia
cin
dic
es(E
DV
,E
SV
an
dE
F)
of
the
pro
pose
dfr
am
ework
,oth
erst
ate-
of-t
he-
art
app
roac
hes
and
inte
r-ob
serv
erva
riab
ilit
y.V
olu
mes
ob
tain
edw
ith
the
pro
pose
dm
eth
od
wer
en
ot
stati
stic
all
ysi
gnifi
cantl
yd
iffer
ent
atap<
0.0
5le
vel
wh
enco
mp
are
dto
[115,1
99].
Note
that
for
met
hod
s[1
93,1
96,1
97,2
12]
aco
mp
ari
son
isn
otp
ossi
ble
asth
ed
ata
isn
otp
ub
licl
yav
aila
ble
.
Met
hod
ED
V(m
l)E
SV
(ml)
EF
(%)
RL
OA
RL
OA
RL
OA
Pro
pose
d0.9
53
−3.2
9±
19.0
30.9
60
−4.8
4±
16.0
90.9
11
1.7±
5.1
8Q
uei
ros
etal.
[199]
0.9
65
−4.9
9±
17.6
60.9
71
−5.8
3±
13.1
40.9
27
2.3
0±
4.2
0B
arb
osa
etal.
[115]
0.9
65
−4.9
9±
17.6
60.9
67
−6.7
8±
13.8
60.8
89
2.8
8±
5.2
4
Ber
nie
ret
al.
[193]
0.9
79
2.7
4±
13.8
70.9
68
2.1
8±
13.7
30.8
11
0.0
5±
7.8
4va
nStr
ale
net
al.
[197]
0.9
58
−4.8
6±
18.0
80.9
65
−15.3
9±
15.0
80.7
51
8.4
0±
7.7
2O
kta
yet
al.
[196]
0.9
61
−4.1
4±
17.3
50.9
73
−3.4
7±
13.6
20.8
92
0.4
8±
5.5
0
Inte
r-obse
rver
Vari
abilit
y[2
12]
0.9
81
−0.6
4±
9.2
70.9
87
−0.5
0±
7.3
50.9
59
0.1
3±
3.1
0
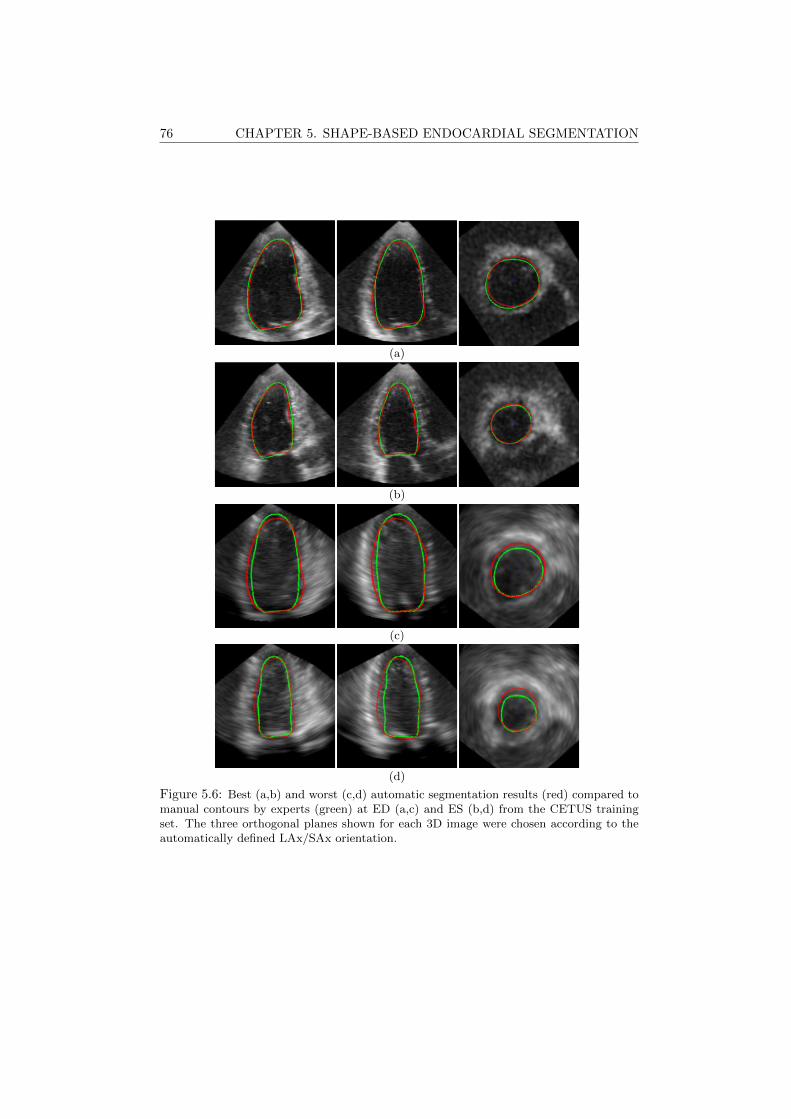
76 CHAPTER 5. SHAPE-BASED ENDOCARDIAL SEGMENTATION
(a)
(b)
(c)
(d)
Figure 5.6: Best (a,b) and worst (c,d) automatic segmentation results (red) compared tomanual contours by experts (green) at ED (a,c) and ES (b,d) from the CETUS trainingset. The three orthogonal planes shown for each 3D image were chosen according to theautomatically defined LAx/SAx orientation.
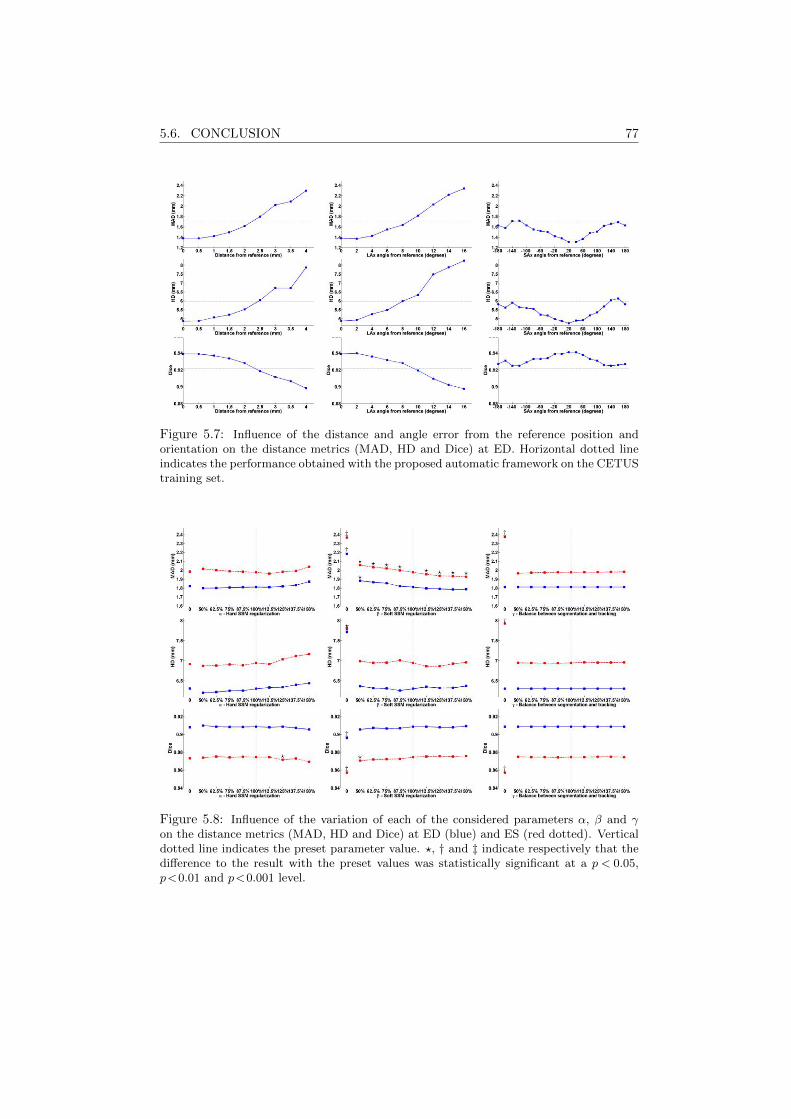
5.6. CONCLUSION 77
Figure 5.7: Influence of the distance and angle error from the reference position andorientation on the distance metrics (MAD, HD and Dice) at ED. Horizontal dotted lineindicates the performance obtained with the proposed automatic framework on the CETUStraining set.
Figure 5.8: Influence of the variation of each of the considered parameters α, β and γon the distance metrics (MAD, HD and Dice) at ED (blue) and ES (red dotted). Verticaldotted line indicates the preset parameter value. ?, † and ‡ indicate respectively that thedifference to the result with the preset values was statistically significant at a p < 0.05,p<0.01 and p<0.001 level.

78 CHAPTER 5. SHAPE-BASED ENDOCARDIAL SEGMENTATION
Chapter 6
Left Ventricular MyocardialSegmentation in 3DUltrasound Recordings:Effect of DifferentEndocardial and EpicardialCoupling Strategies
This chapter is based on a paper published in IEEE Transactions on Ultrasonics, Ferro-electrics, and Frequency Control: Pedrosa J., Barbosa D., Heyde B., Schnell F., Rosner A.,Claus P., D’hooge J.. Left ventricular myocardial segmentation in 3-D ultrasound recordings: ef-fect of different endocardial and epicardial coupling strategies. IEEE Transactions on Ultrasonics,Ferroelectrics, and Frequency Control 2017 Mar; 64(3):525-36.
79

80 CHAPTER 6. LEFT VENTRICULAR MYOCARDIAL SEGMENTATION
Abstract
Cardiac volume/function assessment remains a critical step in daily cardiologyand real-time 3D echocardiography (RT3DE) plays an increasingly important role.Though development of automatic endocardial segmentation methods has receivedmuch attention, the same cannot be said about epicardial segmentation, in spiteof the importance of full myocardial segmentation. In this chapter, different waysof coupling the endo- and epicardial segmentation are contrasted and compared touncoupled segmentation. For this purpose, the B-spline Explicit Active Surfaces(BEAS) framework was used. Twenty-seven RT3DE images were used to validatethe different coupling strategies which were compared to manual contouring of theendo- and epicardial borders performed by an expert. It is shown that an inde-pendent segmentation of the endocardium followed by an epicardial segmentationcoupled to the endocardium is the most advantageous. In this way, a frameworkfor fully automatic 3D myocardial segmentation is proposed using a novel couplingstrategy.
6.1 Introduction
Cardiovascular diseases are a group of disorders of the heart and blood vesselsthat together account for more deaths than any other cause [1] and are projected toremain the single leading cause of death [2]. Analysis of cardiac function, and morespecifically, left ventricular (LV) function is an important factor in terms of patientmanagement, outcome and long-term survival of cardiovascular disease patients [13].Besides global cardiac function, regional cardiac morphology also contains impor-tant information for the detection of regional dysfunction. Among the differentcardiac imaging modalities, ultrasonic imaging stands out as a low-cost, portable,risk-free and non-invasive technique with good space and time resolution. With therecent advent of RT3DE, several limitations of conventional 2D echocardiography(2DE) were overcome, opening a path for more accurate volumetric analysis of car-diac function and regional morphology. Nevertheless, the intrinsic increase of theamount of data makes manual delineation much more time consuming and thus theimportance of automatic LV segmentation frameworks is increasing.
Ultrasound image processing poses however several challenges. The image qual-ity is strongly affected by the acquisition conditions and speckle and a numberof artefacts complicate the segmentation task [75]. In spite of this, numerous ap-proaches have been presented aiming at automated or semi-automated border de-tection in RT3DE as can be appreciated in the review of Leung and Bosch [214].Most of these approaches focus, however, on the segmentation of the LV endocar-dial border and full myocardial segmentation (i.e. segmentation of both endo- andepicardium) has received much less attention [75]. The same trend can be found inthe available commercial solutions for LV segmentation, which focus mostly on theendocardium and define the epicardium by rudimentary methods such as setting afixed thickness from the endocardium [215]. This trend is not only a consequence of
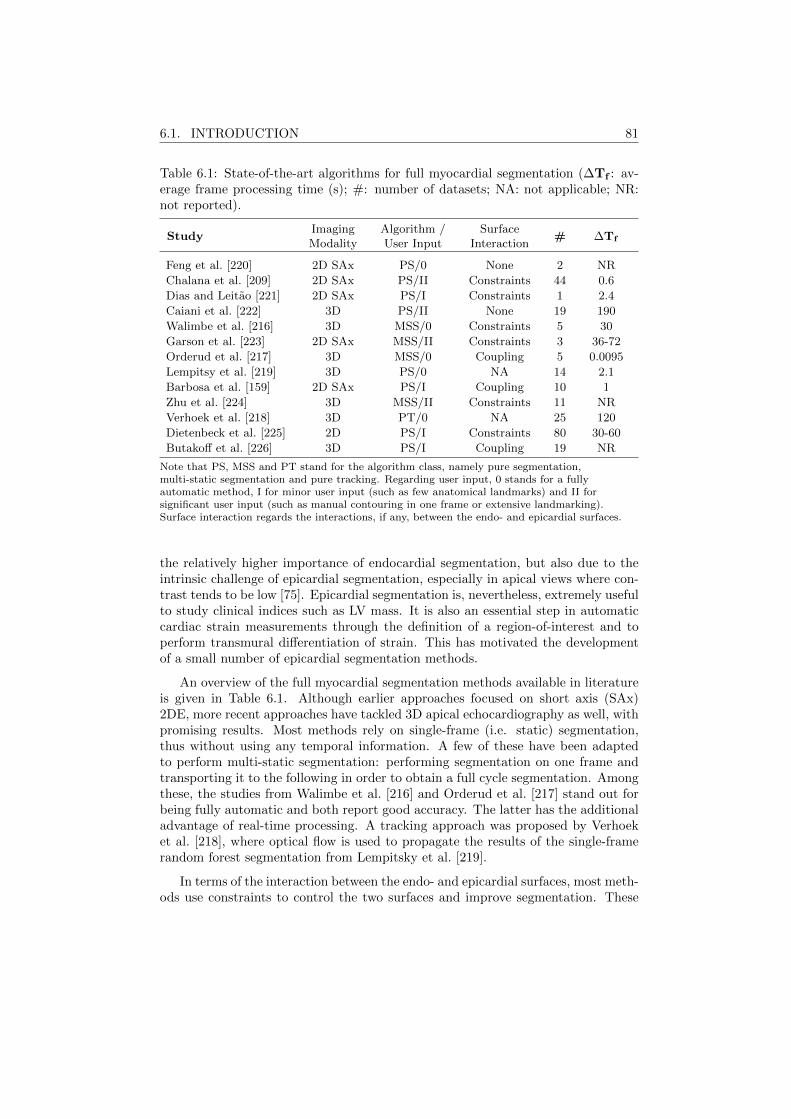
6.1. INTRODUCTION 81
Table 6.1: State-of-the-art algorithms for full myocardial segmentation (∆Tf : av-erage frame processing time (s); #: number of datasets; NA: not applicable; NR:not reported).
StudyImaging Algorithm / Surface
# ∆TfModality User Input Interaction
Feng et al. [220] 2D SAx PS/0 None 2 NR
Chalana et al. [209] 2D SAx PS/II Constraints 44 0.6
Dias and Leitao [221] 2D SAx PS/I Constraints 1 2.4
Caiani et al. [222] 3D PS/II None 19 190
Walimbe et al. [216] 3D MSS/0 Constraints 5 30
Garson et al. [223] 2D SAx MSS/II Constraints 3 36-72
Orderud et al. [217] 3D MSS/0 Coupling 5 0.0095
Lempitsy et al. [219] 3D PS/0 NA 14 2.1
Barbosa et al. [159] 2D SAx PS/I Coupling 10 1
Zhu et al. [224] 3D MSS/II Constraints 11 NR
Verhoek et al. [218] 3D PT/0 NA 25 120
Dietenbeck et al. [225] 2D PS/I Constraints 80 30-60
Butakoff et al. [226] 3D PS/I Coupling 19 NR
Note that PS, MSS and PT stand for the algorithm class, namely pure segmentation,multi-static segmentation and pure tracking. Regarding user input, 0 stands for a fullyautomatic method, I for minor user input (such as few anatomical landmarks) and II forsignificant user input (such as manual contouring in one frame or extensive landmarking).Surface interaction regards the interactions, if any, between the endo- and epicardial surfaces.
the relatively higher importance of endocardial segmentation, but also due to theintrinsic challenge of epicardial segmentation, especially in apical views where con-trast tends to be low [75]. Epicardial segmentation is, nevertheless, extremely usefulto study clinical indices such as LV mass. It is also an essential step in automaticcardiac strain measurements through the definition of a region-of-interest and toperform transmural differentiation of strain. This has motivated the developmentof a small number of epicardial segmentation methods.
An overview of the full myocardial segmentation methods available in literatureis given in Table 6.1. Although earlier approaches focused on short axis (SAx)2DE, more recent approaches have tackled 3D apical echocardiography as well, withpromising results. Most methods rely on single-frame (i.e. static) segmentation,thus without using any temporal information. A few of these have been adaptedto perform multi-static segmentation: performing segmentation on one frame andtransporting it to the following in order to obtain a full cycle segmentation. Amongthese, the studies from Walimbe et al. [216] and Orderud et al. [217] stand out forbeing fully automatic and both report good accuracy. The latter has the additionaladvantage of real-time processing. A tracking approach was proposed by Verhoeket al. [218], where optical flow is used to propagate the results of the single-framerandom forest segmentation from Lempitsky et al. [219].
In terms of the interaction between the endo- and epicardial surfaces, most meth-ods use constraints to control the two surfaces and improve segmentation. These
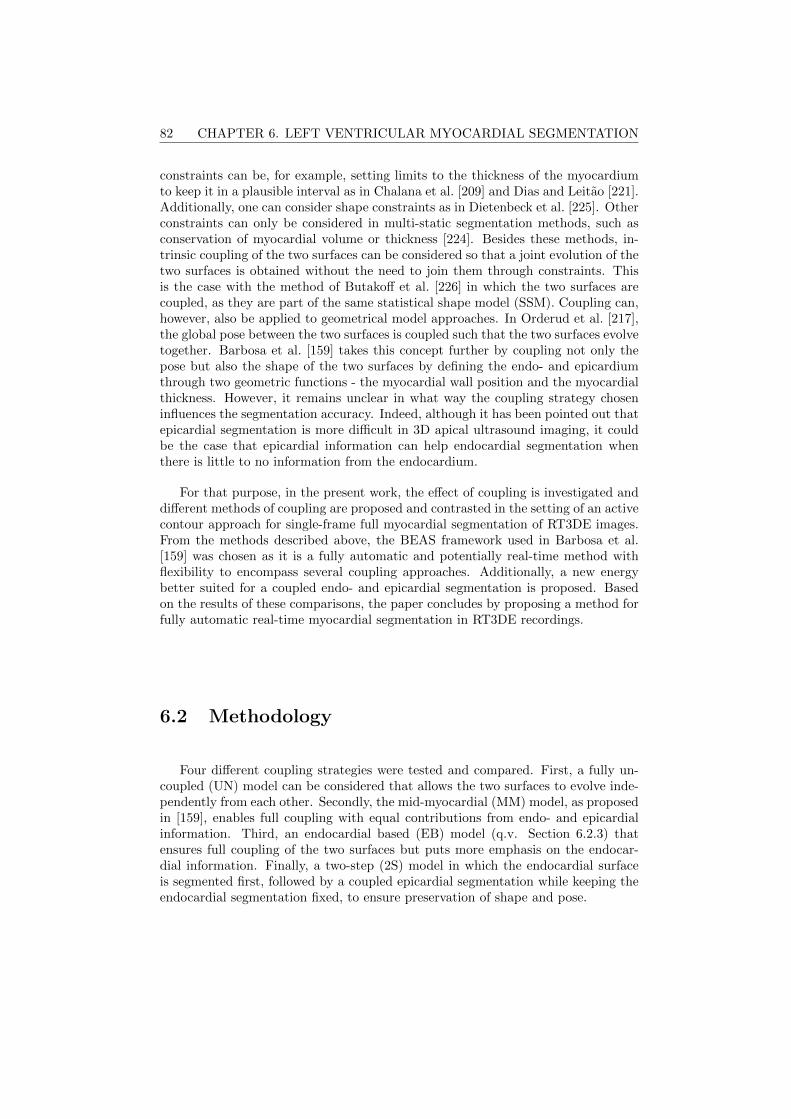
82 CHAPTER 6. LEFT VENTRICULAR MYOCARDIAL SEGMENTATION
constraints can be, for example, setting limits to the thickness of the myocardiumto keep it in a plausible interval as in Chalana et al. [209] and Dias and Leitao [221].Additionally, one can consider shape constraints as in Dietenbeck et al. [225]. Otherconstraints can only be considered in multi-static segmentation methods, such asconservation of myocardial volume or thickness [224]. Besides these methods, in-trinsic coupling of the two surfaces can be considered so that a joint evolution of thetwo surfaces is obtained without the need to join them through constraints. Thisis the case with the method of Butakoff et al. [226] in which the two surfaces arecoupled, as they are part of the same statistical shape model (SSM). Coupling can,however, also be applied to geometrical model approaches. In Orderud et al. [217],the global pose between the two surfaces is coupled such that the two surfaces evolvetogether. Barbosa et al. [159] takes this concept further by coupling not only thepose but also the shape of the two surfaces by defining the endo- and epicardiumthrough two geometric functions - the myocardial wall position and the myocardialthickness. However, it remains unclear in what way the coupling strategy choseninfluences the segmentation accuracy. Indeed, although it has been pointed out thatepicardial segmentation is more difficult in 3D apical ultrasound imaging, it couldbe the case that epicardial information can help endocardial segmentation whenthere is little to no information from the endocardium.
For that purpose, in the present work, the effect of coupling is investigated anddifferent methods of coupling are proposed and contrasted in the setting of an activecontour approach for single-frame full myocardial segmentation of RT3DE images.From the methods described above, the BEAS framework used in Barbosa et al.[159] was chosen as it is a fully automatic and potentially real-time method withflexibility to encompass several coupling approaches. Additionally, a new energybetter suited for a coupled endo- and epicardial segmentation is proposed. Basedon the results of these comparisons, the paper concludes by proposing a method forfully automatic real-time myocardial segmentation in RT3DE recordings.
6.2 Methodology
Four different coupling strategies were tested and compared. First, a fully un-coupled (UN) model can be considered that allows the two surfaces to evolve inde-pendently from each other. Secondly, the mid-myocardial (MM) model, as proposedin [159], enables full coupling with equal contributions from endo- and epicardialinformation. Third, an endocardial based (EB) model (q.v. Section 6.2.3) thatensures full coupling of the two surfaces but puts more emphasis on the endocar-dial information. Finally, a two-step (2S) model in which the endocardial surfaceis segmented first, followed by a coupled epicardial segmentation while keeping theendocardial segmentation fixed, to ensure preservation of shape and pose.

6.2. METHODOLOGY 83
6.2.1 Automatic Initialization
The endocardial borders were initialized according to the method of Barbosaet al. [165] presented in Chapter 2. The epicardial boundaries were initialized at a15mm distance in the normal direction from the endocardial boundaries. Given thatthe endocardial initialization usually underestimates the border of the endocardium,the 15mm distance to the epicardium ensures that the epicardial surface is notattracted to the endocardium.
6.2.2 B-Spline Explicit Active Surfaces
6.2.2.1 Region-Based Energy Formulations
The evolution of the model is defined by the minimization of an energy criterionE. This energy is expressed by the sum of the data attachment term Ed and aregularization term Er:
E = Ed + Er. (6.1)
The region-based representation of the segmentation problem is shown in Figure6.1. The endo- and epicardial surfaces, respectively Γendo and Γepi, act as interfacesbetween the blood pool (in), the myocardium (myo) and the surrounding structures(out). Given this topology of the segmentation problem, the data attachment energyfunctional can be defined as:
Ed =
∫Ω
δφendo(x)
∫Ω
B(x,y) · Fendo(y) dydx+∫Ω
δφepi(x)
∫Ω
B(x,y) · Fepi(y) dydx,
(6.2)
where Fj(y) is the image criterion for surface j and B(x,y) is the mask functionin which the local parameters that drive the evolution are estimated. δφj
(x) isthe Dirac operator applied to the level set function φj(x) = Γj(x
∗) − x1, which isdefined over the image domain Ω.
In this study, two different localized region-based energies were used, accordingto the characteristics of the endo- and epicardium. These region-based energies willbe given through the localized means according to B(x,y) in each of the regions,thus:
uin =
∫ΩB(x,y)Hφendo
(y)I(y)dy∫ΩB(x,y)Hφendo
(y)dy,
umyo =
∫ΩB(x,y)(Hφepi(y)−Hφendo
(y))I(y)dy∫ΩB(x,y)(Hφepi(y)−Hφendo
(y))dy,
uout =
∫ΩB(x,y)(1−Hφepi(y))I(y)dy∫ΩB(x,y)(1−Hφepi
(y))dy,
(6.3)
84 CHAPTER 6. LEFT VENTRICULAR MYOCARDIAL SEGMENTATION
Figure 6.1: Conceptual diagram of the region-based representation of the blood pool,myocardium and pericardium (in, myo and out). The active geometric functions for theMM model are shown in black while the EB model is shown in blue.
where I(y) is the image intensity at point y and Hφj(y) = H(φj(y)) with H being
the Heaviside function.
Because the epicardial interface will separate the myocardium from the externalstructures, which are quite heterogeneous in intensity, an energy functional flexibleenough to accomodate these different situations must be used. The localized Yezzienergy (equation 2.9) was therefore used.
The endocardium is however a much more predictable interface as the bloodpool is usually darker than the myocardial tissue. The variation of the localizedYezzi energy adapted for endocardial segmentation introduced in 2.10 takes intoaccount the expected intensities of the blood pool and the endocardium but, giventhe coupled framework between endo- and epicardium, cannot be used as is. Whilethe localized Yezzi formulation evolves in a quadratic fashion according to the meandifference, the Barbosa formulation evolves linearly. If these two different formu-lations were combined for the energy minimization, the epicardial surface energywould have a larger influence on the overall energy than the endocardial surface. Inorder to solve this problem, a novel energy formulation is proposed:
Fendo(y) =(uin − umyo)3
|uin − umyo|. (6.4)
Note that this formulation maintains both the specificity of the Barbosa formu-lation for endocardial segmentation converging for a solution where the mean fromthe myocardial region (umyo) will be larger than the mean from the blood pool

6.2. METHODOLOGY 85
(uin) but also has the same quadratic evolution as the Yezzi formulation used forthe endocardium.
The minimization of the data attachment energy term in equation 6.2 can thenbe performed through optimization of the B-spline coefficient c[ki], thus:
∂Ed∂c[ki]
=
∫Γendo
gendo(x∗)βd
(x∗
h− ki
)dx∗+∫
Γepi
gepi(x∗)βd
(x∗
h− ki
)dx∗,
(6.5)
where gendo(x∗) and gepi(x
∗) are the feature functions that drive the minimizationof the energy Ed:
gepi(x∗)=−2(umyo−uout)
(I(x∗)−umyo
Amyo+wout
I(x∗)−uoutAout
), (6.6)
gendo(x∗)=2 |uin−umyo|
(win
I(x∗)−uinAin
+I(x∗)−umyo
Amyo
), (6.7)
where Aj is the area of region j used to estimate the local mean uj . I(x∗) cor-responds to the image value at the position x = Γj(x∗), x2, ..., xn and j is theinterface being considered.
Note that additionally to the differentiation, and according to what was proposedin [227], the energy functionals were modified by adding weights to the inner andouter regions of the endocardial and epicardial interfaces, win and wout respectively.These weights can be used to control the balance between the forces exerted by theinner and outer regions of each surface. A weight win larger than 1 will increasethe influence of the inner region attracting the endocardial contour inwards while aweight wout larger than 1 will increase the influence of the outer region attracting theepicardial contour outwards and away from the myocardium. This can be especiallyimportant to mimic the physicians’ behaviour in the drawing of the contours.
6.2.2.2 Mask Region Definition
In equation 6.2, B(x,y) was defined as the mask function in which the localparameters that drive the evolution are estimated. This was set according to equa-tion 2.3, where the neighborhood region limit ρ was set at 16mm as in Barbosa etal. [115].
6.2.2.3 Regularization Terms
Although the coupling strategies will help the sharing of information from onesurface to the other, additional constraints as those proposed in other studies shouldfurther guide the surfaces. To ensure that the segmentation will be limited to
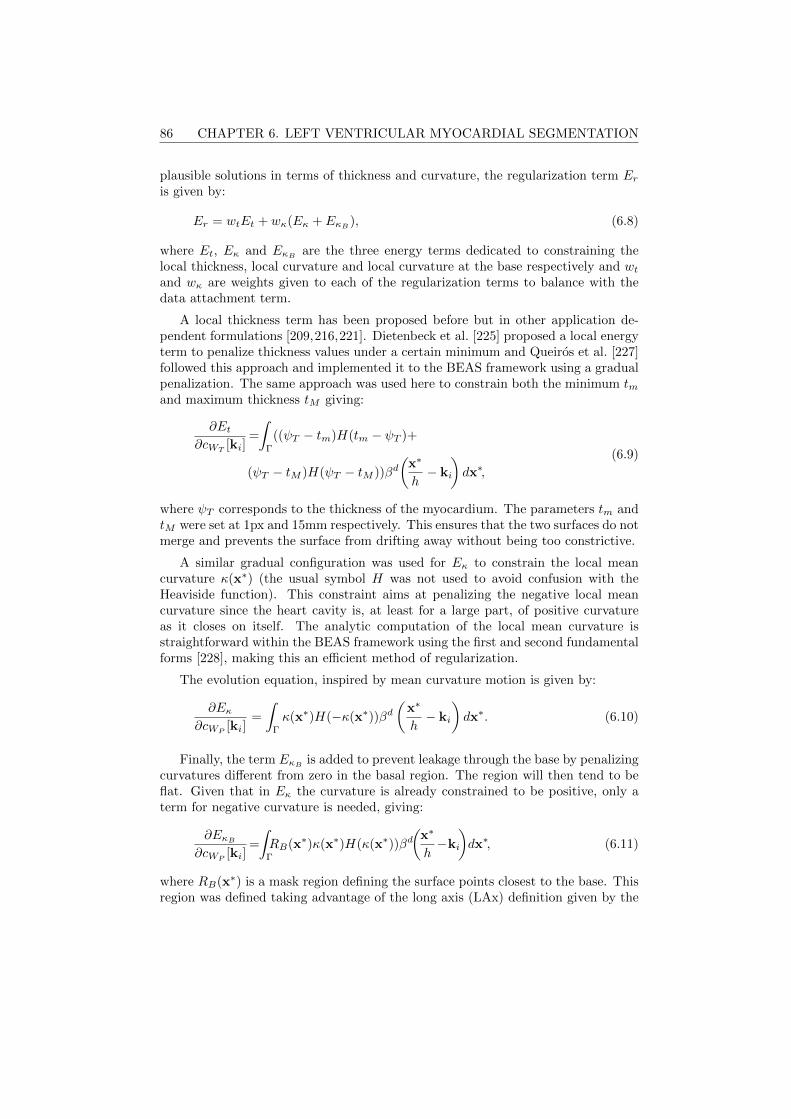
86 CHAPTER 6. LEFT VENTRICULAR MYOCARDIAL SEGMENTATION
plausible solutions in terms of thickness and curvature, the regularization term Eris given by:
Er = wtEt + wκ(Eκ + EκB), (6.8)
where Et, Eκ and EκBare the three energy terms dedicated to constraining the
local thickness, local curvature and local curvature at the base respectively and wtand wκ are weights given to each of the regularization terms to balance with thedata attachment term.
A local thickness term has been proposed before but in other application de-pendent formulations [209,216,221]. Dietenbeck et al. [225] proposed a local energyterm to penalize thickness values under a certain minimum and Queiros et al. [227]followed this approach and implemented it to the BEAS framework using a gradualpenalization. The same approach was used here to constrain both the minimum tmand maximum thickness tM giving:
∂Et∂cWT
[ki]=
∫Γ
((ψT − tm)H(tm − ψT )+
(ψT − tM )H(ψT − tM ))βd(
x∗
h− ki
)dx∗,
(6.9)
where ψT corresponds to the thickness of the myocardium. The parameters tm andtM were set at 1px and 15mm respectively. This ensures that the two surfaces do notmerge and prevents the surface from drifting away without being too constrictive.
A similar gradual configuration was used for Eκ to constrain the local meancurvature κ(x∗) (the usual symbol H was not used to avoid confusion with theHeaviside function). This constraint aims at penalizing the negative local meancurvature since the heart cavity is, at least for a large part, of positive curvatureas it closes on itself. The analytic computation of the local mean curvature isstraightforward within the BEAS framework using the first and second fundamentalforms [228], making this an efficient method of regularization.
The evolution equation, inspired by mean curvature motion is given by:
∂Eκ∂cWP
[ki]=
∫Γ
κ(x∗)H(−κ(x∗))βd(
x∗
h− ki
)dx∗. (6.10)
Finally, the term EκBis added to prevent leakage through the base by penalizing
curvatures different from zero in the basal region. The region will then tend to beflat. Given that in Eκ the curvature is already constrained to be positive, only aterm for negative curvature is needed, giving:
∂EκB
∂cWP[ki]
=
∫Γ
RB(x∗)κ(x∗)H(κ(x∗))βd(
x∗
h−ki
)dx∗, (6.11)
where RB(x∗) is a mask region defining the surface points closest to the base. Thisregion was defined taking advantage of the long axis (LAx) definition given by the
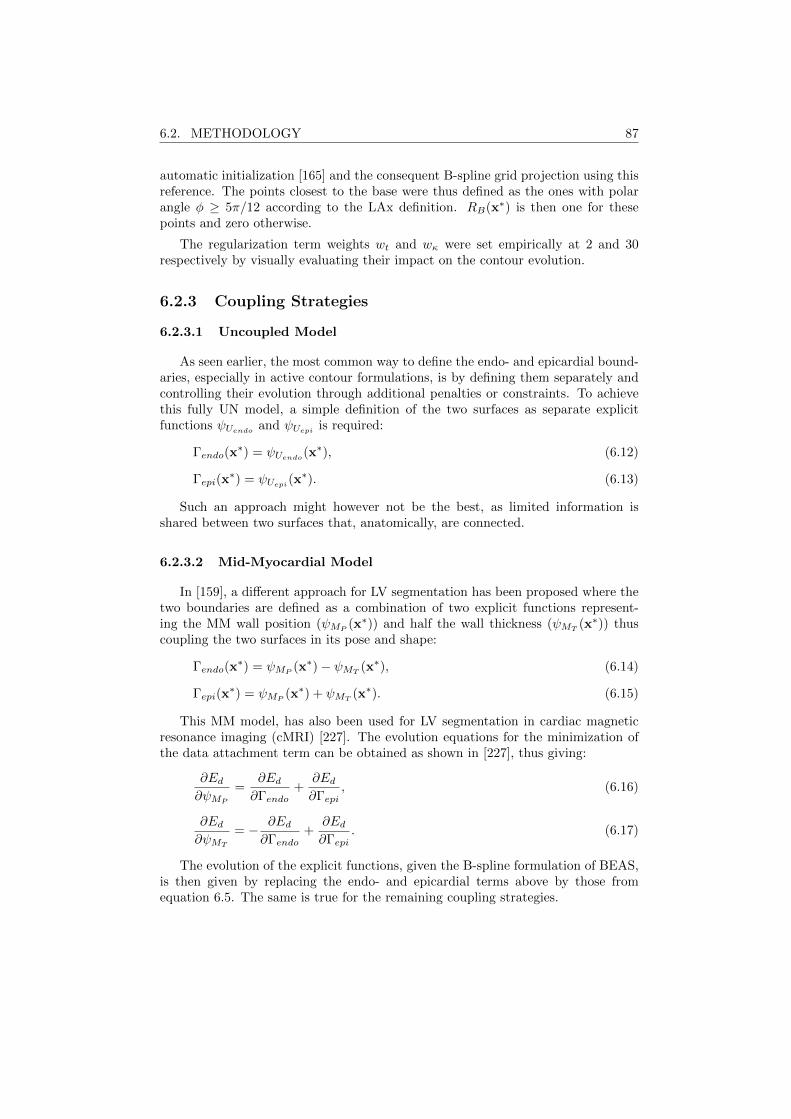
6.2. METHODOLOGY 87
automatic initialization [165] and the consequent B-spline grid projection using thisreference. The points closest to the base were thus defined as the ones with polarangle φ ≥ 5π/12 according to the LAx definition. RB(x∗) is then one for thesepoints and zero otherwise.
The regularization term weights wt and wκ were set empirically at 2 and 30respectively by visually evaluating their impact on the contour evolution.
6.2.3 Coupling Strategies
6.2.3.1 Uncoupled Model
As seen earlier, the most common way to define the endo- and epicardial bound-aries, especially in active contour formulations, is by defining them separately andcontrolling their evolution through additional penalties or constraints. To achievethis fully UN model, a simple definition of the two surfaces as separate explicitfunctions ψUendo
and ψUepi is required:
Γendo(x∗) = ψUendo
(x∗), (6.12)
Γepi(x∗) = ψUepi(x
∗). (6.13)
Such an approach might however not be the best, as limited information isshared between two surfaces that, anatomically, are connected.
6.2.3.2 Mid-Myocardial Model
In [159], a different approach for LV segmentation has been proposed where thetwo boundaries are defined as a combination of two explicit functions represent-ing the MM wall position (ψMP
(x∗)) and half the wall thickness (ψMT(x∗)) thus
coupling the two surfaces in its pose and shape:
Γendo(x∗) = ψMP
(x∗)− ψMT(x∗), (6.14)
Γepi(x∗) = ψMP
(x∗) + ψMT(x∗). (6.15)
This MM model, has also been used for LV segmentation in cardiac magneticresonance imaging (cMRI) [227]. The evolution equations for the minimization ofthe data attachment term can be obtained as shown in [227], thus giving:
∂Ed∂ψMP
=∂Ed∂Γendo
+∂Ed∂Γepi
, (6.16)
∂Ed∂ψMT
= − ∂Ed∂Γendo
+∂Ed∂Γepi
. (6.17)
The evolution of the explicit functions, given the B-spline formulation of BEAS,is then given by replacing the endo- and epicardial terms above by those fromequation 6.5. The same is true for the remaining coupling strategies.

88 CHAPTER 6. LEFT VENTRICULAR MYOCARDIAL SEGMENTATION
Analysing equations 6.14-6.17, it becomes clear that both surfaces give equalcontributions to the evolution of each other. However, and due to the fact thatepicardial border detection is much more challenging in apical views, it may be moreadvantageous to have a coupling strategy in which the endocardial information hasa greater influence than the epicardial.
6.2.3.3 Endocardial Based Model
A change to the MM model is proposed in this chapter in order to form the EBmodel. Hereto, the two explicit functions are defined as the endocardial boundaryposition (ψEP
(x∗)) and the full myocardial wall thickness (ψET(x∗)) thus giving:
Γendo(x∗) = ψEP
(x∗), (6.18)
Γepi(x∗) = ψEP
(x∗) + ψET(x∗). (6.19)
Again, following the derivation shown in Queiros et al. [227], the evolution equa-tions for the minimization of the data attachment term can be obtained:
∂Ed∂ψEP
=∂Ed∂Γendo
, (6.20)
∂Ed∂ψET
= − ∂Ed∂Γendo
+∂Ed∂Γepi
. (6.21)
A schematic representation of both the EB and MM models is shown in Figure6.1. This EB model maintains the key advantages of the MM model, namely thejoint evolution of both contours and also the control over the myocardial wall prop-erties. It has however a greater independence of the endocardial surface as can beseen in equation 6.20.
6.2.3.4 2-Step Model
Nevertheless, in the EB model, there is still an influence of the epicardial in-formation to the endocardial evolution, as the thickness of the myocardium willinfluence the region of interest (ROI) that is used to evolve the endocardium ac-cording to equation 6.3.
As such, a fourth strategy is proposed in which the EB model is used but in a 2Sapproach to guarantee full endocardial independence from the epicardium. First,the endocardium segmentation is performed in an uncoupled manner until a finalendocardial solution is obtained. Secondly, the EB model is initialized and coupledsegmentation of the epicardial surface is performed without, however, evolving theendocardium any further. This can also be seen as first running the EB modelwith a fixed thickness until endocardial convergence, and only then performingthe epicardial segmentation per se. In any case, this 2S model will allow for anendocardial segmentation which is completely independent but which will guide theepicardial segmentation in both pose and shape.
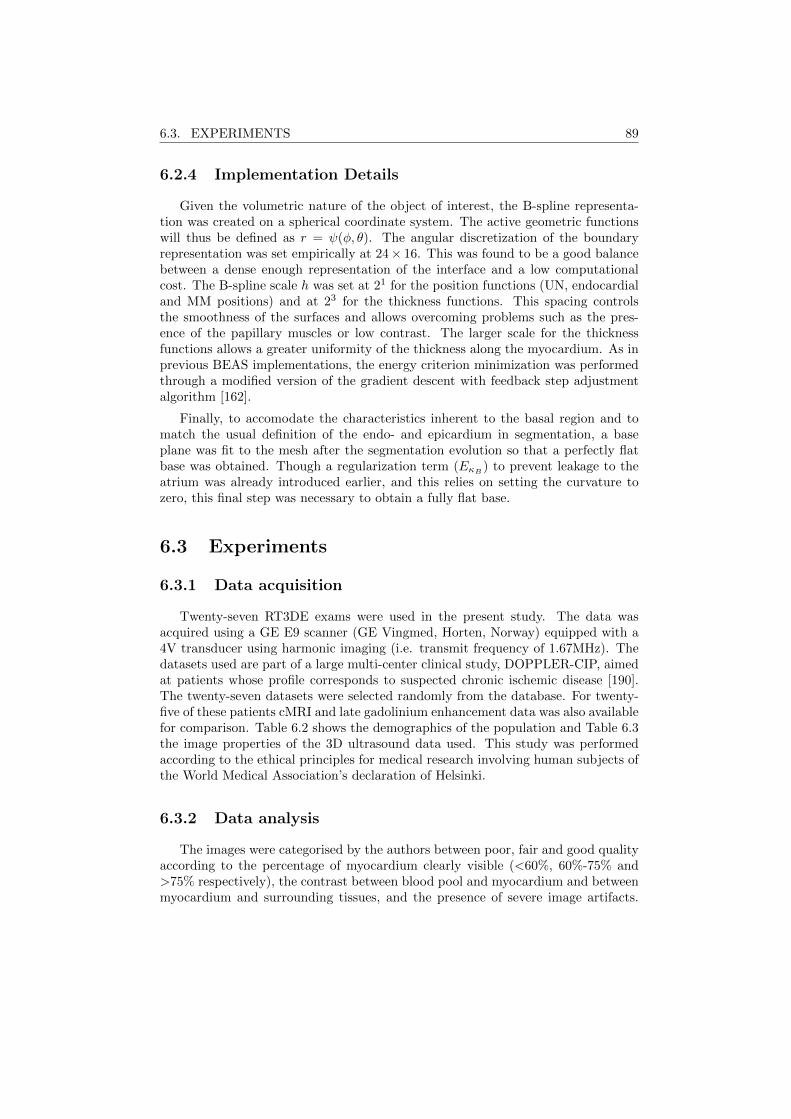
6.3. EXPERIMENTS 89
6.2.4 Implementation Details
Given the volumetric nature of the object of interest, the B-spline representa-tion was created on a spherical coordinate system. The active geometric functionswill thus be defined as r = ψ(φ, θ). The angular discretization of the boundaryrepresentation was set empirically at 24× 16. This was found to be a good balancebetween a dense enough representation of the interface and a low computationalcost. The B-spline scale h was set at 21 for the position functions (UN, endocardialand MM positions) and at 23 for the thickness functions. This spacing controlsthe smoothness of the surfaces and allows overcoming problems such as the pres-ence of the papillary muscles or low contrast. The larger scale for the thicknessfunctions allows a greater uniformity of the thickness along the myocardium. As inprevious BEAS implementations, the energy criterion minimization was performedthrough a modified version of the gradient descent with feedback step adjustmentalgorithm [162].
Finally, to accomodate the characteristics inherent to the basal region and tomatch the usual definition of the endo- and epicardium in segmentation, a baseplane was fit to the mesh after the segmentation evolution so that a perfectly flatbase was obtained. Though a regularization term (EκB
) to prevent leakage to theatrium was already introduced earlier, and this relies on setting the curvature tozero, this final step was necessary to obtain a fully flat base.
6.3 Experiments
6.3.1 Data acquisition
Twenty-seven RT3DE exams were used in the present study. The data wasacquired using a GE E9 scanner (GE Vingmed, Horten, Norway) equipped with a4V transducer using harmonic imaging (i.e. transmit frequency of 1.67MHz). Thedatasets used are part of a large multi-center clinical study, DOPPLER-CIP, aimedat patients whose profile corresponds to suspected chronic ischemic disease [190].The twenty-seven datasets were selected randomly from the database. For twenty-five of these patients cMRI and late gadolinium enhancement data was also availablefor comparison. Table 6.2 shows the demographics of the population and Table 6.3the image properties of the 3D ultrasound data used. This study was performedaccording to the ethical principles for medical research involving human subjects ofthe World Medical Association’s declaration of Helsinki.
6.3.2 Data analysis
The images were categorised by the authors between poor, fair and good qualityaccording to the percentage of myocardium clearly visible (<60%, 60%-75% and>75% respectively), the contrast between blood pool and myocardium and betweenmyocardium and surrounding tissues, and the presence of severe image artifacts.
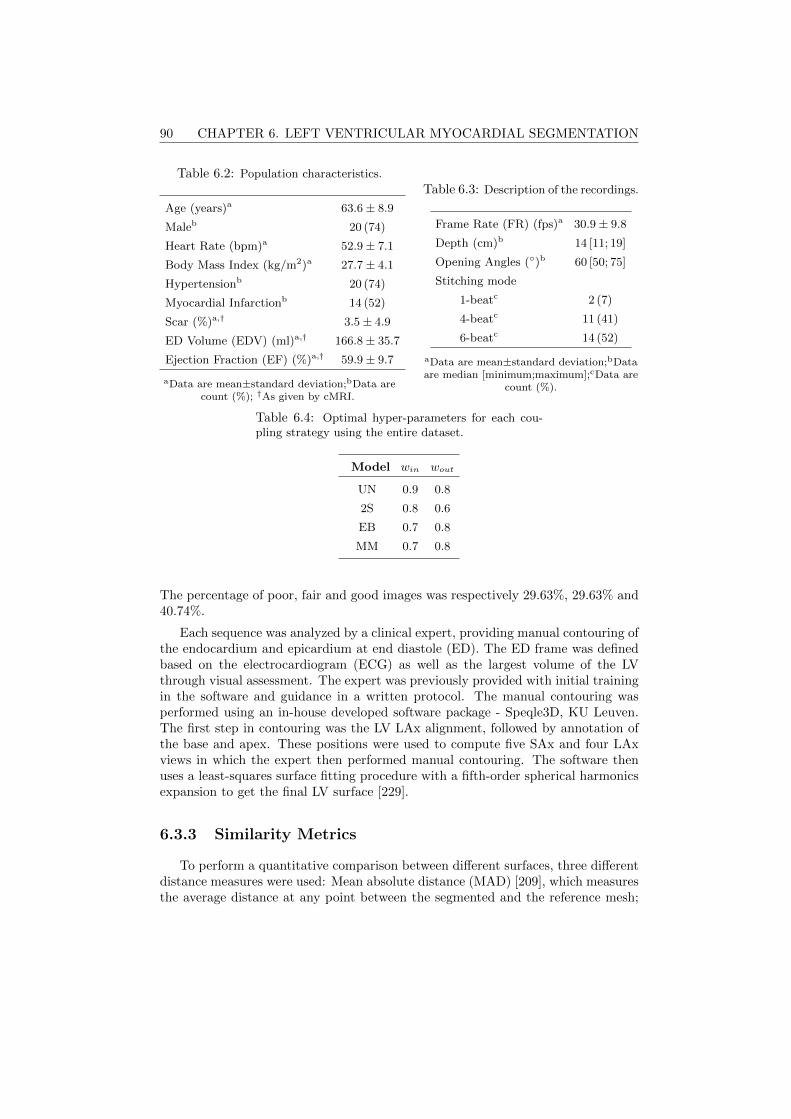
90 CHAPTER 6. LEFT VENTRICULAR MYOCARDIAL SEGMENTATION
Table 6.2: Population characteristics.
Age (years)a 63.6± 8.9
Maleb 20 (74)
Heart Rate (bpm)a 52.9± 7.1
Body Mass Index (kg/m2)a 27.7± 4.1
Hypertensionb 20 (74)
Myocardial Infarctionb 14 (52)
Scar (%)a,† 3.5± 4.9
ED Volume (EDV) (ml)a,† 166.8± 35.7
Ejection Fraction (EF) (%)a,† 59.9± 9.7
aData are mean±standard deviation;bData arecount (%); †As given by cMRI.
Table 6.3: Description of the recordings.
Frame Rate (FR) (fps)a 30.9± 9.8
Depth (cm)b 14 [11; 19]
Opening Angles ()b 60 [50; 75]
Stitching mode
1-beatc 2 (7)
4-beatc 11 (41)
6-beatc 14 (52)
aData are mean±standard deviation;bDataare median [minimum;maximum];cData are
count (%).
Table 6.4: Optimal hyper-parameters for each cou-pling strategy using the entire dataset.
Model win wout
UN 0.9 0.8
2S 0.8 0.6
EB 0.7 0.8
MM 0.7 0.8
The percentage of poor, fair and good images was respectively 29.63%, 29.63% and40.74%.
Each sequence was analyzed by a clinical expert, providing manual contouring ofthe endocardium and epicardium at end diastole (ED). The ED frame was definedbased on the electrocardiogram (ECG) as well as the largest volume of the LVthrough visual assessment. The expert was previously provided with initial trainingin the software and guidance in a written protocol. The manual contouring wasperformed using an in-house developed software package - Speqle3D, KU Leuven.The first step in contouring was the LV LAx alignment, followed by annotation ofthe base and apex. These positions were used to compute five SAx and four LAxviews in which the expert then performed manual contouring. The software thenuses a least-squares surface fitting procedure with a fifth-order spherical harmonicsexpansion to get the final LV surface [229].
6.3.3 Similarity Metrics
To perform a quantitative comparison between different surfaces, three differentdistance measures were used: Mean absolute distance (MAD) [209], which measuresthe average distance at any point between the segmented and the reference mesh;
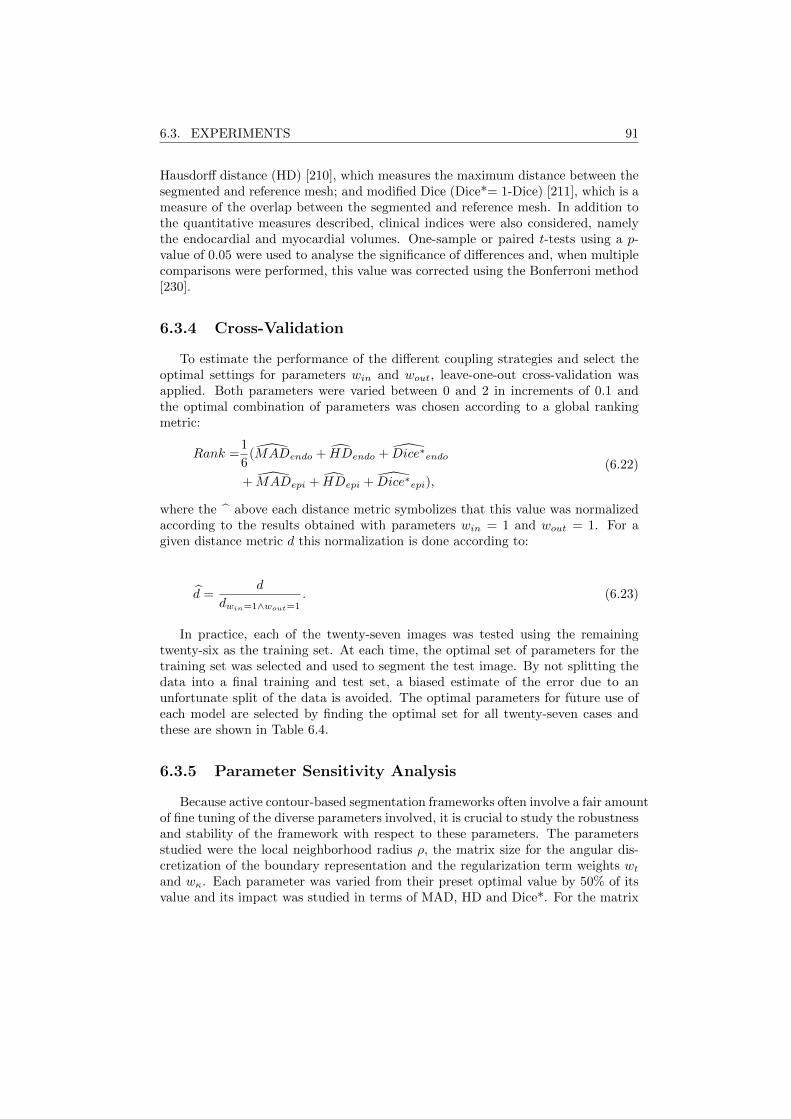
6.3. EXPERIMENTS 91
Hausdorff distance (HD) [210], which measures the maximum distance between thesegmented and reference mesh; and modified Dice (Dice*= 1-Dice) [211], which is ameasure of the overlap between the segmented and reference mesh. In addition tothe quantitative measures described, clinical indices were also considered, namelythe endocardial and myocardial volumes. One-sample or paired t-tests using a p-value of 0.05 were used to analyse the significance of differences and, when multiplecomparisons were performed, this value was corrected using the Bonferroni method[230].
6.3.4 Cross-Validation
To estimate the performance of the different coupling strategies and select theoptimal settings for parameters win and wout, leave-one-out cross-validation wasapplied. Both parameters were varied between 0 and 2 in increments of 0.1 andthe optimal combination of parameters was chosen according to a global rankingmetric:
Rank =1
6(MADendo + HDendo + Dice∗endo
+ MADepi + HDepi + Dice∗epi),
(6.22)
where the above each distance metric symbolizes that this value was normalizedaccording to the results obtained with parameters win = 1 and wout = 1. For agiven distance metric d this normalization is done according to:
d =d
dwin=1∧wout=1. (6.23)
In practice, each of the twenty-seven images was tested using the remainingtwenty-six as the training set. At each time, the optimal set of parameters for thetraining set was selected and used to segment the test image. By not splitting thedata into a final training and test set, a biased estimate of the error due to anunfortunate split of the data is avoided. The optimal parameters for future use ofeach model are selected by finding the optimal set for all twenty-seven cases andthese are shown in Table 6.4.
6.3.5 Parameter Sensitivity Analysis
Because active contour-based segmentation frameworks often involve a fair amountof fine tuning of the diverse parameters involved, it is crucial to study the robustnessand stability of the framework with respect to these parameters. The parametersstudied were the local neighborhood radius ρ, the matrix size for the angular dis-cretization of the boundary representation and the regularization term weights wtand wκ. Each parameter was varied from their preset optimal value by 50% of itsvalue and its impact was studied in terms of MAD, HD and Dice*. For the matrix
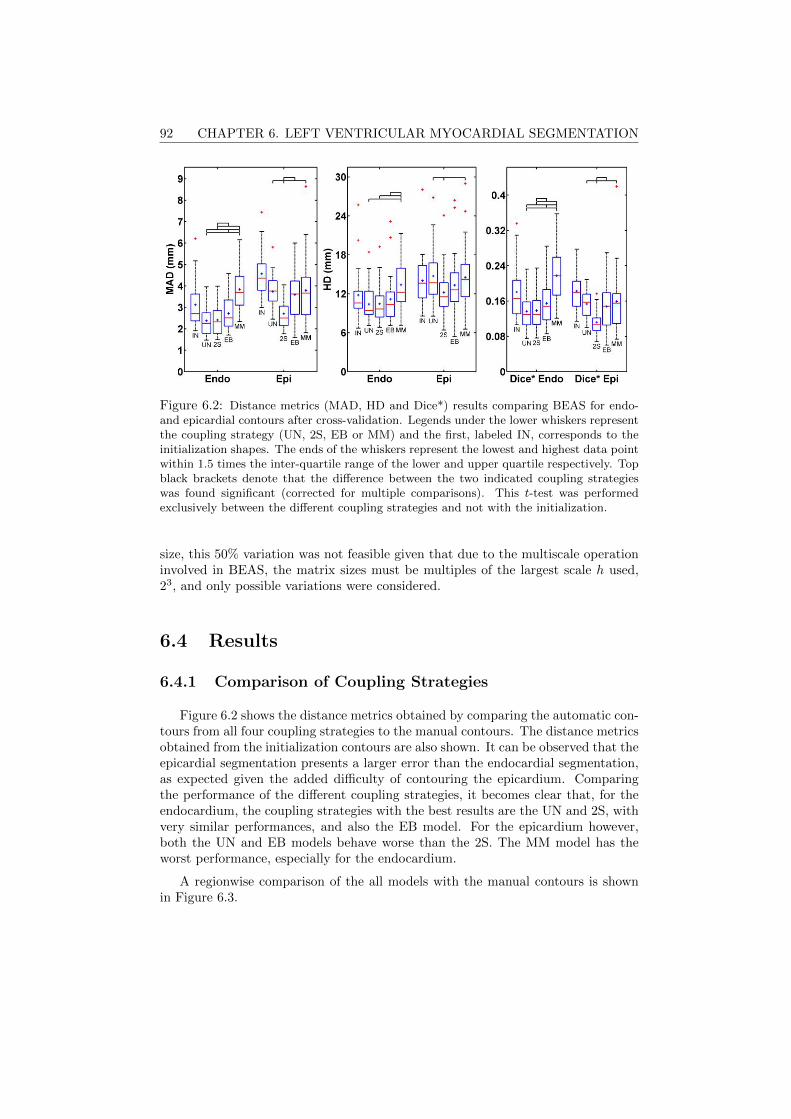
92 CHAPTER 6. LEFT VENTRICULAR MYOCARDIAL SEGMENTATION
Figure 6.2: Distance metrics (MAD, HD and Dice*) results comparing BEAS for endo-and epicardial contours after cross-validation. Legends under the lower whiskers representthe coupling strategy (UN, 2S, EB or MM) and the first, labeled IN, corresponds to theinitialization shapes. The ends of the whiskers represent the lowest and highest data pointwithin 1.5 times the inter-quartile range of the lower and upper quartile respectively. Topblack brackets denote that the difference between the two indicated coupling strategieswas found significant (corrected for multiple comparisons). This t-test was performedexclusively between the different coupling strategies and not with the initialization.
size, this 50% variation was not feasible given that due to the multiscale operationinvolved in BEAS, the matrix sizes must be multiples of the largest scale h used,23, and only possible variations were considered.
6.4 Results
6.4.1 Comparison of Coupling Strategies
Figure 6.2 shows the distance metrics obtained by comparing the automatic con-tours from all four coupling strategies to the manual contours. The distance metricsobtained from the initialization contours are also shown. It can be observed that theepicardial segmentation presents a larger error than the endocardial segmentation,as expected given the added difficulty of contouring the epicardium. Comparingthe performance of the different coupling strategies, it becomes clear that, for theendocardium, the coupling strategies with the best results are the UN and 2S, withvery similar performances, and also the EB model. For the epicardium however,both the UN and EB models behave worse than the 2S. The MM model has theworst performance, especially for the endocardium.
A regionwise comparison of the all models with the manual contours is shownin Figure 6.3.
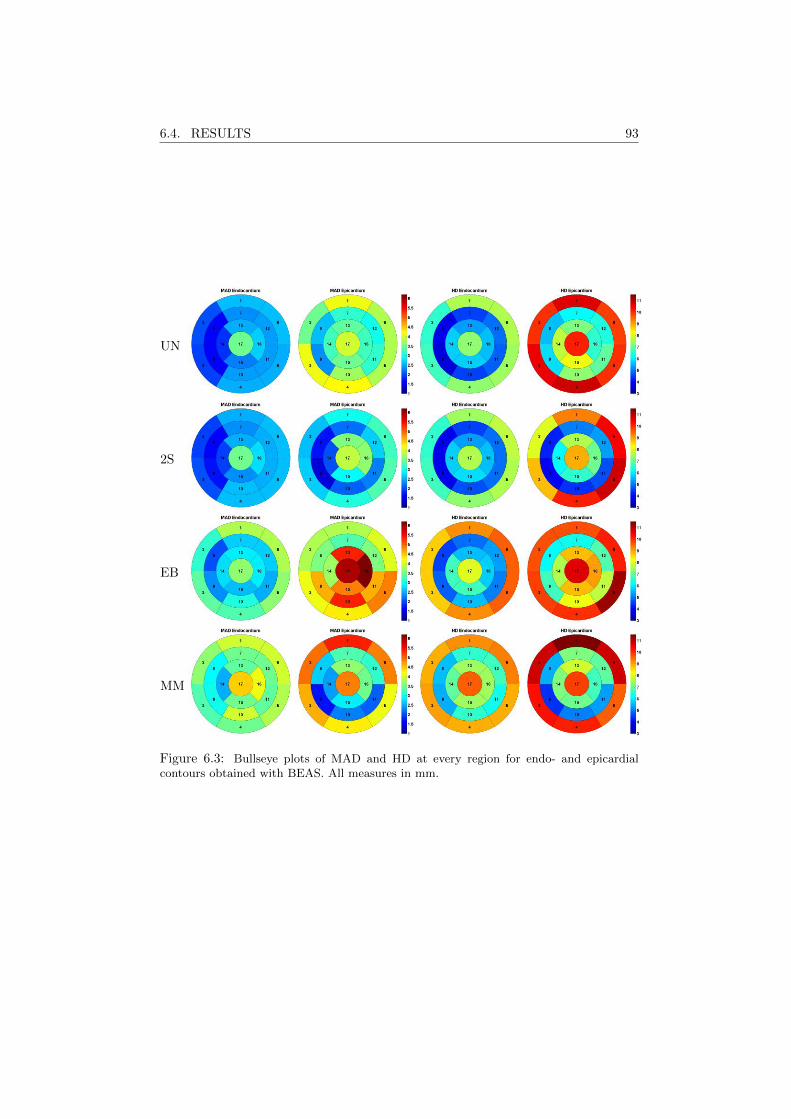
6.4. RESULTS 93
UN
2S
EB
MM
Figure 6.3: Bullseye plots of MAD and HD at every region for endo- and epicardialcontours obtained with BEAS. All measures in mm.
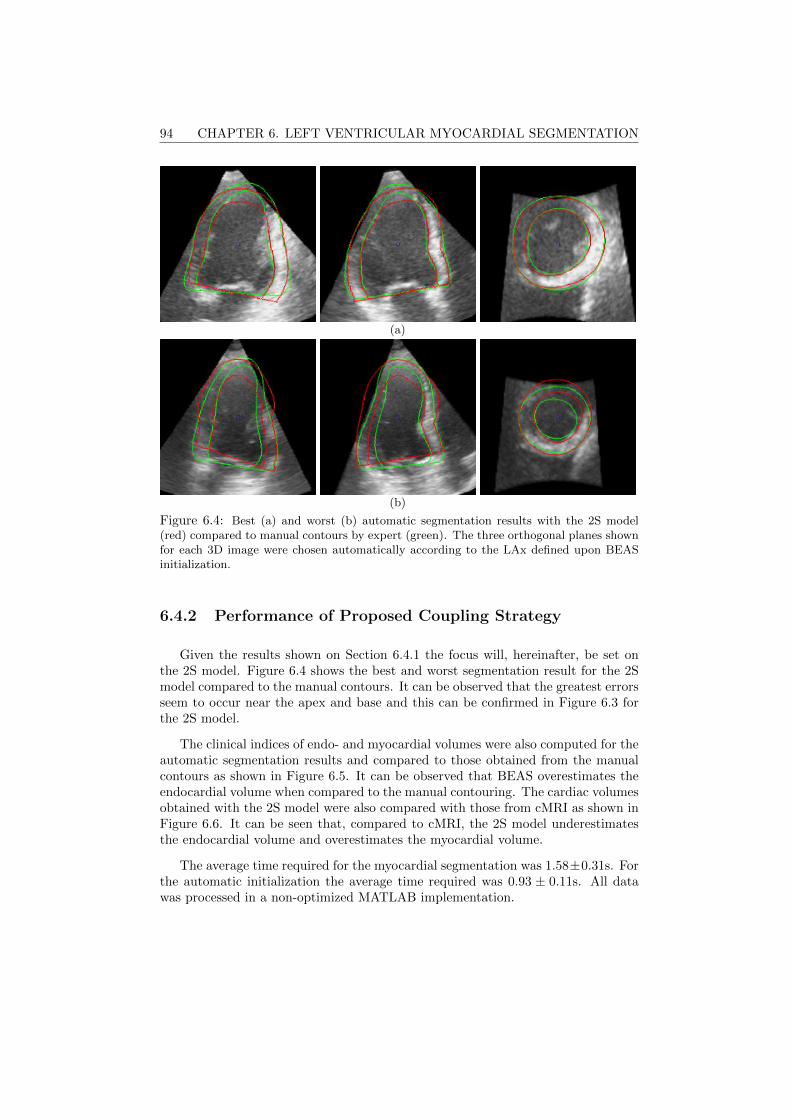
94 CHAPTER 6. LEFT VENTRICULAR MYOCARDIAL SEGMENTATION
(a)
(b)
Figure 6.4: Best (a) and worst (b) automatic segmentation results with the 2S model(red) compared to manual contours by expert (green). The three orthogonal planes shownfor each 3D image were chosen automatically according to the LAx defined upon BEASinitialization.
6.4.2 Performance of Proposed Coupling Strategy
Given the results shown on Section 6.4.1 the focus will, hereinafter, be set onthe 2S model. Figure 6.4 shows the best and worst segmentation result for the 2Smodel compared to the manual contours. It can be observed that the greatest errorsseem to occur near the apex and base and this can be confirmed in Figure 6.3 forthe 2S model.
The clinical indices of endo- and myocardial volumes were also computed for theautomatic segmentation results and compared to those obtained from the manualcontours as shown in Figure 6.5. It can be observed that BEAS overestimates theendocardial volume when compared to the manual contouring. The cardiac volumesobtained with the 2S model were also compared with those from cMRI as shown inFigure 6.6. It can be seen that, compared to cMRI, the 2S model underestimatesthe endocardial volume and overestimates the myocardial volume.
The average time required for the myocardial segmentation was 1.58±0.31s. Forthe automatic initialization the average time required was 0.93 ± 0.11s. All datawas processed in a non-optimized MATLAB implementation.
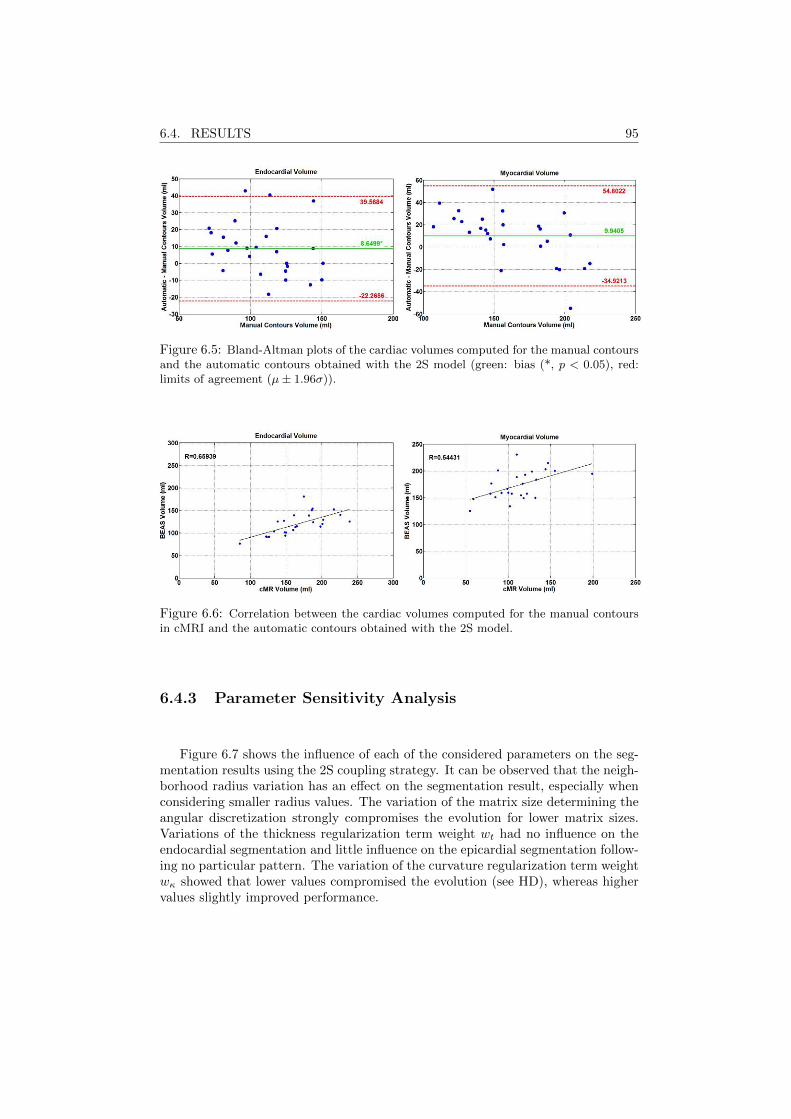
6.4. RESULTS 95
Figure 6.5: Bland-Altman plots of the cardiac volumes computed for the manual contoursand the automatic contours obtained with the 2S model (green: bias (*, p < 0.05), red:limits of agreement (µ± 1.96σ)).
Figure 6.6: Correlation between the cardiac volumes computed for the manual contoursin cMRI and the automatic contours obtained with the 2S model.
6.4.3 Parameter Sensitivity Analysis
Figure 6.7 shows the influence of each of the considered parameters on the seg-mentation results using the 2S coupling strategy. It can be observed that the neigh-borhood radius variation has an effect on the segmentation result, especially whenconsidering smaller radius values. The variation of the matrix size determining theangular discretization strongly compromises the evolution for lower matrix sizes.Variations of the thickness regularization term weight wt had no influence on theendocardial segmentation and little influence on the epicardial segmentation follow-ing no particular pattern. The variation of the curvature regularization term weightwκ showed that lower values compromised the evolution (see HD), whereas highervalues slightly improved performance.
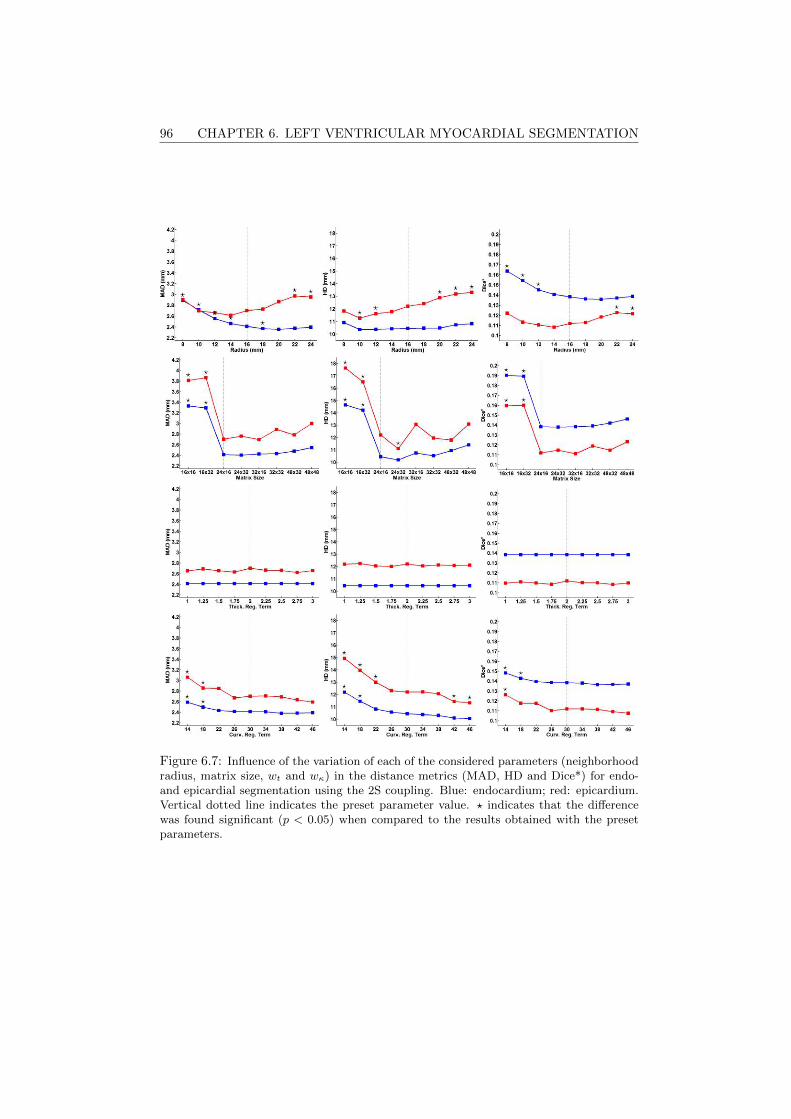
96 CHAPTER 6. LEFT VENTRICULAR MYOCARDIAL SEGMENTATION
Figure 6.7: Influence of the variation of each of the considered parameters (neighborhoodradius, matrix size, wt and wκ) in the distance metrics (MAD, HD and Dice*) for endo-and epicardial segmentation using the 2S coupling. Blue: endocardium; red: epicardium.Vertical dotted line indicates the preset parameter value. ? indicates that the differencewas found significant (p < 0.05) when compared to the results obtained with the presetparameters.
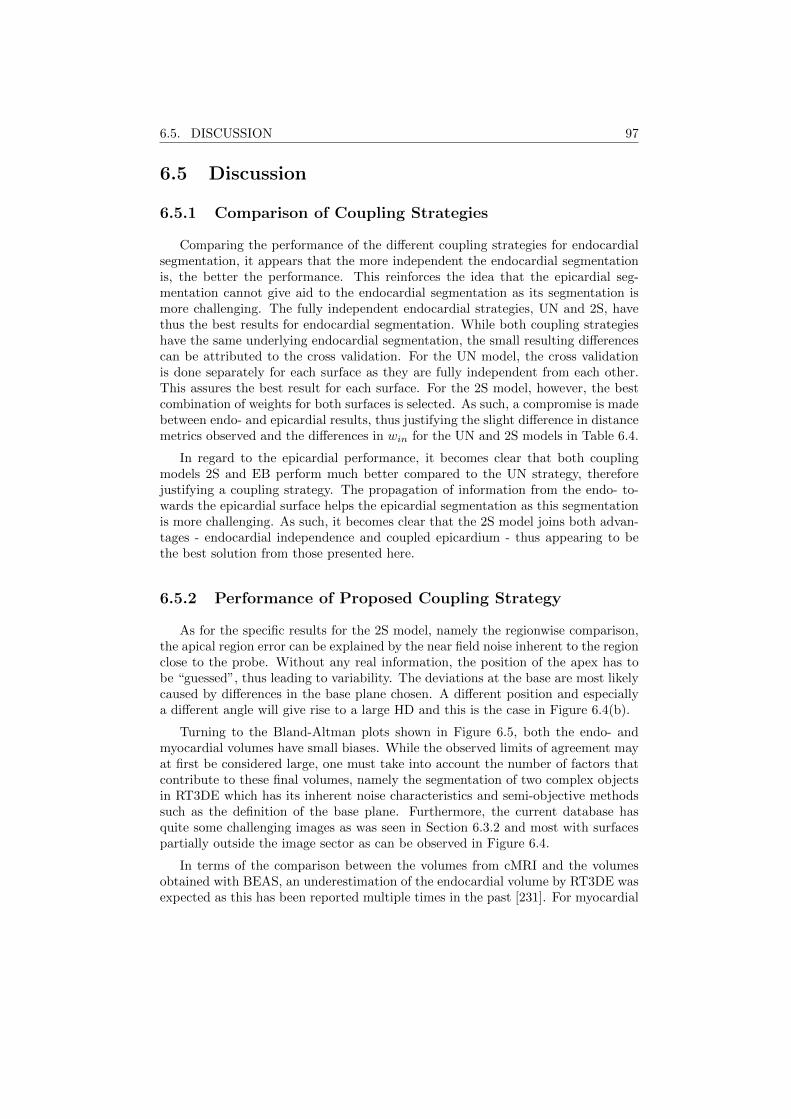
6.5. DISCUSSION 97
6.5 Discussion
6.5.1 Comparison of Coupling Strategies
Comparing the performance of the different coupling strategies for endocardialsegmentation, it appears that the more independent the endocardial segmentationis, the better the performance. This reinforces the idea that the epicardial seg-mentation cannot give aid to the endocardial segmentation as its segmentation ismore challenging. The fully independent endocardial strategies, UN and 2S, havethus the best results for endocardial segmentation. While both coupling strategieshave the same underlying endocardial segmentation, the small resulting differencescan be attributed to the cross validation. For the UN model, the cross validationis done separately for each surface as they are fully independent from each other.This assures the best result for each surface. For the 2S model, however, the bestcombination of weights for both surfaces is selected. As such, a compromise is madebetween endo- and epicardial results, thus justifying the slight difference in distancemetrics observed and the differences in win for the UN and 2S models in Table 6.4.
In regard to the epicardial performance, it becomes clear that both couplingmodels 2S and EB perform much better compared to the UN strategy, thereforejustifying a coupling strategy. The propagation of information from the endo- to-wards the epicardial surface helps the epicardial segmentation as this segmentationis more challenging. As such, it becomes clear that the 2S model joins both advan-tages - endocardial independence and coupled epicardium - thus appearing to bethe best solution from those presented here.
6.5.2 Performance of Proposed Coupling Strategy
As for the specific results for the 2S model, namely the regionwise comparison,the apical region error can be explained by the near field noise inherent to the regionclose to the probe. Without any real information, the position of the apex has tobe “guessed”, thus leading to variability. The deviations at the base are most likelycaused by differences in the base plane chosen. A different position and especiallya different angle will give rise to a large HD and this is the case in Figure 6.4(b).
Turning to the Bland-Altman plots shown in Figure 6.5, both the endo- andmyocardial volumes have small biases. While the observed limits of agreement mayat first be considered large, one must take into account the number of factors thatcontribute to these final volumes, namely the segmentation of two complex objectsin RT3DE which has its inherent noise characteristics and semi-objective methodssuch as the definition of the base plane. Furthermore, the current database hasquite some challenging images as was seen in Section 6.3.2 and most with surfacespartially outside the image sector as can be observed in Figure 6.4.
In terms of the comparison between the volumes from cMRI and the volumesobtained with BEAS, an underestimation of the endocardial volume by RT3DE wasexpected as this has been reported multiple times in the past [231]. For myocardial
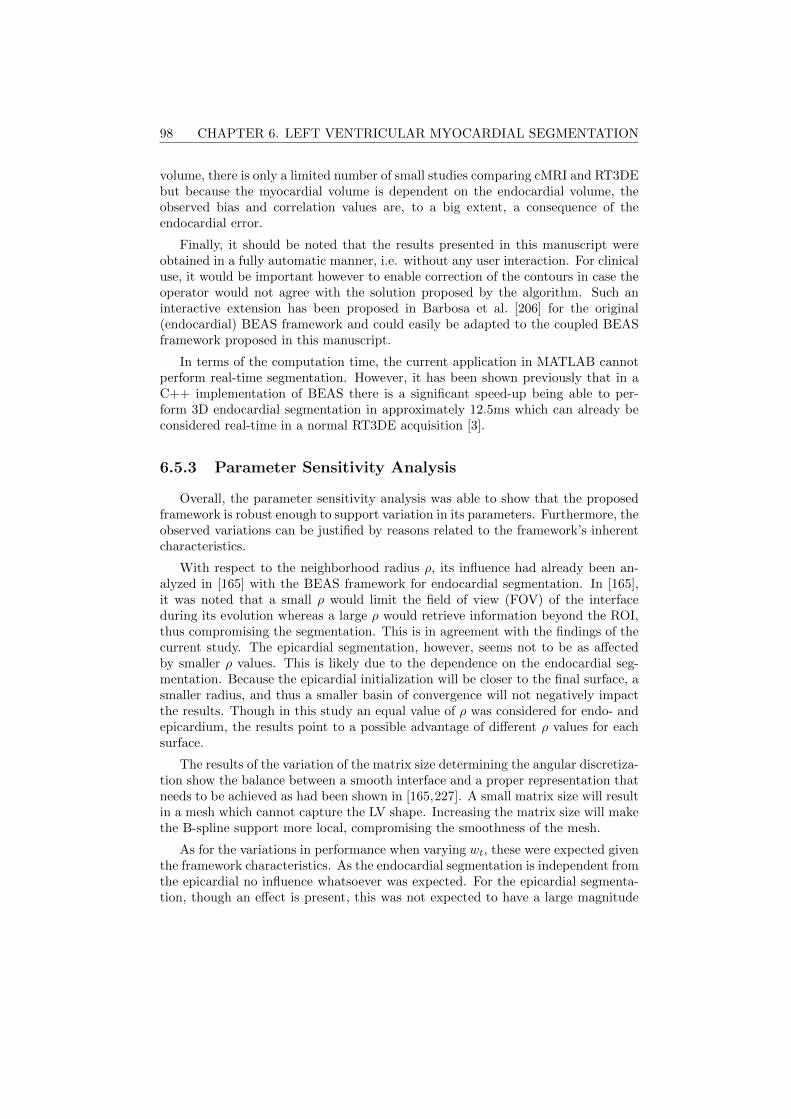
98 CHAPTER 6. LEFT VENTRICULAR MYOCARDIAL SEGMENTATION
volume, there is only a limited number of small studies comparing cMRI and RT3DEbut because the myocardial volume is dependent on the endocardial volume, theobserved bias and correlation values are, to a big extent, a consequence of theendocardial error.
Finally, it should be noted that the results presented in this manuscript wereobtained in a fully automatic manner, i.e. without any user interaction. For clinicaluse, it would be important however to enable correction of the contours in case theoperator would not agree with the solution proposed by the algorithm. Such aninteractive extension has been proposed in Barbosa et al. [206] for the original(endocardial) BEAS framework and could easily be adapted to the coupled BEASframework proposed in this manuscript.
In terms of the computation time, the current application in MATLAB cannotperform real-time segmentation. However, it has been shown previously that in aC++ implementation of BEAS there is a significant speed-up being able to per-form 3D endocardial segmentation in approximately 12.5ms which can already beconsidered real-time in a normal RT3DE acquisition [3].
6.5.3 Parameter Sensitivity Analysis
Overall, the parameter sensitivity analysis was able to show that the proposedframework is robust enough to support variation in its parameters. Furthermore, theobserved variations can be justified by reasons related to the framework’s inherentcharacteristics.
With respect to the neighborhood radius ρ, its influence had already been an-alyzed in [165] with the BEAS framework for endocardial segmentation. In [165],it was noted that a small ρ would limit the field of view (FOV) of the interfaceduring its evolution whereas a large ρ would retrieve information beyond the ROI,thus compromising the segmentation. This is in agreement with the findings of thecurrent study. The epicardial segmentation, however, seems not to be as affectedby smaller ρ values. This is likely due to the dependence on the endocardial seg-mentation. Because the epicardial initialization will be closer to the final surface, asmaller radius, and thus a smaller basin of convergence will not negatively impactthe results. Though in this study an equal value of ρ was considered for endo- andepicardium, the results point to a possible advantage of different ρ values for eachsurface.
The results of the variation of the matrix size determining the angular discretiza-tion show the balance between a smooth interface and a proper representation thatneeds to be achieved as had been shown in [165,227]. A small matrix size will resultin a mesh which cannot capture the LV shape. Increasing the matrix size will makethe B-spline support more local, compromising the smoothness of the mesh.
As for the variations in performance when varying wt, these were expected giventhe framework characteristics. As the endocardial segmentation is independent fromthe epicardial no influence whatsoever was expected. For the epicardial segmenta-tion, though an effect is present, this was not expected to have a large magnitude
6.5. DISCUSSION 99
or specific trend. Due to the fact that a change to the thickness regularizationterm will only have an impact on the strength of the force pulling the contours toplausible values of thickness, changing this value will not have a significant impacton the final result.
Finally, the results observed for the impact of wκ can be caused by either Eκ,EκB
or both since both regularization terms are controlled by wκ. However, giventhat this impact is much more significant for the HD and for the epicardium, itcan be inferred that the base curvature is the main origin of these results as it hasbeen shown that this is the region with the highest HD. According to the results onFigure 6.7, it seems that increasing the value of wκ could improve the segmentationaccuracy, especially for the epicardial segmentation.
6.5.4 Limitations and Future Work
In spite of the results shown in this study, there are some limitations that mustbe addressed in the future. In this study, only the ED frame was segmented. Seg-mentation of the end systolic (ES) frame would be extremely important not only toobtain important clinical values, such as EF, but also to further validate the pro-posed framework. Though the 2S endocardial segmentation is fully independent,and an approach for endocardial ES segmentation has been validated first in [165]and later in Chapters 3 and 5, the performance of the epicardial segmentation hasnot yet been tested and should be addressed in the future.
While the 2S model was the most successful for this population, one must takeinto account that under other populations another model might be more successful.This could be the case for example in hypertrabeculated hearts where the endo-cardial segmentation can be especially challenging. Similarly, some of the caseshave parts of the epicardial surface outside the FOV which has an influence on theresults. Nevertheless, the population considered in this study is representative ofthe greater part of the patients referred for echocardiography which strenghtens theconclusions of this study.
Furthermore, one might consider ways to improve the robustness of this segmen-tation approach. Given the very way that clinicians manually contour the LV, thedefinition of a base plane is required and differences between base planes give riseto large errors in both distance metrics and volume measurements. A method forautomatic detection of specific landmarks such as the mitral annulus (MA) and/orthe LV outflow tract (LVOT) could be of paramount importance to minimize theerror in this region. The introduction of prior shape information through a myocar-dial SSM as was done in Chapter 5 for the endocardium could also help in makingthe segmentation more exact, especially near the base but also in the apex and lowcontrast regions where BEAS sometimes fails to segment correctly.

100 CHAPTER 6. LEFT VENTRICULAR MYOCARDIAL SEGMENTATION
6.6 Conclusions
In conclusion, a framework to perform fully automatic segmentation of endo-and epicardium was proposed. It was shown that the use of a coupling strategycan be advantageous. In the case of apical RT3DE, the optimal coupling strategywas the 2S model, where an independent endocardial segmentation is performedfollowed by a coupled epicardial segmentation. In this way, information from theendocardial shape is propagated to the epicardium but not vice-versa. This resultis a consequence of the inherent characteristics of 3D apical ultrasound images.Similarly to the original BEAS for endocardial segmentation, this approach wouldallow for the implementation of an optimized version of this algorithm in an onlineanalysis tool to provide real-time functional measurements.
Chapter 7
Validation of Automatic 3DMyocardial SegmentationUsing Coupled Shape-BasedB-Spline Explicit ActiveSurfaces
This chapter is based on a paper submitted for publication in a peer-reviewed journal: Pe-drosa J., Duchenne J., Queiros S., Degtiarova G., Gheysens O., Claus P., Voigt J., D’hoogeJ.. Non-invasive myocardial performance mapping using 3D echocardiographic stress-strain loops:validation against PET.
101
102 CHAPTER 7. SHAPE-BASED MYOCARDIAL SEGMENTATION
Abstract
Cardiac assessment is a critical step in cardiology and real-time 3D echocardio-graphy (RT3DE) plays an increasingly important role. While numerous approacheshave been presented for left ventricle (LV) endocardial segmentation, myocardialsegmentation (i.e. segmenting both endo- and epicardial surfaces) has received lessattention. However, myocardial segmentation provides clinical information and isoften essential in post-processing such as strain and classification approaches. In thischapter, a method for shape-based full-cycle myocardial segmentation is proposedfusing the advantages of B-spline Explicit Active Surfaces (BEAS) and statisticalshape models (SSM) for a robust segmentation. The segmentation is propagatedthroughout the heart cycle using localized anatomical affine optical flow (lAAOF).The framework was validated on the CETUS challenge data, a publicly availablemulti-center multi-vendor dataset with manual endocardial contouring performed by3 experts at end diastole (ED) and end systole (ES). One expert segmented the epi-cardium using the same protocol and image planes as those used for the endocardiumto assure uniformity. It is shown that the proposed method achieves a mean absolutedistance (MAD), Hausdorff distance (HD) and Dice of 2.49±0.60mm, 9.91±2.96mmand 0.908±0.029 at ED and 2.90±0.68mm, 12.02±3.28mm and 0.881±0.037 at ESfor epicardial segmentation. The epicardial reference contours developed in thisstudy were made available on the CETUS website thus allowing for future compar-ison studies on epicardial segmentation.
7.1 Introduction
LV volume and function assessment is an essential step in clinical cardiologywhere echocardiography plays a major role due to its low-cost, portability, non-invasiveness and good spatiotemporal resolution. While 2D echocardiography (2DE)is still the standard imaging mode used, RT3DE has several advantages as it allowsto visualize the whole 3D LV geometry and avoids geometrical assumptions usuallyused in 2DE. Nevertheless, manual analysis of 3D imaging is challenging and timeconsuming making the development of automatic tools to help clinicians extremelyimportant.
In spite of the challenges of RT3DE, numerous approaches have been proposedfor automatic and semi-automatic LV segmentation, most of these focused on theendocardial surface [75, 214]. However, epicardial segmentation is also extremelyuseful to study clinical indices such as LV mass and thickness and is also an essen-tial step in advanced post processing techniques such as strain and machine learningapproaches through the definition of a region of interest (ROI). Nevertheless, 3Depicardial segmentation methods have received little attention, especially if consid-ering automatic methods. Walimbe et al. [216] combined a deformable model witha generalized gradient vector field to perform 3D endo- and epicardial segmenta-tion with promising results. Orderud et al. [217] proposed a Kalman filter trackingframework which linked endo- and epicardial segmentation by sharing position, size
7.2. METHODOLOGY 103
and orientation between both surfaces, but this approach was only validated onsimulated images. A semiautomated extension of this approach for biventricularsegmentation has been validated in clinical images with promising results [232]. Atracking approach was proposed by Verhoek et al. [218], where optical flow is usedto propagate the results of the single-frame random forest segmentation from Lem-pitsky et al. [219]. However, none of these approaches perform a full coupling ofboth endo- and epicardial surfaces to share both position and orientation but alsoshape. It was shown in Chapter 6 that a two-step (2S) coupling, where the endo-cardial segmentation provided information to the epicardial segmentation but notvice-versa, was the most advantageous.
In Chapter 5, a segmentation and tracking framework was proposed for full-cycle endocardial LV segmentation which was based on a combination of BEASwith an SSM to provide LV shape clues which was propagated throughout thecycle with lAAOF. This framework was shown to outperform all other proposed LVendocardial segmentation frameworks. In this work, this framework is extended forLV myocardial segmentation using the 2S model and a myocardial SSM to provideshape information on the LV myocardium.
7.2 Methodology
7.2.1 B-spline Explicit Active Surfaces
It was shown in Chapter 6 that the most efficient way to represent the my-ocardium using the BEAS framework was to perform a 2S approach where theendocardial segmentation was performed independently, followed by the epicardialsegmentation represented as the thickness of the myocardium. This allowed theepicardium to take advantage of the information from the endocardial segmenta-tion without the need for extensive and complicated constraints between the twosurfaces. This same representation was chosen for the current study.
As in previous implementations for LV and myocardial segmentation, the angulardiscretization was set to 24× 16 (elevation×azimuth) and the B-spline scale to 21.
The evolution of the model is defined by the minimization of an energy criterionE. This energy is expressed by the sum of the data attachment term Ed and aregularization term Er:
E = Ed + Er. (7.1)
The data attachment energy function Ed follows a variation of the localizedYezzi energy adapted for endocardial segmentation [165] detailed in Section 2.6.The neighborhood region limit ρ was set at 16 mm as in Barbosa et al. [115].
7.2.2 Statistical Shape Model
To give information on the shape variations of the myocardium, 289 cardiacmagnetic resonance imaging (cMRI) datasets from the DOPPLER-CIP study were
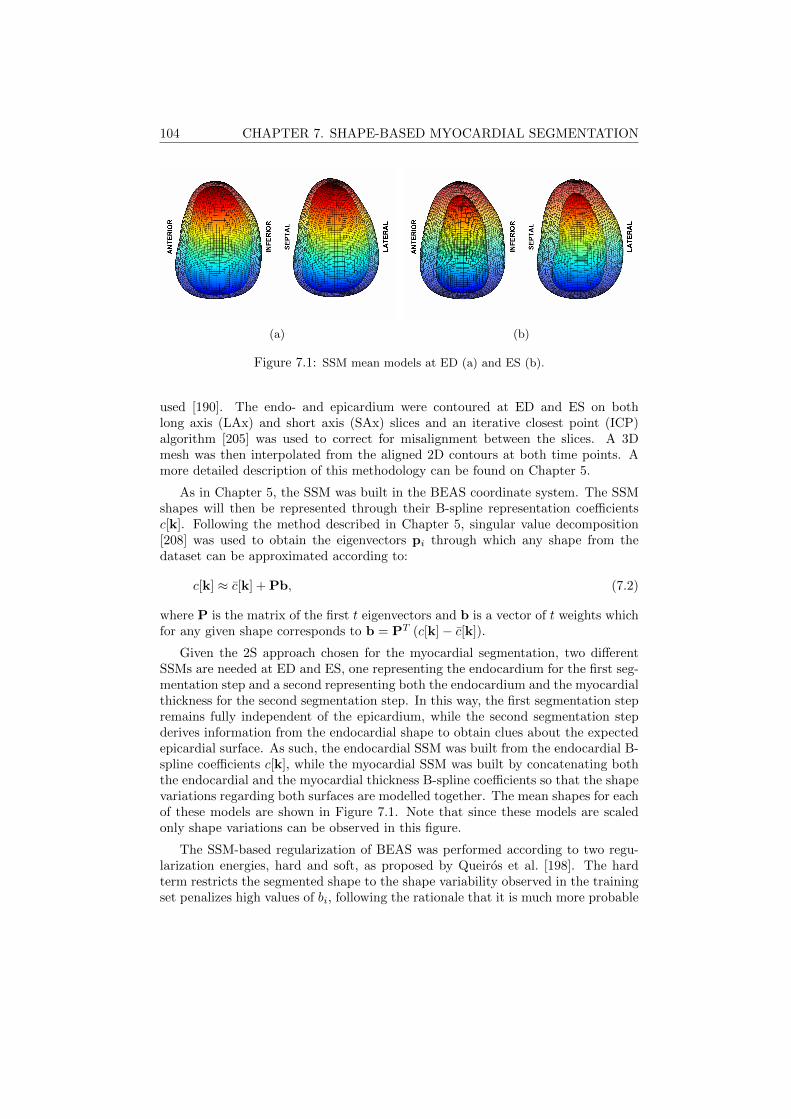
104 CHAPTER 7. SHAPE-BASED MYOCARDIAL SEGMENTATION
(a) (b)
Figure 7.1: SSM mean models at ED (a) and ES (b).
used [190]. The endo- and epicardium were contoured at ED and ES on bothlong axis (LAx) and short axis (SAx) slices and an iterative closest point (ICP)algorithm [205] was used to correct for misalignment between the slices. A 3Dmesh was then interpolated from the aligned 2D contours at both time points. Amore detailed description of this methodology can be found on Chapter 5.
As in Chapter 5, the SSM was built in the BEAS coordinate system. The SSMshapes will then be represented through their B-spline representation coefficientsc[k]. Following the method described in Chapter 5, singular value decomposition[208] was used to obtain the eigenvectors pi through which any shape from thedataset can be approximated according to:
c[k] ≈ c[k] + Pb, (7.2)
where P is the matrix of the first t eigenvectors and b is a vector of t weights whichfor any given shape corresponds to b = PT (c[k]− c[k]).
Given the 2S approach chosen for the myocardial segmentation, two differentSSMs are needed at ED and ES, one representing the endocardium for the first seg-mentation step and a second representing both the endocardium and the myocardialthickness for the second segmentation step. In this way, the first segmentation stepremains fully independent of the epicardium, while the second segmentation stepderives information from the endocardial shape to obtain clues about the expectedepicardial surface. As such, the endocardial SSM was built from the endocardial B-spline coefficients c[k], while the myocardial SSM was built by concatenating boththe endocardial and the myocardial thickness B-spline coefficients so that the shapevariations regarding both surfaces are modelled together. The mean shapes for eachof these models are shown in Figure 7.1. Note that since these models are scaledonly shape variations can be observed in this figure.
The SSM-based regularization of BEAS was performed according to two regu-larization energies, hard and soft, as proposed by Queiros et al. [198]. The hardterm restricts the segmented shape to the shape variability observed in the trainingset penalizes high values of bi, following the rationale that it is much more probable

7.2. METHODOLOGY 105
to find an average shape than a shape which is close to the variability limits. Theregularization term Er is thus defined as
Er = αEhard + βEsoft, (7.3)
where α and β are hyperparameters controlling the relative weight between the twoterms.
7.2.3 Framework Description
A conceptual description of the proposed framework is shown in Figure 7.2 andis an adaptation of the framework for endocardial LV segmentation detailed inChapter 5.
7.2.3.1 Automatic Initialization
The automatic initialization algorithm used was introduced in Barbosa et al.[165] and is detailed in Chapter 2. This initialization will provide the initial esti-mation of the LAx and center for BEAS and the SSM.
7.2.3.2 Automatic SAx Orientation
The SAx orientation method is detailed in Chapter 4 and is crucial to correctlyposition the SSM, given that different sides of the LV have different shape char-acteristics. However, this orientation algorithm depends on a previous estimate ofthe LV surface and the result from the initialization is too rough as it relies on thefitting of an ellipsoid. As such, the automatic SAx orientation is only applied afterthe initial stage of endocardial segmentation.
7.2.3.3 Segmentation at ED
The segmentation at ED is composed of three stages. Initially, an endocardialsegmentation is performed without the SSM, so that the energy criterion E is equalto Ed, the data attachment term. This provides an initial segmentation of theLV, which is used for the SAx orientation estimation but also to refine the initialestimates of LAx orientation and center according to the centroid and direction oflargest variance of the segmented mesh. With the center position and both theLAx and SAx orientation well defined, it is then possible to use BEAS with theendocardial SSM regularization according to equation 5.10 to further refine thesegmentation. In a third stage, the epicardial surface is initialized and segmentedusing the myocardial SSM. As in the original 2S approach, the endocardial surfaceis not refined further at this point, being only a reference for the explicit functionof myocardial thickness and the myocardial SSM.

106 CHAPTER 7. SHAPE-BASED MYOCARDIAL SEGMENTATION
Figure 7.2: Conceptual description of the proposed segmentation and trackingframework. First, automatic initialization is applied to the ED frame (A). Thefirst stage of segmentation is then performed using BEAS (B). The result from thissegmentation is used to detect the SAx orientation (C) and this information is usedto perform the second stage of segmentation using BEAS and the ED SSM (D). Theepicardial surface is then initialized and the ED myocardial SSM is used to performthe myocardial segmentation (E). The final ED segmentation is then propagatedframe to frame using the lAAOF (F) and a final refinement of the ES segmentationis performed using first the ES endocardial SSM (G) and then the ES myocardialSSM (H).
7.2.3.4 Localized Anatomical Affine Optical Flow
lAAOF is then used to propagate the result from ED to the remaining frames.The lAAOF method was proposed in Queiros et al. [199] and relies on an affineoptical flow approach which independently estimates the motion at each point in thesurface based on an anatomically constrained neighborhood. A detailed descriptionof this method can be found in the original paper by Queiros et al. [199]. Theparameters used to tune the lAAOF were replicated from [199].

7.3. EXPERIMENTS 107
7.2.3.5 Segmentation at ES
Segmentation at ES is used to further refine the result from the lAAOF, thusbringing together intensity and shape-based clues. In order to balance the contribu-tion between tracking and segmentation clues, an energy term was added to penalizethe deviation between the result of the lAAOF and the segmentation. Such an ap-proach is similar to that detailed in Chapter 3. The regularization energy criterionis then expressed as:
Er = αEhard + βEsoft + γEA, (7.4)
where EA is defined according to 3.11 and γ is a hyperparameter used to definethe balance between tracking and intensity/shape-based information. As at ED,the 2S approach is used, so that the endocardium is refined first, followed by theepicardium using both the refined endocardial surface and the epicardial trackingresult.
7.3 Experiments
Given the lack of a robust and validated database for epicardial segmentation inRT3DE, manual contouring of the epicardium was performed by an expert on theCETUS challenge database. The CETUS challenge database is a publicly availablemulti-center multi-vendor dataset with manual endocardial contouring performedby 3 experts at ED and ES until consensus was achieved between the three. Itcomprises 45 RT3DE datasets, divided into 15 training and 30 testing datasets.
To ensure uniformity between the endo- and epicardial contours, the same proto-col that was used for the endocardial contours was followed for the epicardium [212].In brief, the expert contoured the epicardium in pre-defined slices where the endo-cardial contours were also visible. The epicardial countours were defined as toobserve the following requirements: a) located outside the endocardial contours;b) excluding the pericardium; c) keeping tissue consistency between ED and ES;d) contour up to the basal plane defined by the endocardial reference. This wasperformed at ED and ES and the contours at each time point were used to definea 3D reference mesh using a spherical harmonics interpolation [103]. The basalplane defined on the endocardial reference was used to define the basal plane of theepicardial reference.
The automatic segmentation was evaluated against the epicardial manual con-touring with MAD, HD and Dice. Myocardial volumes at ED and ES were alsocompared. The results of the proposed framework were also compared to the sameframework without the use of the SSM regularization to study the impact of this reg-ularization on the segmentation accuracy. Results are presented in mean±standarddeviation.
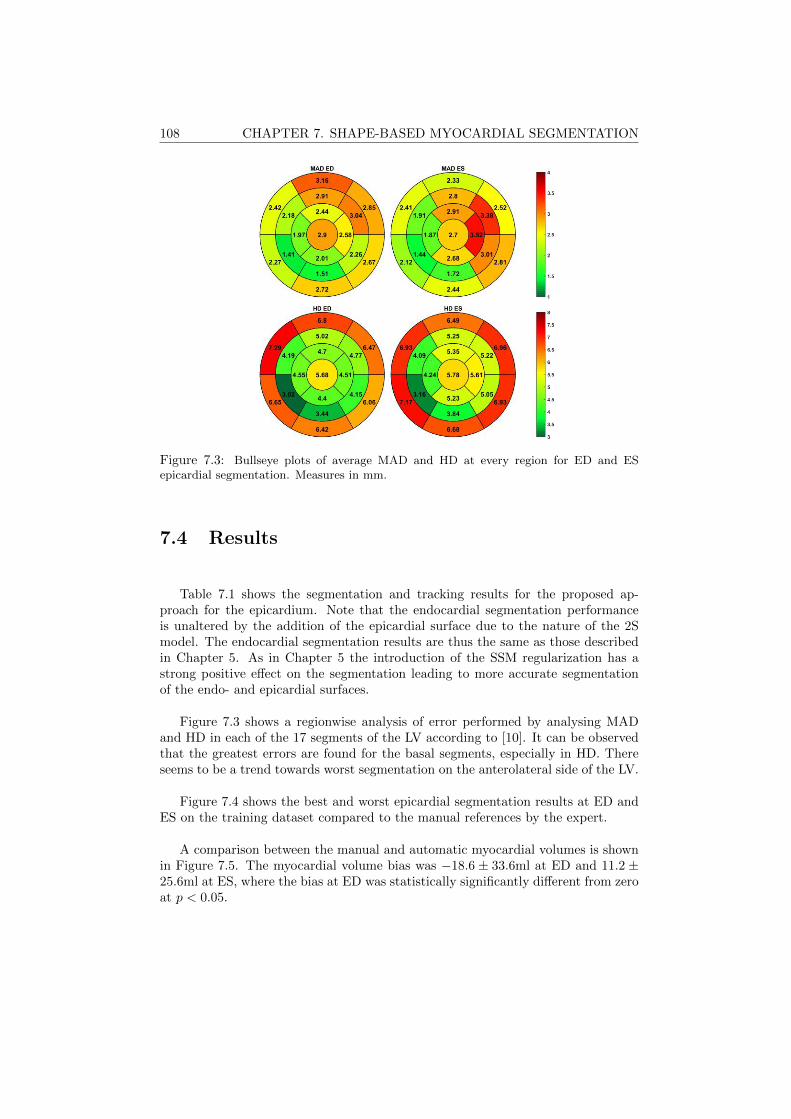
108 CHAPTER 7. SHAPE-BASED MYOCARDIAL SEGMENTATION
Figure 7.3: Bullseye plots of average MAD and HD at every region for ED and ESepicardial segmentation. Measures in mm.
7.4 Results
Table 7.1 shows the segmentation and tracking results for the proposed ap-proach for the epicardium. Note that the endocardial segmentation performanceis unaltered by the addition of the epicardial surface due to the nature of the 2Smodel. The endocardial segmentation results are thus the same as those describedin Chapter 5. As in Chapter 5 the introduction of the SSM regularization has astrong positive effect on the segmentation leading to more accurate segmentationof the endo- and epicardial surfaces.
Figure 7.3 shows a regionwise analysis of error performed by analysing MADand HD in each of the 17 segments of the LV according to [10]. It can be observedthat the greatest errors are found for the basal segments, especially in HD. Thereseems to be a trend towards worst segmentation on the anterolateral side of the LV.
Figure 7.4 shows the best and worst epicardial segmentation results at ED andES on the training dataset compared to the manual references by the expert.
A comparison between the manual and automatic myocardial volumes is shownin Figure 7.5. The myocardial volume bias was −18.6 ± 33.6ml at ED and 11.2 ±25.6ml at ES, where the bias at ED was statistically significantly different from zeroat p < 0.05.
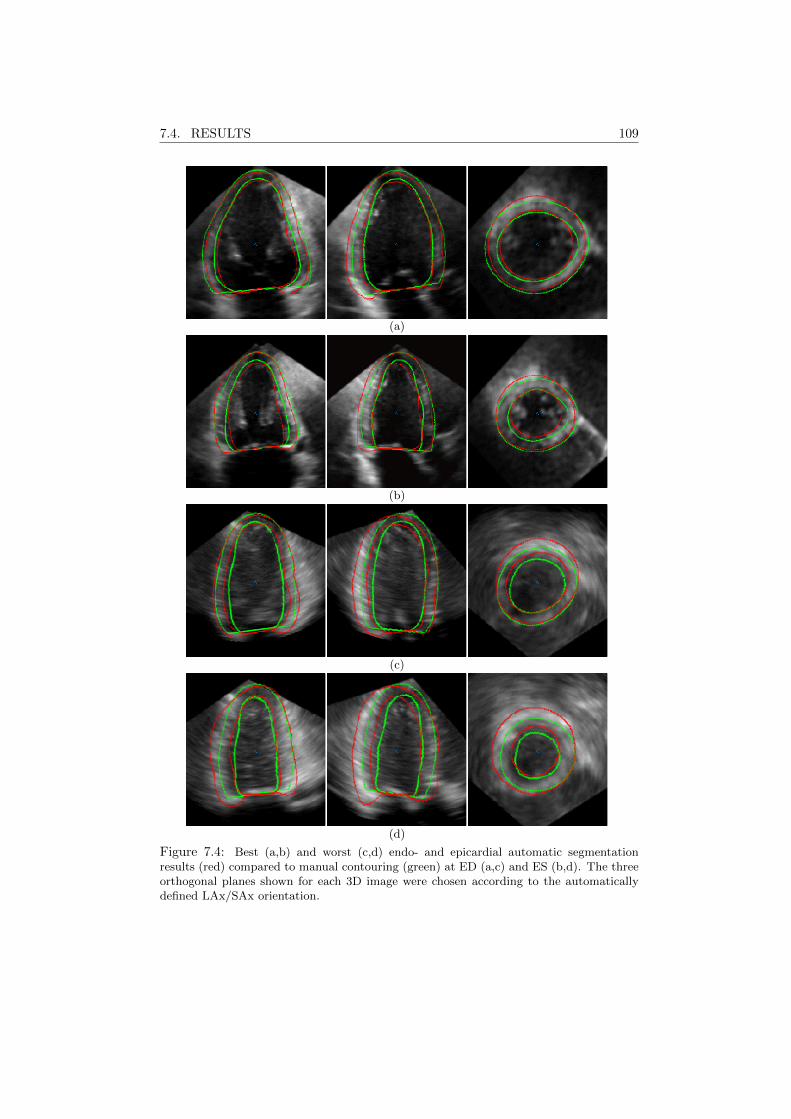
7.4. RESULTS 109
(a)
(b)
(c)
(d)
Figure 7.4: Best (a,b) and worst (c,d) endo- and epicardial automatic segmentationresults (red) compared to manual contouring (green) at ED (a,c) and ES (b,d). The threeorthogonal planes shown for each 3D image were chosen according to the automaticallydefined LAx/SAx orientation.
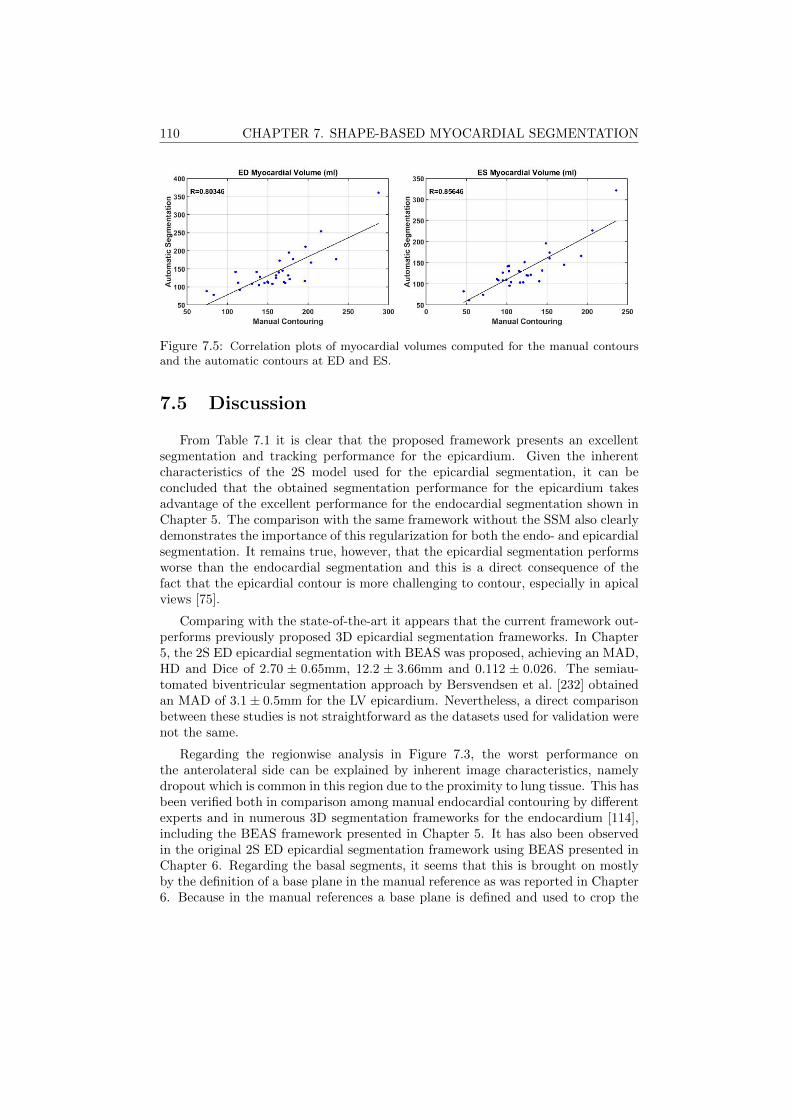
110 CHAPTER 7. SHAPE-BASED MYOCARDIAL SEGMENTATION
Figure 7.5: Correlation plots of myocardial volumes computed for the manual contoursand the automatic contours at ED and ES.
7.5 Discussion
From Table 7.1 it is clear that the proposed framework presents an excellentsegmentation and tracking performance for the epicardium. Given the inherentcharacteristics of the 2S model used for the epicardial segmentation, it can beconcluded that the obtained segmentation performance for the epicardium takesadvantage of the excellent performance for the endocardial segmentation shown inChapter 5. The comparison with the same framework without the SSM also clearlydemonstrates the importance of this regularization for both the endo- and epicardialsegmentation. It remains true, however, that the epicardial segmentation performsworse than the endocardial segmentation and this is a direct consequence of thefact that the epicardial contour is more challenging to contour, especially in apicalviews [75].
Comparing with the state-of-the-art it appears that the current framework out-performs previously proposed 3D epicardial segmentation frameworks. In Chapter5, the 2S ED epicardial segmentation with BEAS was proposed, achieving an MAD,HD and Dice of 2.70 ± 0.65mm, 12.2 ± 3.66mm and 0.112 ± 0.026. The semiau-tomated biventricular segmentation approach by Bersvendsen et al. [232] obtainedan MAD of 3.1± 0.5mm for the LV epicardium. Nevertheless, a direct comparisonbetween these studies is not straightforward as the datasets used for validation werenot the same.
Regarding the regionwise analysis in Figure 7.3, the worst performance onthe anterolateral side can be explained by inherent image characteristics, namelydropout which is common in this region due to the proximity to lung tissue. This hasbeen verified both in comparison among manual endocardial contouring by differentexperts and in numerous 3D segmentation frameworks for the endocardium [114],including the BEAS framework presented in Chapter 5. It has also been observedin the original 2S ED epicardial segmentation framework using BEAS presented inChapter 6. Regarding the basal segments, it seems that this is brought on mostlyby the definition of a base plane in the manual reference as was reported in Chapter6. Because in the manual references a base plane is defined and used to crop the
7.6. CONCLUSION 111
epicardium mesh, the same must be done for the automatic segmentation but evensmall errors in the position and angle of that plane can result in large HDs. Thiseffect can be seen on Figure 7.4, especially for the worst case.
Regarding the myocardial volume, although a significant bias was obtained at ESthe correlation values obtained are high, especially taking into account the numberof factors that contribute to this final value of myocardial volume.
7.6 Conclusion
In this work, a fully automatic full-cycle LV myocardial segmentation and track-ing framework is proposed. This framework is an extension of a previous work onLV endocardial segmentation and takes advantage of its excellent endocardial seg-mentation performance to obtain a promising epicardial segmentation performancethrough the 2S model coupling the endo- and epicardial surfaces and the use of amyocardial SSM to provide additional shape information. Furthermore, the currentwork is validated on a publicly available and robust database on which the epicardialcontours were drawn by an expert in this study. The publication of these epicardialreferences on the same platform as the database will allow future studies directcomparisons to other state-of-the-art methods, accelerating meaningful research inthe field.

112 CHAPTER 7. SHAPE-BASED MYOCARDIAL SEGMENTATION
Tab
le7.1:
Perfo
rman
ceon
the
CE
TU
Stestin
gd
ata
setsfo
ren
do-
an
dep
icard
ial
surfa
ces.M
AD
,H
Dan
dD
iceof
the
prop
osedsh
ap
e-based
myocard
ial
segm
enta
tionfra
mew
ork
com
pared
toth
esa
me
fram
ework
with
ou
tu
sing
the
SS
M.
All
values
inm
ean±
stand
ard
dev
iation
.?,†
an
d‡
ind
icateresp
ectivelyth
at
the
diff
erence
toth
ep
rop
osed
framew
orkw
asstatistically
signifi
cant
at
ap<
0.05,p<
0.01an
dp<
0.001
level.
Meth
od
Surfa
ceM
AD
(mm
)H
D(m
m)
Dic
eE
DE
SE
DE
SE
DE
S
Pro
posed
Endoca
rdiu
m1.8
1±
0.5
91.9
8±
0.6
66.3
1±
1.6
96.9
5±
2.1
40.9
09±
0.0
34
0.8
75±
0.0
46
Epica
rdiu
m2.4
3±
0.6
92.5
1±
0.6
39.2
5±
2.6
99.8
6±
3.0
50.9
11±
0.0
31
0.8
96±
0.0
34
No
SSM
Endoca
rdiu
m2.2
6±
0.7
2‡
2.4
5±
0.8
5‡
8.1
0±
2.6
2‡
8.1
9±
3.0
3?
0.8
94±
0.0
40‡
0.8
61±
0.0
54?
Epica
rdiu
m3.0
5±
0.6
9‡
3.3
5±
0.8
4‡
11.0
9±
2.6
9†
11.7
7±
2.6
8†
0.8
85±
0.0
27‡
0.8
56±
0.0
42‡

Part II
Applications
113


Chapter 8
Integration of SegmentationMethodologies in aDistributable User-FriendlySoftware Tool
115
116 CHAPTER 8. INTEGRATION IN SPEQLE3D
Abstract
In this chapter, the integration of the tools developed and validated in thefirst part of this thesis is discussed. While previous chapters presented the toolsdeveloped and their validation, the availability of these tools in a distributableuser-friendly software is of great importance to allow their application in the future.Speqle3D, an in-house developed software package, was thus chosen for this purpose.The tools presented in this thesis were implemented in a user-friendly way in thissoftware environment.
8.1 Introduction
While the development and validation of novel segmentation and tracking toolsis of value per se, it is equally important to make them available so that they canbe applied in other studies. In the case of myocardial segmentation, these stud-ies could be direct applicational studies, for example to obtain further insight on4D myocardial geometry in a specific population, or studies where the myocardialsegmentation acts as an initial step in a post processing chain such as strain or ma-chine learning applications, where segmentation could be used to define the regionof interest (ROI). Furthermore, the direct use of this technology in a clinical settingcould be of much use by providing additional clinical information through an auto-mated workflow. No matter the application, it thus becomes of great importanceto make the tools developed available in a distributable software package that canbe easily used by clinicians and/or researchers from different backgrounds.
8.2 Speqle3D
Speqle3D is an in-house developed software package to visualize and process 2Dechocardiography (2DE) and real-time 3D echocardiography (RT3DE) datasets.Among other characteristics, Speqle3D allows for the slicing and orientation of 3Dimages in arbitrary planes and manual contouring of structures. Speqle3D relieson a graphical interface compiled in MATLAB, thus making it extremely simplefrom both the user point of view as it appears like a usual graphical interface butalso from the programming point of view as changes can be easily incorporated ina MATLAB environment. Speqle3D is freely available for research purposes witha computer-based license so that it is possible to distribute it to researchers thatwant to use it. Figure 8.1 shows the basic interface of Speqle3D and an example ofan RT3DE image as seen in the interface.
Three different tools were implemented in Speqle3D: the left ventricular (LV)myocardial segmentation described in Chapter 7, an adapted version of the LVmyocardial segmentation for 2DE and the 3D mitral valve (MV) segmentation de-scribed in Appendix A. These tools complement those already implemented in
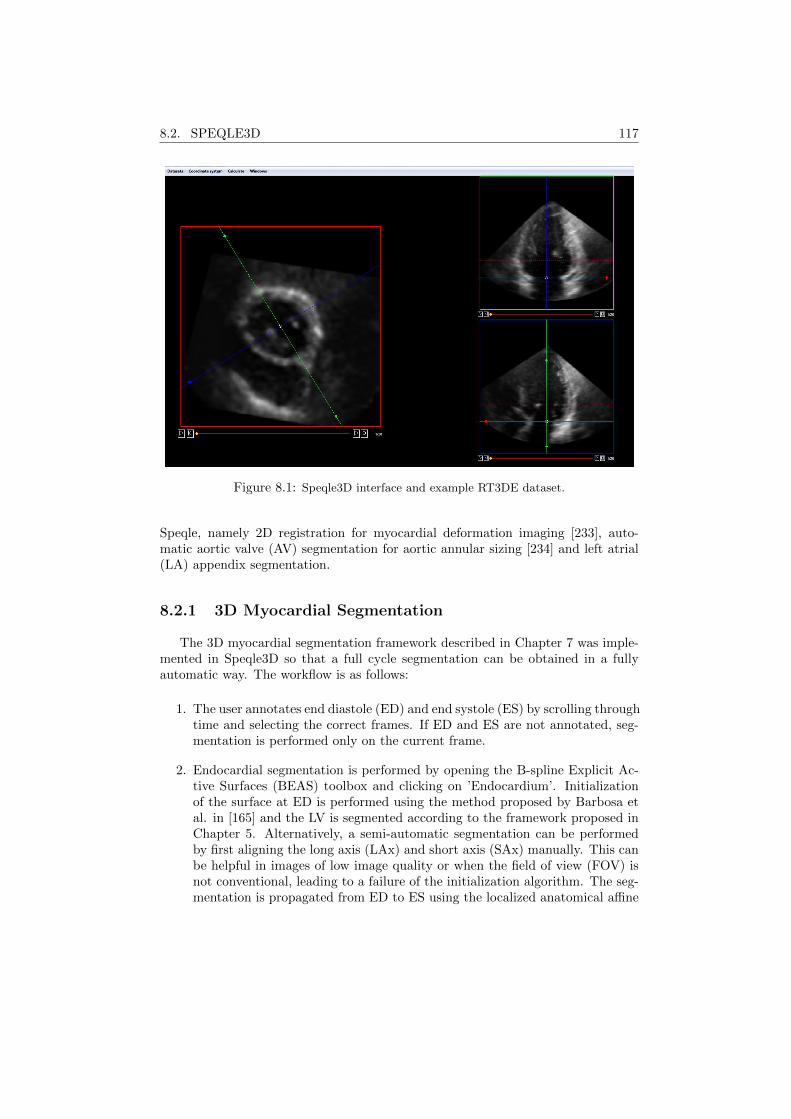
8.2. SPEQLE3D 117
Figure 8.1: Speqle3D interface and example RT3DE dataset.
Speqle, namely 2D registration for myocardial deformation imaging [233], auto-matic aortic valve (AV) segmentation for aortic annular sizing [234] and left atrial(LA) appendix segmentation.
8.2.1 3D Myocardial Segmentation
The 3D myocardial segmentation framework described in Chapter 7 was imple-mented in Speqle3D so that a full cycle segmentation can be obtained in a fullyautomatic way. The workflow is as follows:
1. The user annotates end diastole (ED) and end systole (ES) by scrolling throughtime and selecting the correct frames. If ED and ES are not annotated, seg-mentation is performed only on the current frame.
2. Endocardial segmentation is performed by opening the B-spline Explicit Ac-tive Surfaces (BEAS) toolbox and clicking on ’Endocardium’. Initializationof the surface at ED is performed using the method proposed by Barbosa etal. in [165] and the LV is segmented according to the framework proposed inChapter 5. Alternatively, a semi-automatic segmentation can be performedby first aligning the long axis (LAx) and short axis (SAx) manually. This canbe helpful in images of low image quality or when the field of view (FOV) isnot conventional, leading to a failure of the initialization algorithm. The seg-mentation is propagated from ED to ES using the localized anatomical affine
118 CHAPTER 8. INTEGRATION IN SPEQLE3D
optical flow (lAAOF) proposed in [199] and the segmentation result is refinedat ES using shape-based regularization.
3. Manual correction of the endocardial surface is then possible at any frame.This is possible in a separate window where the user is presented with a set ofpredefined LAx slices and their orientation in the 17 segment model [10]. Thecorrection is performed by placing points in each of the slices. The point isthen used to obtain a new contour on that slice through spline interpolation.To control the influence of each of the points placed, a sphere of influence ispresented to the user for each point which determines the section of the originalcontour which is discarded before spline interpolation. In that manner, theuser can control how local the influence of the point is. The manual correctioninterface is shown in Figure 8.2, showing the image slice being corrected andthe 17-segment model for 3D orientation. When the user is satisfied with thecorrected contours, the 3D mesh is interpolated leading to a new segmentationresult for that frame. The corrected mesh is then propagated automaticallythroughout the heart cycle.
4. By clicking ’Epicardium’ on the BEAS toolbox, myocardial segmentation isperformed. The endocardial segmentation at ED is used to initialize theepicardial surface which is segmented according to the method described inChapter 7. This segmentation is propagated from ED to ES using the lAAOFproposed in [199] and the segmentation result is refined at ES using shape-based regularization.
5. Epicardial manual correction is possible through the placing of user pointswithin the same manual correction environment and methodology describedfor the endocardium and the corrected mesh is propagated automaticallythroughout the heart cycle.
An example of a segmented LV myocardium in Speqle3D is shown in Figure 8.3 andthe complete workflow can be appreciated in the link given in the footnote.
8.2.2 2D Myocardial Segmentation
Although this thesis focused on RT3DE as potentially the standard echocar-diographic examination of the future, 2DE is currently still the most used imagingtechnique both in clinical practice and research. As such, it was important to adaptthe framework developed in this thesis to analyse 2DE LV images. This can eas-ily be done in the BEAS framework by adapting the explicit function to a polarrather than a spherical domain and tuning the parameters. Given the much largervariability of views in 2DE than 3D, an adaptation of the automatic LAx initial-ization would not be able to have a satisfactory feasibility and, as such, manualinitialization was implemented. The workflow is as follows:
https://kuleuven.box.com/s/bii3yf4o5v4rz3295ua6ctyijjokzy1k
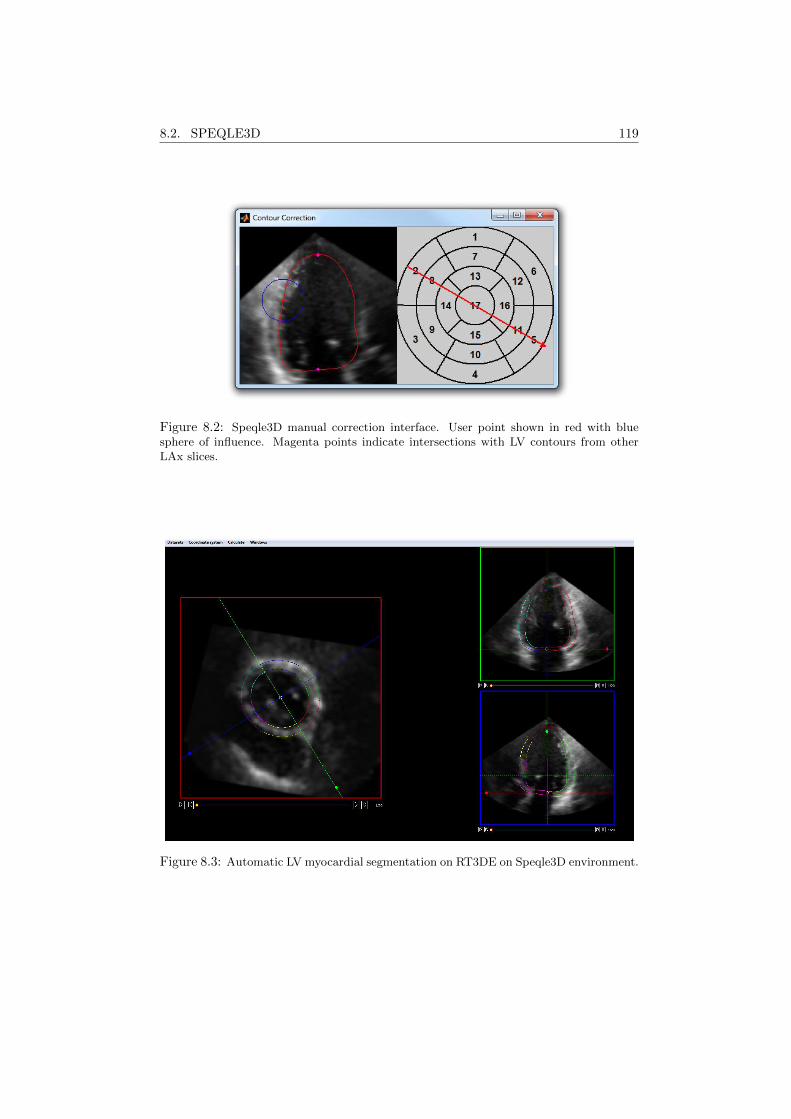
8.2. SPEQLE3D 119
Figure 8.2: Speqle3D manual correction interface. User point shown in red with bluesphere of influence. Magenta points indicate intersections with LV contours from otherLAx slices.
Figure 8.3: Automatic LV myocardial segmentation on RT3DE on Speqle3D environment.

120 CHAPTER 8. INTEGRATION IN SPEQLE3D
1. The user annotates ED and ES by scrolling through time and selecting thecorrect frames. If ED and ES are not annotated, segmentation is performedonly on the current frame.
2. The user places three points on the ED frame, at the mitral annulus (MA)and apex.
3. Endocardial segmentation is performed by opening the BEAS toolbox andclicking on ’Endocardium’. The three user points are used to initialize the en-docardial surface through spline interpolation. LAx orientation is determinedas the direction from the mid-basal point to the apex. Endocardial segmen-tation is performed in two stages as proposed in Chapter 5 for RT3DE. Afirst segmentation stage is performed using the modified Yezzi energy pro-posed in [165] and a second stage using the same data attachment term witha shape model regularization. This segmentation is propagated from ED toES using the lAAOF proposed in [199] and the segmentation result is refinedat ES using shape-based regularization.
4. Endocardial manual correction is possible through the placing of user pointswithin the same manual correction environment and methodology describedfor 3D myocardial segmentation. The corrected mesh is then propagatedautomatically throughout the heart cycle.
5. By clicking ’Epicardium’ on the BEAS toolbox, myocardial segmentation isperformed. The endocardial segmentation at ED is used to initialize the epi-cardial surface which is segmented using a myocardial shape model accordingto the method described in Chapter 7. This segmentation is propagated fromED to ES using the lAAOF proposed in [199] and the segmentation result isrefined at ES using shape-based regularization.
6. Epicardial manual correction is possible through the placing of user pointswithin the same manual correction environment and methodology describedfor 3D myocardial segmentation and the corrected mesh is propagated auto-matically throughout the heart cycle.
The angular discretization of the boundary representation was set empiricallyat 48 points and the B-spline scale h at 21 for both endo- and epicardial surfaces.The neighborhood region limit ρ was set at 15mm. The endo- and myocardialshape models were built from a set of 2DE images from 500 patients collected in aclinical setting. This dataset emcompasses both 2- and 4-chamber images manuallycontoured at ED and ES. Following the methodology described in Chapter 5 and7, the contours were scaled and aligned and principal component analysis is usedto obtain a statistical shape model (SSM) representing the shape variability ofthe LV. As such, four different SSMs were obtained, at ED and ES for 2- and 4-chamber images. The 2- or 4-chamber set of SSMs is then selected based on theimage metadata (if absent no SSM regularization is applied). The hard and softregularization terms α and β were set empirically at 1 and 0.0002 for the endocardial
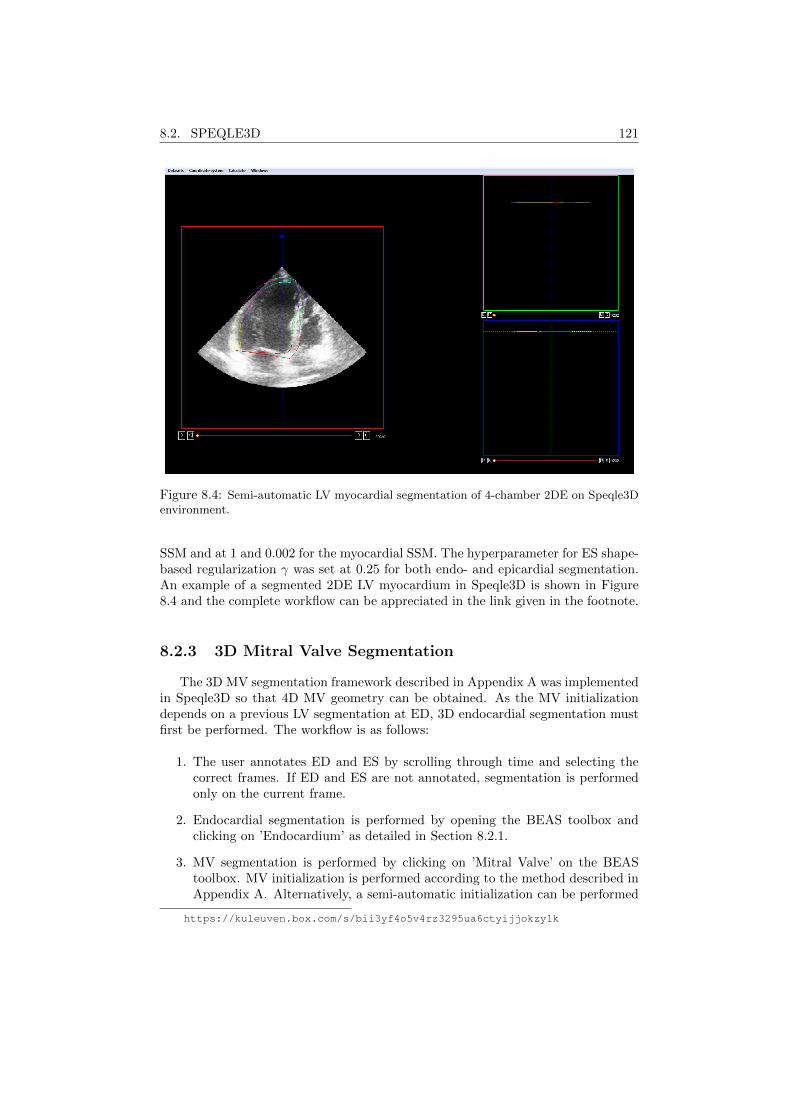
8.2. SPEQLE3D 121
Figure 8.4: Semi-automatic LV myocardial segmentation of 4-chamber 2DE on Speqle3Denvironment.
SSM and at 1 and 0.002 for the myocardial SSM. The hyperparameter for ES shape-based regularization γ was set at 0.25 for both endo- and epicardial segmentation.An example of a segmented 2DE LV myocardium in Speqle3D is shown in Figure8.4 and the complete workflow can be appreciated in the link given in the footnote.
8.2.3 3D Mitral Valve Segmentation
The 3D MV segmentation framework described in Appendix A was implementedin Speqle3D so that 4D MV geometry can be obtained. As the MV initializationdepends on a previous LV segmentation at ED, 3D endocardial segmentation mustfirst be performed. The workflow is as follows:
1. The user annotates ED and ES by scrolling through time and selecting thecorrect frames. If ED and ES are not annotated, segmentation is performedonly on the current frame.
2. Endocardial segmentation is performed by opening the BEAS toolbox andclicking on ’Endocardium’ as detailed in Section 8.2.1.
3. MV segmentation is performed by clicking on ’Mitral Valve’ on the BEAStoolbox. MV initialization is performed according to the method described inAppendix A. Alternatively, a semi-automatic initialization can be performed
https://kuleuven.box.com/s/bii3yf4o5v4rz3295ua6ctyijjokzy1k
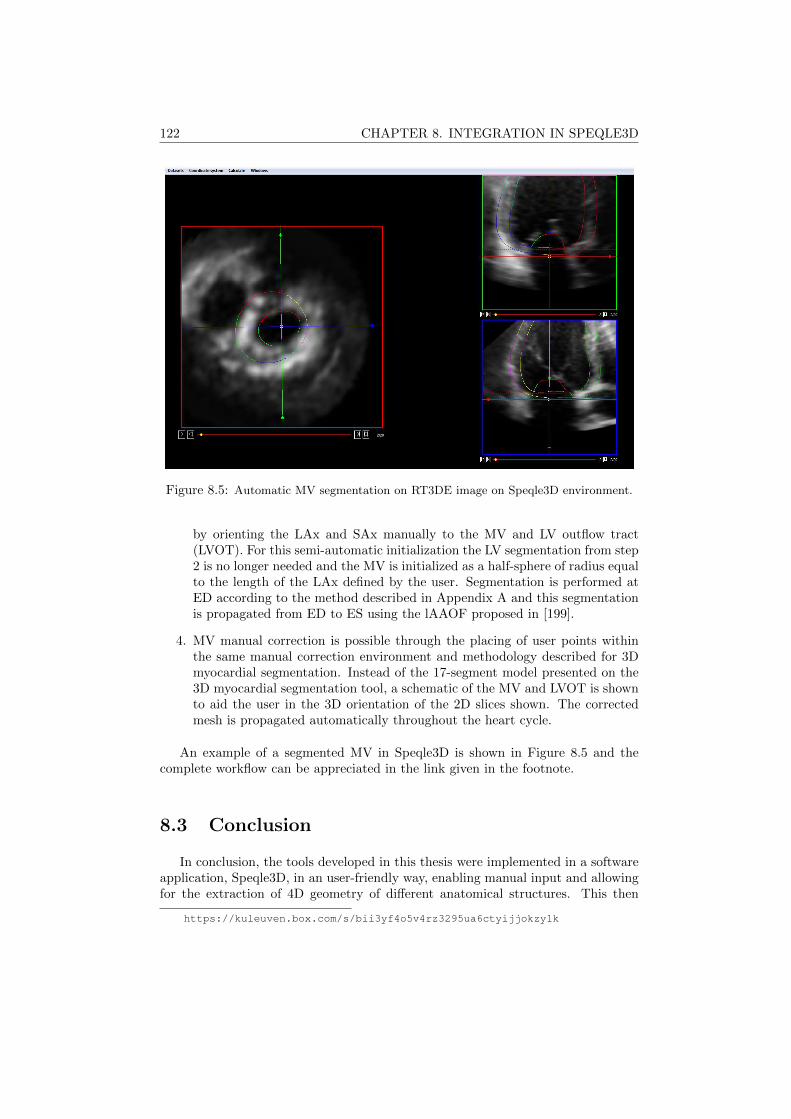
122 CHAPTER 8. INTEGRATION IN SPEQLE3D
Figure 8.5: Automatic MV segmentation on RT3DE image on Speqle3D environment.
by orienting the LAx and SAx manually to the MV and LV outflow tract(LVOT). For this semi-automatic initialization the LV segmentation from step2 is no longer needed and the MV is initialized as a half-sphere of radius equalto the length of the LAx defined by the user. Segmentation is performed atED according to the method described in Appendix A and this segmentationis propagated from ED to ES using the lAAOF proposed in [199].
4. MV manual correction is possible through the placing of user points withinthe same manual correction environment and methodology described for 3Dmyocardial segmentation. Instead of the 17-segment model presented on the3D myocardial segmentation tool, a schematic of the MV and LVOT is shownto aid the user in the 3D orientation of the 2D slices shown. The correctedmesh is propagated automatically throughout the heart cycle.
An example of a segmented MV in Speqle3D is shown in Figure 8.5 and thecomplete workflow can be appreciated in the link given in the footnote.
8.3 Conclusion
In conclusion, the tools developed in this thesis were implemented in a softwareapplication, Speqle3D, in an user-friendly way, enabling manual input and allowingfor the extraction of 4D geometry of different anatomical structures. This then
https://kuleuven.box.com/s/bii3yf4o5v4rz3295ua6ctyijjokzy1k

8.3. CONCLUSION 123
facilitates the application of the tools developed in this thesis in a clinical setting.Furthermore, it enables the use of the tools developed in future studies, such asusing the segmentation as an initial step in other postprocessing methods such asstrain applications or machine learning tools or more clinical oriented studies tryingto obtain more information regarding 4D geometry of the LV myocardium and theMV.

124 CHAPTER 8. INTEGRATION IN SPEQLE3D
Chapter 9
Non-invasive MyocardialPerformance Mapping Using3D EchocardiographicStress-Strain Loops
This chapter is based on a paper submitted for publication in a peer-reviewed journal: Pe-drosa J., Duchenne J., Queiros S., Degtiarova G., Gheysens O., Claus P., Voigt J., D’hoogeJ.. Non-invasive myocardial performance mapping using 3D echocardiographic stress-strain loops:validation against PET.
125
126 CHAPTER 9. MYOCARDIAL PERFORMANCE MAPPING
Abstract
Regional contribution to left ventricular (LV) ejection is of much clinical impor-tance but its assessment is notably challenging. While deformation imaging is oftenused, this does not take into account loading conditions. Recently, a method forintraventricular pressure estimation was proposed, thus allowing for loading condi-tions to be taken into account in a non-invasive way. In this work, a method for3D automatic myocardial performance mapping in echocardiography is proposed byperforming 3D myocardial segmentation and tracking, thus giving access to localgeometry and strain. This is then used to assess local LV stress-strain relationshipswhich can be seen as a measure of local myocardial work. The proposed methodwas validated against 18F-fluorodeoxyglucose positron emission tomography (FDG-PET), the reference method to assess local metabolism clinically. Averaged over allpatients, the mean correlation between FDG-PET and the proposed method was0.67 ± 0.18. In conclusion, the proposed method shows promising results for fullyautomatic non-invasive estimation of regional myocardial performance.
9.1 Introduction
The assessment of the regional contribution to LV ejection has long been anobject of interest in clinical cardiology and is clinically most often assessed throughvisual wall motion readings. However, such readings are subject to high intra-and inter-observer variability. More objective measurements of shortening indicesthrough regional deformation imaging have thus been introduced to tackle thisproblem [102, 235, 236]. However, local deformation is highly dependent on load-ing conditions and to truly estimate myocardial performance, the relation betweendeformation and loading conditions must be taken into account [237]. Neverthe-less, it is challenging to estimate loading conditions non-invasively and most studiesthus resort to invasive intraventricular pressure measurements. Suga [238] first pro-posed such an approach by successfully correlating LV pressure-volume loop areato global myocardial oxygen consumption in a canine model and this approach waslater validated in a clinical setting [239]. Following the same rationale, regional my-ocardial work was estimated by relating local myocardial deformation to pressurein several studies [240–244]. While these techniques have been proposed alreadydecades ago, they have seen limited clinical application due to their complexity andthe need for an invasive intraventricular pressure measurement. Recently, Russelet al. [245] have proposed a method for non-invasive estimation of intraventricularpressure, thus allowing for non-invasive estimation of myocardial work. Neverthe-less, pressure remains a global loading parameter as local loading, expressed asmyocardial stress, depends on LV geometry. Such an approach was followed ina recent study [246], where the authors used Laplace’s law to estimate local stressfrom non-invasive pressure measurements and local geometry, which, related to localstrain was equated to local myocardial work.
In spite of these recent advances, the methodology remains complex as obtaining
9.2. METHODOLOGY 127
the full myocardial performance map requires 3 different long axis (LAx) views tobe acquired and in each of the views the LV must be segmented and local strainscomputed. As such, the use of real-time 3D echocardiography (RT3DE) can playa role in decreasing the complexity of this method by decreasing the number ofacquisitions needed. Although manual analysis of 3D images is more challengingthan 2D, automatic methods can be used to obtain 3D local LV geometry andstrains, further decreasing the complexity of the method. Moreover, the acquisitionof RT3DE rather than 2D echocardiography (2DE) allows the analysis of the full 3Dmyocardial motion rather than being limited to in-plane motion as in [243,245,246]where only longitudinal strain-stress loop area was considered.
As such, in this study, a method for non-invasive myocardial performance map-ping on RT3DE is proposed. A validated fully automatic method for myocardialsegmentation and tracking presented in Chapter 7 was used to obtain 3D localLV geometry and strain. Intraventricular pressure was estimated according to themethod by Russel et al. [245], which is used together with local geometry to esti-mate local LV stress. The proposed LV stress-strain loop areas were then validatedagainst FDG-PET, the reference method to clinically assess local metabolism.
9.2 Methodology
9.2.1 3D Left Ventricular Myocardial Segmentation
3D LV myocardial segmentation was performed using B-spline Explicit ActiveSurfaces (BEAS) according to the framework proposed in Chapter 7. To extract lo-cal geometry and strain, the LV segmentation obtained was divided into 17 segmentsaccording to [10] and the extracted parameters averaged within each segment. Ateach frame, the local wall thickness h was computed, defined as the distance fromthe endo- to the epicardial surface along the endocardial surface normal. Longitudi-nal and circumferential curvatures, kl and kc, were also extracted taking advantageof the spherical domain on which the BEAS segmentation is defined:
kl = k −√k2 −K, (9.1)
kc = k +√k2 −K, (9.2)
where k and K are respectively the mean and gaussian curvatures obtained accord-ing to
k =eG+ gE
2EG, (9.3)
K =eg − f2
EG, (9.4)
where E and G are coefficients of the first fundamental form and e, f and g arecoefficients of the second fundamental form [228]. Segmental strain was computedthroughout the heart cycle for all three components - longitudinal (εl), circumfer-ential (εc) and radial (εr).
128 CHAPTER 9. MYOCARDIAL PERFORMANCE MAPPING
9.2.2 Left Ventricular Stress Estimation
In order to estimate LV stress, the equations proposed by Mirsky et al. [247]were used, thus:
σl =P.rl
h(2 + hrl
), (9.5)
σc =P
h( 1rc
+ 1rc
+ hrlrc
), (9.6)
where σl and σc are, respectively, the longitudinal and circumferential componentsof LV stress, P is the intraventricular pressure and ri = 1/ki is the radius ofcurvature along direction i. For a more extensive reasoning of the assumptionsbehind the equations chosen, the reader is referred to the original paper by Mirskyet al. [247].
Intraventricular pressure was estimated according to the method by Russel etal. [245], which essentially scales a typical LV pressure trace based on valve open-ing/closing and measured systolic arterial cuff pressure. The valve events weremanually annotated by visual inspection of the RT3DE images.
To estimate the radial LV stress σr, the generalized 3D Hooke’s law was used,assuming that the myocardium is an elastic, isotropic and incompressible medium:
εr =1
E(σr − µ(σl + σc)), (9.7)
where E and µ are, respectively, the Young’s modulus and Poisson coefficient of themedium. Given that the myocardium is assumed to be incompressible, µ = 0.5.
9.2.3 Myocardial Performance Mapping
To obtain a map of myocardial performance, a stress-strain loop was calculatedfor each of the components (i.e. radial, longitudinal and circumferential). The sumof the area of each of these loops, hereinafter referred to as L+C+R loop area, wasthen taken as an estimate of the total local myocardial work.
It can be shown that the radial stress-strain loop area is independent of theYoung’s modulus E chosen given that:
Aεr, σr =1
2
∫σrεr
′ − εrσr ′dt
=1
2
∫(Eεr + µ(σl + σc))εr
′ − εr(Eεr + µ(σl + σc))′dt
=µ
2
∫σlεr
′ − εrσl′dt+µ
2
∫σcεr
′ − εrσc′dt
= µAεr, σl+ µAεr, σc,
(9.8)
where Aεi, σj is the area of the loop formed by stress component i and straincomponent j. For simplicity sake, the prime symbol was used to represent thederivative in t.
9.3. EXPERIMENTS 129
9.3 Experiments
12 non-ischemic and 7 ischemic patients were selected from the WORK-CRTstudy, which followed heart failure patients undergoing cardiac resynchronizationtherapy (CRT) at the University Hospitals Leuven (ClinicalTrials.gov Identifier:NCT02537782). The patients were selected based on showing acceptable RT3DEspatiotemporal resolution and image quality and FDG-PET analysis one week priorto CRT.
3D LV myocardial segmentation was performed for each patient and the myocar-dial performance maps estimated based on the method described above. A com-parison to FDG-PET was performed by using the normalized tracer uptake (%).The LV segment with the highest tracer uptake was used as a reference (100%), andsegmental values reported as percentages of this value.
For comparison to the proposed myocardial performance maps, pressure-strainloop areas as proposed in [245] were also computed.
9.4 Results
An example of the myocardial performance map and FDG-PET tracer uptakemap obtained for one patient as well as the correlation between the two measure-ments is shown in Figure 9.1. Qualitatively, it can be observed that there is a goodcorrespondence between the L+C+R stress-strain loop area in Figure 9.1(a) andthe FDG-PET map in Figure 9.1(b). By plotting the segmental L+C+R stress-strain loop area values against the FDG-PET tracer uptake as in Figure 9.1(c), acorrelation value can be obtained showing the agreement between both measures.Among all patients, the Pearson correlation coefficient was 0.67± 0.14.
A comparison of the performance of each of the components individually tothe L+C+R stress-strain loop area is shown in Fig. 9.2. It can be seen thatthe contribution of all three spatial components outperforms any of the other in-dividually considered components. The difference between the correlations usingL+C+R stress-strain and pressure-strain loop areas was also statistically signifi-cant at p < 0.05.
9.5 Discussion
It is clear that the proposed methodology can successfully estimate LV myocar-dial work in a non-invasive way. Both local deformation and loading conditions aretaken into account, thus using additional information in comparison to myocardialdeformation imaging, which is essential for the estimation of myocardial perfor-mance. The proposed method is also of low complexity, as only one image needsto be acquired. Moreover, the LV myocardial segmentation is fully automatic andonly the valve events need to be annotated manually.
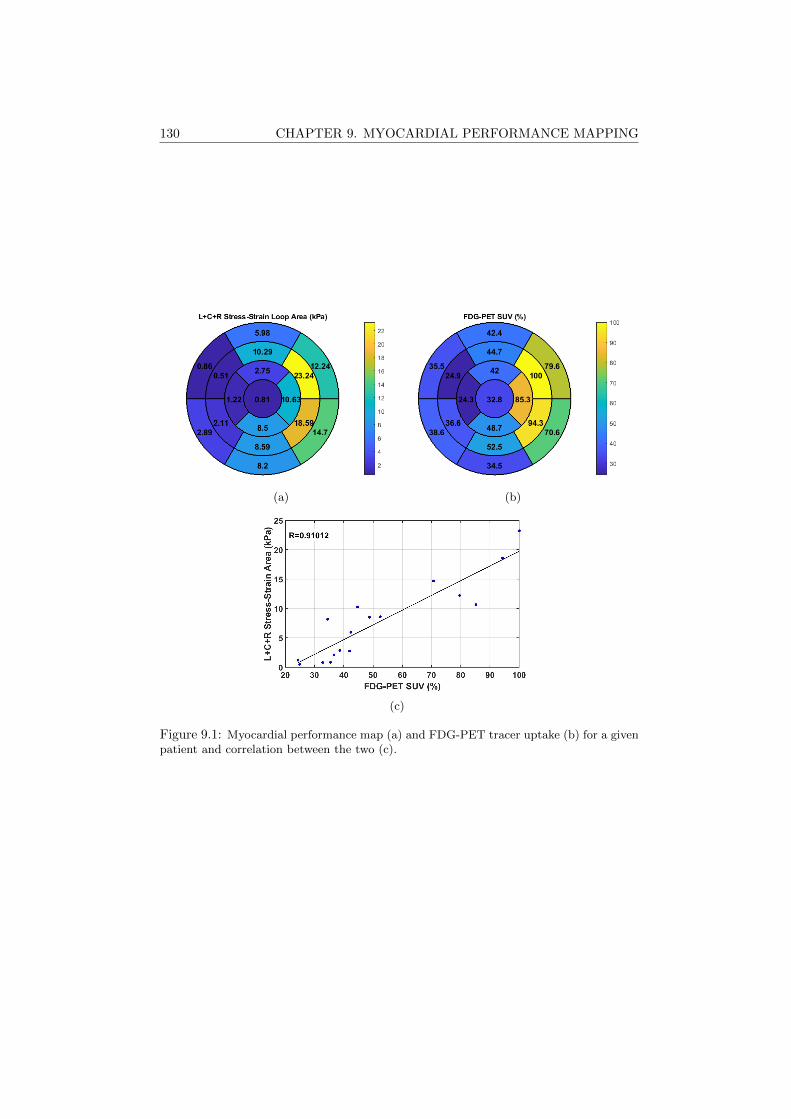
130 CHAPTER 9. MYOCARDIAL PERFORMANCE MAPPING
(a) (b)
(c)
Figure 9.1: Myocardial performance map (a) and FDG-PET tracer uptake (b) for a givenpatient and correlation between the two (c).
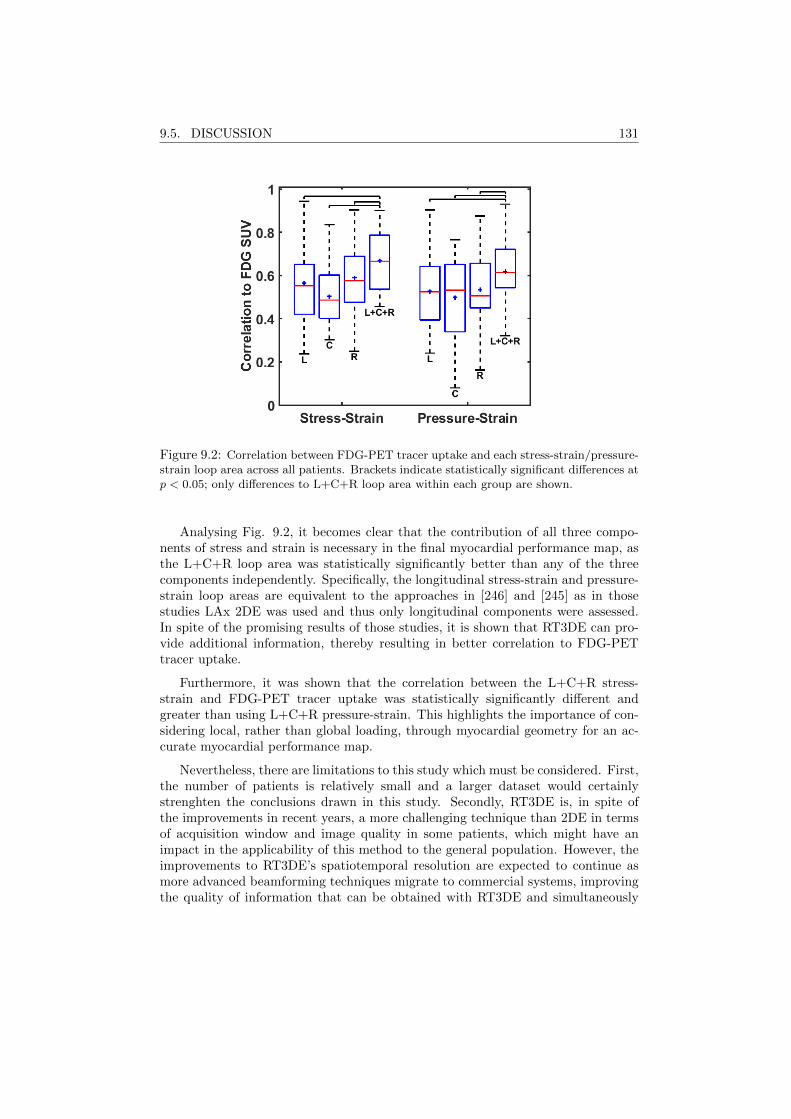
9.5. DISCUSSION 131
Figure 9.2: Correlation between FDG-PET tracer uptake and each stress-strain/pressure-strain loop area across all patients. Brackets indicate statistically significant differences atp < 0.05; only differences to L+C+R loop area within each group are shown.
Analysing Fig. 9.2, it becomes clear that the contribution of all three compo-nents of stress and strain is necessary in the final myocardial performance map, asthe L+C+R loop area was statistically significantly better than any of the threecomponents independently. Specifically, the longitudinal stress-strain and pressure-strain loop areas are equivalent to the approaches in [246] and [245] as in thosestudies LAx 2DE was used and thus only longitudinal components were assessed.In spite of the promising results of those studies, it is shown that RT3DE can pro-vide additional information, thereby resulting in better correlation to FDG-PETtracer uptake.
Furthermore, it was shown that the correlation between the L+C+R stress-strain and FDG-PET tracer uptake was statistically significantly different andgreater than using L+C+R pressure-strain. This highlights the importance of con-sidering local, rather than global loading, through myocardial geometry for an ac-curate myocardial performance map.
Nevertheless, there are limitations to this study which must be considered. First,the number of patients is relatively small and a larger dataset would certainlystrenghten the conclusions drawn in this study. Secondly, RT3DE is, in spite ofthe improvements in recent years, a more challenging technique than 2DE in termsof acquisition window and image quality in some patients, which might have animpact in the applicability of this method to the general population. However, theimprovements to RT3DE’s spatiotemporal resolution are expected to continue asmore advanced beamforming techniques migrate to commercial systems, improvingthe quality of information that can be obtained with RT3DE and simultaneously
132 CHAPTER 9. MYOCARDIAL PERFORMANCE MAPPING
increasing the applicability of RT3DE based methods such as the one proposed inthis study. Thirdly, given the fact that normalized FDG-PET tracer uptake wasused as ground truth, a direct comparison between patients is not possible. Thismight have an effect on the final results as correlations are only possible within eachpatient. An alternative approach could be to use the FDG-PET standard uptakeratio as proposed in [248], which would allow for a more robust measurement ofmyocardial oxygen consumption and a comparison across all patients. However,this method could not be applied to this population in the scope of this study. Fi-nally, the equations 9.5, 9.6 and 9.7 used to estimate LV stress present numerousassumptions which are known to be violated in the LV myocardium. While numer-ous forms of these equations exist, the most known being perhaps Laplace’s law,these were chosen as they predict different longitudinal and circumferentail stress.Nevertheless, due to the assumption involved, it would be important to considermore complex analysis tools adapted to complex geometries as the LV myocardium,such as finite element methods. However, good correlation with FDG-PET, thereference method to clinically assess local metabolism, was obtained validating theproposed method.
In terms of future work, the automation of the annotation of the valve eventswould be of interest as it is currently the only step that requires user interaction.This would further simplify the method, rendering it fully automatic.
9.6 Conclusion
In conclusion, a novel non-invasive method for myocardial performance mappingin RT3DE is proposed. The fact that the proposed method relies on RT3DE notonly simplifies the protocol, as only one image must be acquired and processed,but gives access to the full 3D information, leading to more accurate results thanprevious similar implementations in 2DE. Furthermore, the proposed method relieson an automatic segmentation framework, where only the valve events must bemanually annotated making it simple to apply.

Chapter 10
Real-Time AnatomicalImaging of the Heart on anExperimental UltrasoundSystem
This chapter is based on a paper published in the proceedings of the 2017 IEEE InternationalUltrasonics Symposium (IUS): Pedrosa J., Komini V., Duchenne J., D’hooge J.. Real-timeanatomical imaging of the heart on an experimental ultrasound system. In 2017 IEEE Interna-tional Ultrasonics Symposium (IUS) proceedings Sep 6 (pp. 1-4).
133
134 CHAPTER 10. ANATOMICAL IMAGING OF THE HEART
Abstract
Fast echocardiography imaging requires a reduction of the number of trans-mit events. This can be achieved through advanced beamforming techniques butrestricting the field of view (FOV) to the anatomically relevant domain, e.g. the my-ocardium, can increase frame rate (FR) further. In the present work, an anatomicalscan sequence was implemented and tested experimentally by performing real-timesegmentation of the myocardium on conventional B-mode and feeding this infor-mation back to the scanner in order to define a fast myocardial scan sequence.Ultrasound imaging was performed using HD-PULSE, an experimental fully pro-grammable 256 channel ultrasound system equipped with a 3.5MHz phased arraytransducer. A univentricular polyvinyl alcohol (PVA) phantom was connected to apump to simulate the cardiac cycle to perform in vitro validation of this approach.In addition, three volunteers were also imaged from an apical 4-chamber view todemonstrate the feasibility of this method in vivo. It is shown that this method isfeasible to be applied in real-time and in vivo giving a minimum gain in FR of 1.5.
10.1 Introduction
Echocardiography is the modality of choice for routine diagnosis and assessmentof cardiac function due to its low cost, wide availability and lack of ionizing radi-ation. Nevertheless, in spite of having good spatiotemporal resolution, traditionalultrasound cannot resolve the totality of cardiac mechanical events, especially whenconsidering some very short lived events such as the mechanical activation of theleft ventricle (LV) pre-ejection. As such, potentially important clinical informationmight be lost.
Recently, very high temporal resolution ultrasound imaging has been made pos-sible through the development of more complex scan sequences such as multi-lineacquisition (MLA), retrospective gating, diverging wave (DW) imaging and multi-line transmit (MLT) [59]. In MLA, multiple neighboring lines are reconstructedsimultaneously for each transmit beam [47]. This technique is already implementedin most commercial scanners. Retrospective gating divides the sector into smallersubsectors and each of these subsectors is imaged at high FR using electrocardio-gram (ECG) as a timing reference [46]. It is then possible to combine the differentsubsectors into a single high FR sector. Retrospective gating is also a standard tech-nique for 3D imaging. However, this fusion process may fail if the cardiac cyclesbetween the subsectors are markedly different or when the subject’s heartbeat isirregular leading to stitching artifacts. DW imaging relies on the transmission of asingle or a small number of DW to reconstruct the whole sector [55]. However, thistechnique significantly compromises spatial resolution and contrast-to-noise ratio,thus requiring coherent spatial compounding which in turn compromises the gainin FR [249]. Alternatively, MLT imaging relies on the simultaneous transmission ofmultiple focused beams [49]. In spite of the possibility of cross-talk between differ-ent beams, it has been shown that this effect is very limited when MLT is carefully
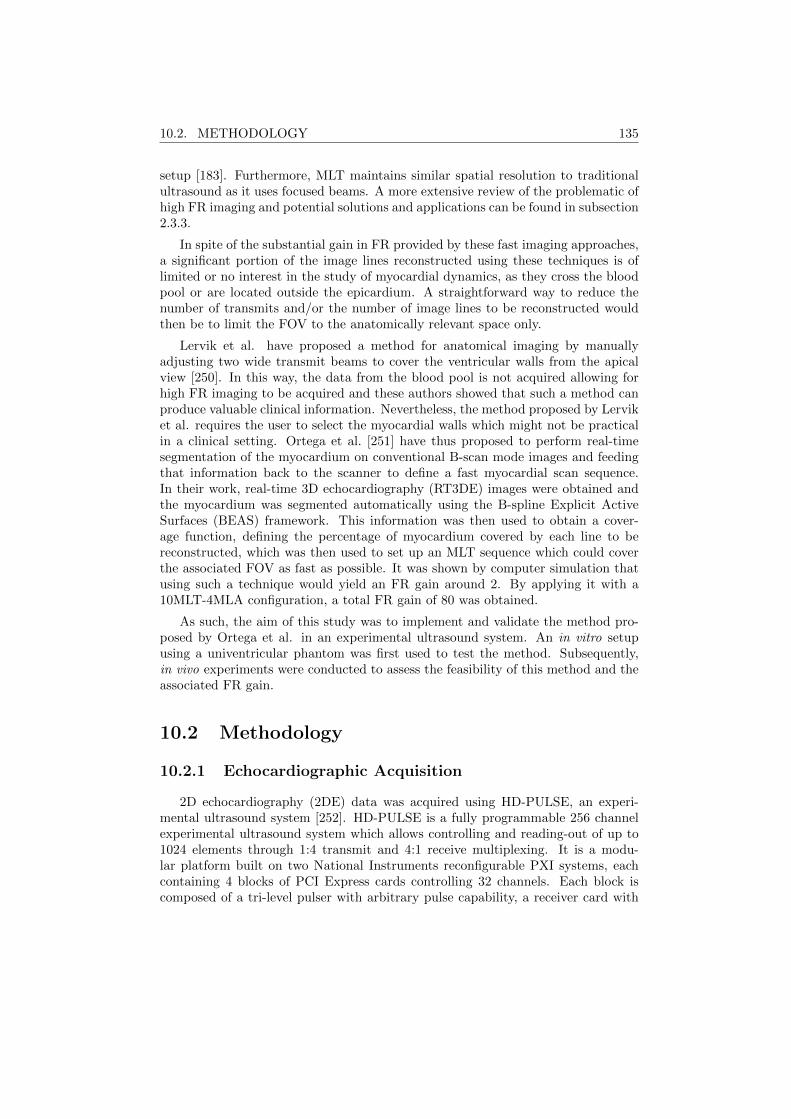
10.2. METHODOLOGY 135
setup [183]. Furthermore, MLT maintains similar spatial resolution to traditionalultrasound as it uses focused beams. A more extensive review of the problematic ofhigh FR imaging and potential solutions and applications can be found in subsection2.3.3.
In spite of the substantial gain in FR provided by these fast imaging approaches,a significant portion of the image lines reconstructed using these techniques is oflimited or no interest in the study of myocardial dynamics, as they cross the bloodpool or are located outside the epicardium. A straightforward way to reduce thenumber of transmits and/or the number of image lines to be reconstructed wouldthen be to limit the FOV to the anatomically relevant space only.
Lervik et al. have proposed a method for anatomical imaging by manuallyadjusting two wide transmit beams to cover the ventricular walls from the apicalview [250]. In this way, the data from the blood pool is not acquired allowing forhigh FR imaging to be acquired and these authors showed that such a method canproduce valuable clinical information. Nevertheless, the method proposed by Lerviket al. requires the user to select the myocardial walls which might not be practicalin a clinical setting. Ortega et al. [251] have thus proposed to perform real-timesegmentation of the myocardium on conventional B-scan mode images and feedingthat information back to the scanner to define a fast myocardial scan sequence.In their work, real-time 3D echocardiography (RT3DE) images were obtained andthe myocardium was segmented automatically using the B-spline Explicit ActiveSurfaces (BEAS) framework. This information was then used to obtain a cover-age function, defining the percentage of myocardium covered by each line to bereconstructed, which was then used to set up an MLT sequence which could coverthe associated FOV as fast as possible. It was shown by computer simulation thatusing such a technique would yield an FR gain around 2. By applying it with a10MLT-4MLA configuration, a total FR gain of 80 was obtained.
As such, the aim of this study was to implement and validate the method pro-posed by Ortega et al. in an experimental ultrasound system. An in vitro setupusing a univentricular phantom was first used to test the method. Subsequently,in vivo experiments were conducted to assess the feasibility of this method and theassociated FR gain.
10.2 Methodology
10.2.1 Echocardiographic Acquisition
2D echocardiography (2DE) data was acquired using HD-PULSE, an experi-mental ultrasound system [252]. HD-PULSE is a fully programmable 256 channelexperimental ultrasound system which allows controlling and reading-out of up to1024 elements through 1:4 transmit and 4:1 receive multiplexing. It is a modu-lar platform built on two National Instruments reconfigurable PXI systems, eachcontaining 4 blocks of PCI Express cards controlling 32 channels. Each block iscomposed of a tri-level pulser with arbitrary pulse capability, a receiver card with
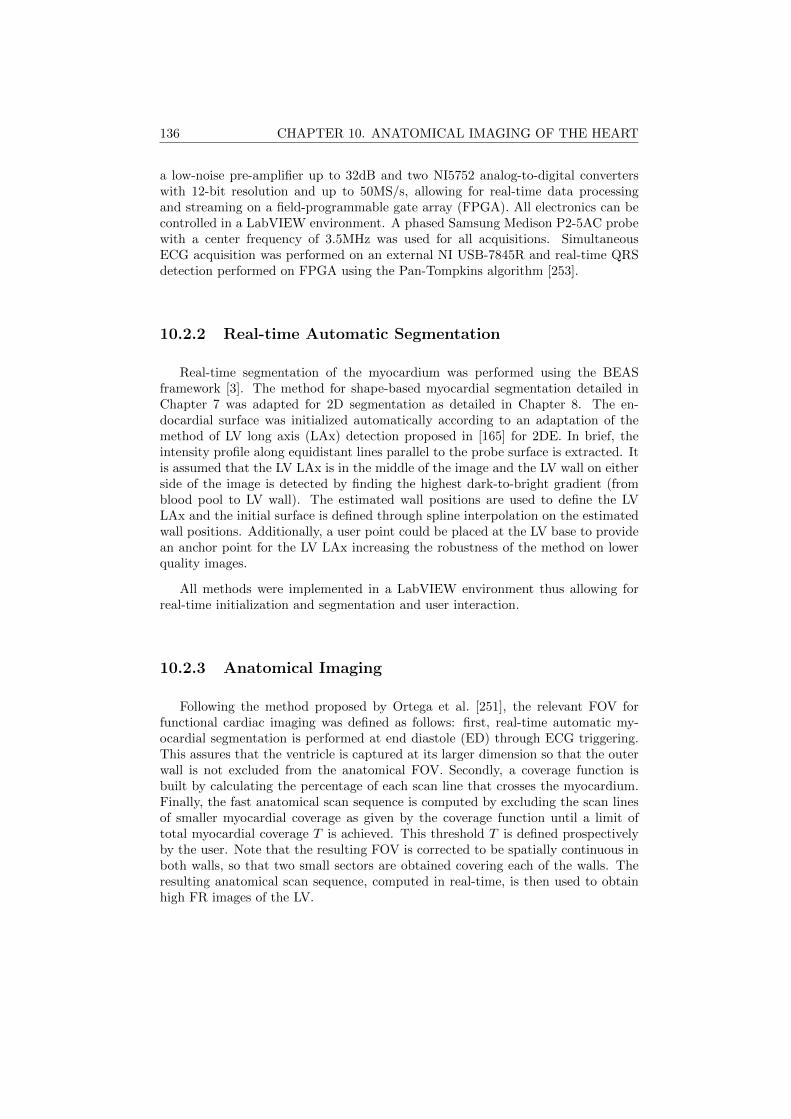
136 CHAPTER 10. ANATOMICAL IMAGING OF THE HEART
a low-noise pre-amplifier up to 32dB and two NI5752 analog-to-digital converterswith 12-bit resolution and up to 50MS/s, allowing for real-time data processingand streaming on a field-programmable gate array (FPGA). All electronics can becontrolled in a LabVIEW environment. A phased Samsung Medison P2-5AC probewith a center frequency of 3.5MHz was used for all acquisitions. SimultaneousECG acquisition was performed on an external NI USB-7845R and real-time QRSdetection performed on FPGA using the Pan-Tompkins algorithm [253].
10.2.2 Real-time Automatic Segmentation
Real-time segmentation of the myocardium was performed using the BEASframework [3]. The method for shape-based myocardial segmentation detailed inChapter 7 was adapted for 2D segmentation as detailed in Chapter 8. The en-docardial surface was initialized automatically according to an adaptation of themethod of LV long axis (LAx) detection proposed in [165] for 2DE. In brief, theintensity profile along equidistant lines parallel to the probe surface is extracted. Itis assumed that the LV LAx is in the middle of the image and the LV wall on eitherside of the image is detected by finding the highest dark-to-bright gradient (fromblood pool to LV wall). The estimated wall positions are used to define the LVLAx and the initial surface is defined through spline interpolation on the estimatedwall positions. Additionally, a user point could be placed at the LV base to providean anchor point for the LV LAx increasing the robustness of the method on lowerquality images.
All methods were implemented in a LabVIEW environment thus allowing forreal-time initialization and segmentation and user interaction.
10.2.3 Anatomical Imaging
Following the method proposed by Ortega et al. [251], the relevant FOV forfunctional cardiac imaging was defined as follows: first, real-time automatic my-ocardial segmentation is performed at end diastole (ED) through ECG triggering.This assures that the ventricle is captured at its larger dimension so that the outerwall is not excluded from the anatomical FOV. Secondly, a coverage function isbuilt by calculating the percentage of each scan line that crosses the myocardium.Finally, the fast anatomical scan sequence is computed by excluding the scan linesof smaller myocardial coverage as given by the coverage function until a limit oftotal myocardial coverage T is achieved. This threshold T is defined prospectivelyby the user. Note that the resulting FOV is corrected to be spatially continuous inboth walls, so that two small sectors are obtained covering each of the walls. Theresulting anatomical scan sequence, computed in real-time, is then used to obtainhigh FR images of the LV.

10.3. EXPERIMENTS 137
10.2.4 Non-rigid Image Registration
In order to demonstrate the feasibility of anatomical imaging for functionalmyocardial imaging, a non-rigid image registration (NRIR) framework [233] wasused to estimate the motion of the tissue in the image. In brief, the basic conceptof NRIR is to deform a moving image IM to align with a fixed image IF . Thedisplacement field Tξ = (Tx, Ty) is computed at every pixel (x, y) and modeled asa tensor product of 2D cubic B-splines β3
ξ [ξ ∈ (x, y)] [254] such that
Tξ(x, y) =∑i∈Ni
∑i∈Nj
µijβ3x
(x− κijxσx
)β3y
(y − κijyσy
), (10.1)
where Nξ denotes the set of control grid points within the compact support of B-splines of intergrid position κξ and spacing σξ. The B-spline coefficients µij arethen optimized in an iterative multiscale optimization process according to the sumof squared differences and a bending energy [254]. A detailed description of thismethod can be consulted in [233].
10.3 Experiments
In vitro
A univentricular homogeneous PVA phantom with realistic LV dimensions wasmanufactured and connected to a CardioFlow 5000MR pump (Shelley MedicalImaging Technologies, Ontario, Canada) as described in [255]. In brief, the phantomwas submerged in a water tank and fixed so that apical scanning was possible. Thepump was connected to the PVA phantom in a closed circulation so that the pumpflow deforms the phantom through the increase/decrease of pressure. A sinusoidalflow waveform was used to cyclically (60bpm) inflate/deflate the phantom in orderto simulate cardiac motion/contraction. To have an independent measure of tissuedeformation, a digital ultrasonic measurement system (Sonometrics Corporation,London, Ontario, Canada) was used. Two ultrasonic microcrystals were attachedto the wall in the same longitudinal direction to obtain reference longitudinal dis-placement. These microcrystals emit and detect ultrasonic pulses and thus the timeof flight between the two microcrystals can be used to estimate the distance betweenthem along time.
A 2MLT-2MLA approach was used to create a conventional B-scan of the phan-tom (FR 155Hz). BEAS was then used to perform segmentation in real-time at themoment of largest volume of the phantom. A total myocardial coverage value T of85% was used to create an anatomical scan sequence from the obtained coveragefunction. A minimum of two seconds were captured for both conventional imagesand anatomical imaging and these were processed offline using NRIR to estimatethe tissue motion. The longitudinal strain obtained with the ultrasonic microcrys-tals was then used as a reference by comparing it to the longitudinal strain obtainedfrom NRIR at in the same wall region on both imaging modes.
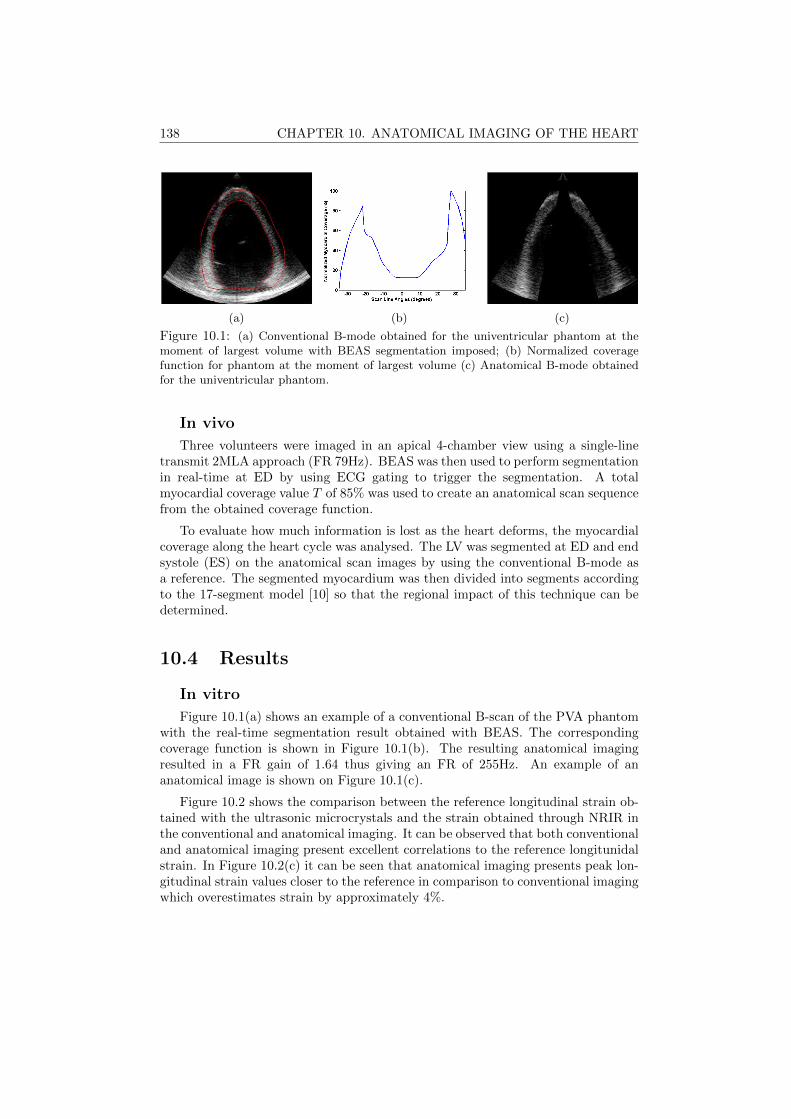
138 CHAPTER 10. ANATOMICAL IMAGING OF THE HEART
(a) (b) (c)
Figure 10.1: (a) Conventional B-mode obtained for the univentricular phantom at themoment of largest volume with BEAS segmentation imposed; (b) Normalized coveragefunction for phantom at the moment of largest volume (c) Anatomical B-mode obtainedfor the univentricular phantom.
In vivo
Three volunteers were imaged in an apical 4-chamber view using a single-linetransmit 2MLA approach (FR 79Hz). BEAS was then used to perform segmentationin real-time at ED by using ECG gating to trigger the segmentation. A totalmyocardial coverage value T of 85% was used to create an anatomical scan sequencefrom the obtained coverage function.
To evaluate how much information is lost as the heart deforms, the myocardialcoverage along the heart cycle was analysed. The LV was segmented at ED and endsystole (ES) on the anatomical scan images by using the conventional B-mode asa reference. The segmented myocardium was then divided into segments accordingto the 17-segment model [10] so that the regional impact of this technique can bedetermined.
10.4 Results
In vitro
Figure 10.1(a) shows an example of a conventional B-scan of the PVA phantomwith the real-time segmentation result obtained with BEAS. The correspondingcoverage function is shown in Figure 10.1(b). The resulting anatomical imagingresulted in a FR gain of 1.64 thus giving an FR of 255Hz. An example of ananatomical image is shown on Figure 10.1(c).
Figure 10.2 shows the comparison between the reference longitudinal strain ob-tained with the ultrasonic microcrystals and the strain obtained through NRIR inthe conventional and anatomical imaging. It can be observed that both conventionaland anatomical imaging present excellent correlations to the reference longitunidalstrain. In Figure 10.2(c) it can be seen that anatomical imaging presents peak lon-gitudinal strain values closer to the reference in comparison to conventional imagingwhich overestimates strain by approximately 4%.
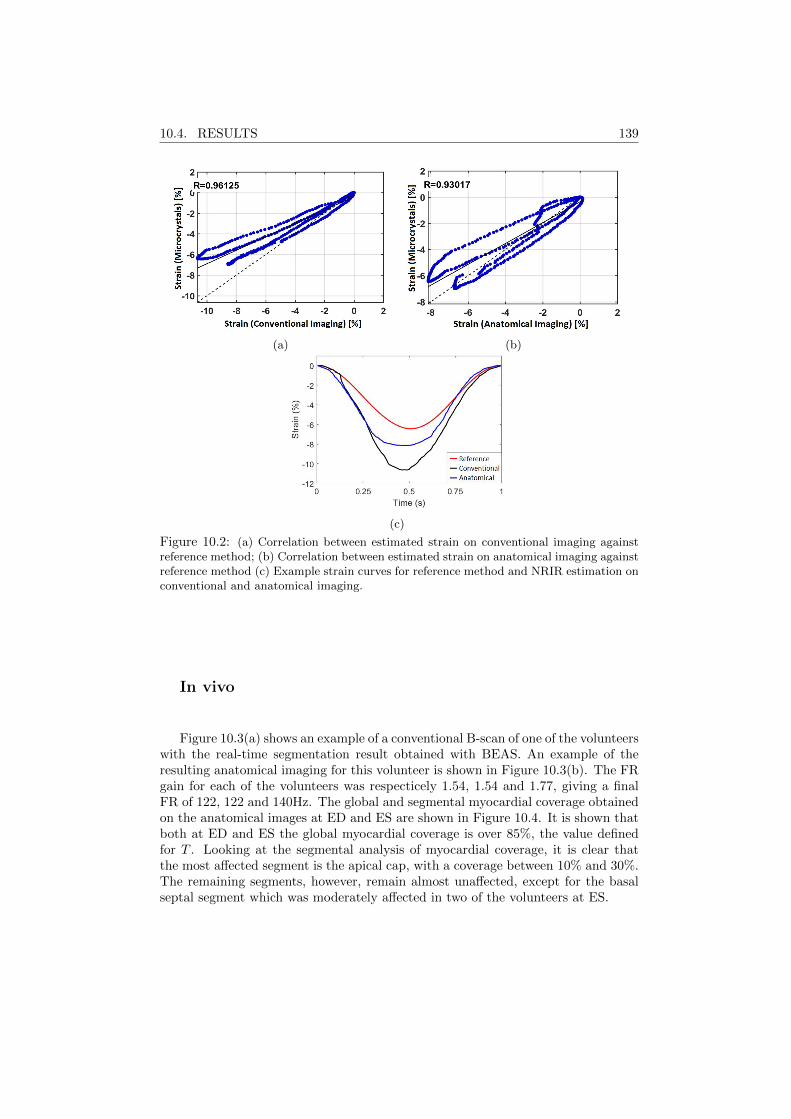
10.4. RESULTS 139
(a) (b)
(c)
Figure 10.2: (a) Correlation between estimated strain on conventional imaging againstreference method; (b) Correlation between estimated strain on anatomical imaging againstreference method (c) Example strain curves for reference method and NRIR estimation onconventional and anatomical imaging.
In vivo
Figure 10.3(a) shows an example of a conventional B-scan of one of the volunteerswith the real-time segmentation result obtained with BEAS. An example of theresulting anatomical imaging for this volunteer is shown in Figure 10.3(b). The FRgain for each of the volunteers was respecticely 1.54, 1.54 and 1.77, giving a finalFR of 122, 122 and 140Hz. The global and segmental myocardial coverage obtainedon the anatomical images at ED and ES are shown in Figure 10.4. It is shown thatboth at ED and ES the global myocardial coverage is over 85%, the value definedfor T . Looking at the segmental analysis of myocardial coverage, it is clear thatthe most affected segment is the apical cap, with a coverage between 10% and 30%.The remaining segments, however, remain almost unaffected, except for the basalseptal segment which was moderately affected in two of the volunteers at ES.
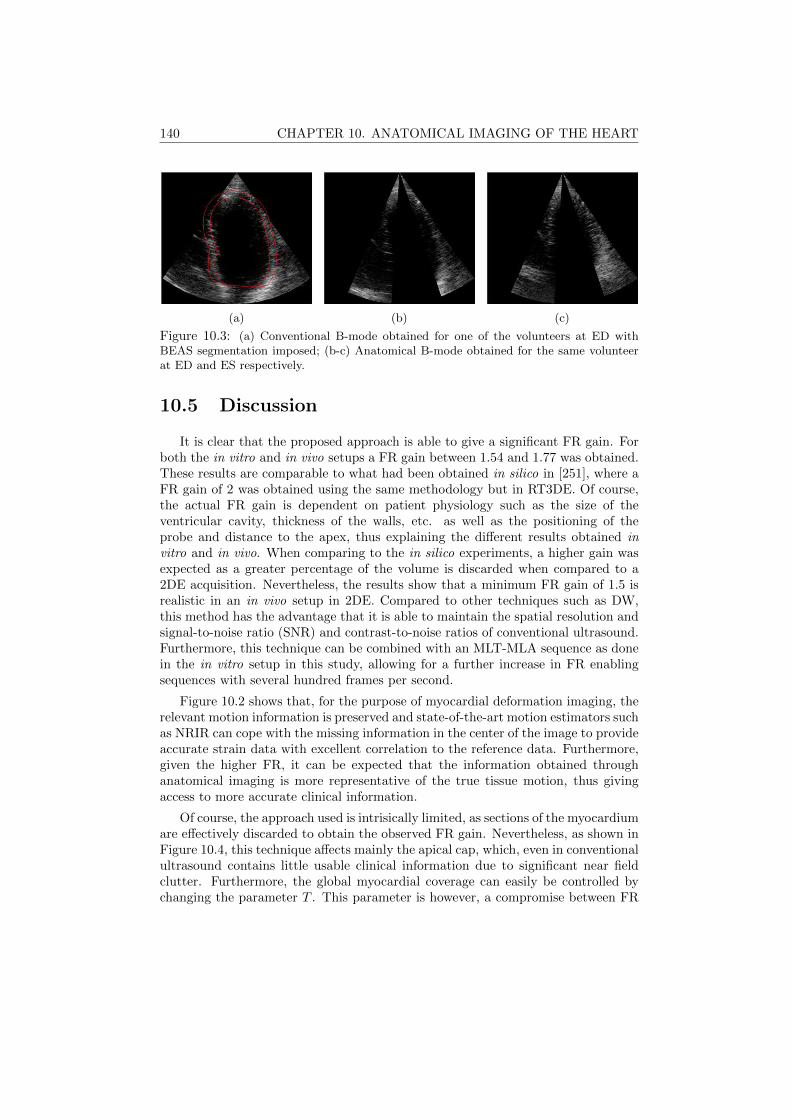
140 CHAPTER 10. ANATOMICAL IMAGING OF THE HEART
(a) (b) (c)
Figure 10.3: (a) Conventional B-mode obtained for one of the volunteers at ED withBEAS segmentation imposed; (b-c) Anatomical B-mode obtained for the same volunteerat ED and ES respectively.
10.5 Discussion
It is clear that the proposed approach is able to give a significant FR gain. Forboth the in vitro and in vivo setups a FR gain between 1.54 and 1.77 was obtained.These results are comparable to what had been obtained in silico in [251], where aFR gain of 2 was obtained using the same methodology but in RT3DE. Of course,the actual FR gain is dependent on patient physiology such as the size of theventricular cavity, thickness of the walls, etc. as well as the positioning of theprobe and distance to the apex, thus explaining the different results obtained invitro and in vivo. When comparing to the in silico experiments, a higher gain wasexpected as a greater percentage of the volume is discarded when compared to a2DE acquisition. Nevertheless, the results show that a minimum FR gain of 1.5 isrealistic in an in vivo setup in 2DE. Compared to other techniques such as DW,this method has the advantage that it is able to maintain the spatial resolution andsignal-to-noise ratio (SNR) and contrast-to-noise ratios of conventional ultrasound.Furthermore, this technique can be combined with an MLT-MLA sequence as donein the in vitro setup in this study, allowing for a further increase in FR enablingsequences with several hundred frames per second.
Figure 10.2 shows that, for the purpose of myocardial deformation imaging, therelevant motion information is preserved and state-of-the-art motion estimators suchas NRIR can cope with the missing information in the center of the image to provideaccurate strain data with excellent correlation to the reference data. Furthermore,given the higher FR, it can be expected that the information obtained throughanatomical imaging is more representative of the true tissue motion, thus givingaccess to more accurate clinical information.
Of course, the approach used is intrisically limited, as sections of the myocardiumare effectively discarded to obtain the observed FR gain. Nevertheless, as shown inFigure 10.4, this technique affects mainly the apical cap, which, even in conventionalultrasound contains little usable clinical information due to significant near fieldclutter. Furthermore, the global myocardial coverage can easily be controlled bychanging the parameter T . This parameter is however, a compromise between FR
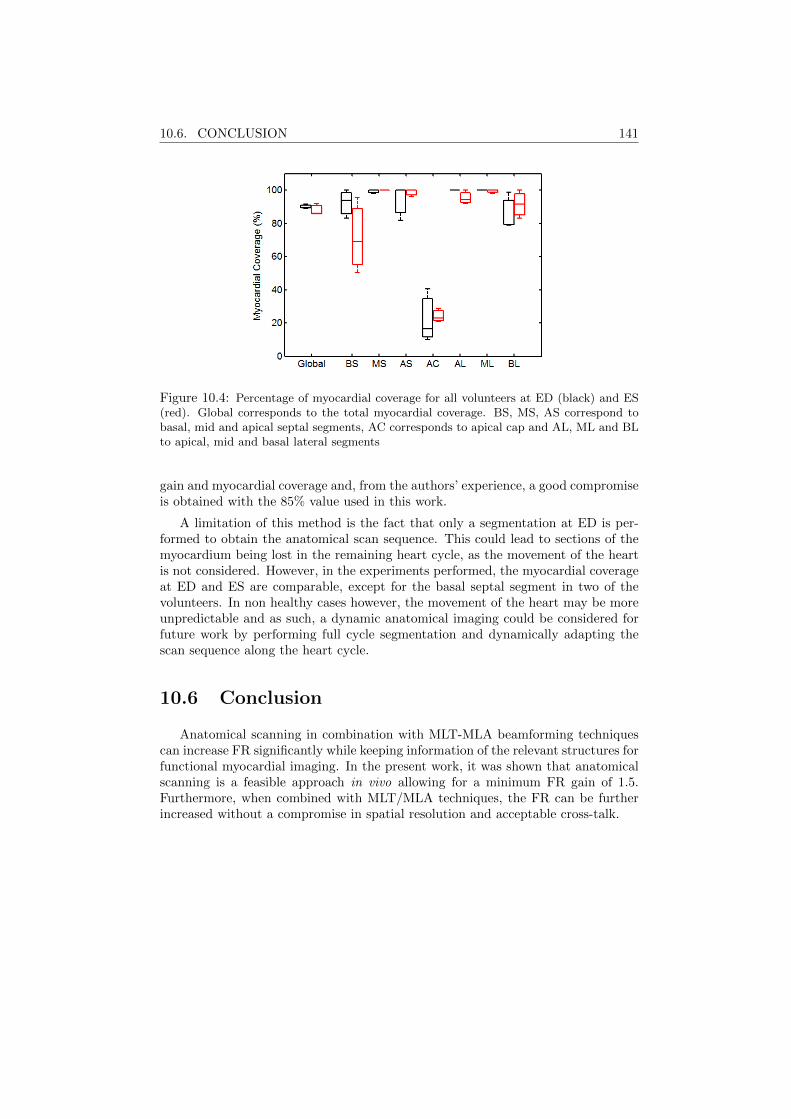
10.6. CONCLUSION 141
Figure 10.4: Percentage of myocardial coverage for all volunteers at ED (black) and ES(red). Global corresponds to the total myocardial coverage. BS, MS, AS correspond tobasal, mid and apical septal segments, AC corresponds to apical cap and AL, ML and BLto apical, mid and basal lateral segments
gain and myocardial coverage and, from the authors’ experience, a good compromiseis obtained with the 85% value used in this work.
A limitation of this method is the fact that only a segmentation at ED is per-formed to obtain the anatomical scan sequence. This could lead to sections of themyocardium being lost in the remaining heart cycle, as the movement of the heartis not considered. However, in the experiments performed, the myocardial coverageat ED and ES are comparable, except for the basal septal segment in two of thevolunteers. In non healthy cases however, the movement of the heart may be moreunpredictable and as such, a dynamic anatomical imaging could be considered forfuture work by performing full cycle segmentation and dynamically adapting thescan sequence along the heart cycle.
10.6 Conclusion
Anatomical scanning in combination with MLT-MLA beamforming techniquescan increase FR significantly while keeping information of the relevant structures forfunctional myocardial imaging. In the present work, it was shown that anatomicalscanning is a feasible approach in vivo allowing for a minimum FR gain of 1.5.Furthermore, when combined with MLT/MLA techniques, the FR can be furtherincreased without a compromise in spatial resolution and acceptable cross-talk.

142 CHAPTER 10. ANATOMICAL IMAGING OF THE HEART

Chapter 11
Final Remarks
143
144 CHAPTER 11. FINAL REMARKS
11.1 Main Contributions
In this thesis, the topic of real-time 3D echocardiography (RT3DE) left ventric-ular (LV) assessment was addressed. This topic was approached both in a technicalcontext in Part I of this thesis, developing novel image processing frameworks toextract valuable information from the image, and also in an applicational/clinicalcontext in Part II, by applying the techniques developed to solve clinical problems.
In Chapter 2, a review of the most relevants topics for the contextualizationof this work was given. Starting with anatomical and functional considerationson the cardiovascular system and particularly the LV, a review on the prognosticvalue of LV assessment in clinical practice was presented, highlighting the clinicalimportance of the LV and the maturity of this clinical field. The different cardiacimaging modalities were then explored as means to assess the LV and the focus wasset on echocardiography due to its inherent advantages. Moreover, the importanceof RT3DE was highlighted as it gives access to the true 3D geometry of the cardiacstructures. The relevance of high frame rate (FR) imaging was also briefly describedas an additional way of obtaining further information on the cardiac dynamics.
In Section 2.4, a review of the state-of-the-art of LV segmentation and trackingmethodologies was presented, which showed the advanced maturity of the researchfield. Also the commercial solutions available were described as those are the onescommonly available to clinicians. Finally, a review on the validation of RT3DE LVvolume assessment was presented, showing the validity of this modality as a clinicaltool.
11.1.1 Technical Contributions
Given the topic of this thesis, the technical contributions were of course aroundthe topic of 3D myocardial LV segmentation in RT3DE. The starting point ofthis thesis was, as described in Section 2.5, the B-spline Explicite Active Surfaces(BEAS) framework for 3D LV segmentation which had proven to be potentiallyreal-time, fully automatic and accurate. The work developed during this thesisaimed then at improving this framework both in terms of its robustness and theclinical information it provides.
The first technical contribution of this thesis was heartBEATS, a hybrid energyframework for tracking of the LV from end diastole (ED) to end systole (ES) pre-sented on Chapter 3. Though this framework was initially proposed in the PhDwork of Daniel Barbosa, the author of this thesis played a determinant role in thefinalization and publication of the validation results obtained. The heartBEATSframework allows the tracking of the LV segmentation throughout the heart cycle,balancing segmentation and tracking clues for an improved tracking result withoutcompromising the feasibility of real-time.
The second technical contribution was an automatic method for short axis (SAx)orientation of the LV proposed in Chapter 4. This method is based on the detectionof the inferior right ventricular (RV) insertion using image intensity and structural
11.1. MAIN CONTRIBUTIONS 145
information. SAx orientation allows to extract regional information from an LVsegmentation and divide it into a 17 segment model for example.
The third technical contribution was a framework for full-cycle LV segmentationusing a statistical shape model (SSM) obtained from cardiac magnetic resonanceimaging (cMRI) images (Chapter 5). This approach couples the advantages of theBEAS framework, a purely image information approach, to those of SSMs to giveprior information about the expected shape for an accurate segmentation. Thesegmentation is propagated throughout the heart cycle using localized anatomicalaffine optical flow (lAAOF). This framework was enabled by the contributions fromprevious chapters, namely the SAx orientation proposed in Chapter 4 to align theimage to the LV SSM and the hybrid energy approach from Chapter 3 to refinethe segmentation at ES. The proposed framework outperformed any other state-of-the-art method for ED/ES LV segmentation evaluated on the MICCAI CETUSchallenge. Moreover, it outperforms other methods in terms of computational speed,being able to perform ED/ES segmentation and tracking in a few seconds in a non-optimized implementation and could thus be implemented to run real-time.
The fourth technical contribution focused on the way to couple endo- and epi-cardial segmentation for an optimal myocardial segmentation (Chapter 6). Whilethese two surfaces are bound anatomically to the same structure, the myocardium,their mathematical definition can be done in a number of ways and plays a role inthe final result. It was shown that the best approach was a two-step (2S) approachwhere the endocardial surface is segmented first and then used as a base for theepicardial segmentation by defining the epicardial surface as the thickness of themyocardium. This corroborates the idea that epicardial segmentation is more chal-lenging, and can thus benefit from the additional shape and position informationprovided by the endocardial segmentation. In this way, a framework for LV my-ocardial segmentation was proposed, allowing for more information to be extracted,namely LV mass and myocardial thickness. Furthermore, myocardial segmentationis essential as a first step in post processing approaches such as strain analysis ordefinition of the region of interest (ROI) in machine learning approaches.
The fifth contribution was presented in Chapter 7 and was the adaptation ofthe framework from Chapter 5 for LV myocardial segmentation. This was possibleby combining this framework to the coupling validated in Chapter 6 and throughthe creation of a myocardial SSM. Because epicardial segmentation datasets arenot publicly available, an expert contoured the epicardium in the MICCAI CETUSchallenge database and this data was made public on the challenge website, thus al-lowing the validation and direct comparison with other methods in the future. Thisframework for automatic and robust full-cycle LV myocardial segmentation/trackingallows for the extraction of LV volumes and local geometry throughout the heartcycle, thus giving important clinical information. 3D strains can also be extractedin the myocardium given the local characteristics of the lAAOF, enabling moreadvanced clinical analysis.
146 CHAPTER 11. FINAL REMARKS
11.1.2 Applicational/Clinical Contributions
A first study, dedicated to facilitating the future application of the proposedtechnical contributions, was described in Chapter 8. The framework developedin Chapter 7 for 3D myocardial segmentation was implemented in a user-friendlydistributable software application where echocardiographic images can be loaded,automatically segmented and manually corrected. An adapted version of this frame-work for 2D echocardiography (2DE) was also implemented. The framework for 3Dmitral valve (MV) segmentation described in Appendix A was also implemented.The implementation of the frameworks developed in this thesis in a distributablesoftware application enables their application in future studies, technical or clinical,and accessible to any user without the need for programming skills.
The second contribution was the introduction of a method for myocardial perfor-mance mapping in RT3DE in Chapter 9. By using the 3D LV myocardial segmen-tation framework in Chapter 7, 3D local myocardial deformation and geometry canbe obtained. Intraventricular pressure can then be estimated based on the valveevents and by using equations that link pressure and geometry to LV stress, LVstress-strain loops can be built. The area of these loops is shown to be a measurefor myocardial work as validated by 18F-fluorodeoxyglucose positron emission to-mography (FDG-PET), the reference method to assess local metabolism clinically.
The third contribution was the validation of a high FR imaging method, anatom-ical imaging, in an in vivo setting (Chapter 10). In this method, real-time myocar-dial segmentation is performed in 2DE on the ultrasound system and the resultingsegmentation is used to define a fast myocardial scan sequence. This method wastested on HD-PULSE, an experimental ultrasound scanner. It was shown that aminimum FR gain of 1.5 was possible without a significant impact on spatial reso-lution, thus giving access to more information on wall motion dynamics. Moreover,the potential applications of real-time LV segmentation were highlighted, showingthat they far outreach the direct extraction of clinical parameters.
11.2 Discussion
The literature review presented in this thesis has made it evident that echocar-diographic image analysis is a mature field, especially when it comes to solutionsfor the LV. Analysis of RT3DE has particularly received attention in recent years asthe perceived imaging technique of the future for LV analysis. Numerous solutions,both semi- and fully automated, have been proposed in the research communityand are now gaining importance in commercial solutions. Nevertheless, there arestill challenges to be solved that could be tackled in future work.
In spite of the extensive research conducted towards the development of auto-matic frameworks for LV segmentation in RT3DE image, there still seems to be nosoftware platform providing a robust set of tools for LV assessment in RT3DE. Thetechnical contributions made in this thesis aimed at providing fast, automatic androbust solutions for this problematic, going further than the endocardial surface at
11.2. DISCUSSION 147
a single time frame to obtain a full LV myocardial segmentation throughout theheart cycle, thus providing additional clinical information. Establishing links withemerging image processing techniques, as is lAAOF, and fusing these with BEAS inan elegant framework was extremely important for this objective, contributing tothe promising results obtained. The inclusion of prior information through an SSMwas also shown to be a major factor in increasing the robustness of the frameworkand directly contributing to the promising results obtained. Ultrasound is a chal-lenging imaging modality and RT3DE especially so making the shape informationprovided by the SSM extremely useful, driving the segmentation when the imageinformation is low or unreliable.
While it is not always straightforward to balance image and prior informationon the final segmentation, it is expected that data driven solutions (thus poweredby shape and/or appearance prior information) become the standard in RT3DEsolutions, following the direction already observed in other computer vision fields.This trend can already be seen for the commercial players (as access to data isusually less of a constraint than in a research setting) in products such as Siemens’eSie LVATM or Philips’ HeartModelAI. It can be expected that data driven andspecifically deep learning approaches will take the same path that mechanistic ap-proaches treaded in the past years, starting with 2DE and then moving to 3D LVand eventually coming to 3D LV myocardial segmentation.
In the context of the framework for 3D LV myocardial segmentation developedin this thesis, data driven solutions can also come to play a major role furtherimproving the results obtained and creating a more robust framework. The LVinitialization proposed in [165] and used throughout this thesis is dependent onedge detection followed by Hough transform for circles (HTc) for long axis (LAx)detection and surface initialization and could therefore be replaced by a data drivenapproach. The influence of the initialization error was explored in Chapter 5 and itwas shown that improving the initialization could increase the performance of theframework (mean absolute distance (MAD): 1.38 mm; Hausdorff distance (HD):4.86 mm; Dice: 0.959 for the LV endocardial segmentation at ED). It would there-fore be interesting to replace this initialization for an approach that would takeinto account shape, appearance and contextual information for a more accurate de-cision regarding LV pose and shape. Several machine learning algorithms alreadyimplemented for LV assessment in echocardiography [256, 257] could provide suchan initialization through the creation of an edgemap for LV initialization. Moreover,such an edgemap could also be used to strenghten the segmentation by including anenergy term designed for and driven by this map, either replacing or complementingthe modified Yezzi energy term [165] currently used to extract image information.
The potential clinical application of the techniques developed in this work was amajor concern throughout the thesis. The focus was set on the clinical indices thatcan be extracted and improved by the proposed framework and its improvementsand clinicians were, naturally, an important source of input. Nevertheless, a majorgap still exists preventing the widespread use of this, or other similar frameworks,in the clinic. In spite of the inherent advantages of RT3DE and its recent develop-ments, providing better image quality and temporal resolution, clinical cardiology
148 CHAPTER 11. FINAL REMARKS
still relies heavily on 2DE and RT3DE is reserved almost entirely to clinical research.This can be attributed, on one hand, to the gap between clinical and research im-age processing tools, a gap that now starts to be closed by the major commercialplayers. On the other hand, the average clinician must be focused on providingthe best care to his/her patients and, consequently, follows the recommendationsof higher entities such as the European Association of Cardiovascular Imaging. Assuch, research efforts towards validation of RT3DE and its associated processingframeworks are of utmost importance as they bring more evidence to strengthenwhat is still an emerging clinical tool.
Besides more accurate assessment of the clinical indices already in use todaysuch as ED and ES volumes (EDV and ESV) and ejection fraction (EF), RT3DE LVassessment opens up new clinical possibilities by giving access to a greater amountof information in a more reliable way. The introduction of a novel frameworkfor myocardial performance mapping in Chapter 9 has highlighted the wealth ofinformation that can be retrieved from a single RT3DE acquisition in a totallyautomatic and non-invasive way. Myocardial performance mapping has long beena holy grail of clinical cardiology which has recently received new strenght withthe method for non-invasive intraventricular pressure measurement by Russel etal. [245]. While the ideas applied in Chapter 9 have long been proposed, such astudy using RT3DE and correlating it to a ground truth from FDG-PET had notyet been reported. Nevertheless, the number of patients in this study is limited andshould be extended.
The application of the myocardial segmentation in a real-time application inChapter 10 for anatomical imaging has shown the potential applications of thistechnology, straightening the gap between image processing and acquisition. Whilein this chapter an important step was given showing the feasibility of this technol-ogy in vivo, further efforts are needed to validate the clinical information obtainedthrough this high FR imaging approach. Specifically, strain and/or strain ratescould be extracted from such an approach and compared to those from other highFR imaging approaches such as diverging wave (DW) imaging within the same sub-ject. This could validate the idea that anatomical imaging provides a better spatialresolution and signal-to-noise ratio (SNR) and consequently more reliable clinicalinformation. However, this study was not possible within the scope of this thesis.An additional problematic could be that the current implementation of the methodmight prove challenging in more complex anatomies and heart motion due to thefact that only the position of the LV at ED is taken into account for the coveragefunction. This could lead to the LV moving out of the anatomical field of view(FOV) during the heart cycle. A straighforward improvement would then be to uselAAOF to track the LV along the heart cycle, thus creating a dynamic anatomicalimaging, perfectly adapted to the LV along the whole heart cycle. Looking furtherinto the future, an implementation of 3D anatomical imaging (thus implying real-time 3D LV myocardial segmentation) would lead to an even larger FR gain. Anin silico implementation of this technique has yielded a FR gain of 80 times in a 10multi-line transmit (MLT) - 4 multi-line acquisition (MLA) configuration withoutsignificant loss of image quality [251]. However, this was not possible within the
11.3. CONCLUSION AND FUTURE PERSPECTIVES 149
scope of this thesis due to hardware limitations on HD-PULSE which prevented theacquisition of RT3DE imaging.
Finally, the LV myocardial segmentation framework implemented in a distributablesoftware application - Speqle3D (Chapter 8) allows for its application in future stud-ies on further validation and extraction of clinical information. One important pointof this implementation was the possibility of manual correction, in case the userdisagreed with the segmentation result. This is especially important when imagequality is lower or the view is not standard, to get the optimal segmentation result.However, a thorough validation of this manual correction would have been impor-tant to clearly assess how much and in what cases this type of input is perceivedby the users as important.
11.3 Conclusion and Future Perspectives
Echocardiography is an indispensable tool for cardiac assessment and LV vol-ume/function assessment has undeniable prognostic and diagnostic value as revealedby the existing extensive literature on the topic. Though currently still an emerg-ing technology in the clinic, RT3DE gives access to the full 3D geometry of cardiacstructures, thus presenting significant advantages over 2DE. However, the analysisof 3D images is particularly challenging and time consuming, making the develop-ment of automatic tools extremely important. Such tools would allow for easieranalysis of RT3DE images, ultimately providing more information about the LV ina more robust and less user dependent way than current 2DE solutions.
In this thesis, several technical contributions were made with this goal in mind:a method for hybrid segmentation and tracking for more robust full-cycle segmen-tation; a method for SAx orientation of the LV giving additional local information;the addition of an SSM to the BEAS framework for a more robust segmentation; thecoupling of endo- and epicardial surfaces for an efficient myocardial segmentation;and the framework for full-cycle 3D LV myocardial segmentation. It was shown thatthe proposed framework outperformed any other state-of-the-art framework on LVsegmentation on the MICCAI CETUS challenge dataset. The application of thetechnical contributions made in this thesis was also considered, by implementingthe proposed framework in a user-friendly distributable software application. Theclinical value of the information that can be retrieved from RT3DE was furtherhighlighted by proposing a method for myocardial performance mapping throughthe study of the stress-strain relationships in the LV, showing good correlation withFDG-PET. Finally, other applications were also considered by applying real-timesegmentation in 2DE for anatomical imaging, as to obtain high FR imaging andstudy short lived myocardial dynamics.
The main challenge for the future remains the validation and acceptance ofRT3DE LV assessment in a clinical setting. The research community plays an im-portant role in the validation and benchmarking of new algorithms and it shouldbe expected that more data driven methods and deep learning approaches are pro-posed. As large sets of data have become more accessible in recent years these tech-
150 CHAPTER 11. FINAL REMARKS
niques have been implemented in a wide range of applications with very promisingresults. Though biomedical imaging is a particularly challenging field due to thedifficulty of obtaining a reliable ground truth, it should be expected that deep learn-ing approaches become the dominant framework in the future. A trend for morecontextual information is also expected, e.g. multi-chamber segmentation frame-works, leading to more information to be extracted from a single image while at thesame time making that information more reliable. This will likely have clinical im-plications as a wealth of information that was earlier infeasible or difficult to assessbecomes available as was shown for the myocardial performance mapping in thisthesis. The link between acquisition and processing will likely also be straightenedin the future as real-time processing is made possible through faster processing andgraphics processing unit implementations. An example of this is the anatomicalimaging proposed in this thesis, linking acquisition and segmentation for high FRimaging. Besides high FR imaging, the optimization of the imaging settings basedon the information being captured in real-time and the guidance of the clinician inpositioning the probe would be extremely interesting to maximize image quality,thereby improving the quality of information that can be extracted. In conclusion,these technologies would have the potential for robust, unbiased and fast assessmentof cardiac function, ultimately leading to better clinical care.

Appendix A
Fully Automatic Assessmentof Mitral Valve Morphologyfrom 3D TransthoracicEchocardiography
This chapter is based on a paper published in the proceedings of the 2018 IEEE InternationalUltrasonics Symposium (IUS): Pedrosa J., Queiros S., Vilaca J., Badano L., D’hooge J.. Fullyautomatic assessment of mitral valve morphology from 3D transthoracic echocardiography. In 2018IEEE International Ultrasonics Symposium (IUS) proceedings Oct 22 (accepted for publication).
151

152 APPENDIX A. MITRAL VALVE SEGMENTATION
Abstract
Quantitative assessment of mitral valve (MV) morphology is important for di-agnosing MV pathology and for planning of reparative procedures. Although this istypically done using 3D transesophageal echocardiography (TEE), recent advancesin the spatiotemporal resolution of 3D transthoracic echocardiography (TTE) haveenabled the use of this more patient friendly modality. However, manual data anal-ysis is time consuming and operator dependent. In this study, a fully automaticmethod for MV segmentation and tracking in 3D TTE is proposed and validated.The proposed framework takes advantage of the left ventricle (LV) segmentationframework presented in Chapter 5 to localize the MV and performs segmentationbased on the B-spline Explicit Active Surfaces (BEAS) framework. The orientationof the MV is obtained according to the automatically detected right ventricular(RV) insertion point and the LV outflow tract (LVOT). Following the segmen-tation, the MV surface is cropped to the mitral annulus (MA) and divided intoposterior and anterior leaflets using a dynamic programming technique refined byconsulting an atlas of manually contoured MVs. The segmented MV at end diastole(ED) is then propagated to end systole (ES) using localized anatomical affine op-tical flow (lAAOF). Because the orientation and leaflet division is known, relevantclinical parameters can then be extracted from the mesh at any time point. Theproposed framework shows excellent segmentation results with a mean absolute dis-tance (MAD) and Hausdorff distance (HD) of 1.19 ± 0.25mm and 5.79 ± 1.25mmat ED and 1.39 ± 0.32mm and 6.70 ± 1.97mm at ES against manual analysis. Inconclusion, an automatic method for MV segmentation is proposed which couldprovide valuable clinical information in a more patient-friendly manner.
A.1 Introduction
The MV is a crucial structure of the left heart, playing a significant role in LVand left atrial (LA) function [258], and thus of great clinical importance. While thestandard clinical tools for MV function assessment are mostly based on Dopplertechniques [259, 260], quantitative assessment of the MV geometry plays an in-creasingly important role, allowing a better understanding of MV physiology andpathophysiology in mitral regurgitation [261–263] and mitral stenosis [264,265], di-agnosis of MV pathology [266,267] and planning of reparative procedures [268,269].However, the fact that the MV is a 3D dynamic structure makes any quantitativeassessment in standard 2D echocardiography (2DE) or cardiac magnetic resonanceimaging (cMRI) challenging due to the need to define a correct imaging plane andto make geometric assumptions regarding the 3D structure of the MV [270]. Real-time 3D echocardiography (RT3DE), in specific RT3DE TEE (due to its betterspatiotemporal resolution and optimal imaging window to the MV), has thus beenproposed as an alternative to other 2D modalities. Furthermore, it has been shownthat MV assessment by 3D TEE is not only in accordance to surgical measurementsbut also superior to 2D TEE [271]. Manual analysis of a 3D structure such as theMV throughout time is, however, quite challenging and time consuming, which has
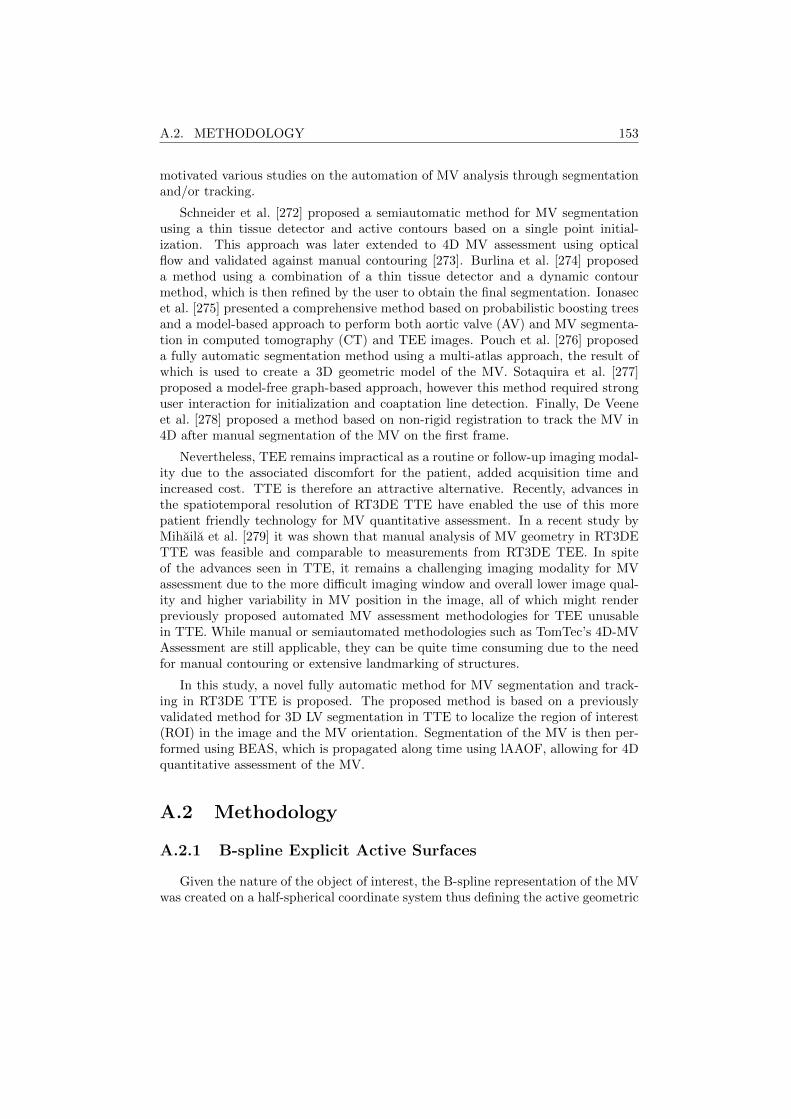
A.2. METHODOLOGY 153
motivated various studies on the automation of MV analysis through segmentationand/or tracking.
Schneider et al. [272] proposed a semiautomatic method for MV segmentationusing a thin tissue detector and active contours based on a single point initial-ization. This approach was later extended to 4D MV assessment using opticalflow and validated against manual contouring [273]. Burlina et al. [274] proposeda method using a combination of a thin tissue detector and a dynamic contourmethod, which is then refined by the user to obtain the final segmentation. Ionasecet al. [275] presented a comprehensive method based on probabilistic boosting treesand a model-based approach to perform both aortic valve (AV) and MV segmenta-tion in computed tomography (CT) and TEE images. Pouch et al. [276] proposeda fully automatic segmentation method using a multi-atlas approach, the result ofwhich is used to create a 3D geometric model of the MV. Sotaquira et al. [277]proposed a model-free graph-based approach, however this method required stronguser interaction for initialization and coaptation line detection. Finally, De Veeneet al. [278] proposed a method based on non-rigid registration to track the MV in4D after manual segmentation of the MV on the first frame.
Nevertheless, TEE remains impractical as a routine or follow-up imaging modal-ity due to the associated discomfort for the patient, added acquisition time andincreased cost. TTE is therefore an attractive alternative. Recently, advances inthe spatiotemporal resolution of RT3DE TTE have enabled the use of this morepatient friendly technology for MV quantitative assessment. In a recent study byMihaila et al. [279] it was shown that manual analysis of MV geometry in RT3DETTE was feasible and comparable to measurements from RT3DE TEE. In spiteof the advances seen in TTE, it remains a challenging imaging modality for MVassessment due to the more difficult imaging window and overall lower image qual-ity and higher variability in MV position in the image, all of which might renderpreviously proposed automated MV assessment methodologies for TEE unusablein TTE. While manual or semiautomated methodologies such as TomTec’s 4D-MVAssessment are still applicable, they can be quite time consuming due to the needfor manual contouring or extensive landmarking of structures.
In this study, a novel fully automatic method for MV segmentation and track-ing in RT3DE TTE is proposed. The proposed method is based on a previouslyvalidated method for 3D LV segmentation in TTE to localize the region of interest(ROI) in the image and the MV orientation. Segmentation of the MV is then per-formed using BEAS, which is propagated along time using lAAOF, allowing for 4Dquantitative assessment of the MV.
A.2 Methodology
A.2.1 B-spline Explicit Active Surfaces
Given the nature of the object of interest, the B-spline representation of the MVwas created on a half-spherical coordinate system thus defining the active geometric

154 APPENDIX A. MITRAL VALVE SEGMENTATION
Figure A.1: Conceptual description of the proposed segmentation and trackingframework. After endocardial segmentation at ED, automatic initialization andsegmentation of the MV is performed (A). LVOT detection is then performed toorient the MV (B). The lower frame shows the LV orientation according to theRV insertion point (red arrow) and MV orientation according to the LVOT (greenarrow) as well as LVOT and right heart cavity (RH). After MV orientation theMV is outlined by detecting the MA (C). The coaptation line is then detected (D),separating the anterior and posterior leaflets (red and green). This segmentation isthen propagated to ES (E).
functions as r = ψ(φ, θ) for φ < 0. The angular discretization of the boundaryrepresentation was empirically set to 24× 16 (elevation×azimuth) and the B-splinescale to 22 for both angular coordinates.
A.2.2 Framework Description
A conceptual description of the proposed framework is shown in Figure A.1.
A.2.2.1 Mitral Valve Initialization
Due to the variability of the position and orientation of the MV in RT3DE TTE,its localization in an automatic way is often challenging. As such, the initializationused is based on the automatic LV segmentation framework presented in Chapter5.
Taking advantage of the inherent BEAS structure of the segmented LV mesh,the localized image intensity outside the LV surface can be analyzed at any meshpoint. This can be used to distinguish between LV mesh points that are close to themyocardium (and thus with relatively high image intensity) and those that separatethe LV and LA blood pool (and thus with relatively low image intensity). Animage intensity map in the spherical domain according to the LV BEAS coordinatesystem is shown in Figure A.2. Dynamic programming can then be used to findthe separation between points adjacent to the myocardium and those adjacent tothe blood pool according to the gradient of the image intensity map along the
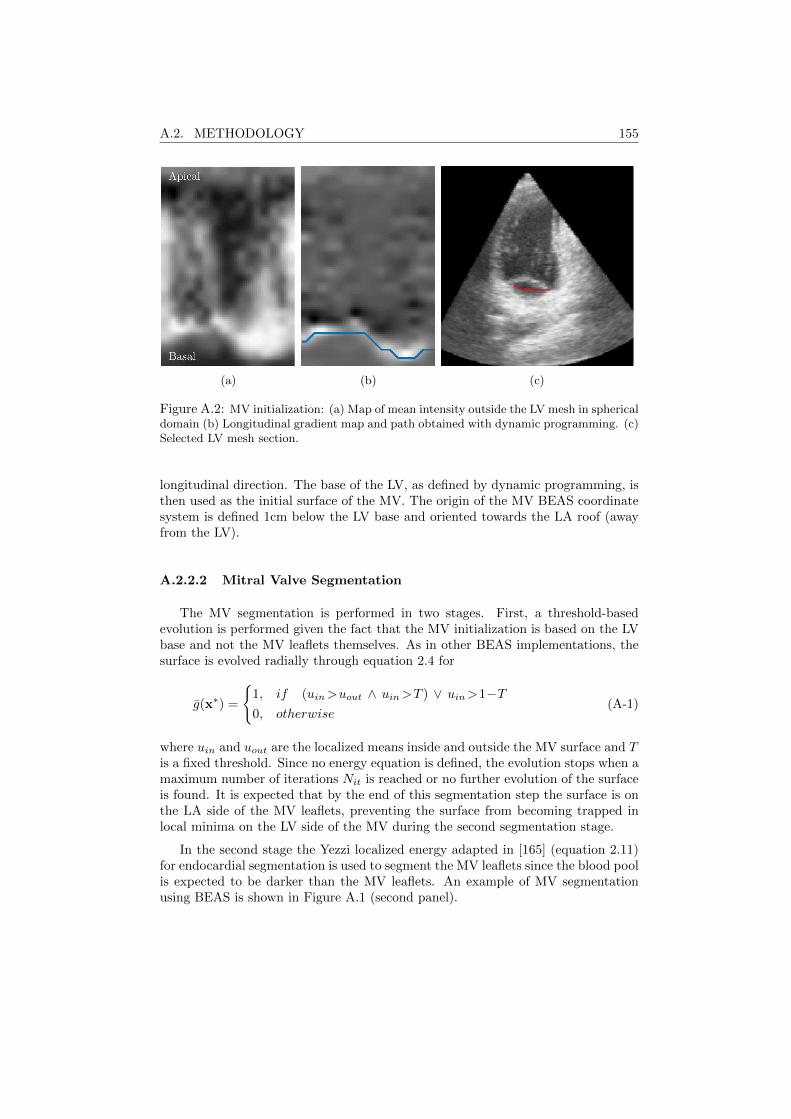
A.2. METHODOLOGY 155
(a) (b) (c)
Figure A.2: MV initialization: (a) Map of mean intensity outside the LV mesh in sphericaldomain (b) Longitudinal gradient map and path obtained with dynamic programming. (c)Selected LV mesh section.
longitudinal direction. The base of the LV, as defined by dynamic programming, isthen used as the initial surface of the MV. The origin of the MV BEAS coordinatesystem is defined 1cm below the LV base and oriented towards the LA roof (awayfrom the LV).
A.2.2.2 Mitral Valve Segmentation
The MV segmentation is performed in two stages. First, a threshold-basedevolution is performed given the fact that the MV initialization is based on the LVbase and not the MV leaflets themselves. As in other BEAS implementations, thesurface is evolved radially through equation 2.4 for
g(x∗) =
1, if (uin>uout ∧ uin>T ) ∨ uin>1−T0, otherwise
(A-1)
where uin and uout are the localized means inside and outside the MV surface and Tis a fixed threshold. Since no energy equation is defined, the evolution stops when amaximum number of iterations Nit is reached or no further evolution of the surfaceis found. It is expected that by the end of this segmentation step the surface is onthe LA side of the MV leaflets, preventing the surface from becoming trapped inlocal minima on the LV side of the MV during the second segmentation stage.
In the second stage the Yezzi localized energy adapted in [165] (equation 2.11)for endocardial segmentation is used to segment the MV leaflets since the blood poolis expected to be darker than the MV leaflets. An example of MV segmentationusing BEAS is shown in Figure A.1 (second panel).
156 APPENDIX A. MITRAL VALVE SEGMENTATION
(a) (b) (c)
Figure A.3: LVOT detection: (a) RT3DE slice at MA level; (b) Frangi vesselness filterresult at MA level; (c) Normalized average circumferential intensity profiles extractedfrom image (blue) and Frangi vesselness filter (red) and point chosen as LVOT (blackcross). Angle θ is given from LV orientation at RV insertion point towards the right heart(clockwise in slices (a) and (b)). Vertical colored lines in (c) indicate the angular positionsmarked in slices (a) and (b).
A.2.2.3 Left Ventricle Outflow Tract Detection
To be able to extract clinical information from the segmented mesh, it is impor-tant to orient the mesh according to the surrounding anatomical structures. Whilean approximate orientation is obtained from the LV segmentation as the RV inser-tion point position is known (Chapter 4), the MV is more easily oriented accordingto the LVOT. Although typically the RV insertion point and LVOT are π/2 radiansapart, patient variability is significant.
LVOT detection is therefore performed according to: i) the mean intensity out-side uout given that the blood pool in the LVOT is naturally dark; ii) a vesselnessfilter as introduced by Frangi et al. [280] suited for the average LVOT size, em-pirically set between 6 and 9mm. The circumferential direction between π/3 andπ with maximum vesselness− uout (where f stands for the maximum-normalizedvalue of f) is then selected as the LVOT direction as shown in Figure A.3.
A.2.2.4 Mitral Annulus Detection
Given the definition of BEAS in a half-spherical coordinate system it follows thatthe surface obtained will be defined for any φ< 0. However, the MV is delineatedby the MA, which is saddle shaped. It can be observed in Figure A.1 that the lowersections of the segmentation encompass the LA walls and the ascending aorta. Thesesections thus need to be discarded by finding the MA, where the MV leaflets areattached. Once again, the BEAS structure is used to retrieve uout. It is expectedthat above the MA, where the uout is extracted across the MV leaflets into theLV blood pool, the mean intensity will be low, whereas below the MA the uout is

A.2. METHODOLOGY 157
(a) (b) (c)
Figure A.4: MA detection example: (a) RT3DE slice at MA level; (b,c) Orthogonal longaxis slices after MA cropping of the MV mesh; (d) uout gradient map and path chosenafter dynamic programming. Angle θ is given from the MV orientation at LVOT awayfrom the right heart (clockwise in slice (a)). Colors of vertical lines in (b) and upper lefttriangles in (c) indicate the angular positions marked in slice (a).
extracted from the LA walls and thus of high intensity. Based on this assumption,dynamic programming can be used to separate these two regions based on thegradient along the longitudinal direction.
However, uout is not a sufficiently reliable measure to delineate the MA, espe-cially in the LVOT where the ascending aorta will also have low mean intensitiesand the MA is defined at the AV. Furthermore, artifacts might change the intensityprofiles locally making this problem more challenging. As such, an intensive atlasbased approach is used based on a set of reference meshes (excluding the referencefrom the patient being tested). The MV mesh is thus aligned to each of the refer-ence meshes through an iterative closest point (ICP) algorithm taking into accountthe LVOT orientation. Mean square distance is used to score the alignment to eachreference mesh and those with lower distance are selected. The reference MA pathof each of these meshes is then projected into the MV BEAS space, thus creatinga new map showing the reference MA paths. Summing this map to the uout gra-dient map creates a single map representing both image intensity and shape-basedinformation, penalizing paths away from the reference MA paths. The highest prob-ability path is selected using dynamic programming and used to crop the segmentedBEAS mesh and obtain the MV mesh as shown in Figure A.4.
A.2.2.5 Coaptation Line Detection
To extract further information on the MV anatomy it is important to separatethe two leaflets by detecting the coaptation line, where the two leaflets meet. Asproposed by Sotaquira et al. in [277], the distance of the mesh point to the MA
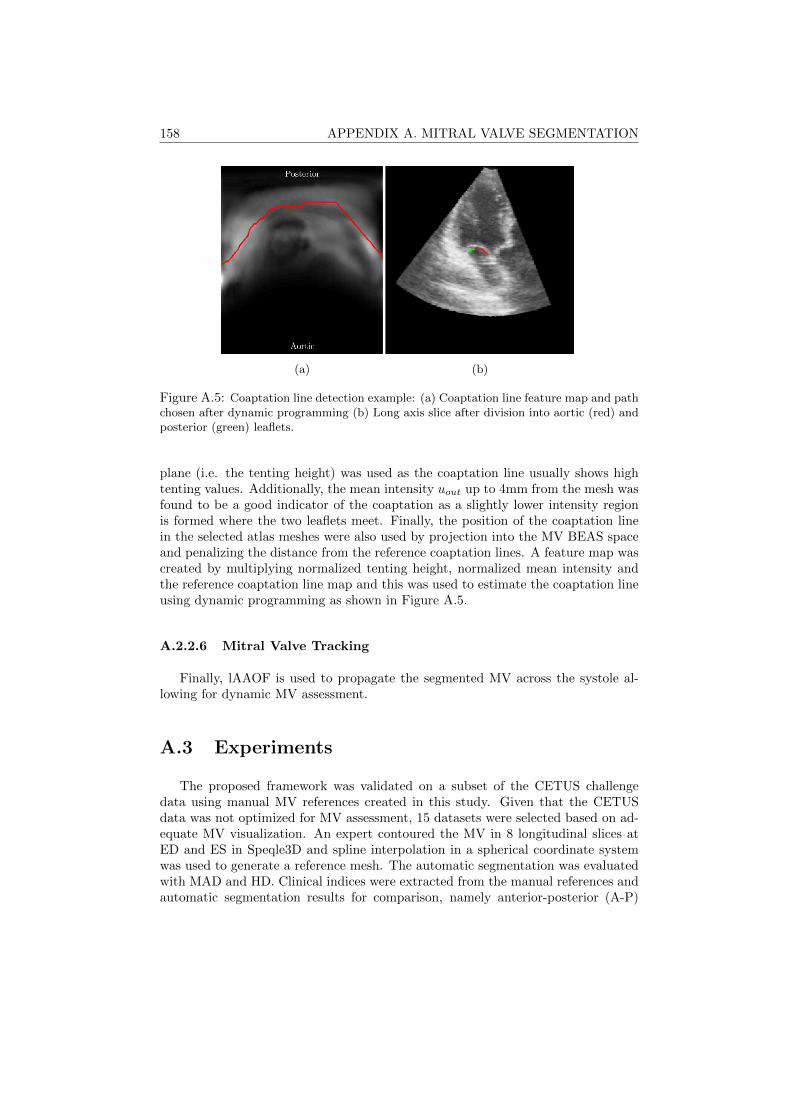
158 APPENDIX A. MITRAL VALVE SEGMENTATION
(a) (b)
Figure A.5: Coaptation line detection example: (a) Coaptation line feature map and pathchosen after dynamic programming (b) Long axis slice after division into aortic (red) andposterior (green) leaflets.
plane (i.e. the tenting height) was used as the coaptation line usually shows hightenting values. Additionally, the mean intensity uout up to 4mm from the mesh wasfound to be a good indicator of the coaptation as a slightly lower intensity regionis formed where the two leaflets meet. Finally, the position of the coaptation linein the selected atlas meshes were also used by projection into the MV BEAS spaceand penalizing the distance from the reference coaptation lines. A feature map wascreated by multiplying normalized tenting height, normalized mean intensity andthe reference coaptation line map and this was used to estimate the coaptation lineusing dynamic programming as shown in Figure A.5.
A.2.2.6 Mitral Valve Tracking
Finally, lAAOF is used to propagate the segmented MV across the systole al-lowing for dynamic MV assessment.
A.3 Experiments
The proposed framework was validated on a subset of the CETUS challengedata using manual MV references created in this study. Given that the CETUSdata was not optimized for MV assessment, 15 datasets were selected based on ad-equate MV visualization. An expert contoured the MV in 8 longitudinal slices atED and ES in Speqle3D and spline interpolation in a spherical coordinate systemwas used to generate a reference mesh. The automatic segmentation was evaluatedwith MAD and HD. Clinical indices were extracted from the manual references andautomatic segmentation results for comparison, namely anterior-posterior (A-P)
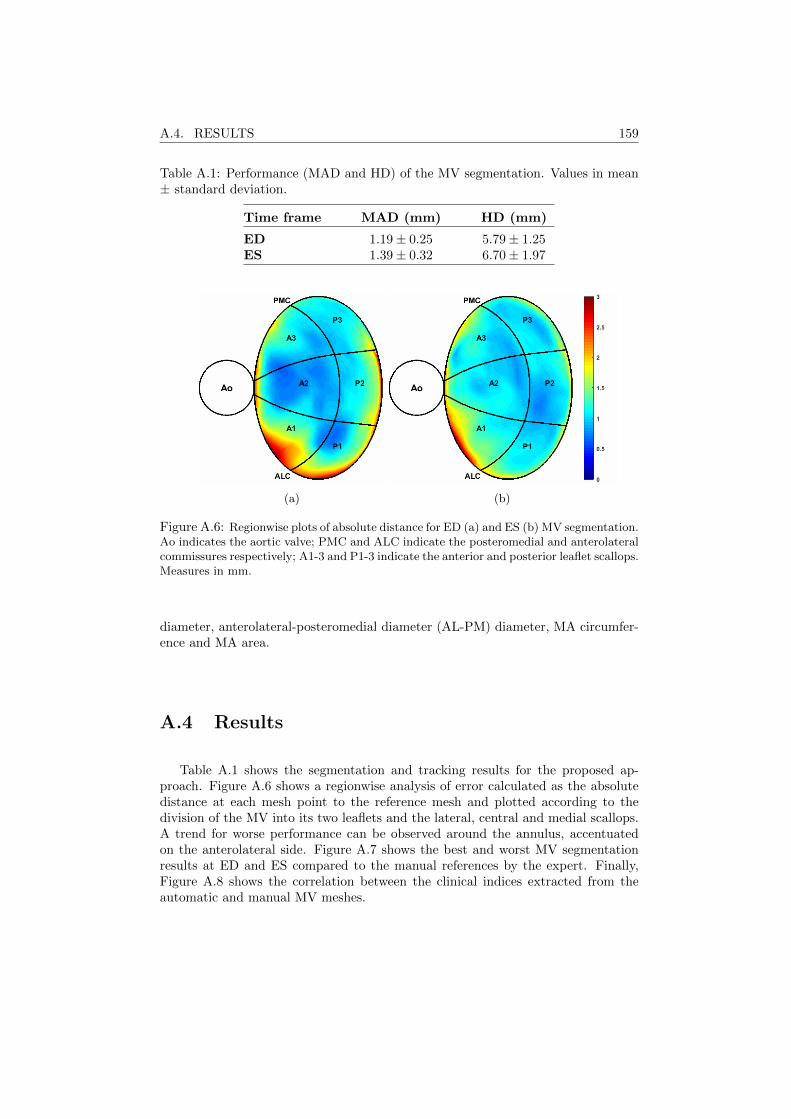
A.4. RESULTS 159
Table A.1: Performance (MAD and HD) of the MV segmentation. Values in mean± standard deviation.
Time frame MAD (mm) HD (mm)
ED 1.19± 0.25 5.79± 1.25ES 1.39± 0.32 6.70± 1.97
(a) (b)
Figure A.6: Regionwise plots of absolute distance for ED (a) and ES (b) MV segmentation.Ao indicates the aortic valve; PMC and ALC indicate the posteromedial and anterolateralcommissures respectively; A1-3 and P1-3 indicate the anterior and posterior leaflet scallops.Measures in mm.
diameter, anterolateral-posteromedial diameter (AL-PM) diameter, MA circumfer-ence and MA area.
A.4 Results
Table A.1 shows the segmentation and tracking results for the proposed ap-proach. Figure A.6 shows a regionwise analysis of error calculated as the absolutedistance at each mesh point to the reference mesh and plotted according to thedivision of the MV into its two leaflets and the lateral, central and medial scallops.A trend for worse performance can be observed around the annulus, accentuatedon the anterolateral side. Figure A.7 shows the best and worst MV segmentationresults at ED and ES compared to the manual references by the expert. Finally,Figure A.8 shows the correlation between the clinical indices extracted from theautomatic and manual MV meshes.
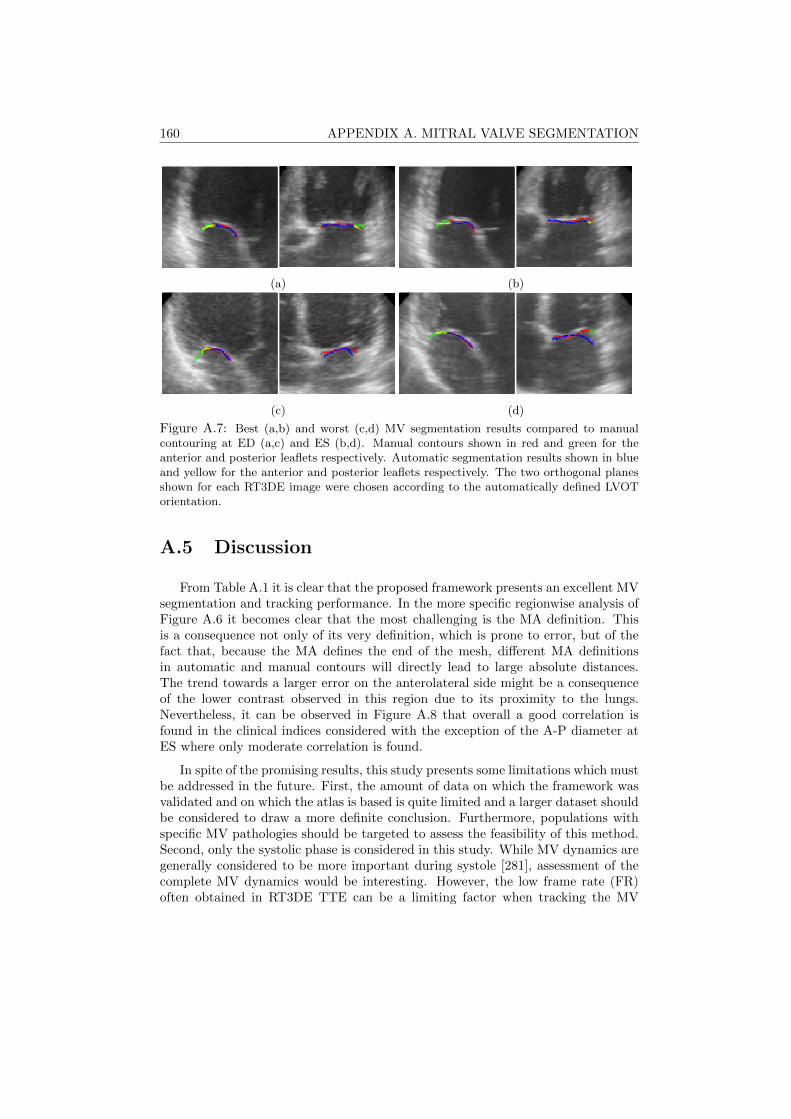
160 APPENDIX A. MITRAL VALVE SEGMENTATION
(a) (b)
(c) (d)
Figure A.7: Best (a,b) and worst (c,d) MV segmentation results compared to manualcontouring at ED (a,c) and ES (b,d). Manual contours shown in red and green for theanterior and posterior leaflets respectively. Automatic segmentation results shown in blueand yellow for the anterior and posterior leaflets respectively. The two orthogonal planesshown for each RT3DE image were chosen according to the automatically defined LVOTorientation.
A.5 Discussion
From Table A.1 it is clear that the proposed framework presents an excellent MVsegmentation and tracking performance. In the more specific regionwise analysis ofFigure A.6 it becomes clear that the most challenging is the MA definition. Thisis a consequence not only of its very definition, which is prone to error, but of thefact that, because the MA defines the end of the mesh, different MA definitionsin automatic and manual contours will directly lead to large absolute distances.The trend towards a larger error on the anterolateral side might be a consequenceof the lower contrast observed in this region due to its proximity to the lungs.Nevertheless, it can be observed in Figure A.8 that overall a good correlation isfound in the clinical indices considered with the exception of the A-P diameter atES where only moderate correlation is found.
In spite of the promising results, this study presents some limitations which mustbe addressed in the future. First, the amount of data on which the framework wasvalidated and on which the atlas is based is quite limited and a larger dataset shouldbe considered to draw a more definite conclusion. Furthermore, populations withspecific MV pathologies should be targeted to assess the feasibility of this method.Second, only the systolic phase is considered in this study. While MV dynamics aregenerally considered to be more important during systole [281], assessment of thecomplete MV dynamics would be interesting. However, the low frame rate (FR)often obtained in RT3DE TTE can be a limiting factor when tracking the MV
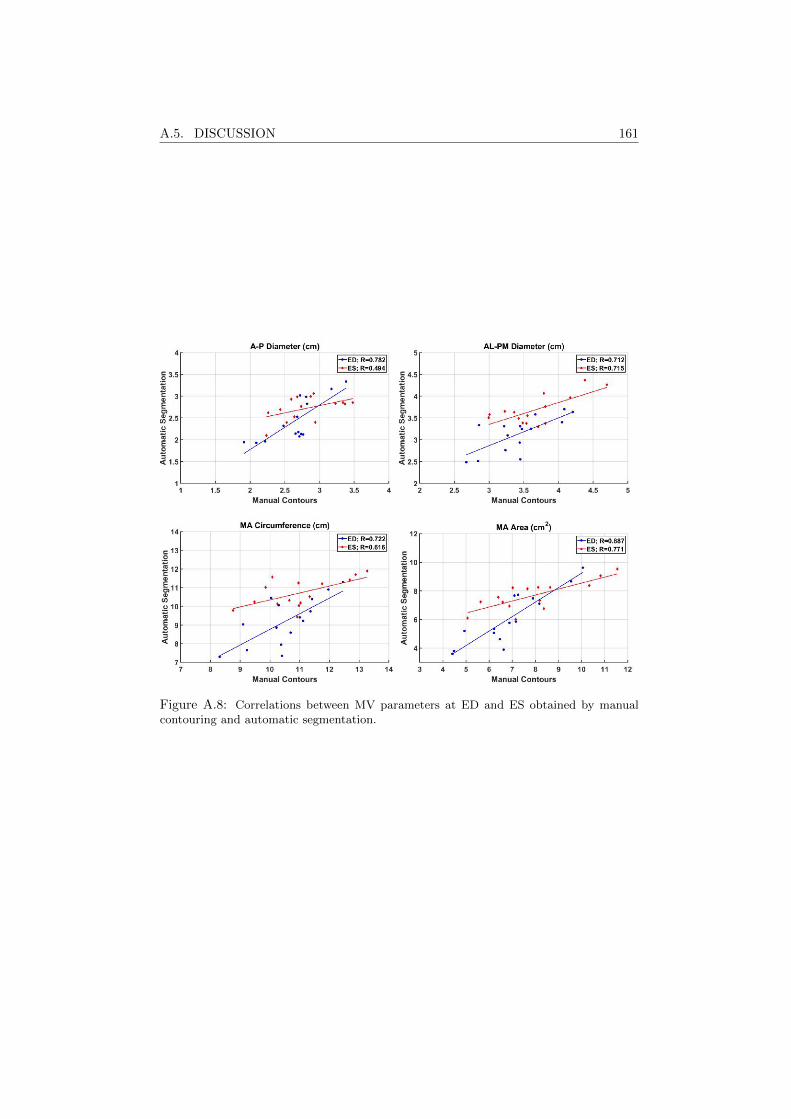
A.5. DISCUSSION 161
Figure A.8: Correlations between MV parameters at ED and ES obtained by manualcontouring and automatic segmentation.

162 BIBLIOGRAPHY
during diastole due to the very fast motion of the leaflets.
A.6 Conclusion
In this work, a novel automatic MV segmentation and tracking framework forRT3DE TTE based on BEAS and lAAOF is proposed and validated. This toolprovides dynamic systolic MV assessment, allowing for the extraction of importantclinical parameters with good correlation to those obtained from manual assess-ment.

Bibliography
[1] World Health Organization et al. Global status report on noncommunicable diseases2014: attaining the nine global noncommunicable diseases targets; a shared respon-sability. In Global status report on noncommunicable diseases 2014: attaining thenine global noncommunicable diseases targets; a shared responsability. 2014.
[2] Colin D Mathers and Dejan Loncar. Projections of global mortality and burden ofdisease from 2002 to 2030. PLoS medicine, 3(11):e442, 2006.
[3] Daniel Barbosa, Thomas Dietenbeck, Joel Schaerer, Jan D’hooge, Denis Friboulet,and Olivier Bernard. B-spline explicit active surfaces: an efficient framework forreal-time 3-D region-based segmentation. IEEE Transactions on Image Processing,21(1):241–251, 2012.
[4] Qi Duan, Elsa D Angelini, and Andrew F Laine. Real-time segmentation by activegeometric functions. Computer methods and programs in biomedicine, 98(3):223–230,2010.
[5] Authors/Task Force members, Perry M Elliott, Aris Anastasakis, Michael A Borger,Martin Borggrefe, Franco Cecchi, Philippe Charron, Albert Alain Hagege, AntoineLafont, Giuseppe Limongelli, et al. 2014 ESC guidelines on diagnosis and manage-ment of hypertrophic cardiomyopathy: the task force for the diagnosis and manage-ment of hypertrophic cardiomyopathy of the european society of cardiology (ESC).European heart journal, 35(39):2733–2779, 2014.
[6] Rick A Nishimura, Catherine M Otto, Robert O Bonow, Blase A Carabello, John PErwin, Robert A Guyton, Patrick T O’Gara, Carlos E Ruiz, Nikolaos J Skubas,Paul Sorajja, Thoralf M Sundt, and James D Thomas. 2014 AHA/ACC guidelinefor the management of patients with valvular heart disease. Journal of the AmericanCollege of Cardiology, 63(22):e57–e185, 2014.
[7] Clyde W Yancy, Mariell Jessup, Biykem Bozkurt, Javed Butler, Donald E Casey,Mark H Drazner, Gregg C Fonarow, Stephen A Geraci, Tamara Horwich, James LJanuzzi, et al. 2013 ACCF/AHA guideline for the management of heart failure:executive summary. Circulation, 128(16):1810–1852, 2013.
[8] Paul A Iaizzo. Handbook of cardiac anatomy, physiology, and devices. SpringerScience & Business Media, 2009.
[9] By adh30 revised work by DanielChangMD who revised original work of DestinyQx;Redrawn as SVG by xavax (Wikimedia Commons: Wiggers Diagram.svg) CC BY-SA 4.0, via Wikimedia Commons), 2018. https://upload.wikimedia.org/wikipedia/commons/9/91/Wiggers_Diagram_2.svg.
163

164 BIBLIOGRAPHY
[10] Manuel D Cerqueira, Neil J Weissman, Vasken Dilsizian, Alice K Jacobs, SanjivKaul, Warren K Laskey, Dudley J Pennell, John A Rumberger, Thomas Ryan, andMario S Verani. Standardized myocardial segmentation and nomenclature for to-mographic imaging of the heart: a statement for healthcare professionals from thecardiac imaging committee of the council on clinical cardiology of the american heartassociation. Journal of the American Society of Echocardiography, 15(5):463–467,2002.
[11] Joaquin F Pombo, Bart L Troy, and Richard O Russell. Left ventricular volumesand ejection fraction by echocardiography. Circulation, 43(4):480–490, 1971.
[12] James D Thomas and Zoran B Popovic. Assessment of left ventricular function bycardiac ultrasound. Journal of the American College of Cardiology, 48(10):2012 –2025, 2006. Focus Issue: Cardiac Imaging.
[13] Harvey D White, Robin M Norris, Michael A Brown, Peter W Brandt, Ralph MLWhitlock, and Christopher J Wild. Left ventricular end-systolic volume as the ma-jor determinant of survival after recovery from myocardial infarction. Circulation,76(1):44–51, 1987.
[14] Robin M Norris, Harvey D White, David B Cross, Christopher J Wild, and Ralph MLWhitlock. Prognosis after recovery from myocardial infarction: the relative im-portance of cardiac dilatation and coronary stenoses. European heart journal,13(12):1611–1618, 1992.
[15] Robert J Burns, Raymond J Gibbons, Qilong Yi, Robin S Roberts, Todd D Miller,Gary L Schaer, Jeffrey L Anderson, and Salim Yusuf. The relationships of left ven-tricular ejection fraction, end-systolic volume index and infarct size to six-monthmortality after hospital discharge following myocardial infarction treated by throm-bolysis. Journal of the American College of Cardiology, 39(1):30 – 36, 2002.
[16] The Multicenter Postinfarction Research Group. Risk stratification and survivalafter myocardial infarction. New England Journal of Medicine, 309(6):331–336, 1983.PMID: 6866068.
[17] Jean L Rouleau, Mario Talajic, Bruce Sussex, Louise Potvin, Wayne Warnica,Richard F Davies, Martin Gardner, Duncan Stewart, Sylvain Plante, Robert Dupuis,Claude Lauzon, John Ferguson, Etel Mikes, Vidoslav Balnozan, and Pierre Savard.Myocardial infarction patients in the 1990s - their risk factors, stratification and sur-vival in canada: The canadian assessment of myocardial infarction (CAMI) study.Journal of the American College of Cardiology, 27(5):1119 – 1127, 1996.
[18] Maria Teresa La Rovere, Gian Domenico Pinna, Stefan H Hohnloser, Frank I Marcus,Andrea Mortara, Ryuji Nohara, J Thomas Bigger, A John Camm, and Peter JSchwartz. Baroreflex sensitivity and heart rate variability in the identification ofpatients at risk for life-threatening arrhythmias. Circulation, 103(16):2072–2077,2001.
[19] Derek V Exner, Katherine M Kavanagh, Michael P Slawnych, L Brent Mitchell,Darlene Ramadan, Sandeep G Aggarwal, Catherine Noullett, Allie Van Schaik,Ryan T Mitchell, Mariko A Shibata, Sajad Gulamhussein, James McMeekin, WayneTymchak, Gregory Schnell, Anne M Gillis, Robert S Sheldon, Gordon H Fick, andHenry J Duff. Noninvasive risk assessment early after a myocardial infarction: TheREFINE study. Journal of the American College of Cardiology, 50(24):2275 – 2284,2007.
BIBLIOGRAPHY 165
[20] Axel Bauer, Petra Barthel, Raphael Schneider, Kurt Ulm, Alexander Muller, AnkeJoeinig, Raphael Stich, Antti Kiviniemi, Katerina Hnatkova, Heikki Huikuri, AlbertSchomig, Marek Malik, and Georg Schmidt. Improved stratification of autonomicregulation for risk prediction in post-infarction patients with preserved left ventric-ular function (ISAR-Risk). European Heart Journal, 30(5):576–583, 2009.
[21] Eldrin F Lewis, Lemuel A Moye, Jean L Rouleau, Frank M Sacks, J Malcolm OArnold, J Wayne Warnica, Greg C Flaker, Eugene Braunwald, and Marc A Pfef-fer. Predictors of late development of heart failure in stable survivors of myocar-dial infarction: The CARE study. Journal of the American College of Cardiology,42(8):1446 – 1453, 2003.
[22] Al Hallstrom, Craig M Pratt, H Leon Greene, Melissa Huther, Stephen Gottlieb,Anthony DeMaria, and James B Young. Relations between heart failure, ejectionfraction, arrhythmia suppression and mortality: Analysis of the cardiac arrhythmiasuppression trial. Journal of the American College of Cardiology, 25(6):1250 – 1257,1995.
[23] Alfred E Buxton, Kerry L Lee, Gail E Hafley, Luis A Pires, John D Fisher, Michael RGold, Mark E Josephson, Michael H Lehmann, and Eric N Prystowsky. Limitationsof ejection fraction for prediction of sudden death risk in patients with coronaryartery disease: Lessons from the MUSTT study. Journal of the American College ofCardiology, 50(12):1150 – 1157, 2007.
[24] Theophilus E Owan, David O Hodge, Regina M Herges, Steven J Jacobsen,Veronique L Roger, and Margaret M Redfield. Trends in prevalence and outcomeof heart failure with preserved ejection fraction. New England Journal of Medicine,355(3):251–259, 2006. PMID: 16855265.
[25] R Sacha Bhatia, Jack V Tu, Douglas S Lee, Peter C Austin, Jiming Fang, AnnickHaouzi, Yanyan Gong, and Peter P Liu. Outcome of heart failure with preservedejection fraction in a population-based study. New England Journal of Medicine,355(3):260–269, 2006. PMID: 16855266.
[26] Jithendra B Somaratne, Colin Berry, John JV McMurray, Katrina K Poppe,Robert N Doughty, and Gillian A Whalley. The prognostic significance of heart fail-ure with preserved left ventricular ejection fraction: a literature-based meta-analysis.European journal of heart failure, 11(9):855–862, 2009.
[27] Meta-analysis Global Group in Chronic Heart Failure (MAGGIC). The survival ofpatients with heart failure with preserved or reduced left ventricular ejection fraction:an individual patient data meta-analysis. European Heart Journal, 33(14):1750–1757,2012.
[28] M Komadja, JP Jais, F Reeves, B Goldfarb, JB Bouhour, Y Juillieres, J Lanfranchi,P Peycelon, P Geslin, D Carrie, and Y Grosgogeat. Factors predicting mortality inidiopathic dilated cardiomyopathy. European Heart Journal, 11(9):824–831, 1990.
[29] CS Rihal, RA Nishimura, LK Hatle, KR Bailey, and AJ Tajik. Systolic and diastolicdysfunction in patients with clinical diagnosis of dilated cardiomyopathy. relation tosymptoms and prognosis. Circulation, 90(6):2772–2779, 1994.
[30] Pantaleo Giannuzzi, Pier L Temporelli, Enzo Bosimini, Pedro Silva, Alessandro Im-parato, Ugo Corra, Michele Galli, and Amerigo Giordano. Independent and incre-mental prognostic value of doppler-derived mitral deceleration time of early fillingin both symptomatic and asymptomatic patients with left ventricular dysfunction.Journal of the American College of Cardiology, 28(2):383 – 390, 1996.
166 BIBLIOGRAPHY
[31] Shigeki Yamada, Hideki Ishii, Hiroshi Takahashi, Toru Aoyama, Yasuhiro Morita,Hirotake Kasuga, Keiko Kimura, Yutaka Ito, Ryo Takahashi, Takanobu Toriyama,Yoshinari Yasuda, Mutsuharu Hayashi, Hideki Kamiya, Yukio Yuzawa, ShoichiMaruyama, Seiichi Matsuo, Tatsuaki Matsubara, and Toyoaki Murohara. Prognosticvalue of reduced left ventricular ejection fraction at start of hemodialysis therapy oncardiovascular and all-cause mortality in end-stage renal disease patients. ClinicalJournal of the American Society of Nephrology, 5(10):1793–1798, 2010.
[32] Tali Sharir, Guido Germano, Paul B Kavanagh, Shenhan Lai, Ishac Cohen,Howard C Lewin, John D Friedman, Michael J Zellweger, and Daniel S Berman.Incremental prognostic value of post-stress left ventricular ejection fraction and vol-ume by gated myocardial perfusion single photon emission computed tomography.Circulation, 100(10):1035–1042, 1999.
[33] Janine Krivokapich, John S Child, Donald O Walter, and Alan Garfinkel. Prognosticvalue of dobutamine stress echocardiography in predicting cardiac events in patientswith known or suspected coronary artery disease. Journal of the American Collegeof Cardiology, 33(3):708 – 716, 1999.
[34] Nicholas G Bellenger, Malcolm I Burgess, Simon G Ray, Avijit Lahiri, Andrew JSCoats, John GF Cleland, and Dudley J Pennell. Comparison of left ventricularejection fraction and volumes in heart failure by echocardiography, radionuclideventriculography and cardiovascular magnetic resonance. Are they interchangeable?European heart journal, 21(16):1387–1396, 2000.
[35] Frans JT Wackers, Harvey J Berger, David E Johnstone, Lee Goldman, Lawrence AReduto, Rene A Langou, Alexander Gottschalk, Barry L Zaret, Lenny Quartararo,and Linda Pytlik. Multiple gated cardiac blood pool imaging for left ventricularejection fraction: Validation of the technique and assessment of variability. TheAmerican Journal of Cardiology, 43(6):1159 – 1166, 1979.
[36] Ronald G Schwartz, William B McKenzie, Jonathan Alexander, Philip Sager, An-thony D’Souza, Amita Manatunga, Peter E Schwartz, Harvey J Berger, John Se-taro, Lee Surkin, et al. Congestive heart failure and left ventricular dysfunctioncomplicating doxorubicin therapy: seven-year experience using serial radionuclideangiocardiography. The American Journal of Medicine, 82(6):1109–1118, 1987.
[37] Tom R Miller, Jerold W Wallis, Brian R Landy, Robert J Gropler, and Chander LSabharwal. Measurement of global and regional left ventricular function by cardiacPET. Journal of Nuclear Medicine, 35(6):999–1005, 1994.
[38] Robert O Bonow, Vasken Dilsizian, Alberto Cuocolo, and Stephen L Bacharach.Identification of viable myocardium in patients with chronic coronary artery diseaseand left ventricular dysfunction. Comparison of thallium scintigraphy with reinjec-tion and PET imaging with 18F-fluorodeoxyglucose. Circulation, 83(1):26–37, 1991.
[39] Thomas L Szabo. Diagnostic ultrasound imaging: inside out. Academic Press, 2004.
[40] Paul Suetens. Fundamentals of medical imaging. Cambridge University Press, 2002.
[41] Siddharth Singh and Abha Goyal. The origin of echocardiography: a tribute to IngeEdler. Texas Heart Institute Journal, 34(4):431, 2007.
[42] Richard L Popp, Stanley B Wolfe, Tsuneo Hirata, and Harvey Feigenbaum. Estima-tion of right and left ventricular size by ultrasound: A study of the echoes from theinterventricular septum. The American journal of cardiology, 24(4):523–530, 1969.
BIBLIOGRAPHY 167
[43] Harvey Feigenbaum, Richard L Popp, Stanley B Wolfe, Bart L Troy, Joaquin FPombo, Charles L Haine, and Harold T Dodge. Ultrasound measurements of the leftventricle: a correlative study with angiocardiography. Archives of Internal Medicine,129(3):461–467, 1972.
[44] Horace L Wyatt, Ming K Heng, Samuel Meerbaum, Pascal Gueret, John Hestenes,Eugene Dula, and Eliot Corday. Cross-sectional echocardiography. II. Analysis ofmathematic models for quantifying volume of the formalin-fixed left ventricle. Cir-culation, 61(6):1119–1125, 1980.
[45] Horace L Wyatt, Samuel Meerbaum, Ming K Heng, Pascal Gueret, and Eliot Corday.Cross-sectional echocardiography III. Analysis of mathematic models for quantify-ing volume of symmetric and asymmetric left ventricles. American heart journal,100(6):821–828, 1980.
[46] Shougang Wang, Wei-Ning Lee, Jean Provost, Jianwen Luo, and Elisa E Konofagou.A composite high-frame-rate system for clinical cardiovascular imaging. IEEE trans-actions on ultrasonics, ferroelectrics, and frequency control, 55(10), 2008.
[47] David P Shattuck, Marc D Weinshenker, Stephen W Smith, and Olaf T von Ramm.Explososcan: A parallel processing technique for high speed ultrasound imaging withlinear phased arrays. The Journal of the Acoustical Society of America, 75(4):1273–1282, 1984.
[48] Toshio Shirasaka. Ultrasonic imaging apparatus, March 21 1989. US Patent4,815,043.
[49] Raoul Mallart and Mathias Fink. Improved imaging rate through simultaneoustransmission of several ultrasound beams. In New Developments in Ultrasonic Trans-ducers and Transducer Systems, volume 1733, pages 120–131. International Societyfor Optics and Photonics, 1992.
[50] Alessandro Ramalli, Alessandro Dallai, Enrico Boni, Luca Bassi, Valentino Meacci,Matteo Giovannetti, Ling Tong, Jan D’hooge, and Piero Tortoli. Multi transmitbeams for fast cardiac imaging towards clinical routine. In Ultrasonics Symposium(IUS), 2016 IEEE International, pages 1–4. IEEE, 2016.
[51] Alejandra Ortega, Jean Provost, Ling Tong, Pedro Santos, Brecht Heyde, MathieuPernot, and Jan D’hooge. A comparison of the performance of different multilinetransmit setups for fast volumetric cardiac ultrasound. IEEE transactions on ultra-sonics, ferroelectrics, and frequency control, 63(12):2082–2091, 2016.
[52] B Delannoy, R Torguet, C Bruneel, E Bridoux, JM Rouvaen, and H Lasota. Acous-tical image reconstruction in parallel-processing analog electronic systems. Journalof Applied Physics, 50(5):3153–3159, 1979.
[53] Jesper Udesen, Fredrik Gran, Kristoffer Lindskov Hansen, Jørgen Arendt Jensen,Carsten Thomsen, and Michael Bachmann Nielsen. High frame-rate blood vectorvelocity imaging using plane waves: Simulations and preliminary experiments. IEEEtransactions on ultrasonics, ferroelectrics, and frequency control, 55(8):1729–1743,2008.
[54] Mathieu Couade, Mathieu Pernot, Mickael Tanter, Emmanuel Messas, Alain Bel,Maguette Ba, Albert-Alain Hagege, and Mathias Fink. Ultrafast imaging of theheart using circular wave synthetic imaging with phased arrays. In UltrasonicsSymposium (IUS), 2009 IEEE International, pages 515–518. IEEE, 2009.

168 BIBLIOGRAPHY
[55] Hideyuki Hasegawa and Hiroshi Kanai. High-frame-rate echocardiography usingdiverging transmit beams and parallel receive beamforming. Journal of medicalultrasonics, 38(3):129–140, 2011.
[56] Jean Provost, Vu Thanh-Hieu Nguyen, Diego Legrand, Stan Okrasinski, AlexandreCostet, Alok Gambhir, Hasan Garan, and Elisa E Konofagou. Electromechanicalwave imaging for arrhythmias. Physics in Medicine & Biology, 56(22):L1, 2011.
[57] Clement Papadacci, Mathieu Pernot, Mathieu Couade, Mathias Fink, and MickaelTanter. High-contrast ultrafast imaging of the heart. IEEE transactions on ultra-sonics, ferroelectrics, and frequency control, 61(2):288–301, 2014.
[58] Gregg E Trahey and Levin F Nock. Synthetic receive aperture imaging with phasecorrection for motion and for tissue inhomogeneities. II. Effects of and correctionfor motion. IEEE transactions on ultrasonics, ferroelectrics, and frequency control,39(4):496–501, 1992.
[59] Maja Cikes, Ling Tong, George R Sutherland, and Jan D’hooge. Ultrafast cardiacultrasound imaging: technical principles, applications, and clinical benefits. JACC:Cardiovascular Imaging, 7(8):812–823, 2014.
[60] Mickael Tanter and Mathias Fink. Ultrafast imaging in biomedical ultrasound.IEEE transactions on ultrasonics, ferroelectrics, and frequency control, 61(1):102–119, 2014.
[61] Hiroshi Kanai and Yoshiro Koiwa. Myocardial rapid velocity distribution. Ultrasoundin Medicine and Biology, 27(4):481–498, 2001.
[62] Mathieu Pernot and Elisa E Konofagou. Electromechanical imaging of the my-ocardium at normal and pathological states. In Ultrasonics Symposium, 2005 IEEE,volume 2, pages 1091–1094. IEEE, 2005.
[63] Jean Provost, Wei-Ning Lee, Kana Fujikura, and Elisa E Konofagou. Imaging theelectromechanical activity of the heart in vivo. Proceedings of the National Academyof Sciences, 108(21):8565–8570, 2011.
[64] Aaron Fenster, Donal B Downey, and H Neale Cardinal. Three-dimensional ultra-sound imaging. Physics in medicine & biology, 46(5):R67, 2001.
[65] Don L Dekker, Robert L Piziali, and Eugene Dong Jr. A system for ultrasonicallyimaging the human heart in three dimensions. Computers and biomedical research,7(6):544–553, 1974.
[66] Jeffery C Bamber, Robert J Eckersley, P Hubregtse, Nigel L Bush, David S Bell,and Diane C Crawford. Data processing for 3-D ultrasound visualization of tumoranatomy and blood flow. In Visualization in Biomedical Computing’92, volume 1808,pages 651–664. International Society for Optics and Photonics, 1992.
[67] Donal B Downey and Aaron Fenster. Vascular imaging with a three-dimensionalpower doppler system. AJR. American Journal of Roentgenology, 165(3):665–668,1995.
[68] Odd Helge Gilja, Nils Thune, Knut Matre, Trygve Hausken, Arnold Berstad, et al.In vitro evaluation of three-dimensional ultrasonography in volume estimation ofabdominal organs. Ultrasound in medicine & biology, 20(2):157–165, 1994.
[69] Alain Delabays, Natesa G Pandian, Qi-Ling Cao, Lissa Sugeng, Gerald Marx, AchiLudomirski, and Steven L Schwartz. Transthoracic real-time three-dimensionalechocardiography using a fan-like scanning approach for data acquisition. Echocar-diography, 12(1):49–59, 1995.
BIBLIOGRAPHY 169
[70] Tracy L Elliot, Donal B Downey, Shidong Tong, Carolyn A McLean, and AaronFenster. Accuracy of prostate volume measurements in vitro using three-dimensionalultrasound. Academic radiology, 3(5):401–406, 1996.
[71] Shidong Tong, Donal B Downey, H Neale Cardinal, and Aaron Fenster. A three-dimensional ultrasound prostate imaging system. Ultrasound in medicine & biology,22(6):735–746, 1996.
[72] Stephen W Smith, Henry G Pavy, and Olaf T von Ramm. High-speed ultrasoundvolumetric imaging system. I. Transducer design and beam steering. IEEE transac-tions on ultrasonics, ferroelectrics, and frequency control, 38(2):100–108, 1991.
[73] Olaf T Von Ramm, Stephen W Smith, and Henry G Pavy. High-speed ultrasoundvolumetric imaging system. II. Parallel processing and image display. IEEE trans-actions on ultrasonics, ferroelectrics, and frequency control, 38(2):109–115, 1991.
[74] Judy Hung, Roberto Lang, Frank Flachskampf, Stanton K Shernan, Marti L Mc-Culloch, David B Adams, James Thomas, Mani Vannan, and Thomas Ryan. 3Dechocardiography: a review of the current status and future directions. Journal ofthe American Society of Echocardiography, 20(3):213–233, 2007.
[75] J Alison Noble and Djamal Boukerroui. Ultrasound image segmentation: a survey.IEEE Transactions on medical imaging, 25(8):987–1010, 2006.
[76] KY Esther Leung and Johan G Bosch. Automated border detection in three-dimensional echocardiography: principles and promises. European journal ofechocardiography, 11(2):97–108, 2010.
[77] Olivier Gerard, Antoine Collet Billon, Jean-Michel Rouet, Miarie Jacob, MaximFradkin, and Cyril Allouche. Efficient model-based quantification of left ventric-ular function in 3-D echocardiography. IEEE transactions on medical imaging,21(9):1059–1068, 2002.
[78] Johan Montagnat, Maxime Sermesant, Herve Delingette, Gregoire Malandain, andNicholas Ayache. Anisotropic filtering for model-based segmentation of 4D cylindri-cal echocardiographic images. Pattern Recognition Letters, 24(4-5):815–828, 2003.
[79] Vladimir Zagrodsky, Vivek Walimbe, Carlos R Castro-Pareja, Jian Xin Qin, Jong-Min Song, and Raj Shekhar. Registration-assisted segmentation of real-time 3-Dechocardiographic data using deformable models. IEEE Transactions on MedicalImaging, 24(9):1089–1099, 2005.
[80] Maartje M Nillesen, Richard GP Lopata, Inge H Gerrits, Livia Kapusta, Henkjan JHuisman, Johan M Thijssen, and Chris L de Korte. Segmentation of the heart musclein 3-D pediatric echocardiographic images. Ultrasound in Medicine and Biology,33(9):1453–1462, 2007.
[81] Elsa D Angelini, Andrew F Laine, Shin Takuma, Jeffrey W Holmes, and ShunichiHomma. LV volume quantification via spatiotemporal analysis of real-time 3-Dechocardiography. IEEE Transactions on Medical Imaging, 20(6):457–469, 2001.
[82] Xenophon Papademetris, Albert J Sinusas, Donald P Dione, and James S Duncan.Estimation of 3D left ventricular deformation from echocardiography. Medical imageanalysis, 5(1):17–28, 2001.
[83] Djamal Boukerroui, Olivier Basset, Atilla Baskurt, and Gerard Gimenez. A multi-parametric and multiresolution segmentation algorithm of 3D ultrasonic data. IEEEtransactions on ultrasonics, ferroelectrics, and frequency control, 48(1):64–77, 2001.

170 BIBLIOGRAPHY
[84] Yun Zhu, Xenophon Papademetris, Albert Sinusas, and James S Duncan. Segmen-tation of myocardial volumes from real-time 3D echocardiography using an incom-pressibility constraint. In International Conference on Medical Image Computingand Computer-Assisted Intervention, pages 44–51. Springer, 2007.
[85] Xujiong Ye, J Alison Noble, and David Atkinson. 3-D freehand echocardiographyfor automatic left ventricle reconstruction and analysis based on multiple acousticwindows. IEEE transactions on medical imaging, 21(9):1051–1058, 2002.
[86] Elsa D Angelini, Shunichi Homma, Gregory Pearson, Jeffrey W Holmes, and An-drew F Laine. Segmentation of real-time three-dimensional ultrasound for quantifi-cation of ventricular function: a clinical study on right and left ventricles. Ultrasoundin Medicine and Biology, 31(9):1143–1158, 2005.
[87] Cristiana Corsi, Giuseppe Saracino, Alessandro Sarti, and Claudio Lamberti. Leftventricular volume estimation for real-time three-dimensional echocardiography.IEEE transactions on medical imaging, 21(9):1202–1208, 2002.
[88] Ning Lin, Weichuan Yu, and James S Duncan. Combinative multi-scale level setframework for echocardiographic image segmentation. Medical Image Analysis,7(4):529–537, 2003.
[89] Alessandro Sarti, Cristiana Corsi, Elena Mazzini, and Claudio Lamberti. Max-imum likelihood segmentation of ultrasound images with Rayleigh distribution.IEEE transactions on ultrasonics, ferroelectrics, and frequency control, 52(6):947–960, 2005.
[90] Enrico G Caiani, Cristiana Corsi, Jose Zamorano, Lissa Sugeng, Peter MacEneaney,Lynn Weinert, Roberto Battani, Juan Luis Gutierrez, Rick Koch, Leopoldo Perezde Isla, et al. Improved semiautomated quantification of left ventricular volumesand ejection fraction using 3-dimensional echocardiography with a full matrix-arraytransducer: comparison with magnetic resonance imaging. Journal of the AmericanSociety of Echocardiography, 18(8):779–788, 2005.
[91] Meng Ma, Marijn van Stralen, Johan HC Reiber, Johan G Bosch, and Boudewijn PFLelieveldt. Left ventricle segmentation from contrast enhanced fast rotating ultra-sound images using three dimensional active shape models. In International Con-ference on Functional Imaging and Modeling of the Heart, pages 295–302. Springer,2009.
[92] Meng Ma, Marijn van Stralen, Johan HC Reiber, Johan G Bosch, and Boudewijn PFLelieveldt. Model driven quantification of left ventricular function from sparse single-beat 3D echocardiography. Medical image analysis, 14(4):582–593, 2010.
[93] Jøger Hansegard, Fredrik Orderud, and Stein I Rabben. Real-time active shapemodels for segmentation of 3D cardiac ultrasound. In International Conference onComputer Analysis of Images and Patterns, pages 157–164. Springer, 2007.
[94] Jøger Hansegard, Stig Urheim, Ketil Lunde, and Stein Inge Rabben. Constrainedactive appearance models for segmentation of triplane echocardiograms. IEEE trans-actions on medical imaging, 26(10):1391–1400, 2007.
[95] HS Wu, D Wang, L Shi, and CM Yu. Automatic segmentation of left ventricle in 3Dechocardiography using a level set approach. International Journal of Cardiology,164(2):S12–S13, 2013.
[96] KY Esther Leung, Marijn van Stralen, Marco M Voormolen, Nico de Jong, Anto-nius FW van der Steen, Johan HC Reiber, and Johan G Bosch. Improving 3D active
BIBLIOGRAPHY 171
appearance model segmentation of the left ventricle with jacobian tuning. In MedicalImaging 2008: Image Processing, volume 6914, page 69143B. International Societyfor Optics and Photonics, 2008.
[97] Giuseppe Coppini, Riccardo Poli, and Guido Valli. Recovery of the 3-D shape ofthe left ventricle from echocardiographic images. IEEE Transactions on MedicalImaging, 14(2):301–317, 1995.
[98] Mingzhou Song, Robert M Haralick, Florence H Sheehan, and Richard K Johnson.Integrated surface model optimization for freehand three-dimensional echocardiog-raphy. IEEE transactions on medical imaging, 21(9):1077–1090, 2002.
[99] Bogdan Georgescu, Xiang Sean Zhou, Dorin Comaniciu, and Alok Gupta. Database-guided segmentation of anatomical structures with complex appearance. In IEEEComputer Society Conference on Computer Vision and Pattern Recognition, 2005.CVPR 2005., volume 2, pages 429–436. IEEE, 2005.
[100] Xiaoguang Lu, Bogdan Georgescu, Yefeng Zheng, Joanne Otsuki, and Dorin Comani-ciu. AutoMPR: Automatic detection of standard planes in 3D echocardiography. In5th IEEE International Symposium on Biomedical Imaging: From Nano to Macro,2008. ISBI 2008., pages 1279–1282. IEEE, 2008.
[101] Andriy Myronenko, Xubo Song, and David J Sahn. LV motion tracking from 3Dechocardiography using textural and structural information. In International Con-ference on Medical Image Computing and Computer-Assisted Intervention, pages428–435. Springer, 2007.
[102] An Elen, Hon Fai Choi, Dirk Loeckx, Hang Gao, Piet Claus, Paul Suetens, Fred-erik Maes, and Jan D’hooge. Three-dimensional cardiac strain estimation usingspatio–temporal elastic registration of ultrasound images: A feasibility study. IEEEtransactions on medical imaging, 27(11):1580–1591, 2008.
[103] Brecht Heyde, Daniel Barbosa, Piet Claus, Frederik Maes, and Jan D’hooge. Three-dimensional cardiac motion estimation based on non-rigid image registration usinga novel transformation model adapted to the heart. In International Workshop onStatistical Atlases and Computational Models of the Heart, pages 142–150. Springer,2012.
[104] Gemma Piella, Antonio R Porras, Mathieu De Craene, Nicolas Duchateau, and Ale-jandro F Frangi. Temporal diffeomorphic free form deformation to quantify changesinduced by left and right bundle branch block and pacing. In International Work-shop on Statistical Atlases and Computational Models of the Heart, pages 134–141.Springer, 2012.
[105] Leopoldo Perez de Isla, David Vivas Balcones, Covadonga Fernandez-Golfın, Pe-dro Marcos-Alberca, Carlos Almerıa, Jose Luis Rodrigo, Carlos Macaya, and JoseZamorano. Three-dimensional-wall motion tracking: a new and faster tool for my-ocardial strain assessment: comparison with two-dimensional-wall motion tracking.Journal of the American Society of Echocardiography, 22(4):325–330, 2009.
[106] Patricia Reant, Laurence Barbot, Cecile Touche, Marina Dijos, Florence Arsac,Xavier Pillois, Mathieu Landelle, Raymond Roudaut, and Stephane Lafitte. Eval-uation of global left ventricular systolic function using three-dimensional echocar-diography speckle-tracking strain parameters. Journal of the American Society ofEchocardiography, 25(1):68–79, 2012.
[107] Ken Saito, Hiroyuki Okura, Nozomi Watanabe, Akihiro Hayashida, Kikuko Obase,Koichiro Imai, Tomoko Maehama, Takahiro Kawamoto, Yoji Neishi, and Kiyoshi
172 BIBLIOGRAPHY
Yoshida. Comprehensive evaluation of left ventricular strain using speckle track-ing echocardiography in normal adults: comparison of three-dimensional and two-dimensional approaches. Journal of the American Society of Echocardiography,22(9):1025–1030, 2009.
[108] Jonas Crosby, Brage H Amundsen, Torbjørn Hergum, Espen W Remme, Stian Lan-geland, and Hans Torp. 3-D speckle tracking for assessment of regional left ventric-ular function. Ultrasound in Medicine and Biology, 35(3):458–471, 2009.
[109] Yoshihiro Seo, Tomoko Ishizu, Yoshiharu Enomoto, Haruhiko Sugimori, and Kazu-taka Aonuma. Endocardial surface area tracking for assessment of regional LV walldeformation with 3D speckle tracking imaging. JACC: Cardiovascular Imaging,4(4):358–365, 2011.
[110] Lennart Tautz, Anja Hennemuth, and Heinz-Otto Peitgen. Quadrature filter basedmotion analysis for 3D ultrasound sequences. In International Workshop on Sta-tistical Atlases and Computational Models of the Heart, pages 169–177. Springer,2012.
[111] Martino Alessandrini, Herve Liebgott, Daniel Barbosa, and Olivier Bernard. Mono-genic phase based optical flow computation for myocardial motion analysis in 3Dechocardiography. In International Workshop on Statistical Atlases and Computa-tional Models of the Heart, pages 159–168. Springer, 2012.
[112] Oudom Somphone, Cecile Dufour, Benoıt Mory, Loıc Hilpert, Sherif Makram-Ebeid,Nicolas Villain, Mathieu De Craene, Pascal Allain, and Eric Saloux. Motion esti-mation in 3D echocardiography using smooth field registration. In InternationalWorkshop on Statistical Atlases and Computational Models of the Heart, pages 151–158. Springer, 2012.
[113] Qi Duan, Elsa D Angelini, Susan L Herz, Christopher M Ingrassia, Kevin D Costa,Jeffrey W Holmes, Shunichi Homma, and Andrew F Laine. Region-based endo-cardium tracking on real-time three-dimensional ultrasound. Ultrasound in Medicineand Biology, 35(2):256–265, 2009.
[114] Olivier Bernard, Johan G Bosch, Brecht Heyde, Martino Alessandrini, Daniel Bar-bosa, Sorina Camarasu-Pop, Frederic Cervenansky, Sebastien Valette, Oana Mirea,Michel Bernier, et al. Standardized evaluation system for left ventricular segmen-tation algorithms in 3D echocardiography. IEEE transactions on medical imaging,35(4):967–977, 2016.
[115] Daniel Barbosa, Denis Friboulet, Jan D’hooge, and Olivier Bernard. Fast tracking ofthe left ventricle using global anatomical affine optical flow and local recursive blockmatching. Proceedings of the MICCAI Challenge on Endocardial Three-dimensionalUltrasound Segmentation-CETUS, pages 17–24, 2014.
[116] Erik Smistad and Frank Lindseth. Real-time tracking of the left ventricle in 3D ultra-sound using Kalman filter and mean value coordinates. Medical Image Segmentationfor Improved Surgical Navigation, page 189, 2014.
[117] Denisa Muraru, Umberto Cucchini, Sorina Mihaila, Marcelo Haertel Miglioranza,Patrizia Aruta, Giacomo Cavalli, Antonella Cecchetto, Seena Padayattil-Jose,Diletta Peluso, Sabino Iliceto, et al. Left ventricular myocardial strain by three-dimensional speckle-tracking echocardiography in healthy subjects: reference valuesand analysis of their physiologic and technical determinants. Journal of the AmericanSociety of Echocardiography, 27(8):858–871, 2014.
BIBLIOGRAPHY 173
[118] Lawrence D Jacobs, Ivan S Salgo, Sascha Goonewardena, Lynn Weinert, PatrickCoon, Dianna Bardo, Olivier Gerard, Pascal Allain, Jose L Zamorano, Leopoldo Pde Isla, et al. Rapid online quantification of left ventricular volume from real-timethree-dimensional echocardiographic data. European Heart Journal, 27(4):460–468,2005.
[119] Sebastiaan A Kleijn, Mohamed FA Aly, Caroline B Terwee, Albert C van Rossum,and Otto Kamp. Comparison between direct volumetric and speckle trackingmethodologies for left ventricular and left atrial chamber quantification by three-dimensional echocardiography. American Journal of Cardiology, 108(7):1038–1044,2011.
[120] Heartmodel AI. https://www.philips.com.eg/healthcare/resources/feature-detail/anatomical-intelligence. Accessed on: 2018-04-01.
[121] Francesco Maffessanti, Hans-Joachim Nesser, Lynn Weinert, Regina Steringer-Mascherbauer, Johannes Niel, Willem Gorissen, Lissa Sugeng, Roberto M Lang, andVictor Mor-Avi. Quantitative evaluation of regional left ventricular function usingthree-dimensional speckle tracking echocardiography in patients with and withoutheart disease. American Journal of Cardiology, 104(12):1755–1762, 2009.
[122] Ryo Kawamura, Yoshihiro Seo, Tomoko Ishizu, Akiko Atsumi, Masayoshi Ya-mamoto, Tomoko Machino-Ohtsuka, Hideki Nakajima, Satoshi Sakai, Yumiko OishiTanaka, Manabu Minami, et al. Feasibility of left ventricular volume measurementsby three-dimensional speckle tracking echocardiography depends on image qualityand degree of left ventricular enlargement: validation study with cardiac magneticresonance imaging. Journal of cardiology, 63(3):230–238, 2014.
[123] Tomoyuki Takeguchi, Masahide Nishiura, Yasuhiko Abe, Hiroyuki Ohuchi, and Tet-suya Kawagishi. Practical considerations for a method of rapid cardiac functionanalysis based on three-dimensional speckle tracking in a three-dimensional diag-nostic ultrasound system. Journal of Medical Ultrasonics, 37(2):41–49, 2010.
[124] Yefeng Zheng, Adrian Barbu, Bogdan Georgescu, Michael Scheuering, and DorinComaniciu. Fast automatic heart chamber segmentation from 3D CT data usingmarginal space learning and steerable features. In Computer Vision, 2007. ICCV2007. IEEE 11th International Conference on, pages 1–8. IEEE, 2007.
[125] Lin Yang, Bogdan Georgescu, Yefeng Zheng, Peter Meer, and Dorin Comaniciu. 3Dultrasound tracking of the left ventricle using one-step forward prediction and datafusion of collaborative trackers. In Computer Vision and Pattern Recognition, 2008.CVPR 2008. IEEE Conference on, pages 1–8. IEEE, 2008.
[126] Victor Mor-Avi, Carly Jenkins, Harald P Kuhl, Hans-Joachim Nesser, ThomasMarwick, Andreas Franke, Christian Ebner, Benjamin H Freed, Regina Steringer-Mascherbauer, Heidi Pollard, et al. Real-time 3-dimensional echocardiographic quan-tification of left ventricular volumes: multicenter study for validation with magneticresonance imaging and investigation of sources of error. JACC: Cardiovascular Imag-ing, 1(4):413–423, 2008.
[127] Samuel C Siu, J Miguel Rivera, J Luis Guerrero, Mark D Handschumacher, Jean PaulLethor, Arthur E Weyman, Robert A Levine, and Michael H Picard. Three-dimensional echocardiography. in vivo validation for left ventricular volume andfunction. Circulation, 88(4):1715–1723, 1993.
[128] Michal Hubka, Edward L Bolson, John A McDonald, Roy W Martin, Brad Munt,and Florence H Sheehan. Three-dimensional echocardiographic measurement of left
174 BIBLIOGRAPHY
and right ventricular mass and volume: in vitro validation. The international journalof cardiovascular imaging, 18(2):111–118, 2002.
[129] Michael A Schmidt, Chikai J Ohazama, Kwabena O Agyeman, Raisa Z Freidlin,Michael Jones, Joy M Laurienzo, Cynthia L Brenneman, Andrew E Arai, Olaf T vonRamm, and Julio A Panza. Real-time three-dimensional echocardiography for mea-surement of left ventricular volumes. American Journal of Cardiology, 84(12):1434–1439, 1999.
[130] Doyal Lee, Anthon R Fuisz, Po-Hoey Fan, Tsui-Lieh Hsu, Chun-Pun Liu, and Hung-Tin Chiang. Real-time 3-dimensional echocardiographic evaluation of left ventricularvolume: correlation with magnetic resonance imaging—a validation study. Journalof the American Society of Echocardiography, 14(10):1001–1009, 2001.
[131] Harald P Kuhl, Andreas Franke, Marc W Merx, Rainer Hoffmann, DavidPuschmann, and Peter Hanrath. Rapid quantification of left ventricular functionand mass using transoesophageal three-dimensional echocardiography: validationof a method that uses long-axis cutplanes. European Journal of Echocardiography,3(1):213–221, 2000.
[132] Herman FJ Mannaerts, Johannes A Van Der Heide, Otto Kamp, Theano Papavas-siliu, Johannes T Marcus, Aernout Beek, Albert C Van Rossum, Jos Twisk, andCees A Visser. Quantification of left ventricular volumes and ejection fraction us-ing freehand transthoracic three-dimensional echocardiography: comparison withmagnetic resonance imaging. Journal of the American Society of Echocardiography,16(2):101–109, 2003.
[133] Harald P Kuhl, Marcus Schreckenberg, Dierk Rulands, Markus Katoh, WolfgangSchafer, Georg Schummers, Arno Bucker, Peter Hanrath, and Andreas Franke. High-resolution transthoracic real-time three-dimensional echocardiography: quantitationof cardiac volumes and function using semi-automatic border detection and compar-ison with cardiac magnetic resonance imaging. Journal of the American College ofCardiology, 43(11):2083–2090, 2004.
[134] Carly Jenkins, Kristen Bricknell, Lizelle Hanekom, and Thomas H Marwick. Repro-ducibility and accuracy of echocardiographic measurements of left ventricular param-eters using real-time three-dimensional echocardiography. Journal of the AmericanCollege of Cardiology, 44(4):878–886, 2004.
[135] Lissa Sugeng, Victor Mor-Avi, Lynn Weinert, Johannes Niel, Christian Ebner,Regina Steringer-Mascherbauer, Frank Schmidt, Christian Galuschky, Georg Schum-mers, Roberto M Lang, et al. Quantitative assessment of left ventricular sizeand function: side-by-side comparison of real-time three-dimensional echocardio-graphy and computed tomography with magnetic resonance reference. Circulation,114(7):654–661, 2006.
[136] Annemien E van den Bosch, Danielle Robbers-Visser, Boudewijn J Krenning,Marco M Voormolen, Jackie S McGhie, Wim A Helbing, Jolien W Roos-Hesselink,Maarten L Simoons, and Folkert J Meijboom. Real-time transthoracic three-dimensional echocardiographic assessment of left ventricular volume and ejectionfraction in congenital heart disease. Journal of the American Society of Echocardio-graphy, 19(1):1–6, 2006.
[137] Carly Jenkins, Jonathan Chan, Lizelle Hanekom, and Thomas H Marwick. Accu-racy and feasibility of online 3-dimensional echocardiography for measurement ofleft ventricular parameters. Journal of the American Society of Echocardiography,19(9):1119–1128, 2006.
BIBLIOGRAPHY 175
[138] Osama II Soliman, Boudewijn J Krenning, Marcel L Geleijnse, Attila Nemes, Robert-Jan van Geuns, Timo Baks, Ashraf M Anwar, Tjebbe W Galema, Wim B Vletter,and Folkert J Ten Cate. A comparison between QLAB and TomTec full volumereconstruction for real time three-dimensional echocardiographic quantification ofleft ventricular volumes. Echocardiography, 24(9):967–974, 2007.
[139] Osama II Soliman, Boudewijn J Krenning, Marcel L Geleijnse, Attila Nemes, Jo-han G Bosch, Robert-Jan van Geuns, Sharon W Kirschbaum, Ashraf M Anwar,Tjebbe W Galema, Wim B Vletter, et al. Quantification of left ventricular vol-umes and function in patients with cardiomyopathies by real-time three-dimensionalechocardiography: a head-to-head comparison between two different semiauto-mated endocardial border detection algorithms. Journal of the American Societyof Echocardiography, 20(9):1042–1049, 2007.
[140] Jøger Hansegard, Stig Urheim, Ketil Lunde, Siri Malm, and Stein Inge Rabben.Semi-automated quantification of left ventricular volumes and ejection fraction byreal-time three-dimensional echocardiography. Cardiovascular ultrasound, 7(1):18,2009.
[141] Denisa Muraru, Luigi P Badano, Gianluca Piccoli, Pasquale Gianfagna, LorenzoDel Mestre, Davide Ermacora, and Alessandro Proclemer. Validation of a novelautomated border-detection algorithm for rapid and accurate quantitation of leftventricular volumes based on three-dimensional echocardiography. European journalof echocardiography, 11(4):359–368, 2010.
[142] Sebastiaan A Kleijn, Wessel P Brouwer, Mohamed FA Aly, Iris K Russel, Gerben Jde Roest, Aernout M Beek, Albert C van Rossum, and Otto Kamp. Comparisonbetween three-dimensional speckle-tracking echocardiography and cardiac magneticresonance imaging for quantification of left ventricular volumes and function. Euro-pean Heart Journal–Cardiovascular Imaging, 13(10):834–839, 2012.
[143] Christopher A Miller, Keith Pearce, Peter Jordan, Rachel Argyle, David Clark,Martin Stout, Simon G Ray, and Matthias Schmitt. Comparison of real-time three-dimensional echocardiography with cardiovascular magnetic resonance for left ven-tricular volumetric assessment in unselected patients. European Heart Journal–Cardiovascular Imaging, 13(2):187–195, 2011.
[144] Paaladinesh Thavendiranathan, Shizhen Liu, David Verhaert, Anna Calleja, AdrienNitinunu, Thomas Van Houten, Nathalie De Michelis, Orlando Simonetti, Sanjay Ra-jagopalan, Thomas Ryan, et al. Feasibility, accuracy, and reproducibility of real-timefull-volume 3D transthoracic echocardiography to measure LV volumes and systolicfunction: a fully automated endocardial contouring algorithm in sinus rhythm andatrial fibrillation. JACC: Cardiovascular Imaging, 5(3):239–251, 2012.
[145] Quan Bin Zhang, Jing Ping Sun, Rui Feng Gao, Alex Pui-Wai Lee, Yan Lin Feng,Xiao Rong Liu, Wei Sheng, Feng Liu, and Cheuk-Man Yu. Novel single-beat full-volume capture real-time three-dimensional echocardiography and auto-contouringalgorithm for quantification of left ventricular volume: validation with cardiac mag-netic resonance imaging. International journal of cardiology, 168(3):2946–2948, 2013.
[146] Sung-A Chang, Sang-Chol Lee, Eun-Young Kim, Seung-Hee Hahm, Shin Yi Jang,Sung-Ji Park, Jin-Oh Choi, Seung Woo Park, Yeon Hyeon Choe, and Jae K Oh.Feasibility of single-beat full-volume capture real-time three-dimensional echocar-diography and auto-contouring algorithm for quantification of left ventricular vol-ume: validation with cardiac magnetic resonance imaging. Journal of the AmericanSociety of Echocardiography, 24(8):853–859, 2011.
176 BIBLIOGRAPHY
[147] Kentaro Shibayama, Hiroyuki Watanabe, Nobuo Iguchi, Shunsuke Sasaki, KeitaroMahara, Jun Umemura, and Tetsuya Sumiyoshi. Evaluation of automated measure-ment of left ventricular volume by novel real-time 3-dimensional echocardiographicsystem: validation with cardiac magnetic resonance imaging and 2-dimensionalechocardiography. Journal of cardiology, 61(4):281–288, 2013.
[148] Wendy Tsang, Ivan S Salgo, Lyubomir Zarochev, Scott Settlemier, Nicole Bhave,Juergen Weese, Irina Waechter-Stehle, Michael Cardinale, Aldo Prado, Lynn Wein-ert, et al. Fully automated quantification of left ventricular and left atrial volumesfrom transthoracic 3D echocardiography: a validation study. Journal of the Ameri-can College of Cardiology, 61(10 Supplement):E904, 2018.
[149] Yuichi J Shimada and Takahiro Shiota. A meta-analysis and investigation for thesource of bias of left ventricular volumes and function by three-dimensional echocar-diography in comparison with magnetic resonance imaging. American Journal ofCardiology, 107(1):126–138, 2011.
[150] Jennifer L Dorosz, Dennis C Lezotte, David A Weitzenkamp, Larry A Allen, andErnesto E Salcedo. Performance of 3-dimensional echocardiography in measuring leftventricular volumes and ejection fraction: a systematic review and meta-analysis.Journal of the American College of Cardiology, 59(20):1799–1808, 2012.
[151] Thomas H Marwick. Application of 3D echocardiography to everyday practice:Development of normal ranges is step 1*, 2012.
[152] Erlend Aune, Morten Bækkevar, Olaf Rødevand, and Jan Erik Otterstad. Referencevalues for left ventricular volumes with real-time 3-dimensional echocardiography.Scandinavian Cardiovascular Journal, 44(1):24–30, 2010.
[153] Kyoko Kaku, Masaaki Takeuchi, Kyoko Otani, Lissa Sugeng, Hiromi Nakai,Nobuhiko Haruki, Hidetoshi Yoshitani, Nozomi Watanabe, Kiyoshi Yoshida, Yu-taka Otsuji, et al. Age-and gender-dependency of left ventricular geometry assessedwith real-time three-dimensional transthoracic echocardiography. Journal of theAmerican Society of Echocardiography, 24(5):541–547, 2011.
[154] Shota Fukuda, Hiroyuki Watanabe, Masao Daimon, Yukio Abe, Akihiro Hirashiki,Kumiko Hirata, Hiroshi Ito, Masumi Iwai-Takano, Katsuomi Iwakura, ChisatoIzumi, et al. Normal values of real-time 3-dimensional echocardiographic param-eters in a healthy japanese population. Circulation Journal, 76(5):1177–1181, 2012.
[155] Navtej S Chahal, Tiong K Lim, Piyush Jain, John C Chambers, Jaspal S Kooner,and Roxy Senior. Population-based reference values for 3D echocardiographic LVvolumes and ejection fraction. JACC: Cardiovascular Imaging, 5(12):1191–1197,2012.
[156] Denisa Muraru, Luigi P Badano, Diletta Peluso, Lucia Dal Bianco, SimonaCasablanca, Gonenc Kocabay, Giacomo Zoppellaro, and Sabino Iliceto. Comprehen-sive analysis of left ventricular geometry and function by three-dimensional echocar-diography in healthy adults. Journal of the American Society of Echocardiography,26(6):618–628, 2013.
[157] Katrina K Poppe, Robert N Doughty, and Gillian A Whalley. Redefining normalreference ranges for echocardiography: a major new individual person data meta-analysis. European Heart Journal–Cardiovascular Imaging, 14(4):347–348, 2012.
[158] Gillian Whalley. A meta-analysis of echocardiographic measurements of the left heartfor the development of normative reference ranges in a large international cohort:the echonormal study. 2014.
BIBLIOGRAPHY 177
[159] Daniel Barbosa, Olivier Bernard, Oana Savu, Thomas Dietenbeck, Brecht Heyde,Piet Claus, Denis Friboulet, and Jan D’hooge. Coupled B-spline active geomet-ric functions for myocardial segmentation: A localized region-based approach. InUltrasonics Symposium (IUS), 2010 IEEE, pages 1648–1651. IEEE, 2010.
[160] Michael Unser. Splines: A perfect fit for signal and image processing. IEEE Signalprocessing magazine, 16(6):22–38, 1999.
[161] Shawn Lankton and Allen Tannenbaum. Localizing region-based active contours.IEEE transactions on image processing, 17(11):2029–2039, 2008.
[162] Jan Kybic and Michael Unser. Fast parametric elastic image registration. IEEEtransactions on image processing, 12(11):1427–1442, 2003.
[163] Tony F Chan and Luminita A Vese. Active contours without edges. IEEE Transac-tions on image processing, 10(2):266–277, 2001.
[164] Daniel Barbosa, Brecht Heyde, Thomas Dietenbeck, Helene Houle, Denis Friboulet,Olivier Bernard, and Jan D’hooge. Quantification of left ventricular volume andglobal function using a fast automated segmentation tool: validation in a clinicalsetting. The international journal of cardiovascular imaging, 29(2):309–316, 2013.
[165] Daniel Barbosa, Thomas Dietenbeck, Brecht Heyde, Helene Houle, Denis Friboulet,Jan D’hooge, and Olivier Bernard. Fast and fully automatic 3-D echocardiographicsegmentation using B-spline explicit active surfaces: feasibility study and validationin a clinical setting. Ultrasound in Medicine and Biology, 39(1):89–101, 2013.
[166] Marijn van Stralen, KY Esther Leung, Marco M Voormolen, Nico de Jong, Anto-nius FW van der Steen, Johan HC Reiber, and Johan G Bosch. Time continuousdetection of the left ventricular long axis and the mitral valve plane in 3-D echocar-diography. Ultrasound in medicine and biology, 34(2):196–207, 2008.
[167] Mehmet Uzumcu, Rob J van der Geest, Cory Swingen, Johan HC Reiber, andBoudewijn PF Lelieveldt. Time continuous tracking and segmentation of cardio-vascular magnetic resonance images using multidimensional dynamic programming.Investigative radiology, 41(1):52–62, 2006.
[168] Daniel Barbosa, Olivier Bernard, Brecht Heyde, Thomas Dietenbeck, Helene Houle,Denis Friboulet, and Jan D’hooge. B-spline explicit active tracking of surfaces(BEATS): Application to real-time 3D segmentation and tracking of the left ventriclein 3D echocardiography. In Ultrasonics Symposium (IUS), 2012 IEEE International,pages 224–227. IEEE, 2012.
[169] Engin Dikici and Fredrik Orderud. Generalized step criterion edge detectors forkalman filter based left ventricle tracking in 3D+T echocardiography. In Interna-tional Workshop on Statistical Atlases and Computational Models of the Heart, pages261–269. Springer, 2012.
[170] Fredrik Orderud, Jøger Hansegard, and Stein I Rabben. Real-time tracking of the leftventricle in 3D echocardiography using a state estimation approach. In InternationalConference on Medical Image Computing and Computer-Assisted Intervention, pages858–865. Springer, 2007.
[171] KY Esther Leung, Marijn van Stralen, Gerard van Burken, Nico de Jong, and Jo-han G Bosch. Automatic active appearance model segmentation of 3D echocar-diograms. In Biomedical Imaging: From Nano to Macro, 2010 IEEE InternationalSymposium on, pages 320–323. IEEE, 2010.
178 BIBLIOGRAPHY
[172] KY Esther Leung, Mikhail G Danilouchkine, Marijn van Stralen, Nico de Jong,Antonius FW van der Steen, and Johan G Bosch. Left ventricular border trackingusing cardiac motion models and optical flow. Ultrasound in medicine & biology,37(4):605–616, 2011.
[173] Lin Yang, Bogdan Georgescu, Yefeng Zheng, Yang Wang, Peter Meer, and DorinComaniciu. Prediction based collaborative trackers (PCT): A robust and accurateapproach toward 3D medical object tracking. IEEE Transactions on Medical Imag-ing, 30(11):1921–1932, 2011.
[174] Ruta Jasaityte, Brecht Heyde, and Jan D’hooge. Current state of three-dimensionalmyocardial strain estimation using echocardiography. Journal of the American So-ciety of Echocardiography, 26(1):15–28, 2013.
[175] Mathieu De Craene, Stephanie Marchesseau, Brecht Heyde, Hang Gao, MartinoAlessandrini, Olivier Bernard, Gemma Piella, AR Porras, Lennart Tautz, Anja Hen-nemuth, et al. 3D strain assessment in ultrasound (Straus): A synthetic comparisonof five tracking methodologies. IEEE transactions on medical imaging, 32(9):1632–1646, 2013.
[176] Michael Suhling, Muthuvel Arigovindan, Patrick Hunziker, and Michael Unser. Mul-tiresolution moment filters: Theory and applications. IEEE Transactions on ImageProcessing, 13(LIB-ARTICLE-2004-013):484–495, 2004.
[177] Daniel Barbosa, Brecht Heyde, Thomas Dietenbeck, Denis Friboulet, Jan D’hooge,and Olivier Bernard. Fast left ventricle tracking in 3D echocardiographic data usinganatomical affine optical flow. In International Conference on Functional Imagingand Modeling of the Heart, pages 191–199. Springer, 2013.
[178] Bruce D Lucas and Takeo Kanade. An iterative image registration technique withan application to stereo vision. 1981.
[179] Berthold KP Horn and Brian G Schunck. Determining optical flow. Artificial Intel-ligence, 17(1):185 – 203, 1981.
[180] Jean-Yves Bouguet. Pyramidal implementation of the affine Lucas Kanade featuretracker description of the algorithm. Intel Corporation, 5(1-10):4, 2001.
[181] Fredrik Orderud and Stein Inge Rabben. Real-time 3D segmentation of the leftventricle using deformable subdivision surfaces. In IEEE Conference On ComputerVision and Pattern Recognition, 2008. CVPR 2008., pages 1–8. IEEE, 2008.
[182] Kashif Rajpoot, Vicente Grau, J Alison Noble, Harald Becher, and Cezary Szmigiel-ski. The evaluation of single-view and multi-view fusion 3D echocardiography usingimage-driven segmentation and tracking. Medical image analysis, 15(4):514–528,2011.
[183] Ling Tong, Hang Gao, and Jan D’hooge. Multi-transmit beam forming for fastcardiac imaging-a simulation study. IEEE transactions on ultrasonics, ferroelectrics,and frequency control, 60(8):1719–1731, 2013.
[184] Honghai Zhang, Ademola K Abiose, Dipti Gupta, Dwayne N Campbell, James BMartins, Milan Sonka, and Andreas Wahle. Novel indices for left-ventricular dyssyn-chrony characterization based on highly automated segmentation from real-time 3-Dechocardiography. Ultrasound in medicine & biology, 39(1):72–88, 2013.
[185] Brecht Heyde, Daniel Barbosa, Ana-Maria Daraban, Ruta Jasaityte, Piet Claus,Frederik Maes, and Jan D’hooge. An automated pipeline for regional cardiac strainestimation from volumetric ultrasound data. In Ultrasonics Symposium (IUS), 2013IEEE International, pages 1248–1251. IEEE, 2013.
BIBLIOGRAPHY 179
[186] Mahdi Tabassian, Martino Alessandrini, Peter Claes, Luca De Marchi, Dirk Van-dermeulen, Guido Masetti, and Jan D’hooge. Automatic detection of myocardialinfarction through a global shape feature based on local statistical modeling. In Sta-tistical Atlases and Computational Models of the Heart. Imaging and Modelling Chal-lenges, volume 9534 of Lecture Notes in Computer Science, pages 208–216. SpringerInternational Publishing, 2016.
[187] Fredrik Orderud, Hans Torp, and Stein Inge Rabben. Automatic alignment of stan-dard views in 3D echocardiograms using real-time tracking. In SPIE Medical Imaging2009, page 72650D, March 2009.
[188] Kiryl Chykeyuk, Mohammad Yaqub, and J Alison Noble. Class-specific regressionrandom forest for accurate extraction of standard planes from 3D echocardiography.In Medical Computer Vision. Large Data in Medical Imaging, volume 8331 of LectureNotes in Computer Science, pages 53–62. Springer International Publishing, 2014.
[189] Joao S Domingos, Eduardo Lima, Paul Leeson, and J Alison Noble. Local phase-based fast ray features for automatic left ventricle apical view detection in 3Dechocardiography. In Medical Computer Vision. Large Data in Medical Imaging,volume 8331 of Lecture Notes in Computer Science, pages 119–129. Springer Inter-national Publishing, 2014.
[190] Frank Rademakers, Jan Engvall, Thor Edvardsen, Mark Monaghan, Rosa Sicari,Eike Nagel, Jose Zamorano, Heikki Ukkonen, Tino Ebbers, Vitantonio Di Bello,Jens-Uwe Voigt, Lieven Herbots, Piet Claus, and Jan D’hooge. Determining optimalnoninvasive parameters for the prediction of left ventricular remodeling in chronicischemic patients. Scandinavian Cardiovascular Journal, 47(6):329–334, December2013.
[191] Nuno Almeida, Denis Friboulet, Sebastian Imre Sarvari, Olivier Bernard, Daniel Bar-bosa, Eigil Samset, and Jan D’hooge. Left-atrial segmentation from 3-D ultrasoundusing B-spline explicit active surfaces with scale uncoupling. IEEE transactions onultrasonics, ferroelectrics, and frequency control, 63(2):212–221, 2016.
[192] Xulei Qin, Zhibin Cong, and Baowei Fei. Automatic segmentation of right ventricularultrasound images using sparse matrix transform and a level set. Physics in medicineand biology, 58(21):7609, 2013.
[193] Michael Bernier, Pierre-Marc Jodoin, and Alain Lalande. Automatized evaluation ofthe left ventricular ejection fraction from echocardiographic images using graph cut.Proceedings MICCAI Challenge on Echocardiographic Three-Dimensional UltrasoundSegmentation (CETUS), Boston, MIDAS Journal, pages 25–32, 2014.
[194] Ozan Oktay, Wenzhe Shi, Kevin Keraudren, Jose Caballero, and Daniel Rueckert.Learning shape representations for multi-atlas endocardium segmentation in 3D echoimages. Proceedings MICCAI Challenge on Echocardiographic Three-DimensionalUltrasound Segmentation (CETUS), Boston, MIDAS Journal, pages 57–64, 2014.
[195] Chunliang Wang and Orjan Smedby. Model-based left ventricle segmentation in3D ultrasound using phase image. In MICCAI Workshop” Grand Challenge onEndocardial Three-dimensional Ultrasound Segmentation”, Boston, US, 2014., 2014.
[196] Ozan Oktay, Alberto Gomez, Kevin Keraudren, Andreas Schuh, Wenjia Bai, WenzheShi, Graeme Penney, and Daniel Rueckert. Probabilistic Edge Map (PEM) for 3DUltrasound Image Registration and Multi-atlas Left Ventricle Segmentation, pages223–230. Springer International Publishing, Cham, 2015.
180 BIBLIOGRAPHY
[197] Marijn van Stralen, Alexander Haak, KY Esther Leung, Gerard van Burken, ClemensBos, and Johan G Bosch. Full-cycle left ventricular segmentation and tracking in 3Dechocardiography using active appearance models. In Ultrasonics Symposium (IUS),2015 IEEE International, pages 1–4. IEEE, 2015.
[198] Sandro Queiros, Alexandros Papachristidis, Daniel Barbosa, Konstantinos CTheodoropoulos, Jaime C Fonseca, Mark J Monaghan, Joao L Vilaca, and JanD’hooge. Aortic valve tract segmentation from 3D-TEE using shape-based B-splineexplicit active surfaces. IEEE transactions on medical imaging, 35(9):2015–2025,2016.
[199] Sandro Queiros, Joao L Vilaca, Pedro Morais, Jaime C Fonseca, Jan D’hooge, andDaniel Barbosa. Fast left ventricle tracking using localized anatomical affine op-tical flow. International journal for numerical methods in biomedical engineering,33(11):e2871, 2017.
[200] Jyrki Lotjonen, Mika Pollari, Sari Kivisto, and Kirsi Lauerma. Correction of Move-ment Artifacts from 4-D Cardiac Short- and Long-Axis MR Data, pages 405–412.Springer Berlin Heidelberg, Berlin, Heidelberg, 2004.
[201] Adam G Chandler, Richard J Pinder, Thomas Netsch, Julia A Schnabel, David JHawkes, Derek LG Hill, and Reza Razavi. Correction of misaligned slices in multi-slice cardiovascular magnetic resonance using slice-to-volume registration. Journalof Cardiovascular Magnetic Resonance, 10(1):13, 2008.
[202] Piotr J Slomka, David Fieno, Amit Ramesh, Vaibhav Goyal, Hidetaka Nishina,Louise EJ Thompson, Rola Saouaf, Daniel S Berman, and Guido Germano. Pa-tient motion correction for multiplanar, multi-breath-hold cardiac cine MR imaging.Journal of Magnetic Resonance Imaging, 25(5):965–973, 2007.
[203] Maria Chiara Carminati, Francesco Maffessanti, and Enrico Gianluca Caiani. Nearlyautomated motion artifacts correction between multi breath-hold short-axis andlong-axis cine CMR images. Computers in Biology and Medicine, 46:42 – 50, 2014.
[204] An Elen, Jeroen Hermans, Javier Ganame, Dirk Loeckx, Jan Bogaert, Frederik Maes,and Paul Suetens. Automatic 3-D breath-hold related motion correction of dynamicmultislice MRI. IEEE Transactions on Medical Imaging, 29(3):868–878, 2010.
[205] Paul J Besl and Neil D McKay. Method for registration of 3-D shapes. In SensorFusion IV: Control Paradigms and Data Structures, volume 1611, pages 586–607.International Society for Optics and Photonics, 1992.
[206] Daniel Barbosa, Brecht Heyde, Maja Cikes, Thomas Dietenbeck, Piet Claus, DenisFriboulet, Olivier Bernard, and Jan D’hooge. Real-time 3D interactive segmentationof echocardiographic data through user-based deformation of B-spline explicit activesurfaces. Computerized Medical Imaging and Graphics, 38(1):57 – 67, 2014.
[207] Timothy F Cootes, Christopher J Taylor, David H Cooper, and Jim Graham. Activeshape models - their training and application. Computer vision and image under-standing, 61(1):38–59, 1995.
[208] Ian Jolliffe. Principal Component Analysis. John Wiley & Sons, Ltd, 2014.
[209] Vikram Chalana, David T Linker, David R Haynor, and Yongmin Kim. A multipleactive contour model for cardiac boundary detection on echocardiographic sequences.IEEE Transactions on Medical Imaging, 15(3):290–298, 1996.
[210] Daniel P Huttenlocher, Gregory A Klanderman, and William J Rucklidge. Com-paring images using the Hausdorff distance. IEEE Transactions on pattern analysisand machine intelligence, 15(9):850–863, 1993.
BIBLIOGRAPHY 181
[211] Lee R Dice. Measures of the amount of ecologic association between species. Ecology,26(3):pp. 297–302, 1945.
[212] Alexandros Papachristidis, Marcel Geleijnse, Elena Galli, Brecht Heyde, MartinoAlessandrini, Daniel Barbosa, Erwan Donal, Marc Monaghan, Olivier Bernard, JanD’hooge, et al. Clinical expert delineation of 3D left ventricular echocardiograms forthe CETUS segmentation challenge. In Proceedings MICCAI challenge on echocar-diographic three-dimensional ultrasound segmentation (CETUS), pages 9–16, 2014.
[213] Marijn Van Stralen, Alexander Haak, KY Esther Leung, Gerard van Burken, andJohan G Bosch. Segmentation of multi-center 3D left ventricular echocardiogramsby active appearance models. Proceedings MICCAI Challenge on EchocardiographicThree-Dimensional Ultrasound Segmentation (CETUS), Boston, MIDAS Journal,pages 73–80, 2014.
[214] KY Esther Leung and Johan G Bosch. Automated border detection in three-dimensional echocardiography: principles and promises. European Heart Journal- Cardiovascular Imaging, 11(2):97–108, 2010.
[215] Masaaki Takeuchi, Tomoko Nishikage, Victor Mor-Avi, Lissa Sugeng, Lynn Wein-ert, Hironi Nakai, Ivan S Salgo, Olivier Gerard, and Roberto M Lang. Measurementof left ventricular mass by real-time three-dimensional echocardiography: Valida-tion against magnetic resonance and comparison with two-dimensional and M-modemeasurements. Journal of the American Society of Echocardiography, 21(9):1001 –1005, 2008.
[216] Vivek Walimbe, Vladimir Zagrodsky, and Raj Shekhar. Fully automatic segmenta-tion of left ventricular myocardium in real-time three-dimensional echocardiography.In Medical Imaging 2006: Image Processing, volume 6144, page 61444H. Interna-tional Society for Optics and Photonics, 2006.
[217] Fredrik Orderud, Gabriel Kiss, and Hans Torp. Automatic coupled segmentationof endo-and epicardial borders in 3D echocardiography. In Ultrasonics Symposium,2008. IUS 2008. IEEE, pages 1749–1752. IEEE, 2008.
[218] Michael Verhoek, Mohammad Yaqub, John McManigle, and J Alison Noble. Learn-ing optical flow propagation strategies using random forests for fast segmentation indynamic 2D & 3D echocardiography. In Kenji Suzuki, Fei Wang, Dinggang Shen,and Pingkun Yan, editors, Machine Learning in Medical Imaging, volume 7009 ofLecture Notes in Computer Science, pages 75–82. Springer Berlin Heidelberg, 2011.
[219] Victor Lempitsky, Michael Verhoek, J Alison Noble, and Andrew Blake. Randomforest classification for automatic delineation of myocardium in real-time 3D echocar-diography. In Nicholas Ayache, Herve Delingette, and Maxime Sermesant, editors,Functional Imaging and Modeling of the Heart, volume 5528 of Lecture Notes inComputer Science, pages 447–456. Springer Berlin Heidelberg, 2009.
[220] Jie Feng, Wei-Chung Lin, and Chin-Tu Chen. Epicardial boundary detection usingfuzzy reasoning. IEEE Transactions on Medical Imaging, 10(2):187–199, Jun 1991.
[221] Jose MB Dias and Jose MN Leitao. Wall position and thickness estimation fromsequences of echocardiographic images. IEEE Transactions on Medical Imaging,15(1):25–38, 1996.
[222] Enrico G Caiani, Cristiana Corsi, Lissa Sugeng, Peter MacEneaney, Lynn Weinert,Victor Mor-Avi, and Roberto M Lang. Improved quantification of left ventricularmass based on endocardial and epicardial surface detection with real time threedimensional echocardiography. Heart, 92(2):213–219, 2006.
182 BIBLIOGRAPHY
[223] Christopher D Garson, Bing Li, Scott T Acton, and John A Hossack. Guidingautomated left ventricular chamber segmentation in cardiac imaging using the con-cept of conserved myocardial volume. Computerized Medical Imaging and Graphics,32(4):321 – 330, 2008.
[224] Yun Zhu, Xenophon Papademetris, Albert J Sinusas, and James S Duncan. Acoupled deformable model for tracking myocardial borders from real-time echocar-diography using an incompressibility constraint. Medical Image Analysis, 14(3):429– 448, 2010.
[225] Thomas Dietenbeck, Martino Alessandrini, Daniel Barbosa, Jan D’hooge, De-nis Friboulet, and Olivier Bernard. Detection of the whole myocardium in 2D-echocardiography for multiple orientations using a geometrically constrained level-set. Medical image analysis, 16(2):386–401, 2012.
[226] Constantine Butakoff, Simone Balocco, Federico M Sukno, Corne Hoogendoorn,Catalina Tobon-Gomez, Gustavo Avegliano, and Alejandro F Frangi. Left-ventricular epi- and endocardium extraction from 3D ultrasound images using an au-tomatically constructed 3D ASM. Computer Methods in Biomechanics and Biomed-ical Engineering: Imaging & Visualization, 4(5):265–280, 2016.
[227] Sandro Queiros, Daniel Barbosa, Brecht Heyde, Pedro Morais, Joao L Vilaca, DenisFriboulet, Olivier Bernard, and Jan D’hooge. Fast automatic myocardial segmenta-tion in 4D cine CMR datasets. Medical Image Analysis, 18(7):1115 – 1131, 2014.
[228] Elsa Abbena, Simon Salamon, and Alfred Gray. Modern Differential Geometry ofCurves and Surfaces with Mathematica, Third Edition. Textbooks in Mathematics.Taylor & Francis, 2006.
[229] Piet Claus, Hon Fai Choi, Jan D’hooge, and Frank E Rademakers. On the calculationof principle curvatures of the left-ventricular surfaces. In 30th Annual InternationalConference of the IEEE Engineering in Medicine and Biology Society, pages 961–964,Aug 2008.
[230] Olive Jean Dunn. Multiple comparisons among means. Journal of the AmericanStatistical Association, 56(293):52–64, 1961.
[231] Peter W Wood, Jonathan B Choy, Navin C Nanda, and Harald Becher. Left ven-tricular ejection fraction and volumes: It depends on the imaging method. Echocar-diography, 31(1):87–100, 2014.
[232] Jørn Bersvendsen, Fredrik Orderud, Øyvind Lie, Richard John Massey, KristianFossa, Raul San Jose Estepar, Stig Urheim, and Eigil Samset. Semiautomated biven-tricular segmentation in three-dimensional echocardiography by coupled deformablesurfaces. Journal of Medical Imaging, 4(2):024005, 2017.
[233] Bidisha Chakraborty, Zhi Liu, Brecht Heyde, Jianwen Luo, and Jan D’hooge. 2-D myocardial deformation imaging based on RF-based nonrigid image registration.IEEE transactions on ultrasonics, ferroelectrics, and frequency control, 65(6):1037–1047, 2018.
[234] Sandro Queiros, Pedro Morais, Christophe Dubois, Jens-Uwe Voigt, WolfgangFehske, Andreas Kuhn, Tobias Achenbach, Jaime C Fonseca, Joao L Vilaca, andJan D’hooge. Validation of a novel software tool for automatic aortic annular siz-ing in three-dimensional transesophageal echocardiographic images. Journal of theAmerican Society of Echocardiography, 31(4):515–525, 2018.
BIBLIOGRAPHY 183
[235] Jan D’hooge, Andreas Heimdal, Fadi Jamal, Tomasz Kukulski, Bart Bijnens, FrankRademakers, Liv Hatle, Paul Suetens, and George R Sutherland. Regional strainand strain rate measurements by cardiac ultrasound: principles, implementation andlimitations. European Journal of Echocardiography, 1(3):154–170, 2000.
[236] Jan D’hooge, Elisa Konofagou, Fadi Jamal, Andreas Heimdal, Laurentino Barrios,Bart Bijnens, Jan Thoen, Frans Van de Werf, George Sutherland, and Paul Suetens.Two-dimensional ultrasonic strain rate measurement of the human heart in vivo.IEEE transactions on ultrasonics, ferroelectrics, and frequency control, 49(2):281–286, 2002.
[237] Frank Rademakers, Frans Werf, Luc Mortelmans, Guy Marchal, and Jan Bogaert.Evolution of regional performance after an acute anterior myocardial infarction inhumans using magnetic resonance tagging. The Journal of physiology, 546(3):777–787, 2003.
[238] Hiroyuki Suga. Total mechanical energy of a ventricle model and cardiac oxygenconsumption. American Journal of Physiology-Heart and Circulatory Physiology,236(3):H498–H505, 1979.
[239] Hideyuki Takaoka, Motoshi Takeuchi, Michio Odake, and Mitsuhiro Yokoyama. As-sessment of myocardial oxygen consumption (Vo2) and systolic pressure–volume area(PVA) in human hearts. European heart journal, 13:85–90, 1992.
[240] Ryuichi Hisano and George Cooper. Correlation of force-length area with oxygenconsumption in ferret papillary muscle. Circulation Research, 61(3):318–328, 1987.
[241] John V Tyberg, James S Forrester, Horace L Wyatt, Steven J Goldner, William WParmley, and Harold JC Swan. An analysis of segmental ischemic dysfunction uti-lizing the pressure-length loop. Circulation, 49(4):748–754, 1974.
[242] James S Forrester, John V Tyberg, Horace L Wyatt, Steven Goldner, William WParmely, and Harold JC Swan. Pressure-length loop: a new method for simultaneousmeasurement of segmental and total cardiac function. Journal of applied physiology,37(5):771–775, 1974.
[243] Stig Urheim, Stein Inge Rabben, Helge Skulstad, Erik Lyseggen, Halfdan Ihlen, andOtto A Smiseth. Regional myocardial work by strain doppler echocardiography andLV pressure: a new method for quantifying myocardial function. American Journalof Physiology-Heart and Circulatory Physiology, 288(5):H2375–H2380, 2005.
[244] Jurgen Duchenne, Piet Claus, Efstathios D Pagourelias, Razvan O Mada, Joeri VanPuyvelde, Kathleen Vunckx, Eric Verbeken, Olivier Gheysens, Filip Rega, and Jens-Uwe Voigt. Sheep can be used as animal model of regional myocardial remodellingand controllable work. Cardiology Journal, 2014.
[245] Kristoffer Russell, Morten Eriksen, Lars Aaberge, Nils Wilhelmsen, Helge Skulstad,Espen W Remme, Kristina H Haugaa, Anders Opdahl, Jan Gunnar Fjeld, Ola Gjes-dal, et al. A novel clinical method for quantification of regional left ventricularpressure–strain loop area: a non-invasive index of myocardial work. European heartjournal, 33(6):724–733, 2012.
[246] Marta Cvijic, Jurgen Duchenne, Serkan Unlu, Blazej Michalski, Marit Aarones, Ste-fan Winter, Svend Aakhus, Wolfgang Fehske, Ivan Stankovic, and Jens-Uwe Voigt.Timing of myocardial shortening determines left ventricular regional myocardialwork and regional remodelling in hearts with conduction delays. European HeartJournal-Cardiovascular Imaging, 2017.
184 BIBLIOGRAPHY
[247] Israel Mirsky, William J Corin, Tomoyuki Murakami, Joerg Grimm, Otto M Hess,and Hans P Krayenbuehl. Correction for preload in assessment of myocardial con-tractility in aortic and mitral valve disease. application of the concept of systolicmyocardial stiffness. Circulation, 78(1):68–80, 1988.
[248] Jorg van den Hoff, Liane Oehme, Georg Schramm, Jens Maus, Alexandr Lougovski,Jan Petr, Bettina Beuthien-Baumann, and Frank Hofheinz. The PET-derived tumor-to-blood standard uptake ratio (SUR) is superior to tumor SUV as a surrogateparameter of the metabolic rate of FDG. EJNMMI research, 3(1):77, 2013.
[249] Mickael Tanter, Jeremy Bercoff, Laurent Sandrin, and Mathias Fink. Ultrafast com-pound imaging for 2-D motion vector estimation: Application to transient elas-tography. IEEE transactions on ultrasonics, ferroelectrics, and frequency control,49(10):1363–1374, 2002.
[250] Lars Christian Naterstad Lervik, Birger Brekke, Svein Arne Aase, Mai ToneLønnebakken, Dordi Stensvag, Brage H Amundsen, Hans Torp, and Asbjorn Støylen.Myocardial strain rate by anatomic doppler spectrum: First clinical experience usingretrospective spectral tissue doppler from ultra-high frame rate imaging. Ultrasoundin Medicine & Biology, 43(9):1919–1929, 2017.
[251] Alejandra Ortega, Joao Pedrosa, Brecht Heyde, Ling Tong, and Jan D’hooge. Auto-matic definition of an anatomic field of view for volumetric cardiac motion estimationat high temporal resolution. Applied Sciences, 7(7):752, 2017.
[252] Alejandra Ortega, Dave Lines, Joao Pedrosa, Bidisha Chakraborty, Vangjush Ko-mini, Hans Gassert, and Jan D’hooge. HD-PULSE: High channel Density Pro-grammable ULtrasound System based on consumer Electronics. In Ultrasonics Sym-posium (IUS), 2015 IEEE International, pages 1–3, Oct 2015.
[253] Jiapu Pan and Willis J Tompkins. A real-time QRS detection algorithm. IEEEtransactions on biomedical engineering, (3):230–236, 1985.
[254] Daniel Rueckert, Luke I Sonoda, Carmel Hayes, Derek LG Hill, Martin O Leach, andDavid J Hawkes. Nonrigid registration using free-form deformations: application tobreast MR images. IEEE transactions on medical imaging, 18(8):712–721, 1999.
[255] Brecht Heyde, Szymon Cygan, Hon Fai Choi, Beata Lesniak-Plewinska, Daniel Bar-bosa, An Elen, Piet Claus, Dirk Loeckx, Krzysztof Kaluzynski, and Jan D’hooge.Regional cardiac motion and strain estimation in three-dimensional echocardiogra-phy: A validation study in thick-walled univentricular phantoms. IEEE transactionson ultrasonics, ferroelectrics, and frequency control, 59(4):668–682, 2012.
[256] Sarah Leclerc, Thomas Grenier, Florian Espinosa, and Olivier Bernard. A fully auto-matic and multi-structural segmentation of the left ventricle and the myocardium onhighly heterogeneous 2D echocardiographic data. In Ultrasonics Symposium (IUS),2017 IEEE International, pages 1–4. IEEE, 2017.
[257] Ozan Oktay, Enzo Ferrante, Konstantinos Kamnitsas, Mattias Heinrich, Wenjia Bai,Jose Caballero, Stuart A Cook, Antonio de Marvao, Timothy Dawes, Declan PO’Regan, et al. Anatomically constrained neural networks (ACNNs): applicationto cardiac image enhancement and segmentation. IEEE transactions on medicalimaging, 37(2):384–395, 2018.
[258] Tomasz A Timek and D Craig Miller. Experimental and clinical assessment of mitralannular area and dynamics: what are we actually measuring? The Annals of thoracicsurgery, 72(3):966–974, 2001.
BIBLIOGRAPHY 185
[259] William A Zoghbi, David Adams, Robert O Bonow, Maurice Enriquez-Sarano, ElyseFoster, Paul A Grayburn, Rebecca T Hahn, Yuchi Han, Judy Hung, Roberto M Lang,et al. Recommendations for noninvasive evaluation of native valvular regurgitation:a report from the american society of echocardiography developed in collaborationwith the society for cardiovascular magnetic resonance. Journal of the AmericanSociety of Echocardiography, 30(4):303–371, 2017.
[260] Helmut Baumgartner, Judy Hung, Javier Bermejo, John B Chambers, Arturo Evan-gelista, Brian P Griffin, Bernard Iung, Catherine M Otto, Patricia A Pellikka, andMiguel Quinones. Echocardiographic assessment of valve stenosis: EAE/ASE rec-ommendations for clinical practice. Journal of the American Society of Echocardio-graphy, 22(1):1–23, 2009.
[261] Nozomi Watanabe, Yasuo Ogasawara, Yasuko Yamaura, Nozomi Wada, TakahiroKawamoto, Eiji Toyota, Takashi Akasaka, and Kiyoshi Yoshida. Mitral annulusflattens in ischemic mitral regurgitation: geometric differences between inferior andanterior myocardial infarction. Circulation, 112(9 suppl):I–458, 2005.
[262] Jasmine Grewal, Rakesh Suri, Sunil Mankad, Akiko Tanaka, Douglas W Mahoney,Hartzell V Schaff, Fletcher A Miller, and Maurice Enriquez-Sarano. Mitral annulardynamics in myxomatous valve disease: new insights with real-time 3-dimensionalechocardiography. Circulation, 121(12):1423–1431, 2010.
[263] Starr R Kaplan, Gerard Bashein, Florence H Sheehan, Malcolm E Legget, BradMunt, Xiang-Ning Li, Murali Sivarajan, Edward L Bolson, Merrilinn Zeppa, M Ar-cha, et al. Three-dimensional echocardiographic assessment of annular shape changesin the normal and regurgitant mitral valve. American heart journal, 139(3):378–387,2000.
[264] Jorina Langerveld, Gabriel Valocik, HW Thijs Plokker, Sjef MPG Ernst, Herman FJMannaerts, Johannes C Kelder, Otto Kamp, and Wybren Jaarsma. Additionalvalue of three-dimensional transesophageal echocardiography for patients with mitralvalve stenosis undergoing balloon valvuloplasty. Journal of the American Society ofEchocardiography, 16(8):841–849, 2003.
[265] Dominik Schlosshan, Gunjan Aggarwal, Gita Mathur, Roger Allan, and Greg Cran-ney. Real-time 3D transesophageal echocardiography for the evaluation of rheumaticmitral stenosis. JACC: Cardiovascular Imaging, 4(6):580–588, 2011.
[266] Alex Pui-Wai Lee, Ming C Hsiung, Ivan S Salgo, Fang Fang, Jun-Min Xie, Yan-Chao Zhang, Qing-Shan Lin, Jen-Li Looi, Song Wan, Randolph HL Wong, et al.Quantitative analysis of mitral valve morphology in mitral valve prolapse using real-time three-dimensional echocardiography: importance of annular saddle-shape inpathogenesis of mitral regurgitation. Circulation, page 112, 2012.
[267] Karima Addetia, Victor Mor-Avi, Lynn Weinert, Ivan S Salgo, and Roberto M Lang.A new definition for an old entity: improved definition of mitral valve prolapse usingthree-dimensional echocardiography and color-coded parametric models. Journal ofthe American Society of Echocardiography, 27(1):8–16, 2014.
[268] Feroze Mahmood, Balachundhar Subramaniam, Joseph H Gorman, Robert MLevine, Robert C Gorman, Andrew Maslow, Peter J Panzica, Robert M Hag-berg, Swaminathan Karthik, and Kamal R Khabbaz. Three-dimensional echocar-diographic assessment of changes in mitral valve geometry after valve repair. TheAnnals of thoracic surgery, 88(6):1838–1844, 2009.
186 BIBLIOGRAPHY
[269] Feroze Mahmood, Joseph H Gorman, Balachundhar Subramaniam, Robert C Gor-man, Peter J Panzica, Robert C Hagberg, Adam B Lerner, Philip E Hess, AndrewMaslow, and Kamal R Khabbaz. Changes in mitral valve annular geometry afterrepair: saddle-shaped versus flat annuloplasty rings. The Annals of thoracic surgery,90(4):1212–1220, 2010.
[270] Gary P Foster, Adam K Dunn, Selwin Abraham, Naser Ahmadi, and Guilda Sarraf.Accurate measurement of mitral annular dimensions by echocardiography: impor-tance of correctly aligned imaging planes and anatomic landmarks. Journal of theAmerican Society of Echocardiography, 22(5):458–463, 2009.
[271] Patric Biaggi, Sean Jedrzkiewicz, Christiane Gruner, Massimiliano Meineri, JacekKarski, Annette Vegas, Felix C Tanner, Harry Rakowski, Joan Ivanov, Tirone EDavid, et al. Quantification of mitral valve anatomy by three-dimensional trans-esophageal echocardiography in mitral valve prolapse predicts surgical anatomy andthe complexity of mitral valve repair. Journal of the American Society of Echocar-diography, 25(7):758–765, 2012.
[272] Robert J Schneider, Douglas P Perrin, Nikolay V Vasilyev, Gerald R Marx, J Pedro,and Robert D Howe. Mitral annulus segmentation from 3D ultrasound using graphcuts. IEEE Transactions on Medical Imaging, 29(9):1676–1687, 2010.
[273] Robert J Schneider, Neil A Tenenholtz, Douglas P Perrin, Gerald R Marx, J Pedro,and Robert D Howe. Patient-specific mitral leaflet segmentation from 4D ultrasound.In International Conference on Medical Image Computing and Computer-AssistedIntervention, pages 520–527. Springer, 2011.
[274] Philippe Burlina, Chad Sprouse, Daniel DeMenthon, Anne Jorstad, Radford Juang,Francisco Contijoch, Theodore Abraham, David Yuh, and Elliot McVeigh. Patient-specific modeling and analysis of the mitral valve using 3D-TEE. In InternationalConference on Information Processing in Computer-Assisted Interventions, pages135–146. Springer, 2010.
[275] Razvan Ioan Ionasec, Ingmar Voigt, Bogdan Georgescu, Yang Wang, Helene Houle,Fernando Vega-Higuera, Nassir Navab, and Dorin Comaniciu. Patient-specific mod-eling and quantification of the aortic and mitral valves from 4-D cardiac CT andTEE. IEEE transactions on medical imaging, 29(9):1636–1651, 2010.
[276] Alison M Pouch, Hongzhi Wang, Manabu Takabe, Benjamin M Jackson, Joseph HGorman, Robert C Gorman, Paul A Yushkevich, and Chandra M Sehgal. Fully au-tomatic segmentation of the mitral leaflets in 3D transesophageal echocardiographicimages using multi-atlas joint label fusion and deformable medial modeling. Medicalimage analysis, 18(1):118–129, 2014.
[277] Miguel Sotaquira, Mauro Pepi, Laura Fusini, Francesco Maffessanti, Roberto MLang, and Enrico G Caiani. Semi-automated segmentation and quantification ofmitral annulus and leaflets from transesophageal 3-D echocardiographic images. Ul-trasound in Medicine and Biology, 41(1):251–267, 2015.
[278] Henri De Veene, Philippe B Bertrand, Natasa Popovic, Pieter M Vandervoort, PietClaus, Matthieu De Beule, and Brecht Heyde. Automatic mitral annulus tracking involumetric ultrasound using non-rigid image registration. In Engineering in Medicineand Biology Society (EMBC), 2015 37th Annual International Conference of theIEEE, pages 1985–1988. IEEE, 2015.
[279] Sorina Mihaila, Denisa Muraru, Eleonora Piasentini, Marcelo Haertel Miglioranza,Diletta Peluso, Umberto Cucchini, Sabino Iliceto, Dragos Vinereanu, and Luigi P

BIBLIOGRAPHY 187
Badano. Quantitative analysis of mitral annular geometry and function in healthyvolunteers using transthoracic three-dimensional echocardiography. Journal of theAmerican Society of Echocardiography, 27(8):846–857, 2014.
[280] Alejandro F Frangi, Wiro J Niessen, Koen L Vincken, and Max A Viergever. Mul-tiscale vessel enhancement filtering. In International Conference on Medical ImageComputing and Computer-Assisted Intervention, pages 130–137. Springer, 1998.
[281] Jun Kwan, Min-Jae Jeon, Dae-Hyeok Kim, Keum-Soo Park, and Woo-Hyung Lee.Does the mitral annulus shrink or enlarge during systole? A real-time 3D echocar-diography study. Journal of Korean medical science, 24(2):203–208, 2009.

188 BIBLIOGRAPHY

List of publications
International Journals
Joao Pedrosa, Daniel Barbosa, Nuno Almeida, Olivier Bernard, Johan Bosch,and Jan D’hooge. Cardiac chamber volumetric assessment using 3D ultrasound - areview. Current Pharmaceutical Design, 2016.
Alejandra Ortega, Joao Pedrosa, Brecht Heyde, Ling Tong, and Jan D’hooge.Automatic definition of an anatomic field of view for volumetric cardiac motionestimation at high temporal resolution. Applied Sciences, 7(7):752, 2017.
Daniel Barbosa, Joao Pedrosa, Brecht Heyde, Thomas Dietenbeck, Denis Fri-boulet, Olivier Bernard, and Jan D’hooge. heartBEATS: A hybrid energy approachfor real-time B-spline explicit active tracking of surfaces. Computerized MedicalImaging and Graphics, 2017.
Joao Pedrosa, Daniel Barbosa, Brecht Heyde, Frederic Schnell, Assami Rosner,Piet Claus, and Jan D’hooge. Left ventricular myocardial segmentation in 3-D ultra-sound recordings: Effect of different endocardial and epicardial coupling strategies.IEEE transactions on ultrasonics, ferroelectrics, and frequency control, 64(3):525536, 2017.
Joao Pedrosa, Sandro Queiros, Olivier Bernard, Jan Engvall, Thor Edvardsen,Eike Nagel, and Jan D’hooge. Fast and fully automatic left ventricular segmenta-tion and tracking in echocardiography using shape-based B-spline explicit activesurfaces. IEEE Transactions on Medical Imaging, 2017.
Assami Rosner, Tigran Khalapyan, Joao Pedrosa, Havard Dalen, Doff B.McElhinney, Mark K. Friedberg, George K. Lui. Ventricular mechanics in ado-lescent and adult patients with a Fontan circulation: Relation to geometry and wallstress. Echocardiography, 2018.
Joao Pedrosa, Jurgen Duchenne, Sandro Queiros, Ganna Degtiarova, PietClaus, Jens-Uwe Voigt, Jan D’hooge. Non-invasive myocardial performance map-ping using 3D echocardiographic stress-strain loops: validation against PET. (sub-mitted for publication).
Pedro Santos, Aniela Petrescu, Joao Pedrosa, Marta Orlowska, Vangjush Ko-mini, Jens-Uwe Voigt, Jan D’hooge. Natural shear wave imaging in the humanheart: normal values, feasibility and reproducibility. (submitted for publication).
189
190 LIST OF PUBLICATIONS
Aniela Petrescu, Pedro Santos, Marta Orlowska, Joao Pedrosa, StephanieBezy, Bidisha Chakraborty, Marta Cvijic, Monica Dobrovie, Michel Delforge, JanD’hooge, Jens-Uwe Voigt. Velocity of naturally occurring myocardial shear wavesto assess myocardial stiffness. (submitted for publication).
Bidisha Chakraborty, Joao Pedrosa, Oana Mirea, Brecht Heyde, Jens-UweVoigt, Jan D’hooge. Clinical validation of 2D non-rigid image registration and esti-mation of accuracy in assessment of global and regional dysfunctionality in cardiacimages. (submitted for publication).
International Conference Proceedings
Alejandra Ortega, Joao Pedrosa, Brecht Heyde, Ling Tong, and Jan D’hooge.An automatic method for determining the anatomical relevant space for fast volu-metric cardiac imaging. In 2015 IEEE International Ultrasonics Symposium (IUS),pages 14, Oct 2015.
Alejandra Ortega, Dave Lines, Joao Pedrosa, Bidisha Chakraborty, VangjushKomini, Hans Gassert, and Jan D’hooge. HD-PULSE: High channel Density Pro-grammable ULtrasound System based on consumer Electronics. In 2015 IEEEInternational Ultrasonics Symposium (IUS), pages 1-3, Oct 2015.
Joao Pedrosa, Brecht Heyde, Laurens Heeren, Jan Engvall, Jose Zamorano,Alexandros Papachristidis, Thor Edvardsen, Piet Claus, and Jan D’hooge. Auto-matic short axis orientation of the left ventricle in 3D ultrasound recordings. InSPIE Medical Imaging 2016: Ultrasonic Imaging and Tomography, volume 9790,pages 97900E, 2016.
Joao Pedrosa, Vangjush Komini, Jurgen Duchenne, and Jan D’hooge. Real-time anatomical imaging of the heart on an experimental ultrasound system. In2017 IEEE International Ultrasonics Symposium (IUS), Sep 2017.
Pedro Santos, Nadezhda Koriakina, Bidisha Chakraborty, Joao Pedrosa, Vang-jush Komini, and Jan D’hooge. Phase coherence beamforming to enhance myocar-dial speckle tracking performance. In 2017 IEEE International Ultrasonics Sympo-sium (IUS), Sep 2017.
Pedro Santos, Joao Pedrosa, and Jan D’hooge. High frame rate multi-planeechocardiography using multi-line transmit beamforming: First experimental find-ings. In 2017 IEEE International Ultrasonics Symposium (IUS), Sep 2017.
Bidisha Chakraborty, Joao Pedrosa, Vangjush Komini, Brecht Heyde, and JanD’hooge. RF-NRIR for motion estimation in fast cardiac anatomical imaging. In2017 IEEE International Ultrasonics Symposium (IUS), Sep 2017.
Joao Pedrosa, Sandro Queiros, Joao Vilaca, Luigi Badano, Jan D’hooge. Fullyautomatic assessment of mitral valve morphology from 3D transthoracic echocar-diography. In Ultrasonics Symposium (IUS), 2018 IEEE International, Oct 2018(accepted for publication).

Acknowledgement, PersonalContribution and Conflicts ofInterest
Scientific Acknowledgment
This thesis was supported by the European Research Council under the Euro-pean Union’s Seventh Framework Program (HeartMAPAS; FP7/2007-2013/ERC)under Grant 281748.
Personal Contribution
I hereby assert that the personal contributions to this thesis included but werenot limited to:
Conception, implementation and validation of the frameworks detailed inChapters 4-7 and Appendix A;
Implementation of the tools described in Chapters 8;
Implementation of the framework in real-time for ECG triggering, LV segmen-tation and anatomical scan sequence generation and processing of the dataacquired in Chapter 10;
Patient selection, processing of RT3DE data and conception and validation ofthe framework used in Chapter 9;
Writing of the papers included in this thesis and the remaining chapters.
Conflicts of Interest
I hereby assert that there are no conflicts of interest (both personal and institu-tional) regarding specific financial interests that are relevant to the work reportedin this thesis.
191
Related Documents