Sedimentation rates and subsidence in the Southern Tyrrhenian Basin V. Pasquale*, P. Chiozzi & M. Verdoya Dipartimento per lo Studio del Territorio e delle sue Risorse, Settore di Geofisica, Universita ` di Genova, Viale Benedetto XV, 5, I-16132, Genova, Italy; *Author for correspondence (E-mail: [email protected]; fax +39-10-352169) Received 24 January 2005; accepted 28 October 2005 Key words: back-arc basin, compaction, isostasy, mass accumulation rate, porosity, subsidence analysis Abstract The petrophysical properties of sediment drill core samples recovered from the Sardinian margin and the abyssal plain of the Southern Tyrrhenian Basin were used to estimate the downhole change in porosity and rates of deposition and mass accumulation. We calculated how the deposited material has changed its thickness as a function of depth, and corrected the thickness for the compaction. The corresponding porosity variation with depth for terrigenous and pelagic sediments and evaporites was modelled according to an exponential law. The mass accumulation rate for the Plio-Quaternary is on average 4.810 4 kg m )2 my )1 on the Sardinian margin and for the Pliocene in the abyssal plain. In the latter area, the Quaternary attains its greatest thickness and a mass accumulation rate of 11– 4010 4 kg m )2 my )1 . The basement response to sediment loading was calculated with Airy-type backstripping. On the lower part of the Sardinian margin, the basement subsidence rate due to sediment loading has decreased from a value of 300 m my )1 in the Tortonian and during the Messinian salinity crisis (7.0–5.33 Ma) to about 5 m my )1 in the Plio-Quaternary. In contrast, on the abyssal plain this rate has changed from 8–50 m my )1 during the period 3.6–0.46 Ma, to 95–130 m my )1 since 0.46 Ma, with the largest values in the Marsili Basin. The correlation between age and the depth to the basement corrected for the loading of the sediment in the ocean domain of the Tyrrhenian Basin argues for a young age of basin formation. Introduction Considerable efforts have been carried out in the last two decades to quantify the geological pro- cesses that have led to the formation of the Southern Tyrrhenian Basin (Figure 1). These pro- cesses have involved lithosphere extension and subsequent ocean spreading in its abyssal plain, which lies above a narrow west-dipping litho- spheric slab, clearly outlined by the seismic activity and heat flux (Pasquale et al., 2005, and references therein). The average basement depth in the deepest parts, floored by oceanic crust and char- acterized by enhanced terrestrial heat flux, and the dip angle of the subducting slab argue for a back- arc basin of young age (9–7 Ma) (Pasquale et al., 1999). The Sardinian passive margin, forming the western side of the basin, is thought to have been stretched and thinned by rotational normal faults prior to ocean opening (Spadini et al., 1995). The eastern rifted margin, running from the western side of the Italian peninsula to northern Sicily, is affected by volcanic activity. The anomalously high surface heat flux on this margin reflects an additional thermal contribution due to crustal underplating of magma resulting from partial melting within a hotter than normal asthenosphere (Pasquale et al., 2003). This paper tackles the integrated analysis of stratigraphic data and petrophysical properties of the sedimentary cover, derived during several drilling legs in the Southern Tyrrhenian Basin, to document the spatial–temporal distribution of sediments, which can be used as an additional tool to study the tectonic history of the back-arc basin. We focus on the accumulation and sedimentation rates with particular reference to the recent Plio- Quaternary deposition. The subsidence history due to sediment load was inferred at selected holes. For this purpose, we considered the major structural elements of the cover, together with porosity, bulk and grain density data of core samples. The analysis was divided into the following steps: (i) determination of curves of porosity versus depth Marine Geophysical Researches (2006) 27:155–165 ȑ Springer 2006 DOI 10.1007/s11001-005-4564-1

Welcome message from author
This document is posted to help you gain knowledge. Please leave a comment to let me know what you think about it! Share it to your friends and learn new things together.
Transcript
Sedimentation rates and subsidence in the Southern Tyrrhenian Basin
V. Pasquale*, P. Chiozzi & M. VerdoyaDipartimento per lo Studio del Territorio e delle sue Risorse, Settore di Geofisica, Universita di Genova, VialeBenedetto XV, 5, I-16132, Genova, Italy; *Author for correspondence (E-mail: [email protected];fax +39-10-352169)
Received 24 January 2005; accepted 28 October 2005
Key words: back-arc basin, compaction, isostasy, mass accumulation rate, porosity, subsidence analysis
Abstract
The petrophysical properties of sediment drill core samples recovered from the Sardinian margin and the abyssal plain of the SouthernTyrrhenian Basin were used to estimate the downhole change in porosity and rates of deposition and mass accumulation. Wecalculated how the deposited material has changed its thickness as a function of depth, and corrected the thickness for the compaction.The corresponding porosity variation with depth for terrigenous and pelagic sediments and evaporites was modelled according to anexponential law. The mass accumulation rate for the Plio-Quaternary is on average 4.8�104 kg m)2 my)1 on the Sardinian margin andfor the Pliocene in the abyssal plain. In the latter area, the Quaternary attains its greatest thickness and a mass accumulation rate of 11–40�104 kg m)2 my)1. The basement response to sediment loading was calculated with Airy-type backstripping. On the lower partof the Sardinian margin, the basement subsidence rate due to sediment loading has decreased from a value of 300 m my)1 in theTortonian and during the Messinian salinity crisis (7.0–5.33 Ma) to about 5 m my)1 in the Plio-Quaternary. In contrast, on the abyssalplain this rate has changed from 8–50 m my)1 during the period 3.6–0.46 Ma, to 95–130 m my)1 since 0.46 Ma, with the largest valuesin the Marsili Basin. The correlation between age and the depth to the basement corrected for the loading of the sediment in the oceandomain of the Tyrrhenian Basin argues for a young age of basin formation.
Introduction
Considerable efforts have been carried out in thelast two decades to quantify the geological pro-cesses that have led to the formation of theSouthern Tyrrhenian Basin (Figure 1). These pro-cesses have involved lithosphere extension andsubsequent ocean spreading in its abyssal plain,which lies above a narrow west-dipping litho-spheric slab, clearly outlined by the seismic activityand heat flux (Pasquale et al., 2005, and referencestherein). The average basement depth in thedeepest parts, floored by oceanic crust and char-acterized by enhanced terrestrial heat flux, and thedip angle of the subducting slab argue for a back-arc basin of young age (9–7 Ma) (Pasquale et al.,1999). The Sardinian passive margin, forming thewestern side of the basin, is thought to have beenstretched and thinned by rotational normal faultsprior to ocean opening (Spadini et al., 1995). Theeastern rifted margin, running from the westernside of the Italian peninsula to northern Sicily, is
affected by volcanic activity. The anomalouslyhigh surface heat flux on this margin reflects anadditional thermal contribution due to crustalunderplating of magma resulting from partialmelting within a hotter than normal asthenosphere(Pasquale et al., 2003).
This paper tackles the integrated analysis ofstratigraphic data and petrophysical properties ofthe sedimentary cover, derived during severaldrilling legs in the Southern Tyrrhenian Basin, todocument the spatial–temporal distribution ofsediments, which can be used as an additional toolto study the tectonic history of the back-arc basin.We focus on the accumulation and sedimentationrates with particular reference to the recent Plio-Quaternary deposition. The subsidence history dueto sediment load was inferred at selected holes. Forthis purpose, we considered the major structuralelements of the cover, together with porosity, bulkand grain density data of core samples. Theanalysis was divided into the following steps: (i)determination of curves of porosity versus depth
Marine Geophysical Researches (2006) 27:155–165 � Springer 2006DOI 10.1007/s11001-005-4564-1
for each lithology; (ii) estimate of the depositionalrate for defined decompacted stratigraphic inter-vals; (iii) backstripping of sediments corrected forcompaction and calculation of subsidence due tosediment loading in the holes that reached thebasement. Finally, for the abyssal plain we com-pared the depth to the basement corrected for theloading of the sediment obtained in our analysiswith the values inferred from an age-depth modelfor back-arc basins.
Sedimentary cover
Principal domains
The abyssal plain of the Tyrrhenian Basin isdivided into two basins, Magnaghi-Vavilov, to the
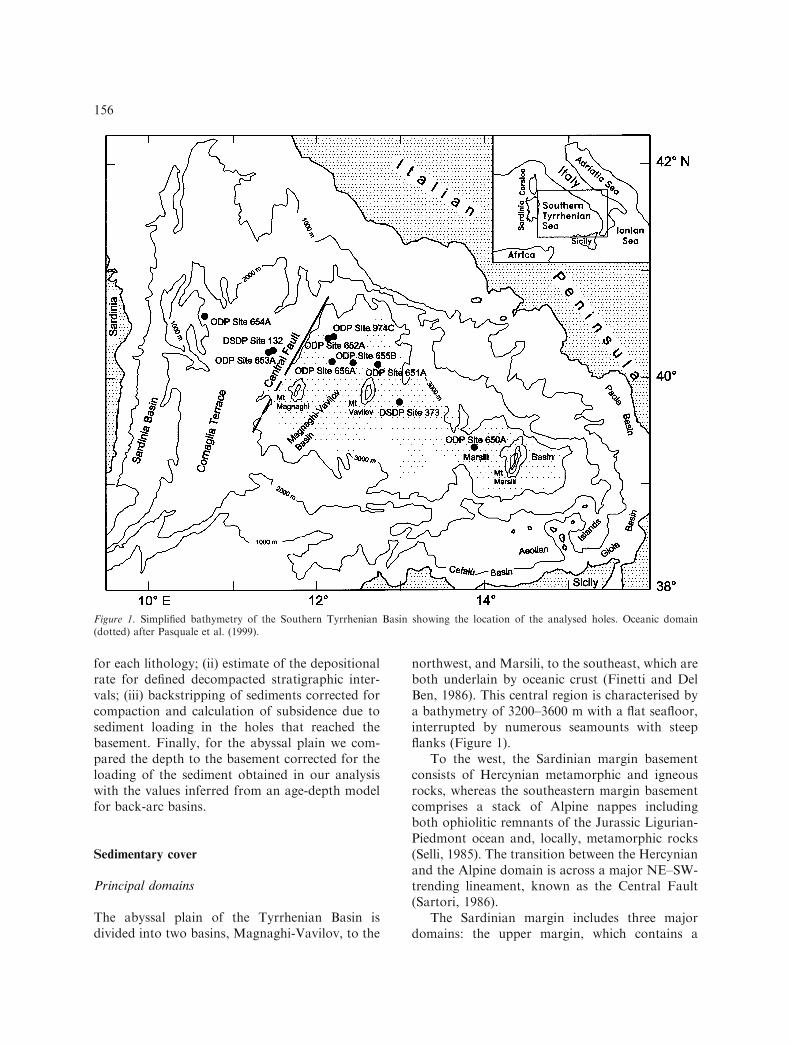
northwest, and Marsili, to the southeast, which areboth underlain by oceanic crust (Finetti and DelBen, 1986). This central region is characterised bya bathymetry of 3200–3600 m with a flat seafloor,interrupted by numerous seamounts with steepflanks (Figure 1).
To the west, the Sardinian margin basementconsists of Hercynian metamorphic and igneousrocks, whereas the southeastern margin basementcomprises a stack of Alpine nappes includingboth ophiolitic remnants of the Jurassic Ligurian-Piedmont ocean and, locally, metamorphic rocks(Selli, 1985). The transition between the Hercynianand the Alpine domain is across a major NE–SW-trending lineament, known as the Central Fault(Sartori, 1986).
The Sardinian margin includes three majordomains: the upper margin, which contains a
Figure 1. Simplified bathymetry of the Southern Tyrrhenian Basin showing the location of the analysed holes. Oceanic domain(dotted) after Pasquale et al. (1999).
156
north–south elongated basin (Sardinia Basin);the middle margin, corresponding to a very flatdomain extending to 2500 m depth (CornagliaTerrace) suddenly interrupted eastward by theCentral Fault; the lower margin, which extendsbetween 3000 and 3200 m depth and is floored byvery thin continental crust, adjacent to the oceanicdomain. The southeastern margin of the basinshows water depth similar to the conjugateSardinian margin, and a number of small sedi-mentary basins such as the Paola, Gioia andCefalu Basins (Fabbri and Curzi, 1979; Pasqualeet al., 1999; Spadini et al., 1995).
Deposited successions
Results from a dense grid of seismic reflectionsurveys carried out over several years have allowedscientists to propose stratigraphic and facies inter-pretations for the Tyrrhenian Sea (e.g. Finetti andDel Ben, 1986; Finetti and Morelli, 1973; Malin-verno et al., 1981; Rehault et al., 1987). Theseresults are partly constrained by data derived fromthe Deep Sea Drilling Project (DSDP) holes of Leg13 (Ryan et al., 1973) and Leg 42 (Hsu et al.,1978). In addition, Kastens et al. (1987 and 1988),Mascle and Rehault (1990) and Spadini et al.(1995) proposed a reliable seismic stratigraphybased on the Ocean Drilling Program (ODP) Leg107 results and multichannel seismic lines, re-corded during the site-survey cruise. Furtherinformation about the most recent sedimentarysequence was gained during the ODP Leg 161(Comas et al., 1996).
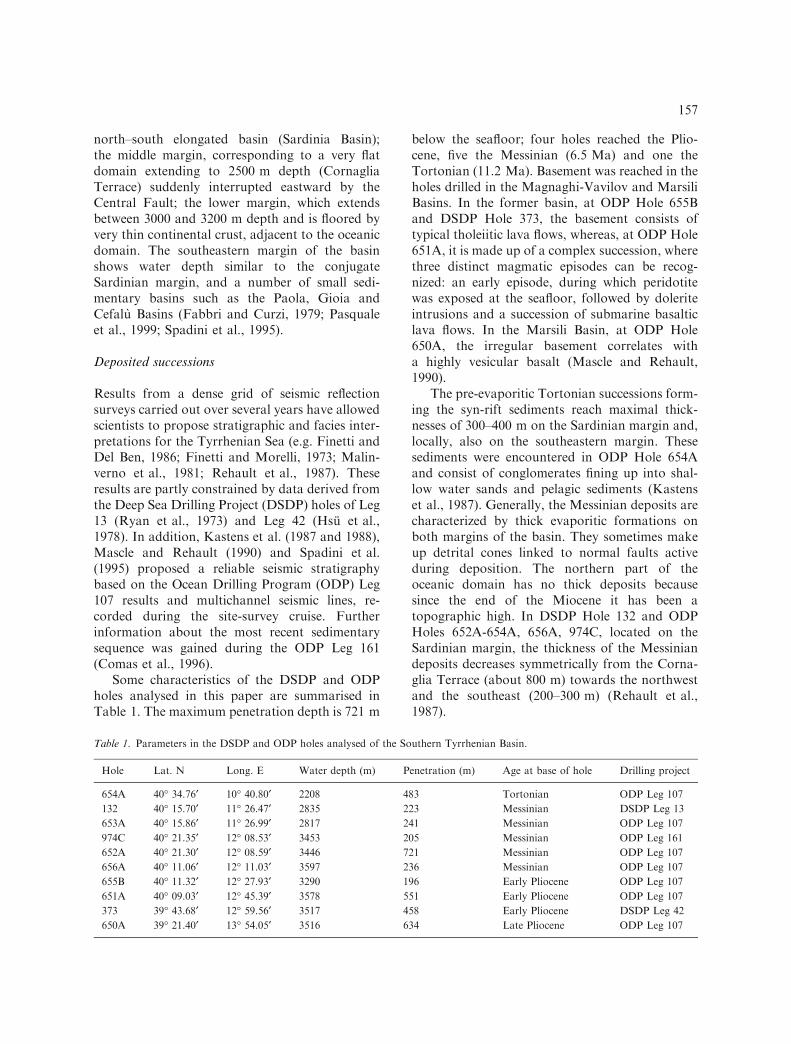
Some characteristics of the DSDP and ODPholes analysed in this paper are summarised inTable 1. The maximum penetration depth is 721 m
below the seafloor; four holes reached the Plio-cene, five the Messinian (6.5 Ma) and one theTortonian (11.2 Ma). Basement was reached in theholes drilled in the Magnaghi-Vavilov and MarsiliBasins. In the former basin, at ODP Hole 655Band DSDP Hole 373, the basement consists oftypical tholeiitic lava flows, whereas, at ODP Hole651A, it is made up of a complex succession, wherethree distinct magmatic episodes can be recog-nized: an early episode, during which peridotitewas exposed at the seafloor, followed by doleriteintrusions and a succession of submarine basalticlava flows. In the Marsili Basin, at ODP Hole650A, the irregular basement correlates witha highly vesicular basalt (Mascle and Rehault,1990).
The pre-evaporitic Tortonian successions form-ing the syn-rift sediments reach maximal thick-nesses of 300–400 m on the Sardinian margin and,locally, also on the southeastern margin. Thesesediments were encountered in ODP Hole 654Aand consist of conglomerates fining up into shal-low water sands and pelagic sediments (Kastenset al., 1987). Generally, the Messinian deposits arecharacterized by thick evaporitic formations onboth margins of the basin. They sometimes makeup detrital cones linked to normal faults activeduring deposition. The northern part of theoceanic domain has no thick deposits becausesince the end of the Miocene it has been atopographic high. In DSDP Hole 132 and ODPHoles 652A-654A, 656A, 974C, located on theSardinian margin, the thickness of the Messiniandeposits decreases symmetrically from the Corna-glia Terrace (about 800 m) towards the northwestand the southeast (200–300 m) (Rehault et al.,1987).
Table 1. Parameters in the DSDP and ODP holes analysed of the Southern Tyrrhenian Basin.
Hole Lat. N Long. E Water depth (m) Penetration (m) Age at base of hole Drilling project
654A 40� 34.76¢ 10� 40.80¢ 2208 483 Tortonian ODP Leg 107
132 40� 15.70¢ 11� 26.47¢ 2835 223 Messinian DSDP Leg 13
653A 40� 15.86¢ 11� 26.99¢ 2817 241 Messinian ODP Leg 107
974C 40� 21.35¢ 12� 08.53¢ 3453 205 Messinian ODP Leg 161
652A 40� 21.30¢ 12� 08.59¢ 3446 721 Messinian ODP Leg 107
656A 40� 11.06¢ 12� 11.03¢ 3597 236 Messinian ODP Leg 107
655B 40� 11.32¢ 12� 27.93¢ 3290 196 Early Pliocene ODP Leg 107
651A 40� 09.03¢ 12� 45.39¢ 3578 551 Early Pliocene ODP Leg 107
373 39� 43.68¢ 12� 59.56¢ 3517 458 Early Pliocene DSDP Leg 42
650A 39� 21.40¢ 13� 54.05¢ 3516 634 Late Pliocene ODP Leg 107
157
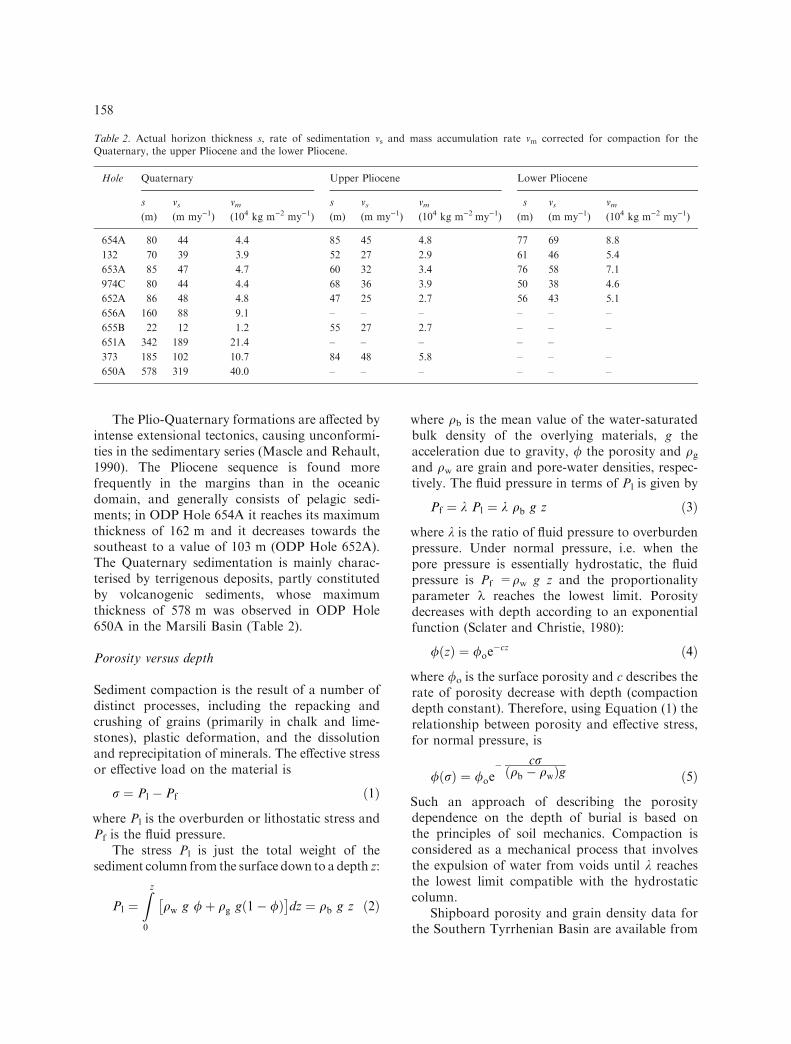
The Plio-Quaternary formations are affected byintense extensional tectonics, causing unconformi-ties in the sedimentary series (Mascle and Rehault,1990). The Pliocene sequence is found morefrequently in the margins than in the oceanicdomain, and generally consists of pelagic sedi-ments; in ODP Hole 654A it reaches its maximumthickness of 162 m and it decreases towards thesoutheast to a value of 103 m (ODP Hole 652A).The Quaternary sedimentation is mainly charac-terised by terrigenous deposits, partly constitutedby volcanogenic sediments, whose maximumthickness of 578 m was observed in ODP Hole650A in the Marsili Basin (Table 2).
Porosity versus depth
Sediment compaction is the result of a number ofdistinct processes, including the repacking andcrushing of grains (primarily in chalk and lime-stones), plastic deformation, and the dissolutionand reprecipitation of minerals. The effective stressor effective load on the material is
r ¼ Pl � Pf ð1Þ
where Pl is the overburden or lithostatic stress andPf is the fluid pressure.
The stress Pl is just the total weight of thesediment column from the surface down to a depth z:
Pl ¼Zz
0
qw g /þ qg g 1� /ð Þ� �
dz ¼ qb g z ð2Þ
where qb is the mean value of the water-saturatedbulk density of the overlying materials, g theacceleration due to gravity, / the porosity and qg
and qw are grain and pore-water densities, respec-tively. The fluid pressure in terms of Pl is given by
Pf ¼ k Pl ¼ k qb g z ð3Þ
where k is the ratio of fluid pressure to overburdenpressure. Under normal pressure, i.e. when thepore pressure is essentially hydrostatic, the fluidpressure is Pf =qw g z and the proportionalityparameter k reaches the lowest limit. Porositydecreases with depth according to an exponentialfunction (Sclater and Christie, 1980):
/ zð Þ ¼ /oe�cz ð4Þ
where /o is the surface porosity and c describes therate of porosity decrease with depth (compactiondepth constant). Therefore, using Equation (1) therelationship between porosity and effective stress,for normal pressure, is
/ rð Þ ¼ /oe� cr
qb � qwð Þg ð5Þ
Such an approach of describing the porositydependence on the depth of burial is based onthe principles of soil mechanics. Compaction isconsidered as a mechanical process that involvesthe expulsion of water from voids until k reachesthe lowest limit compatible with the hydrostaticcolumn.
Shipboard porosity and grain density data forthe Southern Tyrrhenian Basin are available from
Table 2. Actual horizon thickness s, rate of sedimentation vs and mass accumulation rate vm corrected for compaction for theQuaternary, the upper Pliocene and the lower Pliocene.
Hole Quaternary Upper Pliocene Lower Pliocene
s
(m)
vs(m my)1)
vm(104 kg m)2 my)1)
s
(m)
vs(m my)1)
vm(104 kg m)2 my)1)
s
(m)
vs(m my)1)
vm(104 kg m)2 my)1)
654A 80 44 4.4 85 45 4.8 77 69 8.8
132 70 39 3.9 52 27 2.9 61 46 5.4
653A 85 47 4.7 60 32 3.4 76 58 7.1
974C 80 44 4.4 68 36 3.9 50 38 4.6
652A 86 48 4.8 47 25 2.7 56 43 5.1
656A 160 88 9.1 – – – – – –
655B 22 12 1.2 55 27 2.7 – – –
651A 342 189 21.4 – – – – –
373 185 102 10.7 84 48 5.8 – – –
650A 578 319 40.0 – – – – – –
158
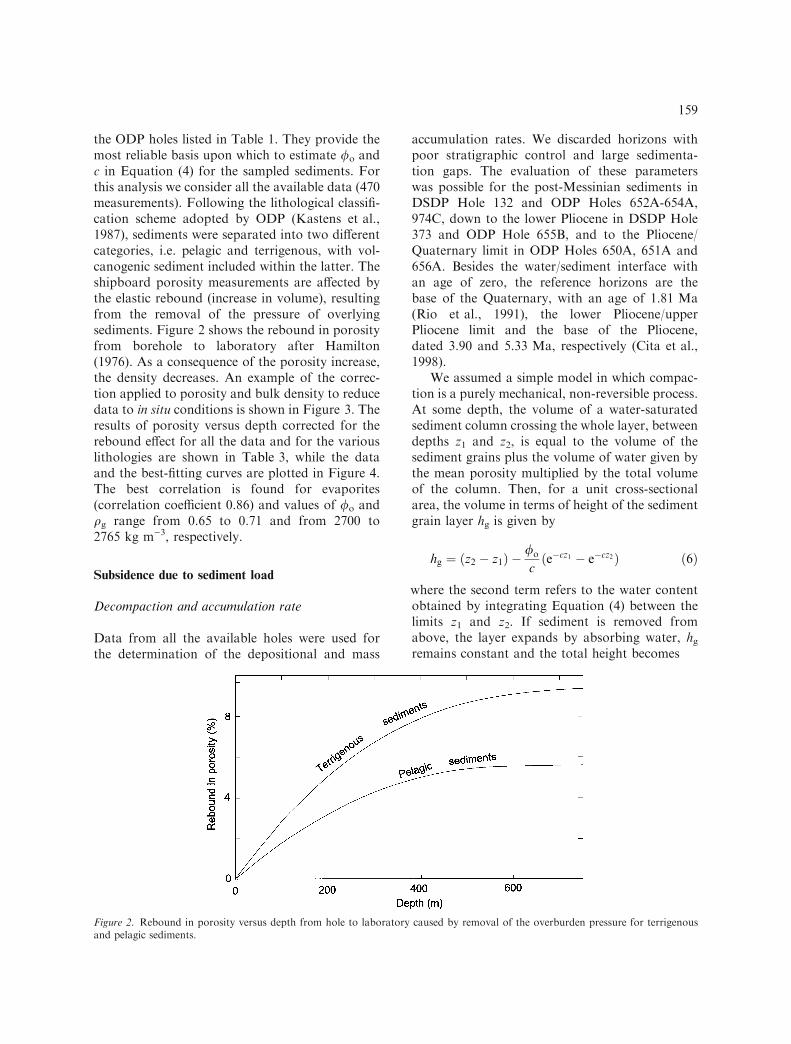
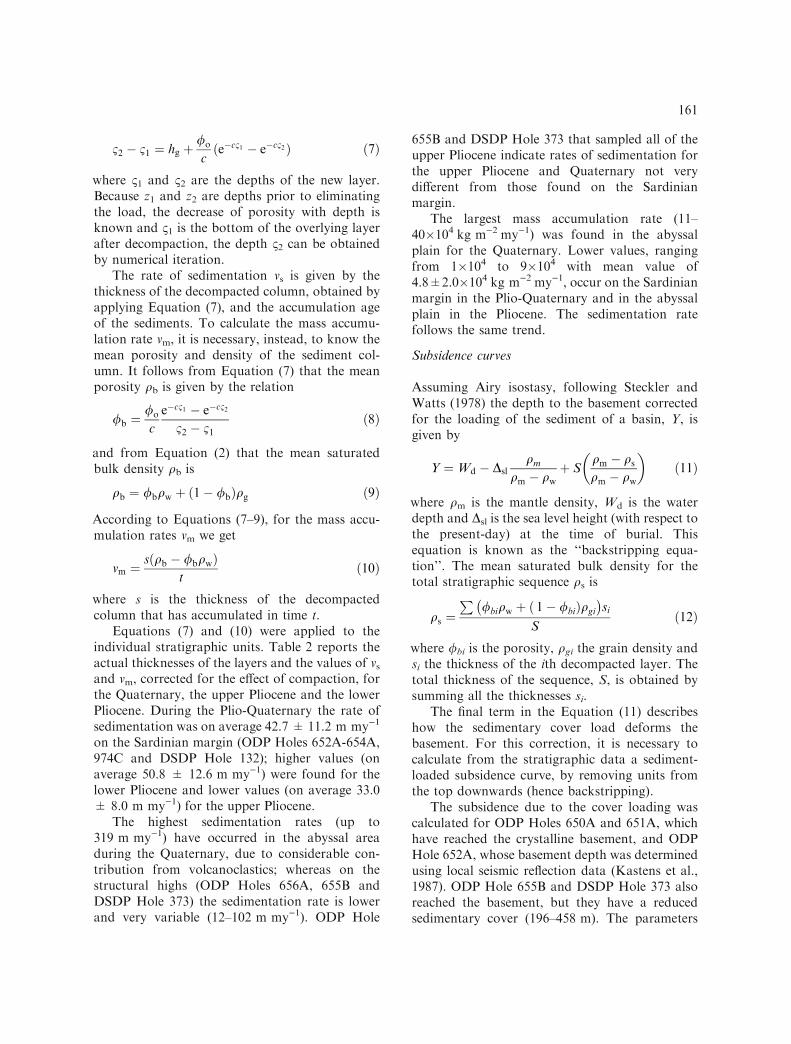
the ODP holes listed in Table 1. They provide themost reliable basis upon which to estimate /o andc in Equation (4) for the sampled sediments. Forthis analysis we consider all the available data (470measurements). Following the lithological classifi-cation scheme adopted by ODP (Kastens et al.,1987), sediments were separated into two differentcategories, i.e. pelagic and terrigenous, with vol-canogenic sediment included within the latter. Theshipboard porosity measurements are affected bythe elastic rebound (increase in volume), resultingfrom the removal of the pressure of overlyingsediments. Figure 2 shows the rebound in porosityfrom borehole to laboratory after Hamilton(1976). As a consequence of the porosity increase,the density decreases. An example of the correc-tion applied to porosity and bulk density to reducedata to in situ conditions is shown in Figure 3. Theresults of porosity versus depth corrected for therebound effect for all the data and for the variouslithologies are shown in Table 3, while the dataand the best-fitting curves are plotted in Figure 4.The best correlation is found for evaporites(correlation coefficient 0.86) and values of /o andqg range from 0.65 to 0.71 and from 2700 to2765 kg m)3, respectively.
Subsidence due to sediment load
Decompaction and accumulation rate
Data from all the available holes were used forthe determination of the depositional and mass
accumulation rates. We discarded horizons withpoor stratigraphic control and large sedimenta-tion gaps. The evaluation of these parameterswas possible for the post-Messinian sediments inDSDP Hole 132 and ODP Holes 652A-654A,974C, down to the lower Pliocene in DSDP Hole373 and ODP Hole 655B, and to the Pliocene/Quaternary limit in ODP Holes 650A, 651A and656A. Besides the water/sediment interface withan age of zero, the reference horizons are thebase of the Quaternary, with an age of 1.81 Ma(Rio et al., 1991), the lower Pliocene/upperPliocene limit and the base of the Pliocene,dated 3.90 and 5.33 Ma, respectively (Cita et al.,1998).
We assumed a simple model in which compac-tion is a purely mechanical, non-reversible process.At some depth, the volume of a water-saturatedsediment column crossing the whole layer, betweendepths z1 and z2, is equal to the volume of thesediment grains plus the volume of water given bythe mean porosity multiplied by the total volumeof the column. Then, for a unit cross-sectionalarea, the volume in terms of height of the sedimentgrain layer hg is given by
hg ¼ z2 � z1ð Þ � /o
ce�cz1 � e�cz2ð Þ ð6Þ
where the second term refers to the water contentobtained by integrating Equation (4) between thelimits z1 and z2. If sediment is removed fromabove, the layer expands by absorbing water, hgremains constant and the total height becomes
Figure 2. Rebound in porosity versus depth from hole to laboratory caused by removal of the overburden pressure for terrigenousand pelagic sediments.
159
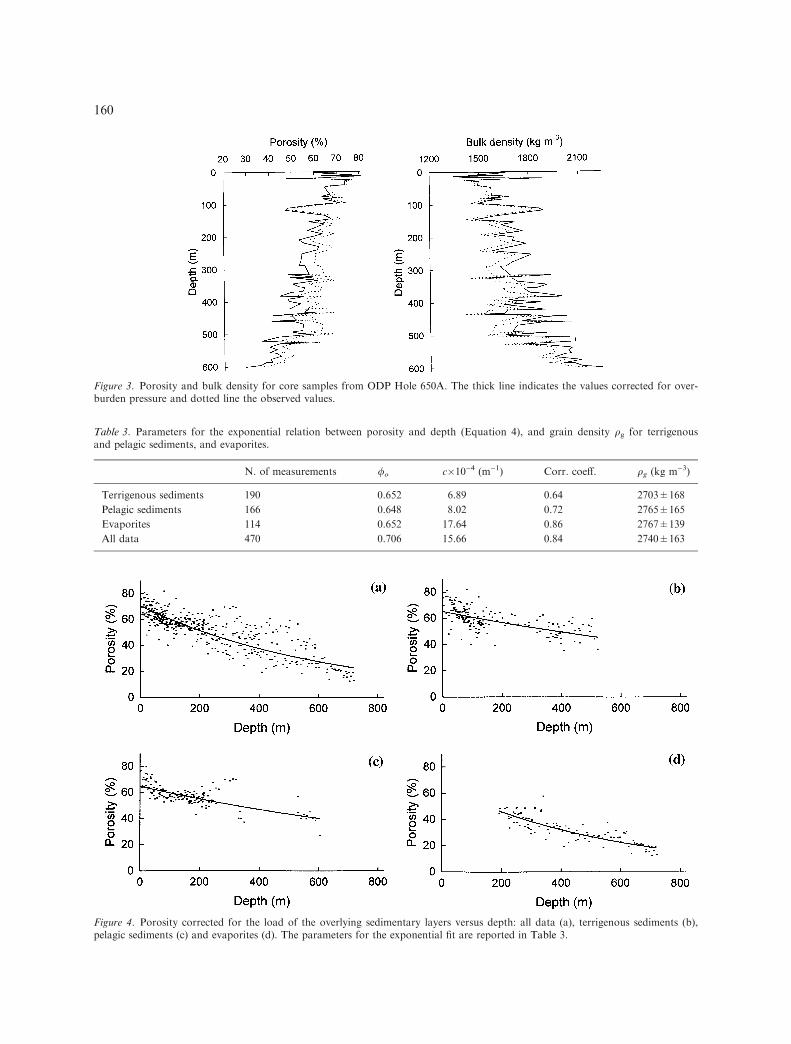
Figure 3. Porosity and bulk density for core samples from ODP Hole 650A. The thick line indicates the values corrected for over-burden pressure and dotted line the observed values.
Figure 4. Porosity corrected for the load of the overlying sedimentary layers versus depth: all data (a), terrigenous sediments (b),pelagic sediments (c) and evaporites (d). The parameters for the exponential fit are reported in Table 3.
Table 3. Parameters for the exponential relation between porosity and depth (Equation 4), and grain density qg for terrigenousand pelagic sediments, and evaporites.
N. of measurements /o c�10)4 (m)1) Corr. coeff. qg (kg m)3)
Terrigenous sediments 190 0.652 6.89 0.64 2703±168
Pelagic sediments 166 0.648 8.02 0.72 2765±165
Evaporites 114 0.652 17.64 0.86 2767±139
All data 470 0.706 15.66 0.84 2740±163
160
12 � 11 ¼ hg þ/o
ce�c11 � e�c12ð Þ ð7Þ
where 11 and 12 are the depths of the new layer.Because z1 and z2 are depths prior to eliminatingthe load, the decrease of porosity with depth isknown and 11 is the bottom of the overlying layerafter decompaction, the depth 12 can be obtainedby numerical iteration.
The rate of sedimentation vs is given by thethickness of the decompacted column, obtained byapplying Equation (7), and the accumulation ageof the sediments. To calculate the mass accumu-lation rate vm, it is necessary, instead, to know themean porosity and density of the sediment col-umn. It follows from Equation (7) that the meanporosity qb is given by the relation
/b ¼/o
c
e�c11 � e�c12
12 � 11ð8Þ
and from Equation (2) that the mean saturatedbulk density qb is
qb ¼ /bqw þ 1� /bð Þqg ð9Þ
According to Equations (7–9), for the mass accu-mulation rates vm we get
vm ¼s qb � /bqwð Þ
tð10Þ
where s is the thickness of the decompactedcolumn that has accumulated in time t.
Equations (7) and (10) were applied to theindividual stratigraphic units. Table 2 reports theactual thicknesses of the layers and the values of vsand vm, corrected for the effect of compaction, forthe Quaternary, the upper Pliocene and the lowerPliocene. During the Plio-Quaternary the rate ofsedimentation was on average 42.7 ± 11.2 m my)1
on the Sardinian margin (ODP Holes 652A-654A,974C and DSDP Hole 132); higher values (onaverage 50.8 ± 12.6 m my)1) were found for thelower Pliocene and lower values (on average 33.0± 8.0 m my)1) for the upper Pliocene.
The highest sedimentation rates (up to319 m my)1) have occurred in the abyssal areaduring the Quaternary, due to considerable con-tribution from volcanoclastics; whereas on thestructural highs (ODP Holes 656A, 655B andDSDP Hole 373) the sedimentation rate is lowerand very variable (12–102 m my)1). ODP Hole
655B and DSDP Hole 373 that sampled all of theupper Pliocene indicate rates of sedimentation forthe upper Pliocene and Quaternary not verydifferent from those found on the Sardinianmargin.
The largest mass accumulation rate (11–40�104 kg m)2 my)1) was found in the abyssalplain for the Quaternary. Lower values, rangingfrom 1�104 to 9�104 with mean value of4.8±2.0�104 kg m)2 my)1, occur on the Sardinianmargin in the Plio-Quaternary and in the abyssalplain in the Pliocene. The sedimentation ratefollows the same trend.
Subsidence curves
Assuming Airy isostasy, following Steckler andWatts (1978) the depth to the basement correctedfor the loading of the sediment of a basin, Y, isgiven by
Y ¼Wd � Dslqm
qm � qw
þ Sqm � qs
qm � qw
� �ð11Þ
where qm is the mantle density, Wd is the waterdepth and Dsl is the sea level height (with respect tothe present-day) at the time of burial. Thisequation is known as the ‘‘backstripping equa-tion’’. The mean saturated bulk density for thetotal stratigraphic sequence qs is
qs ¼P
/biqw þ 1� /bið Þqgi
� �si
Sð12Þ
where /bi is the porosity, qgi the grain density andsi the thickness of the ith decompacted layer. Thetotal thickness of the sequence, S, is obtained bysumming all the thicknesses si.
The final term in the Equation (11) describeshow the sedimentary cover load deforms thebasement. For this correction, it is necessary tocalculate from the stratigraphic data a sediment-loaded subsidence curve, by removing units fromthe top downwards (hence backstripping).
The subsidence due to the cover loading wascalculated for ODP Holes 650A and 651A, whichhave reached the crystalline basement, and ODPHole 652A, whose basement depth was determinedusing local seismic reflection data (Kastens et al.,1987). ODP Hole 655B and DSDP Hole 373 alsoreached the basement, but they have a reducedsedimentary cover (196–458 m). The parameters
161
qm and qw were assumed to be 3300 and1030 kg m)3, respectively, for all calculations.
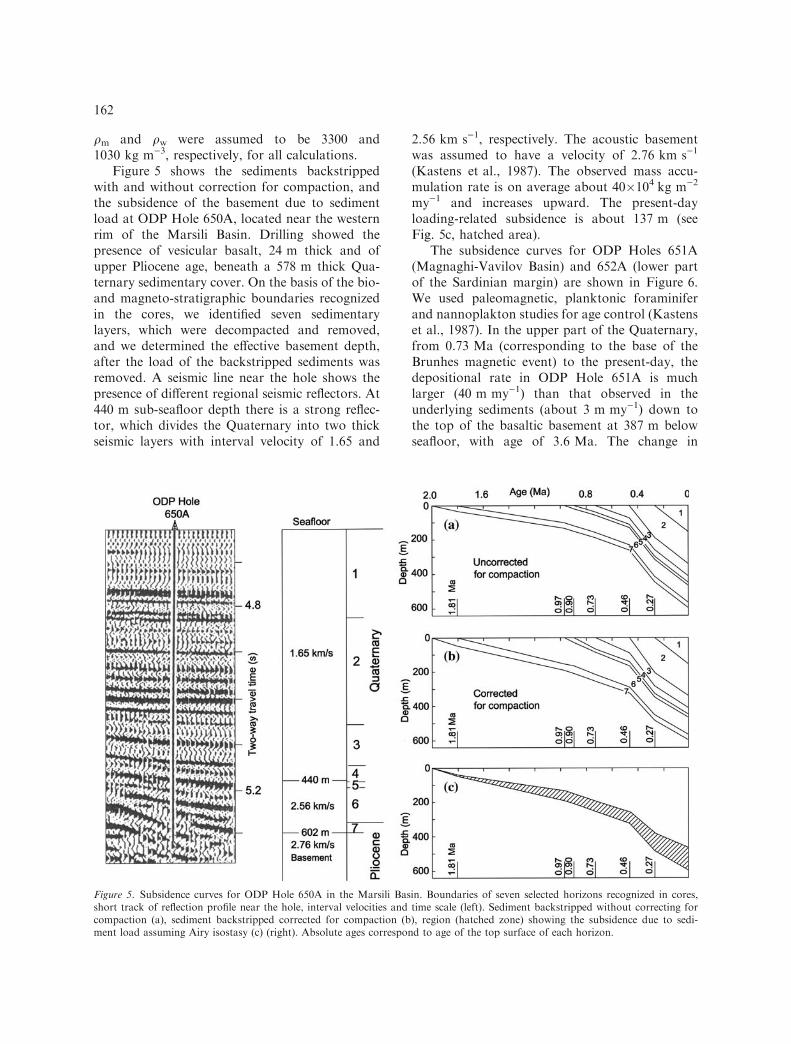
Figure 5 shows the sediments backstrippedwith and without correction for compaction, andthe subsidence of the basement due to sedimentload at ODP Hole 650A, located near the westernrim of the Marsili Basin. Drilling showed thepresence of vesicular basalt, 24 m thick and ofupper Pliocene age, beneath a 578 m thick Qua-ternary sedimentary cover. On the basis of the bio-and magneto-stratigraphic boundaries recognizedin the cores, we identified seven sedimentarylayers, which were decompacted and removed,and we determined the effective basement depth,after the load of the backstripped sediments wasremoved. A seismic line near the hole shows thepresence of different regional seismic reflectors. At440 m sub-seafloor depth there is a strong reflec-tor, which divides the Quaternary into two thickseismic layers with interval velocity of 1.65 and
2.56 km s)1, respectively. The acoustic basementwas assumed to have a velocity of 2.76 km s)1
(Kastens et al., 1987). The observed mass accu-mulation rate is on average about 40�104 kg m)2
my)1 and increases upward. The present-dayloading-related subsidence is about 137 m (seeFig. 5c, hatched area).
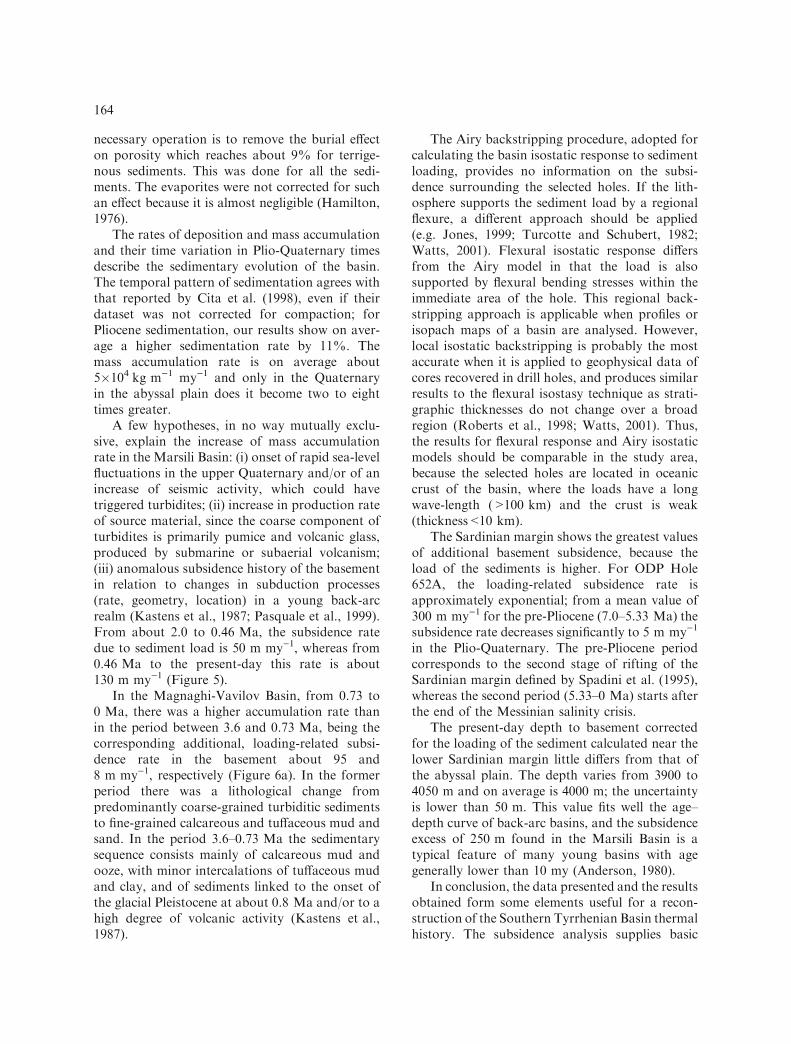
The subsidence curves for ODP Holes 651A(Magnaghi-Vavilov Basin) and 652A (lower partof the Sardinian margin) are shown in Figure 6.We used paleomagnetic, planktonic foraminiferand nannoplakton studies for age control (Kastenset al., 1987). In the upper part of the Quaternary,from 0.73 Ma (corresponding to the base of theBrunhes magnetic event) to the present-day, thedepositional rate in ODP Hole 651A is muchlarger (40 m my)1) than that observed in theunderlying sediments (about 3 m my)1) down tothe top of the basaltic basement at 387 m belowseafloor, with age of 3.6 Ma. The change in
Figure 5. Subsidence curves for ODP Hole 650A in the Marsili Basin. Boundaries of seven selected horizons recognized in cores,short track of reflection profile near the hole, interval velocities and time scale (left). Sediment backstripped without correcting forcompaction (a), sediment backstripped corrected for compaction (b), region (hatched zone) showing the subsidence due to sedi-ment load assuming Airy isostasy (c) (right). Absolute ages correspond to age of the top surface of each horizon.
162
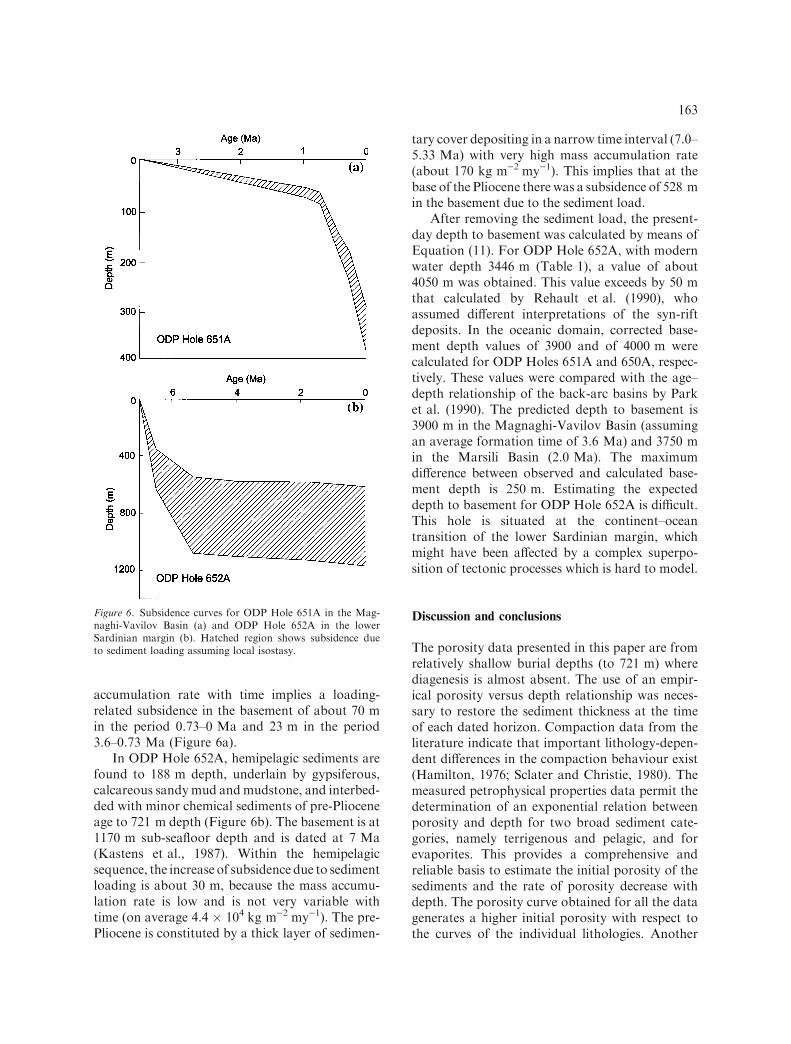
accumulation rate with time implies a loading-related subsidence in the basement of about 70 min the period 0.73–0 Ma and 23 m in the period3.6–0.73 Ma (Figure 6a).
In ODP Hole 652A, hemipelagic sediments arefound to 188 m depth, underlain by gypsiferous,calcareous sandymud andmudstone, and interbed-ded with minor chemical sediments of pre-Plioceneage to 721 m depth (Figure 6b). The basement is at1170 m sub-seafloor depth and is dated at 7 Ma(Kastens et al., 1987). Within the hemipelagicsequence, the increase of subsidence due to sedimentloading is about 30 m, because the mass accumu-lation rate is low and is not very variable withtime (on average 4.4 � 104 kg m)2 my)1). The pre-Pliocene is constituted by a thick layer of sedimen-
tary cover depositing in a narrow time interval (7.0–5.33 Ma) with very high mass accumulation rate(about 170 kg m)2 my)1). This implies that at thebase of the Pliocene there was a subsidence of 528 min the basement due to the sediment load.
After removing the sediment load, the present-day depth to basement was calculated by means ofEquation (11). For ODP Hole 652A, with modernwater depth 3446 m (Table 1), a value of about4050 m was obtained. This value exceeds by 50 mthat calculated by Rehault et al. (1990), whoassumed different interpretations of the syn-riftdeposits. In the oceanic domain, corrected base-ment depth values of 3900 and of 4000 m werecalculated for ODP Holes 651A and 650A, respec-tively. These values were compared with the age–depth relationship of the back-arc basins by Parket al. (1990). The predicted depth to basement is3900 m in the Magnaghi-Vavilov Basin (assumingan average formation time of 3.6 Ma) and 3750 min the Marsili Basin (2.0 Ma). The maximumdifference between observed and calculated base-ment depth is 250 m. Estimating the expecteddepth to basement for ODP Hole 652A is difficult.This hole is situated at the continent–oceantransition of the lower Sardinian margin, whichmight have been affected by a complex superpo-sition of tectonic processes which is hard to model.
Discussion and conclusions
The porosity data presented in this paper are fromrelatively shallow burial depths (to 721 m) wherediagenesis is almost absent. The use of an empir-ical porosity versus depth relationship was neces-sary to restore the sediment thickness at the timeof each dated horizon. Compaction data from theliterature indicate that important lithology-depen-dent differences in the compaction behaviour exist(Hamilton, 1976; Sclater and Christie, 1980). Themeasured petrophysical properties data permit thedetermination of an exponential relation betweenporosity and depth for two broad sediment cate-gories, namely terrigenous and pelagic, and forevaporites. This provides a comprehensive andreliable basis to estimate the initial porosity of thesediments and the rate of porosity decrease withdepth. The porosity curve obtained for all the datagenerates a higher initial porosity with respect tothe curves of the individual lithologies. Another
Figure 6. Subsidence curves for ODP Hole 651A in the Mag-naghi-Vavilov Basin (a) and ODP Hole 652A in the lowerSardinian margin (b). Hatched region shows subsidence dueto sediment loading assuming local isostasy.
163
necessary operation is to remove the burial effecton porosity which reaches about 9% for terrige-nous sediments. This was done for all the sedi-ments. The evaporites were not corrected for suchan effect because it is almost negligible (Hamilton,1976).
The rates of deposition and mass accumulationand their time variation in Plio-Quaternary timesdescribe the sedimentary evolution of the basin.The temporal pattern of sedimentation agrees withthat reported by Cita et al. (1998), even if theirdataset was not corrected for compaction; forPliocene sedimentation, our results show on aver-age a higher sedimentation rate by 11%. Themass accumulation rate is on average about5�104 kg m)1 my)1 and only in the Quaternaryin the abyssal plain does it become two to eighttimes greater.
A few hypotheses, in no way mutually exclu-sive, explain the increase of mass accumulationrate in the Marsili Basin: (i) onset of rapid sea-levelfluctuations in the upper Quaternary and/or of anincrease of seismic activity, which could havetriggered turbidites; (ii) increase in production rateof source material, since the coarse component ofturbidites is primarily pumice and volcanic glass,produced by submarine or subaerial volcanism;(iii) anomalous subsidence history of the basementin relation to changes in subduction processes(rate, geometry, location) in a young back-arcrealm (Kastens et al., 1987; Pasquale et al., 1999).From about 2.0 to 0.46 Ma, the subsidence ratedue to sediment load is 50 m my)1, whereas from0.46 Ma to the present-day this rate is about130 m my)1 (Figure 5).
In the Magnaghi-Vavilov Basin, from 0.73 to0 Ma, there was a higher accumulation rate thanin the period between 3.6 and 0.73 Ma, being thecorresponding additional, loading-related subsi-dence rate in the basement about 95 and8 m my)1, respectively (Figure 6a). In the formerperiod there was a lithological change frompredominantly coarse-grained turbiditic sedimentsto fine-grained calcareous and tuffaceous mud andsand. In the period 3.6–0.73 Ma the sedimentarysequence consists mainly of calcareous mud andooze, with minor intercalations of tuffaceous mudand clay, and of sediments linked to the onset ofthe glacial Pleistocene at about 0.8 Ma and/or to ahigh degree of volcanic activity (Kastens et al.,1987).
The Airy backstripping procedure, adopted forcalculating the basin isostatic response to sedimentloading, provides no information on the subsi-dence surrounding the selected holes. If the lith-osphere supports the sediment load by a regionalflexure, a different approach should be applied(e.g. Jones, 1999; Turcotte and Schubert, 1982;Watts, 2001). Flexural isostatic response differsfrom the Airy model in that the load is alsosupported by flexural bending stresses within theimmediate area of the hole. This regional back-stripping approach is applicable when profiles orisopach maps of a basin are analysed. However,local isostatic backstripping is probably the mostaccurate when it is applied to geophysical data ofcores recovered in drill holes, and produces similarresults to the flexural isostasy technique as strati-graphic thicknesses do not change over a broadregion (Roberts et al., 1998; Watts, 2001). Thus,the results for flexural response and Airy isostaticmodels should be comparable in the study area,because the selected holes are located in oceaniccrust of the basin, where the loads have a longwave-length (>100 km) and the crust is weak(thickness<10 km).
The Sardinian margin shows the greatest valuesof additional basement subsidence, because theload of the sediments is higher. For ODP Hole652A, the loading-related subsidence rate isapproximately exponential; from a mean value of300 m my)1 for the pre-Pliocene (7.0–5.33 Ma) thesubsidence rate decreases significantly to 5 m my)1
in the Plio-Quaternary. The pre-Pliocene periodcorresponds to the second stage of rifting of theSardinian margin defined by Spadini et al. (1995),whereas the second period (5.33–0 Ma) starts afterthe end of the Messinian salinity crisis.
The present-day depth to basement correctedfor the loading of the sediment calculated near thelower Sardinian margin little differs from that ofthe abyssal plain. The depth varies from 3900 to4050 m and on average is 4000 m; the uncertaintyis lower than 50 m. This value fits well the age–depth curve of back-arc basins, and the subsidenceexcess of 250 m found in the Marsili Basin is atypical feature of many young basins with agegenerally lower than 10 my (Anderson, 1980).
In conclusion, the data presented and the resultsobtained form some elements useful for a recon-struction of the Southern Tyrrhenian Basin thermalhistory. The subsidence analysis supplies basic
164
geophysical information to study the nature andthermal evolution of the basin and it is of funda-mental importance for studies on hydrocarbonmaturationmodelling.However, holes are unevenlydistributed for understanding subsidence of thewhole basin. Provided that in areas lacking in holesseismic two-way reflection time data are available,indirect approaches, such as the method by Crough(1983), may be applied to estimate the effect of thesediment loading on subsidence.Moreover, in orderto obtain the subsidence history, it would benecessary to know the water depth and the heightof the sea level at the time of deposition.
Acknowledgments
The paper benefited of the critical reading ofP. Clift, D. Healy and an anonymous reviewer.
References
Anderson, R.N., 1980, Update of the heat flow in the East andSoutheast Asia Seas, in Hayes, D.E. (ed.) The Tectonic andGeologic Evolution of the Southeast Asian Seas and Is-lands, Geophys. Monogr. Am. Geophys. Union, Washington,pp. 319–326.
Cita, M.B., Racchetti, S., Brambilla, R., Bertarini, L., Colom-baroli, D., Morelli, L., Negri, M., Ritter, M., Rovina, E.,Sala, P. and Sancito, S., 1998, Evoluzione dei bacini pro-fondi del Mediterraneo documentata dalle variazioni nellevelocita di sedimentazione nel Plio-Pleistocene, Rend. Fis.Acc. Lincei 9, 83–100.
Comas, M.C., Zahan, R. et al., 1996, Proceedings of the OceanDrilling Program. Initial Reports Mediterranean Sea II TheWestern Mediterranean, Ocean Drilling Program. TexasA&M University 161, 1–1023.
Crough, S.T., 1983, The correction for sediment loading on theseafloor, J. Geophys. Res. 88, 6449–6454.
Fabbri, A. and Curzi, P., 1979, The Messinian of the Tyrrhe-nian Sea: seismic evidence and dynamic implications, G.Geol. 43, 215–248.
Finetti, I. and Morelli, C., 1973, Geophysical exploration of theMediterranean sea, Boll. Geofis. Teor. Appl. 15, 263–344.
Finetti, I. and Del Ben, A., 1986, Geophysical study of theTyrrhenian opening, Boll. Geofis. Teor. Appl. 27, 75–156.
Hamilton, E., 1976, Variations of density and porosity withdepth in deep-sea sediments, J. Sed. Petrol. 46, 280–300.
Hsu, K.J., Montadert, L., et al., 1978, Site 373: TyrrhenianBasin, DSDP Leg 42, in: Hsu, K.J., Montadert, L. et al.(eds.), Initial Reports of the Deep Sea Drilling Project,Washington, D.C. (US Government Printing Office) 42, partI, pp. 151–174.
Jones, E.J.W., 1999,Marine Geophysics. New York: JohnWiley.Kastens, K.A., Mascle, J., Auroux, C. et al., 1987, Proceedings
of the Ocean Drilling Program, Part A – Initial ReportsTyrrhenian Sea, Ocean Drilling Program Texas A&M Uni-versity 107, 1–1013.
Kastens, K.A., Mascle, J. et al., 1988, ODP Leg 107 in theTyrrhenian Sea: Insights into passive margin and back-arcbasin evolution, Geol. Soc. Am. Bull. 100, 1140–1156.
Malinverno, A., Cafiero, M., Ryan, W.B.F. and Cita, M.B.,1981, Distribution of Messinian sediments and erosionalsurfaces beneath the Tyrrhenian Sea: geodynamic implica-tions, Oceanol. Acta 4, 489–496.
Mascle, J. and Rehault, J.P., 1990, A revised seismic stratig-raphy of the Tyrrhenian Sea: implications for the basinevolution, in Kastens, K.A., Mascle J. et al. (eds.), Pro-ceedings of the Ocean Drilling Program, Scientific Results,Ocean Drilling Program Texas A&M University 107, pp.617–663.
Park, C.H., Tamaki, K. and Kobayashi, K., 1990, Age–depthcorrelation of the Philippine Sea back-arc basins and othermarginal basins in the world, Tectonophysics 181, 351–371.
Pasquale, V., Verdoya, M. and Chiozzi, P., 1999, Thermal stateand deep earthquakes in the Southern Tyrrhenian, Tec-tonophysics 306, 435–448.
Pasquale, V., Verdoya, M. and Chiozzi, P., 2003, Heat-fluxbudget in the southeastern continental margin of the Tyr-rhenian basin, Phys. Chem. Earth 28, 407–420.
Pasquale, V., Verdoya, M. and Chiozzi, P., 2005, Thermalstructure of the Ionian slab, Pure Appl. Geophys. 162, 967–986.
Rehault, J.P., Moussat, E. and Fabbri, A., 1987, Structuralevolution of the Tyrrhenian back-arc basin, Mar. Geol. 74,123–150.
Rehault, J.P., Tisseau, C., Brunet, M.F. and Louden, K.E.,1990, Subsidence analysis on the Sardinian margin and thecentral Tyrrhenian basin: thermal modelling and heat flowcontrol; deep structure implications, J. Geodyn. 12, 269–310.
Rio, D., Sprovieri, R. and Thunell, R., 1991, Pliocene–lowerPleistocene chronostratigraphy. A re-evaluation of Medi-terranean type section, Geol. Soc. Am. Bull. 103, 1049–1058.
Roberts, A.M., Kusznir, N.J., Yielding, G. and Styles, P., 1998,2D flexural backstripping of extensional basins: the need fora sideways glance, Petroleum Geosci. 4, 327–338.
Ryan, W.B.F., Hsu, K., et al., 1973, Tyrrhenian Rise – Site 132,DSDP Leg 13, in Ryan, W.B.F., Hsu, K. et al. (eds.), InitialReports of the Deep Sea Drilling Project, Washington, D.C.(US Government Printing Office) 13, 403–464.
Sartori, R., 1986, Notes on the geology of the acoustic base-ment in the Tyrrhenian sea, Mem. Soc. Geol. It. 36, 99–108.
Sclater, J.G. and Christie, P.A.F., 1980, Continental stretching:an exploration of the post-mid-Cretaceous subsidence of theCentral North Sea Basin, J. Geophys. Res. 85, 3711–3739.
Selli, R., 1985, Tectonic evolution of the Tyrrhenian Sea, inStanley, D.J. and Wezel, F.C. (eds.), Geological Evolutionof the Mediterranean Basin, Springer-Verlag, New York,pp. 131–151.
Spadini, G., Bertotti, G. and Cloetingh, S., 1995, Tectono-stratigraphic modelling of the Sardinia margin of the Tyr-rhenian Sea, Tectonophysics 252, 269–284.
Steckler, M.S. and Watts, A.B., 1978, Subsidence of theAtlantic-type continental margin off New York, EarthPlanet. Sci. Lett. 41, 1–13.
Turcotte, D.L. and Schubert, G., 1982, Geodynamics Applica-tion of Continuum Physics to Geological Problems. NewYork: John Wiley.
Watts, A.B., 2001, Isostasy and Flexure of the Lithosphere.United Kingdom: Cambridge University Press.
165
Related Documents